
Evan H. Campbell Grant US Geological Survey Amphibian Research and Monitoring Initiative Patuxent...
31
Evan H. Campbell Grant US Geological Survey Amphibian Research and Monitoring Initiative Patuxent Wildlife Research Center SO Conte Anadromous Fish Research Laboratory Turners Falls, MA ADAPTING TO NATURE IN THE NEW NORMAL IMPROVING NATURAL RESOURCE DECISION MAKING UNDER UNCERTAINTY
-
Upload
lynne-ball -
Category
Documents
-
view
213 -
download
0
Transcript of Evan H. Campbell Grant US Geological Survey Amphibian Research and Monitoring Initiative Patuxent...
Evan H. Campbell GrantUS Geological Survey Amphibian Research and Monitoring InitiativePatuxent Wildlife Research CenterSO Conte Anadromous Fish Research LaboratoryTurners Falls, MA
ADAPTING TO NATURE IN THE NEW
NORMAL IMPROVING NATURAL RESOURCE DECISION
MAKING UNDER UNCERTAINTY

PROBLEM:AMPHIBIAN POPULATIONS ARE DECLINING
WORLDWIDE
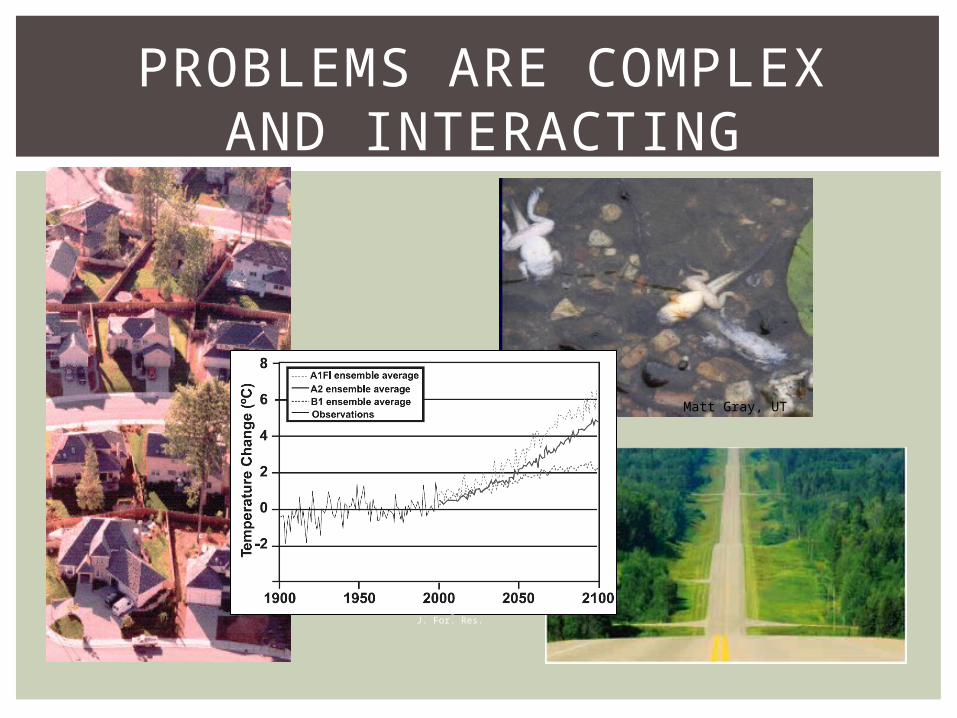
PROBLEMS ARE COMPLEX AND INTERACTING
Matt Gray, UT
Huntington et al. 2009. Can J. For. Res.
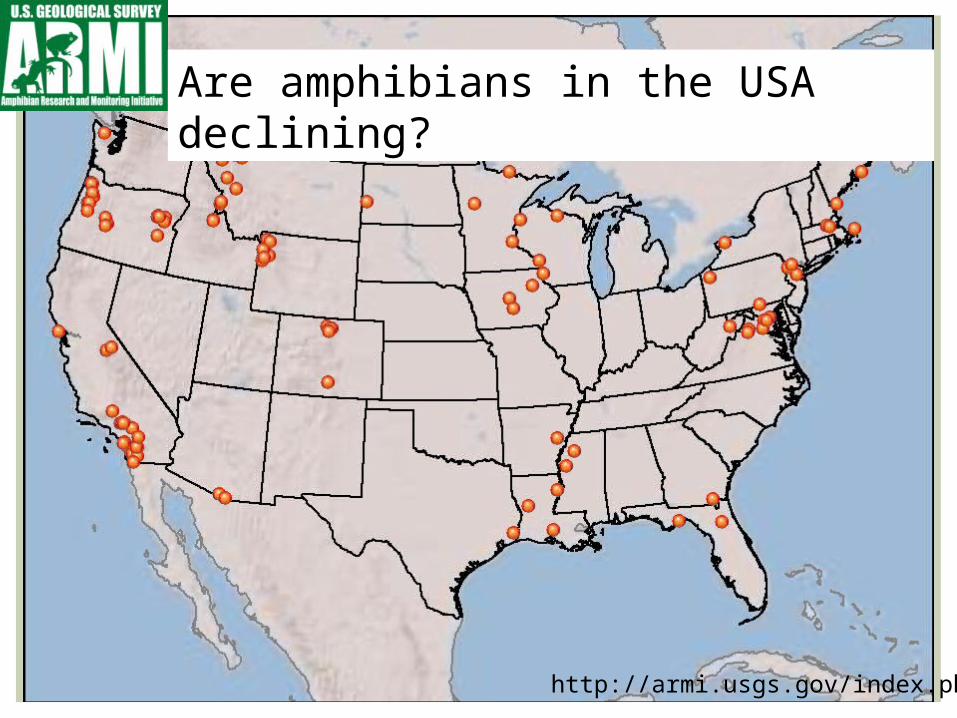
http://armi.usgs.gov/index.php
Are amphibians in the USA declining?


IN THE NORTHEAST…
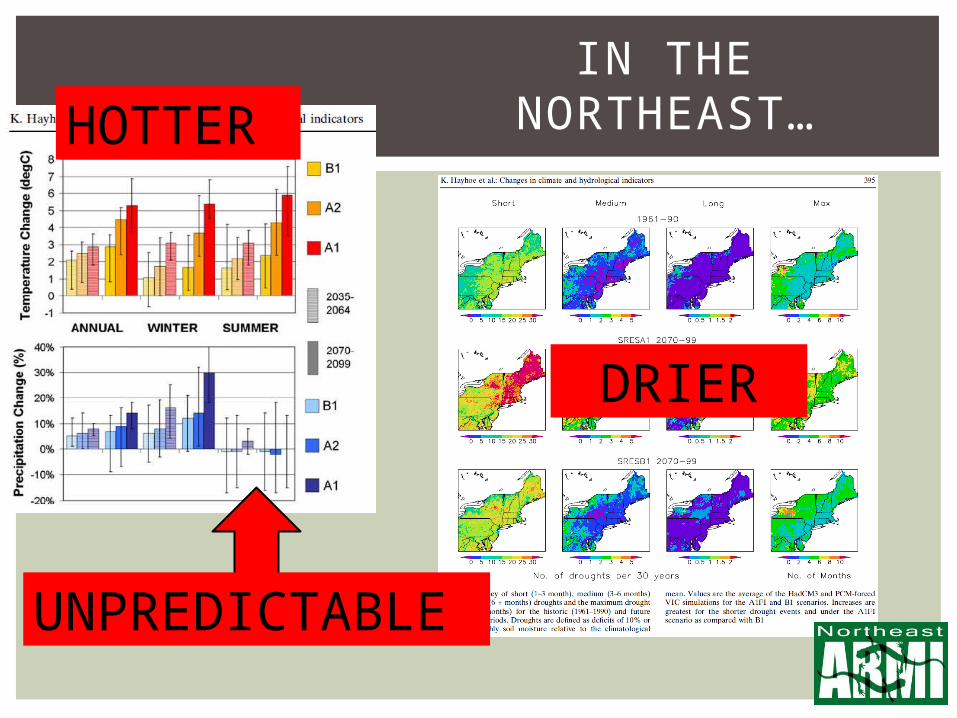
HOTTER
DRIER
UNPREDICTABLE
IN THE NORTHEAST…

PROBLEM: HABITAT PROTECTION ALONE MIGHT
NOT CUT IT
Number of droughts

9
PRESCRIPTION FOR RESOLVING 10,000 DECISIONS
Keeney 2004. Making better decision makers. Decision Analysis 1:193-204.

10
PRESCRIPTION FOR RESOLVING 10,000 DECISIONS
Keeney 2004. Making better decision makers. Decision Analysis 1:193-204.

11
The structuring of a decision problem in terms of choices, outcomes, and values to identify the choice that is most likely to achieve the values of the decision maker.
Decisions involvevaluing the outcomes predicting outcomes from alternative choices
The first part is the (subjective) role ofsociety; the second part is the (objective) role of science
WHAT IS DECISION ANALYSIS?

Clear ObjectivesCreative management Alternatives
Models linking actions to objectives, generate predictions
Optimization to determine best approach, given observations and objectives
Implement a decisionMonitor system state changes
STRUCTURED DECISION MAKING
Elements:

Clear ObjectivesCreative management Alternatives
Models linking actions to objectives, generate predictions
Optimization to determine best approach, given observations and objectives
Implement a decisionMonitor system state changes
STRUCTURED DECISION MAKING
Values
ValuesScience
Science
14
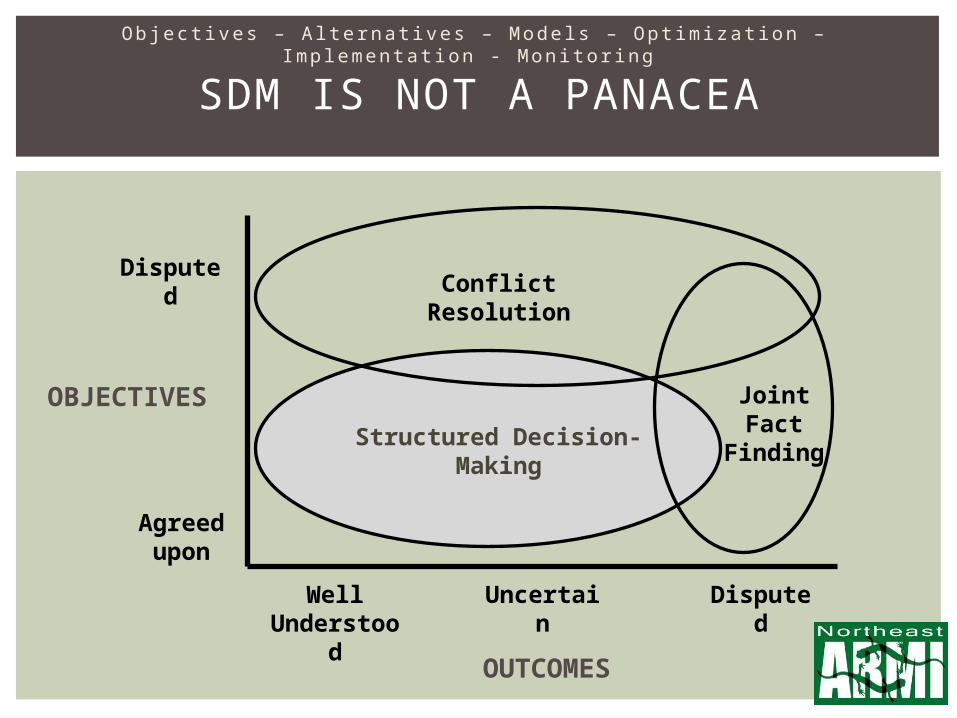
SDM IS NOT A PANACEA
OBJECTIVES
Agreed upon
Disputed
OUTCOMES
Well Understood
Uncertain Disputed
Structured Decision- Making
Conflict Resolution
Joint Fact
Finding
Objec t i ves – A l te rna t i ves – Mode l s – Opt im iza t ion – Imp lementa t i on - Mon i to r ing

EXAMPLE FROM C&O CANAL NHP
‘Potomac Gorge’ area of C&OThreats (Allen and Flack 2001)
Urbanization Invasive/alien species Isolation
Climate change (and variability)
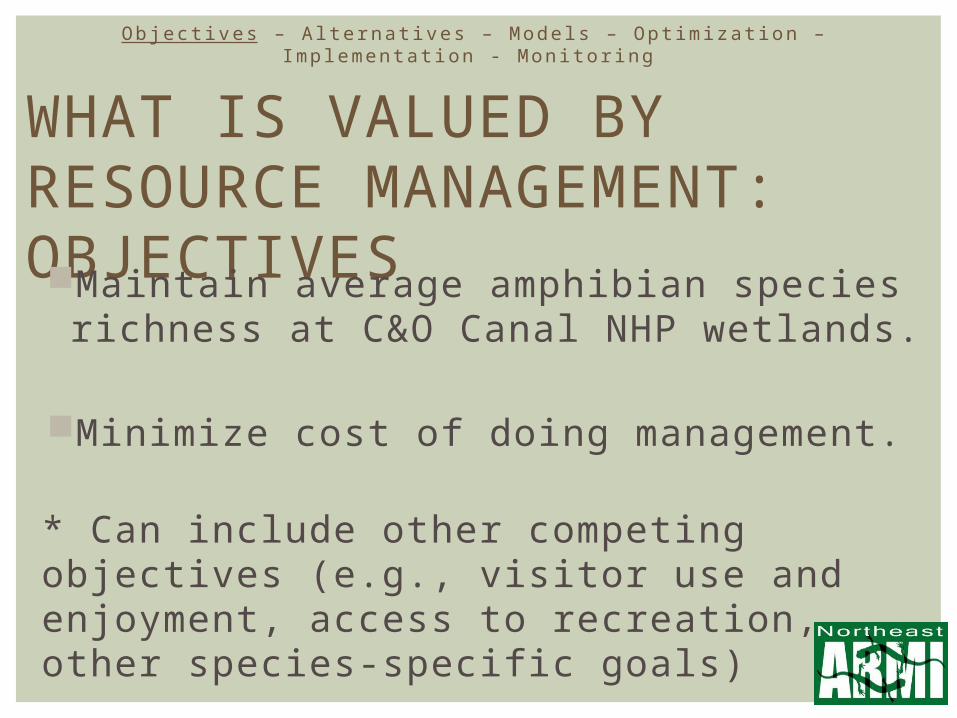
WHAT IS VALUED BY RESOURCE MANAGEMENT: OBJECTIVESMaintain average amphibian species richness
at C&O Canal NHP wetlands.
Minimize cost of doing management.
* Can include other competing objectives (e.g., visitor use and enjoyment, access to recreation, other species-specific goals)
Objec t i ves – A l te rna t i ves – Mode l s – Opt im iza t i on – Imp lementa t i on - Mon i to r ing

Monitoring data:
Since 2005
0 2 4 6 8
02
46
8
Wetland richness 2005
We
tla
nd
ric
hn
ess 2
01
0
Observe a decline in occupancy for all
species

Relate occupancy to measured variables
(*hydroperiod)
0 1000 2000 3000
02
46
8
Wetland Area (m2)
Avera
ge p
roje
cte
d r
ichness
0 2 4 6 8 10
02
46
810
Observed number of species (2010)
Observ
ed n
um
ber
of
specie
s (
2005-2
009)
0 2 4 6 8
02
46
8
Wetland richness 2010
Pro
jecte
d w
etland r
ichness
0.0 0.2 0.4 0.6 0.8 1.0
0.0
0.2
0.4
0.6
0.8
1.0
1-Specificity
Sensitiv
ity
Permanent
Semi-permanent
Temporary
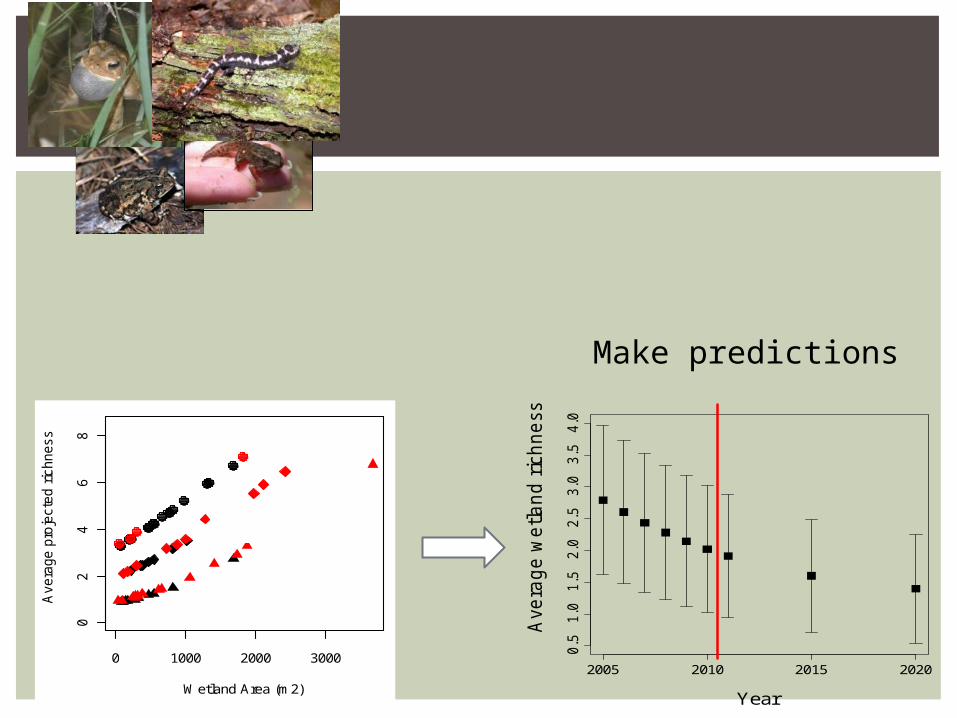
2005 2010 2015 2020
0.5
1.0
1.5
2.0
2.5
3.0
3.5
4.0
Year
Ave
rag
e w
etla
nd
ric
hn
ess
Make predictions
0 1000 2000 3000
02
46
8
Wetland Area (m2)
Avera
ge p
roje
cte
d r
ichness
0 2 4 6 8 10
02
46
810
Observed number of species (2010)
Observ
ed n
um
ber
of
specie
s (
2005-2
009)
0 2 4 6 8
02
46
8
Wetland richness 2010
Pro
jecte
d w
etland r
ichness
0.0 0.2 0.4 0.6 0.8 1.0
0.0
0.2
0.4
0.6
0.8
1.0
1-Specificity
Sensitiv
ity
Permanent
Semi-permanent
Temporary

THINKING BACK TO OUR FORECASTSHOTTER
DRIER
UNPREDICTABLE

Best Alternative: increase hydroperiod of temporary wetlands
Optimization: Rank wetlands by the expected increase in richness, to choose most suitable sites for management each year
USING THE MODEL TO GUIDE MANAGEMENT:
OPTIMIZATION
Objec t i ves – A l te rna t i ves – Mode l s – Opt im iza t i on – Imp lementa t ion - Mon i to r ing

Typical response is to want to understand what’s causing declines,
But there is a tradeoff in waiting for more information (which may be imperfect) and a need for action
Both have components of uncertainty.
NOW WHAT?

When to initiate a decision?
1 5 10
Utility threshold
Avera
ge w
etl
an
d r
ich
ness
Year that management is implemented
Objec t i ves – A l te rna t i ves – Mode l s – Opt im iza t ion – Imp lementa t i on - Mon i to r ing

1 5 10
Avera
ge w
etl
an
d r
ich
ness
Manage half
Manage a quarter
Manage none
Objec t i ves – A l te rna t i ves – Mode l s – Opt im iza t i on – Imp lementa t ion - Mon i to r ing

1 5 10
Marginal benefit of managing 50% of sites in year 1, vs. no management, assuming poor outcome.
Avera
ge w
etl
an
d r
ich
ness
Objec t i ves – A l te rna t i ves – Mode l s – Opt im iza t ion – Imp lementa t i on - Mon i to r ing

1 5 10
Avera
ge w
etl
an
d r
ich
ness
Marginal benefit of implementing management of 50% of sites in year 1 vs. 5, assuming best outcome
Objec t i ves – A l te rna t i ves – Mode l s – Opt im iza t ion – Imp lementa t i on - Mon i to r ing

1 5 10
Marginal benefit of managing 50% vs. 25% of sites in year 1, assuming average outcome.
Avera
ge w
etl
an
d r
ich
ness
Objec t i ves – A l te rna t i ves – Mode l s – Opt im iza t ion – Imp lementa t i on - Mon i to r ing

1 5 10
Marginal benefit of managing 50% of sites in year 1 vs. 25% of sites in year 5, assuming learning occurred
Avera
ge w
etl
an
d r
ich
ness
Objec t i ves – A l te rna t i ves – Mode l s – Opt im iza t ion – Imp lementa t i on - Mon i to r ing

IN SUMMARY
Amphibians are in trouble (or may be…)
Even amphibians in protected areas are at risk under climate change

IF we value amphibians, where they are, we need to make hard decisions about active management
UNCERTAINTY IS SCARY,BUT -

A proactive approach to conservation
Designed to preempt (or respond to) climate change effects – short term focus
Maintain community and prevent LOCAL extinctions
A structured approach to decision making


