Evaluation Tools of Urban Interchange Design and...
8
148 TRANSPORTATION RESEAR CH RECORD 1280 Evaluation Tools of Urban Interchange Design and Operation A. ESSAM RADWAN AND ROGER L. HATTON Urban interchange are a means of facilitating traffic movements between arterial streets and freeway ramps. The ingle point dia- mond interchange (SPDI) and the conventional diamond inter- change are two specific interchange de igns . Essentially, both de ign s can be treated as ·ignaJized inters ec tions. Deviation from the standard signalized intersection operation can be attributed to factors such a longer clearance interval, larger turni.n g rad.ii , different phasing schemes. and different sig11al off ets between adjacent intersections. Avai lable comp ut er software was reviewed to determine its ability to simulate the operation of the urban diamond interchanges operation. Data collected at two sites in the Phoenix metrop litan area were used. Five programs were chosen: PASSER 11 - 87, PASSER III-88, TRANSYT-7F, TRAF- NET IM, and TEXA . An assessment of each program was conducted to determine its ability to simulate both the SPDI and the conventional diamond interchange. It was concluded that the PASSER III-88 and the TEXAS models simulated the SPDI fairly well. All models except the TEXAS model were able to simulate the conventional diamond design. The Phoenix metropolitan area has been witnessing a sub- stantial growth in population and urban travel. Over the next two decades, close to 230 mi of freeways will be added to the existing network. With this growth in facility design and con- struction, different designs of urban interchanges need to be considered. Other metropolitan areas are heavily involved in projects to rehabilitate and reconstruct major sections of the urban Interstate system. Interchanges on such facilities are critical elements of corridor operational efficiency. Whether a new freeway is being added to the network or rehabilitation is being conducted on existing facilities, developing a set of warrants for different types of urban interchanges at any given site is crucial. Such warrants would include factors such as traffic demand, land availability and cost, traffic signal phasing, frontage road spacings, interchange capacity, construction costs, and road user costs. To be able to evaluate large numbers of design alternatives, computer software that can simulate the operation of urban interchanges must be selected. Two criteria essential to this selection process are ability and credibility, i.e., the ability to simulate a given diamond interchange operation and the cred- ibility of the produced output to reasonably represent the real world. The main objective of this research effort was to assess available computer software in terms of its ability to simulate A. E. Radwan, Center for Advanced Research in Transportation, Arizona State University, Tempe, Ariz. 85287-6306 . R. L. Hatton, Arizona Department of Transportation, 205 S. 17th Ave., Phoenix, Ariz . 85007. two types of urban diamond interchanges: the single point diamond interchange (SPDI) and the conventional diamond interchange. BACKGROUND The conventional diamond, shown in Figure 1, is the most used interchange on urban freeways. Its design is most suitable in suburban and urban locations where traffic volumes are low to moderate and where right-of-way is restrictive. The conventional diamond is characterized by dual intersections, three-phase signal control with overlap movements, and tight turning radii. The dual intersection design combined with the three-phase signal scheme has been proven to delay the interior move- ments that account for approximately one-third of the total delay with the conventional diamond (1). The SPDI (also known as the urban interchange) was intro- duced more than two decades ago. It has recently become more attractive because of its compact design, which requires less right-of-way. The SPDI, shown in Figure 2, operates as a single three-phase intersection. The through movement from the off-ramp can be prohibited, resulting in less delay to off- ramp traffic. One advantage of the SPDI over the conven- tional diamond is the large turning radius provided for the left-turn movement. The turning radius of the SPDI is approx- imately 300 ft; for the conventional diamond, it is only 50 to 60 ft (2). The larger turning radius allows vehicles to accelerate while turning, resulting in less delay and higher capacity . A critical element that significantly affects the SPDI's capacity is the signal clearance duration. The distance between the two stop bars on the arterial typically ranges between 150 and 250 ft. Considering an approach speed of 35 mph, the minimum required clearance interval ranges between 7 and 9 sec (3). This is usually accomplished by using a yellow and an all-red clearance interval. As the number of left-turn lanes and free- way lanes increases, the minimum clearance interval increases and the effo.:iem:y gained by this type of interchange may be quickly lost. A recent study ( 4) attempted to develop a methodology to determine when grade separations are appropriate. This methodology includes an economic analysis based on a ben- efit-cost study for ranking three-level diamond interchanges. Delay estimates were derived using the TRANSYT-7F model. A comparative assessment of the SPDI and the compressed diamond was recently published in the !TE Journal (3), which stated: "The analyses presented make it evident that appli- cations are limited for the single-point diamond. Generally
Transcript of Evaluation Tools of Urban Interchange Design and...

148 TRANSPORTATION RESEARCH RECORD 1280
Evaluation Tools of Urban Interchange Design and Operation
A. ESSAM RADWAN AND ROGER L. HATTON
Urban interchange are a means of facilitating traffic movements between arterial streets and freeway ramps. The ingle point diamond interchange (SPDI) and the conventional diamond interchange are two specific interchange de igns . Essentially, both de igns can be treated as ·ignaJized intersections. Deviation from the standard signalized intersection operation can be attributed to factors such a longer clearance interval , larger turni.ng rad.ii , different phasing schemes. and different sig11al off ets between adjacent intersections. Available computer software was reviewed to determine its ability to simulate the operation of the urban diamond interchanges operation. Data collected at two sites in the Phoenix metrop litan area were used. Five programs were chosen: PASSER 11- 87, PASSER III-88, TRANSYT-7F, TRAFNET IM, and TEXA . An assessment of each program was conducted to determine its ability to simulate both the SPDI and the conventional diamond interchange. It was concluded that the PASSER III-88 and the TEXAS models simulated the SPDI fairly well. All models except the TEXAS model were able to simulate the conventional diamond design.
The Phoenix metropolitan area has been witnessing a substantial growth in population and urban travel. Over the next two decades, close to 230 mi of freeways will be added to the existing network. With this growth in facility design and construction, different designs of urban interchanges need to be considered.
Other metropolitan areas are heavily involved in projects to rehabilitate and reconstruct major sections of the urban Interstate system. Interchanges on such facilities are critical elements of corridor operational efficiency. Whether a new freeway is being added to the network or rehabilitation is being conducted on existing facilities, developing a set of warrants for different types of urban interchanges at any given site is crucial. Such warrants would include factors such as traffic demand, land availability and cost, traffic signal phasing, frontage road spacings, interchange capacity, construction costs, and road user costs.
To be able to evaluate large numbers of design alternatives, computer software that can simulate the operation of urban interchanges must be selected. Two criteria essential to this selection process are ability and credibility, i.e., the ability to simulate a given diamond interchange operation and the credibility of the produced output to reasonably represent the real world.
The main objective of this research effort was to assess available computer software in terms of its ability to simulate
A. E. Radwan, Center for Advanced Research in Transportation, Arizona State University, Tempe, Ariz. 85287-6306. R. L. Hatton, Arizona Department of Transportation, 205 S. 17th Ave., Phoenix, Ariz. 85007.
two types of urban diamond interchanges: the single point diamond interchange (SPDI) and the conventional diamond interchange.
BACKGROUND
The conventional diamond, shown in Figure 1, is the most used interchange on urban freeways. Its design is most suitable in suburban and urban locations where traffic volumes are low to moderate and where right-of-way is restrictive. The conventional diamond is characterized by dual intersections, three-phase signal control with overlap movements, and tight turning radii.
The dual intersection design combined with the three-phase signal scheme has been proven to delay the interior movements that account for approximately one-third of the total delay with the conventional diamond (1).
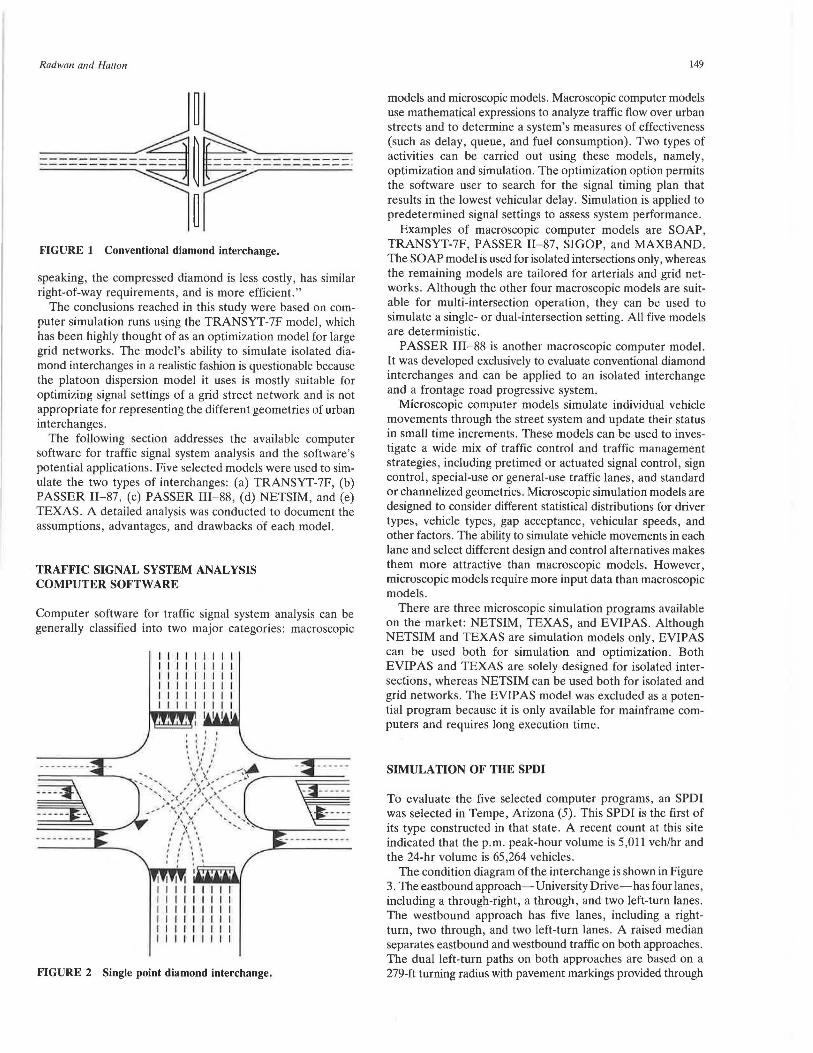
The SPDI (also known as the urban interchange) was introduced more than two decades ago. It has recently become more attractive because of its compact design, which requires less right-of-way. The SPDI, shown in Figure 2, operates as a single three-phase intersection. The through movement from the off-ramp can be prohibited, resulting in less delay to offramp traffic. One advantage of the SPDI over the conventional diamond is the large turning radius provided for the left-turn movement. The turning radius of the SPDI is approximately 300 ft; for the conventional diamond, it is only 50 to 60 ft (2). The larger turning radius allows vehicles to accelerate while turning, resulting in less delay and higher capacity .
A critical element that significantly affects the SPDI's capacity is the signal clearance duration. The distance between the two stop bars on the arterial typically ranges between 150 and 250 ft. Considering an approach speed of 35 mph, the minimum required clearance interval ranges between 7 and 9 sec (3). This is usually accomplished by using a yellow and an all-red clearance interval. As the number of left-turn lanes and freeway lanes increases, the minimum clearance interval increases and the effo.:iem:y gained by this type of interchange may be quickly lost.
A recent study ( 4) attempted to develop a methodology to determine when grade separations are appropriate. This methodology includes an economic analysis based on a benefit-cost study for ranking three-level diamond interchanges. Delay estimates were derived using the TRANSYT-7F model.
A comparative assessment of the SPDI and the compressed diamond was recently published in the !TE Journal (3), which stated: "The analyses presented make it evident that applications are limited for the single-point diamond. Generally
Radwan and Halton
~~k -----------~ ~ ~---------- · ----------, ~ r ---------· FIGURE 1 Conventional diamond interchange.
speaking, the compressed diamond is less costly, has similar right-of-way requirements, and is more efficient."
The conclusions reached in this study were based on computer simulation runs using the TRANSYT-7F model, which has been highly thought of as an optimization model for large grid networks. The model's ability to simulate isolated diamond interchanges in a realistic fashion is questionable because the platoon dispersion model it uses is mostly suitable for optimizing signal settings of a grid street network and is not appropriate for representing the different geometries of urban interchanges.
The following section addresses the available computer software for traffic signal system analysis and the software's potential applications. Five selected models were used to simulate the two types of interchanges: (a) TRANSYT-7F, (b) PASSER 11-87, (c) PASSER III-88, (d) NETSIM, and (e) TEXAS. A detailed analysis was conducted to document the assumptions, advantages, and drawbacks of each model.
TRAFFIC SIGNAL SYSTEM ANALYSIS COMPUTER SOFTWARE
Computer software for traffic signal system analysis can be generally classified into two major categories: macroscopic
I I I I I I I I I I I I II I I I I 111111111 11 1111111 11111111 1 1 1 1111111
I I I I
I I I I I II I 11 11111111 I I II 11 I I I 111111111 I I I II I II I 111 11 1111
FIGURE 2 Single point diamond interchange.
149
models and microscopic models. Macroscopic computer models use mathematical expressions to analyze traffic flow over urban streets and to determine a system's measures of effectiveness (such as delay, queue, and fuel consumption). Two types of activities can be carried out using these models, namely, optimization and simulation. The optimization option permits the software user to search for the signal timing plan that results in the lowest vehicular delay. Simulation is applied to predetermined signal settings to assess system performance.
Examples of macroscopic computer models are SOAP, TRANSYT-7F, PASSER 11-87, SIGOP, and MAXBAND. The SOAP model is used for isolated intersections only, whereas the remaining models are tailored for arterials and grid networks. Although the other four macroscopic models are suitable for multi-intersection operation, they can be used to simulate a single- or dual-intersection setting. All five models are deterministic.
PASSER 111-88 is another macroscopic computer model. It was developed exclusively to evaluate conventional diamond interchanges and can be applied to an isolated interchange and a frontage road progressive system.
Microscopic computer models simulate individual vehicle movements through the street system and update their status in small time increments . These models can be used to investigate a wide mix of traffic control and traffic management strategies, including pretimed or actuated signal control, sign control, special-use or general-use traffic lanes, and standard or channelized geometrics. Microscopic simulation models are designed to consider different statistical distributions for driver types, vehicle types, gap acceptance, vehicular speeds, and other factors. The ability to simulate vehicle movements in each lane and select different design and control alternatives makes them more attractive than macroscopic models. However, microscopic models require more input data than macroscopic models.
There are three microscopic simulation programs available on the market: NETSIM, TEXAS, and EVIPAS. Although NETSIM and TEXAS are simulation models only, EVIPAS can be used both for simulation and optimization. Both EVIP AS and TEXAS are solely designed for isolated intersections, whereas NETSIM can be used both for isolated and grid networks. The EVIP AS model was excluded as a potential program because it is only available for mainframe computers and requires long execution time.
SIMULATION OF THE SPDI
To evaluate the five selected computer programs, an SPDI was selected in Tempe, Arizona (5). This SPDI is the first of its type constructed in that state. A recent count at this site indicated that the p.m. peak-hour volume is 5,011 veh/hr and the 24-hr volume is 65 ,264 vehicles.
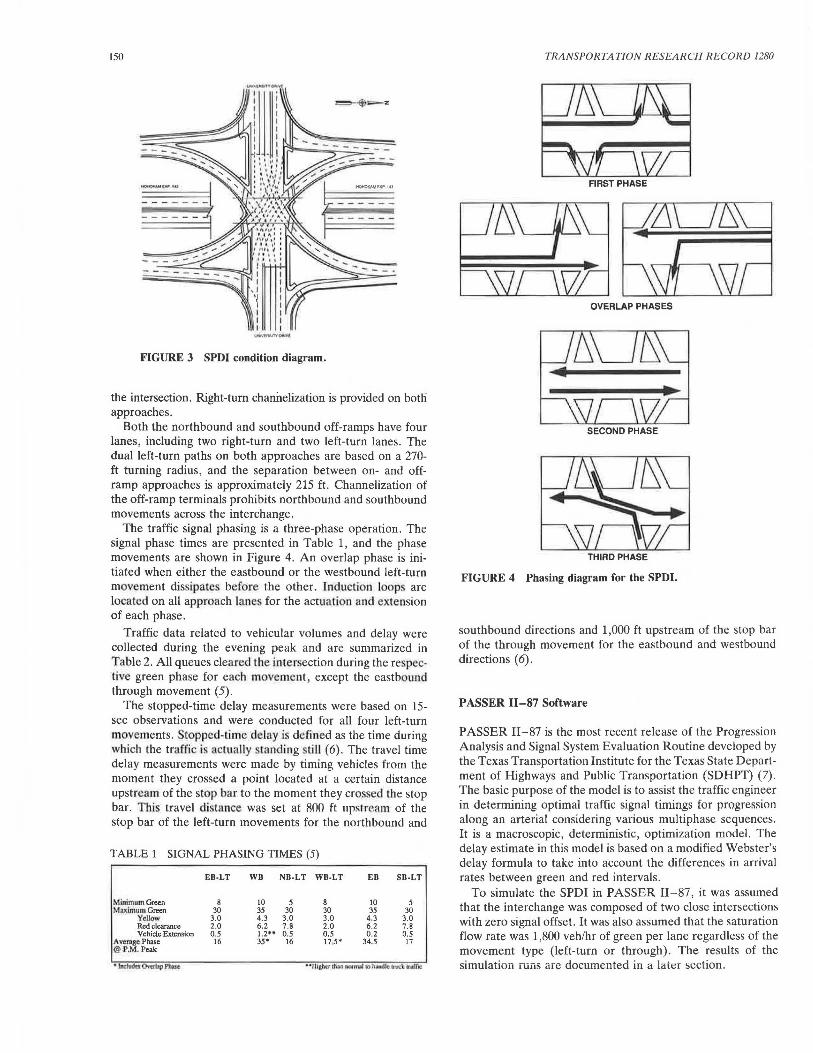
The condition diagram of the interchange is shown in Figure 3. The eastbound approach-University Drive-has four lanes, including a through-right, a through, and two left-tum lanes. The westbound approach has five lanes, including a rightturn, two through, and two left-turn lanes. A raised median separates eastbound and westbound traffic on both approaches. The dual left-turn paths on both approaches are based on a 279-ft turning radius with pavement markings provided through
150
FIGURE 3 SPDI condition diagram.
the intersection. Right-tum channelization is provided on botli approaches.
Both the northbound and southbound off-ramps have four lanes, including two right-tum and two left-tum lanes. The dual left-tum paths on both approaches are based on a 270-ft turning radius, and the separation between on- and offramp approaches is approximately 215 ft. Channelization of the off-ramp terminals prohibits northbound and southbound movements across the interchange.
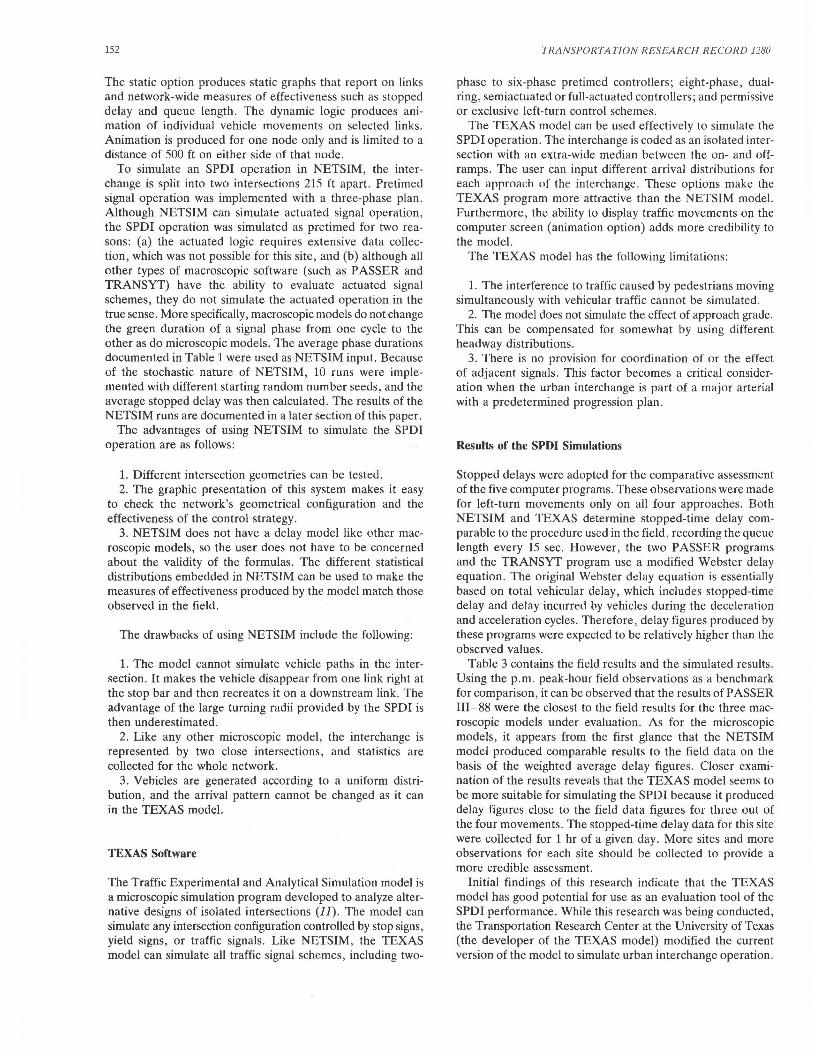
The traffic signal phasing is a three-phase operation. The signal phase times are presented in Table 1, and the phase movements are shown in Figure 4. An overlap phase is initiated when either the eastbound or the westbound left-tum movement dissipat before the other. J nduction loop are located on all approach lane for the actuation and extension of each phase.
Traffic data related to vehicular volumes and delay were collected during the evening peak and are summarized in Table 2. All queues cleared the intersection during the respective green phase for each movement, except the eastbound through movement (5).
The stopped-time delay measurements were based on 15-sec observations and were conducted for all four left-turn movements. Stopped-time delay is defined as the time during which the traffic is actually randing till (6) . The travel time delay measurements were made by timing vehicles from the moment they crossed a point located at a certain distance upstream of the stop bar to the moment they cros. ed the stop bar. This travel distance was set at 800 ft 11pstre11111 of the stop bar of the left-tum movements for the northbound and
TABLE 1 SIGNAL PHASING TIMES (5)
EB-LT we NB-LT WB-LT EB SB-LT
Minimum Green 8 10 5 8 10 5 M1udnmm Green 30 35 30 30 35 30
Ycllo'v 3.0 4.3 3.0 3.0 4.3 3.0 Red clearance 2.0 6.2 7.8 2.0 6.2 7.8 Vehicle Ex~sion o.s 1.2•• 0.5 0.5 0.2 0.5
/Iv.rage Phase @ P.M. Peak
16 35• 16 11,5• 34.5 17
• hl<ladn Owrlll' Phau ••111ghcr 1h1n l'IOlmll IOhiH~Uuckailf'l'k
TRANSPORTATION RESEARCH RECORD 1280
ARSTPHASE
OVERLAP PHASES
SECOND PHASE
THIRD PHASE
FIGURE 4 Phasing diagram for the SPDI.
southbound directions and 1,000 ft upstream of the stop bar of the through movement for the eastbound and westbound directions ( 6).
PASSER 11-87 Software
PASSER 11-87 is the most recent release of the Progression Analysis and Signal System Evaluation Routine developed by the Texas Transportation Institute for the Texas State Department of Highways and Public Transportation (SDHPT) (7). The basic purpose of the model is to assist the traffic engineer in determining optimal traffic signal timings for progression along an arterial considering various multiphase sequences. It is a macroscopic, deterministic, optimization model. The delay estimate in this model is based on a modified Webster's delay formula to take into account the differences in arrival rates between green and red intervals .
To simulate the SPDI in PASSER 11-87, it was assumed that the interchange was composed of two close intersections with zero signal offset. It was also assumed that the saturation flow rate was 1,800 veh/hr of green per lane regardless of the movement type (left-tum or through) . The results of the simulation runs are documented in a later section.

Radwan and Halton 151
TABLE 2 TRAFFIC DATA SUMMARY (5)
EASTBOUND WESTBOUND NORTHBOUND SOUTHBOUND
LEFT THROUGH RIGHT LEFT THROUGH RIGHT LEFT RIGHT LEFT RIGHT
Intersection Data
Number of Lanes 2 2 0 2
Peak Hour Volume 463 1227 308 635
Delay (Seconds)
Stopped Time Delay 30.7 . . 32.8
Travel Time Delay
at 1000 ft . 84 . 53.4
at 800 ft . . - .
Some of the advantages of using the PASSER II model are the simplicity of data input and the ability to simulate different types of signal phasing schemes. However, the model has several disadvantages. The main disadvantage is the inability of the user to input the appropriate clearance interval of each phase. One possibility to overcome this shortcoming is to add the clearance interval to the green phase. Regardless of the user input, the model assumes a fixed phase lost time of 4.0 sec, and the user has no way of changing this value. Another disadvantage is that the model has no special treatment for right-turn traffic and no allowance for separate right-turning lanes.
PASSER 111-88 Software
PASSER 111-88 is the recent release of the Progression Analysis and Signal System Evaluation Routine-Model III for diamond interchanges (8). The model was developed to determine the optimal phase patterns, splits, and internal offsets at signalized isolated interchanges. In addition, the model is capable of optimizing system cycle length and progression offsets for one-way frontage roads.
The isolated interchange logic simulates the operation of the interchange into both a right and a left side. Five basic signal phases are allowable. There are two possibilities for off-ramp left turners: either lead or lag to the on-ramp movement. Several phasing combinations can be generated, and the model tests these alternatives to find the optimum pattern and offsets. Webster's delay equation is used for the optimization process.
Because PASS ER 111-88 is designed exclusively for the conventional diamond, several assumptions had to be made to simulate the SPDI operation. No apparent advantages were identified in using this software. As with PASSER 11-87, the clearance interval was overlooked in the analysis process. However, PASSER 111-88 provides for a separate analysis of right-turning movement as well as a simulation of separate turning lanes. One severe limitation is that PASSER III-88 is a fixed-sequence program, which limits its application to the five predetermined sequences.
2 1 2 2 2 2
592 583 72 331 568 232
. . 29.6 . 31.6 -
44.7 18.5 . - . .
- . 45.0 . 54.2 .
TRANS YT-7F Software
The TRANSYT-7F model is the U.S. version of the Traffic Network Study Tool model developed by the Transport and Road Research Laboratory of Great Britain (9). It is a macroscopic, deterministic, time-scan model for optimizing the signalization on arterials and grid networks.
Intersections are represented by nodes in TRANSYT, and links represent streets connecting those intersections. Each link can represent a traffic movement at any given node. The SPDI is represented by coding two nodes with zero offset. The delay model used is a modified version of the Webster formula. The hill-climbing procedure is not applicable for diamond interchanges because there is no offset between the two signals. The model is used only for simulation.
The advantage of using TRANSYT is the ability to simulate each movement separately and to include the clearance interval for each phase. Furthermore, the model can simulate other geometric features such as the location of the stop bar and the location of transit stops. The results of the simulation runs for the SPDI are documented in a later section.
TRAF-NETSIM Software
TRAF is a system of traffic simulation models designed to represent traffic flow on any existing highway facility. The abbreviation "NETSIM" is composed of the prefix "NET" for surface street network and the suffix "SIM" for microscopic simulation. Individual vehicles are simulated through the system along the links, according to specified controls at nodes (intersections), stochastically determined turning movements, and deterministic car following. No set paths are modeled because turning movements are purely random.
NETSIM has a multiplicity of features and user options. Virtually any feasible geometric configuration, traffic control system, traffic management strategy, and demand configuration can be modeled. The type of network may vary from a single intersection to a complex grid network.
The most recent release of TRAF-NETSIM can produce static and dynamic representation of traffic movements (10).
152
The static option produces static graphs that report on links and network-wide measures of effectiveness such as stopped delay and queue length. The dynamic logic produces animation of individual vehicle movements on selected links . Animation is produced for one node only and is limited to a distance of 500 ft on either side of that node.
To simulate an SPDI operation in NETSIM, the interchange is split into two intersections 215 ft apart . Pretimed signal operation was implemented with a three-phase plan. Although NETSIM can simulate actuated signal operation, the SPDI operation was simulated as pretimed for two reasons: (a) the actuated logic requires extensive data collection, which was not possible for this site, and (b) although all other types of macroscopic software (such as PASSER and TRANSYT) have the ability to evaluate actuated signal schemes, they do not simulate the actuated operation in the true sense. More specifically, macroscopic models do not change the green duration of a signal phase from one cycle to the other as do microscopic models. The average phase durations documented in Table 1 were used as NETSIM input. Because of the stochastic nature of NETSIM, 10 runs were implemented with different starting random number seeds, and the average stopped delay was then calculated. The results of the NETSIM runs are documented in a later section of this paper.
The advantages of using NETSIM to simulate the SPDI operation are as follows:
1. Different intersection geometries can be tested. 2. The graphic presentation of this system makes it easy
to check the network's geometrical configuration and the effectiveness of the control strategy.
3. NETSIM does not have a delay model like other macroscopic models, so the user does not have to be concerned about the validity of the formulas . The different statistical distributions embedded in NETSIM can be used to make the measures of effectiveness produced by the model match those observed in the field.
The drawbacks of using NETSIM include the following:
1. The model cannot simulate vehicle paths in the intersection. It makes the vehicle disappear from one link right at the stop bar and then recreates it on a downstream link. The advantage of the large turning radii provided by the SPDI is then underestimated.
2. Like any other microscopic model, the interchange is represented by two close intersections, and statistics are collected for the whole network.
3. Vehicles are generated according to a uniform distribution, and the arrival pattern cannot be changed as it can in the TEXAS model.
TEXAS Software
The Traffic Experimental and Analytical Simulation model is a microscopic simulation program developed to analyze alternative designs of isolated intersections (11). The model can simulate any intersection configuration controlled by stop signs, yield signs, or traffic signals. Like NETSIM, the TEXAS model can simulate all traffic signal schemes, including two-
TRANSPORTATION RESEARCH RECORD 1280
phase to six-phase pretimed controllers; eight-phase, dualring, semiactuated or full-actuated controllers; and permissive or exclusive left-turn control schemes.
The TEXAS model can be used effectively to simulate the SPDI operation. The interchange is coded as an isolated intersection with an extra-wide median between the on- and offramps. The user can input different arrival distributions for each apprn11c.h of the interchange . These options make the TEXAS program more attractive than the NETSIM model. Furthermore, the ability to display traffic movements on the computer screen (animation option) adds more credibility to the model.
The TEXAS model has the following limitations:
1. The interference to traffic caused by pedestrians moving simultaneously with vehicular traffic cannot be simulated.
2. The model does not simulate the effect of approach grade. This can be compensated for somewhat by using different headway distributions.
3. There is no provision for coordination of or the effect of adjacent signals. This factor becomes a critical consideration when the urban interchange is part of a major arterial with a predetermined progression plan.
Results of the SPDI Simulations
Stopped delays were adopted for the comparative assessment of the five computer programs. These observations were made for left-turn movements only on all four approaches. Both NETSIM and TEXAS determine stopped-time delay comparable to the procedure used in the field, recording the queue length every 15 sec. However, the two PASSER programs and the TRANSYT program use a modified Webster delay equation . The original Webster delay equation is essentially based on total vehicular delay, which includes stopped-time delay and delay incurred by vehicles during the deceleration and acceleration cycles. Therefore, delay figures produced by these programs were expected to be relatively higher than the observed values.
Table 3 contains the field results and the simulated results . Using the p.m . peak-hour field observations as a benchmark for comparison, it can be observed that the results of PASSER 111-88 were the closest to the field results foLthe three macroscopic models under evaluation. As for the microscopic models, it appears from the first glance that the NETSIM model produced comparable results to the field data on the basis of the weighted average delay figures. Closer examination of the results reveals that the TEXAS model seems to be more suitable for simulating the SPDI because it produced delay figures close to the field data figures for three out of the four movements. The stopped-time delay data for this site were collected for 1 hr of a given day . More sites and more observations for each site should be collected to provide a more credible assessment.
Initial findings of this research indicate that the TEXAS model has good potential for use as an evaluation tool of the SPDI performance. While this research was being conducted, the Transportation Research Center at the University of Texas (the developer of the TEXAS model) modified the current version of the model to simulate urban interchange operation.
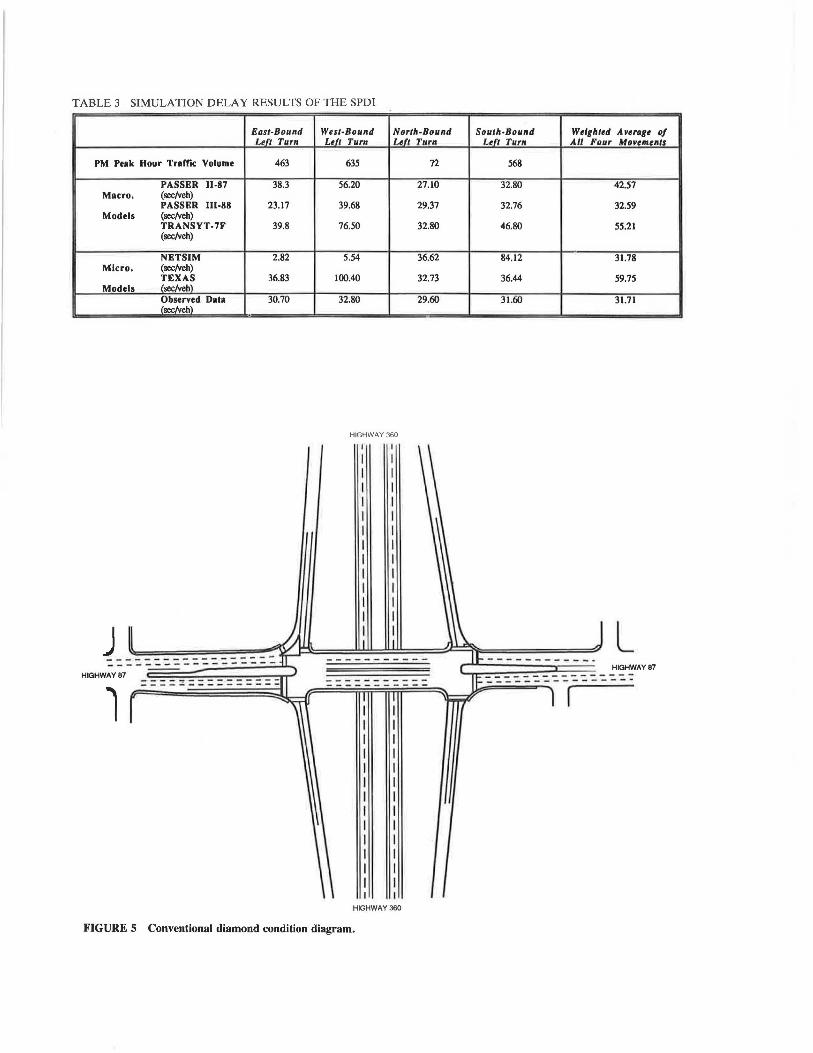
TABLE 3 SIMULATION DELAY RES UL TS OF THE SPDI
East-Bound West-Bound North-Bound South-Bound Weighted A verag1 of Left Turn Ltft Turn Left Turn L eft Turn All Four Movements
PM Peak Hour Trame Volume 463 635 72 568
PASSER 11-87 38.3 56.20 27.10 32.80 42.57 Macro. (sec/Yeh)
PASSER 111-88 23.17 39.68 29.37 32.76 32.59 Models (sec/veh)
TRANSYT-7F 39.8 76.50 32.80 46.80 55.21 (sec/veh)
NETSIM 2.82 5.54 36.62 84.12 31.78 Micro. (sec/veh)
TEXAS 36.83 100.40 32.73 36.44 59.75 Models (sec/veh)
Observed Dala 30.70 32.80 29.60 31.60 31.71 (sec/veh)
HIGHWAY 360
J _ ----------------~=====~==~=- _= __ = __ = __ = __ :=P"_ ---- ----- -- -- ------L
HIGHWAY87 HIGHWAY87
l
HIGHWAY 360
FIGURE S Conventional diamond condition diagram.

154 TRANSPORTATION RESEARCH RECORD 1280
TABLE 4 TRAFFIC DATA SUMMARY FOR CONVENTIONAL DIAMOND INTERCHANGE (5)
S.R. 87 (ARTERIAL) S.R. 360 OFF-RAMPS
SOUTH·BOUND NORTH·BOUND WEST-BOUND EAST-BOUND
LEFT TllROUUH RIGHT LEFT THROUGH RIGHT LEFT RIG/IT LEFT RIGHT
Number of Lanes 1
Volume of P.M.
Peak Hour 271
Average Phase
Length (Seconds) 16.8
Yellow 4.5
Red Qearance 2.0
Cycle Length = 92.50 Seconds Lost Time= 19.0 Seconds
FRONTAGE ROAD
2
1316
30
4.5
2.0
_JTI_ ARTERIAL
,PA-
" ~c LEFT TURNS t
,PC-
1 1
712 302
. 18.5
. 4.5
. 2.0
L -,PA
ARTERIAL
FRONTAGE ROAD
PHASING LEFT SIDE LEFT TURN RIGHT SIDE CODE PHllSE SEQUENCE SEQUENCE PHASE SEQUENCE
- J - - i __J
I - ir- LEAD-LEAU - -A c A B c
- - ~ - t _J 2 -r- LAG-LEAD -- -A c B A B c
~ - - _J
t -3 - -r- LEAD· LAG -A B - c B c A - i - __J i -4 r- LAG·LAG -- - c A c 8 A B - + - - l ~ IA -- re TTl-LEAD - ~ A B A
FIGURE 6 Phasing code description used by PASSER III-88.
~
1307
30
4.5
2.0
1 1.5 1.5 2 1
303 335 281 517 345
- 25 25
. 4.0 4.0
. 2.0 2.0
No public release has yet been made of that version, and the Texas SDHPT is currently evaluating the program.
SIMULATION OF THE CONVENTIONAL DIAMOND
The conventional diamond interchange is the interchange most commonly found in urban areas where the arterial street is carried over or under the freeway facility. Accessibility to and from the freeway is provided by four ramps. The interchange can be treated as two isolated signalized intersections 250 to 350 ft apart. The storage area on the bridge deck is a critical element in determining the interchange capacity. The signal phasing scheme of this type of interchange may specifically affect its performance.
To test the ability of the PASSER 11-87, PASSER III-88 , TRANSYT-7F, TRAF-NETSIM, and TEXAS models to simulate the conventional diamond interchange operation, an interchange in Mesa, Arizona, was adopted (5). Figure S shows a layout of the conventional diamond, and Table 4 presents a traffic data summary of this interchange.
As shown in Figure 6, the five phasing schemes adopted by the PASSER III-88 model were used to test the computer software. No delay data were available for the conventional diamond in Mesa; however, the delay statistics produced by the computer models were used to conduct a comparative assessment to determine if models produce comparable results.
The coding of the conventional diamond could not be accomplished for the TEXAS model because the phasing code for this model is limited to a single intersection. Therefore, the assessment was limited to the other four programs. Table 5 presents the delay results in seconds per vehicle as calculated

Radwan and Ha/Ion 155
TABLE 5 DELAY RESULTS OF CONVENTIONAL DIAMOND (sec/veh)
PHASE ORDER PASSER 11-87 PASSER III-88
Lead-Lead 45.10 39.06
Lag-Lead 43.90 38.66
Lead-Lag 44.10 37.96
Lag-Lag 42.90 37.11
TTI-1..ead 44.70 62.57*
•sim11la1ed for a cycle lcnglh of 120 sccoods
by the four programs. The three macroscopic models produced comparable results with respect to the five phase orders under consideration. The only exception was observed for the Texas Transportation Institute (TTI) lead phase as applied to the PASSER III program. The difference between the TII scheme and the lead-lead scheme is that the TII phase order considers a 12-sec offset between the left side of the interchange and the right side. PASSER III logic did not permit the TII evaluation for a 95-sec cycle length, and the cycle length had to be increased to 120 sec. This change was probably the reason for the higher delay figure in this phase.
The results of the NETSIM model varied more than those of the other models for different phase orders. This finding was expected for two reasons. The first is that NETSIM is a microscopic model and traffic events are processed in smaller time increments, allowing more accurate calculation of the impact of signal phasing schemes on vehicular delay. The second reason is attributed to the stochastic nature of the model, which would be included in the analysis of the effects of random events.
Another significant issue is the absolute values of the delay figures produced by the models. Both PASSER models produced comparable delay values, but the TRANSYT and the NETSIM models did not. Because of the lack of field data availability at conventional diamond interchanges, no conclusions can be reached concerning which model is more accurate in simulating the conventional diamond.
CONCLUSION
It was concluded that all five computer programs evaluated can simulate the SPDI operation. Each program has unique features that make it more attractive than the others. From the limited number of runs made, it appears that the PASS ER 111-88 and the TEXAS model results were the closest to the field data.
All programs except the TEXAS model were able to simulate the conventional diamond design. It was not possible to determine the effectiveness of these simulations without extensive field data to conduct successful model validations.
TRANSYT-7F NETS IM
181.97 26.80
185.79 66.20
181.04 58.60
184.87 26.00
181.49 42.80
ACKNOWLEDGMENTS
The authors would like to express their appreciation to the Arizona Department of Transportation (ADOT) for sponsoring this study. Appreciation is also extended to John Warner of the ADOT Traffic Engineering Section for making the field data available.
REFERENCES
1. J. P. Leisch. Innovations of Diamond Interchanges in Urban Environment. !TE Journal, Vol. 55, No. 11, Nov. 1985 .
2. T. Darnell. Gridlock. American City and County, Communications Channels, Inc., Atlanta, Ga., Vol. 102, No. 8, Aug. 1987.
3. J . P. Leisch, T. Urbanik, and J.P. Oxley. A Comparison of Two Diamond Interchange Forms in Urban Areas. /TE Journal, Vol. 59, No. 5, May 1989.
4. B. Rymer and T. Urbanik. Intersection, Diamond, Three Level Diamond Grade Separation Benefit/Cost Analysis Based on Delay Savings. In Transportation Research Record 1239, TRB , National Research Council, Washington, D.C., 1989.
5. J . H. Warner. Traffic Engineering Study of the Urban Interchange. Traffic Engineering Section , Arizona Department of Transportation, Phoenix, Aug. 1988.
6. Manual of Traffic Engineering Studies, 4th ed., ITE, Washington, D.C., 1976.
7. E. Chang, Y. Lei, and C. Messer. Arterial Signal Timing Optimization Using PASSER l!-87: User's Guide. Texas Transportation Institute, Texas A&M University, College Station, July 1988.
8. D . Fambro et al. A Report on the User's Manual for the Microcomputer Version of PASSER III-88. Texas Transportation Institute, Texas A&M University, College Station, Sept. 1988.
9. TRANSYT-7F: User's Manual, Release 5. FHWA, U.S. Department of Transportation, 1987.
10. TRAF-NETSIM: User's Manual. FHWA, U.S. Department of Transportation, March 1989.
11. C. Lee et al. User-Friendly TEXAS Model-Guide to Data Entry. Research Report 361-lF. Center for Transportation Research, University of Texas at Austin, Aug . 1986.
Th view. e.tpressed i11 this paptJr are /hose of tlie ruuhors and not of the Arizona Depar1me11t of Tra11spona1io11. The all/hors are solely respomible for tile accuracy of tire results presellted.
Publication of this paper sponsored by Committee on Operational Effects of Geometrics.