EVALUATION OF THE TOTAL MASS OF SPENT FUEL AND PLUTONIUM GENERATED … · 2016-10-21 ·...
12
/JMJ~-%-()(X.c2 LA-UR 93-0062 ~EpRoDucT,oN &,=iA_...,. ,.+,++ F copy ;!< 1S4 REPORT SECTION .,_ – ---- ~-—–e -—- .= — — EVALUATION OF THE TOTAL MASS OF SPENT FUEL AND PLUTONIUM GENERATED BY U.S. AND GLOBAL NUCLEAR REACTORS O. P. JUDD, J. W. DAVIDSON, AND T. J. TRAPP DECEMBER 18, 1992 This is a preprint of a paper intended for publication in a journal or procaadinga. Because changes may be made before publication, this preprint is made available with the understanding that it will not be cited or reproduced without the permission of the author.
Transcript of EVALUATION OF THE TOTAL MASS OF SPENT FUEL AND PLUTONIUM GENERATED … · 2016-10-21 ·...

/JMJ~-%-()(X.c2
LA-UR 93-0062 ~EpRoDucT,oN &,=iA_...,. ,.+,++
F
copy ;!<
1S4 REPORT SECTION .,_ – ----~-—–e -—-.=—
—
EVALUATION OF THE TOTAL MASS OFSPENT FUEL AND PLUTONIUM
GENERATED BY U.S. AND GLOBALNUCLEAR REACTORS
O. P. JUDD, J. W. DAVIDSON, AND T. J. TRAPP
DECEMBER 18, 1992
This is a preprint of a paper intended for publication in a journal or procaadinga. Because changes may be made before publication, this preprint is made available with
the understanding that it will not be cited or reproduced without the permission of the author.
ABOUT THIS REPORT
This official electronic version was created by scanning the best available paper or microfiche copy of the original report at a 300 dpi resolution. Original color illustrations appear as black and white images. For additional information or comments, contact: Library Without Walls Project Los Alamos National Laboratory Research Library Los Alamos, NM 87544 Phone: (505)667-4448 E-mail: [email protected]

LA-UR 93-0062
EVALUATION OF THE TOTAL MASS OF SPENT FUEL AND PLUTONIUMGENERATED BY U.S. AND GLOBAL NUCLEAR REACTORS
O. P. JUDD, J. W. DAVIDSON, AND T. J. TRAPP
DECEMBER 18, 1992
DETERMINATION OF THE PLUTONIUM IN SPENT FUEL
The plutonium generated by U.S. and global nuclear reactors can be estimatedfrom two factors: the amount of reactor spent fuel generated, and the fractionof the spent fuel that is plutonium. Energy production depends on the powerof the reactor and the burnup of the fissile fuel in the reactor. The burnup ofa reactor is a measure of the fission energy produced and is usually expressedin terms of megawatt(therrnal) -days per metric ton of the initial heavy metalfuel load(MWt-d/MTIHM). For brevity, MTIHM will simply be abbreviated as T.
As an example, using 200MeV as the energy release from one fission event of23SU; one kilogr~ of 235U produces approximately 1000 Mwt-d . If the fuelwere all fissile material, this is the largest burnup and specific energy outputthat could be achieved from a reactor. For light water reactors (LWR), naturaluranium fuel is enriched in the fissile isotope to a level of 3%. If we nownormalize the burnup to the total metal mass of fuel, we get for the aboveexample, 33,000 MWt-d/T. By the late 19 80’s, typical BWR and PWR bumupswere around 33 ,000MWt-d/T with an enrichment level of 3.2% 235U. Advancesin fuel assemblies and fuel management techniques, combined with higherenrichment levels of 5% now yield bumup levels of 50,000MWt-cl/T. 1
The typical thermal-to- electrical conversion efficiency for a reactor is 339f0.Consequently, 33,000MWt-d corresponds to approximately 10,000MWe-d/T.
In actual reactor operation, the situation is somewhat more complicated. Mostof the fuel is 238U, which by itself will contribute less than 10% to the fissileenergy release. However, some of the 238U will be converted to 239Pu throughsuccessive neutron capture reactions, which will contribute to the fission
~power of the reactor. The amount of uranium that is converted to plutonium_—w ,. 1in the reactor is emmessed by the conversion ratio, C, and depends upon howthe reactor is oper&ed. For-t ypical operation of a LWR, after 15 years, abouthalf of the power generated by fission results from burning Pu.Consequently, it is necessary to distinguish the mass of Pu in spent fuel, waste,and reactor inventory. Fo; most LWR reactors, the spent fuel mass ispredominately 238U. “Waste” generally denotes the mass of actnides andfission products generated. As an example, a one GWe reactor operating forone year m-educes atmroximately 33 T of spent fuel, 330 Kg of actinides (300 Kgof Pfi) , m-dthe reactor
1000 Kg”:ffuel cycle,
fission rkoducts. AI1 of these values depend strongly onthe fuel enrichment, and the specific ‘operation of the
1
LJ4-UR 93-0062
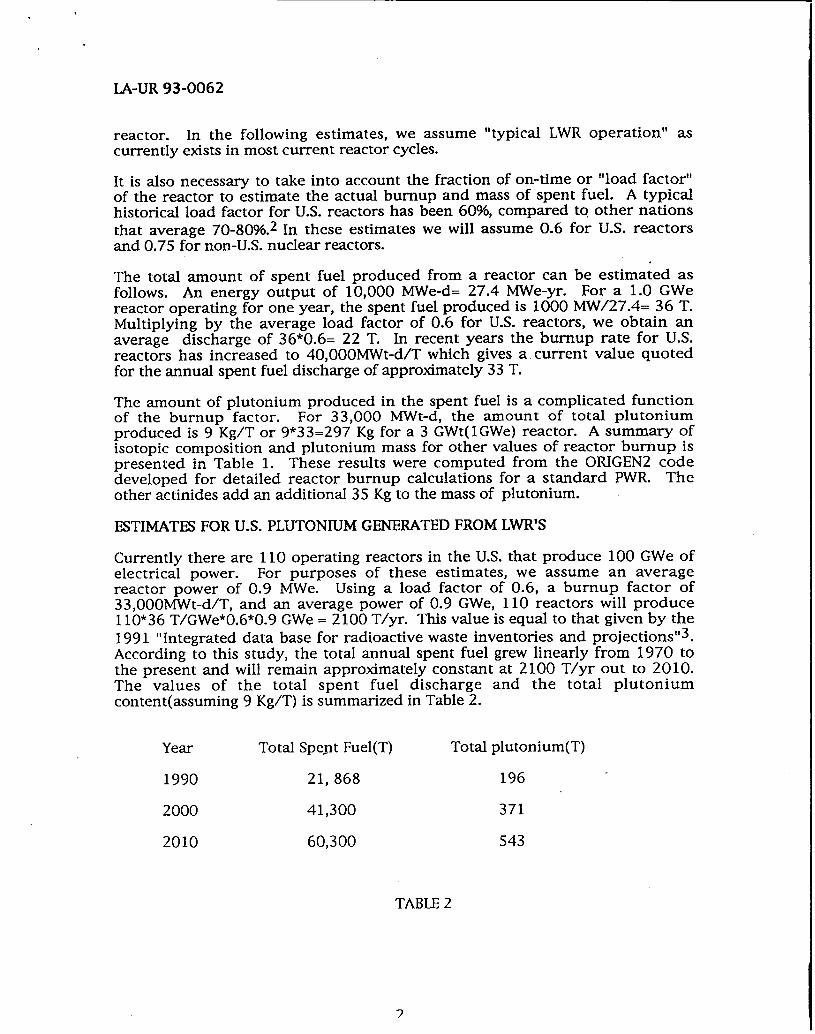
reactor. In the following estimates, we assume “typical LWR operation” ascurrently exists in most current reactor cycles.
It is also necessary to take into account the fraction of on-time or “load factor”of the reactor to estimate the actual burnup and mass of spent fuel. A typicalhistorical load factor for U.S. reactors has been 60%, compared to other nationsthat average 70-809f0.2 In these estimates we will assume 0.6 for U.S. reactorsand 0.75 for non-U.S. nuclear reactors.
The total amount of spent fuel produced from a reactor can be estimated asfollows. An energy output of 10,000 MWe-d= 27.4 MWe-yr. For a 1.0 GWereactor operating for one year, the spent fuel produced is 1000 MW/27.4= 36 T.Multiplying by the average load factor of 0.6 for U.S. reactors, we obtain anaverage discharge of 36*0.6= 22 T. In recent years the burnup rate for U.S.reactors has increased to 40,000MWt-d/T which gives a current value quotedfor the annual spent fuel discharge of approximately 33 T.
The amount of plutonium produced in the spent fuel is a complicated functionof the burnup factor. For 33,000 MWt-d, the amount of total plutoniumproduced is 9 Kg/T or 9*33=297 Kg for a 3 GWt( 1GWe) reactor. A summary ofisotopic composition and plutonium mass for other values of reactor burnup ispresented in Table 1. These results were computed from the 0RIGEN2 codedeveloped for detailed reactor burnup calculations for a standard PWR. Theother actinides add an additional 35 Kg to the mass of plutonium.
ESTIMATES FOR U.S. PLUTONIUM GENERATED FROM LWR’S
Currently there are 110 operating reactors in the U.S. that produce 100 GWe ofelectrical power. For purposes of these estimates, we assume an averagereactor power of 0.9 MWe. Using a load factor of 0.6, a burnup factor of33 ,000MWt-d/T, and an average power of 0.9 GWe, 110 reactors will produce110*36 T/GWe*O.6*0.9 GWe = 2100 T/yr. This value is equal to that given by the1991 “Integrated data base for radioactive waste inventories and projections”3.According to this study, the total annual spent fuel grew linearly from 1970 tothe present and will remain approximately constant at 2100 T/yr out to 2010.The values of the total spent fuel discharge and the total plutoniumcontent(assuming 9 Kg/T) is summarized in Table 2.
Year Total Spent Fuel(T) Total plutonium(T)
1990 21, 868 196
2000 41,300 371
2010 60,300 543
TABLE 2
7

LA-UR 93-0062
GLOBAL PLUTONIUM GENERATED IN NUCLEAR REACTORS
Estimates for the global production of plutonium are slightly more complicatedand more uncertain. Approximately 85% of all reactors in the world are PWR’Sand BWR’S. The rest produce smaller amounts of plutonium. For theseestimates we assume that the spent fuel discharge from PWR’S and BWR’S areapproximately equal and that the 412 nuclear reactors in the world have atypical burnup of 33,000MWt-d/T. The current global power production is 325GWe, resulting in an average reactor of 325/412 = 0.8 GWe. Assuming a 0.75load factor and a waste production rate of 36 T/GWe as derived previously, theannual production of global nuclear spent fuel is 36*0.8*0.75= 21.6 T/reactoror 412* 21.6 = 8900 T/yr total. Using the results in Table 1, we obtain aPlutonium fraction of 9 Kg/T. The annual production of plutonium fromglobal reactor spent fuel is then 8900 T/yr*9 Kg/T= 80 T/yr. A more currentburnup value for many Euorpean reactors is 50,000 MWt-d/T, which results ina lower discharge of total spent fuel but a higher fraction of plutonium. Usingthe appropriate values from Table 1 we obtain 8900 T/yr* 10.9 Kg/T= 97 T/yr.For purposes of this estimate we will assume an global annual plutoniumproduction of 100 T/yr.
In order to obtain the current world reactor waste estimate we use the datafrom the IAEA1 that by the end of 1991, a total of 6038 years-reactor operatingexperience had been accumulated in the course of generating a total of 20,145TWe-h. This average energy generation corresponds to 839 x 106 MWe-d.Assuming a burnup factor of 33,000 MWt-d/T = 10,000 MWe-d/T, the spent fuelgenerated during this time is 839 x 106 MWe-d/10,000 MWe-d/T = 83,900 T.Using the plutonium conversion fraction of 9 Kg/T gives a value of 83,900 V9Kg/T = 755 T for the plutonium generated globally to date in spent fuel. We willround this off to 800 T of plutonium in spent fuel in 1990.
PLUTONIUM INVENTORY IN REACTORS
In addition to the plutonium in spent fuel, there is also a significant mass ofplutonium in the reactor fuel inventory. This can be estimated as follows. Weassume three refueling for the reactor. On any refueling interval, the meanbumup is approximately 1/2 of the average discharge burnup rate for thereactor or 33,000 MW-d /2= 16,500 MSV-d/T. Using Table 1, this corresponds to5.9 Kg of Pu per ton of total uranium fuel inventory. For a typical one GWereactor with a uranium fuel inventory of 100-33= 67 T, the Pu inventory is 393Kg. For 110 U.S. reactors, the average Pu inventory is approximately 43 T.Using the same procedure for global reactors, the Pu inventory is 412* 393 Kg=161 T.
3

LJ&UR 93-0062
SUMMARY
In 1990, the U.S. had 110 reactors operating at an average electrical poweroutput of 0.9 GWe giving a total capacity of 100 GWe. From the period of 1970through 1990, these reactors generated 20,868 T of total spent fuel of whichapproximately 200 T is plutonium. Assuming replacement of all currentnuclear capacity, but no new growth, the total spent fuel will increase at a rateof 2100 T/yr and plutonium at a rate of 19 T/yr.
Currently there are 412 nuclear reactors in the world with a total electricalgeneration capacity of 325 GWe. The accumulated spent fuel generated up to1990 is 83,900 ~ of this the plutonium content is 800 T. “Assuming replacementof all current nuclear capacity but no new growth, the total global spent fuelwill increase at a rate of 8900 T/yr and the plutonium will increase at a rate of100 T/yr.
As a comparison, the amount of plutonium expected to be recovered fromdismantled nuclear weapons for both the U. S. and the CIS is approximately 100.1.
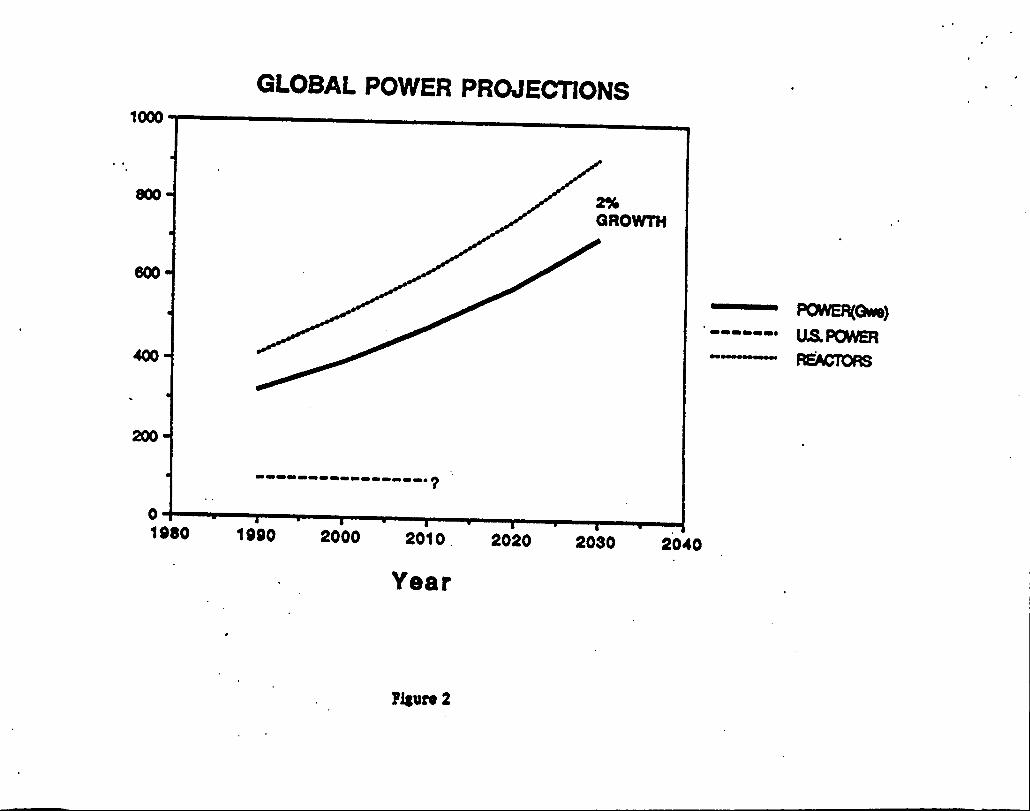
Plots of historical and projected electrical generation, total spent fuelproduction and plutonium production for the U.S. and the world are shown inFigures (1), (2), (3), and(4) respectively.
4
LA-UR 93-0062
REFERENCES
(1) “Nuclear Power Reactor Characteristics”, The Uranium Institute, IAEA,Bowater House, London, England, 1992.
(2) “Nuclear Power” National Research Council, National Academy Press,Washington, D.C. , 1992. p50. )
(3) “Integrated Data Base For 1991: U.S. Spent Fuel and Radioactive WasteInventories, Projections, and Characteristics”, Oak Ridge National LaboratoryReport DOEYRW-0006, 1991;p21.
5

.
.“.
.-.-
—.-
Iii!zz
,

.i
.
.-
nc<[
UIJ
-J0
●
u)
.1
8.
1.
11
.
.8$,
0.:.
6‘“
.
..
:8I
.
>10.
n
N
.

!.
,.
9<w●ml
I
(J■■3
●dz:E0ccLIm.4LLI
ii?}-:2LUCL
co8
3z
Wuoool=
)S
svuu

,..
,,
Jn
Il:;I:;I:i
I:iI:i
ouI
o
Ui
o
CJ
co
%\
cl.
i=
\\..
iC-4
%.●
i
‘\.‘
i\
.●
.i
\.●
i-o
.\.
;(~
\8.
\.
i,0
\.
\.
i~ol
.\
.i
\.
\.
i
\..
;‘
\.
\.
io
\\
ii
LF.
\i
,0.
\..
\i
~.
\.
;—
\..
;\
.
\,
i..
;o
.1i
.0-o
\*.
\.
04
\........
0..
a)m
o00co
o0
000
0z
wo
uN
(M)
SSVW
WfllN
Olflld
c–,
*
ro

.
1---
0C3