Evaluation of the Multijurisdictional Task Forces (MJTFs ...
88
The author(s) shown below used Federal funds provided by the U.S. Department of Justice and prepared the following final report: Document Title: Evaluation of the Multijurisdictional Task Forces (MJTFs), Phase II: MJTF Performance Monitoring Guide Author: William Rhodes, Christina Dyous, Meg Chapman, Michael Shively, Dana Hunt, Kristen Wheeler Document No.: 228942 Date Received: December 2009 Award Number: 2005-DD-BX-0002 This report has not been published by the U.S. Department of Justice. To provide better customer service, NCJRS has made this Federally- funded grant final report available electronically in addition to traditional paper copies. Opinions or points of view expressed are those of the author(s) and do not necessarily reflect the official position or policies of the U.S. Department of Justice.
Transcript of Evaluation of the Multijurisdictional Task Forces (MJTFs ...

The author(s) shown below used Federal funds provided by the U.S. Department of Justice and prepared the following final report: Document Title: Evaluation of the Multijurisdictional Task Forces
(MJTFs), Phase II: MJTF Performance Monitoring Guide
Author: William Rhodes, Christina Dyous, Meg
Chapman, Michael Shively, Dana Hunt, Kristen Wheeler
Document No.: 228942
Date Received: December 2009 Award Number: 2005-DD-BX-0002 This report has not been published by the U.S. Department of Justice. To provide better customer service, NCJRS has made this Federally-funded grant final report available electronically in addition to traditional paper copies.
Opinions or points of view expressed are those
of the author(s) and do not necessarily reflect the official position or policies of the U.S.
Department of Justice.
Evaluation of theMultijurisdictional Task Forces
(MJTFs), Phase II
MJTF PERFORMANCEMONITORING GUIDE
Final
Contract #2005-DD-BX-002
February 27, 2009
Prepared for
Brett ChapmanOffice of Research and Evaluation
National Institute of Justice810 Seventh St., N.W.
Washington, DC 20531
Prepared by
William Rhodes, Project DirectorChristina Dyous, Deputy Project Director
Meg ChapmanMichael Shively
Dana HuntKristen Wheeler
Abt Associates Inc.55 Wheeler St.
Cambridge, MA 02138www.abtassoc.com

Abt Associates Inc. Contents i
Contents
Introduction….. .................................................................................................................................... 1Why Develop a Guide? ................................................................................................................ 1What Is This Guide? .................................................................................................................... 2For Whom Is This Guide Intended?............................................................................................. 2How Was This Guide Developed?............................................................................................... 2Why Should Programs Be Monitored? ........................................................................................ 3
To Promote Accountability ............................................................................................... 3To Support Decisions about MJTF Sustainment ............................................................... 4To Inform Program Improvement ..................................................................................... 4
Using Performance Measures To Monitor MJTFs....................................................................... 4
Chapter 1: Performance Measurement: What to Measure ....................................................... 6Logic Models ............................................................................................................................... 6Developing a Logic Model .......................................................................................................... 8
Defining Goals................................................................................................................... 9Identifying All Inputs/Resources..................................................................................... 10Listing Program Activities............................................................................................... 11Identifying and Developing Output Measures................................................................. 12Identifying and Developing Outcome Measures ............................................................. 12Thinking Through Impacts .............................................................................................. 13Summary: Developing Logic Models.............................................................................. 14
Using the Logic Model to Move to a Performance Monitoring System.................................... 15
Chapter 2: Performance Measurement: Collecting Data ........................................................ 16A Template for a Multijurisdictional Task Force Performance Measurement System.............. 18
Definitions ....................................................................................................................... 18Part I ................................................................................................................................ 18Part II ............................................................................................................................... 20
Chapter 3: Performance Monitoring: Analyzing MJTF Performance................................... 23Using MJTF Logic Models to Guide Assessments of Performance .......................................... 23I. Using the System to Describe MJTF Programs............................................................... 24
Describing Resources Committed to MJTF Programs .................................................... 24Describing MJTF Activities and Outputs ........................................................................ 27
II. Using the Performance Monitoring System to Track MJTF Programs Over Time......... 30Tracking Task Force Objectives...................................................................................... 30Tracking MJTF Staffing Levels ...................................................................................... 32Tracking the Portion of MJTF Expenditures Offset by Revenue .................................... 34Tracking MJTF Investigations, Arrests, and Drug Seizures............................................ 34Tracking MJTF Outcomes: Convictions and Sentences................................................. 39
III. Using Performance Monitoring Systems to Examine Linkages in MJTF Logic Models 42Examining Links Between MJTF Objectives and Outputs ............................................. 42Examining Links between MJTF Resources and Activities and Outputs ....................... 43
Monitoring Using Tabulations versus Monitoring Using Statistical Analysis .......................... 46
This document is a research report submitted to the U.S. Department of Justice. This report has not been published by the Department. Opinions or points of view expressed are those of the author(s) and do not necessarily reflect the official position or policies of the U.S. Department of Justice.

Abt Associates Inc. Contents ii
Chapter 4: Performance Monitoring: Practical Steps and Advanced Analysis..................... 47The Workbook ........................................................................................................................... 47
Trends in Inputs............................................................................................................... 50Correlations between Inputs and Outputs........................................................................ 52Statistical Significance of Correlations between Inputs and Outputs.............................. 52Extended Analysis ........................................................................................................... 56
Conclusion……................................................................................................................................... 70
Appendix 1: References .............................................................................................................A1-1
Appendix 2: Performance Measurement Template ................................................................A2-1
Appendix 3: Analysis Worksheet..............................................................................................A3-1
This document is a research report submitted to the U.S. Department of Justice. This report has not been published by the Department. Opinions or points of view expressed are those of the author(s) and do not necessarily reflect the official position or policies of the U.S. Department of Justice.

Abt Associates Inc. Introduction 1
Introduction
State and local law enforcement is the first line of defense in reducing the availability of illegal drugson American streets. Recognizing the critical role of local agencies, federal and state agenciesaugment local enforcement funding with grants and transfers. However, with increased frequencythose federal and state agencies are requiring local accountability of the use of funds—hard evidencethat grants and transfers are worthwhile. As a result, programs that are unable to provide solidevidence of their activities and effectiveness are more vulnerable to having their resources cut ordiverted to programs that can better demonstrate success.
Multijurisdictional Task Forces (MJTFs) are not immune to this new accountability in government,but like many other law enforcement programs, MJTFs lack a history of collecting performancemeasures and using them to justify program operations. Consequently, MJTFs are disadvantaged inthe new competition for federal and state funding. Overcoming that disadvantage requires developinga performance monitoring system.
Performance measurement is a system for gathering information about how programs operate andwhat they accomplish. Performance monitoring refers to the periodic analysis and use of the datacollected through performance measurement to track program implementation and execution, makingchanges as necessary based on subjective and objective assessments of the information. Performanceevaluation is a subset of performance monitoring that requires application of rigorous researchprotocols to make conclusions about program performance. A performance monitoring system is aset of procedures for integrating performance measurement and performance monitoring into aframework that supports public decision making. A performance monitoring system, including itsperformance measurement and performance monitoring components, is the focus of this guide.
Why Develop a Guide?
Multijurisdictional task forces exist throughout the United States. The National Institute of Justiceand the Bureau of Justice Assistance commissioned Abt Associates to develop a methodology forevaluating those task forces based on a demonstration evaluation performed across four states. Thegoal was to transfer that methodology both to state agencies that had oversight authority and to taskforce commanders who were interested in program evaluation. NIJ and BJA envisioned a workbookformat to facilitate the technology transfer.
After extensive investigation by Abt researchers, NIJ and BJA concluded that developing a workbookwas impractical. Not only were data insufficient to estimate what task forces accomplished, datawere inadequate to even tell what the task forces did as routine work. The problem was that state andfederal grants were awarded without even the rudiments of performance monitoring.1 The revised
1 The absence of a performance monitoring system is not inherent to the nature of multijurisdictional taskforce operations. Although High Intensity Drug Trafficking Area (HIDTA) programs tend to target higherlevel drug trafficking organization than do MJTFs, the HIDTA and MJTF programs have much in common.Yet the HIDTA has a fully functioning and improving performance management process. Seehttp://www.whitehousedrugpolicy.gov/hidta/perfinfo.html, downloaded on February 18, 2009.
This document is a research report submitted to the U.S. Department of Justice. This report has not been published by the Department. Opinions or points of view expressed are those of the author(s) and do not necessarily reflect the official position or policies of the U.S. Department of Justice.

Abt Associates Inc. Introduction 2
goal was to provide a template that BJA and state agencies might follow to develop performancemonitoring systems. This report provides that guide.A reader might infer that developing a data reporting tool for a monitoring system is a simple exercisethat requires a straightforward approach: Ask experts to determine what needs to be known and asktask force commanders to provide the data. Why is a guide necessary? Any researcher who has everdesigned a survey knows that this simple approach is a formula for disaster. Certainly experts whounderstand MJTFs should help frame survey questions, but this is hardly sufficient to develop aperformance monitoring system. First, questions need to be posed so that they quantify the salientaspects of program activities and outcomes. Second, the questions need to be posed so that they meanthe same thing to all respondents. Third, the questions must be answerable without undue effort byMJTF commanders or their designees. Finally, even the best experts are unlikely to know if themonitoring system works without preliminary and final testing. This guide explains the requisiteapproach using a step-by-step demonstration.
What Is This Guide?
This guide is designed to assist BJA, state administrative agencies (SAAs) and others in developing aperformance monitoring system. This guide provides:
a generic logic model that can be tailored for each state and MJTF to provide a structurefor understanding MJTF funding, activities, outputs, outcomes and impacts; and
a model data reporting template that forms the basis of the performance measurementcomponent; and
a model analysis plan that forms the basis of the performance monitoring component.
For Whom Is This Guide Intended?
The primary audiences for this guide are BJA and SAAs, although MJTF commanders and all otherswith an interest in how to measure how MJTF programs operate and perform may benefit from thisguide. Because SAAs are the organizations most likely to have the need, interest, and the resourcesto monitor or evaluate MJTFs, this guide is specifically designed to assist them in developingperformance monitoring systems. Most of the performance data must be gathered from individualMJTFs, so the guide is also designed to assist SAAs in developing systems that are user-friendly forMJTFs.
How Was This Guide Developed?
The template for a performance monitoring system presented in this guide was the result ofcollaboration between BJA, the National Institute of Justice, and Abt Associates Inc., with theassistance and advice of SAAs from Colorado, Georgia, Illinois, and Tennessee, and in consultationwith task force commanders. The objective of this project has been to produce a set of practical toolsto help SAAs, BJA, and MJTF commanders measure the implementation of MJTFs and to describeand monitor the work they do. To pursue this objective, the study team examined the range andquality of existing data regarding MJTFs by surveying 56 SAAs and 757 Byrne-supported MJTFs,
This document is a research report submitted to the U.S. Department of Justice. This report has not been published by the Department. Opinions or points of view expressed are those of the author(s) and do not necessarily reflect the official position or policies of the U.S. Department of Justice.

Abt Associates Inc. Introduction 3
conducting site visits to 18 MJTFs in six states, and gathering extensive retrospective data from fourstates.
Specifically, the study team examined the monitoring and reporting needs of BJA and the SAAs,compared them to the information that was currently available, and used the available data to assesstheir usefulness for performance measurement, monitoring and evaluation. As reported,investigations showed that existing data are inadequate for these purposes. Most MJTFs and SAAsreport only basic information, and examination found that data were often incomplete and/or thequality too poor to support effective program monitoring, comparisons among programs, or thetracking of changes over time.
Why Should Programs Be Monitored?
To Promote Accountability
There was a time when performance measurement, monitoring and evaluation of government-fundedlaw enforcement programs were the exception rather than the rule. However, in recent years federalaccountability initiatives and competition for funding has intensified, and the federal and stategovernments are demanding evidence that programs are implemented as intended and accomplishwhat they promise. Increasingly, agencies receiving federal funds are required to report how fundsare spent and the results of those expenditures. For example, the Government Performance andResults Act of 1993 (or GPRA) put the burden on programs to provide evidence of theirimplementation and effectiveness. This has been reinforced by the White House’s issuance of theProgram Assessment Rating Tool (PART) to rate all government agencies by examining theirindividual program initiatives.
Performance measurement is not simply a reporting burden. Performance measurement andmonitoring help SAAs assess the fit between the MJTFs’ designs and implementation, and theconsistency of implementation over time and across task forces with an eye to improvement. Aneffective monitoring system allows states to track and compare the operations and performance of:
Individual task forces.
Task forces of distinct types, such as
those focusing on specific drug types. those covering urban versus rural areas. those with a focus on street gangs versus higher-level, organized crime networks.
The entire set of MJTFs within a state over time.
Accountability in government is an unavoidable part of today’s world. Government agencies mustprovide evidence that public resources are being deployed as promised and produce benefitscommensurate with their costs. The structure provided by the performance monitoring systemexplicated in this guide will help to expand the capacity of BJA and states to account for (a) theresources deployed among MJTFs, (b) the activities those resources supported, and (c) whether those
This document is a research report submitted to the U.S. Department of Justice. This report has not been published by the Department. Opinions or points of view expressed are those of the author(s) and do not necessarily reflect the official position or policies of the U.S. Department of Justice.

Abt Associates Inc. Introduction 4
activities produced results. The performance monitoring system will also allow BJA to betterdemonstrate the overall value of the hundreds of MJTFs supported by Byrne/JAG funds.
To Support Decisions about MJTF Sustainment
With tight budgets and many competing demands for law enforcement resources, programs with hardevidence of effectiveness are more likely to be retained, while those without such evidence are morevulnerable to elimination. Performance measures can provide information attesting to theeffectiveness of MJTFs, thereby justifying public investments. Conversely, evidence maydemonstrate poor performance, which can guide decisions to modify under-performing MJTFs or toreplace them with something more promising.
To Inform Program Improvement
Feedback on program implementation and results can also be used to make adjustments that improvetask force performance. For example, several task forces could fail to show progress in convictionrates for task force cases, leaving the SAA and separate task force leadership teams to determine howto respond. Perhaps these relatively unsuccessful MJTFs fail to work as closely with prosecutor,while successful MJTFs engage prosecutors as soon as investigations open. Armed with thisinformation, SAAs may begin providing guidance to some of the state’s task force on effectivestrategies for early coordination with local and federal prosecutors.
Using Performance Measures To Monitor MJTFs
Performance measurement systems require that programs report periodically (usually quarterly orsemi-annually) in a standard format to continuously update program records. For example, the datareporting template provided in this guide asks SAAs to collect data on any training funded for MJTFinvestigators. Whenever MJTF staff receive training, the MJTF should update its internal records ofwho provided the training, the number of officers or other staff trained, how many hours of trainingeach received, any certification on training done, etc. If data input into a performance measurementsystem are routinely kept current, up-to-date information on training or any other measure of MJTFoperations are then readily available for periodic reports requested by program sponsors.
A wide range of questions can be addressed with the information provided by MJTF performancemonitoring systems. For example:
What are the MJTFs’ goals and objectives?
Are these goals and objectives consistent with the intentions of the agenciesproviding funding?
Are the stated goals and objectives up to date? Have they changed over time in response to new needs or concerns?
What are MJTFs doing (what activities are being performed)? For example,
Investigating. Training task force investigators. Public education and outreach.
This document is a research report submitted to the U.S. Department of Justice. This report has not been published by the Department. Opinions or points of view expressed are those of the author(s) and do not necessarily reflect the official position or policies of the U.S. Department of Justice.

Abt Associates Inc. Introduction 5
Holding regular meetings of MJTF personnel. Collaborating with law enforcement in other jurisdictions. Sharing intelligence. Seizing drugs and assets.
Are MJTF activities well-suited to achieving stated objectives?
What resources are being mobilized for MJTFs?
Are these resources adequate to support MJTF activities? What is the total annual cost of MJTFs?
Are MJTFs producing their intended results?
Have there been increases in drug seizures, arrests, etc.? What programs or activities worked particularly well? Do the benefits justify the costs?
This guide and the template provided in Appendix 2 offer a base upon which BJA and SAAs canmodel and build MJTFs performance monitoring systems. The development of these systems can bepursued in a three-step process. The following four chapters are each one step in developing andusing a performance monitoring system:
Chapter 1 discusses the first step when developing an ongoing performance monitoringsystem—deciding what should be measured.
The second step is to develop an ongoing system for defining measurements andcollecting data. This is the subject of Chapter 2.
As data accumulate, developing a performance monitoring system requires data analysis,and Chapter 3 turns to basic data analysis.
Some SAAs will seek to go beyond basic data analysis, and Chapter 4 provides someguidance for SAAs that are so inclined, though advanced data analysis may require theassistance of consultants trained in social science statistics.
This document is a research report submitted to the U.S. Department of Justice. This report has not been published by the Department. Opinions or points of view expressed are those of the author(s) and do not necessarily reflect the official position or policies of the U.S. Department of Justice.

Abt Associates Inc. Chapter 1: Performance Measurement: What to Measure 6
Chapter 1: Performance Measurement: What toMeasure
MJTF goals, structures, resources, and operations vary across states and within states. Nevertheless,diverse MJTFs will have similar long-term goals (reduce drug availability, reduce drug crime);structure (task force commanders, policy board); resources (grant funds, staffing, partnerships); andactivities (covert and overt activity, community prevention). Performance measurement shouldreflect these core elements, capturing unique task force components through supplementary datacollection efforts. This chapter describes a process for identifying these core elements, offering alogic model that BJA and SAAs can modify to accommodate special features of MJTFs within thestate.
Logic Models
Logic models are commonly used to link a program’s goals with its strategies and tactics. Logicmodels are effective tools for studying any type of program, but are particularly useful when trying tobreak down a program as complex as MJTFs.
All programs have goals and objectives. To pursue these goals, programs use resources that supportactivities intended to produce targeted results. Logic models show the logical links from programgoals, to resources, to activities, to outputs (the direct representation of activities), to programoutcomes (indication of the change that activities are seeking to accomplish), and finally to impacts(the indications that the program’s broader goals have been realized).
Graphically:
[1] goals [2] resources [3] activities [4] outputs [5] outcomes [6] impacts
Each component of the logic model is described in more detail below:
1. Goals
Goals reflect what the program is trying to accomplish. Every MJTF has goals. These mightbe stated broadly: Reduce the availability of illegal drugs. They may be more targeted:Reduce the availability of methamphetamine. Without identifying program goals, it is notpossible to determine whether the MJTF is structured to achieve those stated goals. Forexample, does it have the required resources to match the plans? Does it engage in otherrelated activities?
2. Resources/Inputs
Resources include all funding, space, equipment, personnel, in-kind contributions, etc. thatsupport program activities. For task forces this might include funding from federal and othersources; state and local partners; forfeiture proceeds; access to intelligence support systems;in-kind contribution of equipment and space; and task force and on-loan staff from partneragencies.
This document is a research report submitted to the U.S. Department of Justice. This report has not been published by the Department. Opinions or points of view expressed are those of the author(s) and do not necessarily reflect the official position or policies of the U.S. Department of Justice.

Abt Associates Inc. Chapter 1: Performance Measurement: What to Measure 7
3. Activities
This is what the program “does” on a regular basis, including all activity directed at meetingprogram objectives. For MJTFs, these activities may include launching investigations,training agents, conducting community prevention and public education programs, sharingintelligence, and coordinating investigations with prosecution.
4. Outputs
Outputs are the direct or immediate results of program activities, i.e. numbers of peopletrained, numbers of seizures made. The outputs are representations of activities, or measuresof the implementation of the program activity. The outputs of operational activities shouldlink directly to the specific activity and “make countable” what occurred. For example, if theactivity is drug eradication, outputs could be counts of marijuana plants or hectares destroyed,or drug labs eradicated. If the activity is undercover operations, outputs would include thenumber of active or new investigations.
5. Outcomes
The outcome of each activity is what is expected to happen when the activity has been fullyimplemented. Rather than simply a count of the number of officers trained, for example, theoutcome of the training would be an indication of increased skill level or knowledge gained.Similarly, an outcome of mobilizing new prosecutorial teams might logically result inincreased numbers of prosecutions of drug cases. Outcomes of operational activities reflectthe result of putting into place those activities.
6. Impact
The impacts mirror the goals. The impacts are what one would reasonably expect from thesuccessful execution of strategy and tactics. For MJTFs impacts may include reduced drugavailability, drug use, and drug-related crime. An impact is typically a distant result ofprogram activities, acting through a causal linkage: activities output outcomeimpact. Successful operation of a MJTF is only one of many factors that affect goalachievement. However, the presumption is that the MJTF can have some meaningful effecton local drugs markets (or whatever else it set as a goal), or else there would seem to be littlebasis for spending public funds on task force activities.2
To summarize, there should be a logical connection across each component of the logic model, andthe logic model should be a comprehensive statement of how and why an MJTF works.Understanding this logic is a prerequisite for developing a performance monitoring system, becausewhy would one want to monitor something that was unimportant to program performance, and how
2 Task force commanders and enforcement personnel in general avoid being held accountable for impactssuch as the prevalence of drug abuse. From a social science perspective, their argument is that so manydiverse factors affect drug abuse that it is difficult to distinguish the effect of task force activity from theeffect of those other factors. Social scientists think of this as the problem of distinguishing signal fromnoise. The point here is that impacts are part of the logic model even if statistical analysis can onlyimprecisely estimate the links across elements of that logic model.
This document is a research report submitted to the U.S. Department of Justice. This report has not been published by the Department. Opinions or points of view expressed are those of the author(s) and do not necessarily reflect the official position or policies of the U.S. Department of Justice.
Abt Associates Inc. Chapter 1: Performance Measurement: What to Measure 8
could one justify failing to monitor an essential component of the logical structure of an MJTFprogram? Of course, it may be impractical or impossible to quantify parts of the logic model, but thatis a problem discussed later in this guide.
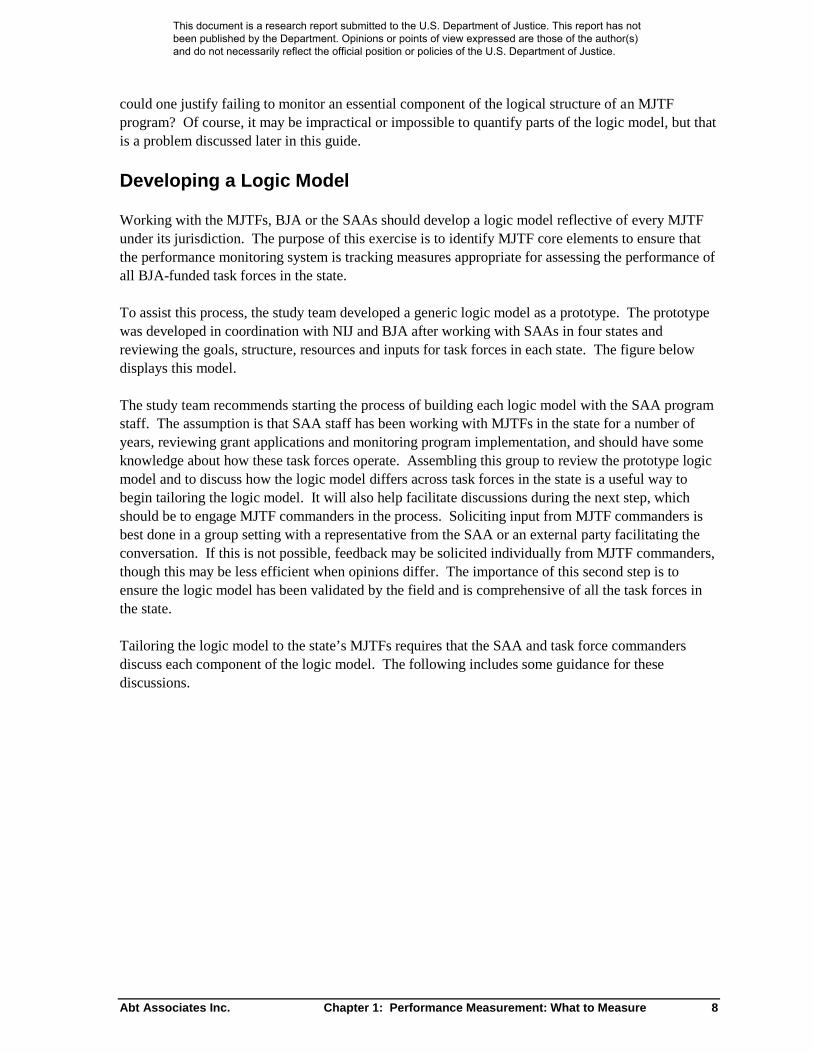
Developing a Logic Model
Working with the MJTFs, BJA or the SAAs should develop a logic model reflective of every MJTFunder its jurisdiction. The purpose of this exercise is to identify MJTF core elements to ensure thatthe performance monitoring system is tracking measures appropriate for assessing the performance ofall BJA-funded task forces in the state.
To assist this process, the study team developed a generic logic model as a prototype. The prototypewas developed in coordination with NIJ and BJA after working with SAAs in four states andreviewing the goals, structure, resources and inputs for task forces in each state. The figure belowdisplays this model.
The study team recommends starting the process of building each logic model with the SAA programstaff. The assumption is that SAA staff has been working with MJTFs in the state for a number ofyears, reviewing grant applications and monitoring program implementation, and should have someknowledge about how these task forces operate. Assembling this group to review the prototype logicmodel and to discuss how the logic model differs across task forces in the state is a useful way tobegin tailoring the logic model. It will also help facilitate discussions during the next step, whichshould be to engage MJTF commanders in the process. Soliciting input from MJTF commanders isbest done in a group setting with a representative from the SAA or an external party facilitating theconversation. If this is not possible, feedback may be solicited individually from MJTF commanders,though this may be less efficient when opinions differ. The importance of this second step is toensure the logic model has been validated by the field and is comprehensive of all the task forces inthe state.
Tailoring the logic model to the state’s MJTFs requires that the SAA and task force commandersdiscuss each component of the logic model. The following includes some guidance for thesediscussions.
This document is a research report submitted to the U.S. Department of Justice. This report has not been published by the Department. Opinions or points of view expressed are those of the author(s) and do not necessarily reflect the official position or policies of the U.S. Department of Justice.

Abt Associates Inc. Chapter 1: Performance Measurement: What to Measure 9
Figure 1.1
Logic Model Prototype for Multijurisdictional Drug Task ForcesMultijurisdictional Drug Task Forces
• Number of submissionsto intelligence database
• Number of referrals
• Number of hours oftraining
• Number of agentstrained
• Number of eradications
• Number ofinvestigations
• Number of casesprosecuted
• Number of communitytrainings conducted
• Number of citizenparticipants
Inputs/Resources Program Activities Outputs Outcomes Impacts
• Funding
• In-kind contributions
• Equipment /Space
• Staff
• Forfeiture proceeds
• Intelligence supportsystems
• State and localpartners
• Reduced drugavailability
• Reduced drug crime
• Reduced drug use
• Information andIntelligence Sharing
• Specialized training
• Training other lawenforcement officers
• Covert/overtinvestigations
• Drug eradication
• Coordination with theprosecution
• Community drugeducation andawareness
• Increased level of skill,professionalization of staff
• Increased drug arrests
• Increased search warrantsserved
• Increased number offederal prosecutions
• Increased assetseizures/forfeitures
• Increased drug/labseizures
• Increase conviction rates
• Increase sentence length
• Decrease in known drugtrafficking organizationsoperating in the area
• Increased communityawareness of drugproblem
Goals/
Organization
•Task Force Goals
•Organizational structure
•Command structure
Defining Goals
What is the mission? Answering this question should focus on identifying both the long- and short-term program goals. Note that outputs and outcomes are not goals, but rather, producing outputs andoutcomes are instrumental to achieving goals. Some questions that might help to identify goals are:
What are the task forces in the state trying to accomplish?
Reduce drug availability? Reduce drug use? Reduce drug related crime?
Are there other things the task forces in the state are trying to accomplish?
What goals are included in the task force mission statement? How do task forces in the state describe their purpose?
This document is a research report submitted to the U.S. Department of Justice. This report has not been published by the Department. Opinions or points of view expressed are those of the author(s) and do not necessarily reflect the official position or policies of the U.S. Department of Justice.

Abt Associates Inc. Chapter 1: Performance Measurement: What to Measure 10
Threat assessments are useful when setting goals. Given a threat assessment, the goals might includetargeting specific types of drugs, distribution networks, or drug-related crime. While there should bea consensus about goals for task force operations, every task force is likely to target a subset of thosegoals as consistent with its threat assessment. At the end of this process, there should be consensuson task force goals, even though the identified goals will likely differ across task forces.
For example, the Abt investigators found that in rural areas, MJTFs often become the principal lawenforcement agency for combating drug sales. In those settings, goals are likely oriented towardstreet sales and related behaviors. In urban areas, MJTFs are more likely to augment the resources oflocal enforcement agencies. In those settings, local police focus on street sales; the MJTF focus ondistribution networks. Goals would be set accordingly.
Identifying All Inputs/Resources
The logic model should reflect all resources directed at the drug problem by MJTFs. Therefore, itshould be inclusive of all resources, not just financial. Below are some questions that may help drivethis discussion.
What kinds of resources are listed in task force grant applications? For example,
Personnel Equipment Technology Office lease Travel Confidential funds Supplies
What other kinds of resources are used to support task force activities? For example,
In-kind contributions of personnel or equipment Forfeiture proceeds Task force revenue (e.g., proceeds from fines levied on seized drugs) Intelligence systems State and local partnerships
Consider each of the activities engaged in by task forces in the state and identify anyother resources used to engage in those activities.
After identifying what is believed to be a comprehensive list, it is helpful to revisit the list to confirmconsistency between task force activities (see the next subsection) and task force resources.
Obviously, when evaluating program operations, the operational cost is a fundamental to a benefit-cost calculation, and without at least a crude benefit-cost calculation, one cannot assess whether aprogram is worthwhile. Without knowing the inputs into a program, one cannot determine whataccounts for failure or success; one cannot make a reasoned determination about how to improveprogram operations.
This document is a research report submitted to the U.S. Department of Justice. This report has not been published by the Department. Opinions or points of view expressed are those of the author(s) and do not necessarily reflect the official position or policies of the U.S. Department of Justice.
Abt Associates Inc. Chapter 1: Performance Measurement: What to Measure 11
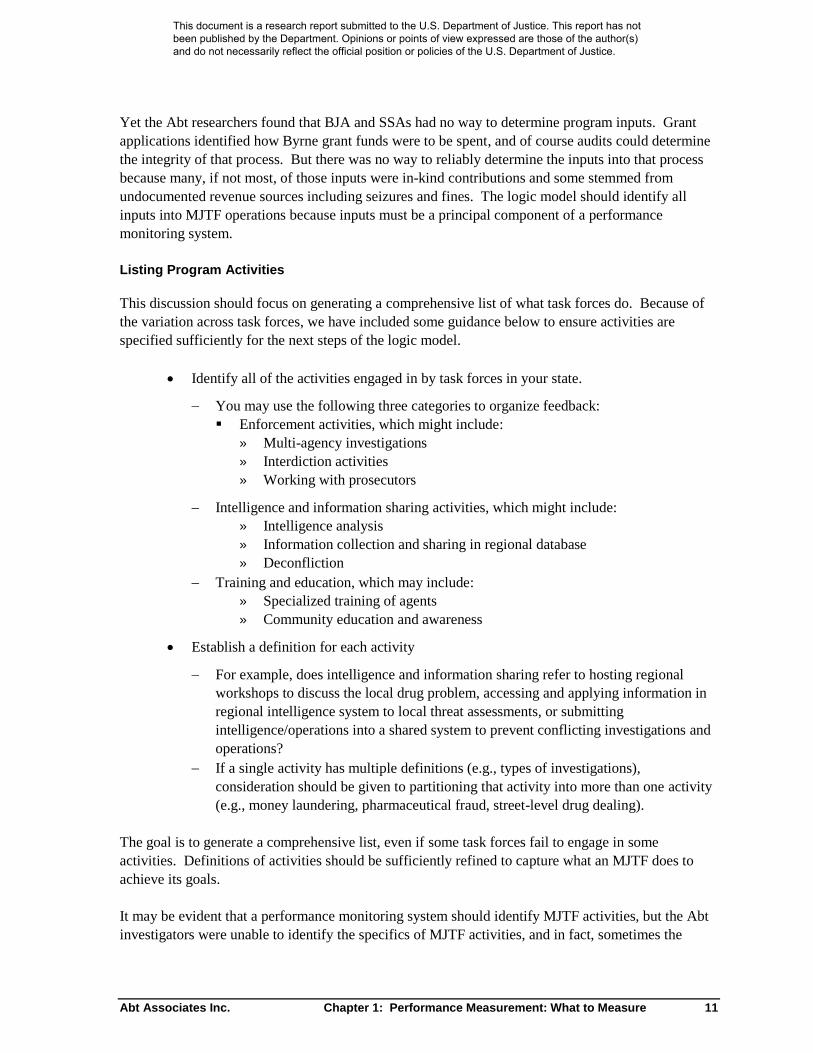
Yet the Abt researchers found that BJA and SSAs had no way to determine program inputs. Grantapplications identified how Byrne grant funds were to be spent, and of course audits could determinethe integrity of that process. But there was no way to reliably determine the inputs into that processbecause many, if not most, of those inputs were in-kind contributions and some stemmed fromundocumented revenue sources including seizures and fines. The logic model should identify allinputs into MJTF operations because inputs must be a principal component of a performancemonitoring system.
Listing Program Activities
This discussion should focus on generating a comprehensive list of what task forces do. Because ofthe variation across task forces, we have included some guidance below to ensure activities arespecified sufficiently for the next steps of the logic model.
Identify all of the activities engaged in by task forces in your state.
You may use the following three categories to organize feedback: Enforcement activities, which might include:
» Multi-agency investigations» Interdiction activities» Working with prosecutors
Intelligence and information sharing activities, which might include:» Intelligence analysis» Information collection and sharing in regional database» Deconfliction
Training and education, which may include:» Specialized training of agents» Community education and awareness
Establish a definition for each activity
For example, does intelligence and information sharing refer to hosting regionalworkshops to discuss the local drug problem, accessing and applying information inregional intelligence system to local threat assessments, or submittingintelligence/operations into a shared system to prevent conflicting investigations andoperations?
If a single activity has multiple definitions (e.g., types of investigations),consideration should be given to partitioning that activity into more than one activity(e.g., money laundering, pharmaceutical fraud, street-level drug dealing).
The goal is to generate a comprehensive list, even if some task forces fail to engage in someactivities. Definitions of activities should be sufficiently refined to capture what an MJTF does toachieve its goals.
It may be evident that a performance monitoring system should identify MJTF activities, but the Abtinvestigators were unable to identify the specifics of MJTF activities, and in fact, sometimes the
This document is a research report submitted to the U.S. Department of Justice. This report has not been published by the Department. Opinions or points of view expressed are those of the author(s) and do not necessarily reflect the official position or policies of the U.S. Department of Justice.

Abt Associates Inc. Chapter 1: Performance Measurement: What to Measure 12
investigators could not determine if an individual MJTF did anything. This is not a criticism ofMJTFs. It is a simple assertion that neither BJA nor SAAs can readily determine how Byrne grantfunds affect law enforcement operations with sufficient detail to determine if the expenditure ofpublic funds is appropriately targeted.
Identifying and Developing Output Measures
The discussion should address how activities can be quantified. Below are some questions tofacilitate the discussion.
How can each activity be measured?
What would indicate whether or not an activity is occurring? For example, how can one measure information sharing? Through the number of
times a database is accessed or the number of multi-agency meetings? How“information sharing” was defined in the earlier exercise will help make thisdistinction.
What does that measure reflect? For example, enforcement activities. Should the measure reflect the quantity
through a measure of the number of active investigations or the scope through ameasure of the type of organization targeted?
At the end of the discussion, a final check should be made to ensure every activity has at least oneoutput measure.
Working with task forces, the Abt researchers understand the difficulty of quantification. Forexample, intelligence centers engage in a variety of activities. At one extreme, they performcomparatively simple functions: They track individuals and groups who are under investigation,thereby informing two or more agents that they are unwittingly working on the same case, and theymay track operations, informing agents when two operations may conflict and endanger participatingagents. At another extreme, they may perform wire taps, an extremely time intensive operation. Asimple count will not work to untangle these diverse tasks and to quantify operations. Perhaps moreuseful would be a count of the number of wiretap operations, a count of the number of case filepreparations (organizational charts and time lines), and a count of the number of trap and tracedevices and pen registers.
Identifying and Developing Outcome Measures
This discussion should focus on what success looks like, which may mean different things to differenttask forces. Below are some questions to help guide this potentially difficult discussion.
What is success for each activity?
For example, increased number of arrests may be considered success by some MJTFcommanders who focus on lower level drug distribution, but not by task forcesfocusing on higher level drug trafficking organizations where cases take longer tobuild and fewer people are arrested.
This document is a research report submitted to the U.S. Department of Justice. This report has not been published by the Department. Opinions or points of view expressed are those of the author(s) and do not necessarily reflect the official position or policies of the U.S. Department of Justice.
Abt Associates Inc. Chapter 1: Performance Measurement: What to Measure 13
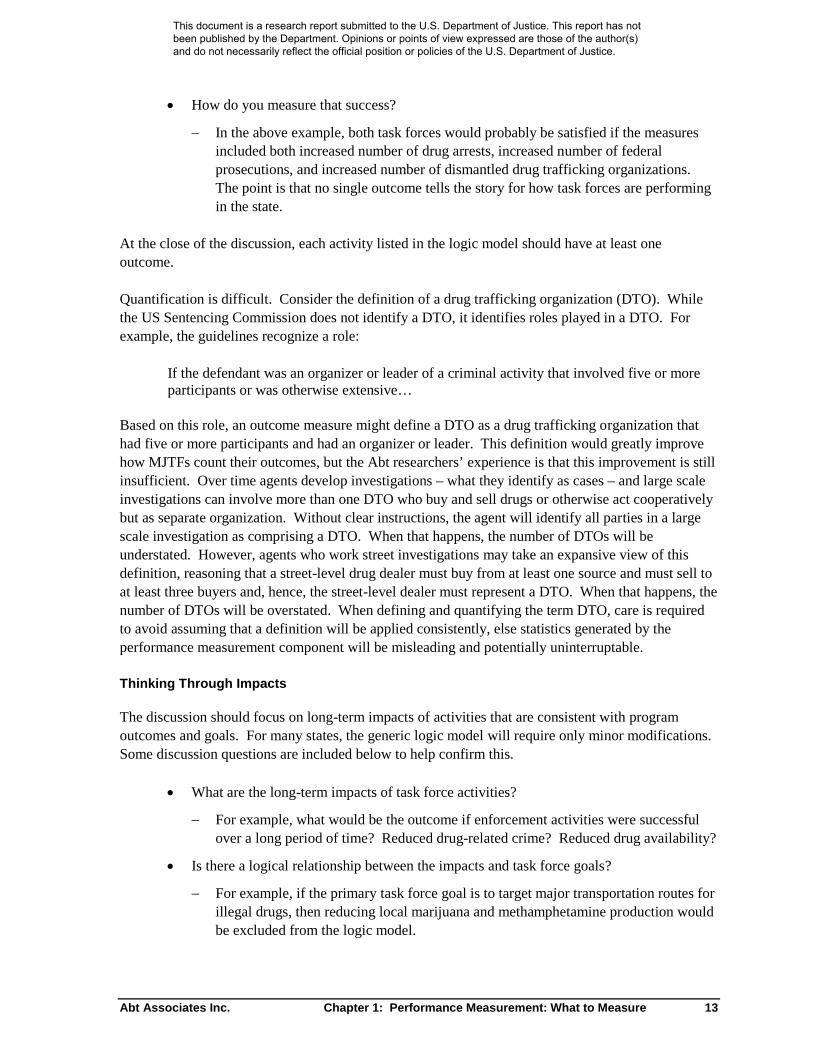
How do you measure that success?
In the above example, both task forces would probably be satisfied if the measuresincluded both increased number of drug arrests, increased number of federalprosecutions, and increased number of dismantled drug trafficking organizations.The point is that no single outcome tells the story for how task forces are performingin the state.
At the close of the discussion, each activity listed in the logic model should have at least oneoutcome.
Quantification is difficult. Consider the definition of a drug trafficking organization (DTO). Whilethe US Sentencing Commission does not identify a DTO, it identifies roles played in a DTO. Forexample, the guidelines recognize a role:
If the defendant was an organizer or leader of a criminal activity that involved five or moreparticipants or was otherwise extensive…
Based on this role, an outcome measure might define a DTO as a drug trafficking organization thathad five or more participants and had an organizer or leader. This definition would greatly improvehow MJTFs count their outcomes, but the Abt researchers’ experience is that this improvement is stillinsufficient. Over time agents develop investigations – what they identify as cases – and large scaleinvestigations can involve more than one DTO who buy and sell drugs or otherwise act cooperativelybut as separate organization. Without clear instructions, the agent will identify all parties in a largescale investigation as comprising a DTO. When that happens, the number of DTOs will beunderstated. However, agents who work street investigations may take an expansive view of thisdefinition, reasoning that a street-level drug dealer must buy from at least one source and must sell toat least three buyers and, hence, the street-level dealer must represent a DTO. When that happens, thenumber of DTOs will be overstated. When defining and quantifying the term DTO, care is requiredto avoid assuming that a definition will be applied consistently, else statistics generated by theperformance measurement component will be misleading and potentially uninterruptable.
Thinking Through Impacts
The discussion should focus on long-term impacts of activities that are consistent with programoutcomes and goals. For many states, the generic logic model will require only minor modifications.Some discussion questions are included below to help confirm this.
What are the long-term impacts of task force activities?
For example, what would be the outcome if enforcement activities were successfulover a long period of time? Reduced drug-related crime? Reduced drug availability?
Is there a logical relationship between the impacts and task force goals?
For example, if the primary task force goal is to target major transportation routes forillegal drugs, then reducing local marijuana and methamphetamine production wouldbe excluded from the logic model.
This document is a research report submitted to the U.S. Department of Justice. This report has not been published by the Department. Opinions or points of view expressed are those of the author(s) and do not necessarily reflect the official position or policies of the U.S. Department of Justice.

Abt Associates Inc. Chapter 1: Performance Measurement: What to Measure 14
Is there a logical relationship between impacts and outcomes?
For example, if all activities are focused on enforcement and outcomes are focusedon the prosecution of street-level drug trafficking organizations, then one mightexpect to have a significant impact on drug availability in a region, but notnecessarily money laundering.
During this discussion, the SAA should be mindful that MJTF commanders will have the mostconcern with the measurement of impacts, principally because MJTF activity is only one of manycauses of drug availability and drug use. No one likes to be held accountable for what they cannotcontrol, and during the study team’s investigations, it was clear that MJTF commanders objected tobeing held accountable for impacts. To address this concern, remind MJTF commanders that it maybe impractical to measure all the linkages in the logic model, but measurement issues should bedistinguished from the logic of task force objectives, strategy and tactics.
Moreover, the problem of estimating the linkage between impacts and earlier components of the logicmodel is common in social science enquiry and surely not unique to monitoring and evaluating taskforces. For example, early childhood interventions are often done to ultimately improve the outcomesfrom secondary education and to improve earning prospects. Few social science studies wouldactually track program participants through the decades required to quantify the relationship betweenearly interventions and long-term impacts. Instead, one relies on a logic model: early interventionslead to higher grade school performance; improved grade school performance leads to improved highschool performance; better high school performance leads to higher earning prospects. If the logicmodel is compelling, then demonstrating that the early intervention improves grade schoolperformance argues for the utility of early interventions. The logic model must be compelling,however, a point that emphasizes the importance of spending time developing the logic model even ifsome of its linkages cannot be estimated with precision.
Summary: Developing Logic Models
After this process is complete, the resulting logic model should reflect a shared understanding of thecore elements for logic models operating in the state. As mentioned previously, task forces differfrom each other and a useful logic model must reflect that diversity. For example, rural and urbanjurisdictions operate differently and, therefore, may have quite different outcomes. Consequently, itis unlikely that a single logic model will fit both, but the generic model can be tailored to representeach.
This two-step process of engaging SAA program staff and then MJTF commanders in a review of alogic model should only be required initially. After that, SAAs can ensure the logic model(s) remaincurrent in a number of ways. For example, grant applications may be organized around the logicmodel so the SAA can easily crosswalk the information in the applications to the current logic model.States with annual meetings of MJTFs might also include a review of the logic model on its meetingagenda.
This document is a research report submitted to the U.S. Department of Justice. This report has not been published by the Department. Opinions or points of view expressed are those of the author(s) and do not necessarily reflect the official position or policies of the U.S. Department of Justice.

Abt Associates Inc. Chapter 1: Performance Measurement: What to Measure 15
Using the Logic Model to Move to a Performance MonitoringSystem
A logic model provides the framework for ensuring that the monitoring system accounts for how atask force carries out its work. Ideally, the system should capture this information from multiplesources, e.g., task forces, SAAs, other state agencies. The best source is the one that can provide theinformation most efficiently.
A performance monitoring system should be both reasonable and not overly burdensome. It shouldmeasure information generated by or otherwise accessible to task forces. In other words, ifinformation can be obtained from other reliable sources (e.g., state comptroller) it places unnecessaryburden on the task forces to also track that information. Collection of these data should be a stateresponsibility. This will be clear for data that are already being collected at the state or local level,but less obvious for information not previously collected, which may require adding to extant datacollection efforts or generating new data collection efforts.
The next chapter reviews a data collection template that has been created based on the prototype logicmodel. This tool will facilitate the process of transitioning from logic models to performancemonitoring systems.
This document is a research report submitted to the U.S. Department of Justice. This report has not been published by the Department. Opinions or points of view expressed are those of the author(s) and do not necessarily reflect the official position or policies of the U.S. Department of Justice.

Abt Associates Inc. Chapter 2: Performance Measurement: Collecting Data 16
Chapter 2: Performance Measurement: CollectingData
As discussed in the previous chapter, the logic model identifies what should be measured to reflectMJTF performance:
Goals Inputs/resources Program activities Outputs Outcomes Impacts
Often these data elements are either unavailable in existing sources such as program documentationor are measured inconsistently so they are not useful for explaining program operations andaccomplishments. This chapter describes a template for collecting measurement data. While thistemplate should provide a good starting point for most states, it may need modifications toaccommodate special features of MJTFs within the state, as well as adjustments to address issues ofspecial policy relevant to individual states. This chapter walks readers through the process ofreviewing and tailoring the template.
The process remains valuable even in states with existing performance measurement systems. Inthese cases, existing measures can be included in the process of reviewing and tailoring the templateto ensure everything that should be measured is being measured. In other words, should anyshortcomings exist between the existing system and what needs to be measured, the template canprovide measures that will improve the quality of existing systems.
Building from the logic model presented in the previous chapter, the study team worked with BJAand NIJ to develop a prospective, generic data collection form, a field-tested template for gatheringdata about performance monitoring. The template is prospective in the sense that it is intended forfuture use to measure MJTF operations. Consistent with the discussion in the previous chapter, thetool is generic in the sense that a SAA may modify the prototypical logic model and thosemodifications will lead to changes in the generic data collection template. We present the entiretemplate in Appendix 2, and will discuss each item separately in this chapter.
To develop the data collection template, the study team began with the prototype logic modelpresented in Chapter 2. Recall that the logic model anticipated data from two sources: MJTFs andother sources accessible by the SAA. Using the prototypical logic model as a guide, the study teamdrafted a tool to collect core data from MJTFs. The template was refined through a focus group withtask forces in one state and a field test with task forces in four other states. Those MJTFs providedfeedback that allowed the study team to clarify questions that were ambiguous and to eliminatequestions that participating MJTFs could not readily answer. In other words, the tool has beenvalidated by the field, which is worth remembering when tailoring the tool to fit local needs.
This document is a research report submitted to the U.S. Department of Justice. This report has not been published by the Department. Opinions or points of view expressed are those of the author(s) and do not necessarily reflect the official position or policies of the U.S. Department of Justice.

Abt Associates Inc. Chapter 2: Performance Measurement: Collecting Data 17
When tailoring or otherwise fielding the BJA template, the SAA should consult with MJTFcommanders. The SAA and MJTF commanders should review the data collection template and adjustit as necessary to deal with departures from the prototypical logic model(s) developed for task forcesin the state. Below are some suggestions for how to start discussions within the state regarding howto collect performance data from the MJTFs:
How will the items in this data collection template supplement or replace items in anexisting performance monitoring systems?
How will the information be collected? For example, through an on-line system or willtask forces submit periodic reports?
How will the information be maintained? For example, will data be entered into adatabase after it is submitted to the SAA?
How often will this information be collected?
How will the information be used?
The next step is to review each section of the data collection template, crosswalking its data elementsback to the logic model. Below are some suggested questions to address during the review:
Is this information relevant for the state’s unique logic model?
Is the question clear?
Is the information available from another source? If not, what is the burden associatedwith collecting this information?
Is other information needed to monitor MJTF performance?
Should an additional subset of questions be added for certain MJTFs?
The result should be a new or revised data collection template. Revisions should not be done in theabstract by experts who decide that some parts of the template merit change, because such a simplerevision process risks producing a meaningless template. Structured focus groups are useful forjudging that the instrument provides sufficient definitions that every task force commander or his orher delegate will interpret questions consistently and will be able to provide valid and reliableanswers. This is difficult to judge in the abstract. Furthermore, focus groups can provide insight, butthere is no substitute for field testing. There is a science to instrumentation, and bypassing thatscience by taking shortcuts can lead to worthless measures and a dysfunctional performancemonitoring system.
To assist in this exercise, the rest of the chapter will review each section of the data collectiontemplate, demonstrating how a user might tailor each section to match the state’s generic logic model.
This document is a research report submitted to the U.S. Department of Justice. This report has not been published by the Department. Opinions or points of view expressed are those of the author(s) and do not necessarily reflect the official position or policies of the U.S. Department of Justice.

Abt Associates Inc. Chapter 2: Performance Measurement: Collecting Data 18
A Template for a Multijurisdictional Task Force PerformanceMeasurement System
This template has two parts. Part I, comprises sections A, B, and C and covers the first twocomponents of the logic model—goals/ organization and inputs/resources. The information in thissection tends to be static, requiring periodic updates by MJTFs, as necessary. Part II comprisessections D and E and covers outputs and outcomes.3 These sections cover information that isdynamic and should, therefore be collected on a regular basis (e.g., quarterly, semi-annually).
As each section is reviewed below, the discussion defines terms and provides guidance about howBJA and SAAs might tailor the tool. Tips on how MJTFs should respond to specific items are alsoprovided.
Definitions
The first page of the template provides definitions. Read these definitions before reviewing the tool,as they will clarify questions that otherwise may be ambiguous. Note and correct any inconsistencieswith local definitions, for example, definitions of what constitutes a gang or drug traffickingorganizations, and revise as necessary, and always document changes. While working through therest of the template, refer to these definitions, modifying them as necessary.
Definitions may also be added for existing or new items in the data collection tool. As necessary,provide additional definitions to increase the clarity of the tool and to ensure consistent datacollection across task forces. Keep definitions consistent over time, because a consistentlymaintained time-series will increase the value of these data for a performance monitoring system.
Part I
Before reviewing the first three sections of the template, users should review the elements included inthe following two components of the state’s logic model: Organization/Mission andInputs/Resources.
Section A: Task Force CharacteristicsThis section gathers information on basic characteristics of each task force. Those characteristics areprimarily, but not entirely, administrative:
task force name; jurisdiction; formal partners; staffing; and task force objectives.
3 Impacts were not covered in the template, as this is not information that would be generated or provided bya task force
This document is a research report submitted to the U.S. Department of Justice. This report has not been published by the Department. Opinions or points of view expressed are those of the author(s) and do not necessarily reflect the official position or policies of the U.S. Department of Justice.

Abt Associates Inc. Chapter 2: Performance Measurement: Collecting Data 19
The reporting cycle is also noted, suggesting that this information be reported initially and updated asneeded, but at a minimum annually.
A user might deem some of this information as unnecessary, given existing record keeping systems atthe state level, or a user might decide to add a request for information on, for example, informalpartners (those who aren’t included in the MOU) or the geographic size of the task force jurisdiction.
Field testing of the data collection template suggests being specific about objectives (short-termgoals). Although it may seem unnecessary, given that most BJA-supported MJTFs share the broadgoal of reducing drug availability and drug-related crime, modifications should capture changes inspecific task force objectives (such as focusing on investigating trafficking or manufacturing one drugtype versus another), as these are likely to vary across MJTFs and over time as circumstances changein a given jurisdiction. Current information on more specific objectives is also critical to anyexamination of changes in task force performance over time, as outputs and outcomes should reflectthese shifts in priorities. Therefore, review stated objectives for accuracy in terms of whether they arecomprehensive of the objectives of task forces in the state, as stated in the tailored logic model.
Section B: Task Force Annual BudgetThis section requests information on the task force’s annual budget. It includes a breakdown ofpersonnel and non-personnel costs by federal funds; state, local, and/or tribal funds; and task forcerevenue. It also requests information on in-kind contributions.
This section is designed to capture estimates of task force budgets for the upcoming fiscal year.Although one would anticipate accurate reports of federal, state, local, and/or tribal funds, estimatingrevenue might be difficult for some task forces. The assumption is that the task forces responding tothis request are sufficiently established that they can anticipate what might be expected from othersources (e.g., forfeiture proceeds, contributions from other agencies). Of course, this assumption maybe false for some states.
A user might consider an alternate approach, for example, collecting budget and revenue informationseparately or modifying the request to reflect annual expenditures. When talking to focus groupparticipants, the study team determined that while budget information would be easier for task forcesto provide, expenditures are a more accurate reflection of actual resources invested. Deciding whichto collect should be based on where information resides, whether it be at the state, task force, oragency level, as this impacts the burden associated with collection. Decisions on which to collectshould reflect the reporting cycle, since budget information is better collected at the beginning of thefiscal year and expenditures at the end of the fiscal year.
This section also requests information on in-kind contributions by category. Depending on the extentto which task forces in each state rely on in-kind contributions, users might consider supplementingthe question by asking for specification on what is being received, particularly with respect topersonnel contributions. Users might also consider assisting task forces with estimating the value ofthese contributions (use of a cruiser on weekends, assignment of an officer part-time to the taskforce). Recording non-cash contributions are an important part of understanding the full set ofresources at a task force disposal, both in light of fluctuations in activity over time and whencomparing outputs across task forces.
This document is a research report submitted to the U.S. Department of Justice. This report has not been published by the Department. Opinions or points of view expressed are those of the author(s) and do not necessarily reflect the official position or policies of the U.S. Department of Justice.

Abt Associates Inc. Chapter 2: Performance Measurement: Collecting Data 20
Section C: Task Force Structure and OperationsThis section collects information on a number of elements of a task force’s structure and operations.The items include:
MOU or Interagency Agreements Policy Boards Written protocols, policies, procedures Training resources Physical space Collaboration with prosecutors Access to intelligence support systems (state-level, regional, national) Use of threat assessments to set priorities Deconfliction of events
Some users may view one or more of these items as irrelevant for task force operations in their statesand more detailed than dictated by the logic model. However, most of these items are elements BJAconsiders important to successful task forces, and BJA intends to target technical assistance to taskforces weak in any of these areas. Therefore, we recommend that users retain the above items (unlessinapplicable to all task forces in your state), and we encourage reviewing and supplementing thesection with additional items that users deem appropriate.
Part II
Before reviewing the next two sections of the template, users should note the elements listed undertask force Activities, Outputs and Outcomes in the state’s logic model.
Section D: Task Force ActivitiesThis section is focused on capturing the output from the following task force activities:
Information and intelligence sharing; Education and awareness; Investigation activity; Drug seizures; Firearm seizures; and Property seizures and forfeitures.
Outputs are measures that count the activities of the task force, such as the number of submissions toan intelligence database, number of agents trained, and number of new investigations opened.
After reviewing its logic model, an SAA may identify additional activities that require measurement,or the SSA may disagree on how an activity is quantified, requiring some modifications. Forexample, an SAA might feel that the number of queries to an intelligence database is a betterindicator of use than is the number of submissions.
This document is a research report submitted to the U.S. Department of Justice. This report has not been published by the Department. Opinions or points of view expressed are those of the author(s) and do not necessarily reflect the official position or policies of the U.S. Department of Justice.

Abt Associates Inc. Chapter 2: Performance Measurement: Collecting Data 21
This section also includes information on seizures and forfeitures. Review this section. For example,it may not make sense to collect information on the number of hazardous sites cleaned if anotheragency in the state is responsible for hazardous waste cleanup and cleanup is, therefore, not anactivity occupying task forces in that state.
Ensuring that this section accurately reflects activities performed by task forces in the state, asdepicted in the logic model, is probably one of the most important steps in developing theperformance monitoring system. It might also be controversial, as MJTF commanders may disagreeon how to quantify activities or they may have concerns that data may be misconstrued. MJTFcommanders may also disagree on relevance because task forces engage in different activities.Again, the information collected should be comprehensive of all task forces, even if that means sometask forces will report “not applicable” for some items. Similarly, the information collected should beas detailed as possible, within reason. In other words, avoid collapsing information into broadcategories in an effort to reduce burden. For example, tracking arrest data by severity of charges andcharge type might seem burdensome, but detail will be useful in the future and the information can becollapsed later to simplify reporting. The key is to be thoughtful now because it will be difficult tocollect information retrospectively.
Information should be reported periodically (e.g., monthly, quarterly, annually). The decision on howfrequently this information will be collected will depend on how much the relative value of frequentreporting offsets the burden placed on the task force for collecting and reporting the information.
Section E: Task Force OutcomesThis section collects information on the outcomes or results of MJTF activities. Information onwhether individuals arrested by task forces are prosecuted, convicted, and sentenced is the focus ofthe data collected in this section. This information is an important indicator of the quality of the casesgenerated by the task force and the level of cooperation with prosecution.
However, as field testing confirmed, there are some difficulties in tracking this information. The firstdifficulty is tagging cases as task forces cases as they move though the criminal justice system. If thisis not already being done, some tagging mechanism would need to be established before collectingthis information. The second difficulty is the time it takes for a case to move through the criminaljustice system and what happens to the case during that time. Task forces often lose track of a caseonce it is accepted for prosecution, because prosecutors combine and break-up cases that may go totrial or be pled. Therefore, the case the task force built may look very different a year or two later.
For these reasons, consider the best source for this information. If you decide to obtain theinformation from the District Attorneys or through court records, then time must be invested indetermining how task forces’ cases will be identified and tracked. You must also decide how often tocollect this information. The suggestion is that the information in this section be reportedperiodically. If official sources are used, a longer reporting period (e.g., annually) may be desirableto increase the likelihood that a case has progressed through multiple points in the criminal justicesystem during the same reporting cycle.
If the task forces can provide some or all of the information, then you should provide specificinstructions for reporting cases as they move through the criminal justice system (for example, report
This document is a research report submitted to the U.S. Department of Justice. This report has not been published by the Department. Opinions or points of view expressed are those of the author(s) and do not necessarily reflect the official position or policies of the U.S. Department of Justice.

Abt Associates Inc. Chapter 2: Performance Measurement: Collecting Data 22
on the number of convictions that took place during the reporting period, regardless of the number ofcases accepted for prosecution during that same reporting period). Consider the burden of thisdecision if the task forces were not already collecting this information; avoid undue burden toencourage compliance.
Making decisions on how to collect and track information will be difficult. However, without thisinformation, it would be impractical to measure task force outcomes and, therefore, assess task forceperformance over time.
After each section has been reviewed, making revisions and additions as needed, users should go backand review the tailored logic model, the definitions page, as well as the overall burden of the datacollection on local task forces and whether the burden associated with collecting performance datahas been minimized without compromising the purpose of the performance monitoring system. Someof this will depend on the existing performance monitoring system and how making theseimprovements will change that system. For example, task forces in a state that had an on-lineperformance monitoring system that included most of the measures in their final data collection toolwill unlikely feel an increased burden with the addition of a few items. However, a state where taskforces are unused to submitting anything beyond a quarterly or annual report on task force outputsmay experience resistance from task forces. This is another reason for engaging MJTF commandersearly in the development process.
The next two chapters will demonstrate how performance data can be used to monitor task forceperformance.
This document is a research report submitted to the U.S. Department of Justice. This report has not been published by the Department. Opinions or points of view expressed are those of the author(s) and do not necessarily reflect the official position or policies of the U.S. Department of Justice.

Abt Associates Inc. Chapter 3: Performance Monitoring: Analyzing MJTF Performance 23
Chapter 3: Performance Monitoring: AnalyzingMJTF Performance
This chapter discusses how to use data gathered by a performance measurement system to answerquestions about the operations and effectiveness of MJTF programs:
What are the specific goals and objectives of MJTFs?
What resources are being mobilized to pursue these objectives?
What activities are engaged in by task force personnel?
Are the program’s resources and activities combining to produce the intended results?
Providing answers to these questions requires understanding the elements of MJTF programs,collecting data about program operations, and analyzing those data to draw inferences about programoperations and achievements. Chapter 1 introduced a generic logic model and Chapter 2 introduced atemplate for collecting program data consistent with that logic model.
This chapter explores how to use the state’s logic model and accumulated data to monitor MJTFprogram performance. The discussion is framed around the logic model presented earlier anddescribes how it can guide performance monitoring, illustrating the linkages between program goals,resources, activities, and outcomes, using hypothetical examples to illustrate key points.
Using MJTF Logic Models to Guide Assessments of Performance
A well conceived and executed performance measurement system provides evidence of connectionsbetween a program’s goals, the resources that are mobilized and the activities supported by thoseresources, and the results of those activities. The job of those who monitor programs is to use thesedata to quantify or at least describe the connections between the model’s components. Recall theearlier discussion: At present, one cannot identify task force resource; nor can one tell what a taskforce does as its routine activities. Even a rudimentary quantification would advance anunderstanding of MJTFs.
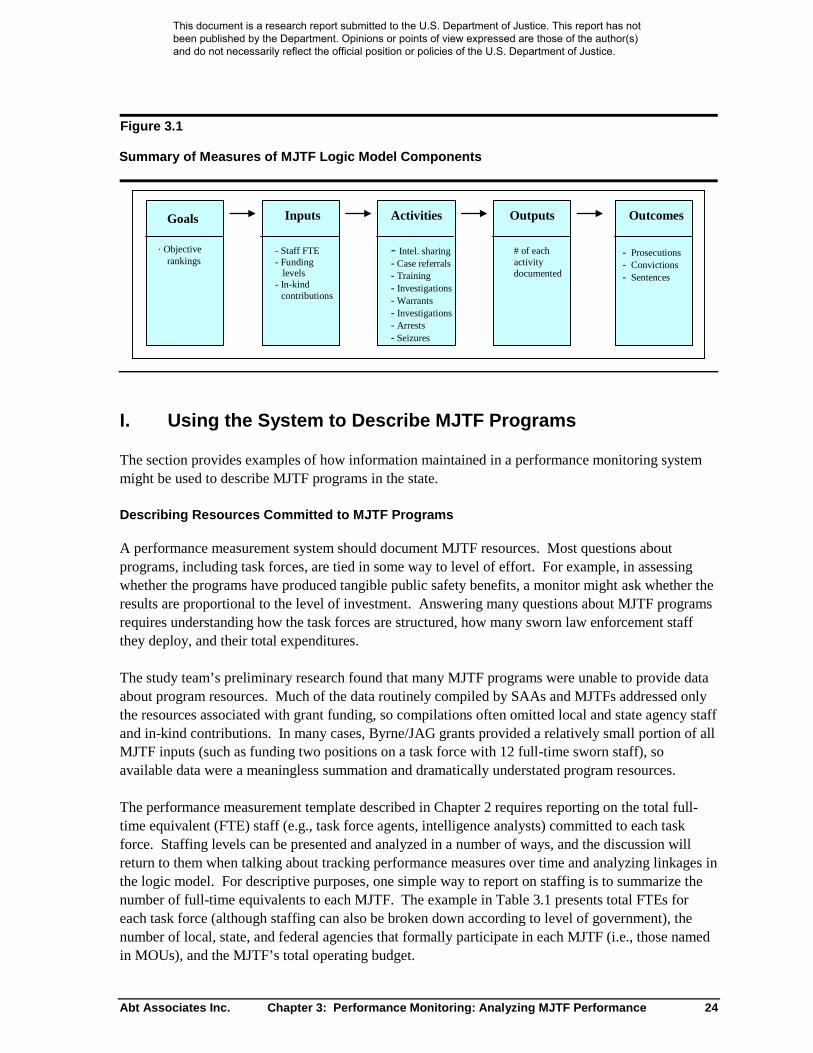
The template has identified a number of performance measures for each component of generic MJTFlogic models. Figure 3.1 summarizes some measures that are associated with each logic modelcomponent and the linkages between them.
A performance monitoring system should describe MJTF goals, inputs, activities, and outputs usingsimple tabulations, descriptive statistics, and graphics. What follows is a discussion and illustrationof some basic methods for compiling and presenting task force performance data. Subsequentsections of this chapter discuss tracking measures over time and examining the relationships betweenthem to make inferences about linkages in MJTF logic models.
This document is a research report submitted to the U.S. Department of Justice. This report has not been published by the Department. Opinions or points of view expressed are those of the author(s) and do not necessarily reflect the official position or policies of the U.S. Department of Justice.
Abt Associates Inc. Chapter 3: Performance Monitoring: Analyzing MJTF Performance 24
Figure 3.1
Summary of Measures of MJTF Logic Model Components
Goals
- Objectiverankings
Inputs
- Staff FTE- Funding
levels- In-kind
contributions
Activities
- Intel. sharing- Case referrals- Training- Investigations- Warrants- Investigations- Arrests- Seizures
Outputs
# of eachactivitydocumented
Outcomes
- Prosecutions- Convictions- Sentences
I. Using the System to Describe MJTF Programs
The section provides examples of how information maintained in a performance monitoring systemmight be used to describe MJTF programs in the state.
Describing Resources Committed to MJTF Programs
A performance measurement system should document MJTF resources. Most questions aboutprograms, including task forces, are tied in some way to level of effort. For example, in assessingwhether the programs have produced tangible public safety benefits, a monitor might ask whether theresults are proportional to the level of investment. Answering many questions about MJTF programsrequires understanding how the task forces are structured, how many sworn law enforcement staffthey deploy, and their total expenditures.
The study team’s preliminary research found that many MJTF programs were unable to provide dataabout program resources. Much of the data routinely compiled by SAAs and MJTFs addressed onlythe resources associated with grant funding, so compilations often omitted local and state agency staffand in-kind contributions. In many cases, Byrne/JAG grants provided a relatively small portion of allMJTF inputs (such as funding two positions on a task force with 12 full-time sworn staff), soavailable data were a meaningless summation and dramatically understated program resources.
The performance measurement template described in Chapter 2 requires reporting on the total full-time equivalent (FTE) staff (e.g., task force agents, intelligence analysts) committed to each taskforce. Staffing levels can be presented and analyzed in a number of ways, and the discussion willreturn to them when talking about tracking performance measures over time and analyzing linkages inthe logic model. For descriptive purposes, one simple way to report on staffing is to summarize thenumber of full-time equivalents to each MJTF. The example in Table 3.1 presents total FTEs foreach task force (although staffing can also be broken down according to level of government), thenumber of local, state, and federal agencies that formally participate in each MJTF (i.e., those namedin MOUs), and the MJTF’s total operating budget.
This document is a research report submitted to the U.S. Department of Justice. This report has not been published by the Department. Opinions or points of view expressed are those of the author(s) and do not necessarily reflect the official position or policies of the U.S. Department of Justice.
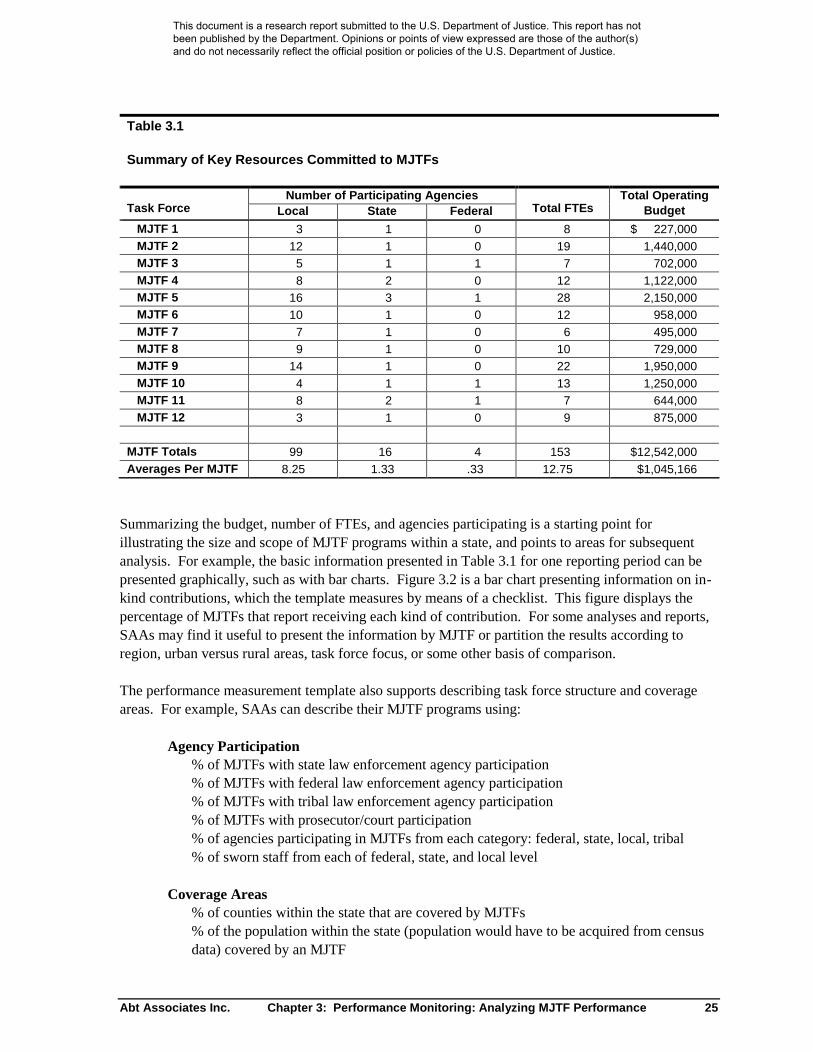
Abt Associates Inc. Chapter 3: Performance Monitoring: Analyzing MJTF Performance 25
Table 3.1
Summary of Key Resources Committed to MJTFs
Number of Participating AgenciesTask Force Local State Federal Total FTEs
Total OperatingBudget
MJTF 1 3 1 0 8 $ 227,000MJTF 2 12 1 0 19 1,440,000MJTF 3 5 1 1 7 702,000MJTF 4 8 2 0 12 1,122,000MJTF 5 16 3 1 28 2,150,000MJTF 6 10 1 0 12 958,000MJTF 7 7 1 0 6 495,000MJTF 8 9 1 0 10 729,000MJTF 9 14 1 0 22 1,950,000MJTF 10 4 1 1 13 1,250,000MJTF 11 8 2 1 7 644,000MJTF 12 3 1 0 9 875,000
MJTF Totals 99 16 4 153 $12,542,000Averages Per MJTF 8.25 1.33 .33 12.75 $1,045,166
Summarizing the budget, number of FTEs, and agencies participating is a starting point forillustrating the size and scope of MJTF programs within a state, and points to areas for subsequentanalysis. For example, the basic information presented in Table 3.1 for one reporting period can bepresented graphically, such as with bar charts. Figure 3.2 is a bar chart presenting information on in-kind contributions, which the template measures by means of a checklist. This figure displays thepercentage of MJTFs that report receiving each kind of contribution. For some analyses and reports,SAAs may find it useful to present the information by MJTF or partition the results according toregion, urban versus rural areas, task force focus, or some other basis of comparison.
The performance measurement template also supports describing task force structure and coverageareas. For example, SAAs can describe their MJTF programs using:
Agency Participation% of MJTFs with state law enforcement agency participation% of MJTFs with federal law enforcement agency participation% of MJTFs with tribal law enforcement agency participation% of MJTFs with prosecutor/court participation% of agencies participating in MJTFs from each category: federal, state, local, tribal% of sworn staff from each of federal, state, and local level
Coverage Areas% of counties within the state that are covered by MJTFs% of the population within the state (population would have to be acquired from censusdata) covered by an MJTF
This document is a research report submitted to the U.S. Department of Justice. This report has not been published by the Department. Opinions or points of view expressed are those of the author(s) and do not necessarily reflect the official position or policies of the U.S. Department of Justice.

Abt Associates Inc. Chapter 3: Performance Monitoring: Analyzing MJTF Performance 26
Figure 3.2
Percent of MJTFs Receiving Each Type of In-Kind Contribution, Statewide Levels
82%
69%
54%
34%
0%
10%
20%
30%
40%
50%
60%
70%
80%
90%
Equipment Technology Supplies Personnel
Type of Contribution
%M
JTF
sC
on
trib
uti
ng
MJTF Structure and Policies% of MJTFs with an MOU or IAA% of MJTFs with a policy board% of MJTFs with a policy board that meets:
MonthlyQuarterlyAnnuallyAs needed
% of MJTFs with written protocols that include:Chain of commandMission statementGoals and objectivesPolicies and procedures
FOP for agentsTargeting and approving casesInformation referrals
Exhibits and summaries similar to those in Table 3.1 and Figure 3.3 can be made for these and othermeasures of task force structure and operations.
This document is a research report submitted to the U.S. Department of Justice. This report has not been published by the Department. Opinions or points of view expressed are those of the author(s) and do not necessarily reflect the official position or policies of the U.S. Department of Justice.

Abt Associates Inc. Chapter 3: Performance Monitoring: Analyzing MJTF Performance 27
Figure 3.3
MJTF Intelligence Sharing, Statewide Levels
0
100
200
300
400
500
600
700
800
900
State Intel.Database
Regional Intel.Database
National Intel.Database
CounterterrorismReferrals
Drug EndangeredChild Referrals
Other Tips/Leads
Urban Rural
Here and elsewhere we encourage users to be creative and thoughtful when adapting the template.Measuring the number of FTEs dedicated to a task force is important and may be sufficient. ManyMJTFs in rural areas essentially provide the only narcotics enforcement for the area, so knowing thenumber of sworn personnel is informative. Other MJTFs have complicated structures and missions.For example it might be helpful to partition the FTEs across enforcement, intelligence and trainingactivities. The current template does not allow that detail, but the template could be modified if taskforce reporting requires that detail.
Describing MJTF Activities and Outputs
Ultimately, program success or failure depends on whether activities are correctly targeted and ofsufficient frequency and magnitude to produce the desired effects. MJTF activities can be describedin many different ways, including how the programs are organized and structured; the rules andpolicies that govern them; and the steps that exist to investigate drug-related crime, seize drugs, makearrests, and prosecute those arrested. Performance measures provide a means of documenting thatthese activities have occurred as intended. When evidence of program activity is collectedconsistently, it provides a foundation for (a) examining whether the resources are in place toadequately support the necessary activities, (b) tracking over time to assess whether activities arekeeping pace with changing crime problems, task force objectives, and available resources, and (c)explaining outcomes.
This document is a research report submitted to the U.S. Department of Justice. This report has not been published by the Department. Opinions or points of view expressed are those of the author(s) and do not necessarily reflect the official position or policies of the U.S. Department of Justice.

Abt Associates Inc. Chapter 3: Performance Monitoring: Analyzing MJTF Performance 28
As discussed in previous chapters on logic models and measurement issues, program monitors shoulddistinguish between activities and outputs. Outputs are the immediate results of the program’sactivities. A task force, for example, may have as an objective providing public outreach andeducation to enlist support for its anti-drug efforts. To further that objective, the MJTF may conducta series of public presentations and “training sessions” in communities within the task force coveragearea. “Training” would be the activity; the number of sessions held and the number of personstrained would be considered “outputs.”4
Intelligence SharingOne of the fundamental reasons for the development of MJTFs is to enhance the flow of informationacross agency and jurisdictional boundaries, and the new performance measurement templateprovides several measures of this exchange of information (Items D1 to D4). To illustrate how thesemeasures can be presented, Figure 3.3 displays the number of referrals to state, regional, and nationalintelligence databases, and referrals to other agencies about drug endangered child and counter-terrorism cases. For this display, the MJTFs are divided into those covering urban versus rural areas.This bar graph makes it readily apparent that in this State, most of the referrals are generated fromMJTFs covering urban areas. This would be expected in a state where most of the population isconcentrated in cities, and thus more criminal and MJTF law enforcement activity would be urban.States that are more heavily rural, with only one or two urban centers, might exhibit different patterns.
The proportions vary across each kind of database or referral. If it is important to highlight the ruralversus urban differences across the kinds of intelligence databases and referrals, one can post therural/urban split in percentages at the top of each column. Another option is to select contrasts ofinterest and produce pie charts, which effectively convey percentage splits across categories (Figure3.4).
4 Among program evaluators there is no consensus on how to determine what should be classified asmeasures of activity versus output. Law enforcement programs present special challenges, since arrests canbe regarded as a program activity (engaging in the act of making arrests), an output (the number of arrestthat occurred as a measure of the “arresting” activity), or as a program outcome (arrests serving as a proxymeasure of crime). Given that there is no single “right” way to classify arrests, for the purposes of thisguide we have elected to regard arrests as a program activity, and counts of arrests as program outputs. Forthe purpose of MJTF performance measurement, the most important issue is ensuring that the data arecollected. How SAAs choose to classify measures as representing different components of the logic modelis a secondary concern.
This document is a research report submitted to the U.S. Department of Justice. This report has not been published by the Department. Opinions or points of view expressed are those of the author(s) and do not necessarily reflect the official position or policies of the U.S. Department of Justice.

Abt Associates Inc. Chapter 3: Performance Monitoring: Analyzing MJTF Performance 29
Figure 3.4
Comparing Rural/Urban Difference in Intelligence Database Entries Child EndangermentReferrals for all MJTFs
Intelligence Databases
65%
35%
Urban Rural
Drug Endangered Child Referrals
86%
14%
Urban Rural
As before, we encourage creativity. An intelligence center may perform different activities that varyin intensity for supporting anti-drug operations. Intelligence analysts sometimes assist agents in thepreparation of documents supporting prosecution – for example, organizational charts, time lines, andso on. They might also assist agents by supporting investigations by analyzing information gainedusing trap and trace devices and pen registers. The same staff members may perform or assist withlabor intensive wire intercepts. Still other staff members might assist investigators with activities asdiverse as mapping urban areas, tracing license plate numbers, and providing deconfliction services.When a task force supports an intelligence center, the performance monitoring system might usefullydifferentiate how labor is allocated across activities, and track trends in usage as a way to anticipatehow future labor needs might differ from current labor needs.
Describing MJTF Investigations, Arrests, and Warrants ServedInvestigating crimes and making arrests are basic police activities, and drug task force operations areoften defined as disrupting and dismantling trafficking organizations and dealers. Non-drug taskforces have their own specific definitions. Law enforcement agencies, program sponsors, andoversight bodies are experienced in collecting and presenting data on arrests. The Uniform CrimeReporting system has been in place for over 30 years, and reporting arrests at the MJTF level is aByrne/JAG funding requirement.
While the concept of reporting arrests is not new, the purpose of the new requirements is to establishuniformity and consistency when reporting across MJTFs and states, and over time. This subdivisionof arrests may represent a change in reporting for some task forces. Items in the template (itemsD10a to D10d) ask for task forces to report separately arrests for possession and for delivery ofcontrolled substances—on the felony and misdemeanor levels—and to report on how many of thearrestees were gang members. A summary table is a good starting point for presenting and assessingthis information. Table 3.2 presents one option for compiling descriptive data on investigations,warrants, and arrests. Counts for each task force can be presented, along with state totals and averagenumbers for each MJTF. Tabular data such as these can also be presented graphically.
This document is a research report submitted to the U.S. Department of Justice. This report has not been published by the Department. Opinions or points of view expressed are those of the author(s) and do not necessarily reflect the official position or policies of the U.S. Department of Justice.

Abt Associates Inc. Chapter 3: Performance Monitoring: Analyzing MJTF Performance 30
Table 3.2
Summary of MJTF Investigations, Arrests, and Warrants Served
Investigations ArrestsTask Force New Opened Pending Dropped Closed
Warrantsserved Possession Delivery
MJTF 1
MJTF 2
MJTF 3
MJTF 4
MJTF 5
MJTF Totals
Averages Per MJTF
Again, we encourage creativity when adapting the template. Counts of investigations, arrests andwarrants may be sufficient for a rural task force that has a street-level enforcement mission, but it canbe misleading for a task force that has a mission to disrupt and dismantle higher-level traffickingorganizations. For the latter organizations, an additional and perhaps preferable metric is the numberof DTOs that were disrupted or dismantled. Of course a meaningful count requires valid and reliabledefinitions and measures of “DTO,” “disrupted,” and “dismantled”.
II. Using the Performance Monitoring System to Track MJTFPrograms Over Time
All performance measures can be tracked over time to document trends in program focus, structure,resources, activities, and indicators of effectiveness. Among the most useful tools for presentingtrend data is a line chart, which can be easily produced using standard spreadsheet programs, andsimple summary tables with year or other reporting period along one axis and the measure of interestalong the other.
Tracking Task Force Objectives
Judging whether MJTFs are successful requires knowing what they are trying to accomplish. Goalsdefine program objectives, and clearly-stated objectives are necessary for establishing measures ofprogram effectiveness. Objectives can be thought of as “goalposts” for a program, and they need tobe defined precisely so that progress reaching them can be measured unambiguously. All BJA-supported MJTFs share the broad goals of reducing drug availability and drug-related crime, andthese goals have not changed over time. However, specific objectives vary across MJTFs due todifferent local crime problems and the fact that they are operating under different conditions.Moreover, even within a specific task force, circumstances change with time, so objectives do as well.As patterns in drug availability and drug-related crime change, MJTFs may shift their focus to adaptto those and other changing conditions.
This document is a research report submitted to the U.S. Department of Justice. This report has not been published by the Department. Opinions or points of view expressed are those of the author(s) and do not necessarily reflect the official position or policies of the U.S. Department of Justice.

Abt Associates Inc. Chapter 3: Performance Monitoring: Analyzing MJTF Performance 31
The new performance measurement template quantifies MJTF goals by ranking the priority of a set ofcommon task force objectives. The objectives of MJTFs within a state can be presented and trackedusing a simple line chart of average priority rankings of the various categories of drugs addressed bytask forces. In a hypothetical example presented in Figure 3.5, one can see that the task forceobjective rankings changed little from 2004 to 2005, then combating methamphetamine rose on thepriority list, while combating marijuana and heroin fell.
Figure 3.5
Ranking Scores for MJTF Objectives, 2004-2008
0
1
2
3
4
5
6
2004 2005 2006 2007 2008
Sta
tew
ide
Ave
rage
Ran
k
CocaineMethHeroin
Since objectives provide the foundation for the deployment of resources and prioritizing differentactivities, a change in objective will affect subsequent elements of the rest of the logic model. Forexample, an area experiencing an increase in the manufacturing and trafficking of methamphetaminemight expect local MJTFs to shift focus from other types of drug enforcement and investigation. TheMJTF’s resource needs would also change (e.g., staff might need specialized equipment and trainingto meet meth-related challenges); as would its activities (investigations, meth lab seizures anderadications); and program outputs (e.g., the amount of meth seized, the number of lab eradications).
The same approach can be used to monitor task forces within groups. Task Forces fall naturally intocertain categories, and it is a simple matter to group them for analytic purposes. For example, SAAsmight find it useful to track and compare MJTFs across:
Rural vs. urban areas
Different regions of the state
This document is a research report submitted to the U.S. Department of Justice. This report has not been published by the Department. Opinions or points of view expressed are those of the author(s) and do not necessarily reflect the official position or policies of the U.S. Department of Justice.
Abt Associates Inc. Chapter 3: Performance Monitoring: Analyzing MJTF Performance 32
Areas with certain geographic features, e.g.
Interstate highway Sharing a border with another state or country Ports, coastal areas Recreational areas, such as lakes and state parks
Tracking MJTF Staffing Levels
Our research on MJTFs found that most expenditure is for staff. Since staff levels drive the task forceactivity, SAAs will want to track the numbers of people deployed in task force programs. Figures 3.6and 3.7 present two options for displaying such data. The first of these figures presents tracking dataon FTEs for a subset of seven individual MJTFs. The graph illustrates that FTEs do not varysubstantially from year to year for most MJTFs, while a few show significant trends indicatingexpansion or contraction.
When there are a small number of task forces, a line chart can effectively present their individualtrends. Even with small numbers of programs, overall trends can become obscured by plotspresenting individual programs. Many states have in excess of 25 MJTFs, and line charts for thisnumber of task force can become unworkable. Therefore, it is often helpful to add a trend line forstatewide totals, or to present a graph showing only the statewide trend line. As Figure 3.6 illustrates,the separate lines show individual MJTF trends but reveal little about overall trends, which are madeapparent by the combined trend line (Figure 3.7). In this hypothetical example, there was a gradualincrease in FTEs from 2002 to 2006, and a drop in the final year.
This graph raises a number of questions. For example: What drove the increase? Did an increase indrug-related crime lead to the increased commitment of staff? Was there a corresponding increase inMJTF activity, and if so, was it proportional to the increase in staffing? Answers to many questionslike these can be addressed by examining other performance measures. For example, later in thischapter we discuss how to examine relationships between measures such as staffing levels and arrests.
This document is a research report submitted to the U.S. Department of Justice. This report has not been published by the Department. Opinions or points of view expressed are those of the author(s) and do not necessarily reflect the official position or policies of the U.S. Department of Justice.

Abt Associates Inc. Chapter 3: Performance Monitoring: Analyzing MJTF Performance 33
Figure 3.6
Full-Time Equivalents Deployed to Sample of MJTFs, 2000-2007
0
5
10
15
20
25
30
2000 2001 2002 2003 2004 2005 2006 2007
MJTF1
MJTF2MJTF3
MJTF4MJTF5
MJTF6
MJTF7
Figure 3.7
Full-Time Equivalents Deployed to MJTFs, Statewide Levels, 2000-2007
Statewide
90
95
100
105
110
115
120
125
130
135
140
2000 2001 2002 2003 2004 2005 2006 2007
This document is a research report submitted to the U.S. Department of Justice. This report has not been published by the Department. Opinions or points of view expressed are those of the author(s) and do not necessarily reflect the official position or policies of the U.S. Department of Justice.
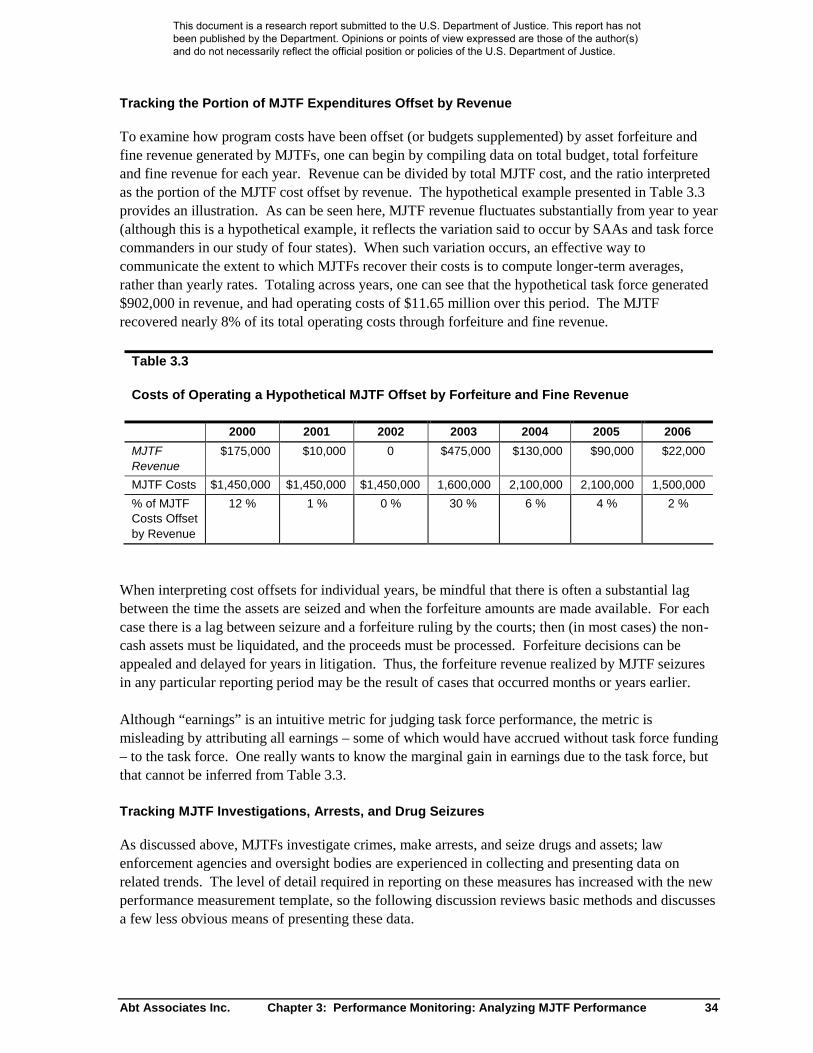
Abt Associates Inc. Chapter 3: Performance Monitoring: Analyzing MJTF Performance 34
Tracking the Portion of MJTF Expenditures Offset by Revenue
To examine how program costs have been offset (or budgets supplemented) by asset forfeiture andfine revenue generated by MJTFs, one can begin by compiling data on total budget, total forfeitureand fine revenue for each year. Revenue can be divided by total MJTF cost, and the ratio interpretedas the portion of the MJTF cost offset by revenue. The hypothetical example presented in Table 3.3provides an illustration. As can be seen here, MJTF revenue fluctuates substantially from year to year(although this is a hypothetical example, it reflects the variation said to occur by SAAs and task forcecommanders in our study of four states). When such variation occurs, an effective way tocommunicate the extent to which MJTFs recover their costs is to compute longer-term averages,rather than yearly rates. Totaling across years, one can see that the hypothetical task force generated$902,000 in revenue, and had operating costs of $11.65 million over this period. The MJTFrecovered nearly 8% of its total operating costs through forfeiture and fine revenue.
Table 3.3
Costs of Operating a Hypothetical MJTF Offset by Forfeiture and Fine Revenue
2000 2001 2002 2003 2004 2005 2006
MJTFRevenue
$175,000 $10,000 0 $475,000 $130,000 $90,000 $22,000
MJTF Costs $1,450,000 $1,450,000 $1,450,000 1,600,000 2,100,000 2,100,000 1,500,000
% of MJTFCosts Offsetby Revenue
12 % 1 % 0 % 30 % 6 % 4 % 2 %
When interpreting cost offsets for individual years, be mindful that there is often a substantial lagbetween the time the assets are seized and when the forfeiture amounts are made available. For eachcase there is a lag between seizure and a forfeiture ruling by the courts; then (in most cases) the non-cash assets must be liquidated, and the proceeds must be processed. Forfeiture decisions can beappealed and delayed for years in litigation. Thus, the forfeiture revenue realized by MJTF seizuresin any particular reporting period may be the result of cases that occurred months or years earlier.
Although “earnings” is an intuitive metric for judging task force performance, the metric ismisleading by attributing all earnings – some of which would have accrued without task force funding– to the task force. One really wants to know the marginal gain in earnings due to the task force, butthat cannot be inferred from Table 3.3.
Tracking MJTF Investigations, Arrests, and Drug Seizures
As discussed above, MJTFs investigate crimes, make arrests, and seize drugs and assets; lawenforcement agencies and oversight bodies are experienced in collecting and presenting data onrelated trends. The level of detail required in reporting on these measures has increased with the newperformance measurement template, so the following discussion reviews basic methods and discussesa few less obvious means of presenting these data.
This document is a research report submitted to the U.S. Department of Justice. This report has not been published by the Department. Opinions or points of view expressed are those of the author(s) and do not necessarily reflect the official position or policies of the U.S. Department of Justice.

Abt Associates Inc. Chapter 3: Performance Monitoring: Analyzing MJTF Performance 35
InvestigationsIf the data have been collected consistently, presenting the number of new investigations opened byMJTFs is relatively simple, and interpreting total counts over time is straightforward. The newtemplate also requires MJTFs to report on (a) the number of investigations pending as of the end ofthe reporting period, (b) the number closed, and (c) the number dropped, which opens severalpossibilities for reporting and analysis.
The substantive interests of SAAs will drive the selection of presentation methods, but many SAAsare likely to find value in certain presentations. For example, one of the key assumptions underlyingMJTFs is that the quantity and flow of intelligence across agencies and jurisdictions (along withincreasing the number and training levels of sworn law enforcement staff) will lead to better cases. Ifso, one might expect that over years of investment in MJTFs, the proportion of cases opened shouldincrease (Figure 3.8). One might also expect the number of cases dropped to fall, and the proportionof cases that are closed by making arrests to increase over time. To examine this, one can calculatethe percentage of investigations closed, dropped, and pending each year.
Figure 3.8
Number of Investigations Opened by MJTFs, Statewide Totals, 2000-2007
Investigations Opened
0
500
1000
1500
2000
2500
3000
3500
2000 2001 2002 2003 2004 2005 2006 2007
A divided bar graph such as that provided in Figure 3.9 can effectively present this information. Asthis graph shows, from 2000 to 2006 the portion of investigations ending in arrest (“closed”) rose inrelation to those that did not end in arrest (“dropped”). Whether the drop in 2007 is the beginning ofa downward movement or “correction” back to lower levels, or merely a one or two year hitch in alarger upward trend, one cannot tell until data have been collected for subsequent years.
This document is a research report submitted to the U.S. Department of Justice. This report has not been published by the Department. Opinions or points of view expressed are those of the author(s) and do not necessarily reflect the official position or policies of the U.S. Department of Justice.
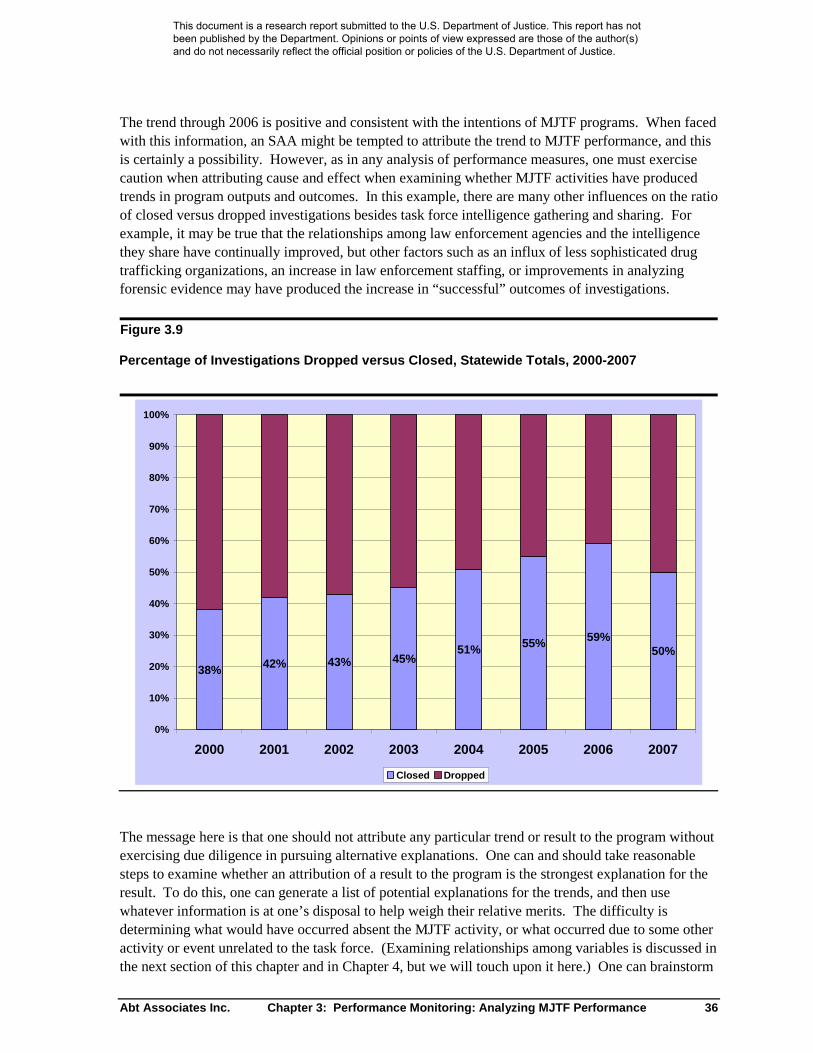
Abt Associates Inc. Chapter 3: Performance Monitoring: Analyzing MJTF Performance 36
The trend through 2006 is positive and consistent with the intentions of MJTF programs. When facedwith this information, an SAA might be tempted to attribute the trend to MJTF performance, and thisis certainly a possibility. However, as in any analysis of performance measures, one must exercisecaution when attributing cause and effect when examining whether MJTF activities have producedtrends in program outputs and outcomes. In this example, there are many other influences on the ratioof closed versus dropped investigations besides task force intelligence gathering and sharing. Forexample, it may be true that the relationships among law enforcement agencies and the intelligencethey share have continually improved, but other factors such as an influx of less sophisticated drugtrafficking organizations, an increase in law enforcement staffing, or improvements in analyzingforensic evidence may have produced the increase in “successful” outcomes of investigations.
Figure 3.9
Percentage of Investigations Dropped versus Closed, Statewide Totals, 2000-2007
38% 42% 43% 45%51% 55% 59%
50%
0%
10%
20%
30%
40%
50%
60%
70%
80%
90%
100%
2000 2001 2002 2003 2004 2005 2006 2007
Closed Dropped
The message here is that one should not attribute any particular trend or result to the program withoutexercising due diligence in pursuing alternative explanations. One can and should take reasonablesteps to examine whether an attribution of a result to the program is the strongest explanation for theresult. To do this, one can generate a list of potential explanations for the trends, and then usewhatever information is at one’s disposal to help weigh their relative merits. The difficulty isdetermining what would have occurred absent the MJTF activity, or what occurred due to some otheractivity or event unrelated to the task force. (Examining relationships among variables is discussed inthe next section of this chapter and in Chapter 4, but we will touch upon it here.) One can brainstorm
This document is a research report submitted to the U.S. Department of Justice. This report has not been published by the Department. Opinions or points of view expressed are those of the author(s) and do not necessarily reflect the official position or policies of the U.S. Department of Justice.
Abt Associates Inc. Chapter 3: Performance Monitoring: Analyzing MJTF Performance 37
about all feasible explanations for these trends, and pare in to a “short list” of more likelyexplanations such as:
1. Shift in drug markets, from drugs and trafficking networks that are more difficult toinvestigate and prosecute to those that are less difficult.
2. Improved training of law enforcement personnel, resulting in better investigative andevidence-handling techniques that in turn produce stronger cases on which to base arrests.
3. The trend may not be a sign that any significant change of improvement in law enforcement;it could simply be a natural level of fluctuation that is hinted at by the decline in 2007, andwould become apparent when longer trend lines can be observed.
Answering these and similar questions about opening and closing investigations is fundamental toperformance monitoring, but answering these questions suggests elaborating on the graphs. Not allinvestigations are the same. Some target major distribution networks, and at some point, thoseinvestigations can consume most of a task force’s resources, meaning that the task force necessarilydelays culmination of other open investigations and may not initiate new ones. Lumpinginvestigations together into a generic type can be misleading for task forces that work both large andsmall cases.
For a performance monitoring system to be useful when task forces work diverse cases, theperformance measurement system requires some means for distinguishing scale across investigations.A meaningful definition of a drug trafficking organization is a starting point. See the earlierdiscussion on this topic that reported the US Sentencing Commissions role in the offense definition:“If the defendant was an organizer or leader of a criminal activity that involved five or moreparticipants or was otherwise extensive…” A drug trafficking organization might be defined as agroup that has such an organizer or leader. A monitoring system might further refine this definition.The DTO might be local or it might have intra-state, inter-state or international employees.
Our experience working with task forces shows that such terms need to be carefully defined. A DTOhas an organizational hierarchy. It may be ephemeral because DTOs form and dissolve readily, butan organizational hierarchy is distinct from a buyer-seller relationship. For example, a local DTO isnot international just because its cocaine is provided by Mexican cartels. Most investigations byMJTFs are not investigations of DTOs according to the Sentencing Commission definition. This doesnot preclude adopting definitions that differ from those provided by the Commission, of course; theobservation nevertheless suggests the need for some meaningful and transparent definition that willusefully distinguish investigations by type. Although a count of investigations sometimes overstatesthe number of DTOs under investigation, we have observed that large scale investigations can involvemultiple DTOs. This happens because of the way that investigations develop – over time, anextensive investigation will link multiple DTOs. It may disrupt or dismantle more than one as part ofthe same investigation.
Performance measurement can provide evidence or how MJTFs affect drug markets, drugmanufacturing, and drug trafficking. Performance monitoring may draw on useful tabulations andcross-tabulations. But a performance monitoring system without good measures is useless and itcannot substitute for judgment.
This document is a research report submitted to the U.S. Department of Justice. This report has not been published by the Department. Opinions or points of view expressed are those of the author(s) and do not necessarily reflect the official position or policies of the U.S. Department of Justice.
Abt Associates Inc. Chapter 3: Performance Monitoring: Analyzing MJTF Performance 38
ArrestsAs discussed above, SAAs and law enforcement agencies have long been required to track and reporton the number of arrests, so this guide does not discuss how to present simple arrest trends. However,the new performance measurement template subdivides arrests in ways that may not be as familiar tosome MJTFs and states. Options for presentation of these data are discussed here.
The new template asks MJTFs to report on possession and trafficking of drugs, and further subdividesarrests as felonies or misdemeanors. There are a number of options for presenting this data, and theinterests of SAAs will determine which methods to pursue. For example, a hypothetical set of MJTFsmay have focused on higher-level drug trafficking, pursuing a smaller number of longer-terminvestigations aimed at arresting key operatives. If there has been a shift from a higher number ofstreet-level arrests, one might expect to see a decrease in the overall number of drug arrests, but alarger proportion of drug arrests would be for felonies. Another state—or set of MJTFs within astate—may be focusing on cracking down on lower-level street dealers and end users (with arrestserving as the gateway to local drug courts and treatment programs), and may expect an increase inoverall arrest numbers and the proportion that are for misdemeanors.
To examine this, one could collapse into a single category the possession and trafficking charges, andcalculate the proportion of all arrests that are felonies and misdemeanors. The graph in Figure 3.10presents trends in the percentages of felony and misdemeanor drug arrests made by MJTF staff. Asthis type of area graph makes readily apparent, the proportion of arrests for felonies varied from yearto year but show a general downward trend. Such a trend would not be welcome news for MJTFsintending to make more felony arrests of traffickers, but would be expected for task forces that hadincreased their street level enforcement and intended to route drug users into treatment. To furtherexamine the latter, one could also track the proportion of arrests for possession versus trafficking, andwould expect to see an increase in arrests for misdemeanor (as well as felony) possession.
Other types of arrest trends that may be of interest to SAAs include percentages of trafficking versuspossession arrests, and felony arrests made by urban versus rural MJTFs. The previous subsectionexplained why arrests may be a poor metric when the task force emphasizes the investigation of drugtrafficking organizations.
Drug SeizuresThe previously discussed methods of tracking, displaying, and interpreting data on arrests andinvestigations are readily applied to data on drug seizures. In monitoring a state’s MJTF programs,SAA will want to begin with simple data tracking presentations, such as line charts of drug seizuresby drug type across reporting periods. One consideration important to presenting seizure data is theneed to ensure that when presenting together seizures of different drug types, that the units ofmeasurement are standardized or, at least, made very clear and considered when interpreting trendsand differences among drug types. For example, many drugs are commonly recorded in grams, butmarijuana is often tracked in kilograms or pounds. If a single graph presents trends in seizures ofcocaine, methamphetamine, and heroin, it is important to convert them all to the same unit ofmeasurement.
This document is a research report submitted to the U.S. Department of Justice. This report has not been published by the Department. Opinions or points of view expressed are those of the author(s) and do not necessarily reflect the official position or policies of the U.S. Department of Justice.

Abt Associates Inc. Chapter 3: Performance Monitoring: Analyzing MJTF Performance 39
Figure 3.10
Percentage of Arrests for Misdemeanor versus Felony Offenses, Statewide Totals, 2000-2007
0%
10%
20%
30%
40%
50%
60%
70%
80%
90%
100%
2000 2001 2002 2003 2004 2005 2006 2007
Felony Misdemeanor
In practice, it is often helpful to track marijuana separately when making tracking graphs. Theamounts of marijuana (measured in grams) often are far larger than for seizures of other drugs, and agraph with a scale able to accommodate large amounts of marijuana can obscure trends in drugsseized in far smaller amounts. This is illustrated in the following figures. Figure 3.11 presents a linechart of five major drug types, including marijuana. As can be seen here, marijuana seizures occur infar greater amounts, and the other trend lines are all packed closely together at the bottom of thescale. Figure 3.12 presents the same trend data for the other four drug types, but with marijuanaremoved the scale is reduced, revealing the nature of the variation over time in seizures of the otherdrugs that was not apparent when marijuana was included.
Tracking MJTF Outcomes: Convictions and Sentences
While investigating and arresting offenders are the key law enforcement activities, they will havelittle impact on crime if the charges are not prosecuted successfully and do not result in substantialcriminal penalties. If MJTFs operate as intended, one would expect increases in the proportion ofcases referred for prosecution that are accepted, an increase in conviction rates, and longer prisonsentences. These expectations are grounded in the assumption that MJTFs produce betterintelligence, communication, and collaboration among police agencies, and more well-trained
This document is a research report submitted to the U.S. Department of Justice. This report has not been published by the Department. Opinions or points of view expressed are those of the author(s) and do not necessarily reflect the official position or policies of the U.S. Department of Justice.

Abt Associates Inc. Chapter 3: Performance Monitoring: Analyzing MJTF Performance 40
Figure 3.11
Trends in Drug Seizures, by Drug Type, Measured in Grams
0
2000
4000
6000
8000
10000
12000
14000
16000
2000 2001 2002 2003 2004 2005 2006 2007
Marijuana Meth Heroin Powder Cocaine Crack Cocaine
Figure 3.12
Trends in Drug Seizures, by Drug Type, Measured in Grams—With Marijuana Removed
0
100
200
300
400
500
600
700
800
900
1000
2000 2001 2002 2003 2004 2005 2006 2007
Meth Heroin Powder Cocaine Crack Cocaine
This document is a research report submitted to the U.S. Department of Justice. This report has not been published by the Department. Opinions or points of view expressed are those of the author(s) and do not necessarily reflect the official position or policies of the U.S. Department of Justice.

Abt Associates Inc. Chapter 3: Performance Monitoring: Analyzing MJTF Performance 41
investigators who can better assemble, preserve, and present evidence. Thus, MJTF should bepresenting prosecutors with stronger cases that can withstand the efforts of defense attorneys, putprosecutors in a stronger position for plea bargaining, and support longer sentences.
Figure 3.13 presents one option for presenting performance data on MJTF outcomes for ahypothetical state. In this example, trends in performance indicators are clearly going in the desireddirection, with the proportion of referred cases accepted by prosecutors, the conviction rate, andproportion receiving prison sentences all increasing.
Figure 3.13
Percentage of Cases Referred to Prosecution That Are Accepted, Result in Conviction, andResult in Prison Sentences, Statewide Totals, 2000-2007
0%
10%
20%
30%
40%
50%
60%
70%
80%
90%
100%
2000 2001 2002 2003 2004 2005 2006 2007
% Accepted % Convicted % Sentenced Prison
Using convictions and sentences as a measure of performance may be misleading for some taskforces. For a task force whose mission is low-level drug-law enforcement, the goal may be diversionthrough drug court. Increasing convictions would contraindicate improved performance, whichwould be better judged by the number of drug court graduates. Diversity across MJTFs requiresdiversity across measures.
This document is a research report submitted to the U.S. Department of Justice. This report has not been published by the Department. Opinions or points of view expressed are those of the author(s) and do not necessarily reflect the official position or policies of the U.S. Department of Justice.

Abt Associates Inc. Chapter 3: Performance Monitoring: Analyzing MJTF Performance 42
III. Using Performance Monitoring Systems to Examine Linkagesin MJTF Logic Models
The new template provides measures that support examining the linkages between and amongcomponents of an MJTF logic model. A number of analytic techniques can be applied, but the basicapproach involves examining the relationship between measures of different components of themodel. For example, as the number of staff (a program input) increases, what happens to arrests andinvestigations? If the correlation between these two variables is positive (i.e., as MJTF staffing rises,arrests increase correspondingly), it provides evidence that the program is having its desired effect.However, one cannot assume that program results and outcomes are determined solely by the effortsof the program, for there may be other external forces at work that obstruct or contribute to aprogram’s successes. For example, the creation or expansion of MJTF programs may result in adramatic increase in numbers of drug traffickers arrested. But if the U.S. drug market hasexperienced a surge in the availability of a particular drug, illicit drug use may increase even as taskforces reach their goals of increased numbers of arrests and convictions.
Determining with high levels of certainty whether this is a causal relationship (attributing the increasein arrests to the MJTF program, rather than to other causes as depicted in Figure 3.14) is an involvedprocess that normally requires highly sophisticated research designs and statistical techniques that arebeyond the scope of this Guide and usually require contracting with evaluation specialists. However,the application of simpler monitoring techniques can provide valuable feedback about whether theprogram appears to be on the right track.
Figure 3.14
Role of External Factors
Goals Inputs Activities Outputs Outcomes
External Factors
Examining Links Between MJTF Objectives and Outputs
The template identifies measures of drug-specific task force objectives (measurable derivatives ofgoals) and activities (drug seizures). Figure 3.15 provides an illustration. One would expect thatgreater amounts of methamphetamine would be seized by task forces that are focused on the objectiveof combating problems associated with that drug. To examine whether this is so, one can produce ascatter-plot in which the priority rank that each MJTF has given to meth is on one axis, and theamount of meth seized that year for each task force is on the other axis. Each point on the plotrepresents the intersections of meth priority rank scores and meth seized for each of 25 hypotheticalMJTFs. The diagonal “regression line” represents the relationship between the two variables. The
This document is a research report submitted to the U.S. Department of Justice. This report has not been published by the Department. Opinions or points of view expressed are those of the author(s) and do not necessarily reflect the official position or policies of the U.S. Department of Justice.

Abt Associates Inc. Chapter 3: Performance Monitoring: Analyzing MJTF Performance 43
line rising from left to right in Figure 3.15 means that as an MJTF’s meth priority rank increases, theamount of meth seized by that MJTF tends to increase.
Figure 3.15
Correlating MJTF Objectives with Drug Seizures
Examining Links between MJTF Resources and Activities and Outputs
The MJTF template provides data supporting examination of linkages between several kinds ofprogram inputs and activities or outputs. For example, the key resource devoted to MJTFs is staff,which the performance measurement template operationally defines as the number of full timeequivalent positions (FTEs). To examine the relationship between this resource and the MJTFactivities, one can produce scatter plots of FTEs and measures of task force activity, such as thenumber of submissions to intelligence databases, number of trainings conducted, and investigationsopened; one might make a similar linkage with measures of task force outcomes, such as individualsarrested or drugs seized. As staff levels increase, most indicators of MJTF activity should increasecorrespondingly, else one would question whether the additional investment was worthwhile.
Time-series analysis – examining how output and outcomes vary over time – is a variation on simplecross tabulation. The difference is that the horizontal axis would show variation in FTEs for anindividual task force. The presumption is that the outputs and outcomes would improve as FTEsincrease, and outputs and outcomes should not deteriorate if FTEs remain constant. Evidence thatcontradicts these expectations calls for closer examination.
This document is a research report submitted to the U.S. Department of Justice. This report has not been published by the Department. Opinions or points of view expressed are those of the author(s) and do not necessarily reflect the official position or policies of the U.S. Department of Justice.

Abt Associates Inc. Chapter 3: Performance Monitoring: Analyzing MJTF Performance 44
Figure 3.16 illustrates the relationship between hypothetical staffing levels and arrests. Each point onthe plot represents an MJTF, and its position in the plot is determined by the number of arrests madeon one axis, and its FTEs on the other. The diagonal regression line represents the relationshipbetween FTEs and arrests. How tightly the points are grouped around the regression line can usuallybe interpreted as indicating the strength of the relationship between the two variables. If there is aweak relationship, the points on the scatter plot will be widely dispersed around the diagonal line.When the relationship is stronger, the points will be more clustered around the line. The results
Figure 3.16
Correlating MJTF Staffing Levels with Arrests
displayed in Figure 3.16 are consistent with expectations, where MJTFs with more FTEs tend tomake more arrests. The line rising from left to right in Figure 3.16 means that as an MJTF’s FTEsincrease, the number of arrests by that MJTF tends to increase.
Figure 3.17 illustrates the relationship between task force budgets and prosecution acceptance rates.One might expect that as more is invested in MJTFs, the quality of cases might rise and result inhigher rates of acceptance for prosecution. To examine this, one can plot total budgets and the ratesof case acceptance for prosecution for each MJTF. Budgets are presented in thousands, andacceptance rates as the percentage of referred task force cases that are accepted for prosecution.
Figure 3.17
Correlating MJTF Budget and Prosecution Acceptance Rates
This document is a research report submitted to the U.S. Department of Justice. This report has not been published by the Department. Opinions or points of view expressed are those of the author(s) and do not necessarily reflect the official position or policies of the U.S. Department of Justice.

Abt Associates Inc. Chapter 3: Performance Monitoring: Analyzing MJTF Performance 45
Figure 3.17
Correlating MJTF Budget and Prosecution Acceptance Rates
In this example, there is variation in both task force budgets and in prosecution acceptance rates, butthere is no evident correlation between task force budgets and prosecution acceptance rates. Note thatthe regression line is horizontal, meaning that as the value of one variable (budgets) increases, there isno corresponding increase in the values of the other variable (acceptance rate). A plausibleexplanation for this result is that the number of prosecutions may increase with FTEs while thepercentage of cases remains constant. That is, large MJTFs have the same acceptance rate as do smallMJTFs. The former simply have more cases.
Other correlations that SAA can consider tracking using performance measures collected by the newtemplate include:
Budget by number of defendants referred for prosecution
Budget by conviction rate
FTEs and sentence length
FTEs and number of offenders convicted
Per-investigator rate of submissions to intelligence databases (# of submissions dividedby investigator FTE) by number of defendants referred for prosecution
This document is a research report submitted to the U.S. Department of Justice. This report has not been published by the Department. Opinions or points of view expressed are those of the author(s) and do not necessarily reflect the official position or policies of the U.S. Department of Justice.

Abt Associates Inc. Chapter 3: Performance Monitoring: Analyzing MJTF Performance 46
Some kinds of data are most effectively presented in the form of cross-tabulations, which convey therelationship between variables by showing how they are distributed when considered simultaneouslyor jointly. For example, to learn more about influences on prosecution acceptance rates, one canexamine the relationship between prosecutor participation in MJTFs and MJTFs having writtenpolicies and procedures for targeting and approving cases. One might expect that prosecution rateswould be higher when district attorneys or other prosecutors are formally involved in MJTFs, andwhen MJTFs have clearly articulated standards and procedures for approving cases for investigation.To examine this, one can produce a table like that presented in Table 3.4. This table presents theprosecution acceptance rates for MJTFs with and without prosecutors as formal task force partners,and those with and without formal, written policies for targeting and approving cases. As would beexpected, prosecution rates are higher for MJTFs with both formal policies and formal involvement ofprosecution.
Table 3.4
Prosecution Acceptance Rates by Having Prosecutors as Formal MJTF Partners and HavingFormal Policies for Case Targeting and Approval
MJTF Has Prosecutor as Formal Partner
Yes No
Yes 78% 62%
MJTF Has CaseTargeting &ApprovingPolicies No 66% 54%
Monitoring Using Tabulations versus Monitoring Using StatisticalAnalysis
This chapter has demonstrated how a performance monitoring system can make simple but powerfuluse of data from a performance measurement system. Advanced statistical analysis can move aperformance monitoring system from description and simple associations between variables towardevaluation. The next Chapter discusses some elements of statistical analysis that will prove useful asthe performance measurement system matures. It illustrates some aspects of that analysis usingretrospective data from four task forces.
This document is a research report submitted to the U.S. Department of Justice. This report has not been published by the Department. Opinions or points of view expressed are those of the author(s) and do not necessarily reflect the official position or policies of the U.S. Department of Justice.

Abt Associates Inc. Chapter 4: Performance Monitoring: Practical Steps and Advanced Analysis 47
Chapter 4: Performance Monitoring: PracticalSteps and Advanced Analysis
Monitoring the performance of MJTFs involves not only looking at the relationships between variousaspects of their operations and the outcomes of those operations, but also examining the statisticalsignificance of observed changes over time. Sometimes the task is simply to consider the associationbetween two parts of a program model, such as the relationship between the number of casessuccessfully prosecuted and the number of FTEs assigned to case development. Other times thedynamic nature of the system is of interest and the task is to examine the components of the model ina time series. Examples of both of these analyses are examined in the Workbook provided in thischapter.
The three previous chapters provided the core for a performance monitoring system. As described inChapters 1 and 2, implementing the performance measurement component should be straightforward,although not necessarily easy. As outlined in Chapter 3, using basic performance monitoring data intabulations, cross-tabulations, and graphics should be within the reach of most SAAs. However,applying advanced statistical analysis to monitor and evaluate MJTFs is more challenging. Asdescribed in this chapter, some of that analysis should be achievable by BJA and SAA staffs, and therest may require the use of consultants with advanced analysis skills.
This chapter first addresses issues that the analyst needs to consider when moving from a display ofdata to statistical interpretation of those data and provides a spreadsheet for preparing data andmaking common calculations that are likely of interest to SAAs. The Workbook first focuses on theever-present difficulty of missing data and provides guidance on how to address imputation. It thenwalks though a spreadsheet designed to assist in analyzing trends and calculate correlations betweeninputs and outputs. Finally, the Workbook provides a guide to looking at performance data as a timeseries.
Accumulating data using the template presented in Chapter 2 will provide the basis for these analyses.This spreadsheet-based workbook should be usable for SAAs in applying statistical analysis toperformance monitoring data now and as they gather data in the future. The example analysespresented here use seven years of retrospective data from three task forces and rely on spreadsheettools. Without burdensome manipulation, however, spreadsheets cannot support more advancedstatistical analysis. Consequently, this chapter also makes recommendations for performing moreadvanced analysis, but actual implementation is likely to require a social science researcher andstatistical computing software.
The Workbook
The Workbook file is an Excel workbook associated with this guide. It comprises multiplespreadsheets. The first spreadsheet (DATA) is a selection of seven years (2000 to 2006) ofretrospective data from various Multi- Jurisdictional Task Forces in Tennessee, Colorado, andIllinois. (Georgia was unable to provide the requisite data for the full period.) The original dataprovided by the Task Forces appear as normal (uncolored) numbers under the “Original Data”
This document is a research report submitted to the U.S. Department of Justice. This report has not been published by the Department. Opinions or points of view expressed are those of the author(s) and do not necessarily reflect the official position or policies of the U.S. Department of Justice.

Abt Associates Inc. Chapter 4: Performance Monitoring: Practical Steps and Advanced Analysis 48
header.5 Although the data are “real”, the specific data were selected for purposes of illustration.Readers should not attach much meaning to the substantive findings from these “real” data. They areprovided as illustrations only.
The variables are:
INPUT VARIABLESYEAR This is the year.MJTF This specifies the MJTF. In order to simplify the structure of this spreadsheet and
to ensure anonymity, MJTFs were randomly assigned a number and not otherwiseidentified.
FTE This is the full time equivalent task force personnel.BUDGET This is the MJTF budget in dollars.
OUTPUT VARIABLESOPENED This is the number of cases opened by the task force.PROSECUTED This is the number of cases prosecuted by the task force.DROPPED This is the number of cases dropped by the task force.ARRESTS This is the number of arrests made because of task force investigations.
These variables do not exhaust all types of retrospective data, but they will be used to demonstratehow monitoring data might be applied to more sophisticated analyses.
Imputing Missing DataEven in the best monitoring systems, it is not uncommon to find that data are missing for somevariables for some jurisdictions. For some purposes, it is convenient to impute responses for missingdata. For example, suppose that an analyst wanted to plot trends in arrests over the last seven years:2000 through 2006. When some of the MJTFs fail to report arrest data for some of the years, theyear-by-year reports would fluctuate with missing responses and trends could be misleading. Thereare a number of ways to deal with this problem. One approach is to drop every district that hasmissing observations for any years, but that approach gives an incomplete picture and can bemisleading if many MJTFs are excluded from the analysis. A second approach is to impute responseswhen the responses are missing. Imputation requires some assumptions, and one reasonableassumption is that the ratio of the variable of interest (call it X) is roughly proportional to the budget.An alternative assumption might be that X is proportional to FTEs. This proportionality can becomputed when data are provided, and then the missing data can be replaced with imputed values.Columns J through P in spreadsheet DATA include these imputations in red and are under the“Imputed Data” header.
The formulas embedded in the spreadsheet show how the imputations were actually done. Thenumbers within the grey highlighted areas in the spreadsheet are the proportions calculated for theinput variable (BUDGET) and the respective output variables’ (X) missing data. In order to calculatethis proportion, the years that contain known data for both variables are summed for each of the two
5 We have also attached spreadsheets for each of the three states participating in the BJA study designated asMJTF Template for IL, MJTF Template for TN and MJTF Template for CO.
This document is a research report submitted to the U.S. Department of Justice. This report has not been published by the Department. Opinions or points of view expressed are those of the author(s) and do not necessarily reflect the official position or policies of the U.S. Department of Justice.

Abt Associates Inc. Chapter 4: Performance Monitoring: Practical Steps and Advanced Analysis 49
variables separately. The output variable’s sum is then divided by the sum of the input variable.Below we present an example from the spreadsheet:
Example: Task Force 2 in the spreadsheet is missing data for the variable DROPPED for2000 (cell O11). To impute the missing value for this cell the following calculations aremade:
1. The known DROPPED data for 2001 to 2006 are summedDROPPED Sum = O12 + O13 + O14 + O15 + O16 + O17
2. The corresponding data for BUDGET is also summedBUDGET Sum = L12 + L13 + L14 + L15 + L16 + L17
3. The sum of the known DROPPED data is then divided by the sum of the knownBUDGET data
O18 = DROPPED Sum/ BUDGET SumThis number is represented in the spreadsheet by the number highlighted in grey atthe bottom of the DROPPED variable column in cell O18.
4. This proportion (O18) is then applied in order to determine the missing data forDROPPED in 2000 by multiplying it by BUDGET for 2000
O11=O18 x L11
While the above example provides a standard methodology, various circumstances may complicatecalculations. The following discussion attempts to address issues that may arise that require analternative methodology than that presented above.
Sometimes the BUDGET may be missing data for one or more years. In this case, FTE (rather thanBUDGET) may be used as the input variable in order to impute an output variable. For example, inTask Force 7, BUDGET and PROSECUTED are both missing data for 2003. Since BUDGET wasknown for 2000 to 2002 and 2004 to 2006, PROSECUTED could be imputed for 2000 to 2002 and2004 to 2006 using BUDGET. However, since BUDGET is missing for 2003 FTE is used tocompute the imputed value.
Known FTE values may also be used to impute unknown BUDGET values. In Task Force 5, forexample, BUDGET is missing for 2005. The sum of corresponding available data for each of theinput variables is calculated and then the BUDGET sum is divided by the FTE Sum to establish theproportion to be used in the imputation (L42). Finally, this proportion is multiplied by the FTE dataavailable for 2005 (K40) in order to establish the imputed BUDGET for 2005 (L40).
BUDGET Sum = L35 + L38 + L39
FTE Sum = K35 + K38 + K39
L42 = BUDGET Sum/ FTE Sum
L40 = L42 x K40
The same method can be followed when imputing an unknown FTE value from a known BUDGETvalue.
This document is a research report submitted to the U.S. Department of Justice. This report has not been published by the Department. Opinions or points of view expressed are those of the author(s) and do not necessarily reflect the official position or policies of the U.S. Department of Justice.

Abt Associates Inc. Chapter 4: Performance Monitoring: Practical Steps and Advanced Analysis 50
Note: This method of imputation can only be used when known corresponding input variable dataexists (e.g. both BUDGET and FTE are known for the same year, at least once).
Note: If a BUDGET (or any other variable) value has been imputed, that specific value should neverbe used to impute another value.
Another issue that may arise is that both the BUDGET and FTE variables for a given task force aremissing data for the same year(s). These variables may be imputed using a known output variable.Task Force 5 provides an example of this situation for 2006. The second proportion highlighted ingrey for both BUDGET and FTE (L43 and K43, respectively) is established using known ARRESTdata. The sum of the known BUDGET data is divided by the sum of corresponding known ARRESTdata. This proportion is then applied to the missing BUDGET data for 2006 by multiplying it by theARREST data for 2006. The same process is followed when computing the unknown FTE variable.It should not be computed with the imputed calculations for BUDGET.
BUDGET Sum = L35 + L36 + L37 + L38 + L39
FTE Sum = K35 + K 36 + K 37 + K 38 + K 39
ARREST Sum = P35 + P36 + P37 + P38 + P39
L43 = BUDGET Sum/ ARREST Sum
K43 = FTE Sum/ ARREST Sum
If data for a specific variable are missing for every years (e.g. MJTF 1’s PROSECUTED andDROPPED columns) then no data can be imputed. Similarly, if there is no known data across allvariables for one or more years (see Task Force 6 for example) no values can be imputed for theseyears. The spreadsheet converts these missing responses to zero; it identifies them with yellowshading. The zeros will not add anything to a summation, so those districts will be excluded from thetabulations for specific variables.
This approach to imputations is reasonable for most tabulations provided that missing data are not apervasive problem. The more missing data, the less compelling any argument is that relies on dataimputations. However, simple imputations will not work for statistical Inference. Consequently thischapter returns to whether or not missing responses should be imputed when applying statisticalanalysis.
Trends in Inputs
For some purposes, the analyst may want to sum variables across the MJTFs for a particular year. Asalready noted, these summations use the imputations, and the summations altogether exclude MJTFsthat failed to report a single value for a variable over all seven years. The resulting tabulations appearin the second spreadsheet called TRENDS.
Using the observed data and imputations reported in the previous section, Figure 4.1 shows trends inannual budget and full-time equivalent employees across the seven years. Because of the differencesin scale for budgets and employees, the figure shows the trends on a logarithmic scale.
This document is a research report submitted to the U.S. Department of Justice. This report has not been published by the Department. Opinions or points of view expressed are those of the author(s) and do not necessarily reflect the official position or policies of the U.S. Department of Justice.

Abt Associates Inc. Chapter 4: Performance Monitoring: Practical Steps and Advanced Analysis 51
Figure 4.1
Trends in Full-Time Equivalent Employees and Budgets, 2000 – 2006
1
10
100
1000
10000
100000
1000000
10000000
2000 2001 2002 2003 2004 2005 2006
Year
FTE
Budget
Although logarithms are convenient for drawing the figures, they are not especially convenient forreporting numbers. Table 4.1 is a substitute.
Table 4.1
Annual Budget and FTEs with Imputations for Missing Data
YEAR FTE BUDGET
2000 50 2,656,5042001 46 2,686,1012002 51 3,161,6962003 53 3,635,6442004 53 3,200,0272005 55 4,287,7992006 50 3,522,176
Based on Figure 4.1 and Table 4.1, the conclusions seem clear. Although FTEs fell between 2000and 2001 and between 2005 and 2006, on average the overall FTE only increased by about onepercent per year. Budgets also fell during two years (2004 and 2006), but on average grew by aboutone percent per year. Data were selected for illustration, so a reader should not draw a substantiveconclusion from this illustrative analysis.
This document is a research report submitted to the U.S. Department of Justice. This report has not been published by the Department. Opinions or points of view expressed are those of the author(s) and do not necessarily reflect the official position or policies of the U.S. Department of Justice.
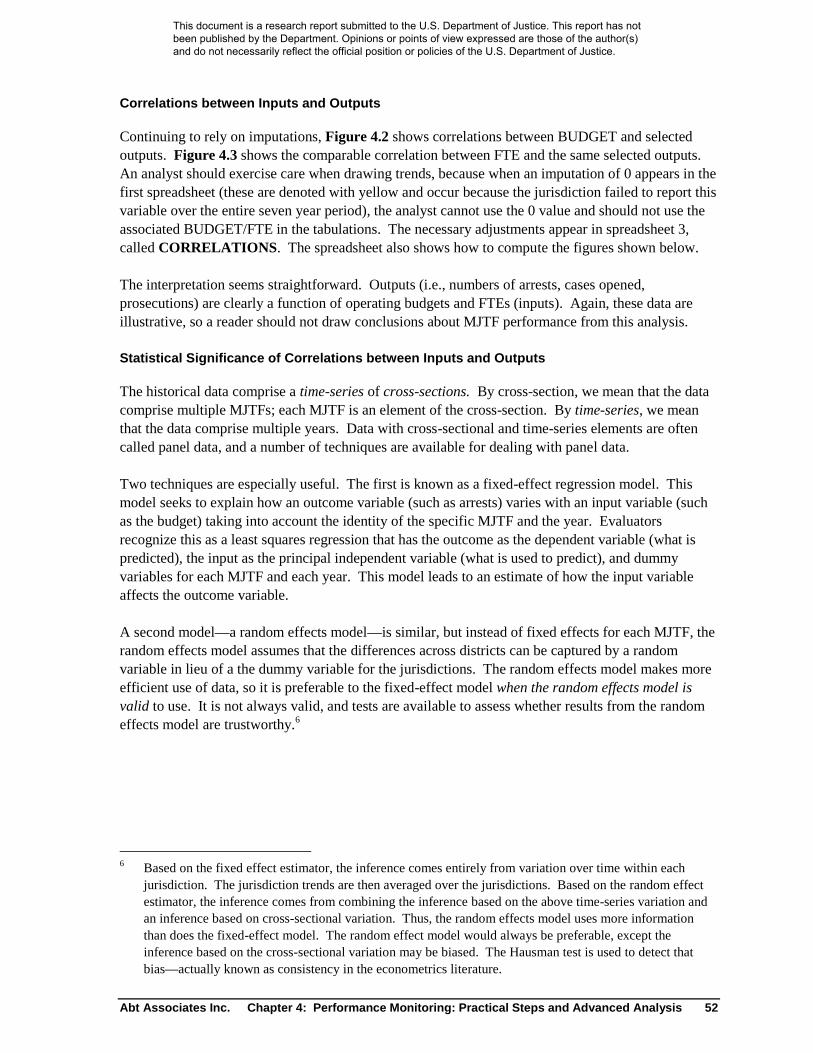
Abt Associates Inc. Chapter 4: Performance Monitoring: Practical Steps and Advanced Analysis 52
Correlations between Inputs and Outputs
Continuing to rely on imputations, Figure 4.2 shows correlations between BUDGET and selectedoutputs. Figure 4.3 shows the comparable correlation between FTE and the same selected outputs.An analyst should exercise care when drawing trends, because when an imputation of 0 appears in thefirst spreadsheet (these are denoted with yellow and occur because the jurisdiction failed to report thisvariable over the entire seven year period), the analyst cannot use the 0 value and should not use theassociated BUDGET/FTE in the tabulations. The necessary adjustments appear in spreadsheet 3,called CORRELATIONS. The spreadsheet also shows how to compute the figures shown below.
The interpretation seems straightforward. Outputs (i.e., numbers of arrests, cases opened,prosecutions) are clearly a function of operating budgets and FTEs (inputs). Again, these data areillustrative, so a reader should not draw conclusions about MJTF performance from this analysis.
Statistical Significance of Correlations between Inputs and Outputs
The historical data comprise a time-series of cross-sections. By cross-section, we mean that the datacomprise multiple MJTFs; each MJTF is an element of the cross-section. By time-series, we meanthat the data comprise multiple years. Data with cross-sectional and time-series elements are oftencalled panel data, and a number of techniques are available for dealing with panel data.
Two techniques are especially useful. The first is known as a fixed-effect regression model. Thismodel seeks to explain how an outcome variable (such as arrests) varies with an input variable (suchas the budget) taking into account the identity of the specific MJTF and the year. Evaluatorsrecognize this as a least squares regression that has the outcome as the dependent variable (what ispredicted), the input as the principal independent variable (what is used to predict), and dummyvariables for each MJTF and each year. This model leads to an estimate of how the input variableaffects the outcome variable.
A second model—a random effects model—is similar, but instead of fixed effects for each MJTF, therandom effects model assumes that the differences across districts can be captured by a randomvariable in lieu of a the dummy variable for the jurisdictions. The random effects model makes moreefficient use of data, so it is preferable to the fixed-effect model when the random effects model isvalid to use. It is not always valid, and tests are available to assess whether results from the randomeffects model are trustworthy.6
6 Based on the fixed effect estimator, the inference comes entirely from variation over time within eachjurisdiction. The jurisdiction trends are then averaged over the jurisdictions. Based on the random effectestimator, the inference comes from combining the inference based on the above time-series variation andan inference based on cross-sectional variation. Thus, the random effects model uses more informationthan does the fixed-effect model. The random effect model would always be preferable, except theinference based on the cross-sectional variation may be biased. The Hausman test is used to detect thatbias—actually known as consistency in the econometrics literature.
This document is a research report submitted to the U.S. Department of Justice. This report has not been published by the Department. Opinions or points of view expressed are those of the author(s) and do not necessarily reflect the official position or policies of the U.S. Department of Justice.
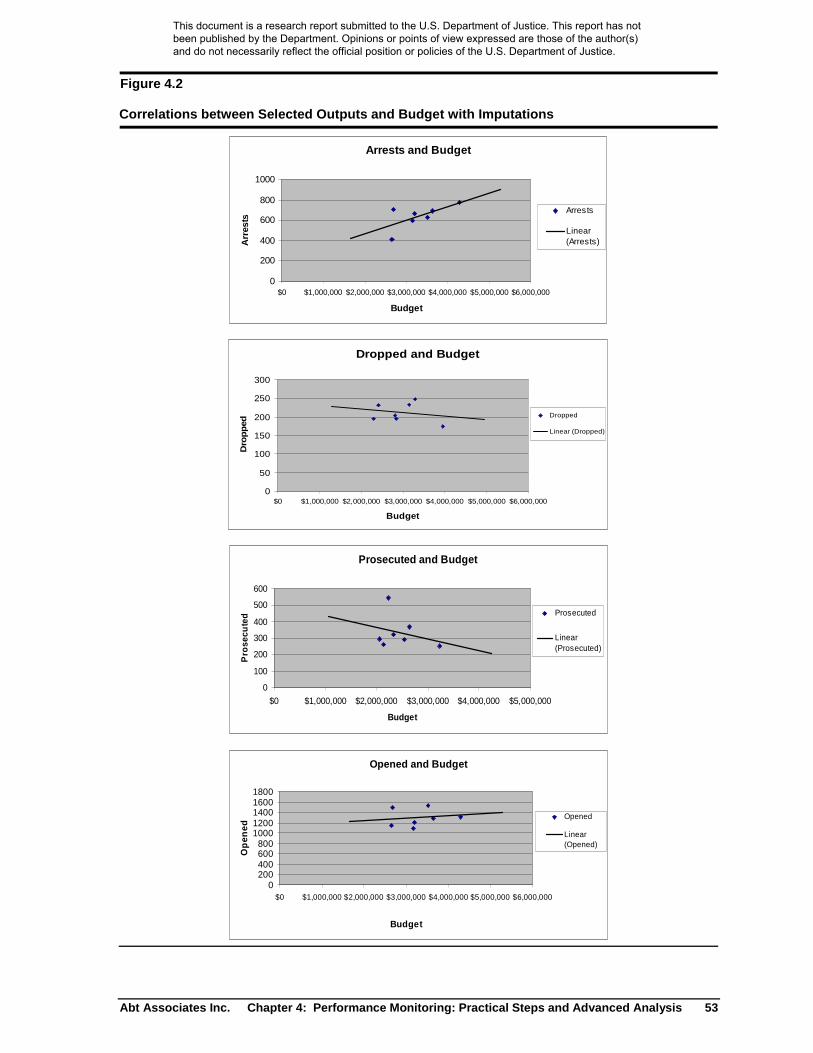
Abt Associates Inc. Chapter 4: Performance Monitoring: Practical Steps and Advanced Analysis 53
Figure 4.2
Correlations between Selected Outputs and Budget with Imputations
Arrests and Budget
0
200
400
600
800
1000
$0 $1,000,000 $2,000,000 $3,000,000 $4,000,000 $5,000,000 $6,000,000
Budget
Arr
ests
Arrests
Linear(Arrests)
Dropped and Budget
0
50
100
150
200
250
300
$0 $1,000,000 $2,000,000 $3,000,000 $4,000,000 $5,000,000 $6,000,000
Budget
Dro
pp
ed
Dropped
Linear (Dropped)
Prosecuted and Budget
0
100
200
300
400
500
600
$0 $1,000,000 $2,000,000 $3,000,000 $4,000,000 $5,000,000
Budget
Pro
secu
ted Prosecuted
Linear(Prosecuted)
Opened and Budget
0200400600800
10001200140016001800
$0 $1,000,000 $2,000,000 $3,000,000 $4,000,000 $5,000,000 $6,000,000
Budget
Op
ened
Opened
Linear(Opened)
This document is a research report submitted to the U.S. Department of Justice. This report has not been published by the Department. Opinions or points of view expressed are those of the author(s) and do not necessarily reflect the official position or policies of the U.S. Department of Justice.
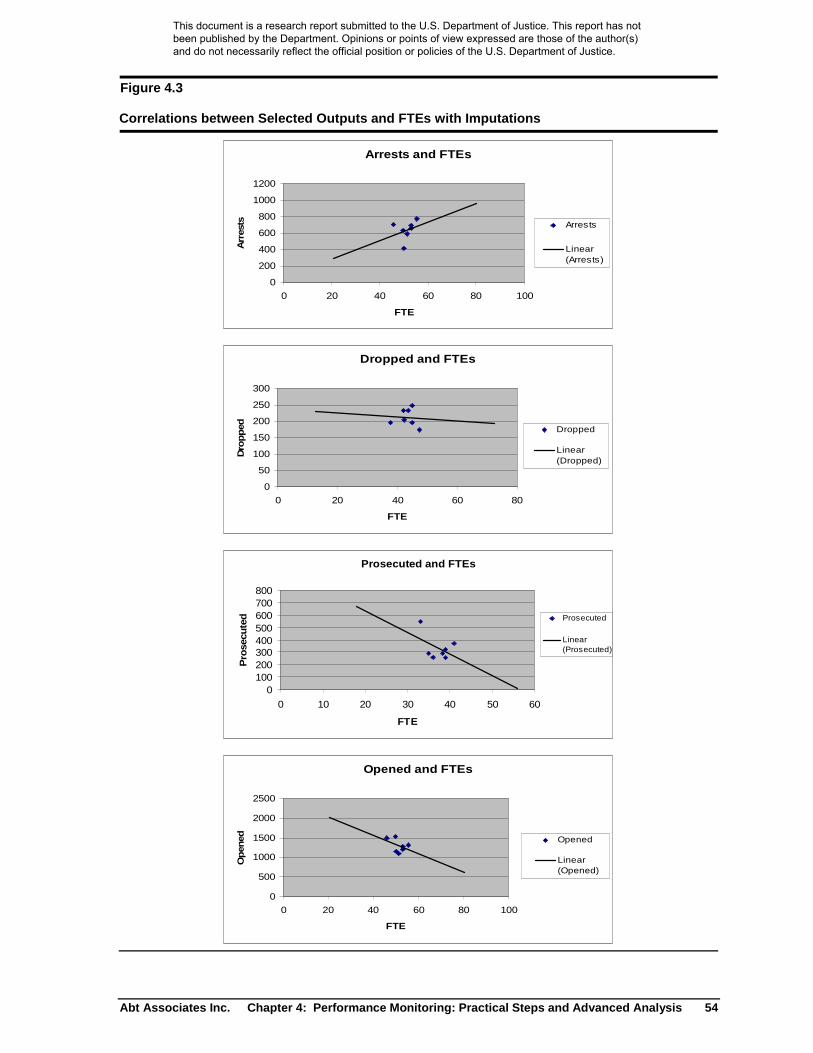
Abt Associates Inc. Chapter 4: Performance Monitoring: Practical Steps and Advanced Analysis 54
Figure 4.3
Correlations between Selected Outputs and FTEs with Imputations
Arrests and FTEs
0
200
400
600
800
1000
1200
0 20 40 60 80 100
FTE
Arr
ests Arrests
Linear(Arrests)
Dropped and FTEs
0
50
100
150
200
250
300
0 20 40 60 80
FTE
Dro
pped Dropped
Linear(Dropped)
Prosecuted and FTEs
0100200300400500600700800
0 10 20 30 40 50 60
FTE
Pro
secu
ted Prosecuted
Linear(Prosecuted)
Opened and FTEs
0
500
1000
1500
2000
2500
0 20 40 60 80 100
FTE
Open
ed Opened
Linear(Opened)
This document is a research report submitted to the U.S. Department of Justice. This report has not been published by the Department. Opinions or points of view expressed are those of the author(s) and do not necessarily reflect the official position or policies of the U.S. Department of Justice.

Abt Associates Inc. Chapter 4: Performance Monitoring: Practical Steps and Advanced Analysis 55
Though this may appear to be abstract, a way to proceed is to follow these steps:
Estimate the fixed-effects model and test for the statistical significance of the relationshipbetween the outcome variable and the input variable; and
Estimate the random effects model and test whether the model is valid. This test isknown as a Hausman test. If the random effects model is invalid, then use the resultsfrom the fixed effects model; or
If the random effects model is not invalidated, use the results from the random effectsmodel.
Statistical software for fixed effect and random effect estimation is widely available, but applicationand interpretation may require a social scientist trained in statistical analysis.
While the random effects model requires the use of specialized software, the fixed effect model canbe estimated with a spreadsheet. If Y is the dependent variable (for example, the number of arrests)and if X is the independent variables (for example, the budget), then the fixed-effect model can beestimated by following three steps:
Compute the mean value for Y and X across the seven years for a specific district. Callthese Y and X . Imputed responses do not enter into these calculations.
Create new variables y and x by subtracting the district mean from the original variable.
These new variables equal YYy and XXx .
Estimate a regression by regressing y onto x. This regression has no constant.
The regression will not report the correct tests of significance. The tests can be correctedby adjustments done within the spreadsheet. The adjustment is to reduce the degrees offreedom by the number of districts minus 1.
Spreadsheet 4 (Fixed Effects) illustrates this approach. First, the spreadsheet carries all the dataforward from spreadsheet 1. This transfer preserves all the missing variables, because imputationsshould not be used in the analysis. Second, the spreadsheet copies four variables (year, district,budget and arrests) into a lower part of the spreadsheet, and it creates dummy variables for the years.The dummy variables are coded 1 if the observation pertains to the specified year and 0 otherwise.The year 2000 does not get a dummy variable.7 Missing data, which are identified with yellowhighlights, appear in these data.
The third step has several subcomponents. The first subcomponent carries forward only thoseobservations that have no missing data. All others are deleted. See cells A120:J157; these are shadedwith light grey. Alternatively, an analyst might delete only those cases that contain missing data forthe variables used in the analysis. The second subcomponent computes the means by jurisdictionsacross years. These means are reported in cells K120:R157, also shaded with grey. The third
7 Although the regression is estimated without a constant, each jurisdiction is represented by a constant, soincluding dummy variables for every year would impose perfectly collinearity on the estimation. This isthe reason for dropping one of the year dummy variables. Any year could have been selected.
This document is a research report submitted to the U.S. Department of Justice. This report has not been published by the Department. Opinions or points of view expressed are those of the author(s) and do not necessarily reflect the official position or policies of the U.S. Department of Justice.

Abt Associates Inc. Chapter 4: Performance Monitoring: Practical Steps and Advanced Analysis 56
subcomponent subtracts the computed means from the original data. The results are reported inS120:Z157, also shaded with grey. Cells S120:Z157 provide the data used in the regression.
An analyst can estimate a linear regression using Excel’s function LINEST. This function has fourarguments. The first argument is “known_Y’s”. For this problem, the known Y’s comprise thecolumn of arrests minus the mean arrests for a district: Cells S288:S413. The second argument is“known X’s”. For this problem, the known X’s comprise the cells T288:Z413. The third argument isConst; the argument should be “False”. The fourth argument is Stats; the argument should be “True”.
Excel documentation explains that this function must be treated as an array formula—a definition thatis specific to Excel. Entering an array formula requires some steps. First, enter the formula. Second,identify a range by holding the shift key and highlighting the range coded in pink. Hit the F2 functionkey, and then while holding the shift and control keys, hit the enter key.
Within the block of cells highlighted with pink, the three cells of greatest interest are highlighted withred. The first is the effect that the budget has on arrests: -0.0000548. The second is the standard errorfor that estimated effect: 0.0000345. As an estimate of the standard error, this is too small. Theproblem is that the third cell, which reported the degrees of freedom as 30, is too large because it doesnot account for estimating the means for each district.
Three other spreadsheets are appended to this workbook. Those additional spreadsheets pertain toTennessee, Colorado and Illinois. Georgia was unable to provide similar data. The state-specificspreadsheets demonstrate the use of the procedures described in the workbook spreadsheet using realdata from Tennessee, Colorado and Illinois. We invite the reader to review findings from those sites.
Extended Analysis
Using a spreadsheet as a statistical computing package is convenient because spreadsheets are widelyused but limiting because spreadsheets lack the statistical computing routines provided by specializedsoftware package. We demonstrate the use of one statistical computing package – Stata – forextending the analysis presented above. We show and discuss Stata code for making thesecomputations. Of course users might prefer different statistical computing software.
We elect to begin our Stata sessions with the following lines of code:
#delimit ;clear;set memory 100m;set more off;
Stata needs a character denoting the end for a line of instructions. By default this is a carriage return.We replace the default with “;” by using the delimit command. The next line clears the memo. Thisline drops all variables that remain from earlier runs. The default memory allocation is sometimesinsufficient in State, so we increase it to 100 megabytes using set memory 100m. The nextcommand, set more off, simply changes the way that Stata reports output to the screen and reducesthe need for user intervention. The next line reads data into memory:
use file,clear;
This document is a research report submitted to the U.S. Department of Justice. This report has not been published by the Department. Opinions or points of view expressed are those of the author(s) and do not necessarily reflect the official position or policies of the U.S. Department of Justice.

Abt Associates Inc. Chapter 4: Performance Monitoring: Practical Steps and Advanced Analysis 57
This assumes that the data have been converted into a Stata file structure. The term file denotes thepath and file name. Many users will read the data multiple times. If the data have already been readonce, however, Stata will refuse to read them again unless the user tells Stata to overwrite the file inmemory. The option clear provides Stata with that instruction. From this point forward, we will usethe Tennessee data, which are provided as part of this report. Variables are:
year years from 2000 through 2006mjtf the identity of the task forcefte full time equivalent employeesbudget task force budget in thousandsopened number of cases opened during the yearprosecuted number of cases prosecuted during the yeardropped number of cases dropped during the yeararrests number of arrests during the year
A good starting point is to describe these data. This can be done with the Stata command:
summarize, separator(10);
The command summarize will summarize the eight variables in the analysis file. The optionseparator(10) affects the format of the reported table. Using the Tennessee data, we see:
arrests 126 124.9048 97.29785 3 500dropped 101 22.92079 35.75044 0 142
prosecuted 100 127.26 88.99491 3 355opened 119 192.6639 143.5531 20 638budget 140 285.2941 292.1967 78.864 2452.556
fte 121 6.38843 7.660637 0 49mjtf 140 13.8 8.448064 1 30year 140 2003 2.007181 2000 2006
Variable Obs Mean Std. Dev. Min Max
. summarize, separator(10);
Here and elsewhere we will report the screenshots from Stata output rather than formatting output inWord tables. There are 140 observations in the Tennessee data file. There are 20 task forces. Eachtask force reports for seven years: 20x7=140. However, data are sometimes missing. While wealways know the budget, we know full time equivalent employees for only 131 task force/yearcombinations – and for one of those reports there were no full time equivalent employees. Likewisewe do not always know the number of opened cases, the number of arrests, and the number ofprosecutions or dropped cases.
We might attempt to impute responses for missing variables, but we will not do that for this analysis.First, imputation methodology is complicated, and second, we can draw inferences withoutperforming imputations.
A second useful step is to summarize the data by MJTF. To request that summary, type:
by mjtf:summarize fte budget;
This document is a research report submitted to the U.S. Department of Justice. This report has not been published by the Department. Opinions or points of view expressed are those of the author(s) and do not necessarily reflect the official position or policies of the U.S. Department of Justice.
Abt Associates Inc. Chapter 4: Performance Monitoring: Practical Steps and Advanced Analysis 58
This statement again uses the summarize command, but now we limit the summary to two variables:fte and budget. More importantly we have added the prefix: by mjtf:. This prefix will provide asummary within each of the thirty task forces. The resulting output is lengthy, so we do not report itin its entirely here. We do report some parts of that output. For the first MJTF, Stata reports:
budget 7 343.2717 47.74866 243.948 394.381fte 7 7.857143 .8997354 6 9
Variable Obs Mean Std. Dev. Min Max
-> mjtf = 1
Both the full time equivalent employees and the budget are reported for all seven years. That is, thereare no missing data. The number of full time equivalents varies between 6 and 9. The budget variesbetween $244,000 and $394,000. Across the MJTFs in Tennessee, the full time equivalent employeesis seldom above 10, but in one MJTF, it is never fewer than 13 and was as many as 49. Thatexceptional district averaged 32 full time equivalent employees and averaged a budget of nearly $1.2million over seven years. No other MJTF averaged more than 9 full time equivalents, and none had abudget that averaged more than $510,000. That exceptional district was so different from the otherdistricts that we delete it from the data file. It was district 30 (the district identifications are notnumbered from 1 to 20), so we drop it with the statement:
drop if MJTF == 30;
The descriptive statistics tell another useful story. Consider the results from MJTF 19:
budget 7 146.1006 4.540284 141.598 154.352fte 7 5 0 5 5
Variable Obs Mean Std. Dev. Min Max
-> mjtf = 19
Data are never missing, but there is no variation over time in the number of full time equivalents, andthere is very little variation in the budget. Nothing can be learned by comparing the variation of fulltime equivalents and arrests in this district, simple because there is no variation in full timeequivalents. Likewise, little can be learned from comparing the variation between arrests and budget,because the variation in budget is immaterial.
After excluding the one MJTF, we can insect the distribution of full time equivalents across MJTFusing a histogram. To request a histogram:
histogram fte,kdensity percent xtitle("full time equivalents") title("Full Time Equivalent Employeesper Task Force");
The basic command is histogram fte to request a histogram of full time equivalents. We added arelatively smooth line with the statement kdensity . The option percent tells Stata to report thehistogram as percentages. The xtitle and title statements add titles. The figure appears below.
This document is a research report submitted to the U.S. Department of Justice. This report has not been published by the Department. Opinions or points of view expressed are those of the author(s) and do not necessarily reflect the official position or policies of the U.S. Department of Justice.

Abt Associates Inc. Chapter 4: Performance Monitoring: Practical Steps and Advanced Analysis 59
05
1015
20P
erce
nt
0 2 4 6 8 10full time equivalents
Full Time Equivalent Employees per Task Force
After deleting the one MJTF, the remaining MJTFs look similar at least with respect to the number offull time equivalent statements. We also examine the distribution for budgets measured in thousands.The statement is the same, except that we substitute budget for fte. The resulting histogram is:
010
2030
40P
erce
nt
0 200 400 600 800 1000dollars (in thousands)
Budget per Task Force
This document is a research report submitted to the U.S. Department of Justice. This report has not been published by the Department. Opinions or points of view expressed are those of the author(s) and do not necessarily reflect the official position or policies of the U.S. Department of Justice.

Abt Associates Inc. Chapter 4: Performance Monitoring: Practical Steps and Advanced Analysis 60
We might be concerned that a few MJTF/ year combinations have dollar amounts that areconsiderably larger than other MJTF/year combinations, but we will ignore that problem in whatfollows.
At this point, one might turn to analysis using statistical models that are appropriate for analyzingpanel data. State requires a user to identify cross-sections (the MJTFs in these data) and individualobservations (the time-series in these data). The statement is simple but must appear in the file:
xtset mjtf year;
Now the user can estimate models that are appropriate for analyzing panel data. First estimate a fixedeffect model using the statement:
xtreg arrests fte year,fe;estimates store FE;
The statement xtreg tells Stata to estimate a regression. The variable to be explained (arrests) is thefirst variable is a list; the explanatory variables (fte and year) are the rest of the variables in the list.The year variable appears so that we can test for a trend that has nothing to do with the number of fulltime equivalent employees. Note that this statement uses the option fe, which follows a comma. Thistells Stata to estimate a fixed effect model. We will discuss the estimates statement later. The outputis:
F test that all u_i=0: F(18, 84) = 10.62 Prob > F = 0.0000
rho .83387444 (fraction of variance due to u_i)sigma_e 47.375221sigma_u 106.14104
_cons -4066.265 5041.383 -0.81 0.422 -14091.61 5959.078year 2.065148 2.522229 0.82 0.415 -2.950582 7.080878fte 8.238908 6.397876 1.29 0.201 -4.483969 20.96179
arrests Coef. Std. Err. t P>|t| [95% Conf. Interval]
corr(u_i, Xb) = 0.3945 Prob > F = 0.1834F(2,84) = 1.73
overall = 0.2599 max = 7between = 0.4208 avg = 5.5
R-sq: within = 0.0396 Obs per group: min = 1
Group variable: mjtf Number of groups = 19Fixed-effects (within) regression Number of obs = 105
Because we have eliminated one MJTF from the analysis, there are only 19 remaining MJTFs in theanalysis. Stata calls these groups. If every MJTF had data for each of the seven years, there wouldbe 19x7=133 observations, but there are only 105 observations. This is because missing data reducethe available data to 5.5 observations per MJTF. The relationship between full time equivalentemployees and arrests is not statistically significant. (It has a P-value of 0.201. Typically an analystwould require a P-value to be smaller than 0.10 or perhaps 0.05.) On the other hand, there is anapparent time-trend toward more arrests. Plausibly this is an accumulating effect from task forcepresence although that explanation is speculative.
This document is a research report submitted to the U.S. Department of Justice. This report has not been published by the Department. Opinions or points of view expressed are those of the author(s) and do not necessarily reflect the official position or policies of the U.S. Department of Justice.

Abt Associates Inc. Chapter 4: Performance Monitoring: Practical Steps and Advanced Analysis 61
So, is there no relationship between the number of full time equivalent employees and arrests?Possibly, but there is a problem. A fixed effect model only exploits the information within each taskforce; it discards all information from across task forces. The problem is that we know from theearlier analysis using the by mjtf:summarize fte budget; command that fte’s are constant or nearlyconstant across several task forces. Such task forces can contribute nothing to the estimates based onthe fixed-effect model. The statement xtsum provides some insight into the issue of within MJTFvariance and across MJTF variance. Request:
xtsum arrests fte;
This produces a table:
within .8202299 2.66416 7.66416 T-bar = 6between 2.145397 2 9 n = 19
fte overall 4.807018 2.168263 0 10.5 N = 114
within 54.97922 -21.72101 362.279 T-bar = 6.26316between 71.85815 11.71429 255.2 n = 19
arrests overall 117.479 88.78453 3 500 N = 119
Variable Mean Std. Dev. Min Max Observations
This table shows that the total variation is arrests can be described by a standard deviation of 88.8.Within MJTFs, the standard deviation is 55.0, but across MJTFs it is 71.9. There is considerablevariation across MJTFs, and the fixed effect estimator does not exploit that. A random effectestimator does exploit that additional variation. Use the command:
xtreg arrests fte year,re;estimates store RE;
This command is the same as the earlier command except that the fe has been replaced with a re. Theoutput is:
rho .75662225 (fraction of variance due to u_i)sigma_e 47.375221sigma_u 83.531516
_cons -2826.099 4998.798 -0.57 0.572 -12623.56 6971.365year 1.439133 2.499151 0.58 0.565 -3.459114 6.337379fte 15.10009 5.446569 2.77 0.006 4.425016 25.77517
arrests Coef. Std. Err. z P>|z| [95% Conf. Interval]
corr(u_i, X) = 0 (assumed) Prob > chi2 = 0.0082Random effects u_i ~ Gaussian Wald chi2(2) = 9.61
overall = 0.2647 max = 7between = 0.3910 avg = 5.5
R-sq: within = 0.0372 Obs per group: min = 1
Group variable: mjtf Number of groups = 19Random-effects GLS regression Number of obs = 105
These results are more reasonable given an expectation that MJTF resources should account forsomething of value. In fact the number of arrests appears to increase by about 15.1 per year per FTEadded to a task force. The effect is statistically significant but it is measured with considerableimprecision. A 95% confidence intervals is 4.4 to 25.8 additional arrests per year per FTE.
This document is a research report submitted to the U.S. Department of Justice. This report has not been published by the Department. Opinions or points of view expressed are those of the author(s) and do not necessarily reflect the official position or policies of the U.S. Department of Justice.

Abt Associates Inc. Chapter 4: Performance Monitoring: Practical Steps and Advanced Analysis 62
Why would an analyst ever use the fixed effect model if it uses less information than does the randomeffect model? That question is the sort of problem that occupies statisticians, but to encapsulate: Therandom effect model rests on some strong assumption that, if not true, will lead to biased estimates.The fixed-effect model is often used to guard against that bias.
How can we tell whether or not the random effect model is valid? Regrettably the answer is notstraightforward. Analyst sometimes use a Hausman test, which is available in Stata. Anticipating theuse of a Hausman test, we introduced but did not explain the lines estimates store FE and estimatesstore RE. To apply the Hausman test, run the following lines:
xtreg arrests fte year,fe;estimates store FE;xtreg arrests fte year,re;estimates store RE;hausman FE RE,sigmamore;
The command estimates store FE and estimates store RE save results for use by the Hausman test.The last line is new. It invokes a Hausman test. If the random effect model is valid, the parameterestimates from the two models will not be significantly different. The results of the Hausman test are:
Prob>chi2 = 0.0318= 6.90
chi2(2) = (b-B)'[(V_b-V_B)^(-1)](b-B)
Test: Ho: difference in coefficients not systematic
B = inconsistent under Ha, efficient under Ho; obtained from xtregb = consistent under Ho and Ha; obtained from xtreg
year 2.065148 1.439133 .6260153 .6242975fte 8.238908 15.10009 -6.861186 3.609686
FE RE Difference S.E.(b) (B) (b-B) sqrt(diag(V_b-V_B))
Coefficients
Unfortunately the parameter associated with the full time equivalent variable is significantly differentacross the two estimators. We know this by dividing -6.861 by 3.610 to get a z-score of 1.90, whichwill be statistically significant according to a table of standard normal variables. This leaves us in anuncertain position, but the evidence seems to indicate that arrests increase with full time equivalentemployees. The best estimate is that the increase equals 8.2 arrests per year per full time equivalentin the fixed-effect model and 15.1 arrests per year per full time equivalent in the random effect model.
We can estimate the same regressions after substituting budget for FTEs. The code is:
xtreg arrests budget year,fe;estimates store FE;xtreg arrests budget year,re;estimates store RE;hausman FE RE,sigmamore;
The results follow:
This document is a research report submitted to the U.S. Department of Justice. This report has not been published by the Department. Opinions or points of view expressed are those of the author(s) and do not necessarily reflect the official position or policies of the U.S. Department of Justice.

Abt Associates Inc. Chapter 4: Performance Monitoring: Practical Steps and Advanced Analysis 63
F test that all u_i=0: F(18, 98) = 7.56 Prob > F = 0.0000
rho .55243675 (fraction of variance due to u_i)sigma_e 56.713665sigma_u 63.008884
_cons -8215.254 5315.16 -1.55 0.125 -18763.02 2332.508year 4.136974 2.655187 1.56 0.122 -1.132159 9.406107
budget .1971487 .0698045 2.82 0.006 .0586239 .3356734
arrests Coef. Std. Err. t P>|t| [95% Conf. Interval]
corr(u_i, Xb) = 0.1512 Prob > F = 0.0023F(2,98) = 6.45
overall = 0.1873 max = 7between = 0.2520 avg = 6.3
R-sq: within = 0.1163 Obs per group: min = 3
Group variable: mjtf Number of groups = 19Fixed-effects (within) regression Number of obs = 119
rho .53223114 (fraction of variance due to u_i)sigma_e 56.713665sigma_u 60.495378
_cons -7669.066 5255.767 -1.46 0.145 -17970.18 2632.049year 3.861643 2.625125 1.47 0.141 -1.283509 9.006794
budget .2201054 .060246 3.65 0.000 .1020255 .3381853
arrests Coef. Std. Err. z P>|z| [95% Conf. Interval]
corr(u_i, X) = 0 (assumed) Prob > chi2 = 0.0001Random effects u_i ~ Gaussian Wald chi2(2) = 18.27
overall = 0.1891 max = 7between = 0.2536 avg = 6.3
R-sq: within = 0.1158 Obs per group: min = 3
Group variable: mjtf Number of groups = 19Random-effects GLS regression Number of obs = 119
Prob>chi2 = 0.6538= 0.85
chi2(2) = (b-B)'[(V_b-V_B)^(-1)](b-B)
Test: Ho: difference in coefficients not systematic
B = inconsistent under Ha, efficient under Ho; obtained from xtregb = consistent under Ho and Ha; obtained from xtreg
year 4.136974 3.861643 .2753316 .3048018budget .1971487 .2201054 -.0229567 .0346062
FE RE Difference S.E.(b) (B) (b-B) sqrt(diag(V_b-V_B))
Coefficients
The fixed-effect model now indicates that $1000 of expenditures increases arrests by about 0.20arrests. The random-effects model indicates that $1000 of expenditures increases arrests by about0.22. The Hausman test provides no evidence that would cause us to dismiss the random effect model
This document is a research report submitted to the U.S. Department of Justice. This report has not been published by the Department. Opinions or points of view expressed are those of the author(s) and do not necessarily reflect the official position or policies of the U.S. Department of Justice.

Abt Associates Inc. Chapter 4: Performance Monitoring: Practical Steps and Advanced Analysis 64
as being inappropriate, so we might conclude that an additional $1000 of expenditures increasesarrests by 0.10 to 0.34 arrests based on a 95 percent confidence interval.
Statisticians often worry about other assumptions that could lead to misleading inferences based onstatistical analysis. Dealing with these assumptions requires advanced knowledge of statisticalmodels applicable to panel data. We cannot cover those topics here, but we will consider one issue.Panel data almost always include data that are correlated across time, which is the reason whystatisticians use fixed-effect and random-effect models. But sometimes that correlations take on aspecific form including autocorrelation. Dealing with autocorrelation is straightforward in balancedpanels. Balanced panels have the same number of data points per MJTF. Our data are not balancedprincipally because of missing data patterns.
To introduce first-order autocorrelation (a common assumption about autocorrelation) into the model,use the statements:
xtreg arrests fte year,pa corr(ar 1) vce(robust);matrix list e(R)xtreg arrests fte year,pa corr(ar 1) vce(robust);matrix list e(R)
These statements introduce some new terms. First, pa substitute for fe and re. The option pa standsfor population averaged and is in fact a very different estimator than those considered earlier. Theterm corr(ar 1) presumes that there exists first-order serial correlation and requires the model toestimate a parameter describing that first-order serial correlation and correct for its presence. Thevce(robust) term corrects for other problems including clustering; those problems motivated the useof the fixed-effect and random-effect models in the first place. The command matrix list e(R)provides an estimate of the correlation across observations.
Output from these two models is reported below, first when the explanatory variable is full timeequivalents and second when the explanatory variable is budget. The notes appearing with the outputexplain that some MJTFs had to be eliminated from the data because the data were unbalanced. Inthis context, unbalanced means that the data skipped years, so Stata could not compute theautocorrelation coefficient. Consequently, these results do not just rest on a different statisticalmodel; they also rest on different data. Note that only 91 observations from 13 MJTFs entered thisanalysis.
This document is a research report submitted to the U.S. Department of Justice. This report has not been published by the Department. Opinions or points of view expressed are those of the author(s) and do not necessarily reflect the official position or policies of the U.S. Department of Justice.

Abt Associates Inc. Chapter 4: Performance Monitoring: Practical Steps and Advanced Analysis 65
r7 .04978559 .08208296 .1353326 .22312684 .36787579 .60652765 1r6 .08208296 .1353326 .22312684 .36787579 .60652765 1r5 .1353326 .22312684 .36787579 .60652765 1r4 .22312684 .36787579 .60652765 1r3 .36787579 .60652765 1r2 .60652765 1r1 1
c1 c2 c3 c4 c5 c6 c7symmetric e(R)[7,7]
. matrix list e(R);
_cons -5972.72 8318.953 -0.72 0.473 -22277.57 10332.13year 2.983045 4.1546 0.72 0.473 -5.159822 11.12591fte 19.72863 4.880275 4.04 0.000 10.16347 29.29379
arrests Coef. Std. Err. z P>|z| [95% Conf. Interval]
Scale parameter: 4303.807 Prob > chi2 = 0.0001Wald chi2(2) = 17.70
Correlation: AR(1) max = 7Family: Gaussian avg = 7.0Link: identity Obs per group: min = 7Group and time vars: mjtf year Number of groups = 13GEE population-averaged model Number of obs = 91
Iteration 4: tolerance = 8.174e-07Iteration 3: tolerance = .00005224Iteration 2: tolerance = .0033746Iteration 1: tolerance = .53818221
3 groups omitted from estimationnot possible to estimate correlations for those groups
note: some groups have fewer than 2 observations3 groups omitted from estimationmodal spacing is delta year = 1 unit
note: observations not equally spaced
r7 .09672024 .14275713 .21070665 .31099878 .45902794 .67751601 1r6 .14275713 .21070665 .31099878 .45902794 .67751601 1r5 .21070665 .31099878 .45902794 .67751601 1r4 .31099878 .45902794 .67751601 1r3 .45902794 .67751601 1r2 .67751601 1r1 1
c1 c2 c3 c4 c5 c6 c7symmetric e(R)[7,7]
. matrix list e(R);
_cons -9069.581 5712.346 -1.59 0.112 -20265.57 2126.411year 4.56819 2.857893 1.60 0.110 -1.033177 10.16956
budget .1152991 .0707715 1.63 0.103 -.0234105 .2540088
arrests Coef. Std. Err. z P>|z| [95% Conf. Interval]Semi-robust
(Std. Err. adjusted for clustering on mjtf)
Scale parameter: 5657.55 Prob > chi2 = 0.0344Wald chi2(2) = 6.74
Correlation: AR(1) max = 7Family: Gaussian avg = 7.0Link: identity Obs per group: min = 7Group and time vars: mjtf year Number of groups = 13GEE population-averaged model Number of obs = 91
Iteration 6: tolerance = 4.171e-07Iteration 5: tolerance = 6.777e-06Iteration 4: tolerance = .0001103Iteration 3: tolerance = .00179446Iteration 2: tolerance = .02921007Iteration 1: tolerance = .6283854
6 groups omitted from estimationmodal spacing is delta year = 1 unit
note: observations not equally spaced
This document is a research report submitted to the U.S. Department of Justice. This report has not been published by the Department. Opinions or points of view expressed are those of the author(s) and do not necessarily reflect the official position or policies of the U.S. Department of Justice.

Abt Associates Inc. Chapter 4: Performance Monitoring: Practical Steps and Advanced Analysis 66
From this analysis, it seems that the addition of a full time equivalent employee increases the numberof arrest from between 10.2 and 29.3 – the best estimate is nearly 20 arrests per full time equivalent.The autocorrelation structure appears to be material. The best estimate is that an additional $1000expenditure increases the number of arrests by about 0.12. The effect is not quite significant at 0.10in a two tailed test of significance. One might argue for using a one-tailed test of significance giventhat the direction of the effect seems predictable. Then the effect would be significant at 0.10 but notquite at 0.05.
One might employ still more sophisticated (and perhaps more compelling) statistical models, butthere are two caveats. Many more compelling models require longer time-series than are provided bythese data, so they may not be useful for these data, although they may be useful for future data.Second, the quality of these data – which undoubtedly include data that suffer from measurementerror – may preclude reaching strong conclusions.
This last caveat aside, we close this section with a summary analysis of the data. Table X presentsresults of how full time equivalents and budget separately affect four outcomes:
arrests opened cases prosecuted cases proportion prosecuted
Tables 4.2 to 4.4 report results for three models: fixed effect, random effect and population averagedwith first-order auto correlation. These are the three models described above.
The tables are organized according to state: Tennessee, Illinois and Colorado. Georgia could notprovide comparable data. For each state, the tables are divided into the two input measures: full timeequivalent employees and MJTF budget. For each state/input the tables are divided into four outcomemeasures: arrests, cases opened, prosecutions and proportion of cases that were dropped withoutprosecution. The columns report the parameter estimate for the regression of the outcome onFTE/budget and year. A P-value for a two-tailed test of significance appears below the parameterestimate. Readers who prefer a one-tailed test based on a prior belief about the direction of causationfrom inputs and outputs can divide the P-values by two.
Evaluators will often impose a penalty for when making multiple comparisons. When a table reportsparameter estimates for multiple analyses (Ninety-six tests in the tables), some would be statisticallysignificant by chance, so researchers adjust the P-values to accommodate that bias. We have not donethat.
Readers can draw their own conclusions, but to summarize our conclusions: In Tennessee, theevidence is compelling that the number of cases, arrests and prosecutions increases with the numberof MJTF full time equivalent staff. The evidence is less compelling – but still appreciable – thatcases, arrests and prosecutions increase with budgets. There is no evidence that the proportion ofdropped cases increases or falls with either budget or full time equivalent employees.
This document is a research report submitted to the U.S. Department of Justice. This report has not been published by the Department. Opinions or points of view expressed are those of the author(s) and do not necessarily reflect the official position or policies of the U.S. Department of Justice.

Abt Associates Inc. Chapter 4: Performance Monitoring: Practical Steps and Advanced Analysis 67
The conclusions are similar in Illinois. However, in Illinois, the fixed-effect model seems to provideno evidence that either full time equivalent employees or task force budgets increase outputs. Thismay be because the inputs do not vary much over time within each task force, but the evidence is tothe contrary as the number of full time equivalent employees was constant in only one task force.The random effect model does point toward improved outcomes based on expanded resources. Ofcourse, this may be because the random effect model is misspecified. This is possible because we seethat the Hausman test calls into question the bias/consistency of the random effect model.
Results from Colorado are very similar to the results from Tennessee provided we examine how fulltime equivalents affect outcomes. The Hausman test suggests that the findings from the randomeffect model are inconsistent, but nevertheless, there is little substantive difference between thefindings from the fixed-effect and random-effect models. In contrast there is no evidence thatbudgets have a large impact on outcomes.
Table 4.2
Results from Estimating the Fixed-Effect and Random-Effect Models in Tennessee
Parameter Estimates and P-Values for Two-Tailed Tests
Fixed-EffectModel
Random-Effect Model
P-Value for theHausman test
PopulationAveragedModel
TennesseeFTE
Arrests 8.24 15.10 0.029 19.730.201 0.006 0.000
Opened 15.81 22.72 0.256 13.790.029 0.000 0.052
Prosecuted 14.05 18.91 0.077 14.560.020 0.000 0.011
Dropped -0.01 -0.01 0.147 0.000.346 0.273 0.759
BudgetArrests 0.20 0.22 0.654 0.12
0.000 0.000 0.103Opened 0.30 0.31 0.333 0.15
0.000 0.000 0.162Prosecuted 0.17 0.21 0.448 0.18
0.059 0.017 0.193Dropped 0.00 0.00 0.408 0.00
0.614 0.446 0.002
This document is a research report submitted to the U.S. Department of Justice. This report has not been published by the Department. Opinions or points of view expressed are those of the author(s) and do not necessarily reflect the official position or policies of the U.S. Department of Justice.
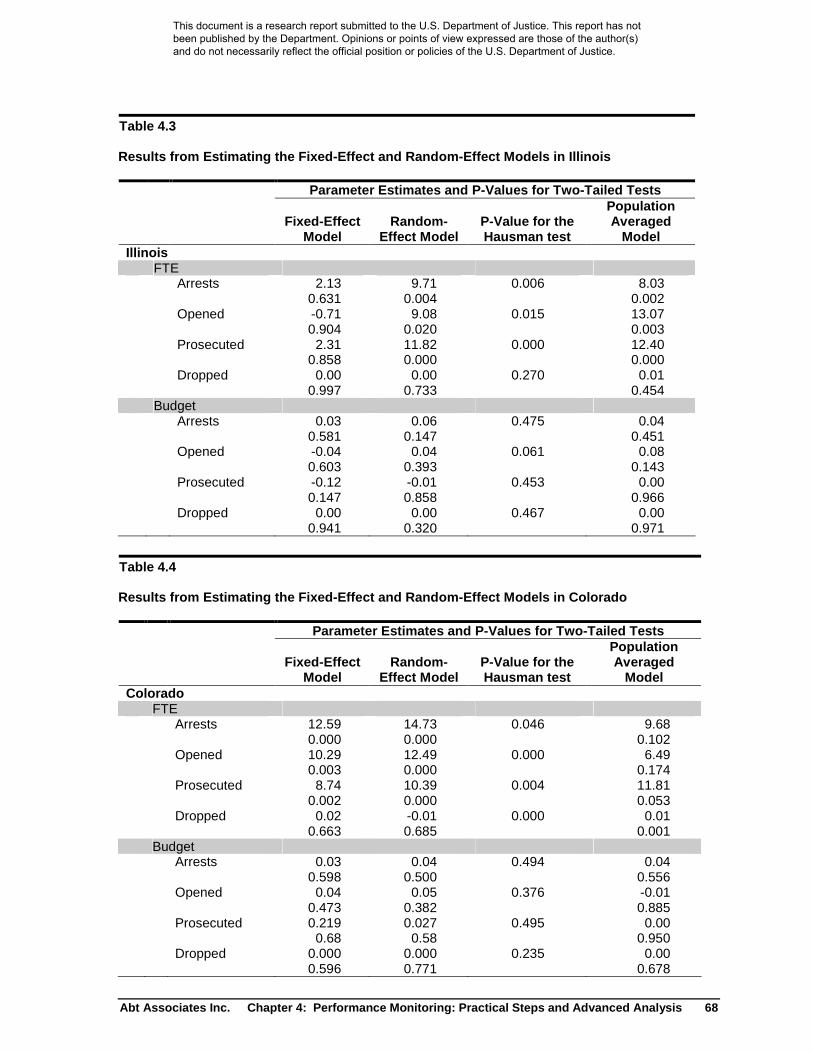
Abt Associates Inc. Chapter 4: Performance Monitoring: Practical Steps and Advanced Analysis 68
Table 4.3
Results from Estimating the Fixed-Effect and Random-Effect Models in Illinois
Parameter Estimates and P-Values for Two-Tailed Tests
Fixed-EffectModel
Random-Effect Model
P-Value for theHausman test
PopulationAveraged
ModelIllinois
FTEArrests 2.13 9.71 0.006 8.03
0.631 0.004 0.002Opened -0.71 9.08 0.015 13.07
0.904 0.020 0.003Prosecuted 2.31 11.82 0.000 12.40
0.858 0.000 0.000Dropped 0.00 0.00 0.270 0.01
0.997 0.733 0.454Budget
Arrests 0.03 0.06 0.475 0.040.581 0.147 0.451
Opened -0.04 0.04 0.061 0.080.603 0.393 0.143
Prosecuted -0.12 -0.01 0.453 0.000.147 0.858 0.966
Dropped 0.00 0.00 0.467 0.000.941 0.320 0.971
Table 4.4
Results from Estimating the Fixed-Effect and Random-Effect Models in Colorado
Parameter Estimates and P-Values for Two-Tailed Tests
Fixed-EffectModel
Random-Effect Model
P-Value for theHausman test
PopulationAveraged
ModelColorado
FTEArrests 12.59 14.73 0.046 9.68
0.000 0.000 0.102Opened 10.29 12.49 0.000 6.49
0.003 0.000 0.174Prosecuted 8.74 10.39 0.004 11.81
0.002 0.000 0.053Dropped 0.02 -0.01 0.000 0.01
0.663 0.685 0.001Budget
Arrests 0.03 0.04 0.494 0.040.598 0.500 0.556
Opened 0.04 0.05 0.376 -0.010.473 0.382 0.885
Prosecuted 0.219 0.027 0.495 0.000.68 0.58 0.950
Dropped 0.000 0.000 0.235 0.000.596 0.771 0.678
This document is a research report submitted to the U.S. Department of Justice. This report has not been published by the Department. Opinions or points of view expressed are those of the author(s) and do not necessarily reflect the official position or policies of the U.S. Department of Justice.

Abt Associates Inc. Chapter 4: Performance Monitoring: Practical Steps and Advanced Analysis 69
One interpretation is that MJTFs had their expected effect on outputs. They seem to have caused anincrease in cases, arrests and prosecutions. There is no evidence that MJTFs lead to a higherproportion of prosecutions per case. We might have expected this outcome without statisticalanalysis, although without some formal analysis, we could not have quantified that effect. A readermust be cautious. Data assembly was complicated and costly, and likely these data include anunquantifiable amount of measurement error.
This document is a research report submitted to the U.S. Department of Justice. This report has not been published by the Department. Opinions or points of view expressed are those of the author(s) and do not necessarily reflect the official position or policies of the U.S. Department of Justice.

Abt Associates Inc. Conclusion 70
Conclusion
The goal of this guide is to provide a template that BJA and state agencies might follow to developperformance monitoring systems. A well-developed performance monitoring system will allow stateand federal agencies to hold MJTFs accountable for how grant funds are used and to provide solidevidence of their activities and effectiveness. Programs unable to provide this kind of evidence are atrisk of having their resources cut or diverted to other programs that can better demonstrate success.
For states without existing performance monitoring systems, the guide provides a thoughtful approachto building a system that supports public decision making. By starting with a logic model thatrepresents the goals, resources, activities, outputs, outcomes, and impacts of the MJTFs in the stateand building a performance measurement component that is developed from the model data reportingtemplate, the SAA can be confident that the resulting performance monitoring system will providesufficient data to monitor and measure performance.
SAAs with existing performance monitoring systems can also benefit from this guide. Existingsystems can always benefit from review, and this guide supports that process by promoting the use oflogic models to assess MJTF goals, resources, activities, outputs, outcomes and impacts to ensureperformance measures are appropriate for tracking and measuring MJTF performance. The modeldata reporting template may also provide additional measures not previously collected by the SAA ora different way to collect information previously of interest to the SAA. The model analysis plan canhelp SAAs identify new ways of analyzing data that would be more useful to public decision makers.
Whether the state is establishing a new system or improving upon an existing performancemonitoring system, the guidance on advanced statistical analysis may assist the SAA in conductingtheir own analysis or to better instruct consultants trained in social science statistics.
To summarize, the guide has broad application to multiple audiences that may or may not haveexperience with performance monitoring. Promoting accountability among MJTFs is critical toensuring continued support for this important first line of defense in reducing the availability ofillegal drugs on American streets.
This document is a research report submitted to the U.S. Department of Justice. This report has not been published by the Department. Opinions or points of view expressed are those of the author(s) and do not necessarily reflect the official position or policies of the U.S. Department of Justice.
Abt Associates Inc. Appendix 1: References A1-1
Appendix 1: References
Baltagi, B. (2005) Econometric Analysis of Panel Data, John Wiley & Sons, 3rd Edition.
Greene, W. (2008) Econometric Analysis, Prentice Hall, 6th Edition.
Heckman, J. and Leamer, E. (2007) Handbook of Econometrics Volume 6B, North-Holland Press,Amsterdam.
King, G., Honaker, J., Joseph, A. and Scheve, K. (2001) Analyzing Incomplete Political ScienceData: An Algorithm for Multiple Imputations, American Political Science Review, Vol.95(1).
Morgan, S. and Winship, C. (2007) Counterfactuals and Causal Inference: Methods and Principalsfor Social Research. Cambridge University Press.
Rosenbaum, P. (2002) Observational Studies, 2nd ed. Springer-Verlag.
Schafer, J. (1997) Analysis of Incomplete Multivariate Data, Chapman and Hall.
Wooldridge, J. (2002) Econometric Analysis of Cross Section and Panel Data. The MIT Press.Cambridge, MA.
This document is a research report submitted to the U.S. Department of Justice. This report has not been published by the Department. Opinions or points of view expressed are those of the author(s) and do not necessarily reflect the official position or policies of the U.S. Department of Justice.

Abt Associates Inc. Appendix 2: Performance Measurement Template A2-1
Appendix 2: Performance Measurement Template
This document is a research report submitted to the U.S. Department of Justice. This report has not been published by the Department. Opinions or points of view expressed are those of the author(s) and do not necessarily reflect the official position or policies of the U.S. Department of Justice.

Abt Associates Inc. Appendix 2: Performance Measurement Template A2-1
MJTF Performance Monitoring Tool
Definitions
Partner Agencies: Those agencies who participate as members of the Task Force in Memoranda ofUnderstanding or Interagency Agreements and/or have assigned staff to the Task Force.
Average FTEs: Comprises all sworn MJTF staff (e.g., police officers, sheriff’s deputies, investigators)and non-sworn MJTF staff who provide substantive support to field operations and investigations (e.g.,crime analysts, intelligence analysts). Administrative assistants and clerical staff are excluded. It includesTask Force staff who are funded by BJA, other grant, through agency budgets, or serve on the Task Forceas matching or in-kind contributions. This should be reported in terms of full-time equivalents (i.e., 1full-time person = 1 FTE; 1 full-time person and 1 half-time person = 1.5 FTEs). Since staffing canfluctuate over time, please update any changes to the average FTEs each reporting period.
Task Force Annual Budget: This should include a breakdown of all funds and contributions made to theTask Force for that fiscal year. Therefore, federal funds include BJA/JAG funding as well as any otherfederal funds used to support Task Force operations. State, local, and/or tribal funds should include anycontributions made by any of these sources. Task Force revenue should include any planned revenue fromforfeiture proceeds, fines, or any other sources of income used to support the Task Force. In-kindcontributions (personnel, cruiser, Task Force office space, etc.) are also captured, which should includepersonnel loaned to the Task Force from a law enforcement agency partner.
Total Arrests: Total number of arrests conducted by the Task Force (one body equals one arrest).Information should be reported by the most serious charge that applies at the time, using the followingbroad categories: felony/misdemeanor, and possession/delivery of controlled substance (i.e., allsubstances that are federally regulated). Therefore, each arrest will fall in either felony possession ofcontrolled substance, felony delivery of controlled substance and so on. Although statutory definitionsand terminology will differ from state to state, the delivery category should include any charge other thansimple possession, including: distribution, manufacture, conspiracy and possession with intent to deliver.Similarly, the controlled substance category should include all controlled substances, including cannabis.
Gang: An ongoing organization, association, or group of three or more persons that have a commoninterest and/or activity characterized by the commission of or involvement in a pattern of criminal ordelinquent conduct. (NCIC).
Drug Seizure Amounts and Units: The total amount of each type of drug (marijuana, cocaine, crack,heroin/opiates, methamphetamine, and other drugs) seized by the Task Force. This is a sum of theamount of each drug seized reported in each Task Force's quarterly report. For each drug type listed,please record based on the units provided. If you have drugs reported in other metrics, use the followingto convert them: 1kg=1000g; 1kg=2.2lbs; 1kg=35.2oz; 1lb=16oz; and 1lb=453.6g. For Task Forcesseizing other types of drugs (e.g., ecstasy, LSD, prescription drugs), space is included to identify fouradditional drugs for which the greatest amount was seized, and to provide the amounts and units ofmeasurement for each.
National Integrated Ballistic Information Network (NIBIN): An intelligence tool provided by the ATFthat deploys Integrated Ballistic Identification System (IBIS) equipment into federal, state and local law
This document is a research report submitted to the U.S. Department of Justice. This report has not been published by the Department. Opinions or points of view expressed are those of the author(s) and do not necessarily reflect the official position or policies of the U.S. Department of Justice.

Abt Associates Inc. Appendix 2: Performance Measurement Template A2-2
enforcement agencies for their use in imaging and comparing crime gun evidence. IBIS equipment is usedto compare firearm related evidence to identify possible links to a crime investigation. (ATF)
Disrupted: Impeding the normal and effective operation of the targeted organization, as indicated bychanges in organizational leadership and/or changes in methods of operation, including, for example,financing, trafficking patterns, communications, or drug production. (HIDTA)
Dismantled: Destruction of the organization’s leadership, financial base, and supply network suchthat the organization is incapable of operating and/or reconstituting itself. (HIDTA)
Drug Trafficking Organization (DTO): An organization consisting of five or more persons that (1)has a clearly defined hierarchy or chain of command and (2) whose principal activity is to generateincome or acquire assets through continuing illegal drug production, manufacturing, importation, ordistribution activities. (Please note: a hierarchy or chain of command can be as minimal as onerecognized leader for all the participants. At least one recognized leader must be present to constitutean organization). (ONDCP)
Total Length of Prison Sentence: The mid-point between the minimum and maximum sentence for eachdefendant. For example, a sentence of five to fifteen years would be ten years. For defendants whoreceive a life sentence, assume life equals 25 years.
This document is a research report submitted to the U.S. Department of Justice. This report has not been published by the Department. Opinions or points of view expressed are those of the author(s) and do not necessarily reflect the official position or policies of the U.S. Department of Justice.

Abt Associates Inc. Appendix 2: Performance Measurement Template A2-3
Reporting Cycle: [Note: This will be pre-filled for respondents.]
Start Date: End Date:
A. Task Force Characteristics(Please complete the following items or update as necessary.)
[Note: This will be reported initially and updated as needed, but at a minimum annually. This applies tosections A-C.]
A.1 Date completed:
A.2 Task Force name:
A.3 Task Force jurisdiction (list state and/or all counties/judicial districts covered by the Task Force):
A.4 Partnering agencies (please list the names of each partner agency):
a. Federal law enforcement agencies:
b. State law enforcement agencies:
c. Local law enforcement agencies
This document is a research report submitted to the U.S. Department of Justice. This report has not been published by the Department. Opinions or points of view expressed are those of the author(s) and do not necessarily reflect the official position or policies of the U.S. Department of Justice.

Abt Associates Inc. Appendix 2: Performance Measurement Template A2-4
d. Tribal law enforcement agencies:
e. Other non-law enforcement agencies (e.g., District Attorney’s Office):
A5. a. Please rank the priority that your Task Force has given to interdicting the following drug types duringthe reporting period. (1=highest priority, the others in descending order):
Rank:
_____ Marijuana
_____ Crack Cocaine
_____ Powder Cocaine
_____ Heroin/Opiates
_____ Methamphetamine
b. Please rank the priority that your Task Force has given to the following issues during the reportingperiod (1=highest priority, the others in descending order):
Rank:
_____ Disrupting organized crime drug trafficking networks
_____ Disrupting street-level drug dealers
_____ Highway interdiction
_____ Public education/outreach
_____ Violent crime
_____ Other (Please list:)
A.6 Full-time equivalent (FTE) Task Force staff assigned to the Task Force:
a. Average number of federal law enforcement ................................................................_____
b. Average number of state law enforcement ......................................................................................_____
c. Average number of local law enforcement......................................................................................_____
d. Average number of tribal law enforcement ....................................................................................._____
e. Average number of other non-law enforcement (e.g., prosecutor, crime analyst) .........................._____
This document is a research report submitted to the U.S. Department of Justice. This report has not been published by the Department. Opinions or points of view expressed are those of the author(s) and do not necessarily reflect the official position or policies of the U.S. Department of Justice.

Abt Associates Inc. Appendix 2: Performance Measurement Template A2-5
B. Task Force Annual Budget Information(Please complete the following items or update as necessary.)
B1. Please report a breakdown of your Task Force’s annual budget for the current fiscal year, separatingpersonnel from other costs.
Federal funds
State, local and/ortribal funds (including
local match)
Task Force revenue(e.g., fines,forfeitures)
a. Personnel $_______________ $_______________ $_______________
b. Non-personnel (e.g. equipment,supplies, office space, technology,and other non-personnel costs)
$_______________ $_______________ $_______________
B.2 Specify any in-kind contributions expected or made during the current fiscal year (check all that apply).
Personnel
Technology
Equipment
Supplies
Other (please specify:)
This document is a research report submitted to the U.S. Department of Justice. This report has not been published by the Department. Opinions or points of view expressed are those of the author(s) and do not necessarily reflect the official position or policies of the U.S. Department of Justice.

Abt Associates Inc. Appendix 2: Performance Measurement Template A2-6
C. Task Force Structure and Operations(Please complete the following items for the current fiscal year or update information as necessary.)
C.1 The Task Force has (check all that apply):
A fully executed (i.e., current and signed) written Interagency Agreement or Memorandum ofUnderstanding.
A Task Force Policy Board (i.e., official board of law enforcement executives that overseeformulation and adherence to policies and operating procedures).
If you have a Task Force Policy Board, how often does the policy board meet? (Check all thatapply.)
Annually Quarterly Monthly As needed
C.2 The Task Force has written protocols that include any of the following (check all that apply):
Task Force chain of command
Task Force mission statement
Task Force goals and objectives
Policies and procedures
If you have written policies and procedures, do they include any of the following? (Check allthat apply.)
Standard Operating Procedures for agents A policy for targeting and approving cases A policy for information referrals Other
C3. How has this documentation been communicated to Task Force members? (check all that apply)
Share with Task Force personnel
Task Force training
Require Task Force personnel to sign copy
Share with partner agencies
Require partner agencies to sign
None of the above
C.4 The Task Force has a physical space designated to the Task Force. (Check if yes.) ............................
C.5 The Task Force has a prosecutor assigned to work with the Task Force. (Check if yes.) ....................
This document is a research report submitted to the U.S. Department of Justice. This report has not been published by the Department. Opinions or points of view expressed are those of the author(s) and do not necessarily reflect the official position or policies of the U.S. Department of Justice.

Abt Associates Inc. Appendix 2: Performance Measurement Template A2-7
C.6 The Task Force has access to the following criminal intelligence support systems (check all that apply):
State level (e.g., Pennsylvania Justice Network)
Regional level (e.g., RISS)
National (e.g., Homeland Security Information Network)
Other
C.7 The Task Force utilizes the results from its local annual threat assessment to setpriorities. (Check if yes.).......................................................................................................................
C.8 The Task Force has a deconfliction system (i.e., a system to identify whether a TaskForce investigation conflicts with another agency's investigation). (Check if yes.) .............................
If the Task Force has a deconfliction system, indicate the number of times duringthis reporting period the deconfliction system identified that a Task Forceinvestigation conflicted with another agency's investigation:........................................................_____
This document is a research report submitted to the U.S. Department of Justice. This report has not been published by the Department. Opinions or points of view expressed are those of the author(s) and do not necessarily reflect the official position or policies of the U.S. Department of Justice.

Abt Associates Inc. Appendix 2: Performance Measurement Template A2-8
D. Task Force Activities(Please complete the following items for the current reporting period.)
[Note: Sections D and E would be reported periodically.]
Information and Intelligence Sharing
D.1 Number of submissions to the following databases:
a. State intelligence database (e.g., Pennsylvania Justice Network ..............................................................._________
b. Regional intelligence database (e.g., Citizen and Law Enforcement Analysis andReporting–CLEAR) ................................................................................................................................_________
c. National intelligence database (e.g., Homeland Security Information Network) ................................_________
D.2 Number of counterterrorism referrals to other agencies (e.g., Joint Terrorism Task Force) ....................._________
D.3 Number of drug-endangered child referrals to appropriate child protective services agencies ................._________
D.4 Number of tips/leads referred to other agencies (other than counterterrorism or childprotective) .................................................................................................................................................._________
Education and Awareness
D.5 Number of specialized training programs received by Task Force personnel (e.g., investigationtechniques, undercover operations, clandestine lab identification, drug interdiction)..............................._________
a. Number of participants trained................................................................................................_________
D.6 Number of community prevention/awareness trainings conducted (e.g., clandestine labidentification)............................................................................................................................................._________
a. Number of participants trained................................................................................................_________
D.7 Number of training programs provided by Task Force personnel to other law enforcementpersonnel...................................................................................................................................................._________
a. Number of participants trained................................................................................................_________
Investigation Activity Initiated by Task Force Personnel
D.8 Investigation activity:
a. Number of new investigations opened ................................................................................................_________
b. Number of investigations closed ................................................................................................_________
c. Number of investigations dropped (i.e., not resulting in arrest)................................................................_________
d. Number of investigations pending ................................................................................................_________
D.9 Number of search warrants served:
a. Federal........................................................................................................................................................_________
b. State............................................................................................................................................................_________
This document is a research report submitted to the U.S. Department of Justice. This report has not been published by the Department. Opinions or points of view expressed are those of the author(s) and do not necessarily reflect the official position or policies of the U.S. Department of Justice.

Abt Associates Inc. Appendix 2: Performance Measurement Template A2-9
D.10a Number of individuals arrested for:
a. Felony possession of controlled substance................................................................................................_________
b. Felony delivery of controlled substance................................................................................................_________
c. Misdemeanor possession of controlled substance......................................................................................_________
d. Misdemeanor delivery of controlled substance.........................................................................................._________
D.10b Of the individuals arrested (from D10 above), how many are documented criminal gangmembers? ..................................................................................................................................................._________
Of those who are documented criminal gang members, how many were arrested for:
a. Felony possession of controlled substance................................................................................................_________
b. Felony delivery of controlled substance................................................................................................_________
c. Misdemeanor possession of controlled substance......................................................................................_________
d. Misdemeanor delivery of controlled substance.........................................................................................._________
Seizures and Forfeitures Initiated by Task Force Personnel
Drug Seizures
D.11 Drug seizure amount and units by drug: (For each type of drug, please indicate the totalamount of drugs seized by your Task Force during the previous fiscal year. If applicable,please list four "other" drugs for which the greatest amount was seized each year, and providethe amounts and units of measurement for each.)
Drug Amount Unit
Marijuana Amount = ______________ pounds
Powder Cocaine Amount = ______________ ounces
Crack Cocaine Amount = ______________ grams
Heroin/Opiates Amount = ______________ grams
Methamphetamine Amount = ______________ grams
Other: Amount = ______________ Unit = _______________
Amount = ______________ Unit = _______________
Amount = ______________ Unit = _______________
Amount = ______________ Unit = _______________
Amount = ______________ Unit = _______________
D.12 Number of methamphetamine labs seized ................................................................................................_________
D.13 Number of cultivated marijuana plants seized..........................................................................................._________
D.14 Number of cannabis-growing operations dismantled ................................................................................_________
This document is a research report submitted to the U.S. Department of Justice. This report has not been published by the Department. Opinions or points of view expressed are those of the author(s) and do not necessarily reflect the official position or policies of the U.S. Department of Justice.

Abt Associates Inc. Appendix 2: Performance Measurement Template A2-10
Drug Seizures
D.15 Number of firearms seized........................................................................................................................._________
a. Number of firearms seized that were reported to NIBIN................................................................_________
b. Number of hits in NIBIN ..........................................................................................................................._________
Property Seizures and Forfeitures
D.16 Value of assets seized:
a. Real property (e.g., house, business)................................................................................................$_____________
b. Cash................................................................................................................................$_____________
c. Other (e.g., vehicles, jewelry) ................................................................................................$_____________
D.17 Number of forfeiture cases filed:
a. Federal........................................................................................................................................................_________
b. State............................................................................................................................................................_________
D.18 Value of assets forfeited:
a. Real property (e.g., house, business)................................................................................................$_____________
b. Cash................................................................................................................................$_____________
c. Other (e.g., vehicles, jewelry) ................................................................................................$_____________
Other
D.19 Number of hazardous sites (i.e., methamphetamine labs) identified ........................................................._________
D.20 Number of hazardous sites (i.e., methamphetamine labs) cleaned ............................................................_________
D.21 Number of disrupted drug trafficking organizations.................................................................................._________
D.22 Number of dismantled drug trafficking organizations..............................................................................._________
This document is a research report submitted to the U.S. Department of Justice. This report has not been published by the Department. Opinions or points of view expressed are those of the author(s) and do not necessarily reflect the official position or policies of the U.S. Department of Justice.
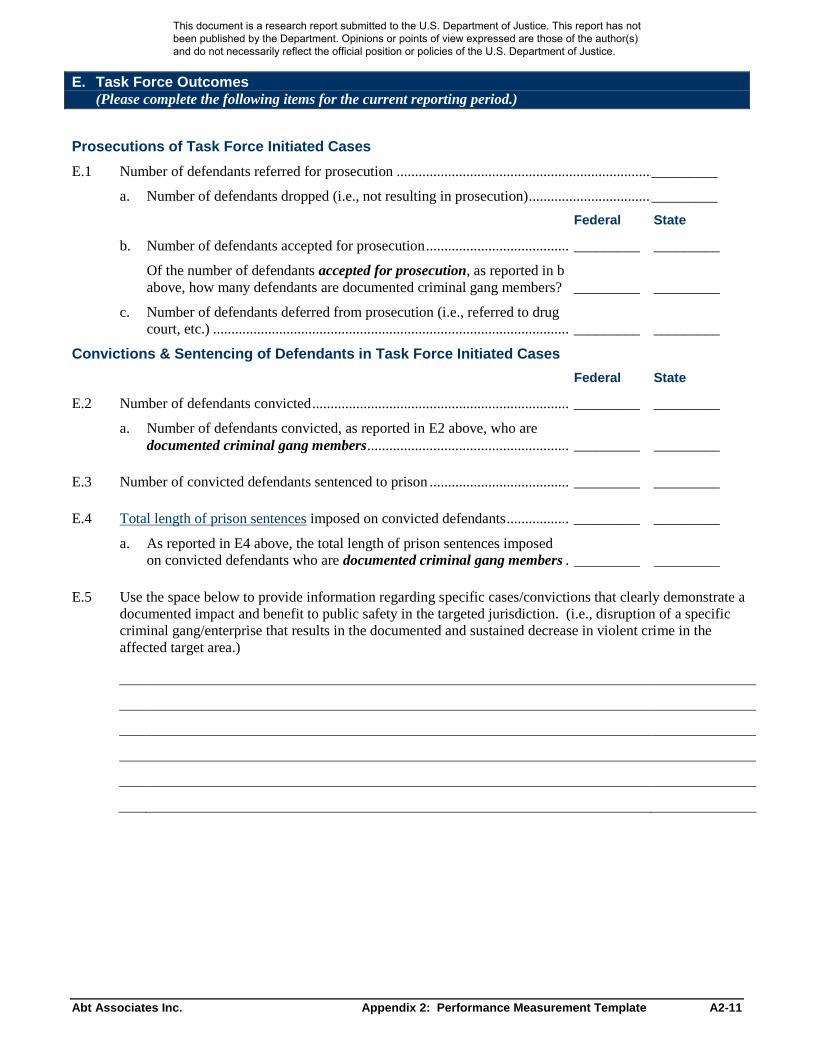
Abt Associates Inc. Appendix 2: Performance Measurement Template A2-11
E. Task Force Outcomes(Please complete the following items for the current reporting period.)
Prosecutions of Task Force Initiated Cases
E.1 Number of defendants referred for prosecution ........................................................................................_________
a. Number of defendants dropped (i.e., not resulting in prosecution)............................................................_________
Federal State
b. Number of defendants accepted for prosecution................................................................_________ _________
Of the number of defendants accepted for prosecution, as reported in babove, how many defendants are documented criminal gang members? _________ _________
c. Number of defendants deferred from prosecution (i.e., referred to drugcourt, etc.) ................................................................................................................................_________ _________
Convictions & Sentencing of Defendants in Task Force Initiated Cases
Federal State
E.2 Number of defendants convicted................................................................................................_________ _________
a. Number of defendants convicted, as reported in E2 above, who aredocumented criminal gang members................................................................_________ _________
E.3 Number of convicted defendants sentenced to prison ................................................................_________ _________
E.4 Total length of prison sentences imposed on convicted defendants................................_________ _________
a. As reported in E4 above, the total length of prison sentences imposedon convicted defendants who are documented criminal gang members ................................_________ _________
E.5 Use the space below to provide information regarding specific cases/convictions that clearly demonstrate adocumented impact and benefit to public safety in the targeted jurisdiction. (i.e., disruption of a specificcriminal gang/enterprise that results in the documented and sustained decrease in violent crime in theaffected target area.)
This document is a research report submitted to the U.S. Department of Justice. This report has not been published by the Department. Opinions or points of view expressed are those of the author(s) and do not necessarily reflect the official position or policies of the U.S. Department of Justice.

Abt Associates Inc. Appendix 3: Analysis Worksheet A3-1
Appendix 3: Analysis Worksheet
Attached.
This document is a research report submitted to the U.S. Department of Justice. This report has not been published by the Department. Opinions or points of view expressed are those of the author(s) and do not necessarily reflect the official position or policies of the U.S. Department of Justice.