Evaluation of the groundwater resources in the Geba basin, Ethiopia
14
1 Evaluation of the groundwater resources in the Geba basin, Ethiopia Kibrewossen Tesfagiorgis 1,2 , Tesfamichael Gebreyohannes 1,3 , Florimond De Smedt 1 , Jan Moeyersons 4 , Miruts Hagos 3 , Jan Nyssen 5 , and Jozef Deckers 6 1 Department of Hydrology and Hydraulic Engineering, Vrije Universiteit Brussel, Pleinlaan 2, 1050 Brussels, Belgium. 2 NOAA-CREST Center, City College of New York, T-107 Steinman Hall, 140th St & Convent Ave, New York, NY 10031, USA. 3 Mekelle University, PO Box 231, Mekelle, Ethiopia 4 Royal Museum for Central Africa, B-3080 Tervuren, Belgium 5 Department of Geography, Ghent University, Krijgslaan 281-S8, B-9000 Gent, Belgium 6 Department of Earth and Environmental Sciences, Division for Land and Water Management, KU Leuven, Celestijnenlaan 200E, B-3001 Leuven, Belgium Corresponding author’s email: [email protected] Abstract This paper presents an assessment of the groundwater resources in the Geba basin, Ethiopia. Hydrogeological characteristics are derived from a combination of GIS and field survey data. MODFLOW groundwater model in PMWIN environment is used to simulate the movement and distribution of groundwater in the basin. Despite the limited data available, by simplifying the model as a single layered semi-confined groundwater system and by optimising the transmissivity of the different lithological units, a realistic description of the groundwater flow is obtained. It is concluded that 30,000 m 3 /d of groundwater can be abstracted in the Geba basin for irrigation in a sustainable way, in locations characterised by shallow groundwater in combination with aquitard type lithological units. Keywords: Groundwater modelling, Transmissivity, Geba basin, Ethiopia Kibrewossen Tesfagiorgis, Tesfamichael Gebreyohannes, De Smedt, F., Moeyersons, J., Miruts Hagos, Nyssen, J.,, Deckers, J., 2011. Evaluation of groundwater resources in the Geba basin, Ethiopia. Bulletin of Engineering Geology and the Environment, 70: 461–466.
Transcript of Evaluation of the groundwater resources in the Geba basin, Ethiopia

1
Evaluation of the groundwater resources in the Geba basin, Ethiopia
Kibrewossen Tesfagiorgis1,2
, Tesfamichael Gebreyohannes1,3
, Florimond De
Smedt1, Jan Moeyersons
4, Miruts Hagos
3, Jan Nyssen
5, and Jozef Deckers
6
1 Department of Hydrology and Hydraulic Engineering, Vrije Universiteit
Brussel, Pleinlaan 2, 1050 Brussels, Belgium.
2 NOAA-CREST Center, City College of New York, T-107 Steinman Hall, 140th St
& Convent Ave, New York, NY 10031, USA.
3 Mekelle University, PO Box 231, Mekelle, Ethiopia
4 Royal Museum for Central Africa, B-3080 Tervuren, Belgium
5 Department of Geography, Ghent University, Krijgslaan 281-S8, B-9000 Gent,
Belgium
6 Department of Earth and Environmental Sciences, Division for Land and Water
Management, KU Leuven, Celestijnenlaan 200E, B-3001 Leuven, Belgium
Corresponding author’s email: [email protected]
Abstract
This paper presents an assessment of the groundwater resources in the Geba basin, Ethiopia.
Hydrogeological characteristics are derived from a combination of GIS and field survey data.
MODFLOW groundwater model in PMWIN environment is used to simulate the movement and
distribution of groundwater in the basin. Despite the limited data available, by simplifying the
model as a single layered semi-confined groundwater system and by optimising the transmissivity
of the different lithological units, a realistic description of the groundwater flow is obtained. It is
concluded that 30,000 m3/d of groundwater can be abstracted in the Geba basin for irrigation in a
sustainable way, in locations characterised by shallow groundwater in combination with aquitard
type lithological units.
Keywords: Groundwater modelling, Transmissivity, Geba basin, Ethiopia
Kibrewossen Tesfagiorgis, Tesfamichael Gebreyohannes, De Smedt, F.,
Moeyersons, J., Miruts Hagos, Nyssen, J.,, Deckers, J., 2011. Evaluation of
groundwater resources in the Geba basin, Ethiopia. Bulletin of Engineering
Geology and the Environment, 70: 461–466.

2
Introduction
Rainfall in Ethiopia is varying highly and erratic in time and space (Yazew 2005).
As a consequence, precipitation is generally insufficient to sustain the agriculture
needed to alleviate food insecurity, and it becomes very important to develop and
manage all other available water resources. Groundwater is one of the renewable
water resources that can be exploited in a sustainable way to help rural
communities in terms of clean domestic water and irrigation.
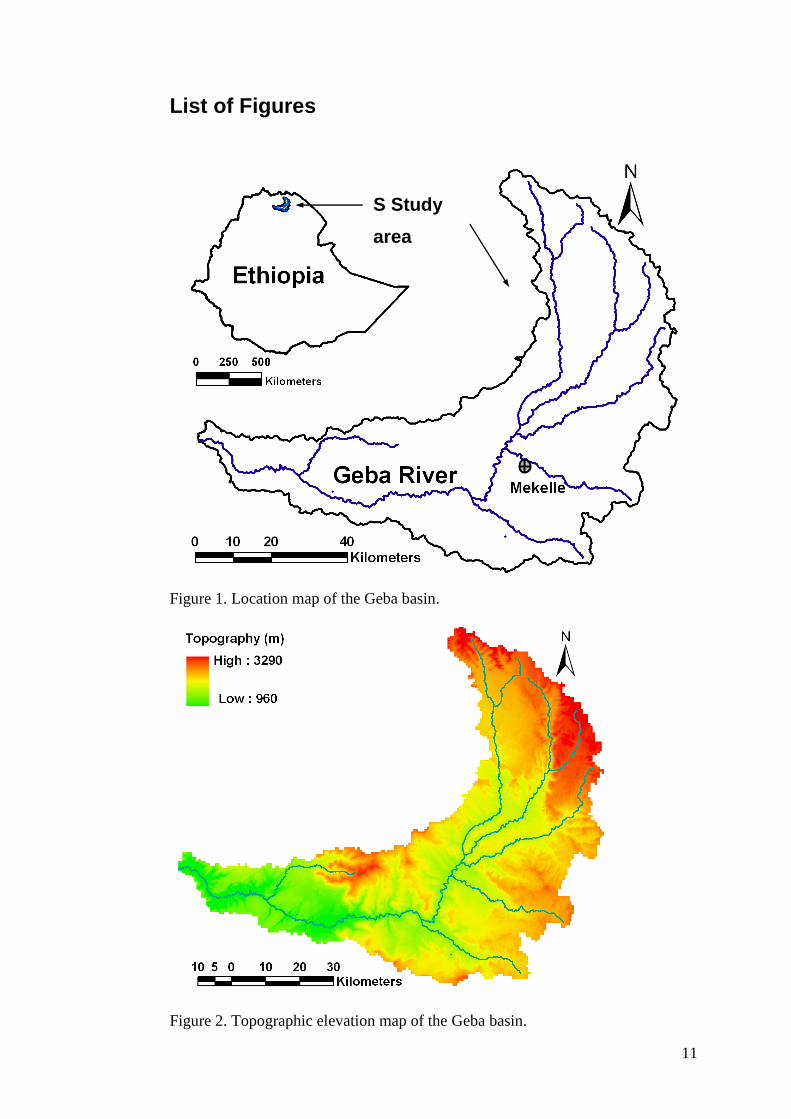
This paper discusses the groundwater potential of the Geba basin (Fig. 1), Tigray
region, northern Ethiopia. The Geba river basin is about 5,150 km2, and forms
part of the Tekeze-Atbara river basin, a tributary of the Blue Nile. The main
economy of the area is agriculture, which accounts for more than 40% of the GDP
and 80% of the labour force. Water is most crucial to support and sustain crop
growth, and irrigation is often required (Leul 1994; Gemechu 2006). Hence,
assessing the location and potential of additional resources as groundwater is
essential. However, lack of long-term meteorological, hydrological, and hydraulic
data in the basin makes accurate assessment of groundwater resources a difficult
challenge.
Some groundwater investigations have been undertaken in the Geba basin by
federal and regional authorities, local NGOs, or university departments. Chernet
and Eshete (1982) performed some hydrogeological mapping around Mekelle
(Fig. 1), the regional capital of Tigray. DEVECON (1992) investigated the water
resources potential of the Mekelle area as part of the Five Towns Water Supply
and Sanitation project of the Ministry of Water Resources of Ethiopia. Studies
undertaken by local NGOs and the regional government for irrigation purposes
have been conducted by REST (1996) and COSAERT (2001). NEDECO (1997)
investigated the Tekeze river basin and described the water resources potential by
borehole drilling of up to 300 m deep at several places in the Mekelle area.
Hussein (2000) investigated the hydrogeology of the Aynalem well field, which
supplies Mekelle with potable water. Gebregziabher (2003) used geophysical
techniques as seismic refraction and magnetic and electrical profiling to
investigate the hydrogeology of the Aynalem basin. WWDSE (2006) performed
some hydro-meteorological, geological, and hydrogeological investigations
around Mekelle, supplemented by a quasi-three dimensional groundwater flow

3
model. All of these studies only provide local and fragmental information, while a
comprehensive insight in the groundwater resources of the Geba basin remains
largely unknown. In this study the groundwater resources of the Geba basin are
investigated using groundwater flow modelling integrated with GIS derived basin
characteristics.
Methods
Development of Hydrogeological Data
The Geba basin is characterized by rugged terrain, with topography ranging from
960 to 3280 m. A digital elevation map (DEM), shown in Fig. 2, was derived
from NASA SRTM data with 3 arc-second or a resolution of 90 m by 90 m.
SRTM tiles of N12E038, N12E039, N13E38, N13E39, N14E038 and N14E039
were considered for bounding the area and subsequently preparing the DEM.
For regional groundwater characterization, considerable test borings and water
well-log data are required to determine the sequence and type of geological
deposits. However, for the Geba basin such knowledge is lacking, except for some
well-logs of the Aynalem well field, 3 km east of Mekelle city (DEVECON,
1992). Instead, hydrogeological characteristics were derived from a digital map,
indicating 20 major lithological units in the basin. The map, shown in Fig. 3, was
prepared in ArcView grid format (90 m pixel size) from a geologic map (Arkin et
al. 1971), previous geological studies (Beyth 1972; Merla et al. 1979; Tesfaye and
Gebretsadik 1982; Getaneh and Valera 2002; Sifeta, Roser, and Kimura 2005),
field surveys, and satellite images.
In addition, 358 surface and ground water levels were recorded during the field
surveys. The observation points included water levels in wells, boreholes, springs,
reservoirs, and perennial river courses during base flow conditions (Fig. 4). The
geographical location and elevation of these observation points were recorded by
GPS. However, as the recorded elevations are liable to error, only horizontal
coordinates from the GPS readings were considered accurate, while the water
levels were adjusted by subtracting the water depth measured from the soil surface
from the DEM values. Another problem with these observations is the erratic
nature of the rainfall that causes large variations in water levels in hand dug wells,
reservoirs, and streams in the region. Moreover, water levels usually are seasonal

4
(REST 2005). To simplify the model, these effects were ignored on this study, and
all observations were considered as steady state.
Alene (2006) applied the WetSpass model (Batelaan and De Smedt 2001) to
estimate seasonal and annual groundwater recharge in the Geba basin. He found
that annual recharge ranges from zero to 215 mm per year and varies from
location to location depending on slope, soil type, land-use, and climate. On
average the total annual recharge was found to be 22 mm per year with a standard
deviation of 33 mm, which accounts for 4% of the average annual rainfall in the
area. This small amount of recharge is due to the high evapotranspiration in the
region (Getnet 2005).The spatial distribution of the recharge obtained from
WetSpass model was converted to a 90 m grid digital map as an input for the
groundwater model.
Groundwater Modelling
The behaviour of the groundwater system was simulated using MODFLOW
groundwater model (Harbaugh et al. 2000) in PMWIN Pro 7 environment (Chiang
and Kinzelbach 2005). PMWIN Pro 7 has a capacity of a million computational
cells. However, all GIS grid data available for the study are raster data with a 90
m 90 m pixel size, which results in a larger number of cells than the model
capacity. As a consequence, the grid was modified to a cell size of 180 m 180
m. The number of cells in the x and y directions becomes 696 and 587
respectively, resulting in a modelled area of 125.28 km Easting and 105.66 km
Northing. Active and inactive cells were defined to delineate the exact shape of
the basin, and the boundary of the basin was considered as a no flow boundary
condition.
The groundwater system was conceptualized as a single layered semi-confined
aquifer. Hence, the following groundwater flow equation applies in a steady state
0QRy
hT
yx
hT
x, (1)
where h is groundwater head or elevation (m), R is groundwater recharge (m/d), Q
is groundwater discharge (m/d), x and y are horizontal dimensions (m), and T is
transmissivity (m2/d), which is assumed to vary spatially depending on the

5
geological conditions. Equation 1 enables to set-up a groundwater model without
specifying any vertical dimensions of the ground layers. Nevertheless, this simple
model concept can produce realistic results for the regionally complex
groundwater flow system if transmissivity values are optimised by calibrating the
model such that a good fit is obtained between simulated and observed
groundwater heads.
Groundwater discharge is modelled with the drain package of MODFLOW
0,hhmaxCQ d, (2)
where hd is drain level (m), and C is drain conductance (d-1
) . Following a
procedure proposed by Batelaan and De Smedt (2004), drain levels equal to
topography minus 1 m are imposed over the whole basin and a large value is
specified for the drain conductance, so that any groundwater level reaching the
ground surface within one meter results in groundwater drainage to the surface.
As such, the model is able to locate automatically all drainage and discharge areas
as perennial rivers, and springs, and to quantify the corresponding discharge flux
with Eq. 2.
In order for the model to provide accurate results, it is necessary to calibrate
uncertain parameters until observations are reproduced with confidence. Hence,
the transmissivity values of the geological formations, which are believed to be
the most uncertain parameters, were optimized with PEST, a parameter estimation
tool embedded in PMWIN Pro. 7. The optimization process was based on
comparing simulated groundwater heads with the measured water levels inventory
(Fig. 4) using three error criteria: mean error (ME), mean absolute error (MAE),
and root mean squared error (RMSE). The mean error is the mean difference
between computed heads hc and observed heads ho
n
1iioc hh
n
1ME , (3)
The mean absolute error is the mean of the absolute value of the differences in
measured and simulated heads
6
n
1i
ioc |hh|n
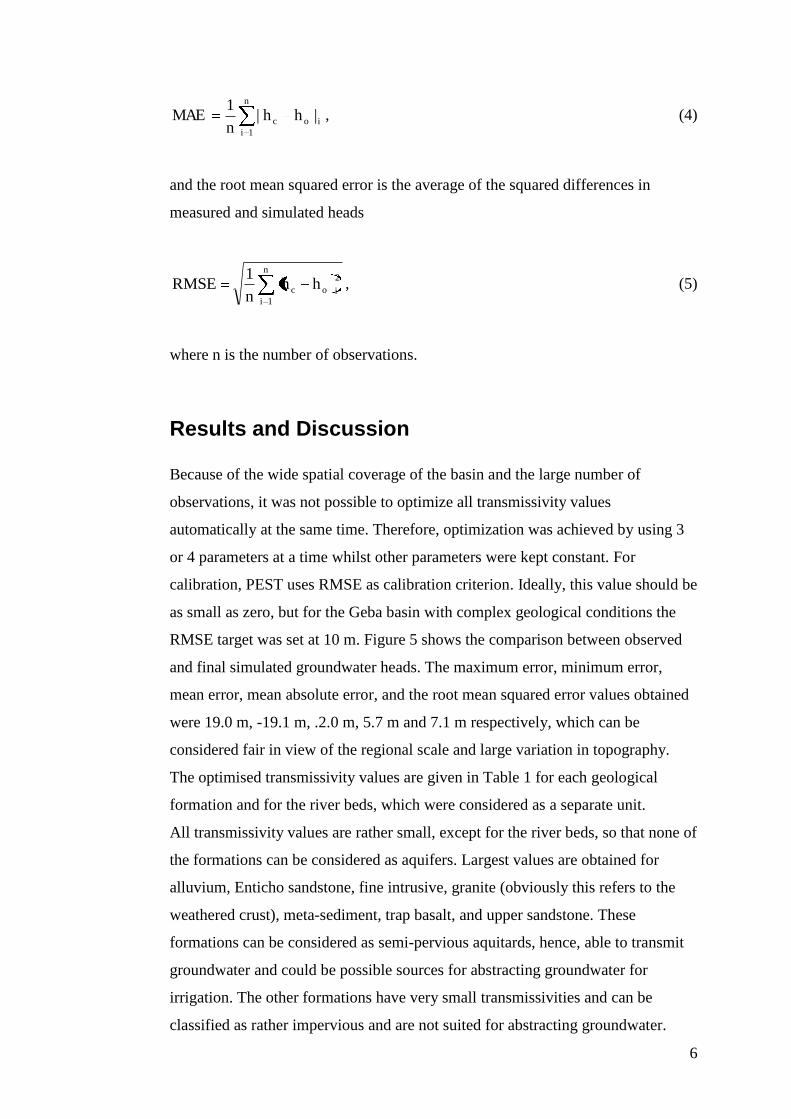
1MAE , (4)
and the root mean squared error is the average of the squared differences in
measured and simulated heads
n
1i
2
ioc hhn
1RMSE , (5)
where n is the number of observations.
Results and Discussion
Because of the wide spatial coverage of the basin and the large number of
observations, it was not possible to optimize all transmissivity values
automatically at the same time. Therefore, optimization was achieved by using 3
or 4 parameters at a time whilst other parameters were kept constant. For
calibration, PEST uses RMSE as calibration criterion. Ideally, this value should be
as small as zero, but for the Geba basin with complex geological conditions the
RMSE target was set at 10 m. Figure 5 shows the comparison between observed
and final simulated groundwater heads. The maximum error, minimum error,
mean error, mean absolute error, and the root mean squared error values obtained
were 19.0 m, -19.1 m, .2.0 m, 5.7 m and 7.1 m respectively, which can be
considered fair in view of the regional scale and large variation in topography.
The optimised transmissivity values are given in Table 1 for each geological
formation and for the river beds, which were considered as a separate unit.
All transmissivity values are rather small, except for the river beds, so that none of
the formations can be considered as aquifers. Largest values are obtained for
alluvium, Enticho sandstone, fine intrusive, granite (obviously this refers to the
weathered crust), meta-sediment, trap basalt, and upper sandstone. These
formations can be considered as semi-pervious aquitards, hence, able to transmit
groundwater and could be possible sources for abstracting groundwater for
irrigation. The other formations have very small transmissivities and can be
classified as rather impervious and are not suited for abstracting groundwater.

7
Figure 6 shows the final simulated regional groundwater head distribution. The
groundwater head varies from a minimum of 960 m around the outlet of the Geba
River to maximum 3,235 m at the northern extreme. The map indicates that
groundwater levels closely follow topography. Finally, the depth to the
groundwater was estimated from the difference between topography and
simulated groundwater levels, as depicted in Fig. 7. This map shows that while
there are places where the groundwater is near the surface such that hand dug
wells or shallow drilled wells could abstract groundwater for irrigation, in other
localities groundwater is situated at depths of up to 200 m from the soil surface.
The groundwater balance can be calculated by aggregating all groundwater flows
as predicted by the model. There is only one input, recharge, which amounts in
total to about 3.0 105 m
3/d on average, and there is also only one output,
groundwater drainage, which also amounts to 3.0 105 m
3/d, yielding an average
river base flow of about 3.5 m3/s at the outlet of the Geba River. This latter value
corresponds well with field observations (MoWR 2002). A fraction of the
groundwater transmitted between recharge and discharge can be abstracted safely
without causing adverse effects (Miles and Chambet 1995). This fraction can
cautiously be estimated as 10%, which amounts to 30,000 m3/d of groundwater
that can be abstracted and used for irrigation in the Geba basin in a sustainable
way. The possible sites where this can be achieved are locations with shallow
groundwater, for instance less than 5 m below soil surface, in combination with
aquitard type lithological units, which can be identified by combining Figs. 3 and
7.
Conclusions
In this study, the main objective was to investigate the distribution of groundwater
in the Geba basin in Northern Ethiopia. Because of lack of detailed
hydrogeological information, the groundwater system of the Geba basin was
conceptualized in a simplified numerical model. However, all local variations and
actual conditions were incorporated in the model by calibration of the
transmissivity values for each geological unit. A steady state groundwater flow
model was applied using MODFLOW model in PMWIN package. Observations
of water levels collected from wells, boreholes, springs, reservoirs, and perennial

8
river courses were used for calibration of the groundwater model, by optimizing
the transmissivity values for each lithological unit.
The comparison of observed and predicted groundwater levels shows a good
agreement, with a mean error of about 2 m and a root mean squared error of 7.1
m. These results are acceptable in view of the size of the study area and lack of
detailed information regarding hydrogeological conditions. From the results
obtained, it can be concluded some geological formations can be considered as
aquitards and could be used for groundwater abstraction, but this should be
supported by local geophysical explorations. Moreover, model results also show
that in many areas depth to groundwater is shallow, which would allow domestic
wells to be dug for irrigation. A first and crude estimation indicates that possibly
30,000 m3/d of groundwater can be abstracted in the Geba basin in a sustainable
way.
References
Alene Y (2006) GIS and remote sensing assisted water balance computation of the Geba basin,
Tigray, Ethiopia. MSc thesis Water Resources Engineering, KULeuven - VUB, Belgium: 122 pp
Arkin Y, Beyth M, Dow DB, Levitte M, Temesgen Haile, Tsegaye Hailu T (1971) Geological map
of Mekelle sheet area ND 37-11, Tigre Province. Geological Survey, Ministry of Mines, Energy
& Water Resources, Addis Ababa, Ethiopia
Batelaan O, De Smedt F (2001) WetSpass: a flexible, GIS based, distributed recharge
methodology for groundwater modelling. In: Impact of Human Activity on Groundwater
Dynamics, IAHS Publ 269: 11-17
Batelaan O, De Smedt F (2004) SEEPAGE, a new MODFLOW DRAIN Package. Ground Water
42: 576-588
Beyth M (1972) Palaeozoic-Mesozoic sedimentary basin of Mekelle outlier, Northern Ethiopia.
Am Ass Petrol Geol Bull 56: 2426-2439
Chernet T, Eshete G (1982) Hydrogeology of the Mekele area (ND37-11). Minstry of Mines and
Energy and Ethiopian Geological Survey, Memoir No 2, Addis Ababa, Ethiopia: 49 pp.
Chiang WH, Kinzelbach W (2005) 3D-groundwater modelling with PMWIN, a simulation system
for modelling groundwater flow and transport. Springer-Verlag, New York, USA: 346 pp
COSAERT (Commission for Sustainable Agriculture and Environmental Rehabilitation in Tigray)
(2001) Suluh valley integrated rural, agriculture and water resources development study.
Identification and Reconnaissance Report, Mekelle, Ethiopia
DEVECON (1992) Five towns water supply and sanitation study. Ministry of Water Resources,
Addis Ababa, Ethiopia
9
Gebregziabher B (2003) Integrated geophysical methods to investigate the geological structures
and hydrostratigraphic unit of the Aynalem area, Southeast Mekelle. MSc thesis Addis Ababa
University, Ethiopia
Gemechu A (2006) Sustainable irrigation in the Tigray highlands of Northern Ethiopia. MSc thesis
Water Resources Engineering, KULeuven - VUB, Belgium: 80 pp
Getaneh W, Valera R (2002) Rare earth element geochemistry of the Antalo Supersequence in the
Mekele Outlier (Tigray region, northern Ethiopia). Chemical Geology 182: 395-407
Getnet M (2005) Groundwater recharge and water balance assessment in Geba basin, Tigray,
Ethiopia. MSc thesis Water Resources Engineering, KULeuven - VUB, Belgium: 78 pp
Harbaugh AW, Banta ER, Hill MC, McDonald MG (2000) MODFLOW-2000, the U.S.
Geological Survey modular ground-water model - User guide to modularization concepts and the
ground-water flow process. US Geological Survey Open-File Report 00-92: 121 pp
Hussein (2000). Hydrogeology of the Aynalem wellfield, Tigray, Northern Ethiopia. Unpublished
MSc thesis, Addis Ababa University.
Leul K (1994) Need, potentials and limitations for irrigation development in Tigray. Commission
for Sustainable Agricultural and Environmental Rehabilitation in Tigray, Mekelle, Ethiopia: 30 pp
Miles JC, Chambet PD (1995). Safe yield of aquifers. J Water Resour Plng and Mgmt 121: 1-8
Merla G, Abbate E, Azzaroli A, Bruni P, Canuti P, Fazzuoli M, Sagri M, and Tacconi P (1979)
Comments to the geological map of Ethiopia and Somalia. Consiglio Nazionale delle Ricerche,
Firenze: 95 pp
MoWR (Ministry of Water Resources of Ethiopia) (2002) Ethiopian Water Resources
Management Policy. Addis Ababa, Ethiopia: 56 pp
NEDECO (Netherlands Engineering Consultants) (1997) Tekeze river basin integrated
development master plan project. Ministry of Water Resources, Addis Ababa, Ethiopia
REST (Relief Society of Tigray) (1996) Raya valley development study project - Reconnaissance
phase report, US Agency for International Development DCHA/OFDA, Mekelle, Ethiopia: 56 pp.
REST (Relief Society of Tigray) (2005) Drought emergency and rehabilitation program annual
report (May 2004-April 2005). US Agency for International Development DCHA/OFDA,
Mekelle, Ethiopia.
Sifeta K, Roser BP, Kimura J (2005) Geochemistry, provenance, and tectonic setting of
Neoproterozoic metavolcanic and metasedimentary units, Werri area, Northern Ethiopia. African
Earth Sciences 41: 212-234
Tesfaye C, Gebretsadik E (1982) Hydrogeology of Mekelle Area. (pp 50). Ministry of Mines and
Energy, Addis Ababa, Ethiopia
WWDSE (Water Works Design and Supervision Enterprise) (2006) Evaluation of Aynalem well
field and selection of additional prospective boreholes for Mekelle Town water supply source.
Report II: 140 pp
Yazew E (2005) Development and management of irrigated lands in Tigray, Ethiopia. PhD thesis
UNESCO-IHE Institute for Water Education. Delft, the Netherlands: 265 pp

10
List of Tables
Table 1. Calibrated transmissivity values for the lithological units.
Geological Formations Transmissivity
(m2/d)
Adigrat Sandstone 0.13
Alluvium 0.5 - 5
Dolerite sill 0.017
Enticho Sandstone 5
Fine Intrusive 4
Granite 2.35
Limestone-Marl 0.2
Marl-Limestone 0.0016
Meta-conglomerate 0.1
Meta-greywack 0.01
Meta-limestone 1
Meta-sediment 2
Meta-volcanic 0.015
River Beds 200 - 500
Shale 0.054
Shale-Marl-Limestone 0.0015
Tillite 0.1
Transition 0.1
Trap Basalt 13.8
Upper Sandstone 16
11
List of Figures
Figure 1. Location map of the Geba basin.
Figure 2. Topographic elevation map of the Geba basin.
S Study
area

12
Figure 3. Map showing lithological units in the Geba basin.
Figure 4. Locations of surface and groundwater levels observed during field
campaigns.

13
Figure 5. Scatter plot of calculated versus observed groundwater heads.
Figure 6. Simulated groundwater heads in the Geba basin.
1000
1500
2000
2500
3000
1000 1500 2000 2500 3000
Observed head (m)
Sim
ula
ted
he
ad
(m
)

14
Figure 7. Depth to groundwater map of the Geba basin.