Antimicrobial activity of cecropins - Journal of Antimicrobial
Evaluation of the Effect of Antimicrobial Substances in
Cloudberries (Rubus chamaemorus L.) on Food Connected Microorganisms
JULIA BJÖRCK
Supervisors: Birgitta Bergström, Elisabeth Borch, Ingela Karlsson
Examiner: Thomas Andlid Master of Science Thesis in the Master Degree Programme, Biotechnology Department of Chemical and Biological Engineering Food Science CHALMERS UNIVERSITY OF TECHNOLOGY Göteborg, Sweden 2010 The thesis was performed in cooperation with SIK – the Swedish Institute for Food and Biotechnology

I
Evaluation of the Effect of Antimicrobial Substances in
Cloudberries (Rubus chamaemorus L.) on Food Connected Microorganisms
JULIA BJÖRCK
Supervisors: Birgitta Bergström, Elisabeth Borch, Ingela Karlsson
Examiner: Thomas Andlid Master of Science Thesis in the Master Degree Programme, Biotechnology Department of Chemical and Biological Engineering Food Science CHALMERS UNIVERSITY OF TECHNOLOGY Göteborg, Sweden 2010 The thesis was performed in cooperation with SIK – the Swedish Institute for Food and Biotechnology
II
Evaluation of the Effect of Antimicrobial Substances in Cloudberries (Rubus chamaemorus L.) on Food Connected Microorganisms © JULIA BJÖRCK, 2010 This Master of Science thesis was performed within the master degree programme of Biotechnology, in the track Food & Health, Chalmers University of Technology, in cooperation with SIK – the Swedish Institute for Food and Biotechnology. Supervisors: Birgitta Bergström, Elisabeth Borch, Ingela Karlsson, SIK Examiner: Thomas Andlid, Chalmers University of Technology SIK – the Swedish Institute for Food and Biotechnology Department of Microbiology and Process Hygiene Box 5401 SE-402 29 Göteborg Sweden Telephone: +46 (0) 10 – 516 66 00 Chalmers University of Technology Department of Chemical and Biological Engineering / Food Science SE-412 96 Göteborg Sweden Telephone: +46 (0) 31 – 772 10 00 Printed by: Department of Chemical and Biological Engineering / Food Science, Chalmers University of Technology Göteborg, Sweden 2010

III
Evaluation of the Effect of Antimicrobial Substances in Cloudberries (Rubus chamaemorus L.) on Food Connected Microorganisms JULIA BJÖRCK Department of Chemical and Biological Engineering / Food Science Chalmers University of Technology
Abstract The antimicrobial effect of phenolic compounds has attracted much interest in the last years. Fruits and berries are good sources of phenolic compounds. The possible use of some of these compounds as “natural preservatives” is of interest both from an industrial perspective and from a consumer perspective. Besides from benzoic acid, cloudberries (Rubus chamaemorus L.) contain large amounts of the phenolic group ellagitannins. In this study the proposed theory is that, besides the natural content of benzoic acid in the cloudberries, also the phenolic group ellagitannins and the phenolic acid ellagic acid contributes to the antimicrobial effect seen from the cloudberries. The study investigates the growth inhibiting effect of cloudberry juice on two food connected microorganisms; Lactobacillus plantarum SIK225 and Candida famata SIK628. L. plantarum is a gram positive rod, typically related to spoilage during low pH and temperatures. C. famata is a yeast which is connected to spoilage of many types of food products, low pH and temperature can be mentioned also for this organism. The project provides an initial study of the antimicrobial effect of cloudberry juice of different concentrations and adjusted pH‟s, using Bioscreen C for measuring microbial growth as optical density, OD. Plate spreading for colony forming unit (CFU) measurement has also been performed. The results show that in certain conditions cloudberry juice inhibits growth of L. plantarum; the lower the pH, the clearer and stronger the effect. Some inhibiting effect was seen for C. famata, but these results were not as unambiguous as for L. plantarum. Further studies are needed to confirm the proposed theory concerning the effect of ellagitannins and ellagic acid. KEYWORDS: Cloudberry, Antimicrobial, Preservatives, Ellagitannins, Ellagic Acid, Benzoic Acid

IV
Utvärdering av effekten av antimikrobiella ämnen i hjortron (Rubus chamaemorus L.) på livsmedelsanknutna mikroorganismer JULIA BJÖRCK Avdelningen för kemi- och bioteknik / Livsmedelsvetenskap Chalmers Tekniska Högskola
Sammanfattning Den antimikrobiella effekten av fenoliska ämen har tillägnats mycket intresse de senaste åren. Frukter och bär är en rik källa av fenoler. Den eventuella användningen av vissa av dessa ämnen som ”naturliga konserveringsmedel” är av intresse, både ur ett industriellt perspektiv och ur ett konsumentperspektiv. Vid sidan av bensoesyra innehåller hjortron (Rubus chamaemorus L.) stora mängder av den fenoliska gruppen ellagitanniner. I studien föreslås en teori vilken innebär att, vid sidan av det naturliga innehållet av bensoesyra i hjortron, även den fenoliska gruppen ellagitanniner och den fenoliska syran ellaginsyra bidrar till den antimikrobiella effekten som ses hos hjortron. Studien undersöker den tillväxthämmande effekten av hjortronjos på två livsmedelsanknutna mikroorganismer; Lactobacillus plantarum SIK225 och Candida famata SIK628. L. plantarum är en grampositiv stav, typiskt associerad med förskämning vid låga pH och temperaturer. C. famata är en jäst som är förknippad med förskämning av många typer av livsmedel, låga pH och temperaturer kan nämnas även för denna organism. Projektet utgör en första studie kring den antimikrobiella effekten av hjortronjos i olika koncentrationer och ställda pH, genom att andvända Bioscreen C för att mäta den mikrobiella tillväxten i form av optisk densitet, OD. Plattspridning för mätning av kolonibildande enheter (Eng. colony forming units, CFU) har också utförts. Resultaten visar att under vissa förhållanden kan hjortronjos inhibera tillväxten av L. plantarum SIK225; ju lägre pH, desto tydligare och starkare effekt. Viss inhiberande effekt kunde också ses mot C. famata SIK628, men dessa resultat var inte like entydiga som för L. plantarum SIK225. Fortsatta studier behövs för att bekräfta den föreslagna teorin angående effekten av ellagitanniner och ellaginsyra. NYCKELORD: Hjortron, Antimikrobiell, Konserveringsmedel, Ellagitanniner, Ellaginsyra, Bensoesyra
V
Acknowledgement First of all I would like to thank everyone at the division of microbiology at SIK in Gothenburg. All of you have made my time at SIK pleasant and funny. Thank you! I would like to thank Ingela Karlsson for giving me really good guidance in the lab. I would especially like to thank you for being a great support throughout the whole work. Next, I would like to thank Birgitta Bergström for all the help with the report writing. You have given me a lot of good comments, making my report look the way it does. I would like to thank Thomas Andlid at Chalmers for being my examiner. It has been very nice to bandy ideas with you. I would also like to thank all the persons that have been part of my work in some way; Roger Uddstål at SIK in Umeå, Eva Grahn Håkansson at Essum, Ann Lindström & Carina Wallmark at Immun, Marina Heinonen at University of Helsinki in Finland, Ivan Harnesk at Grundnäs AB, Carin Nordenberg at SIK in Gothenburg, Albrecht Höhn at Novozymes in Switzerland and of course all of you that I have talked to and asked questions along the way. Thank you all! Last, but not least, I would like to express my gratitude to my family and friends. Without anyone of you, my whole education would not have been possible. Especially I would like to send my thoughts to my dear Gösta, my English would have been even better if you would have been able to read this report. I love you all! Julia Björck Göteborg, Mars 2010

VI

VII
List of Contents 1. Introduction .......................................................................................................................... 1
1.1 Objective and proposed theory ................................................................................... 2
2. Theoretical background ...................................................................................................... 3
2.1 Cloudberry ..................................................................................................................... 3
2.2 Microorganisms ............................................................................................................. 4
2.2.1 Lactobacillus plantarum ............................................................................................ 4
2.2.2 Candida famata ......................................................................................................... 5
2.3 Preservatives and phenols ........................................................................................... 6
2.3.1 Preservatives in general ............................................................................................ 6
2.3.2 Benzoic acid & Sodium benzoate .............................................................................. 6
2.3.3 Phenolics in general .................................................................................................. 7
2.3.4 Ellagitannins, Hexahydroxydiphenic acid and Ellagic acid ..................................... 7
2.3.5 Hydroxybenzoic acids ............................................................................................... 9
2.4 Bioscreen C ................................................................................................................... 10
3. Materials and methods ..................................................................................................... 11
3.1 Microorganisms ........................................................................................................... 11
3.1.1 Lactobacillus plantarum .......................................................................................... 11
3.1.2 Candida famata ....................................................................................................... 11
3.2 Media ............................................................................................................................. 12
3.3 Cloudberry powder .................................................................................................... 12
3.4 Fresh cloudberries and cloudberry juice .................................................................. 13
3.5 Analysis of the cloudberry juice ................................................................................ 14
3.6 MIC-test 1; in test tubes .............................................................................................. 14
3.7 MIC-test 2; in Bioscreen C .......................................................................................... 15
3.8 Calculation of generation times & lag phases ......................................................... 17
3.9 Statistical analysis ........................................................................................................ 18
4. Results ................................................................................................................................. 19
4.1 MIC-test 1; in test tubes .............................................................................................. 19
4.2 Analysis of cloudberry juice ...................................................................................... 20
4.3 MIC-test 2; in Bioscreen C .......................................................................................... 21
4.3.1 OD of the media, MRS ............................................................................................ 21
4.3.2 The microorganisms ................................................................................................ 22
4.3.3 Growth curves, L. plantarum .................................................................................. 22
4.3.4 Generation times and lag phases, L. plantarum ...................................................... 35
4.3.5 CFU – colony forming units, L. plantarum ............................................................ 36
4.3.6 Growth curves, C. famata ....................................................................................... 39
4.3.7 CFU – colony forming units, C. famata ................................................................. 48
5. Discussion ........................................................................................................................... 50
5.1 MIC-test 1; in test tubes .............................................................................................. 50
5.2 Analysis of cloudberry juice ...................................................................................... 51
5.2.1 Benzoic acid and HBA’s .......................................................................................... 51
5.2.2 Further discussion of phenolic content in the cloudberry juice .............................. 52
5.3 MIC-test 2; in Bioscreen C .......................................................................................... 53
5.3.1 Media, MRS ............................................................................................................ 53
5.3.2 Growth of L. plantarum in medium (MRS) and nutritional controls (TN) .......... 54

VIII
5.3.3 Growth of L. plantarum in benzoic acid (Bs) .......................................................... 56
5.3.4 Growth of L. plantarum in cloudberry juice (Hj) ................................................... 58
5.3.5 Growth of C. famata in medium (MRS) and nutritional controls (TN) ................ 61
5.3.6 Growth of C. famata in benzoic acid (Bs) ................................................................ 62
5.3.7 Growth of C. famata in cloudberry juice (Hj) ......................................................... 63
5.3.8 Further discussion ................................................................................................... 65
5.4 Reliability and validity of method ............................................................................ 66
6. Conclusions ........................................................................................................................ 68
7. Suggestions for future work ............................................................................................ 70
References ............................................................................................................................... 72
Appendix A – Analysis; “Juice 2”, “Juice 2 (fr)”, “Juice 2 (fr+ht)” ................................. 74
Appendix B – Analysis; “Juice 1”, “Juice 2 (fr 3 months)” .............................................. 76

1
1. Introduction
Berries are a traditional part of the Nordic diet and have been eaten for the good taste and for its nutritional value during centuries. Today the interest in bioactive compounds from the berries is increasing. Phenols, which is a large and complex group of compounds in berries, has been contributed both anticancer and antiviral properties among others (Chung et al., 1998; Vekiari et al. 2008 cites Okuda 2005 & Serrano et al., 2009). Further, phenols are proposed as possible candidates in drugs against diseases as for example AIDS, bacterial infections and neural disorders (Handique & Baruah, 2002). Moreover, due to the antimicrobial effect of many of the phenolic compounds, their potential as food preservatives is of interest. There is an increased interest in “green labelling” and to produce foods with “natural ingredients”, without “synthetic preservatives”. The consumers demand fresh and minimally processed food products, but still with prolonged shelf life and with higher taste experience. In addition to the mentioned, the producers also try to meet the demands of low fat and low sugar products. All these demands are hard to fulfil. However, as a step towards green labelling, phenolic compounds with antimicrobial effects from berries could be an alternative to the existing preservatives used today. In addition to the possibility to meet the demands discussed above by using “natural preservatives” from berries, there is also an interest in improvement of the Nordic berries. Huge amounts of berries are growing in our northern nature without being used. Comparison with the value of the timber in the forests and the value of the berries at the same areas shows that there is money to earn (Uddstål, 2009). If the berries would be utilized more efficient everybody would gain a profit out of it; the landowners could use the natural resources more efficient, companies could make business out of the berries and consumers could reach both health promoting products and products with more natural ingredients. Cloudberry (Rubus chamaemorus L.) has been chosen for the investigation in this project. The reason for the choice is that cloudberries have been shown to have good potential as source of antimicrobial compounds (Määttä-Riihinen et al., 2004). Moreover, well-established knowledge indicates that the berry is self-preserving. That effect is mainly dedicated the natural content of benzoic acid, but interest in the large amount of phenolic components, and especially ellagitannins and ellagic acid, is increasing. The idea that also these compounds provides to a possible antimicrobial effect has been raised. Further more, in a good year of growing, large volumes of cloudberries can be harvested in a relatively short period of time1.
1 Phone contact with Roger Uddstål, SIK, Umeå, Sweden, 2009-09-15.
2
1.1 Objective and proposed theory
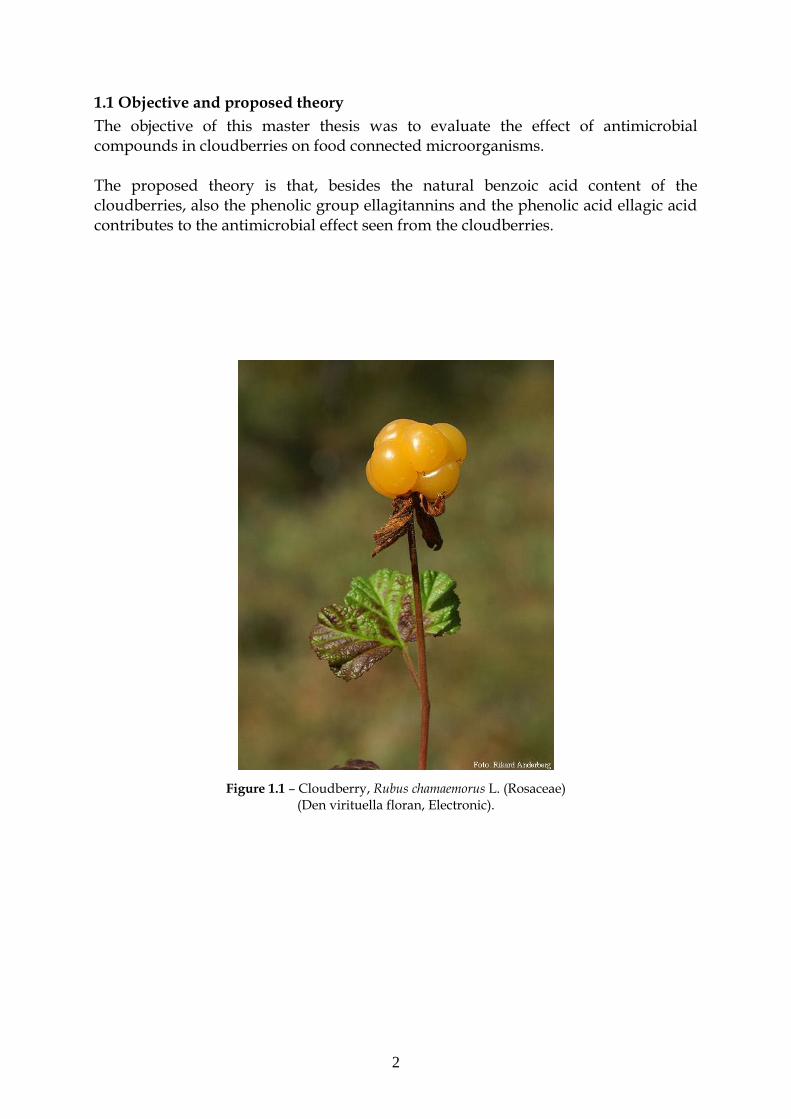
The objective of this master thesis was to evaluate the effect of antimicrobial compounds in cloudberries on food connected microorganisms. The proposed theory is that, besides the natural benzoic acid content of the cloudberries, also the phenolic group ellagitannins and the phenolic acid ellagic acid contributes to the antimicrobial effect seen from the cloudberries.
Figure 1.1 – Cloudberry, Rubus chamaemorus L. (Rosaceae) (Den virituella floran, Electronic).

3
2. Theoretical background
This chapter will provide the theory behind the different parts of the project. The berry of interest, cloudberry, will be presented, followed by a presentation of the microorganisms studied. Further, the classical preservatives and the phenolic compounds of interest will be handled in this chapter. In the end of the chapter a presentation of Bioscreen C, the equipment used for the experimental trials, is to be found.
2.1 Cloudberry
Cloudberry, Rubus chamaemorus L. (Rosaceae), is a boreal, circumpolar plant. In Europe it is mainly found in Finland, Norway, Russia and Sweden, but it can also be found in the Scottish Highlands (Thiem, 2002). The distribution of cloudberry can be seen in figure 2.1 below. Cloudberry is a stone fruit which leafs are five- to seven-tipped, creased and shaped as kidneys. Its flowers are white and in the size of two to three centimetres. The berries are red at first but turn more orange when matured, at the mature state they also become soft and juicy. Cloudberry is a plant common for example on poor peat mosses, osier brushwood‟s and at lake sides (Mossberg & Stenberg, 2003). In a good year of harvest the annual yield can reach more than 1000 tons of the berries (Bra Böckers Lexikon, 1978 & Nationalencyklopedin, Electronic). In those years the berries can relatively easy and fast be harvested2. Cloudberry contains relatively high amount of benzoic acid, which is one of the reasons why it possess such a good ability to self preserve. However, the berries also contain very high amounts of different phenols and phenolic acids and these have attracted more interest during later years. The cloudberry is also rich in ascorbic acid and in earlier times the berries were used to treat scurvy (Rapp et al., 1993). Sexual reproduction of the plant is very inefficient. The plants are unisexual and the female, which are usually less than one third of the number of the plants, and male flowers are growing as separate plant individuals. There are studies going on in Norway to try to increase the efficiency of the reproduction (Nationalencyklopedin, Electronic). The main way for the plant to spread is by extensive, branched rhizome systems. These rhizomes results in that one individual clone can cover several square meters of the ground (Thiem, 2002).
2 Phone contact with Roger Uddstål, SIK, Umeå, 2009-09-15.

4
Figure 2.1 – The circumpolar distribution of cloudberry (Thiem, 2002).
2.2 Microorganisms
The microorganisms used in this project are Lactobacillus plantarum and Candida famata. Their action as food spoilage microorganisms is described in this section.
2.2.1 Lactobacillus plantarum
Lactobacillus plantarum is a gram positive, rod belonging to the group lactic acid bacteria (LAB). The typical conditions for spoilage by the whole group of LAB is low oxygen (e.g. due to vacuum package or packaging in modified atmosphere (MA)), low pH and low temperature. Some LAB are also tolerant to quite high levels of salt and sugar, why products with those characteristics also can be associated with LAB contamination. Most LAB prefer an initial pH of 6 to 7 to grow, but many can grow at pH as low as between 2 to 3. L. plantarum has been shown to be able to grow at pH‟s around 3, depending on medium and other surrounding conditions. Further, L. plantarum is tolerant to acetic acid, why products manufactured with acetic acid as preservative can be associated with spoilage by the specie. Products especially mentioned in this area are mayonnaise, salad dressing and vegetative preserves. Further, also spoilage of some certain fish products has been a problem (Blackburn, 2006). During fermentation L. plantarum produces lactic acid as the end product and the bacterium is, as it is called, a homofermentative LAB. Homofermentative meaning that lactic acid is the only end product from fermentation of carbohydrates. Compare with heterofermentative LAB which are LAB capable to make more than one fermentation products (Madigan et al., 2009). The production of lactic acid leads to a decrease in pH. Spoilage of LAB causes changes in flavours and aromas of the products exposed for the contamination, and off-odours can arise. Formation of gas

5
can be another problem as a result of a LAB contamination, leading to for example broken or exploded packages (Blackburn, 2006). To mention some more food products where LAB spoilage can be a problem, it can be seen in meat and dairy products and in canned, non-fermented vegetables (in fresh vegetables the LAB are usually competed by moulds) (Blackburn, 2006). In alcoholic beverages as beer, wine and cider the spoilage can cause problems as haze, turbidity, unwanted gas formation and flavour changes. Some L. plantarum strains can grow under quite rough conditions with a pH of only 3.2 in combination with an alcohol content of 13% (Blackburn, 2006). However, in many fermented food products L. plantarum can be a desired microorganism. As a few examples, CCUG mention isolation of L. plantarum from food products as sauerkraut, pickled vegetables and sour dough (CCUG, Electronic). The species L. plantarum include strains that have been proved to provide health effects, so called probiotics. As an example, the strain L. plantarum 229v is used as a probiotic in the fruit drink ProViva® (ProViva, Electronic). All these examples of where L. plantarum can be present shows that there can be a wide variety between the different strains even within species; one strain could be a wanted probiotic, whereas another could be an unwanted spoilage bacterium. Where the specific species or strain is present and under which conditions, does also decide whether it is wanted or unwanted. The LAB are mainly referred to as mesophiles, meaning they show the best growth between temperatures of 20 to 40°C. However, there are also strains growing in both lower and higher temperatures (Blackburn, 2006). L. plantarum is psychrotolerant, it can still grow under lower temperatures at about 8°C, however, the growth is then slower than during more optimal temperatures of approximately 30°C.
2.2.2 Candida famata
Candida famata is a common yeast contaminator in food stuffs (CCUG, Electronic). It can frequently be found in many types of foods; fruits and beverages, meat and dairy products, products with low water activity (aw) and products with low pH. The teleomorphic state of C. famata is Debaromyces hansenii. C. famata is psychrotrophic or psychrotolerant rather than psychrophilic. It can be isolated from chilled, but not frozen, foods at -1 to 4°C, but it prefers growth in temperatures around 20 to 25°C. C. famata is halotolerant, it can grow under quite high sugar and salt concentrations. Under these conditions the amount of free water can be low (low aw), which usually affects growth of microorganisms, but C. famata can survive and grow during values of aw lower than 0.8. In general, yeasts prefer slightly acidic conditions, a pH of approximately 4.5 to 5.5, and are more sensitive to alkali conditions. However, C. famata are alkali tolerant and can grow at pH up to approximately 10 to 10.5 (Blackburn, 2006).

6
2.3 Preservatives and phenols
2.3.1 Preservatives in general
In their book, Antimicrobials in Foods, Davidson & Branen (Davidson & Branen, 1993), refers to the U.S. Food and Drug Administration (FDA) for the definition of chemical preservatives. The definition is stated as follows;
Any chemical that when added to food tends to prevent or retard deterioration, but does not include common salt, sugars, vinegars, spices, or oils extracted from species, substances added to food by direct exposure thereof to wood smoke, or chemicals applied for their respective insecticidal or herbicidal properties.
Preservatives are part of a group mentioned as „food additives‟. These additives have to be declared when added to a foodstuff, either with the name of the compound or with its E-number. The E-number system is used internationally as a designation of food additives for declaration on the product to which it is added. There are legislation and regulation concerning the amount of a certain preservative allowed to add into a certain food product. In Sweden the central administrative authority for matters concerning food is the National Food Administration, SLV, and is responsible for this regulation.
2.3.2 Benzoic acid & Sodium benzoate
Benzoic acid (C6H5COOH, E210) is one of the oldest and most commonly used chemical preservative, mainly due to its low cost, ease to incorporate in foods, lack of colour and relatively low toxicity (Davidson & Branen, 1993). In the form of sodium benzoate (C6H5COONa, E211) the solubility in water increases dramatically, which is the reason why it is preferred to use in many situations. Benzoic acid occurs naturally in many fruits and berries. (a) (b)
Figure 2.2 – (a) Benzoic acid and (b) Sodium benzoate (About.com: chemistry, Electronic).
The antimicrobial effectiveness of benzoic acid is dependent on in which form it is, dissociated or undissociated. This is in turn is dependent on the pH of the medium or matrix in which the acid should act. It has been known for a long time that it is the undissociated form of benzoic acid that provides the antimicrobial activity. In table 2.1 it can be seen how the percentage of undissociated acid varies with pH. The pKa value of benzoic acid is 4.19 and at pH=pKa 50% of the acid is undissociated. The development of the curve representing the percentage undissociated benzoic acid is

7
0
20
40
60
80
100
0 2 4 6 8
pH
% u
nd
isso
cia
ted
acid
drastically changing both before and after pKa with only small changes in pH (figure 2.3). Due to its chemical composition (one OH-group) benzoic acid has one pKa value. Table 2.1 – % undissociated benzoic acid at different pH
pH
% undissociated
acid
7 0,156,5 0,49
6 1,53
5,5 4,67
5 13,41
4,5 32,88
4 60,77
3,5 83,04
3 93,94
2,5 98,00
2 99,36
Figure 2.3 – Percentage of undissociated benzoic acid plotted against pH. pKa for benzoic acid is 4.19.
There are, however, some disadvantages using benzoic acid and sodium benzoate as preservative in food products. They are both active in quite a narrow pH range, preferable below 4.5, and they can cause off-flavours in food products. Further, even though the toxicity is relatively low, there are toxicological effects regarding both substances and hypersensitiveness can be seen for certain individuals.
2.3.3 Phenolics in general
Phenols have been on much interest in later years, much of the focus in the research has been the health promoting effects. Studies indicate that many phenolic compounds provides anticancer and antiviral properties, just to mention a few (Vekiari et al., 2008 cites Okuda 2005). Phenols are a large and complex group of compounds which in many cases act protective in the plants where they are present. They can protect from e.g. fungal or bacterial attack or from exposure of radiation from the UV light (Vattem & Shetty, 2004). There are thousands of phenolic phytochemicals. Many phenolic compounds contribute to an antimicrobial effect, why their potential as preservative agents in foods is of interest.
2.3.4 Ellagitannins, Hexahydroxydiphenic acid and Ellagic acid
In cloudberries, the most abundant phenol is ellagitannins. Heinonen shows in her reviw “Antioxidant activity and antimicrobial effect of berry phenolics – a Finnish perspective” that 90% of the total phenolic profile consists of ellagitannins (Heinonen, 2007). Ellagitannins are large and complex molecules consisting of one or more hexahydroxydiphenic acids (HHDP‟s) partially or fully esterified with a sugar, usually glucose (Bakkalbaşi et al., 2009 & Chung et al., 1998). The form is known as

8
glycosides. There are a huge number of varieties in structures of ellagitannins, both since HHDP can bind to the sugar in so many ways, but also due to the ability to form dimeric and oligomeric derivatives (Bakkalbaşi et al., 2009). Ellagitannins are labile and can easily undergo polymerization reactions and hydrolysis. During hydrolysis with an acid or base the ester bonds of HHDP and the sugar are hydrolyzed and HHDP rearranged to ellagic acids (Bakkalbaşi et al., 2009 & Quideau, 2009). This is what happens when consuming fruits or berries containing ellagitannins. Ellagitannins are also referred to as hydrolysable tannins due to this possibility of undergoing hydrolysis. Ellagic acid is a dimeric derivative of gallic acid. Ellagic acid has poor water solubility in contrast to ellagitannins which are water soluble. Ellagic acid is found in plant vacuoles either as free form, in derivatives or in the large complexes of ellagitannins (Bakkalbaşi et al., 2009). The form mainly found in plants are the later; as ellagitannins (Häkkinen et al., 2000). Due to its chemical composition (with four OH-groups), ellagic acid should have four pKa values. However, it seems like only two pKa are chemically distinguishable and kinetically significant; pKa1 = 6.3 and pKa2 = 11.2. It is believed that the peculiar structure of ellagic acid with the positions of the hydroxyl groups is the reason for two, instead of four pKa values (Muñoz-Muñoz et al., 2009). (a) (b) (c) (d) Figure 2.4 – (a) Ellagitannin (ET) (Bakkalbaşi et al., 2009), (b) Hexahydroxydiphenic acid (HDDP) (Serrano et al., 2009), (c) Gallic acid (GA) (Serrano et al., 2009), (d) Ellagic acid (EA), (Bakkalbaşi et al., 2009).

9
The antimicrobial action seen from ellagitannins and ellagic acid is today not fully understood, but there are some proposed theories (Vattem & Shetty, 2004). Phenolic acids, as ellagic acid, are weak acids which makes it possible for them to dissociate at the cell membrane and disturb many essential functions for the growth and survival of the organism in question. The proton and electron gradient can be influenced, certain metal ions needed for growth and metabolism can be delimited. Further, important key proteins or receptors on the membrane, responsible for the transport of nutrients and cofactors, can be inactivated. The electron transport chain and generation of ATP in the cell can be disrupted. Ellagic acid is partially hydrophobic, making it possible for action in a lipid-water interface. This property makes the acid able to stack or embed itself in a membrane and thereby induce a structural change of it. These are all important factors for the antimicrobial activity of ellagic acid (Vattem & Shetty, 2004). Much focus of the research has, as mentioned, been put on human health aspects. Therefore it is for example known that ellagitannins from cloudberries are strong inhibitors of the human pathogen bacteria Staphylococcus and Salmonella (Puupponen-Pimiä, et al., 2005). In the same article as just referred to it is also mentioned that even though berry phenolics might contribute to antimicrobial activity against some human pathogens, the phenolics in the same time are not active against some probiotic lactic acid bacteria. Not much focus has been put on the antimicrobial action of phenols against food spoilage microorganisms.
2.3.5 Hydroxybenzoic acids
The group of hydroxybenzoic acid derivatives (HBA‟s) has a large variety of members. The variation is due to different levels of hydroxylation and methoxylation of the central aromatic ring. Each number in figure 2.5 below represents a carbon atom on which either an OH group or an OCH3 group can be positioned, different according to the HBA in question. The most simple HBA is benzoic acid (compare figure 2.5 with figure 2.2 (a) above). Further, the HBA including three OH groups on the position of carbon atom number 3, 4 and 5 (3,4,5-trihydrobenzoic acid) is none other than the phenolic acid mentioned above; gallic acid (compare figure 2.5 with figure 2.4 (c) above) (Pietta et al., 2003). Figure 2.5 – Basic structure of hydroxybenzoic acids (Pietta et al., 2003). Compare this figure with figure 2.2 (a) of benzoic acid, above.

10
The HBA‟s mainly occurs as conjugates, even though they can be found as free acids in some fruits. One such conjugate is as mentioned above; the dimer of gallic acid, ellagic acid, which esterified with a sugar gives ellagitannins (hydrolysable tannins) (Pietta et al., 2003). Examples of other HBA‟s are salicylic acid (2-hydroxybenzoic acid) and vanillic acid (4-hydroxy-3-methoxybenzoic acid). HBA‟s can be found to a quite high extent in different berries, for example in cloudberries. In this project benzoic acid is of greatest interest. However, if comparing the levels of HBA‟s and ellagitannins in cloudberries the later are of much higher level, with an approximately relation of 10:1000 (Kähkönen, et al., 2001). As can be understood when studying the theory behind phenols, the group is large and complex. Classification into different groups of phenols and phenolic acids are stated, but they can differ some from author to author.
2.4 Bioscreen C
When the project first was thought of, the intention was to use the equipment Bioscreen C for analysis. The reason for using Bioscreen C is that it is an easy and smooth technique which yields large amounts of analyse data. Bioscreen C is an atomized, computer-controlled equipment which measures the optical density (OD) of liquid samples. The OD is related to the growth of a microorganism inoculated into the sample and the results are presented as growth curves. The different samples are placed into small wells on microtiter plates (of so called “Honeycomb” format) with 100 wells per plate. Two plates can be placed in the equipment at once, making it possible of running 200 samples at the time. Each well has a volume of 300 µl. Bioscreen C includes an incubator system with temperature control, which makes it possible to study microbial growth during different temperatures (Growth Curves, Electronic). In this project the growth of L. plantarum and C. famata are to be analyzed using Bioscreen C. One limitation which is needed to think of is that when a screening is performed in a liquid model system, the results might not be directly transferable to any food product of interest (Davidson & Branen, 1993). Therefore the measurements from Bioscreen C shall be counted as a first screening method, from which the results gained can be further verified and studied. A study must also be performed on the specific food product in question to be able to draw more accurate conclusions in that specific case.
11
3. Materials and methods
This chapter will provide the reader with information about how the laboratory part of the project was performed. The chapter will include information about the two major trials – “MIC-test 1; in test tubes” and “MIC-test 2; in Bioscreen C”. First, however, the different materials used during the laboratory part will be presented.
3.1 Microorganisms
Yeasts, moulds and bacteria can all be a problem concerning spoilage of food products, but in this study the focus will lay on spoilage bacteria and yeast. The reason to exclude moulds is that Bioscreen C is used as analysing tool and moulds is problematic to measure using this method.
3.1.1 Lactobacillus plantarum
Lactobacillus plantarum was first chosen since it came to knowledge that the bacterium can be a contamination problem in cider. Cider was the first food product of interest during this project and the first aim was to set up a model system for cider where the preservative effect of cloudberries should be investigated. However, due to time limitations no trials in a food product model system were performed. Further literature studies showed that L. plantarum also can be found as a spoilage bacterium in certain fish products, for example in marinated herring (Blackburn, 2006) (which was also a food model system thought of, but not performed in the end due to time limitation). The strain used was L. plantarum SIK225 (CCUG305033; ATCC149174). L. plantarum was cultivated from a frozen stage on MRS-plates in 30˚C. Further, it was cultivated once more on a new MRS-plate and incubated at 30˚C. The colonies are round and white and have a characteristic acidic odour.
3.1.2 Candida famata
In a later part of the laboratory work the yeast specie Candida famata was included in the trials. This was done when a proper method was worked out and the use of Bioscreen C was decided, which allows a larger amount of samples to be analysed. The strain used was C. famata SIK628 (CCUG54658). As described for L. plantarum, C. famata was also cultivated from a frozen stage on MRS-plates in 30˚C. And again, one more cultivation was performed on a new MRS-plate and in 30˚C. The colonies are round and white, but with a slightly more yellowish nuance than L. plantarum. The colonies are also slightly smaller than the colonies of the lactobacillus and the odour is characteristically yeast-like.
3 CCUG – Culture Collection University of Göteborg; <www.ccug.se> 4 ATCC – The Global Bioresource Center; <www.atcc.org>

12
3.2 Media
The media used from the beginning was NB+glu (Nutrition Broth with 1% glucose) (Oxide). However, during the project a switch of media to MRS (de Man, Rogosa and Sharpe) (Oxide) was done. MRS can be used both as agar and as broth and it was used as both in this project; overnight cultures were grown in MRS broth and the CFU tests were grown on MRS agar plates. CCUG states that a good media for culturing L. plantarum is MRS (CCUG, Electronic).
3.3 Cloudberry powder
In the early stage of the project, it was decided to work with a powder from cloudberries. In articles studied, the methods often include lipophilized berry powder. The company Immun5 kindly provided a cloudberry powder, a new product in their assortment, which was dried but not freeze dried. The powder was instead dried during a longer time in a temperature which was not exceeding 40˚C. An analysis to screen for any microbial growth in the powder was performed. The cloudberry powder was spread directly on blood plates (horse blood) and on TSA (Tryptic Soy Agar) plates, the powder was also elutriated and diluted in series and spread on separate blood- and TSA plates. Blood- and TSA plates are both general media, neither inhibiting nor selective. The plates for the microbial control of the cloudberry powder were placed in an incubator holding 30˚C for three days. Colonies were found on both plates and identified as Aspergillus niger and Bacillus (possibly B. cereus). Whit these results it became necessary to somehow sterilize the powder. Autoclavation (TOMY Autoclave SS-325), using different temperatures (100 to 121 ˚C) and times (1 to 10 minutes) in different combinations, was the sterilizing method investigated. However, autoclavation, at least according to the parameters tested, was not successful in getting rid of the spores of Bacillus. Another cloudberry powder was kindly provided from Immun, this time from a new supplier and this powder was lipophilized. However, microbial growth was detected also in this powder making it hard to work with. The microbial growth in the powders purchased, made it impossible to work with those powders. Any unwanted and uncontrolled microbial growth existing could affect all other microbial growth. The microorganisms inoculated for investigation in the trials might be out concurred by the existing unwanted flora and there fore the results would not be of any trustable value. All the problems along the way of working with the powder resulted in an exclusion of it. Instead the laboratory work continued with the possibilities of working with a juice of cloudberries.
5Den Norrländska Hälsobutiken i Skellefteå, Sweden, <www.immun.se>.

13
3.4 Fresh cloudberries and cloudberry juice
By contacts it became possible to purchase fresh, frozen cloudberries for experimental purpose. The berries were thawed in their buckets in room temperature and then pressed, using an old type of press (HAFICO, H. Fischer & Co., Düsseldorf-1) receiving a cloudberry juice. Ideally, the juice should have been clear enough to be possible for direct use in the Bioscreen C equipment, but that was not fully the case. Moreover, the intention was to get rid of possible unwanted microorganims by sterile filtering the juice and thereby avoiding heat treatment. However, that treatment demands a quite clear juice and since the juice was not clear enough sterile filtering was excluded. To receive a clearer juice it was filtered through a sieve (Sieve no. 7106) covered with four layers of gauze fabric. After that the juice was poured through a funnel, likewise covered with four layers of gauze fabric. The loose bottom sediment was avoided when pouring. Cloudberries were purchased at two occasions, but from the same supplier. The same filtering steps were performed on the juices from the two batches of berries. The juice from the first batch was only pressed and filtered, as described above, and is referred to as “Juice 1”. The juice from the second batch of cloudberries, and which was only pressed and filtered, is referred to as “Juice 2”. To get rid of any possible unwanted microorganisms in the juice it was heat treated, since the sterile filtering was not possible. The heat treatment was performed as follows;
o Water bath holding 80˚C (5 minutes) o Cool on ice o Water bath holding 95˚C (3 minutes) o Cool on ice
The first heating step activates the spores if any present, making them more sensitive. The next heating step kills the now active and sensitive spores. The temperatures and times used were based on information of when spores are activated and by information of heat treatment of phenolics kindly provided from Daniel Svensson7. Before the juice was heat treated it was freezed for two weeks. The juice which originated from the second batch of cloudberries and was pressed, filtered and freezed is referred to as “Juice 2 (fr)”. The juice which originated from the second batch but was pressed, filtered, freezed and then heat treated is referred to as “Juice 2 (fr+ht)”. 6 Sieve no. 710; lend from the Department of Structure and Material Design, SIK. “BS 410 Laboratory Test
Sieve, „Labassco‟ Inter Med (Gbg-Sthlm), Aperature: 710 µm, Tolerance: Full, Pat. No.: 667924, Frame mat‟l:
Brass, Mesh mat‟l: Brass, Ser. No.: 075523, „Endecotts Ltd.‟ London, England.” 7 Contact with Daniel Svensson, Master of Science student at the Master programme Biotechnology, Chalmers
University of Technology, Göteborg, Sweden, November 2009.

14
3.5 Analysis of the cloudberry juice
The cloudberry juice used for the laboratory work was sent for analysis to Eurofins8 and to University of Helsinki, via Marina Heinonen9. Eurofins performed analysis of ascorbic acid and benzoic acid of “Juice 2”. University of Helsinki performed analysis of phenolic content of “Juice 2 (fr)” and “Juice 2 (fr+ht)”. For detailed information about the two analyses see Appendix A. Two other samples was also sent for analysis at Eurofins, “Juice 1” early during the project and “Juice 2” after it had been frozen for almost three months (“Juice 2 (fr 3 months)”), late in the project. These results were used for confirmation of the earlier received results and are presented in Appendix B.
3.6 MIC-test 1; in test tubes
A first minimal inhibitory concentration test (MIC-test), “MIC-test 1; in test tubes”, was performed to gain knowledge about at which concentrations the cloudberry juice were inhibiting the food spoilage bacteria L. plantarum. This trial was performed doing plate spreading from test tubes. The different concentrations Hj0-Hj10 were prepared with cloudberry juice and NB+glu as the media (table 3.1). The pH of the different samples was the uncontrolled pH at which the sample became when mixing respectively juice and medium. Table 3.1 – Samples in “MIC-test 1; in test tubes”
Sample NB+glu [%]
Cloudberry juice* [%] pH
Hj0 100 0 6,9
Hj1 90 10 4,32
Hj2 80 20 -
Hj3 70 30 -
Hj4 60 40 -
Hj5 50 50 3,61
Hj6 40 60 -
Hj7 30 70 -
Hj8 20 80 -
Hj9 10 90 -
Hj10 0 100 3,44
*The cloudberry juice used was “Juice 1”.
To each sample a concentration of approximately 10^4 L. plantarum was inoculated. The test tubes were placed in an incubator holding 30˚C and small volumes for plate spreading for CFU count was taken day 0, day 3 and day 7.
8 Eurofins Food & Agro Sweden AB, Lidköping, Sweden, <www.eurofins.se>. 9 Marina Heinonen, Docent (Food chemistry), University of Helsinki, Finland.

15
3.7 MIC-test 2; in Bioscreen C
When more knowledge about the concentration intervals for inhibition of L. plantarum was gained, a larger trial was set up. Since Bioscreen C now was used a lager number of samples could be analysed, why the trial also included C. famata. “MIC-test 2; in Bioscreen C” aimed to study the influence of pH and the differences or similarities of using cloudberry juice or benzoic acid in different concentrations as preservation media. Benzoic acid was used as a reference of an existing preservative and also for comparison to the natural content of the benzoic acid in the cloudberries. The different samples tested in “MIC-test 2; in Bioscreen C” were the following: Table 3.2 – Samples in “MIC-test 2; in Bioscreen C”.
Sample MRS [%] Pepton water [%]
Cloudberry juice* [%]
Benzoic acid, added [mg/l]
Benzoic acid, natural content ** [mg/l]
MRS 100 - - - -
TN70 70 30 - - -
TN50 50 50 - - -
TN30 30 70 - - -
Bs1 90 10 - 200 -
Bs2 90 10 - 380 -
Bs3 90 10 - 1000 -
Bs4 90 10 - 2000 -
Hj30 70 - 30 - 114
Hj50 50 - 50 - 190
Hj70 30 - 70 - 266
(*) – The cloudberry juice used was “Juice 2 (fr+ht)”, (**) – Based on results from Eurofins (Appendix A & Table 4.1).
The concentrations of cloudberry juice (Hj30, Hj50 & Hj70) tested were based on the results from MIC-test 1 (section 4.1). The lower middle concentration of benzoic acid (Bs2) tested was based on the results from the analysis of free benzoic acid content in the cloudberry juice from Eurofins (Appendix A). The maximal concentration (Bs4) was based on maximal values allowed due to the National Food Administration in Sweden (Livsmedelsverket, Electronic). The lowest concentration (Bs1) used was tested to have a lowest value and the higher middle concentration (Bs3) was tested to have one in between. The concentrations of benzoic acid used referred to the free benzoic acid, but due to the solubility factor (section 2.3.2) it was used in the form of sodium benzoate. Therefore the concentrations had to be recalculated to correspond to the amount sodium benzoate needed to get the concentration of free acid wanted. The following concentrations of sodium benzoate are corresponding to respectively benzoic acid sample; Bs1 – 236 mg/l; Bs2 – 448 mg/l; Bs3 – 1180 mg/l; Bs4 – 2360 mg/l.

16
When the concentration of cloudberry juice increased in the samples, the concentration of medium (MRS) decreased. To confirm that the microorganisms could manage to grow even under conditions of fewer nutrients, a nutrition control was performed. The corresponding samples of cloudberry juice and nutrition control are:
o Hj30 to TN70 (70% MRS) o Hj50 to TN50 (50% MRS) o Hj70 to TN30 (30% MRS)
Adjustments of pH of the samples were done using 1 M NaOH and 1 M HCl. The procedure to obtain the right amount of each solution was done by carefully measuring the pH while dripping either NaOH or HCl into a test volume of respectively sample until the pH desired was achieved. There after the amount of drops were weighted and transferred to a corresponding volume of NaOH or HCl. Respectively volume was added to respectively test volume of the sample for controlling that the procedure went as desired. There after all the samples could be adjusted to the right pH. To each sample a concentration of 10^4 to 10^5 of respectively microorganism, L. plantarum and C. famata, was inoculated. The different samples were prepared and the trial was run in Bioscreen C equipment in 30˚C. The results were given as growth curves with optical density (OD) versus time. The samples were in eight replicates from the beginning, but throughout the trial some samples were taken directly from the Bioscreen plates for analysis, resulting in fewer replicates for some samples. The difference in replicates is taken into account in the results. The medium (MRS) was analysed as a background reference, using the edges of the plates where between 40 to 56 replicates were included depending on set up (see explanation of set ups below). Also the different cloudberry juice concentrations were analysed as background value on the edges of the last set up of the trial, each of the three concentrations as ten replicates. In parallel to the microtiter plates in Bioscreen C, there was also a set up of the same load of microtiter plates in an incubator holding 30˚C. From these parallel plates samples for CFU (Colony Forming Unit) could be taken. Samples for CFU count were taken from some wells of interest, diluted in series, spread on MRS agar plates, incubated in 30˚C for two days and counted. The parallel plates were made to be able to take out samples for analysis without decreasing the amount of replicates in Bioscreen C. However, as mentioned above, some samples were taken from the wells in the Bioscreen C. This was to confirm the same development in the Bioscreen C as in the parallel plates in the incubator. “MIC-test 2; in Bioscreen C”; was divided into three parts depending on estimated time for growth (S=fast, M=medium & L=slow). Each set up included the maximum
17
capacity of two plates (200 wells). Each set up was run for 15 days to include an investigation of a longer time perspective. The first six days was run automatically with constant measurements within an interval of 10 to 30 minutes and after that measurements were performed manually once a day. The reason for switching from automatically to manually measurements was to optimize the time consumption and run two set ups in parallel. It was important to perform frequent measurements the first time since during these days the growth curves was developing. The growth after six days was not as fast as from start, allowing fewer measurements. At the last day of each trial, day 15, each well was evaluated visually just to get some extra information about the appearance of the samples and what the growth/non growth was looking like.
3.8 Calculation of generation times & lag phases
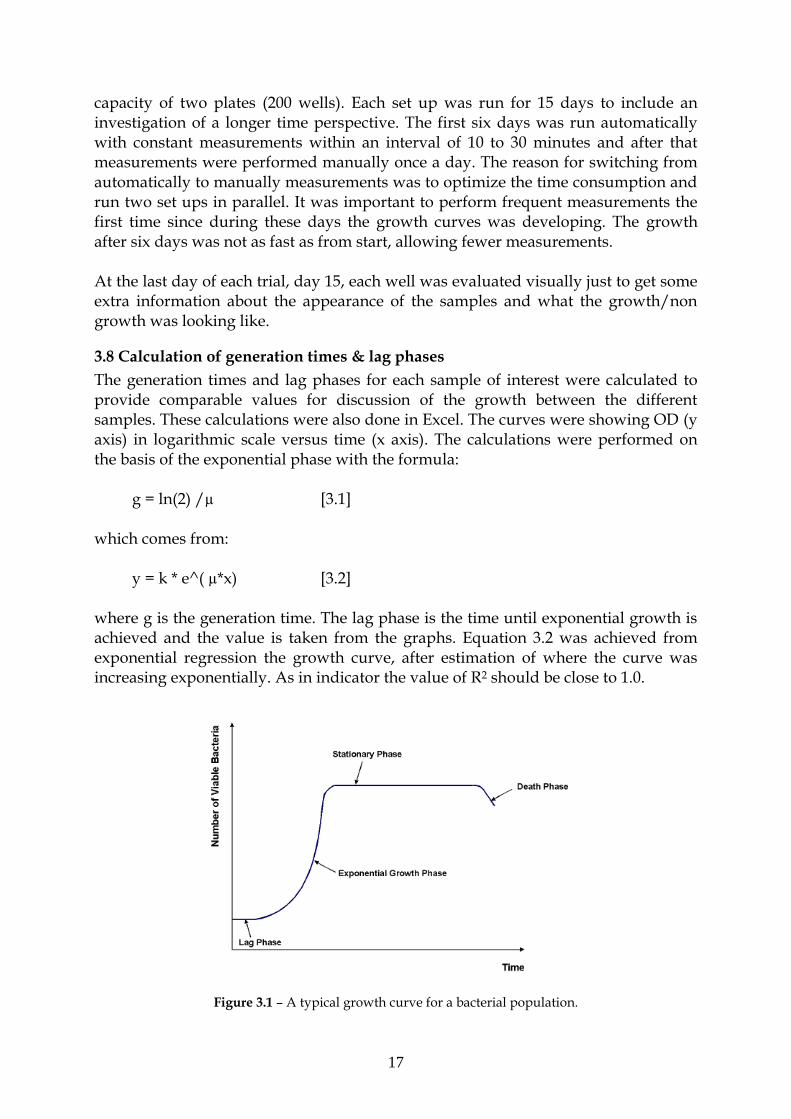
The generation times and lag phases for each sample of interest were calculated to provide comparable values for discussion of the growth between the different samples. These calculations were also done in Excel. The curves were showing OD (y axis) in logarithmic scale versus time (x axis). The calculations were performed on the basis of the exponential phase with the formula: g = ln(2) /µ [3.1] which comes from: y = k * e^( µ*x) [3.2] where g is the generation time. The lag phase is the time until exponential growth is achieved and the value is taken from the graphs. Equation 3.2 was achieved from exponential regression the growth curve, after estimation of where the curve was increasing exponentially. As in indicator the value of R2 should be close to 1.0.
Figure 3.1 – A typical growth curve for a bacterial population.

18
3.9 Statistical analysis
The data gathered from the measurements in Bioscreen C was put together into an Excel file and from the replicates of the samples a mean value was calculated for each and every sample. The standard deviation (SD) was also calculated for each sample. The SD values are presented in the graphs in the results (chapter 4) as positive deviation.

19
0,0
1,0
2,0
3,0
4,0
5,0
6,0
0 2 4 6 8
Time [days]
log
(CF
U)
Hj4
Hj5
Hj6
Hj7
Hj8
Hj9
Hj10
4. Results In this chapter all results of value for the study are presented. The chapter is divided into the two MIC-tests performed and the analysis results of the cloudberry juice are also presented in one separate section. “MIC-test 2; in Bioscreen C” is further divided in respectively microorganism, where the results are presented as growth curves, generation times and lag phases and CFU count.
4.1 MIC-test 1; in test tubes
It can be seen in figure 4.1 that Hj4 was slowly increasing from day 0 until day 3. At day 7 it was not possible to count the colonies from Hj4 at the dilution series analysed. Concerning Hj0-Hj3, the growth was too large for the samples being of any interest. In the sample Hj5, the decrease in growth could be viewed from day 3 until day 7. For Hj6-Hj10 the growth curves decreased from the beginning and Hj7-Hj10 even resulted in zero values at day 7. The values for Hj7 and Hj9 are following the same curve, why they are behind each other in the figure.
Figure 4.1 – Growth of L. plantarum with addition of different concentrations of cloudberry juice (40-100%). Hj=cloudberry juice (from Swedish; hjortronjos). pH of Hj5 = 3.61 & Hj10 = 3.44.

20
4.2 Analysis of cloudberry juice
The results from the samples of cloudberry juice sent for analysis to Eurofins and to University of Helsinki can be seen in table 4.1 and table 4.2. In Appendix A the analysing methods used at respectively analysing place are described briefly. Late during the report writing another sample was sent to Eurofins for analysis of benzoic acid and ascorbic acid content. The aim of another analysis was to confirm the earlier results. The analysed juice was “Juice 2” but it had now been frozen for almost three months. The results from the late analysis are also presented in table 4.1 and referred to as “Juice 2 (fr 3 months)”. More detailed information can be studied in Appendix B. Table 4.1 – Analysis results from Eurofins, “Juice 2” & “Juice 2 (fr 3 months)”.
Compound Juice 2 Juice 2 (fr 3 months)
Ascorbic acid, Vit. C [mg/100g] 9,2 33
Benzoic acid [g/kg] 0,38 0,41
Table 4.2 – Analysis results from University of Helsinki, “Juice 2 (fr)” & “Juice 2 (fr+ht)”.
Phenolic compound Juice 2 (fr)
Juice 2 (fr+ht)
HBA's 39 73
HCA's 12,5 17,5
Anthocyanins 0,4 0,2
Flavonols nd nd
Flavanols nd nd
Ellagitannins: 87 154
-dimers 41 60
-trimers 18 35
-other (not id) 28 59
Ellagic acid 0,1 4,3
Total phenolics* 139 249
Values are presented as µg/ml juice. HBA‟s=Hydroxybenzoic acids, HCA‟s=Hydroxycinnamic acids, nd=not detected, *=sum of phenolic compounds analyse by using UPLC.
Transferring the units for benzoic acid from table 4.1 to the same units as presented in table 4.2; 0.38 g/kg = 380 µg/ml and 0.41 g/kg = 410 µg/ml.

21
4.3 MIC-test 2; in Bioscreen C
The results from “MIC-test 2; in Bioscreen C” are divided into separate parts and the first results presented are for the medium (MRS). There after results concerning respectively microorganism are presented.
4.3.1 OD of the media, MRS
0
0,2
0,4
0,6
0,8
1
1,2
1,4
1,6
1,8
0 2 4 6 8 10 12 14 16
Time [days]
OD
MRS S
MRS M
MRS S without outliers
MRS avg
Figure 4.2 – OD values for pure medium, MRS. “MRS S” from the first trial (S), “MRS M” from the second trial (M), “MRS S without outliers” is MRS S with the outlier values excluded and “MRS avg” is the average value from MRS S without outliers and MRS M. The graph in figure 4.2 shows the measurements from Bioscreen C for the OD values of 40 to 56 replicates of the medium MRS, where no microorganisms are inoculated. The values for MRS are used as a reference to show the “background” for the samples. (Also references for the different cloudberry samples are measured for their background values; Hj30, Hj50 and Hj70 as seen in figure 4.15). When calculating an average from all the mean values of OD at all time points, it becomes ~0.41. Until day 6 of the trials the values from the two MRS-samples, MRS S and MRS M, are following a similar curve with only some smaller variations. But after day 6 the curves are differing quite much, the most with 0.179 OD units at day 13. The difference between the handling of the measurements until day 6 and after that day is that before day 6 all values are done automatically and in a constant period of time with only 10-30 minutes in between the measurement occasions. After day 6 the measurements are performed manually, only once a day, and only with one single measurement occasion (section 3.7).

22
Searching for outliers for MRS M resulted in correction of only one value. This value was from day 13, and when recalculated that value, the difference between MRS S and MRS M changed from 0.179 to 0.170. When studying the values for MRS S, a couple of outlier values were discovered. When those values were excluded, again a new and less differing curve was achieved. Now looking at day 13, the difference between MRS M (the new value) and MRS S without outliers is 0.103 instead of 0.170.
4.3.2 The microorganisms
The results from “MIC-test 2; in Bioscreen C” concerning the microorganisms are divided into separate head sections and presented as; growth curves, generation times and lag phases and CFU. The head sections are further divided under each section. The growth curves for C. famata was not as clear as for L. plantarum and therefore no generation times or lag phases have been calculated for the yeast. Regarding the CFU values presented below, some of them are mean values of two replicates, while others originate from only one replicate. When a level of “<1” is stated, it means a zero count on the CFU-plate. Since one dilution step was not possible to avoid due to the small volumes worked with, this was the consequence.
4.3.3 Growth curves, L. plantarum
The presented growth curves for L. plantarum are divided into three parts; growth in MRS, growth with addition of benzoic acid and growth with addition of cloudberry juice.

23
0
0,2
0,4
0,6
0,8
1
1,2
1,4
1,6
1,8
0 2 4 6 8 10 12 14 16
Time [days]
OD
pH 6
pH 4.5pH 3
Growth in different concentration of medium, MRS The first results to show in this section are how the growth of L. plantarum in the medium (MRS) develops under the influence of only the adjusted pH‟s.
Figure 4.4 – Growth of L. plantarum in the pure medium, MRS, at different pH and in 30°C.
As can be seen in figure 4.4, L. plantarum manages to grow even under the lowest pH tested in this study (pH 3). However the growth seems to be affected to some extent during this low pH compared to the more optimal initial pH of 6. Form the visual control the last day of the trial, growth could be observed in all the samples in figure 4.4. Figure 4.5, 4.6 and 4.7 shows the values from the OD measurements of the nutritional controls. These are the samples containing different concentrations of medium (70%, 50% & 30% MRS), in other words; the level of nutrients available for the microorganism were lower.

24
0
0,2
0,4
0,6
0,8
1
1,2
1,4
1,6
1,8
0 2 4 6 8 10 12 14 16
Time [days]
OD
pH 6
pH 4.5
pH 3
Figure 4.5 – Growth of L. plantarum in the nutritional control of 70% medium, MRS, (TN70) at different pH and in 30°C.
In figure 4.5 the OD values for the highest content of MRS in the control samples (70% MRS) are showed. For the two higher pH‟s (pH 6 & 4.5) clear growth can be regarded. At pH 3, the curve is quite irregular from start and until just over day 3, but from there and until just over day 7 an increase in growth is seen. After day 7 no more increasing trend can be seen. An outlier value at day 7 makes the appearance of the curve a bit different from how it would have been if a more agreeing value had been available. The growth in pH 3 reaches an OD of about just over 0.55 (excluding the outlier value). The visual appearance of the wells of TN70 at pH 3, the last day of the trial, was stated as “thick growth in patches, outside the patches clear”. For the two other pH‟s distinct growth was observed. It is seen that the SD‟s are increasing for the sample holding pH 3 from between day 4 and 5 and all the way during the rest of the trial. The largest deviation is seen at the outlier value at day 7.

25
0
0,2
0,4
0,6
0,8
1
1,2
1,4
1,6
1,8
0 2 4 6 8 10 12 14 16
Time [days]
OD
pH 6
pH 4.5
pH 3
Figure 4.6 – Growth of L. plantarum in the nutritional control of 50% medium, MRS, (TN50) at different pH and in 30°C.
In the nutritional control containing 50% MRS (TN50) distinct growth can be observed. However, at pH 3 the growth seems slower and delayed to some extent. The maximal OD reached at pH 3 is just over 0.95. This can be compared to the previous showed results for TN70 in figure 4.5 (TN70 – 0.55 & TN50 – 0.95). The visual appearance at the last day of the trial stated for TN50 at pH 3 was “distinct, even growth on the bottom”. For the two other pH‟s distinct growth was also observed.
26
0
0,2
0,4
0,6
0,8
1
1,2
1,4
1,6
1,8
0 2 4 6 8 10 12 14 16
Time [days]
OD
pH 6
pH 4.5
pH 3
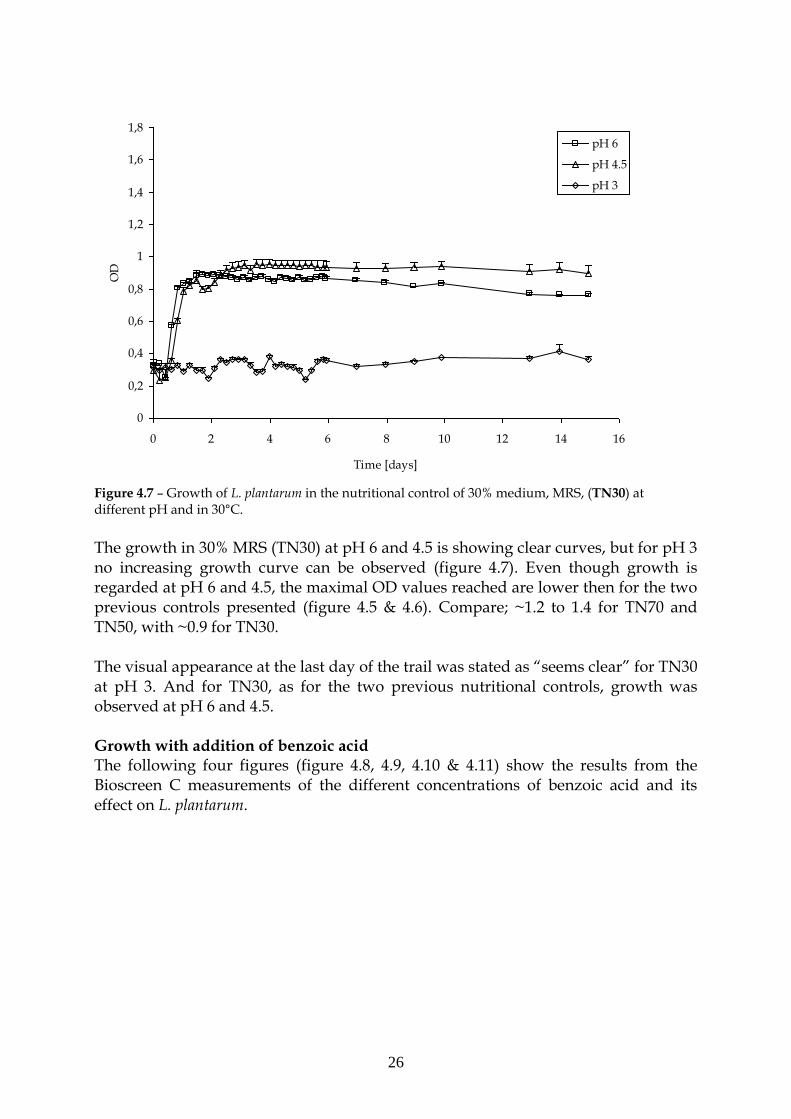
Figure 4.7 – Growth of L. plantarum in the nutritional control of 30% medium, MRS, (TN30) at different pH and in 30°C. The growth in 30% MRS (TN30) at pH 6 and 4.5 is showing clear curves, but for pH 3 no increasing growth curve can be observed (figure 4.7). Even though growth is regarded at pH 6 and 4.5, the maximal OD values reached are lower then for the two previous controls presented (figure 4.5 & 4.6). Compare; ~1.2 to 1.4 for TN70 and TN50, with ~0.9 for TN30. The visual appearance at the last day of the trail was stated as “seems clear” for TN30 at pH 3. And for TN30, as for the two previous nutritional controls, growth was observed at pH 6 and 4.5. Growth with addition of benzoic acid The following four figures (figure 4.8, 4.9, 4.10 & 4.11) show the results from the Bioscreen C measurements of the different concentrations of benzoic acid and its effect on L. plantarum.

27
0
0,2
0,4
0,6
0,8
1
1,2
1,4
1,6
1,8
0 2 4 6 8 10 12 14 16
Time [days]
OD
pH 6pH 4.5pH 3
Figure 4.8 – Growth of L. plantarum in 200 mg/l benzoic acid (Bs1) at different pH and in 30°C. In figure 4.8 clear growth curves are seen for the lowest concentration of benzoic acid (Bs1) at the two highest pH‟s tested (pH 6 & 4.5). When studying the lowest pH used (pH 3) a difference is seen from the higher pH‟s; the growth is now less and slower. The SD‟s are higher for growth in pH 3 than for growth in pH 6 and 4.5. This concentration of benzoic acid (Bs1) is most similar the cloudberry juice sample Hj50 (figure 4.13). The amount benzoic acid in respectively sample is; 200 mg/l (Bs1) and 190 mg/l (Hj50).
28
0
0,2
0,4
0,6
0,8
1
1,2
1,4
1,6
1,8
0 2 4 6 8 10 12 14 16
Time [days]
OD
pH 6pH 4.5pH 3
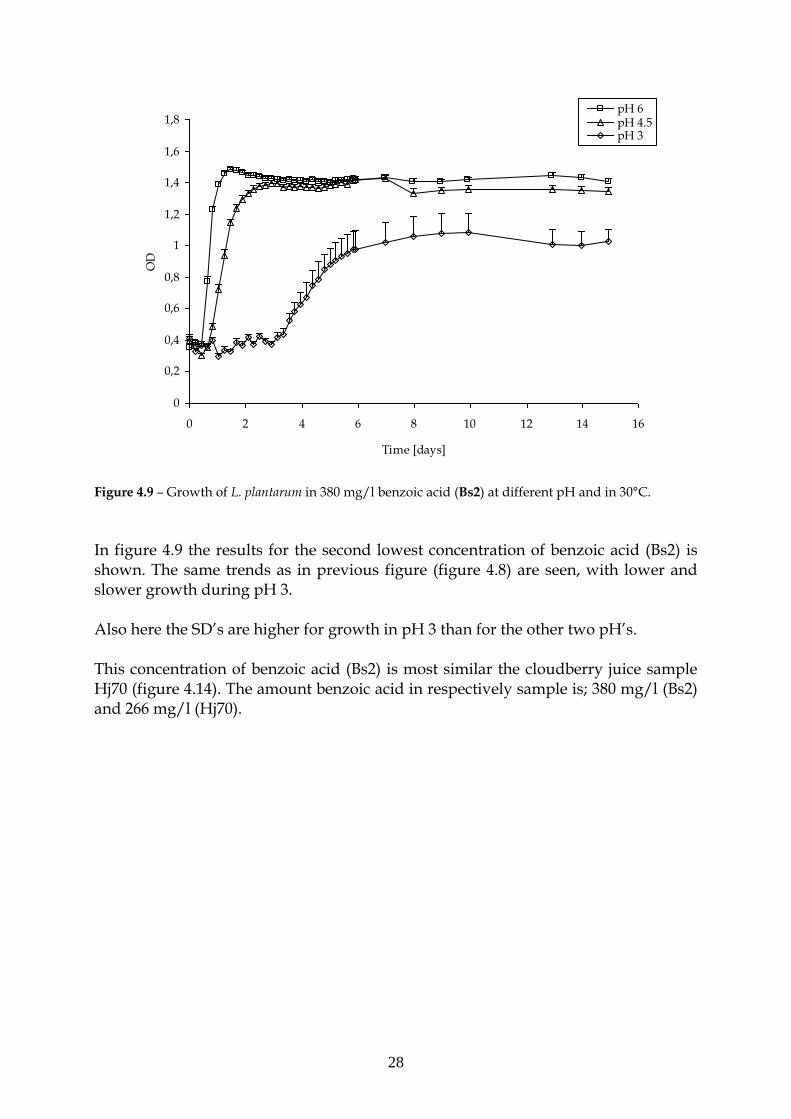
Figure 4.9 – Growth of L. plantarum in 380 mg/l benzoic acid (Bs2) at different pH and in 30°C.
In figure 4.9 the results for the second lowest concentration of benzoic acid (Bs2) is shown. The same trends as in previous figure (figure 4.8) are seen, with lower and slower growth during pH 3. Also here the SD‟s are higher for growth in pH 3 than for the other two pH‟s. This concentration of benzoic acid (Bs2) is most similar the cloudberry juice sample Hj70 (figure 4.14). The amount benzoic acid in respectively sample is; 380 mg/l (Bs2) and 266 mg/l (Hj70).

29
0
0,2
0,4
0,6
0,8
1
1,2
1,4
1,6
1,8
0 2 4 6 8 10 12 14 16
Time [days]
OD
pH 6pH 4.5pH 3
Figure 4.10 – Growth of L. plantarum in 1000 mg/l benzoic acid (Bs3) at different pH and in 30°C. The results for the samples with the second highest concentration of benzoic acid (Bs3) are shown in figure 4.10. Compared to the two previous concentrations (Bs1 & Bs2), a bigger difference between pH 6 and pH 4.5 is seen here. In the sample of pH 3 no increase of the growth curve could be observed. What can be seen regarding the SD‟s is that they are bigger for the sample holding pH 4.5 in this benzoic acid concentration, than they have been for pH 4.5 in the two lower concentrations (Bs1; figure 4.8 & Bs2; figure 4.9).
30
0
0,2
0,4
0,6
0,8
1
1,2
1,4
1,6
1,8
0 2 4 6 8 10 12 14 16
Time [days]
OD
pH 6pH 4.5pH 3
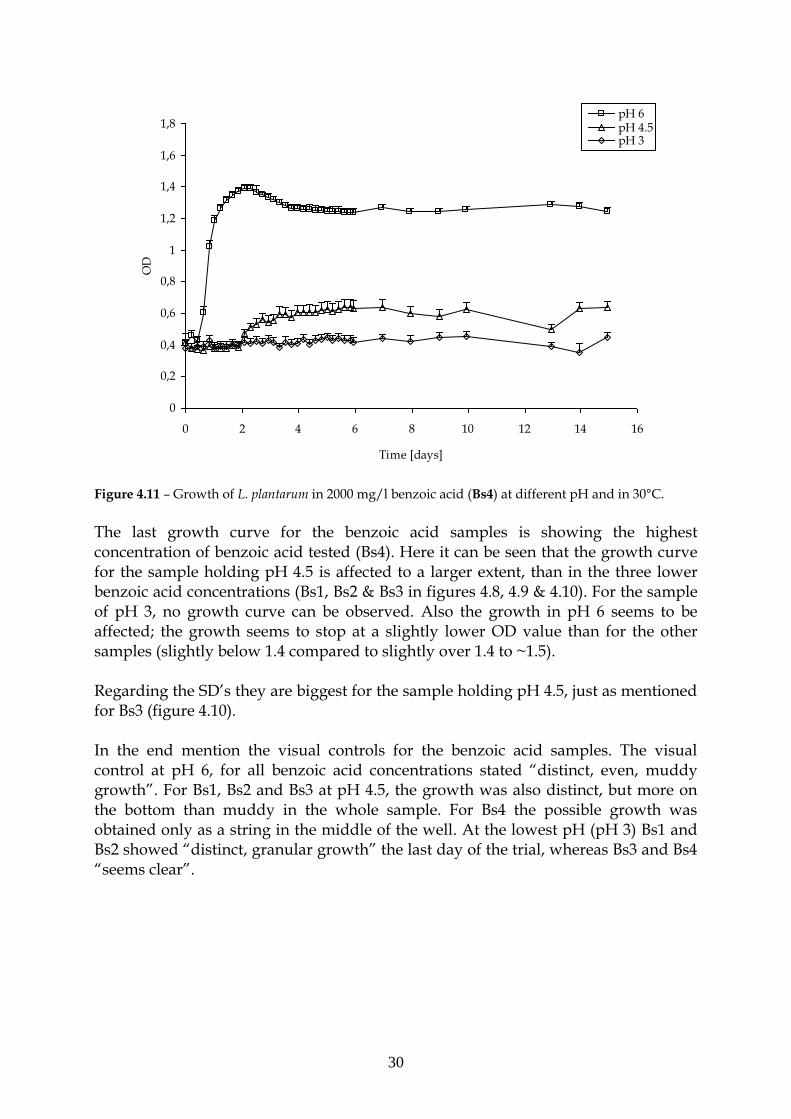
Figure 4.11 – Growth of L. plantarum in 2000 mg/l benzoic acid (Bs4) at different pH and in 30°C. The last growth curve for the benzoic acid samples is showing the highest concentration of benzoic acid tested (Bs4). Here it can be seen that the growth curve for the sample holding pH 4.5 is affected to a larger extent, than in the three lower benzoic acid concentrations (Bs1, Bs2 & Bs3 in figures 4.8, 4.9 & 4.10). For the sample of pH 3, no growth curve can be observed. Also the growth in pH 6 seems to be affected; the growth seems to stop at a slightly lower OD value than for the other samples (slightly below 1.4 compared to slightly over 1.4 to ~1.5). Regarding the SD‟s they are biggest for the sample holding pH 4.5, just as mentioned for Bs3 (figure 4.10). In the end mention the visual controls for the benzoic acid samples. The visual control at pH 6, for all benzoic acid concentrations stated “distinct, even, muddy growth”. For Bs1, Bs2 and Bs3 at pH 4.5, the growth was also distinct, but more on the bottom than muddy in the whole sample. For Bs4 the possible growth was obtained only as a string in the middle of the well. At the lowest pH (pH 3) Bs1 and Bs2 showed “distinct, granular growth” the last day of the trial, whereas Bs3 and Bs4 “seems clear”.

31
0
0,2
0,4
0,6
0,8
1
1,2
1,4
1,6
1,8
0 2 4 6 8 10 12 14 16
Time [days]
OD
pH 6
pH 4.5
pH 3
Growth with addition of cloudberry juice The following three figures (figure 4.12, 4.13 & 4.14) show the results from the Bioscreen C measurements where growth of L. plantarum was affected by different concentrations of cloudberry juice as antimicrobial agent.
Figure 4.12 – Growth of L. plantarum in 30% cloudberry juice (Hj30) at different pH and in 30°C. Figure 4.12 shows the results for the lowest cloudberry juice concentration tested (Hj30). At pH 6 and 4.5 the growth curves are clear and reach relatively high maximal OD‟s. At the lowest pH (pH 3) the growth curve more is more affected, the growth seems slower and delayed. The visual appearance of Hj30 at pH 3 the last day of the trial stases; “distinct, even growth, thicker in patches”. Both higher pH‟s are showing distinct growth from the visual control. The SD‟s for the sample holding pH 3 are relatively high from about day 4 and until the end of the trial. For pH 6 and 4.5, the SD‟s are relatively small.

32
0
0,2
0,4
0,6
0,8
1
1,2
1,4
1,6
1,8
0 2 4 6 8 10 12 14 16
Time [days]
OD
pH 6
pH 4.5
pH 3
Figure 4.13 – Growth of L. plantarum in 50% cloudberry juice (Hj50) at different pH and in 30°C. No increase in growth curve can be observed for Hj50 at pH 3 (figure 4.13). For the two higher pH‟s tested, clear growth curves are achieved, but at this cloudberry concentration it seems to be a slightly bigger difference between the two pH‟s, compared to in the previous figure showing Hj30 (figure 4.12). The visual appearance of Hj50 at pH 3 was stated as “seems clear”. And the two higher pH‟s was mentioned to show distinct growth. The SD‟s are quite small for all measurements. The concentration of benzoic acid in the cloudberry juice sample Hj50 is most similar the benzoic acid sample Bs1 (figure 4.8). The amount benzoic acid in respectively sample is; 190 mg/l (Hj50) and 200 mg/l (Bs1).
33
0
0,2
0,4
0,6
0,8
1
1,2
1,4
1,6
1,8
0 2 4 6 8 10 12 14 16
Time [days]
OD
pH 6
pH 4.5
pH 3
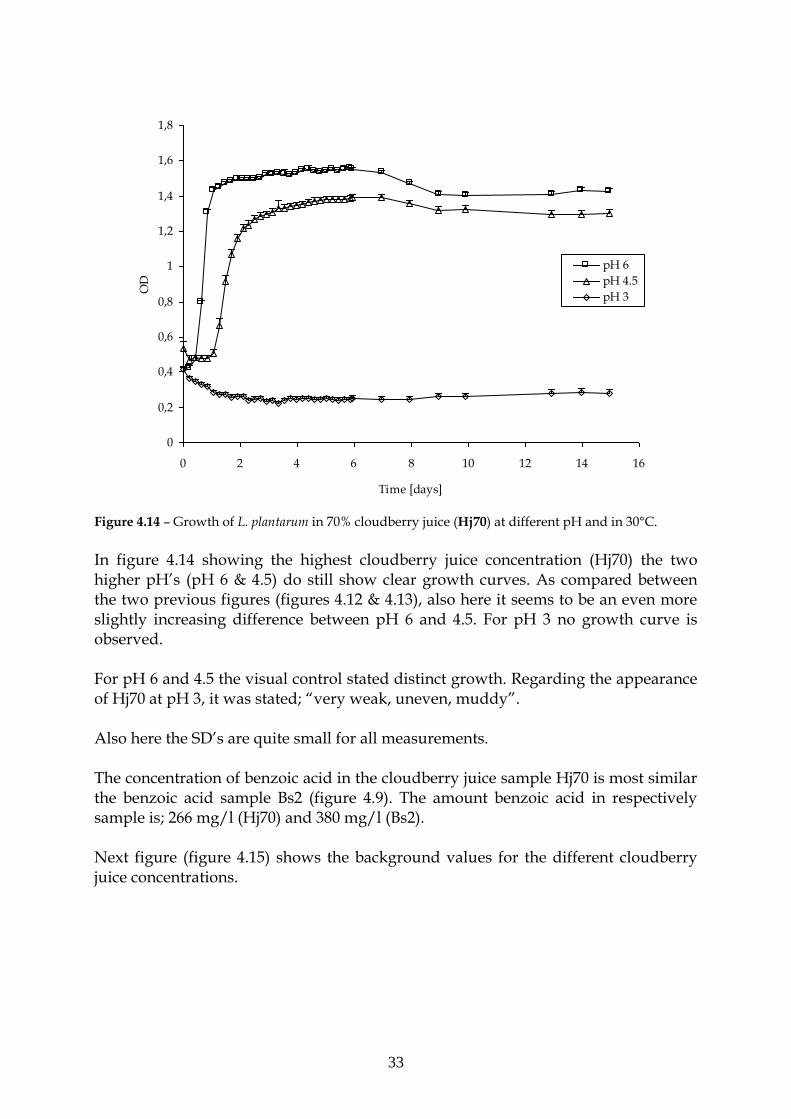
Figure 4.14 – Growth of L. plantarum in 70% cloudberry juice (Hj70) at different pH and in 30°C. In figure 4.14 showing the highest cloudberry juice concentration (Hj70) the two higher pH‟s (pH 6 & 4.5) do still show clear growth curves. As compared between the two previous figures (figures 4.12 & 4.13), also here it seems to be an even more slightly increasing difference between pH 6 and 4.5. For pH 3 no growth curve is observed. For pH 6 and 4.5 the visual control stated distinct growth. Regarding the appearance of Hj70 at pH 3, it was stated; “very weak, uneven, muddy”. Also here the SD‟s are quite small for all measurements. The concentration of benzoic acid in the cloudberry juice sample Hj70 is most similar the benzoic acid sample Bs2 (figure 4.9). The amount benzoic acid in respectively sample is; 266 mg/l (Hj70) and 380 mg/l (Bs2). Next figure (figure 4.15) shows the background values for the different cloudberry juice concentrations.

34
0
0,2
0,4
0,6
0,8
1
1,2
1,4
1,6
1,8
0 2 4 6 8 10 12 14 16
Time [days]
OD
Hj30
Hj50
Hj70
Figure 4.15 – The background values of OD for the three concentrations of cloudberry juice; Hj30, Hj50 & Hj70. From the measurements of OD for the backgrounds of the three different cloudberry juice concentrations a total mean value has been counted. Those averages are 0.49, 0.45 and 0.33 for respectively Hj30, Hj50 and Hj70.

35
4.3.4 Generation times and lag phases, L. plantarum
Generation times and lag phases are presented in table 4.3. Table 4.3 – Generation times [h] (left) and lag phases [h] (right) for the different samples with L. plantarum inoculated. 4.3 (a) – Generation times [h] 4.3 (b) – Lag phases [h]
Sample pH Sample pH
6 4,5 3 6 4,5 3
MRS 4,03 7,1 10,1 MRS 12,5 15 15
TN70 4,6 7,3 103,5 TN70 14 14 90,5
TN50 6,5 4,9 14,4 TN50 14 12 50
TN30 4,7 8,6 - TN30 10 16 -
Bs1 4,2 7,4 50,6 Bs1 10 15 110
Bs2 3,9 10,1 37,5 Bs2 13 15 80
Bs3 4,4 12,9 - Bs3 13 25 -
Bs4 6,2 47,2 - Bs4 14 45 -
Hj30 4,2 7,5 29,5 Hj30 12 17 90,5
Hj50 5,1 8,9 - Hj50 13,5 20 -
Hj70 5,8 12,2 - Hj70 12,5 20 -
“-“ meaning no growth could be observed in the growth curves. Regarding the samples of different concentration of MRS, the trend of increasing generation times and lag phases with decreasing pH is confirmed from the values in table 4.3. No clear trend can however be stated concerning decreasing amounts of nutrients available (amount MRS). Considering all samples with benzoic acid, the generation times are increasing with decreasing pH. This is also the case regarding the lag phases; those are increasing with decreasing pH. Except for Bs2 at pH 6 and pH 3, an increase in generation times is also seen with the increase of the concentration of benzoic acid in the samples. The samples Bs3 and Bs4 at pH 3 show no values (-), indicating no increase seen from the growth curves. Further, the lag phases are also following the trend of increasing times with increasing concentrations of benzoic acid. The only exception from the trend is a reversed order regarding Bs1 and Bs2 at pH 3, this is however in line with the divergence mentioned about the generation times. The samples with cloudberry juice are following a trend quite well, with only some small divergences. The trend is that the generation times are increasing both with increasing concentration of juice and with lowering of the pH in the sample. The same can be said about the lag phases; the lag phases are increasing with increasing concentration of juice and decreasing pH.
36
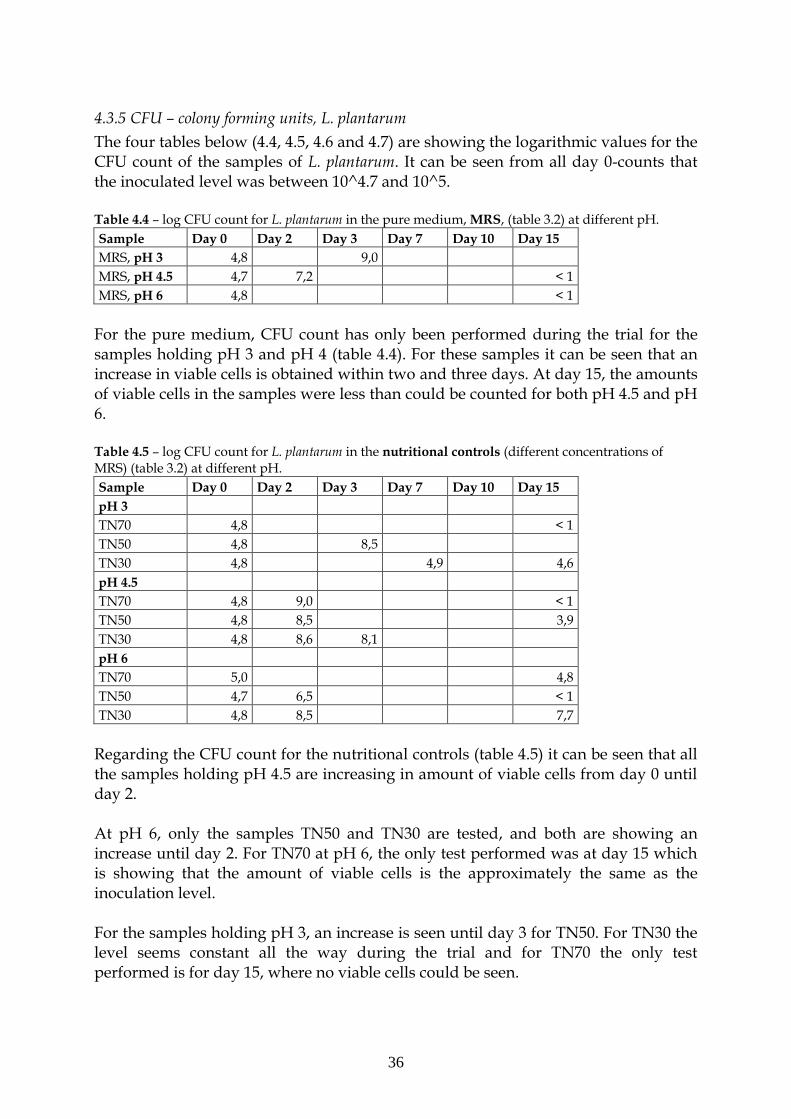
4.3.5 CFU – colony forming units, L. plantarum
The four tables below (4.4, 4.5, 4.6 and 4.7) are showing the logarithmic values for the CFU count of the samples of L. plantarum. It can be seen from all day 0-counts that the inoculated level was between 10^4.7 and 10^5. Table 4.4 – log CFU count for L. plantarum in the pure medium, MRS, (table 3.2) at different pH. Sample Day 0 Day 2 Day 3 Day 7 Day 10 Day 15
MRS, pH 3 4,8 9,0
MRS, pH 4.5 4,7 7,2 < 1
MRS, pH 6 4,8 < 1
For the pure medium, CFU count has only been performed during the trial for the samples holding pH 3 and pH 4 (table 4.4). For these samples it can be seen that an increase in viable cells is obtained within two and three days. At day 15, the amounts of viable cells in the samples were less than could be counted for both pH 4.5 and pH 6. Table 4.5 – log CFU count for L. plantarum in the nutritional controls (different concentrations of MRS) (table 3.2) at different pH. Sample Day 0 Day 2 Day 3 Day 7 Day 10 Day 15
pH 3
TN70 4,8 < 1
TN50 4,8 8,5
TN30 4,8 4,9 4,6
pH 4.5
TN70 4,8 9,0 < 1
TN50 4,8 8,5 3,9
TN30 4,8 8,6 8,1
pH 6
TN70 5,0 4,8
TN50 4,7 6,5 < 1
TN30 4,8 8,5 7,7
Regarding the CFU count for the nutritional controls (table 4.5) it can be seen that all the samples holding pH 4.5 are increasing in amount of viable cells from day 0 until day 2. At pH 6, only the samples TN50 and TN30 are tested, and both are showing an increase until day 2. For TN70 at pH 6, the only test performed was at day 15 which is showing that the amount of viable cells is the approximately the same as the inoculation level. For the samples holding pH 3, an increase is seen until day 3 for TN50. For TN30 the level seems constant all the way during the trial and for TN70 the only test performed is for day 15, where no viable cells could be seen.

37
Table 4.6 – log CFU count for L. plantarum in the different concentrations of benzoic acid (table 3.2) at different pH.
Sample Day 0 Day 2 Day 3 Day 7 Day 10 Day 15
pH 3
Bs1 4,8 8,2
Bs2 4,8 8,0
Bs3 4,8 4,4 3,1 < 1
Bs4 4,8 < 1 < 1 < 1
pH 4.5
Bs1 4,8 8,9 < 1
Bs2 4,8 9,0 < 1
Bs3 4,8 8,7 < 1
Bs4 4,8 8,2 7,7 < 1
pH 6
Bs1 4,8 3
Bs2 4,7 < 1
Bs3 4,8 3,5
Bs4 4,7 6,9 3
Under the stress situation of adding benzoic acid to the samples the results achieved from the CFU counts are presented in table 4.6. At pH 3 only the two lowest concentrations (Bs1 and Bs2) are increasing until day 7. During the same period, Bs3 seems to keep a quite constant level of viable cells, but Bs4 is decreasing and showing no counts on the CFU plates. At a pH of 4.5 all benzoic acid concentrations shows an increase until day 2 or 3. However, at the last day of the trial, day 15, none of the samples contain a countable level of viable cells. At the highest pH used (pH 6) only the highest concentration of benzoic acid (Bs4) was tested before the last day; the CFU count showed an increase with tow log units until day 2. All the concentrations, except for Bs2, are holding a level of viable cells of log 3 units at the last day of the trial, day 15.

38
For the cloudberry juice samples the CFU count gave the following results (table 4.7); Table 4.7 – log CFU count for L. plantarum in the different concentrations of cloudberry juice (table 3.2) at different pH.
Sample Day 0 Day 2 Day 3 Day 7 Day 10 Day 15
pH 3
Hj30 4,8 8,7 4,8
Hj50 4,8 3 < 1 < 1
Hj70 4,8 < 1 < 1 < 1
pH 4.5
Hj30 4,8 8,9 < 1
Hj50 4,8 8,9 < 1
Hj70 4,8 9,2
pH 6
Hj30 4,8 3
Hj50 4,7 7,6 < 1
Hj70 4,8 9,2 < 1
For pH 3, the only sample increasing all the way through the trial was the one with the lowest concentration (Hj30). For Hj50 at pH 3 the first CFU test was performed at day 7, which indicated a decreased amount, however only with one log unit and until day 10 and ahead the CFU level was less than one. For the highest cloudberry juice concentration (Hj70) holding pH 3 the tested days only showed a decrease in the amount of viable cells present. At the pH of 4.5 all the concentrations used showed an increase in viable cells after two or three days. The same was seen for the two highest concentrations (Hj50 & Hj70) at pH 6. For Hj30 at pH 6 the only CFU count performed was at day 15 which showed a CFU of 3 log units.

39
4.3.6 Growth curves, C. famata
The following results show the growth of C. famata in the different samples. First the growth in different concentrations of medium (MRS) are presented, followed by growth with the addition of benzoic acid and in the end cloudberry juice. Growth in different concentration of medium, MRS The two following figures (figures 4.16 & 4.17) are showing growth of C. famata in different concentrations of medium (MRS).
0
0,2
0,4
0,6
0,8
1
0 2 4 6 8 10 12 14 16
Time [days]
OD
pH 6
pH 4.5
pH 3
Figure 4.16 – Growth of C. famata in the pure medium, MRS, at different pH and in 30°C.
The MRS-sample holding pH 6 shows a quit large dip just from start, but after day 1 the curve is slightly increasing again. From day 10, the appearance of the curve looks like a diauxic shift, but that is a statement which can not be proved. The curve does not reach a higher OD than just over 0.54 (with the initial OD of ~0.47, and the OD in the dip ~0.3). The curve at pH 4.5 is showing a slight decrease from start, but after day 8 the curve starts increasing slightly. The curve for pH 3 is quite irregular until a slight increase seen from day 10. From the visual control it was stated that the samples holding pH 6 and 4.5 was looking as “weak, even, muddy growth, slightly granular”. For the sample at pH 3 it was instead stated as “weak growth in patches, slightly granular”.

40
0
0,2
0,4
0,6
0,8
1
0 2 4 6 8 10 12 14 16
Time [days]
OD
TN70, pH 6
TN70, pH 4.5
TN70, pH 3
TN50, pH 6
TN50, pH 4.5
TN50, pH 3
TN30, pH 6
TN30, pH 4.5
TN30, pH 3
Figure 4.17 – Growth of C. famata in the different nutritional controls at different pH and in 30°C.
The reason for plotting all the nutritional controls of C. famata in the same figure was to make clear how much more obvious the growth curves in pH 6 were compared to in pH 4.5 and 3. Studying figure 4.17 it can be seen that it is only in the nutritional controls holding pH 6 where obvious growth curves can be observed. Regarding TN50 and TN30 at pH 4.5 both are decreasing from start, followed by a very slight increase from day 1 and after day 6 the increase might be a bit stronger. It could be of interest to mention something about the visual control made. From the visual control it was stated that the growth in TN70 and TN50 at pH 6 looked like “weak, even, muddy growth, slightly granular”. For TN30 at pH 6 it was stated “distinct, even, muddy growth”. And for the two curves slightly increasing after day 6, the following was mentioned about visual appearance; TN50 at pH 4.5 – “weak growth in patches, slightly granular”, TN30 at pH 4.5 – “distinct, even growth on the bottom”. For the rest of the nutritional controls, weak growth was also observed the last day of the trails.
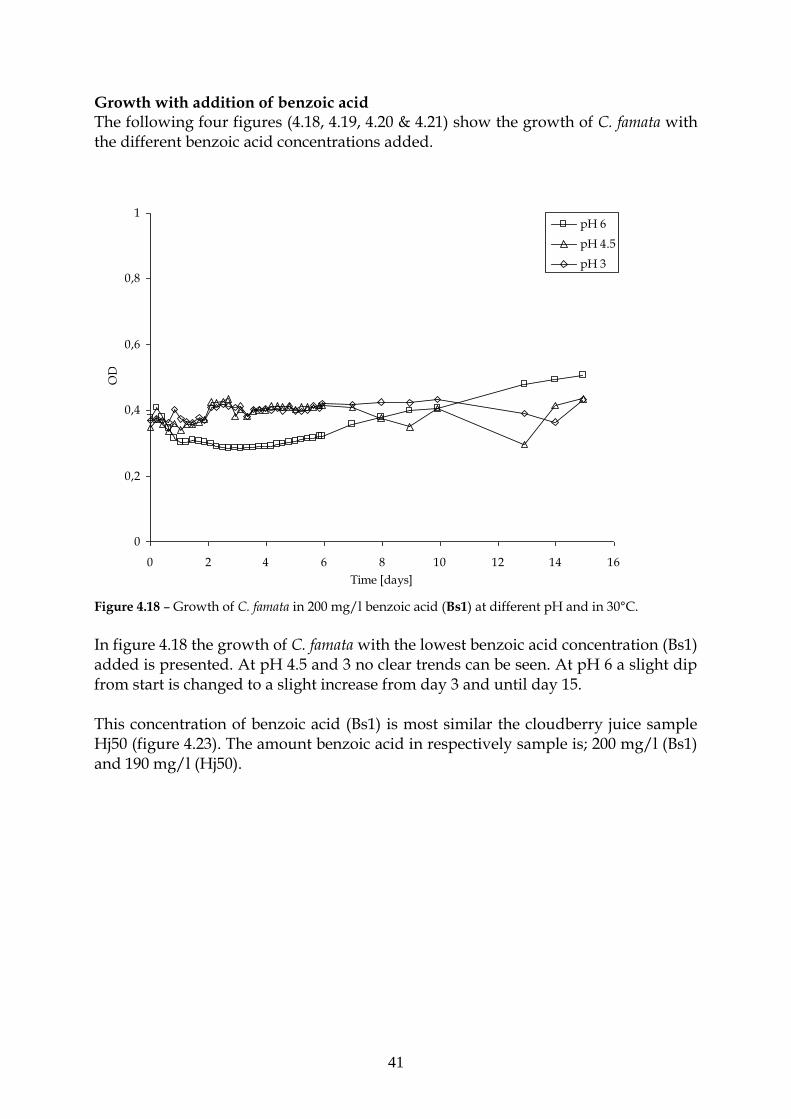
41
Growth with addition of benzoic acid The following four figures (4.18, 4.19, 4.20 & 4.21) show the growth of C. famata with the different benzoic acid concentrations added.
0
0,2
0,4
0,6
0,8
1
0 2 4 6 8 10 12 14 16
Time [days]
OD
pH 6
pH 4.5
pH 3
Figure 4.18 – Growth of C. famata in 200 mg/l benzoic acid (Bs1) at different pH and in 30°C.
In figure 4.18 the growth of C. famata with the lowest benzoic acid concentration (Bs1) added is presented. At pH 4.5 and 3 no clear trends can be seen. At pH 6 a slight dip from start is changed to a slight increase from day 3 and until day 15. This concentration of benzoic acid (Bs1) is most similar the cloudberry juice sample Hj50 (figure 4.23). The amount benzoic acid in respectively sample is; 200 mg/l (Bs1) and 190 mg/l (Hj50).

42
0
0,2
0,4
0,6
0,8
1
0 2 4 6 8 10 12 14 16
Time [days]
OD
pH 6
pH 4.5
pH 3
Figure 4.19 – Growth of C. famata in 380 mg/l benzoic acid (Bs2) at different pH and in 30°C. The same trend as in previous figure (figure 4.18) can also be viewed here at the lower middle concentration of benzoic acid (Bs2). The slight increase in growth at pH 6 is also here seen from day 3 (after the similar small dip from start) and continuing until day 15. No clear trend can be seen for the samples holding pH 4.5 and 3. This concentration of benzoic acid (Bs2) is most similar the cloudberry juice sample Hj70 (figure 4.24). The amount benzoic acid in respectively sample is; 380 mg/l (Bs2) and 266 mg/l (Hj70).
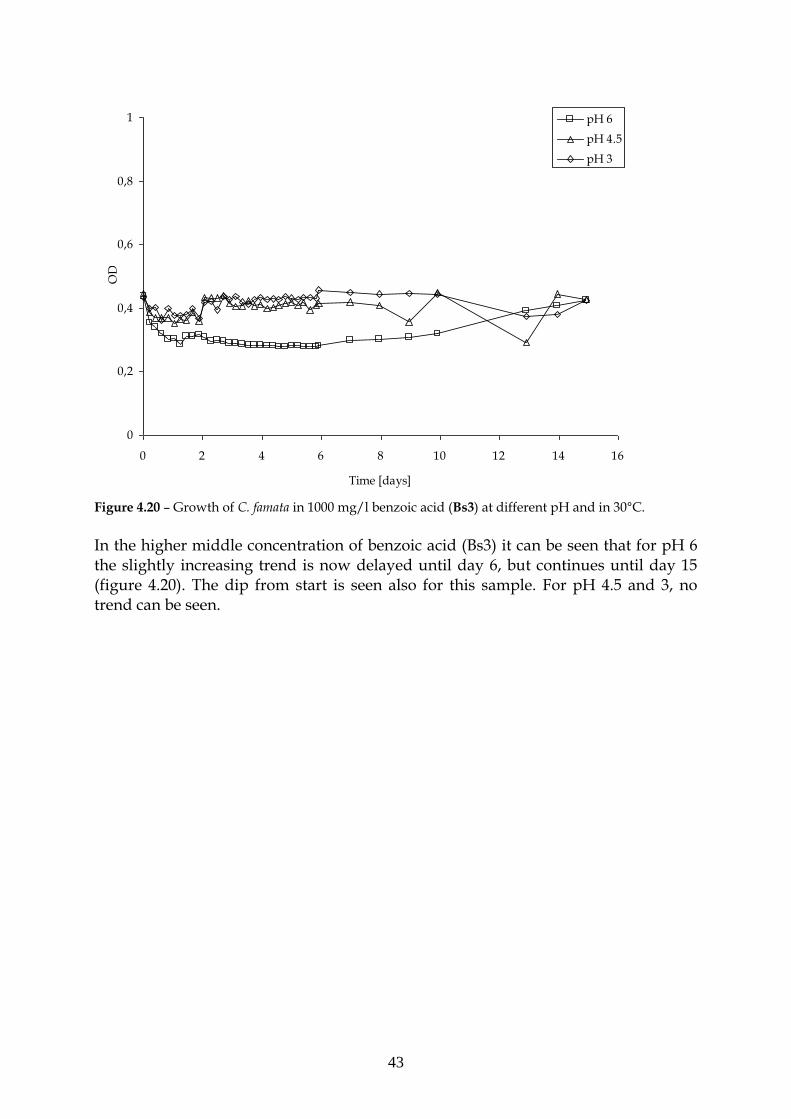
43
0
0,2
0,4
0,6
0,8
1
0 2 4 6 8 10 12 14 16
Time [days]
OD
pH 6
pH 4.5
pH 3
Figure 4.20 – Growth of C. famata in 1000 mg/l benzoic acid (Bs3) at different pH and in 30°C.
In the higher middle concentration of benzoic acid (Bs3) it can be seen that for pH 6 the slightly increasing trend is now delayed until day 6, but continues until day 15 (figure 4.20). The dip from start is seen also for this sample. For pH 4.5 and 3, no trend can be seen.
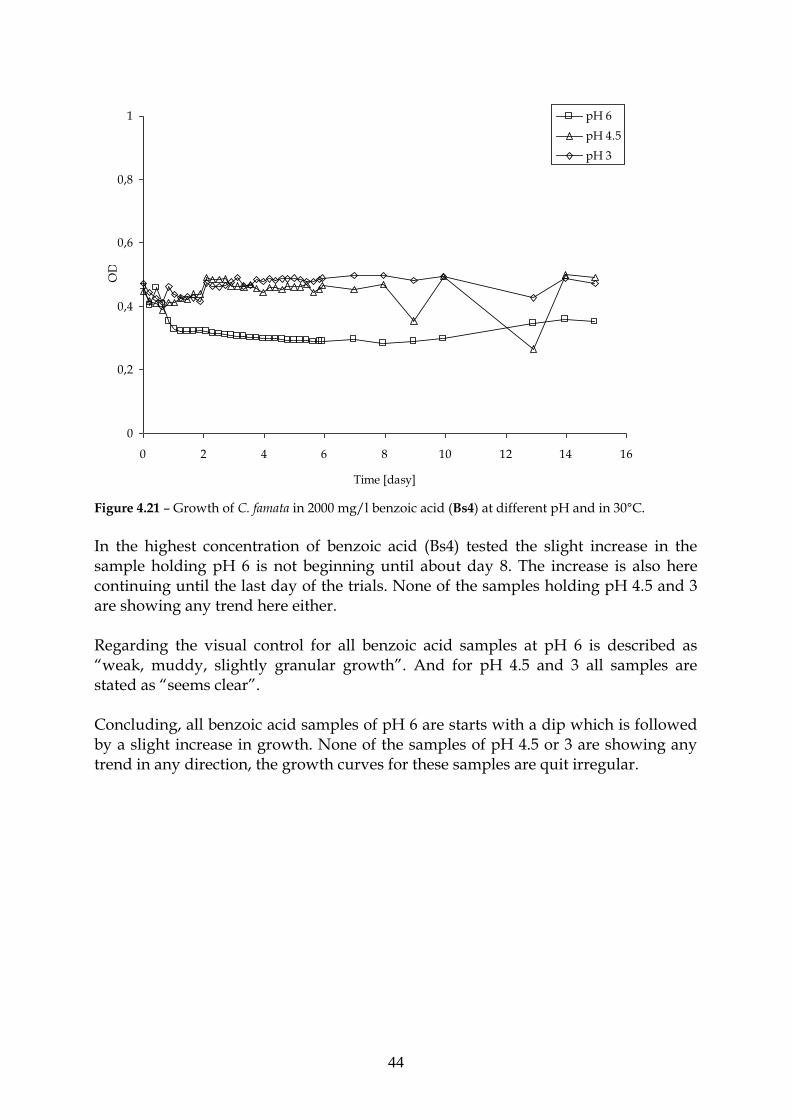
44
0
0,2
0,4
0,6
0,8
1
0 2 4 6 8 10 12 14 16
Time [dasy]
OD
pH 6
pH 4.5
pH 3
Figure 4.21 – Growth of C. famata in 2000 mg/l benzoic acid (Bs4) at different pH and in 30°C. In the highest concentration of benzoic acid (Bs4) tested the slight increase in the sample holding pH 6 is not beginning until about day 8. The increase is also here continuing until the last day of the trials. None of the samples holding pH 4.5 and 3 are showing any trend here either. Regarding the visual control for all benzoic acid samples at pH 6 is described as “weak, muddy, slightly granular growth”. And for pH 4.5 and 3 all samples are stated as “seems clear”. Concluding, all benzoic acid samples of pH 6 are starts with a dip which is followed by a slight increase in growth. None of the samples of pH 4.5 or 3 are showing any trend in any direction, the growth curves for these samples are quit irregular.
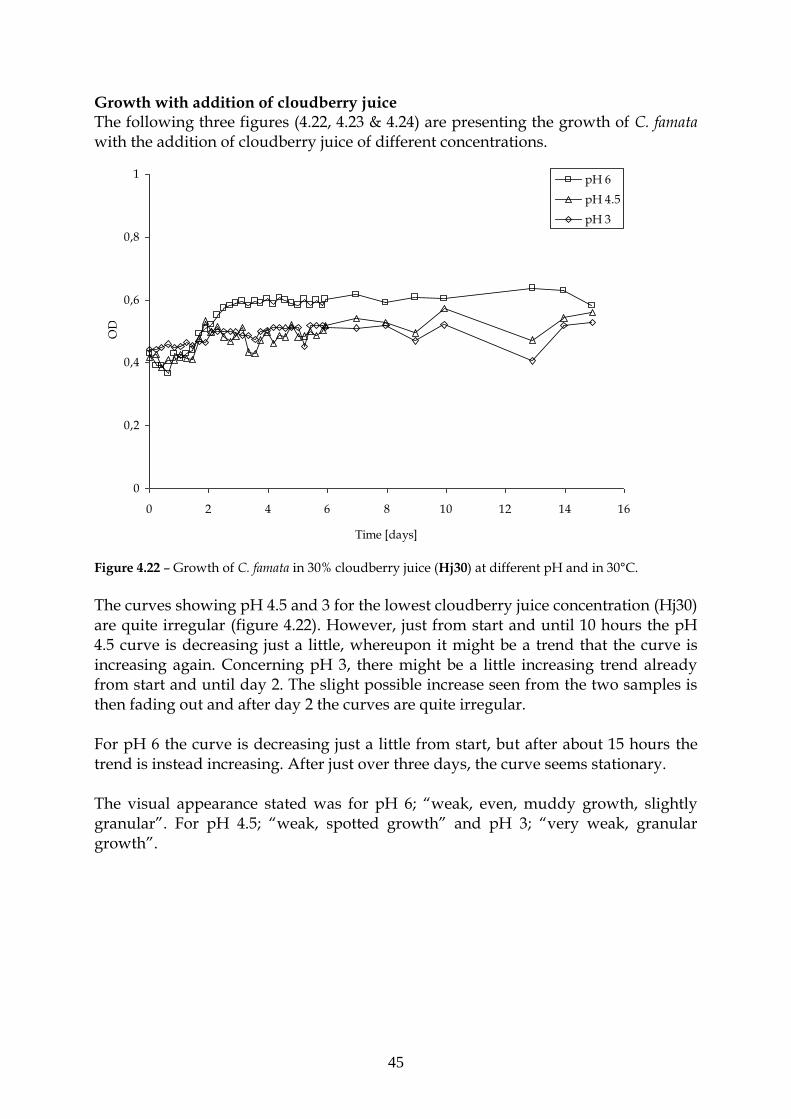
45
Growth with addition of cloudberry juice The following three figures (4.22, 4.23 & 4.24) are presenting the growth of C. famata with the addition of cloudberry juice of different concentrations.
0
0,2
0,4
0,6
0,8
1
0 2 4 6 8 10 12 14 16
Time [days]
OD
pH 6
pH 4.5
pH 3
Figure 4.22 – Growth of C. famata in 30% cloudberry juice (Hj30) at different pH and in 30°C. The curves showing pH 4.5 and 3 for the lowest cloudberry juice concentration (Hj30) are quite irregular (figure 4.22). However, just from start and until 10 hours the pH 4.5 curve is decreasing just a little, whereupon it might be a trend that the curve is increasing again. Concerning pH 3, there might be a little increasing trend already from start and until day 2. The slight possible increase seen from the two samples is then fading out and after day 2 the curves are quite irregular. For pH 6 the curve is decreasing just a little from start, but after about 15 hours the trend is instead increasing. After just over three days, the curve seems stationary. The visual appearance stated was for pH 6; “weak, even, muddy growth, slightly granular”. For pH 4.5; “weak, spotted growth” and pH 3; “very weak, granular growth”.

46
0
0,2
0,4
0,6
0,8
1
0 2 4 6 8 10 12 14 16
Time [days]
OD
pH 6
pH 4.5
pH 3
Figure 4.23 – Growth of C. famata in 50% cloudberry juice (Hj50) at different pH and in 30°C. In figure 4.23 it can be seen that the lowest pH (pH 3) is just showing irregular values. Concerning the sample holding pH 4.5 there might be a slight increase from day 1 and almost until day 3. But the values are quite uneven also for this sample. The curve showing the values from the sample of pH 6 is increasing from start and until approximately day 4, from where the curve level away. From the visual control the following was mentioned; pH 6; “distinct, even, muddy growth”, pH 4.5; “very weak, granular growth” and pH 3; “seems clear”. The concentration of benzoic acid in the cloudberry juice sample Hj50 is most similar the benzoic acid sample Bs1 (figure 4.18). The amount benzoic acid in respectively sample is; 190 mg/l (Hj50) and 200 mg/l (Bs1).

47
0
0,2
0,4
0,6
0,8
1
0 2 4 6 8 10 12 14 16
TIme [days]
OD
pH 6
pH 4.5
pH 3
Figure 4.24 – Growth of C. famata in 70% cloudberry juice (Hj70) at different pH and in 30°C. The growth curves for the highest concentrations of cloudberry juice (Hj70) (figure 4.24), are differing some from the previous two figures (figures 4.22 & 4.23) of the lower concentrations. The sample differing the most is the one of pH 3, which is decreasing to a relatively large extent from start. After day 4 the curve evens out. The curve showing the sample holding pH 4.5 does show some indication of increase between day 1 and 2. Further, a very slight increase might be observed from day 8 or 10 and until the end of the trial. For the highest pH (pH 6) an increasing trend is seen also for this cloudberry juice concentration. In this sample, no dip from start can be seen. The visual appearance form each sample was mentioned as; pH 6; distinct, even growth, thicker in one corner” and regarding both pH 4.5 and 3; “very weak, uneven, muddy”. The concentration of benzoic acid in the cloudberry juice sample Hj70 is most similar the benzoic acid sample Bs2 (figure 4.19). The amount benzoic acid in respectively sample is; 266 mg/l (Hj70) and 380 mg/l (Bs2).

48
4.3.7 CFU – colony forming units, C. famata
The four tables below (4.8, 4.9, 4.10 and 4.11) are showing the logarithmic values for the CFU count of the samples of C. famata. The inoculated levels (day 0) was between 10^3.8 and 10^4.6.
Table 4.8 – log CFU count for C. famata in the medium, MRS, (table 3.2) at different pH. Sample Day 0 Day 3 Day 7 Day 8 Day 15
MRS, pH 3 4,2 5,7
MRS, pH 4.5 3,8 6,7
MRS, pH 6 3,9 6,9 7,3 6,5
Table 4.9 – log CFU count for C. famata in the nutritional controls (different concentrations of MRS) (table 3.2) at different pH. Sample Day 0 Day 3 Day 7 Day 8 Day 15
pH 3
TN70 4,6 6,6
TN50 4,2 6,1
TN30 4,2 5,9
pH 4.5
TN70 4,6 6,6
TN50 4,6 6,8
TN30 4,2 6,2
pH 6
TN70 4,0 7,1
TN50 3,8 7 7,3
TN30 4,6 6,8 7,1
For all the samples with different concentration of the medium (100%, 70%, 50% & 30% MRS) an increase in viable cells is seen to some differing extent. For all values available at day 15, quit high levels of viable cells are present, an increase of about two to three log units depending on sample.

49
Table 4.10 – log CFU count for C. famata in the different concentrations of benzoic acid (table 3.2) at different pH. Sample Day 0 Day 3 Day 7 Day 8 Day 15
pH 3
Bs1 4,2 < 1 < 1
Bs2 4,2 < 1 < 1
Bs3 4,2 < 1 < 1
Bs4 4,2 < 1 < 1
pH 4.5
Bs1 4,6 < 1
Bs2 4,6 < 1
Bs3 4,6 3
Bs4 4,6 < 1
pH 6
Bs1 4,0 6,4
Bs2 3,8 6,4
Bs3 3,9 6,3
Bs4 4,1 6,7 6,2
All samples with addition of benzoic acid holding pH 4.5 or 3 are decreasing. The only sample showing countable levels of viable cells at day 15 is Bs3 at pH 4.5 (log 3). The benzoic acid sample holding pH 6 are all showing an increase of about just over two log units until day 15. Table 4.11 – log CFU count for C. famata in the different concentrations of cloudberry juice (table 3.2) at different pH. Sample Day 0 Day 3 Day 7 Day 8 Day 15
pH 3
Hj30 4,6 2,7
Hj50 4,2 < 1 < 1
Hj70 4,2 < 1 < 1
pH 4.5
Hj30 4,6 5,8
Hj50 4,6 < 1
Hj70 4,2 < 1 < 1
pH 6
Hj30 4,1 6,2
Hj50 4,0 7 6,1
Hj70 4,6 6
Just as for the samples of benzoic acid, all samples with addition of cloudberry juice holding pH 4.5 or 3 are decreasing. The only exception is Hj30 at pH 4.5; here instead a slight increase of 1.6 log units is seen. The same concentration of cloudberry juice (Hj30) at pH 3 does show countable amounts of viable cells (log 2.7) at day 15, this in contrast to the other cloudberry samples of pH 3. All cloudberry juice concentrations added at pH 6 are showing increasing amounts of viable cells at the last day (day 15). As for the benzoic acid sample, the increase until day 15 is about two log units.

50
5. Discussion
This chapter handles a discussion of the results presented in chapter 4. The results and discussion concerning L. plantarum was to some extent clearer and trends could more easily been shown. The results for C. famata will mainly be discussed from the basis of CFU count, and why some results were not as desired will also be discussed. Some thoughts for future studies will be included throughout the chapter.
5.1 MIC-test 1; in test tubes
Results from the first MIC-test indicated at which concentration interval the following trials should be held in. The concentrations decided for following trials were Hj3 (30% juice), Hj5 (50% juice) and Hj7 (70% juice). Hj3 was chosen even though it showed no inhibiting effect in MIC-test 1, but in following trials the pH was to be adjusted giving it would be interesting to study any possible effect under this new conditions. No pH‟s were adjusted in MIC-test 1, the pH of the Hj-sample was the pH it became when medium and juice was mixed. The cloudberry juice is quite acidic and it influenced the media NB+glu to a relatively large extent. The samples were therefore quite acidic; a pH between approximately 3.5 and 4.5. This could have affected the results in favour for the stated theory. Even if the environment in the first MIC-test were acidic, the sample Hj3 is of interest to study again with a more controlled pH. The inhibiting effect seen from the higher concentrations of cloudberry juice might be due to lack of nutrients (table 3.1). When the concentration of juice is increasing, the concentration of medium is decreasing which could lead to malnutrition of the microorganism. No compensation of medium or nutritional controls have been made in this first trial. The trial only aimed to search for inhibiting effect on the growth of L. plantarum (figure 4.1). Further respect of possibility for the microorganism to grow is discussed from the results of MIC-test 2 (section 5.3). NB+glu was the medium used in the early trials. The alternative would have been MRS, but since the colour of NB+glu is lighter than for MRS, it was believed that it would be easier to work with NB+glu in the Bioscreen C equipment. Later on in the laboratory work a switch of media from NB+glu to MRS was necessary to achieve any growth in the Bioscreen C trials. When performing test trials in Bioscreen C using NB+glu as medium, there was probably not enough nutrients, giving no visible growth curves. The more nutritional MRS broth gave good results for the trials including L. plantarum, why MRS was chosen instead. Considering the effect of the medium on the results from Bioscreen C, the colour has probably no influence to speak of. The equipment is rather dependent on the clarity of the medium, since that is what is measured.

51
5.2 Analysis of cloudberry juice
Discussion about the phenolic profile in the cloudberry juice is divided into two sections where benzoic acid, HBA‟s, ellagitannins and ellagic acid is of main interest.
5.2.1 Benzoic acid and HBA’s
As mentioned above in section 2.4.3 benzoic acid is a variety of hydroxybenzoic acids (HBA‟s). If studying the content of HBA‟s from the analysis performed at University of Helsinki (table 4.2) one can see that the amounts are 39 and 73 µg/ml of untreated and heat treated juice respectively. If then studying the content of benzoic acid from the analysis performed by Eurofins (table 4.1), one can see that the amount of benzoic acid is 0.38 g/kg juice. To be able to make any comparison it should be from the untreated juice samples; “Juice 2” from Eurofins and “Juice 2(fr)” from University of Helsinki. The only difference between those two samples is that the later had been frozen for two weeks. One litre cloudberry juice weighs one kilogram and if transferring units from “g/kg” to “µg/ml” 0,38 g/kg is equal to 380 µg/ml. There fore the values to compare would be;
o 380 µg/ml juice, benzoic acid (Eurofins) o 39 µg/ml juice, HBA‟s (University of Helsinki)
The results are quite strange since they differ so much. The analysis at Eurofins focuses on the specific compound benzoic acid and at University of Helsinki they analyses the whole group of HBA‟s. The thought behind the analysis was that the results should have been complementing and confirming, but that does not seem to be the case. To confirm the results from Eurofins (which was the analysis most easily to redo) one more a sample was sent there for analysis of the content of benzoic acid (and ascorbic acid) in the juice. This juice was still from the same batch (“Juice 2”), but had now been frozen for almost three months; the sample is referred to as “Juice 2 (fr 3 months)” (table 4.1). The new analysis showed that the level of benzoic acid seems stable; 0.38 compared to 0,41 g/kg juice (table 4.1). From the basis of knowing that this analysis concerned the actual amount of free benzoic acid and from regarding these two samples as correct, the result of 0.38 g benzoic acid/kg juice was stated alright. It would, however, be interesting to more deeply investigate how comparison between the two results could be handled. Also the possible difference between the results is of interest to follow in a future study. Just to speculate, the different analysing methods used at respectively analysing place might be the reason why the two results are of such difference. The experimental set up in this project has been prepared on basis of the results from Eurofins; the amount of benzoic acid in the cloudberry juice was 0.38 g/kg = 380 µg/ml = 380 mg/l. This was the amount in the pure juice. The concentrations tested

52
in this study were 70%, 50% and 30% cloudberry juice, which in that case would end up in the following amounts of benzoic acid in respectively sample:
o Hj30 – 114 µg/ml o Hj50 – 190 µg/ml o Hj70 – 266 µg/ml
If comparing to the amounts of benzoic acid in the samples, which were;
o Bs1 – 200 mg/l = 200 µg/ml o Bs2 – 380 mg/l = 380 µg/ml o Bs3 – 1000 mg/l = 1000 µg/ml o Bs4 – 2000 mg/l = 2000 µg/ml
The amounts of benzoic acid from the cloudberry juice are quite low. The benzoic acid samples to be compared to the cloudberry juice samples would be the two lowest ones (Bs1 & Bs2). Further discussion of the benzoic acid content of the samples will follow below in section 5.3.
5.2.2 Further discussion of phenolic content in the cloudberry juice
The values of HBA‟s and ellagitannins (among many) from four different samples of cloudberries are given in the article written by Kähkönen, et al. (Kähkönen, et al., 2001). From the values a mean value could be estimated to 34.75 mg/100 g dw of HBA‟s and 1313.25 mg/100 g dw of ellagitannins (based on ellagic acid as standard). These are results from whole lyophilized cloudberries. The phenolic profile provided from the analysis of the cloudberry juice from University of Helsinki (table 4.2) are giving values for the heat treated juice for HBA‟s – 73 µg/ml juice and ellagitannins – 154 µg/ml juice.
o HBA‟s; 34.75 mg/100 g dw – 73 µg/ml juice o Ellagitannins; 1313.25 mg/100 g dw – 154 µg/ml juice
Even though no direct comparison between the values can be made, the phenolic profile seems higher when the whole berry is used than if a juice is pressed. It is probably the case that the main parts of the phenols are located in the skin and the seed of the berry. However, phenols are also found in the liquid part when processing the berries. The pressing process performed in this project can be much more optimized. The equipment used was old and only pressing the berries. It might be an idea to try to mix the whole berries and then press a juice. However, that could increase the problems of get held of a clear juice. Other techniques could be used to increase the phenolic profile of the juice; the amount of water might be decreased by evaporating the juice, making the relative phenolic amount higher. Investigation of how ethanol might be used as a solvent, to increase the yield of phenolics from the berries might be of interest.
53
From the values for “Juice 2 (fr+ht)” it can be seen that the ellagitannins contributes to about 62%, the HBA‟s to about 29% and ellagic acid to about 1.7% of the total phenolic profile (table 4.2). Ellagitannins are the dominating part of the different phenolic groups. The amounts of ellagitannins and ellagic acid seen is in line with what is stated in section 2.3.4, the main part of ellagic acid in plants is in the form of ellagitannins. What is interesting to point out is that the main part of the phenolic profile (all except from the anthocyanins) is increasing after the heat treatment. One explanation, kindly explained by Marina Heinonen10, is that it might be the case that the heat treatment makes the berry material more susceptible for the extracting solvents of the analysing method. The phenolic compounds might more easily be liberated and thereby show higher values. The higher values do not directly indicate higher levels of active phenolics in the juice, but it is still an interesting phenomenon.
5.3 MIC-test 2; in Bioscreen C
The results from MIC-test 2 are divided and presented in different sections. In the first section a discussion about the OD measurements of the medium (MRS) is provided. Then a discussion concerning the two microorganisms is presented, followed by further thoughts about MIC-test 2. First, however, some thoughts about the nutritional controls are discussed. Regarding the nutritional controls these are, as mentioned above (section 3.7), mainly needed for comparison for the analysis of the cloudberry juice samples. Regarding the samples with benzoic acid, the content of medium was 90% in each sample (table 3.2) which is close to the growth conditions in the pure medium. The different concentrations of benzoic acid were added via a standard solution of respectively concentration, giving that the relation between the medium (MRS) and the benzoic acid standard solution was 9:1 in each sample (Bs1, Bs2, Bs3 & Bs4). But for the cloudberry juice samples, the medium was diluted due to the addition of juice (table 3.2) and could therefore not correctly be compared to growth in the pure medium or to the benzoic acid samples. What could have been done different with the cloudberry samples is that the medium in the samples of respectively juice concentration could have been compensated in strength to meet the nutritional requirements. That could in fact be done with all samples in a trial to reach the same initial conditions. However, as the situation was, the cloudberry samples now could be compared to the samples for nutrition control and thereby related to the medium and benzoic acid samples when discussing possible inhibiting effect.
5.3.1 Media, MRS
The OD values for the pure medium (MRS) were differing to some extent (figure 4.2) and some thoughts of why are discussed in this section. However, even though there are some deviations between the MRS samples, the values can be regarded being within the scope of the variation tolerated. The values for MRS are only used as a
10 E-mail contact with Marina Heinonen, Docent (Food chemistry), University of Helsinki, Finland, January
2010.

54
background reference, and not for any type of calculations. Both MRS S and MRS M are close to 0.4, and when a total mean of all values are calculated an average is stated to 0.41. As described above (section 3.7) the measurements in Bioscreen C was performed automatically within an interval of 10 to 30 minutes the first six days. After day 6 and until day 15 (the last day of the trial) the measurements were performed manually, once a day. It might be the case that the Bioscreen C instrument needs some time to stabilize and to provide accurate and trustable values. To avoid divergences between the values in the future, the manually preformed measurements could be done so at least five to six measures points are achieved. The different points can be measured with only one to two minutes in between, to avoid the time factor. In the present study the manually measurements are only done as one single measurement. Working with one single value might be misleading since the obtained value could be an outlier. More values from the same occasion would provide more accurate results. Measurements from the different set ups in the trials (S, M & L) are performed at different occasions. Exactly the same sample (here: MRS) measured at different occasions (here: MRS S & MRS M), has here showed diverse results. In a future study it would be interesting to perform measurement of the many more equal samples, at different occasions, to investigate how much the “occasion factor” might affect the results (section 5.4). More time for repeating the measurements would be to prefer, to learn about the possible error due to the occasion and to avoid differences due to different set ups.
5.3.2 Growth of L. plantarum in medium (MRS) and nutritional controls (TN)
Growth in the pure medium (MRS) To be able to make any conclusions about the inhibiting effect from both the benzoic acid and the cloudberry juice, it must first be stated that the growth of the microorganisms is alright in the medium and the pH of interest. If the growth under the tested conditions without any antimicrobial compound is already affected in a too inhibited way, little can be said about the actual effect from the antimicrobial compound of interest. Therefore the first part of the discussion will concern the growth of the microorganism (in this section L. plantarum) in the medium and in the nutritional controls. First studying the results of L. plantarum growing in only the medium with adjusted pH‟s (MRS in pH 6, 4.5 & 3) (figure 4.4 & table 4.4). There is a difference between the MRS-samples of different pH, both seen in the growth curves and in the generation times and lag phases, but not to a very large extent. The results indicate that the growth of L. plantarum is affected to some level by the pH of the environment. However, the growth at the lowest pH is still quite strong in the pure medium. If studying the results from the CFU count, measurements during the trial were only made for the two lower pH‟s (pH 3 & 4.5) (table 4.4). For pH 6, measurements were only preformed at the first and last day of the trial; day 0 and day 15, why nothing

55
can be stated about the development in between. Both samples with lower pH are showing an increasing amount in viable cells until day 2 and 3 respectively. Strengthened by the fact that most LAB prefer an initial pH of 6 to 7 to grow, the conclusion can be made that this is probably also the trend for in pure MRS at pH 6. If assuming this (which is additionally strengthened also by the results of the growth curves, generation times and lag phases) the total evaluation of the growth of L. plantarum in the medium (MRS) under the different pH‟s tested is considered alright and possible to continuing analysing under suppressed conditions. Growth in the nutritional controls at pH 6 and 4.5 Looking at the growth curves of L. plantarum in the nutritional controls (figure 4.5, 4.6 & 4.7) it is seen that for pH‟s 6 and 4.5 the growths seems alright, even though, with decreasing content of nutrients (TN70 > TN50 > TN30) the maximal OD reached is decreasing (~1.32-1.35 ~1.16-1.28 ~0.89-0.95). These maximal OD‟s reached could be compared to the corresponding maximal OD‟s reached in the pure medium at the pH‟s 6 and 4.5; ~1.46-1.52. The OD values indicate that the growth affected to some level in the nutritional controls compared to in the pure medium. However, relatively clear growth was obtained. Studying the log CFU values of the nutritional control samples holding pH 6 and 4.5 (table 4.5), growth is obtained with an increase of between almost 2 to just over 4 log units depending on sample and time of measurement. The growth could be stated alright also from these measurements, making the results indicating alright growth even stronger. From the basis of these results conclusions could be made for the corresponding cloudberry samples; Hj30 at pH 6 and 4.5, Hj50 at pH 6 and 4.5 & Hj70 at pH 6 and 4.5. But, with the slight decrease in growth due to the reduced amount of MRS, in mind. Growth in the nutritional controls at pH 3 When studying the nutritional controls at pH 3, the sample of the lowest nutritional content (30% MRS) does not develop any growth curve (figure 4.7). When studying the log CFU results for the same sample, the amount of viable cells are constant from day 0 until day 15 (log CFU 4.8 at day 0; 4.9 at day 7 & 4.6 at day 15) (table 4.5). These results indicate a stationary phase, where two scenarios could be the explanation; either the same level of growth and death is achieved, or the cells are just surviving without increasing or decreasing. Due to the results for TN30 at pH 3 it will be hard to say anything about the corresponding cloudberry sample Hj70 at 3. The visual appearance stated might further strengthen that no increase in growth has happened. It was stated as “seems clear”, which was the appearance also when inoculated the wells day 0. Looking at the middle level of nutritional content (50% MRS) at pH 3, a growth curve is obtained, but it is delayed and the growth is slower (figure 4.6 & table 4.3) than for the two higher pH‟s at the same nutrients concentration. The CFU values indicated growth, an increase of almost 4 log units until day 3 (log CFU 4.8 at day 0; 8.5 at day
56
3). If comparing CFU values at pH 3 in pure medium (log CFU 4.8 at day 0; 9.0 at day 3) the increase seen is just over 4 log units until day 3. The results from the CFU measurements makes it possible to say that the growth during these conditions are well enough to be able to compare with the results for the corresponding cloudberry sample (Hj50 at pH 3) and say something about inhibiting effect. The last nutritional control to discuss is TN70 at pH 3; the sample of highest nutritional content of the control samples (70% MRS) at the lowest pH tested (table 3.2). One could assume that the growth in this sample would be faster and better than in the sample of lower nutrient content, just discussed above. This assumption is based on the results for TN50 and MRS at pH 3. However, the growth was better (in terms of generation time and lag phase) in both these samples (MRS > TN50 > TN70). The natural order would have been switched concerning the nutritional controls (giving MRS > TN70 > TN50). Unluckily there are no log CFU values available for TN70 at pH 3, more than from day 0 and day 15. At day 15 the level of viable cells was too low to be counted (table 4.5). However, that does not mean no increase have happened during the trial; many other samples does show a CFU less than one at day 15 even though an increased growth has been viewed earlier. But since no values are available during the trial, nothing can be said with comfort. From the results available for TN70 at pH 3 conclusions will be hard to draw for the corresponding cloudberry sample (Hj30 at pH 3). However, one way to discuss the cloudberry sample is from the assumption discussed above. It seems like the results available could be misleading and that the assumption stated might reflect a more truthful reality, but when discussing the corresponding cloudberry sample, awareness of the actual results must be hold in mind. When studying the visual appearance of the wells of TN70 at pH 3, the last day of the trial, it was stated “thick growth in patches, outside the patches clear”. Since the growth here seems to have gathered in patches, it might be hard for the Bioscreen C to measure the actual OD. That could be a possible explanation of the unclear results achieved. The SD‟s are the highest for TN70 at pH 3 compared to all nutritional controls for L. plantarum. This might indicate some instability of the OD measurements and even stronger point towards the use of the assumption (mentioned above), instead of the real results, when discussing the corresponding cloudberry sample.
5.3.3 Growth of L. plantarum in benzoic acid (Bs)
The percentage of undissociated (active) benzoic acid is increasing with decreasing pH. At pH 6 only about 1.5 % of the acid is active, compared to approximately 94 % at a pH of 3 (table 2.1 & figure 2.3). The lower the pH, the more of the benzoic acid is active to inhibit the growth of the microorganism. A trend is seen from the samples of benzoic acid that the generation times are increasing when the pH‟s are decreasing (table 4.3). The generation times are also increasing with increasing concentrations of
57
benzoic acid, with the only exception of Bs2 at pH 6 and 3 where respective time are shorter than for corresponding Bs1-sample. The concentration deviation from the trend is not easy to explain. It might be due to that the difference in concentration between Bs1 and Bs2 is not big enough to show clear deviation, or that the Bioscreen C method is not fully trustable between the different testing occasions. It could also to some extent depend to the handling of data and the calculations, as discussed below in section 5.4. However, the results are not too divergent and the difference between the samples could actually be a matter of laboratory work mistakes. Preferable would be to redo the tests once more to get more stable and trustable results. However, the tendencies stated above are still strong enough to be regarded as trends. The SD‟s seen for Bs1 and Bs2 at pH 3 (figures 4.8 & 4.9) are relatively large in comparison with the SD‟s seen for Bs3 and Bs4 (figures 4.10 & 4.11). This instability of the values might be due to that the conditions in these samples are on the edge of what L. plantarum can tolerate before growth is inhibited. These limit conditions might cause growth inhibition in some cases, but in other cases growth might be obtained. This could lead to larger difference between the same set of samples. If Bs1 and Bs2 are compared to Bs3 and Bs4 at pH 3, where the conditions are clearly inhibiting the growth of L. plantarum, the differences are not as large, resulting in smaller SD‟s for Bs3 and Bs4. The same trend of increasing SD‟s during limit conditions for growth could also be seen for Bs3 and Bs4 at pH 4.5 (limit condition). Here the SD‟s are larger than for respectively sample in pH 6 (where growth is obtained) or pH 3 (where growth is inhibited). Concluding, the clear conditions when growth or non-growth could be stated are also the samples of lower SD‟s, whereas limit conditions of growth are connected with larger SD‟s. The trend of slower and less growth with decreasing pH and increasing benzoic acid concentrations seen from the generation times can also be seen from the lag phases (table 4.3) and the CFU counts (table 4.6). When benzoic acid is present in the samples the microorganisms are exposed to stress. The increase in lag phase shows that the time needed to adapt to these tougher conditions are longer due to that stress. There are probably syntheses of stress proteins going on to increase the chance of survival during the new, harsh conditions. These results again state the importance of the pH of the surrounding media (food product!) for the benzoic acid to be active and provide with antimicrobial effect. In the end just mentioning that the visual controls seemed to be in line with the trends discussed above.

58
5.3.4 Growth of L. plantarum in cloudberry juice (Hj)
Now studying the results of the growth of L. plantarum with cloudberry juice added in different concentrations, as an antimicrobial agent (Hj30, Hj50 and Hj70) (figures 4.12, 4.13 and 4.14). Growth in the cloudberry juice samples at pH 6 The growth obtained in the nutritional controls at pH 6 made it alright for further comparison of the corresponding cloudberry samples. At pH 6, the lag phases are almost not affected at all with the juice added compared to the lag phase in only the medium at the same pH (table 4.3). The same can be stated concerning the generation times. When looking at the CFU values for the cloudberry samples at pH 6, an increase is seen for the samples of 50% juice and 70% juice until day 2. For the sample of 30% juice no values are available during the trial, but at the last day the log CFU is 3, compared to <1 for the two higher concentrations of cloudberry juice. This indicates that there has probably been an increase in growth also here, at least the end level of viable microorganisms is higher. However, nothing can be stated with strength since no CFU data were available for the sample during the trial. Further, from the growth curves it is also clear that no inhibition of importance was obtained (figure 4.12, 4.13 & 4.14). Regarding the SD‟s in the growth curves at pH 6 all were relatively small, indicating the same action in the samples. Independent of cloudberry juice concentration, at pH 6 the conditions does not seem to be any limit conditions for growth of L. plantarum. For all cloudberry samples at pH 6 the same conclusion can be drawn; the antimicrobial effect from the cloudberry juice at this pH was not enough to inhibit the growth of L. plantarum. Growth in the cloudberry juice samples at pH 4.5 At pH 4.5 a trend can be seen, which is that the growth of L. plantarum is delayed (lag phase increased) in the samples containing cloudberry juice, compared to the growth in pure medium (17 h; 20 h; 20 h compared to 15 h, for respectively cloudberry juice concentration 30%; 50%; 70% and compared to pure MRS) (table 4.3). Comparing the cloudberry samples to respectively nutritional control, it agrees with this trend of longer lag phases when cloudberry juice is present (HJ30 17 h – TN70 14 h; Hj50 20 h – TN50 12 h; Hj70 20 h – TN30 16 h). The nutritional controls were stated as alright for further analysis of respective cloudberry sample (section 5.3.2). Regarding the generation times, they are longer when cloudberry juice is added compared to in the pure medium. And also here the generation times for cloudberry samples are longer than for respectively nutritional control. When studying the values for the CFU count it can be seen that all the cloudberry samples are increasing with a factor of about 4 log units until day 2 and 3 (table 4.7). This is also the fact for the CFU counts for the nutritional controls (table 4.5). The results from the generation times and lag phases indicates some extent of inhibition of growth generated by the cloudberry juice, but the CFU results does not show the same indication. It would be to prefer to perform more and continuous CFU measurements in the early part of the trials to get a clearer picture of what is happening there. The lag phases are up to 20 hours, but the first CFU value are at

59
day 2 and 3 respectively, which is after at least 48 and 72 hours respectively. After the lag phase the growth is increasing exponentially why it would have been good to have CFU values just before the time of the lag phases too. Now the comparison with the CFU data are the values after exponential growth has continued for many hours and therefore it is not strange that an increase in viable cells is seen. The slightly inhibiting trend seen from only looking at generation times and lag phases might be strengthened by the CFU count if it was measured in a more good chosen time, including just before the exponential growth. As mentioned before, in future studies it would be preferable to measure CFU more often, more continuous and especially more frequent in the early days, and maybe also hours, of a trial. Growth in the cloudberry juice samples at pH 3 Studying the growth curves of the cloudberry samples at pH 3 (figure 4.12, 4.13 & 4.14) it is seen that no growth can be viewed from the curves of the two highest cloudberry juice concentrations. The growth curve obtained for the lowest concentration is delayed and slower compared to the other pH‟s of the same concentration. Concerning the sample Hj30 at pH 3 the comparison to the corresponding nutritional control will be discussed from the assumption stated in section 5.3.2., that the growth in this nutritional control was better than the results available indicated. Regarding the two other cloudberry juice concentrations, the results for the nutritional control corresponding to Hj50 at pH 3 were alright to use as basis for conclusions about the antimicrobial effect from the cloudberries in this sample. For Hj70 at pH 3 conclusions can not be made from this trial due to no observed growth in the corresponding nutritional control (no increase in growth curve (figure 4.7) & CFU count indicates stationary phase (table 4.5)). The visual control mention some tendency of unclearness, but that might be explained by the slightly more turbidity seen from the Hj70 samples compared to Hj50 and Hj30 (further discussed in section 5.3.7, for pH 6). First studying the sample of 30% cloudberry juice (Hj30) at pH 3 (figure 4.12 & table 3.2). If following the assumption that growth of L. plantarum can be obtained under the conditions in the corresponding nutritional control (TN70 at pH 3), and also assume that the generation time and lag phase would hold a value in between the pure MRS at pH 3 and the sample of 50% MRS (TN50) at pH 3, it could be stated that the cloudberry juice present in the sample to some extent inhibits the growth of the L. plantarum. The growth is in that case both be delayed (longer lag phase) and slower (longer generation time) when the cloudberry juice is added. Comparing the amount of free benzoic acid present in the sample of 30% cloudberry juice with the two lowest benzoic acid samples gives; 114 µg/ml in Hj30, compared to 200 µg/ml in Bs1 and 380 µg/ml Bs2. The amount of benzoic acid in the cloudberry sample is almost half the amount of what is in Bs1 and more than three times less than in Bs2. If now comparing the results of Hj30 at pH 3 with Bs1 and Bs2 at pH 3, the lag phases are similar (table 4.3), indicating that the delay in growth is similar. Studying the values for generation times, the values for Bs2 at pH 3 is differing from the trend, as discussed above in section 5.3.3. The value for the

60
cloudberry sample is less than for the benzoic acid samples indicating faster growth in the cloudberry sample, but even though the growth is faster in the cloudberry sample, there is an antimicrobial effect seen. And since the amount of benzoic acid in the cloudberry sample is small in comparison to the benzoic acid samples, the results are still positive. However, to keep in mind is also that the nutritional content is higher in the benzoic acid samples (90% MRS) than in the cloudberry samples (in Hj30 – 70% MRS). In the benzoic acid samples it might be tougher to inhibit growth of L. plantarum since the nutritional conditions are more favourable than in the cloudberry samples. In future studies it would be of interest to perform trials with samples of benzoic acid concentration similar to the benzoic acid content in the cloudberry samples (that would provide more comparable samples.) But also to perform the experimental set up so that the same amount of nutrients are present in each sample (compensating the medium), as discussed above in the introduction of section 5.3. Concerning the relatively large SD‟s seen for Hj30 at pH 3 (figure 4.12), it is in line with the discussion about limit conditions for growth, as stated above about the SD‟s in some benzoic acid samples (section 5.3.3). The indication that Hj30 at pH 3 is a limit condition which is on the edge of what L. plantarum can tolerate before fully inhibited, strengthens the possible inhibitory effect discussed above. However, the growth is not fully inhibited by 30% cloudberry juice at pH 3. At day 7 the log CFU indicates an increase in viable cells (table 4.7), but any inhibiting effect is of interest even if it just regards a delayed growth. The visual appearance from the last day indicates that growth has occurred; “distinct, even growth, thicker in patches”. Now studying the sample of 50% cloudberry juice (Hj50) at pH 3 (table 3.2). From the corresponding nutritional control it has been stated that L. plantarum can grow alright in 50% MRS and at pH3. No growth curve was obtained from the cloudberry sample (figure 4.13) and the CFU count showed a decrease in viable cells with almost 2 log units until day 7 (table 4.7). However it would also here have been preferable to have performed CFU measurements at the early days to study the development more precise. The two measurements (growth curve and CFU) are in an agreement and the trend is that growth of L. plantarum is inhibited in the presence of 50% cloudberry juice at pH 3. These results indicate that cloudberry juice provides antimicrobial effect which is in favour for the proposed theory. The amount of free benzoic acid in the cloudberry samples with 50% cloudberry juice (Hj50) is 190 µg/ml, which can be compared to the two samples with the lowest amounts of benzoic acid (Bs1 & Bs2), 200 and 380 µg/ml respectively. The amount of benzoic acid in Hj50 and Bs1 are almost equal and the cloudberry sample seems to inhibit the growth of L. plantarum, which is not the case for the sample Bs2 at pH 3. The two samples with higher concentration of benzoic acid (Bs3; 1000 µg/ml & Bs4; 2000 µg/ml) does show inhibiting effect on the microorganism, but here the levels of benzoic acid also is higher. However, as just discussed above, to keep in mind is that

61
the nutritional content is higher in the benzoic acid samples (90% MRS) than in the cloudberry samples (Hj50 – 50% MRS). This makes the growth more favourable for the microorganism in the benzoic acid samples, so the growth might be harder to inhibit there. Nevertheless, these results are positive for the proposed theory which says that something except for the natural content of benzoic acid provides to the antimicrobial effect of the cloudberries. However, the theory also includes the statement that it is the ellagitannins and ellagic acid that provides the antimicrobial effect; this is a fact that could not be confirmed from the results in these trials. It would be of much interest to perform further investigations looking at the actual antimicrobial action from the cloudberries. Concerning the visual appearance of Hj50 at pH 3 it was stated “seems clear”. This does further confirm the discussed possible inhibition of the growth of L. plantarum.
5.3.5 Growth of C. famata in medium (MRS) and nutritional controls (TN)
Growth in the pure medium (MRS) Studying the log CFU value of growth in pure medium (MRS) at pH 6 (table 4.8) an increase of 3 log units is seen until day 3. That is in line with the slight increase seen in the growth curve from day 1 (figure 4.16). However, it could have been expected that the increase of the growth curve should have been higher to reflect the increase in CFU count. It might be the case that the growth of C. famata is not as easy to study in Bioscreen C, as it is concerning L. plantarum. However, the growth of the two microorganisms can not be compared, since they are two different organisms. The situation might actually be that C. famata does not reflect as strong growth in the OD based growth curves, as seen from CFU counts. Regarding the growth curve for the MRS-sample holding pH 4.5 a slight increase of the growth curve after day 8 seems like being the trend (figure 4.16). Studying the CFU values (table 4.8) an increase of almost 3 log units is seen until day 15. That could be in line with the slight increase seen from the growth curve. No CFU values are available for the days in between, giving that nothing can be said about if the growth start increasing at day 8, as the growth curve indicate, or not. At least it can be stated that C. famata can grow in MRS holding a pH of 4.5. The sample at pH 3 is quite uneven the first six days, and then a slight decrease is seen from day 8 until day 10, from where an increasing trend is seen. From the log CFU development an increase of 1.5 log units until day 7 can be seen. After that no more values are available. However, it seems like the slight increase in viable cells seen from the CFU count at pH 3, is not possible to see from the OD values since the slight increasing trend starts first after day 10. From the CFU values it can, however, be stated that C. famata can grow in pure MRS at pH 3, even though the growth is more affected at this low pH than in pH 6. For both pH 6 and pH 4.5 the visual appearance at day 15 was stated; “weak, even, muddy growth, slightly granular”. Growth had occurred, even though it looked weak. The visual control at pH 3 was stated as “weak growth in patches, slightly granular”. This indicates that growth has been occurring also here, even though it

62
appears even weaker than in the two higher pH‟s. The appearances of the wells do follow the same indications of possible pH dependence. Since the growth in all wells appeared “weak” (even in pH 6, where at least the CFU count indicated alright growth), it might be the case that the yeast does not affect the visual appearance and turbidity to a very large extent. That might explain the less clear growth curves obtained for these samples. However, the visual controls shall only be regarded as some extra information, nothing to base any strong conclusions on (section 5.4). Growth in the nutritional controls All nutritional control samples at pH 6 are developing in a classical growth curve (figure 4.17). That is also in line with the CFU counts (table 4.9). Concerning the other nutritional controls only TN50 and TN30 at pH 4.5 seems to show an increasing trend from the growth curves. The increasing trend is in line with the CFU values, which are also increasing. Concerning the growth curves for the all other nutritional controls they show no trends at all, but the trend form the CFU values shows increased levels of viable cells for them all. This difference between OD and CFU has already been observed and discussed above concerning the pure MRS (first part, section 5.3.5). Due to the visual control, however, weak growth was stated, including the non developed growth curves. However, some trends from the growth curves and CFU values are in agreement. The CFU value for TN30 at pH 6 is 6.8 log units at day 3. The CFU value for TN50 at pH 4.5 is also 6.8, but at day 15. If comparing the OD values at day 3 for TN30 pH 6 with day 15 for TN50 pH 4.5 they are both ~0.48. This fact speaks for harmony between the measurements; the same level of viable cells yields similar OD values. However, there are still some unclear tendencies, why the main discussion will be based on the CFU count in further analysis. But in the cases where accordance is seen, this will also be mentioned. To conclude the indications about the growth of the yeast at the different pH‟s and in different concentrations of medium (MRS) the following can be stated; the yeast is to some extent affected by the lower pH. The CFU counts are consequently lower at pH 3 compared to pH 4.5 and 6. But, even though CFU values are lower, they show growth also at pH 3. The growth in pH 6 is relatively strong for all the concentrations of medium. Clear increase in CFU values was regarded for all the concentrations of medium during all the pH‟s tested, why growth can be stated alright during the conditions tested. However, with the pH effect kept in mind.
5.3.6 Growth of C. famata in benzoic acid (Bs)
Growth in the benzoic acid samples at pH 6 All samples with addition of benzoic acid holding pH 6 are showing an increase in CFU of about 2.5 log units (table 4.10). For these values also the growth curves show some extent of increase (figures 4.18, 4.19, 4.20 & 4.21). From the growth curves the growth seems to be delayed but then constant increasing from day 3, 6 or 7 and ahead, depending on concentration of benzoic acid. However, no concentration trend is seen from the CFU values.

63
From the visual control growth seems to have occurred, this is in line with the other results. The conclusion is that benzoic acid, independent of concentration, will not inhibit growth of C. famata at a pH of 6. This is in line with the low level of active acid at this pH (section 2.3.2). Growth in the benzoic acid samples at pH 4.5 and 3 None of the measurements in Bioscreen C for the benzoic acid samples holding pH 4.5 or 3 showed any growth (figures 4.18, 4.19, 4.20 & 4.21). Concerning the CFU measurements for the samples at pH 3, less than 1 log unit of viable cells were counted at day 7 and day 15 (table 4.10). At pH 4.5 this was also the case for all the samples except for Bs3, which showed a log CFU of 3 at day 15. However, that value is also a decrease in viable cells, but since that is the only day of measuring the CFU, nothing can actually be said about the values in between. And since the growth curve for the sample did not show any growth, it is hard to state what is happening in the sample. The visual control is in line with the results discussed, it was stated the same for all benzoic acid samples holding a pH of 4.5 and 3; “seems clear”. From these results it seems like the pH of the sample is the most important factor concerning the growth of C. famata. It has already been mentioned that the amount of benzoic acid which is active is way higher at lower pH‟s so that is probably one important explanation to the growth obtained in pH 6 and not in pH 4.5 or 3. It seems like the benzoic acid can inhibit the growth of C. famata at pH‟s of 4.5 and 3, but not at pH 6.
5.3.7 Growth of C. famata in cloudberry juice (Hj)
Growth in the cloudberry juice samples at pH 6 From the CFU counts, no inhibiting effect of the growth of C. famata can be seen from the cloudberry juice at pH 6 (table 4.11). Looking at the growth curves at pH 6 (figures 4.22, 4.23 & 4.24), an increase in OD can be seen, and here are the results from OD and CFU in agreement. From the visual controls at pH 6, growth could be obtained from all cloudberry concentrations. This is also in line with the OD and CFU results. The visual control in Hj70 also showed “…thicker in one corner” (section 4.3.6, figure 4.24) that might be due to that the cloudberry sample of this, the highest concentration, was just slightly more turbid than Hj50 and Hj30 (also mentioned in section 5.3.4, for pH 3). In the small concentrations of the microtiter plates, that was not visible. And studying the background values for the cloudberry concentrations (figure 4.15) the OD‟s for Hj70 are lower than both Hj50 and Hj30. But the slightly thicker phenomenon seen in the corners of Hj70 might be explained by a slow accumulation of particles from the juice.

64
Concluding, cloudberry juice does not show inhibiting effect of the growth of C. famata at a pH of 6. Growth in the cloudberry juice samples at pH 4.5 and 3 In the lowest cloudberry juice concentration (Hj30) and pH 4.5 and 3, some slight increasing trends were observed from the growth curves (figure 4.22). This is actually in line with the CFU count, where for Hj30 at pH 4.5 the CFU value is 5.8 log units and for pH 3 the value is 2.7, at day 15. The former indicates a slight increase (as in the growth curve) and the later a decrease. Even tough nothing can be said about the days in between for Hj30 at pH 3 one could assume (from the basis of other CFU values and from the appearance of the growth curve) that it might have been a slight increase in viable cells for this sample. But even if not, the cells are still surviving to some extent. Regarding the visual appearance, something could be seen for both pH 4.5 and 3 in Hj30, even if it was weak. However, if comparing the CFU count of MRS and TN30 at pH 3, these values are higher than for Hj30 at pH 3. On the basis of the CFU count the conclusion is that 30% cloudberry juice is a too low concentration to fully inhibit the growth of C. famata, but at pH 3 it might, however, delay and slow down the growth to some extent. For the two higher concentrations (50% & 70% cloudberry juice) the growth curves are quite irregular at pH 4.5 and 3 (figures 4.23 & 4.24) and no clear trends could be observed. Regarding the visual appearance, the Hj50 samples were very weak (at pH 4.5, where also there might have been a slight increase in the growth curve) or clear (at pH 3, where no trends was observed from the growth curve). This could be stated in line with growth curves. At the visual control for Hj70, both pH 4.5 and 3 showed some weak tendency of unclearness. But, as discussed above for pH 6, also in this case it might be explained by the slightly more turbid sample. And if growth would be inhibited from the lower concentration of 50%, it would be strange if the higher concentration of 70% would not inhibit growth too. Concerning the available CFU values, less than one log unit could be observed from day 7 and ahead. Since the yeast showed ability to grow in the nutritional controls, one might say that the results indicates inhibition of the growth of C. famata with addition of 50% or 70% cloudberry juice at pH 4.5 and 3. However, one shall also have in mind that the conditions are a bit tougher from start in these samples. Even if growth is seen from the nutritional controls at the same initial conditions, it might be easier for an antimicrobial agent to inhibit growth in these samples. Especially with the slight pH effect of the growth of C. famata kept in mind. Comparing with the benzoic acid samples, all contained 90% MRS, why the inhibition there might have been tougher for the antimicrobial agent. As discussed before, it would be of much interest to redo a trial where the initial conditions concerning nutritional content are the same for all samples tested. Compensation of the strength of the medium should be done for all samples to make it more possible to draw conclusions from the same circumstances.

65
If comparing Hj50 (190 µg/ml of benzoic acid) with Bs1 (200 µg/ml of benzoic acid), at pH 4.5 and 3, the same irregular growth curves and zero values from CFU count are achieved. From these results it seems like the two samples act similar in inhibition of growth of the yeast. It can not be stated if any further action, besides the benzoic acid content, can be seen from the cloudberry juice. If comparing Hj70 (266 µg/ml of benzoic acid) with Bs2 (380 µg/ml of benzoic acid) at pH 4.5 and 3 the same can be said for these samples.
5.3.8 Further discussion
Heat treatment of the juice The heat treatment performed on the juice used in this trial might be performed different in a future study. Instead of using as high temperature as 95˚C, the second step can be holding a lower temperature since the possible spores are activated at 80˚C in the first step and therefore more sensitive so they would die at lower temperature than 95˚C in a second step. However, when studying the analysis results from University of Helsinki, the phenolic profile of the heat treated juice showed higher values than the juice not heat treated. If those values would be the same even if a lower temperature was used in the second step, it could be an alternative to lowering the temperature in the second step. It could be of interest to study how the heat treatment affected the phenolic profile, one could perform the second step at both higher and lower temperatures than used here, and analyse the end product to see which temperature might be optimal. OD and CFU Some OD values in the results could be misleading, especially for the samples including C. famata. For this microorganism the CFU count could indicate growth even though the OD values did not. Further some of the high OD values might not reflect what was seen from the CFU count due to for example dead cells as discussed above. The microorganism used in a future study would preferable be screened in Bioscreen C for OD and plate spread for CFU as an initial control to achieve a relation between OD and CFU for the microorganism in question. From the basis of that kind of results it would be easier to draw conclusions of the activity in a certain sample. Either an analysis could be performed as putting dilution series of the microorganism in Bioscreen C and do a CFU count on the same samples of the dilution series and thereby be able to plot OD and log(CFU) against each other in a graph. Another set up of the test would be to let the microorganism grow in the microtiter plates and continuously measure OD in the Bioscreen C, and at specific times (within hours or days) take out samples for CFU count. Both those set ups would preferable produce the same plot, however, there is a risk that the plots would differ. There fore either one set up would be chosen or both would be evaluated to be able to draw the best conclusions. High OD values seen from the Bioscreen C measurements could be a result of high amounts of dead microbial cells which have gathered on the bottom of the well. This would affect the turbidity and also create a bottom layer, resulting in higher OD values. Further, if the liquid content of a well is drying out to some extent so the amount of liquid left in the well is less than from start and the amount of cells to be

66
suspended in the liquid will be relatively higher than form start. That might result in higher values of the OD. Other reasons for misleading OD values could have been due to condensation of the microtiter plates while moving them from the incubator to the Bioscreen C equipment during the manual measurements. Ascorbic acid in cloudberry juice The analysis of ascorbic acid in the cloudberry juice was performed only as an interesting side analysis. It is stated that cloudberries contains high levels of ascorbic acid (section 2.1). The level of ascorbic acid from two of the analysis at Eurofins showed differing results; 41, 9.2 and 31 mg/100g cloudberry juice respectively. The first value comes from the analysis of the first batch of berries (“Juice 1”) and the two other values are from “Juice 2”. However, the latest analysis was performed when “Juice 2” had been frozen for two months (not two weeks as for “Juice 2 (fr)”). Anyway, since two out of three values are higher and quite similar, one could assume that the higher values are describing a more realistic level of ascorbic acid. In the case of the higher levels, those could be compared to the recommended daily intake (RDI) stated at the National Food Administration in Sweden (Livsmedelsverket, Electronic) which is 75 mg for healthy adults. This indicates that one glass (2 dl, 200 g) of the cloudberry juice used in this project could provide the RDI of Vitamin C. Another positive side effect of the ascorbic acid is that it provides antioxidant activity. Enzymatic browning reactions could be decreased due to the presence of the ascorbic acid in the juice. This, however, are parts of future thoughts concerning the benefits if using of cloudberries or cloudberry juice as a preservative in certain food products.
5.4 Reliability and validity of method
This project was not designed from start. The design of the object and proposed theory has been worked out through the way. The design of the laboratory trials has also been worked out along the way, to some extent as “trial and error” experiments. It has been a lot of difficulties and time consuming problems during this project. Therefore, in the end, the results achieved and discussed have not been repeated for more trustable and accurate values. This project must be regarded as a first trial and the theory stated can neither be confirmed nor rejected. Some trends has been seen, which are of interest to follow in future projects. The method using Bioscreen C must be done with care and with thought about variance between different set ups and variance due to location on the microtiter plates. It would have been preferable to run identical trials, but at different occasions, to study the possible “occasion factor”. In this project that has only been done for MRS S and MRS M and a difference between the identical content of the wells, measured at different occasions, could be seen (section 5.3.1). Concerning the location of the sample on the microtiter plates, the wells on the edges, especially the corners, are sensitive and do not always provide fully trustable
67
values. Some of the wells on the edges of the microtiter plates are more easily dried out, which gives misleading values (section 5.3.8). The problem with dried wells has been seen from some MRS samples, which could explain some of the outlier values from MRS S (section 4.3.1 & 5.3.1). Concerning the visual appearance of the content of the wells at day 15, that was only a rough estimation made by one person‟s eyes and evaluation. It was done at different occasions (for each trial, with one week in between) why the evaluation might differ. Further the appearance was only stated for the last day of each trail, why it can only refer to the final situation. Nothing can be stated regarding delayed growth, if it is followed by growth after some days. It could, however, be seen as some kind of extra information, and for some samples pointing in a certain direction, but not a fact to base a theory upon. The handling of data from Bioscreen C measurements, for calculation of generation times and lag phases, includes evaluation of in which part of the growth curve the growth is increasing exponentially. Even though it was done by the same person and during a connected period of time, it is associated with some differences in estimation, which in turn might generate small divergences in the results. However, as an indicator the value of R2 should be close to 1.0 when right estimation was done (section 3.8), which provided help when making the right evaluation.

68
6. Conclusions
This chapter will sum up the most important conclusions. The two microorganisms are concluded separately. Lactobacillus plantarum The sample Hj50 at pH 3 provides the most promising result from this project. The sample consists of 50% cloudberry juice and 50% of the medium MRS and the amount of free benzoic acid is 190 µg/ml. From this sample it could be stated that the cloudberry juice showed good potential of inhibiting the growth of the food spoilage microorganism L. plantarum. There results even indicated more antimicrobial activity than in corresponding benzoic acid sample, which could indicate action besides the natural content of benzoic acid. The sample Hj30 at pH 3 does also show positive results concerning the antimicrobial effect of cloudberry juice on L. plantarum, however the nutritional control corresponding to this sample was not fully trustable, making it hard to state anything with strength. The sample Hj70 at pH 3 was not possible to analyse due to the lack of basis from the corresponding nutritional control. However, since the two lower cloudberry juice concentrations showed some inhibiting effect of the growth of L. plantarum, also this sample is assumed to do so. With a new design of the samples in a new trial, results might be possible to analyse also for this cloudberry juice concentration. At pH 4.5 all the cloudberry samples showed some level of inhibiting effect of the growth of L. plantarum; less than for the three previously mentioned samples, but still some delay before exponential growth and decrease in growth rate. Regarding the samples at pH 6, no inhibiting effect of interest could be seen. Candida famata Regarding the antimicrobial effect of cloudberry juice on C. famata there seems to be an inhibiting effect from the samples of 50% and 70% of cloudberry juice and holding a pH of 4.5 and 3. However, growth curves and CFU values was not always in agreement, why further analysis would be to prefer before making any strong conclusions for the yeast. For the cloudberry sample of 30% juice and at pH 3, the sample might provide a delayed and slower growth of C. famata. However, at pH 4.5 no inhibiting effect seemed to occur. Regarding the samples holding pH 6, no inhibiting effect of interest could be seen from this investigation.
69
Objective and proposed theory The objective of this master thesis was to evaluate the effect of antimicrobial compounds in cloudberries on food connected microorganisms. The overall antimicrobial effect of cloudberries has been investigated by analysing the influence of cloudberry juice on the growth of two microorganisms, by using Bioscreen C for OD values and plate spreading for CFU count. However, specific antimicrobial compounds from cloudberries have not been possible to target for their effect. The proposed theory is that, besides the natural benzoic acid content of the cloudberries, also the phenolic group ellagitannins and the phenolic acid ellagic acid contributes to the antimicrobial effect seen from the cloudberries. The proposed theory in this project can not be fully confirmed, since it was not possible to refer to ellagitannins or ellagic acid. However, the results presented can be used as a starting point and are opening up for further studies in this area. In the future it might be possible to use antimicrobial compounds from cloudberries as preservatives in some suitable food products.
70
7. Suggestions for future work
This chapter will present some thoughts for future studies in the area of using cloudberries in combination with food products in new and exciting ways. In this project the trials has been performed in MRS broth and no food product model systems has been analysed. In future studies it would be desirable to run trials in a model system based on a certain product, to gain even more applicable results. If trials like these would show positive results the next step to handle is the inclusion in a real food product. This would include studies of possible colour and odour changes. In the early days of this project, cider was the food product thought of. In a cider the colour, taste and smell from the cloudberries, in some cases could be a profit to the product. Another product of interest where these properties might be a profit is jam. However, colour, taste and smell are still issues needed to be analysed and solved. If the use of cloudberries as an antimicrobial in for example canned shell fish products would be a possibility, at least the fruity taste and smell has to be decreased. But in canned or pickled herring the cloudberry taste might be a profit. However, the pH dependence seen in the results must be taken into account when choosing a suitable food product and in canned herring or shell fish the pH might be too high. All this investigations might lead to the development of new and interesting flavours of existing products. To link up with the thoughts of mimicking a real food product in a model system, also the influence of temperatures would be investigated. In this project an experimental temperature was set close to optimal temperature of growth for L. plantarum (30˚C) to speed up the trials. However, in future studies it would be of interest to run trials with temperatures set to corresponding storage temperature for a food product of interest. This would provide more realistic and usable results. To optimize the experimental studies in the early investigations of the cloudberry field, the focus could be put on the first days. At least when the trails performed are larger screenings of different microorganisms in Bioscreen C. A trial that should be run for longer time periods might be better designed in systems of larger volume, for example in a set up of test tubes. The small volumes in Bioscreen C can be a limiting factor, and long time trials might provide more reliable results in larger volume systems. Interesting questions to answer might be; could the microorganisms feed on phenols or are the phenols only inhibiting? Could the microorganisms possibly seem inhibited but after some time start grow again? Is the level of phenols constant with time within a sample? Could the phenols inhibit the growth of unwanted microorganisms, and in the same time act beneficial for probiotic microorganisms? Just to mention a few perspectives. One important thought to pass on for future work is to be more frequent and more consequent regarding the measurements for CFU count. The CFU count provides important and complementing information of the amount of viable cells in the sample.

71
The use of ellagic acid as a reference would be of interest in future trials. To be able to compare and draw conclusions regarding active components in cloudberry juice it is necessary. It would be interesting to search for the ellagitannins present in cloudberries and, if possible, perform a trial also with them. This is essential to be able to confirm the proposed theory of this project. As for many health promoting compounds, also the discussion of when a compound actually is active, includes the phenols. The effect of the compound acting in its natural matrix (e.g. in a fruit) compared to when the compound acts alone (e.g. in a supplement) is of interest. There are results from studies, showing synergistic effects between different phenolics. It is proposed that not only the compound itself, but the compound within its matrix, is of importance for the action seen (Vattem & Shetty, 2004). For cloudberries to be used as preservative in certain food products, it might be of interest to study the antimicrobial action from processed berries, but also from pure, extracted compounds. The possibility to extract the ellagitannins and ellagic acid and to investigate their action outside the berry matrix is of interest. There are many interesting tracks to follow in this field. The area of using cloudberries as a natural antimicrobial agent is fascinating and promising for the future.

72
References
About.com: chemistry (Electronic). Available: <www.chemistry.about.com> (2009-12-17).
Bakkalbaşi, E. et al. (2009). Food Ellagitannins – Occurrence, Effects of Processing and Storage. Critical reviews in Food Science and Nutrition, 49, 283-298.
Blackburn, Clive de W. (2006). Food spoilage microorganisms. Cambridge, England: Woodhead Publishing Ltd.
Bra Böckers Lexikon (1978). Höganäs: Bokförlaget Bra Böcker.
Chung, King-Thom et al. (1998). Tannins and Human Health: A Review. Critical reviews in Food Science and Nutrition, 38, 421-464.
CCUG – Culture Collection, University och Göteborg, Sweden (Electronic). Available: <http://www.ccug.se/> (2009-10-01).
Davidson, P. Michael & Branen, Alfred Larry (1993). Antimicrobials in Foods, 2nd ed., rev. and expanded. New York, US: Madison Dekker, Inc.
Den virituella floran (Electronic). Available: <http://linnaeus.nrm.se/flora/di/rosa/rubus/rubucha.html> (2009-12-29).
Growth Curves (Electronic). Available: <http://www.bioscreen.fi/> (2009-09-25).
Handique, J.G. & Baruah, J.B. (2002). Polyphenolic compounds: an overview. Reactive and Functional Polymers, 52, 163-188.
Heinonen, Marina (2007). Antioxidant activity and antimicrobial effect of berry phenolics – a Finnish perspective. Molecular Nutrition & Food Research, 51, 684-691.
Häkkinen, Sari H. et al. (2000). Ellagic acid content in berries: Influence of domestic processing and storage. European Food Research and Technology, 212, 75-80.
Kähkönen, Marja P. et al. (2001). Berry Phenolics and their Antioxidant Activity. Journal of Agricultural and Food Chemistry, 49, 4076-4082.
Livsmedelsverket (Electronic). Available: <http://www.slv.se/upload/dokument/lagstiftning/2000-2005/2003_20.pdf> (2009-09-25).
Livsmedelsverket (Electronic). Available: <http://www.slv.se/sv/grupp1/Mat-och-naring/Vad-innehaller-maten/Vitaminer/Vitamin-C/> (2010-01-25).
Madigan, Michael T. et al. (2009). Brock Biology of Microorganisms, 12th ed. San Francisco, US: Pearson Education, Inc., publishing as Pearson Benjamin Cummings.

73
Mossberg, Bo & Stenberg, Lennart (2003). Den nya nordiska floran, 2nd ed., Tangen, Norway: Repro, tryck & bokbinderi.
Muñoz-Muñoz, J.L. et al. (2009). Ellagic acid: Characterization as Substrate of Polyphenol Oxidase. IUBMB Life, 61, 171-177.
Määttä-Riihinen et al. (2004). Identification and quantification of phenolic compounds in berries of Fragaria and Rubus species (Family Rosaceae). Journal of Agricultural and Food Chemistry, 52, 6178-6187.
Nationalencyklopedin (Electronic). Available: <http://www.ne.se.ezproxy.ub.gu.se/lang/hjortron> (2010-01-21).
Pietta, P. et al. (2003). Plant polyphenols: Structure, Occurance and Bioactivity. Studies in Natural Products Chemistry, 28, 257-312.
ProViva (Electronic). Available: <http://www.proviva.se/sv/Produkter/Fruktdryck/> (2010-01-22).
Puupponen-Pimiä, R. et al. (2005). Berry phenolics selectively inhibit the growth of intestinal pathogens. Journal of Applied Microbiology, 98, 991-1000.
Quideau, Stéphane (2009). Chemistry and biology of ellagitannins, an underestimated class of bioactive plant polyphenols. Singapore, Republic of Singapore: World Scientific Publishing Co. Pte. Ltd.
Rapp, Kåre et al. (1993). Commercialization of the Cloudberry (Rubus chamaemorus L.) in Norway. New corps, 524-526.
Serrano, J. et al. (2009). Tannins: Current knowledge of food sources, intake, bioavailability and biological effects. Molecular Nutrition & Food Research, 53, 310-329.
Thiem, Barbara (2002). Rubus chamaemorus L. – a boreal plant rich in biologically active metabolites: a review. BIOL. LETT., 40, 3-13.
Uddstål, Roger (2009). Bären en outnyttjad hälsokur. Göteborgs-Posten, 1st of September.
Vattem, D. A. & Shetty, K. (2005). Biological Functionality of Ellagic Acid: A Review. Journal of Food Biochemistry, 29, 234-266.
Vekiari, S.A. et al. (2008). Extraction and determination of ellagic acid content in chestnut bark and fruit. Food chemistry, 110, 1007-1011. Cites Okuda, T. (2005) Systematics and health effects of chemically distinct tannins in medicinal plants. Phytochemistry, 66, 2012-2031.

74
Appendix A – Analysis; “Juice 2”, “Juice 2 (fr)”, “Juice 2 (fr+ht)”
Appendix A presents the analysis reports from Eurofins and University of Helsinki from the analysis of the cloudberry juice of the second batch. It also includes a brief presentation of the analysing methods used at respectively place. Table A1 – Analysis from Eurofins, “Juice 2”
Analysing Method, Eurofins The following is described (freely translated from Swedish to English) about the method used for analysis at Eurofins: Ascorbic acid, Vitamin C: The sample was dissolved in DL-dithiothreitol and diluted in relation to a standard. After filtered/centrifuged the sample was quantified using HPLC. The sample was referred to an external standard. Column: C18, 5 µm. l: 250mm, Id: 4.6 mm, UV det: 244 nm A1. A1 G.L. Lookhart, S.B. Hall and K.F. Finney. 1982, Determination of ascorbic acid in wheat flours, bread dough conditioners and commercial vitamin C tablets by High-Performance Liquid Chromatography. Cereal Chemistry, vol. 59, nr 1.
Benzoic acid: The sample was extracted with a mix of water and methanol. The sample was filtered and diluted 1:1 with a diluting soultion to achieve a better resemblance with pH in sample and standard. Final estimation was performed with a reversed phase C18-column A2. A2 HPLC och UV-detektion. NMKL 124, 1997, 2 ed

75
Table A2 – Analysis from University of Helsinki, “Juice 2 (fr)” & “Juice 2 (fr+ht)”
Phenolic compounds Juice 2 (fr) Juice 2 (fr+ht)
Hydroxybenzoic acids 39 73
Hydroxycinnamic acids 12.5 17.5
Anthocyanins 0.4 0.2
Flavonols nd nd
Flavanols nd nd
Ellagitannins: dimers trimers other (structure not identified)
87 41 18 28
154 60 35 59
Ellagic acid 0.1 4.3
Total phenolics * 139 249 Phenolic compounds in cloudberry juices, expressed as µg/ml juice.
Analysing Method, University of Helsinki Following is described about the analysing method used at University of Helsinki: The phenolic compounds were analysed by using UPLC coupled with DAD detector with a method modified from Kähkönen et al. A3. Cloudberry juice phenolics were first extracted using 70% acetone. Hydroxybenzoic acids were quantitated using gallic acid, hydroxycinnamic acid with chlorogenic acid, ellagic acid and ellagitannins with ellagic acid, flavanols (catechins and procyanidins) with catechin, flavonols with rutin, and anthocyanins with cyanidin-3-glucoside. The results are expressed as µg/ml juice. A3 Kähkönen, M.P., Hopia, A.I. & Heinonen, M. 2001. Berry phenolics and their antioxidant activity. J. Agric. Food Chem 49: 4076-4082.
Short comment concerning analyses of ellagitannins: In their article Kähkönen et al. are analysing ellagitannins as ellagic acid equivalents (Kähkönen, et al., 2001). Due to the review “Food Ellagitannins – Occurrence, Effects of Processing and Storage” (Bakkalbaşi, E. et al., 2009), it is difficult to analyse ellagitannins since there is a lack of commercial standards, therefore the estimation is more trustable if ellagitannins are hydrolyzed to ellagic acid and then the acid is analysed with HPLC for quantitative results. The value generated is a comparison of the amount free ellagic acid before and after the analysis (Bakkalbaşi, E. et al., 2009).

76
Appendix B – Analysis; “Juice 1”, “Juice 2 (fr 3 months)”
The analysis results seen in Appendix B are from the first batch (“Juice 1”) and from the second batch (“Juice 2”). The last analysis was preformed late in the project for confirming previous results and the juice therefore had been frozen for almost three months, the juice analysed here is referred to as “Juice 2 (fr 3 months)”. However, the results from the analysis seen in Appendix A are the values based on and discussed from in the project. Table B1 – Analysis from Eurofins, “Juice 1”.
Table B2 – Analysis from Eurofins, “Juice 2 (fr 3 months)”.
Concerning the analysing methods used, these can be studies in Appendix A.