Evaluation of the Dental Health Aide Therapist … 2010 Evaluation of the Dental Health Aide...
97
October 2010 Evaluation of the Dental Health Aide Therapist Workforce Model in Alaska Final Report Prepared for W.K. Kellogg Foundation Rasmuson Foundation Bethel Community Services Foundation Prepared by Scott Wetterhall, MD, MPH James D. Bader, DDS, MPH Barri B. Burrus, PhD Jessica Y. Lee, DDS, PhD Daniel A. Shugars, DDS, PhD, MPH RTI International 3040 Cornwallis Road Research Triangle Park, NC 27709 RTI Project Number 0211727.000.001
Transcript of Evaluation of the Dental Health Aide Therapist … 2010 Evaluation of the Dental Health Aide...
October 2010
Evaluation of the Dental Health Aide Therapist Workforce Model in
Alaska
Final Report
Prepared for
W.K. Kellogg Foundation Rasmuson Foundation
Bethel Community Services Foundation
Prepared by
Scott Wetterhall, MD, MPH James D. Bader, DDS, MPH
Barri B. Burrus, PhD Jessica Y. Lee, DDS, PhD
Daniel A. Shugars, DDS, PhD, MPH RTI International
3040 Cornwallis Road Research Triangle Park, NC 27709
RTI Project Number 0211727.000.001
_________________________________ RTI International is a trade name of Research Triangle Institute.
RTI Project Number 0211727.000.001
Evaluation of the Dental Health Aide Therapist Workforce Model in
Alaska
Final Report
October 2010
Prepared for
W.K. Kellogg Foundation Rasmuson Foundation
Bethel Community Services Foundation
Prepared by
Scott Wetterhall, MD, MPH James D. Bader, DDS, MPH
Barri B. Burrus, PhD Jessica Y. Lee, DDS, PhD, MPH
Daniel A. Shugars, DDS, PhD, MPH RTI International
3040 Cornwallis Road Research Triangle Park, NC 27709
iii
CONTENTS
Section Page
Executive Summary .............................................................................................................ES-1
1 Introduction ................................................................................................................... 1-1
1.1 Issues Addressed by this Evaluation .................................................................... 1-2
1.2 Goals of this Evaluation ....................................................................................... 1-2
1.3 Caveats: Issues Not Addressed by this Evaluation .............................................. 1-3
2 Background ................................................................................................................... 2-1
2.1 Development of Dental Services in Alaska ......................................................... 2-1
2.2 Alaska Native Oral Health Status in 1999 ........................................................... 2-2
2.3 Development of the DHAT Concept ................................................................... 2-2
2.4 Creation of the DHAT Program ........................................................................... 2-4
2.5 Description of Supervision, Scope of Practice, and Standing Orders .................. 2-6
2.6 Concerns About Workforce Model ...................................................................... 2-6
2.7 Development of Evaluation Methods .................................................................. 2-7
3 Methods......................................................................................................................... 3-1
3.1 Composition of Project Study Team .................................................................... 3-1
3.2 Patient Surveys of Satisfaction and Oral Health–Related Quality of Life ........... 3-1
3.3 Oral Health Surveys ............................................................................................. 3-2
3.4 Clinical Technical Performance ........................................................................... 3-3
3.5 Performance Measures ......................................................................................... 3-5
3.6 Record-Based Process Evaluations ...................................................................... 3-6
3.7 Clinic Facilities, Policies, Personnel, and Procedures Evaluations ..................... 3-7
iv
3.8 Key Informant Interviews .................................................................................... 3-8
3.9 Alaska Site Selection ........................................................................................... 3-9
3.10 Site Visit Methodology ...................................................................................... 3-13
3.11 Protection of Human Subjects ........................................................................... 3-13
3.12 Data Analysis ..................................................................................................... 3-14
4 Results ........................................................................................................................... 4-1
4.1 Patient Satisfaction and Oral Health–Related Quality of Life ............................. 4-1 4.1.1 Children Ages 6 to 17 .............................................................................. 4-1 4.1.2 Participants 18 Years of Age or Older ..................................................... 4-8
4.2 Oral Health Status .............................................................................................. 4-14
4.3 Clinical Technical Performance ......................................................................... 4-17
4.4 Performance Measures ....................................................................................... 4-23 4.4.1 Effectiveness of Care Measures (Table 4-31) ........................................ 4-23 4.4.2 Use of Services Measures (Table 4-31) ................................................. 4-24 4.4.3 Complication Rates (Table 4-31) ........................................................... 4-25 4.4.4 Provision of Examinations, Prophylaxes, and Preventive
Procedures (Table 4-32) ......................................................................... 4-26 4.4.5 Gingival Bleeding Assessment (Table 4-32) ......................................... 4-27 4.4.6 Consultation (Table 4-32) ...................................................................... 4-27
4.5 Record-Based Process Evaluations .................................................................... 4-28
4.6 Clinical Facilities Evaluations ........................................................................... 4-29
4.7 Key Informant Interviews .................................................................................. 4-32 4.7.1 Perspectives of Sponsoring Tribal Health Organizations ...................... 4-32 4.7.2 Experiences of Individual Therapists ..................................................... 4-35 4.7.3 Community Context ............................................................................... 4-41 4.7.4 Community Outreach and Prevention Programs ................................... 4-43
5 Discussion ..................................................................................................................... 5-1
5.1 Level of Patient Satisfaction and Access to Care ................................................ 5-1
v
5.2 Clinical Technical Performance and Performance Measures .............................. 5-3
5.3 Record-Based Process Measures and Clinical Facilities Evaluation ................... 5-4
5.4 Development and Implementation of Community-Based Prevention Programs .............................................................................................................. 5-5
5.5 Challenges Facing Implementation of a Tribal Organization’s DHAT Program ................................................................................................................ 5-5 5.5.1 Recruitment and Retention ...................................................................... 5-6 5.5.2 Matching of Resources to Service Needs ................................................ 5-6 5.5.3 Community Context ................................................................................. 5-7
5.6 Future Directions ................................................................................................. 5-8
6 Conclusions ................................................................................................................... 6-1
7 References ..................................................................................................................... 7-1
Appendixes
A: Crisis in Access to Dental Care by Tom Bornstein
B: Project Advisory Groups
C: Satisfaction and Perceived Oral Health Status Surveys
D: Oral Health Impact Profile and Parents Perceptions Questionnaire
E: Oral Examination Instructions
F: Sealant Evaluation Recording Form
G: Composite Evaluation Recording Forms
H: Amalgam Evaluation Recording Forms
I: Stainless Steel Crown Evaluation Recording Forms
J: Oral Hygiene Instruction Evaluation Recording Form
K: Performance Measures Definitions and Audit Instructions
L: Examples of Criteria by Dimensions
M: Key Informant Interview Guides
vi
LIST OF TABLES
Number Page
3-1. Number of Persons Who Participated in Key Informant Interviews, by Stakeholder Category and Type of Interview .............................................................. 3-8
3-2. Data Collection Sites, Types of Dental Services, and Role of Therapist in Providing Dental Care ............................................................................................... 3-10
3-3. Population Demographic Characteristics, by Evaluation Site ................................... 3-10 3-4. Economic Characteristics, by Evaluation Site .......................................................... 3-11 3-5. Other Attributes of Public Health Infrastructure, by Evaluation Site ....................... 3-12 4-1. Characteristics of Survey Respondents Ages 6–17 ..................................................... 4-1 4-2. Caregiver Reports for Children Ages 6–17 Who Were Treated by a Therapist
in Previous 12 Months, All Sites Combined ............................................................... 4-2 4-3. Caregiver Reports for Children Ages 6–17 Who Were Treated by a Therapist
in Previous 12 Months and Who Responded “Always” Or “Usually” to Questions About Their Dental Care, by Site ............................................................... 4-2
4-4. Caregiver Reports for Children Ages 6–17 Who Were Treated by a Therapist in Previous 12 Months and Who Responded “Always” or “Usually” to Questions About Their Dental Care, by Age Group ................................................... 4-3
4-5. Caregiver Rating of Therapist for Children Ages 6–17 Who Were Treated by a Therapist in Previous 12 Months ................................................................................. 4-3
4-6. Dental Care Survey Results for Children Ages 6–17, All Sites Combined ................ 4-4 4-7. Children Ages 6–17 Whose Caregiver Responded “Always” or “Usually” to
Questions about Their Dental Care, by Age Group, All Sites Combined ................... 4-4 4-8. Children Ages 6–17 Whose Caregiver Responded “Always” or “Usually” to
Questions about Their Dental Care, by Site, All Sites Combined .............................. 4-5 4-9. Caregiver Rating of All Dental Care Personally Received in Past 12 Months
For All Respondents Ages 6–17 .................................................................................. 4-5 4-10. Rating of Dental Care System by Caregiver for Children Ages 6–17 ........................ 4-6 4-11. Results of Parents Perceptions Questionnaire, Children Ages 6–17, All Sites
Combined .................................................................................................................... 4-7 4-12. Characteristics of Survey Respondents 18 Years of Age or Older ............................. 4-8 4-13. Persons 18 Years of Age or Older Who Were Treated by a Therapist in
Previous 12 Months, All Sites Combined ................................................................... 4-9 4-14. Persons 18 Years of Age or Older Who Saw a Therapist in Previous 12 Months
and Who Responded “Always” or “Usually” to Questions About Their Dental Care, by Site ................................................................................................................ 4-9
vii
4-15. Persons 18 Years of Age or Older Who Saw a Therapist in Previous 12 Months and Who Responded “Always” or “Usually” to Questions About Their Dental Care, by Age Group ..................................................................................................... 4-9
4-16. Rating of Therapist by Persons 18 Years of Age or Older Who Were Treated by a Therapist in Previous 12 Months ....................................................................... 4-10
4-17. Dental Care Survey Results Among Persons 18 Years of Age or Older, All Sites Combined .......................................................................................................... 4-10
4-18. Persons 18 Years of Age or Older Who Responded “Always” or “Usually” to Questions about Their Dental Care, by Age Group, All Sites Combined ................. 4-11
4-19. Persons 18 Years of Age or Older Who Responded “Always” or “Usually” to Questions about Their Dental Care, by Site, All Sites Combined ............................ 4-11
4-20. Rating of All Dental Care Personally Received in Past 12 Months by All Respondents 18 Years of Age or Older ..................................................................... 4-12
4-21. Rating of Dental Care System by All Respondents 18 Years of Age or Older ......... 4-12 4-22. Results of Oral Health Impact Profile Among Persons 18 Years of Age or
Older .......................................................................................................................... 4-13 4-23. Oral Examination Results (32 Teeth) ........................................................................ 4-14 4-24. Third Grade Comparison ........................................................................................... 4-16 4-25. CPI Examination Results ........................................................................................... 4-17 4-26. Evaluation of Sealant Placement Performed by Therapists ...................................... 4-18 4-27. Evaluation of Composite Preparations Performed by Therapists and
Restorations Performed by Therapists and Dentists .................................................. 4-19 4-28. Evaluation of Amalgam Preparation Performed by Therapists and Restorations
Performed by Therapists and Dentists ....................................................................... 4-20 4-29. Evaluation of Stainless Steel Crown Preparations by Therapists and
Restorations Performed by Therapists and Dentists .................................................. 4-22 4-30. Oral Hygiene Instruction Observation ...................................................................... 4-23 4-31. Audit-Based Performance Measures, by Site ............................................................ 4-25 4-32. Provision of Examinations, Prophylaxes, and Preventive Procedures, by Site ......... 4-28 4-33. Record-Based Process Evaluations, by Site .............................................................. 4-29 4-34. Specific Items in Clinic Structural Evaluation That Did Not Meet Evaluation
Criteria, by Dimension and Site ................................................................................ 4-30 4-35. Number and Disposition of Students Who Participated in New Zealand, by
Training Class ............................................................................................................ 4-35
viii
ACKNOWLEDGEMENTS
In addition to the research team, there were many people and organizations who contributed to this report since the study began in July 2008. Research was guided by a National Advisory Committee and an Alaska Tribal Coordinating Committee with members ranging from professional dentists to Alaska Native community members. We are grateful for the participation of the following people and organizations in this process.
Alaska Tribal Coordinating Committee Brian Hollander Barbara Keena Joe Klejka Frank Sutton Sue Hoeldt Tom Bornstein Doug White Mark Kelso Rose Heyano Loera Berda Willson Sandra Jones June Walunga Stephanie Woods Mark Gorman Dan Long
Alaska Native Tribal Health Consortium Tim Gilbert Jay Butler Ron Nagel Mary Williard
National Advisory Committee Caswell Evans (Chair) Raymond Lala Myron Allukian Jr. Sheila Riggs Robert Brandjord Stephen Schroeder George Brenneman Mary Smith L Jackson Brown Richard Valachovic Dominick DePaola June Walunga Chris Halliday Brad Whistler Ann Battrell Doug White Lawrence Hill Berda Willson
Staff and Study Participants from Alaska The individuals in villages throughout Alaska who participated in the data collection activities
The dental health aide therapists, dentists, and other clinic staff who took part in the study
ix
Individuals and Organizations Contributing to Data Collection and Report Preparation William Murdock Diane Shugars William Blaylock Julia Gable Carla Pinkerton Jo Hetland Lisa Kilpatrick Rita Sembajwe James Kennedy Justin Faerber Thomas Long Orange County Health Department, NC
Foundations, Staff, and Consultants W.K. Kellogg Foundation Alice Warner-Mehlhorn Rasmuson Foundation Joel Neimeyer Bethel Community Services Foundation Chris Perez Albert Yee Jerry Drake Allan Formicola Mary Elizabeth Rider
ES-1
EXECUTIVE SUMMARY
ES.1 Introduction
A majority of Alaska’s Native population lives in remote villages, accessible only by airplane, boat, four-wheeler, or snow mobile. Because of this, devising effective strategies to meet their oral health needs has posed daunting, nearly insurmountable, challenges for over a century. Since the 1960s, dental care for rural Alaska Natives has been provided primarily by itinerant dentists employed by (or under contract to) the Indian Health Service (IHS) or tribal organizations. With limited access to preventive and restorative care, disparities in oral health continue to grow: 62% of children ages 2 to 5 have untreated caries, a sizably higher proportion than among comparable groups from the lower 48 states.
To address these needs, in 2003 the Alaska Native Tribal Health Consortium (ANTHC), in collaboration with tribal health organizations, began the Alaska Dental Health Aide Initiative to provide dental health aide therapists (hereafter called therapists) to rural villages. Modeled after a program that began in New Zealand in 1921 and that has now been successfully emulated in many other countries worldwide, the Initiative is part of the Community Health Aide Program. There are currently 10 therapists who were trained in New Zealand and who work in a variety of practice settings, including subregional clinics and remote villages. Working under the general supervision of dentists at regional offices, therapists may perform cleanings, restorations, and uncomplicated extractions.
In January 2008, the W.K. Kellogg Foundation, in collaboration with ANTHC, the Rasmuson Foundation, and the Bethel Community Services Foundation, requested that an experienced organization provide an independent, detailed, and objective evaluation of the initial implementation of the Dental Health Aide Therapist (DHAT) program. In this evaluation, we focused on the following five areas:
patient satisfaction, oral health–related quality of life, and perceived access to care;
oral health status;
clinical technical performance and performance measures;
record-based process measures and evaluation of clinical facilities; and
implementation of community-based preventive plans and programs.

ES-2
ES.2 Methods
In the ensuing 2.5 years, we undertook an extremely detailed examination of the implementation of the DHAT program in Alaska. Originally, we intended to conduct a comparative study using villages served by therapists vs. those that were not. However, for many reasons, not the least of which was that it was impossible to find comparable villages, we abandoned the comparative approach and instead conducted a case study of five unique villages. Villages were selected to allow us to take full advantage of the natural variability in practice circumstances to assess issues related to the DHAT program implementation under a variety of conditions. Our National Advisory Committee, in recognition of the fact that any long-term evaluation of the DHAT program will require a carefully designed and executed baseline assessment, recommended that this evaluation provide such a rigorous and foundational perspective for future use, and our revised approach was designed to help provide this information. Further, the Alaska Tribal Coordinating Committee requested that we provide data pertinent to their continuing quality improvement information needs. Our clinical and facility assessments were expanded to address this request as well.
We employed a variety of quantitative and qualitative measures to provide legitimate and robust answers to the focus areas we were asked to address. We consciously undertook this evaluation with a narrow scope in mind: to evaluate—using transparent quantitative and qualitative methods—the implementation of the DHAT program in five practice sites in Alaska. We undertook this challenging effort knowing that there are few, if any, widely accepted, evidence-based standards for assessing dental practice performance. Further, for the logical comparison group—that is, dentists in private practice—there are virtually no data for any of the outcomes that we undertook to observe and measure.
The quantitative measures that we used relied on methods that were previously published in the peer-reviewed literature, were developed by national or international organizations, were derived from examination standards used for assessing clinical competency for board certification of U.S. dental school graduates, and were informed by expert opinion of practicing professors from academic dentistry. The qualitative measures that we used were foundational ones commonly used in social sciences and health services research.
We conducted multi-day visits to sites where therapists were currently operating, as well as the regional hubs, relatively larger communities where their supervisory dentists worked. During site visits where therapists were working, we used trained and calibrated project dentists to directly observe the work of the therapists (performing restorations and other patient-specific

ES-3
care). We also had the opportunity to assess, in a blinded fashion, the characteristics of prior restorations (amalgams and composites) that had been performed by both dentists and therapists. Dental records were assessed using explicit published criteria to assess measures of practice effectiveness and site and individual therapist performance. Qualitative data were derived from scores of interviews that were conducted during our multiple site visits to Alaska, as well as numerous phone conversations. On site visits and in phone interviews, we conducted semi-structured interviews using interview guides. These interviews were recorded, transcribed, coded, and analyzed using qualitative analysis software.
ES.3 Results
With regard to restorations, using well-accepted criteria for selected clinical procedures, the therapists were directly observed performing sealant placement, composite and amalgam preparations, stainless steel crown placement, and oral health instruction. The sample sizes for each of these procedures were small, as was the proportion of observed procedures with deficiencies. Prior restorations were assessed by a trained observer who was “blinded,” or unaware whether a therapist or dentist had been the provider. In this convenience sample, few deficiencies were observed, and rates and types of deficiencies were similar for the two provider groups. With regard to prevention, performance measures indicate that assessment of patients' risk of dental disease is well integrated into some but not all practice sites. This is not an unexpected finding; a formal risk assessment is currently being promoted in dental schools but has not yet become universally accepted in dental practices.
The level of patient satisfaction derived from surveys was generally high and did not vary across sites or by age. Therapists were rated as explaining things clearly, listening carefully, and treating patients with courtesy and respect. As a system characteristic, therapists and other dental providers were rated as making patients feel comfortable and generally not keeping their patients waiting for more than 15 minutes. Qualitative results indicated that many persons from the villages reported that they felt access to care had improved. Many village residents reported that they appreciated being able to have dental problems addressed more quickly rather than waiting months for appointments in larger hub communities or having to wait with a toothache until a dentist might come out to the village. Many of the village residents expressed pride that an Alaska Native had been trained to provide these dental services, with the therapists serving as positive role models for the children of the village, particularly in the two village sites where the therapists reside permanently.
ES-4
A fundamental factor influencing the success of implementing prevention programs appeared to be whether the therapist was living permanently in the particular village. The itinerant therapists did not have the time to divert from addressing backlogged dental needs; in addition, because of the short duration of their visits, they had fewer opportunities to develop relationships, particularly with key school personnel who often may need to be educated about the importance of oral health.
In four of the five sites, the therapist operates within a modern medical clinic constructed during the past 20 years. The number of chairs ranged from one (Site C) to eight (Site A). The fifth clinic at Site E has two chairs; it is located in a portion of a doublewide trailer that also provides temporary quarters for itinerant staff. Four of the five therapists’ supervising dentists were dental directors, and the fifth was a clinic dental director. All were full-time employees of their area’s tribal health organization.
The evaluation of clinic facilities, policies, and personnel assessed 91 specific items across eight dimensions, and most of these were satisfactory across all sites. A small number of items that did not meet evaluation criteria at some of the sites were noted in facilities, equipment, written descriptions of policies, and sterilization dimensions. There are no published data on how private practices or clinics in the United States would compare with the results on these 91 specific items.
ES.4 Conclusions
The various indicators that were applied in these case studies to evaluate implementation of this program demonstrate that the five therapists who were included in this study are performing well and operating safely and appropriately within their defined scope of practice. The data indicate that the therapists who were observed are technically competent to perform these procedures within their scope of practice. The patients who were surveyed were generally very satisfied with the care they received from the therapists.
Those who initially conceived of implementing a dental therapist program in Alaska recognized the magnitude of the unmet need. They planned to strategically deploy the therapists to the larger villages (those with populations of 800 or more) to address the considerable unmet need for restorative care. It was expected that the therapists, when first deployed to a village, would place their major emphasis on relieving pain from dental caries as a first line approach. All of the patient care data indicate that the therapists are practicing in this manner under the general supervision of the dentists to whom they are assigned and with standing orders defined by the supervising dentist in accordance with a scope of practice outlined through the federal
ES-5
certification standards. The therapists we observed are well accepted in the villages, and serve as role models. As the burden of acute oral disease is brought under control, the second prong of this approach was to begin implementing preventive measures—including education—through the school system by village-based therapists. There are early indications that this model—implemented by resident therapists who have a well-respected role in the community—can begin to permit therapists to focus part of their efforts on preventive services. Such measures are needed as there continues to be substantial dental disease, and especially troublesome is the fact that many of the younger individuals are moving in the same trajectory as the adults seen in this study. Effecting change will take significant alterations in the oral health attitudes and behavior of Alaska Natives, and this will likely take years to accomplish. The therapists’ cultural awareness and credibility in the villages can help shape changes in behaviors.
1-1
SECTION 1 INTRODUCTION
A majority of Alaska’s Native population lives in remote villages, accessible only by airplane, boat, four-wheeler, or snow machine. Because of this, devising effective strategies to meet their oral health needs has posed daunting, nearly insurmountable, challenges for over a century. Since the 1960s, dental care for rural Alaska Natives has been provided primarily by itinerant dentists employed by (or under contract to) the Indian Health Service (IHS) or tribal organizations. With limited access to preventive and restorative care, disparities in oral health continue to grow: 62% of children ages 2 to 5 have untreated caries (Indian Health Service, 2002).
To address these needs, in 2003 the Alaska Native Tribal Health Consortium (ANTHC), in collaboration with tribal health organizations, began the Alaska Dental Health Aide Initiative to provide dental health aide therapists (hereafter called therapists) to rural villages (ANTHC, 2008). Modeled after a program that began in New Zealand in 1921 and that has now been successfully emulated in many other countries worldwide (Nash, 2004; Nash & Nagel, 2005), the Initiative is part of the Community Health Aide Program. There are currently 10 therapists who were trained in New Zealand and who work in a variety of practice settings, including subregional clinics and remote villages. Working under the general supervision of dentists at regional offices, therapists may perform cleanings, restorations, and uncomplicated extractions.
With its longstanding interest in addressing health disparities by supporting and evaluating delivery systems that can reach the underserved, the Kellogg Foundation, in collaboration with ANTHC, the Rasmuson Foundation, and the Bethel Community Services Foundation, seeks to evaluate the care provided under the integrated dental delivery system now employing the therapists. However, recognizing that the benefits of improving access to dental care may come with unanticipated costs, the foundations and ANTHC asked that the use of therapists be carefully evaluated against any potential to do harm, with attention to whether this model of care delivery represents an improvement of current care practices or, more seriously, results in care that causes detrimental outcomes beyond what would have happened in the absence of such care. Further, in the early stages of fielding a newly developed program, such as the Dental Health Aide Therapist (DHAT) program, it is important to evaluate the implementation process to assess the integrity to the overall program model and identify barriers and facilitators for long-term success.

1-2
1.1 Issues Addressed by this Evaluation
For those who provided resources for this program evaluation, those who served on project advisory committees, and those individuals and their institutions who participated in or contributed to this project—supporters and advocates as well as potential critics and detractors—the overriding areas of focus of this evaluation have been on (1) the care provided by the therapists, and (2) changes in access to care for eligible program beneficiaries. Although measures of quality of care are compelling in their capacity to inform ways to improve the provision of dental care in the future, there are few measures available to assess the quality of care in dental practices, and virtually no published or widely accepted performance standards for these measures (Bader, 2009). Thus quality assessment, by necessity, must be descriptive but not comparative. Although there are reasonable measures of access, having access does not necessarily guarantee patient health unless the definition of access includes the concept that health care services will maintain or improve health or otherwise provide “quality care.”
Therefore, what we provide in this report is an in-depth case study of Alaska tribal health organizations as they implemented a program based on a provider model that was developed nearly 90 years ago in New Zealand and has been emulated in over 40 countries worldwide (Nash et al., 2008). We have employed both quantitative and qualitative methods to collect a rich array of data on the program implementation process that each of the tribal organizations employing New Zealand-trained therapists has undertaken and experienced.
1.2 Goals of this Evaluation
Our general approach was to provide, beginning in 2008, a broad and comprehensive assessment of the implementation of the DHAT program by assessing practice activities in sites within each of the five tribal health organizations that currently employ New Zealand–trained therapists. The overall purpose of this project was to evaluate the implementation of the DHAT program, with a particular emphasis on assessing the care and current practice characteristics that may be influencing changes in levels of access to care. Regarding practice characteristics, there are no published results on how existing practices comply with many of the selected areas studied; however, since the outcome of this study was to assist ANTHC in improving the program as they move forward, we decided to collect such information in addition to assessing care. In addition, we included a cross-section series of oral health surveys in each site to provide a baseline assessment for future longitudinal studies. Specific areas of focus included
patient satisfaction, oral health–related quality of life, and perceived access to care;
oral health status;
1-3
clinical technical performance and performance measures;
record-based process measures and evaluation of clinical facilities; and
implementation of community-based preventive plans and programs.
1.3 Caveats: Issues Not Addressed by this Evaluation
This is not a randomized trial of quality assessment that compares the outcomes of licensed dentists with those of therapists, although we were able to collect, in a blinded, unbiased fashion, data that permit comparisons of the technical excellence of prior restorations provided by members of the two groups. Such information is valuable and informative.
Similarly, this is a cross-sectional assessment that does not afford a reliable quantitative assessment of how dental care access may be changing in bush Alaska. The program is too new and comprises too few therapists to expect such quantification at this time. By nature, a cross-sectional assessment is one that provides insight into how the DHAT program is operating at a single time point of observation. Such an assessment provides valuable information, but this design does not permit an evaluation of what the impact of the DHAT program may be on the oral health of the community over time. For this reason, we included in the evaluation an oral health survey of residents in each village that can serve as a baseline for future longitudinal studies. The oral health survey provides the context in which the therapists and other dental providers are operating. However, to reiterate, the oral health survey’s cross-sectional nature does not enable attribution to a program or a particular provider as having either a positive or negative impact. The survey should be viewed as a snapshot in time, but a picture with considerable clarity nonetheless.
Moreover, this evaluation was consciously undertaken with a narrow scope in mind: to evaluate—using transparent quantitative and qualitative methods—the implementation of the DHAT program in five practice sites in Alaska. We undertook this effort knowing full well that there are few, if any, widespread and evidence-based standards for assessing dental practice performance. There are no uniformly accepted practice groups whose standardized performance can serve as a valid comparison for what we undertook to observe. These caveats should be kept in mind when considering the microscopic scrutiny to which we applied our examination of the implementation of the DHAT program. Applying similarly intense scrutiny to the routine practice and performance of licensed dentists currently in private practice in Alaska, as well as those in the lower 48 states, would be most illuminating. Such examination is beyond the scope of the current project and must await future study and availability of interest and resources.
1-4
This evaluation focused on issues related to program implementation of allied providers, therapists who were trained in a New Zealand–based program that has been operating for 89 years. There are many proponents and opponents of the notion that such allied providers—in some form—be trained, licensed, and deployed in the lower 48 states. These are policy issues that extend well beyond what we were tasked to perform in this evaluation. Advocates on both sides of the issue may find this narrow construction frustrating and incomplete, but the major contributors to this report spent countless hours debating the results of our study and the context in which it will be disseminated. We were not tasked with developing policy recommendations for wider implementation of this or some other allied- or mid-level-provider workforce model. The data provided in this evaluation can serve as a legitimate foundation by which others may draw and formulate their own inferences and recommendations. Our commitment has consistently been to provide the most accurate assessment available. This is the best and most informative role that this study can play in the current policy climate.
Even with these cautionary notes, this study provides information on how therapists provide dental services across a range of practice circumstances, and how that provision is perceived by consumers of those services. These case studies will illuminate many of the issues facing a program whose implementation is still in its infancy; they will not answer all of the questions surrounding the use of “nontraditional” providers, but the findings from the case studies will hopefully contribute some useful observations to further inform the ongoing debate.
2-1
SECTION 2 BACKGROUND
2.1 Development of Dental Services in Alaska
Following the acquisition of Alaska from Russia in 1867, medical care was sporadically provided by ship’s surgeons who were assigned to the Revenue Cutter Service and who occasionally provided treatment to Alaska Natives when making landfall during their summer cruises in the coastal waters of the Bay of Alaska and the Bering Sea. Beginning in 1885, the Department of the Interior’s Bureau of Education operated a series of village schools in Alaska. By 1907, because of the high prevalence of illness among school children, the Bureau of Education began to hire physicians and nurses directly and to support a program of hospital construction in Juneau, Akiak, and Noorvik. In 1916, a Commissioned Officer of the Public Health Service traveled by cutter to villages in the Aleutians, where he reported that the dental health of Alaska Natives was extremely poor and warranted an annual visit by a government dentist.
In 1931 the Bureau of Indian Affairs assumed responsibilities for health programs from the Bureau of Education and embarked on a hospital construction program while expanding dental and nursing services. Nonetheless, during the ensuing two decades, provision of health services, including dental services, was limited—particularly during World War II when many health professionals were drafted to assist in the war effort. In 1954, Congress directed the Division of Indian Health (renamed the Indian Health Service in 1969) to take over health care provision for American Indians and Alaska Natives. During the 1950s and 1960s, the number of Commissioned Officers of the Public Health Service who were assigned to the Division of Indian Health grew in Alaska. Nearly all of the dentists, who were primarily assigned to either Anchorage or field hospitals, were Commissioned Officers. Each of seven hospitals located throughout the state had a dental unit administered by a Commissioned Officer.
In the early 1960s, with transfer of all health care responsibilities to the Division of Indian Health, the concept of field visits by medical and dental teams became established as a basic model for providing care to residents of remote villages. Under this model, teams of providers would visit distant sites for brief periods of time—typically 1 to 2 weeks—and work long hours to accommodate as many patients as possible. The focus was on addressing acute need through extractions and restorative care. Although transportation, particularly access to air travel, has improved dramatically during the past 50 years, this model of itinerant care by dental
2-2
staff still serves as the foundation for the process by which many residents receive their dental care.
With the Civil Rights Movement of the 1960s, the notion that persons who are served by a particular government program should also play a role in that program’s administration gained momentum. Although many lauded the expertise, compassion, and dedication of individual health care professionals who were providing services as employees of the Indian Health Service, critics viewed the agency as rigid, hierarchical, and insufficiently responsive to the idea that program recipients should be empowered to manage their own health care. President Nixon in 1970 stated that “the goal of any new national policy toward the Indian people…[should be]…to strengthen the Indian’s sense of autonomy without threatening his sense of community” (Kunitz, 1996). With the passage of the Indian Self-Determination and Education Assistance Act (PL 93-638) in 1975 and the passage the next year of the Indian Health Care Improvement Act (PL 94-437), the option to transfer responsibility for dental and health care to Tribes and tribal organizations became law. During the next 25 years, tribal health organizations, in assuming responsibility for provision of dental services, continued to use the IHS workforce model of using staff dentists—either IHS officers or contract workers—and itinerant dentists to provide oral health services in Alaska. Under this model, some smaller villages may have only a single 1-week visit by a dentist every 12 months. Currently, there are 13 tribal health organizations that operate their own dental programs in Alaska.
2.2 Alaska Native Oral Health Status in 1999
The Indian Health Service undertook an Oral Health Survey of American Indian and Alaska Natives who had been treated and served in dental service units that were directly or indirectly supported by the IHS. The survey included 12,881 patients and documented the degree of dental disease across multiple ages groups, underscoring the significant unmet need of these populations, regardless of what measure oral health was examined.
2.3 Development of the DHAT Concept
In 1999, Mark Gorman, then Vice President of Community Health Services for the Southeast Alaska Regional Health Consortium (SEARHC) met with Tom Bornstein, SEARHC’s Dental Director to discuss the issue of “extending care to an incredibly needy population.”1 Noting that “a good idea has many parents,” he asked the dental director to think about ways to do things differently, given that there were “continual complaints that access to care was
1 Interview with Mark Gorman, May 13, 2009.
2-3
extremely limited.”2 At first, the VP met with some resistance, particularly since it would, in effect, be “taking away clinical time” from a dentist who was “totally immersed in the clinic… [and]…as busy as could be.”
Once the dental director reconsidered the issue from a broader, population-based perspective, he embraced the concept of approaching oral health issues “from a public health viewpoint,” recognizing that he and other individual providers would never be able to provide sufficient services to address the amount of unmet need. In response, he produced a white paper (Bornstein, 1999) that outlined a series of options for improving oral health services for Alaska Natives (see Appendix A).
He noted a series of challenges that contributed to the current status of oral health among Alaska Natives, including escalating costs, “difficulties in the recruitment of professional staff,” insufficient funding, and accelerating cultural changes such as the transition from a traditional subsistence diet to one heavily infused with refined carbohydrates. On top of this, the population of Alaska Natives was growing in number, which was a healthy sign of the success of the anti-tuberculosis programs of the 1950s (Fortuine, 2006), yet one more unexpected source of stress on an overtaxed and underfunded health care system.
Later in 1999, the dental director presented the options outlined in his white paper at a meeting of the Alaska Native Health Board. One option was to permit tribal health organizations to employ “dentists, dental specialists, and dental hygienists who are fully licensed to practice” in other states, not just providers who had been licensed by the Alaska licensing boards. A second option was more widespread adoption of expanded function dental assistants, trained persons who can perform limited procedures, such as drilling and placement of fillings under indirect supervision of licensed dentists. A third option was to “train dental hygienists in expanded duties and techniques such as atraumatic restoration of teeth.”
Most of these modifications would require changes in licensing arrangements for providers in Alaska. Neither the Alaska Dental Society nor the Alaska Dental Board showed any support for such changes. At that point, Jim Berner, the Director of the Community Health Services Division for ANTHC, suggested that the program changes in dental services be developed under the aegis of the Community Health Aide Program, a well-established program started initially in 1968 to permit local village residents, after training and certification, to provide health services such as first aid, blood pressure screening, and other essential services,
2 Interview with Tom Bornstein, March 17, 2010.

2-4
including triage and request for medical evacuation (Harrison, 1965). The Community Health Aide Program has expanded significantly over time. It is funded by Congress and operates under federal law. As such, community health aides were not subject to the health licensing authorities of states.
2.4 Creation of the DHAT Program
Under the leadership of the IHS Alaska Area Dental Director, Jeanine Tucker, the Alaska Area applied for a grant from the IHS Clinical and Preventive Support Center.3 The $1.3 million, 5-year grant awarded in 2000 was to be used as seed money for developing dental providers under the aegis of the Community Health Aide Program. Ron Nagel, who had workforce development experience from his dental assignments in the Western Pacific, was hired to staff the grant. The University of Kentucky, which had several dentists who had been active in developing alternative workforce models in international settings, was contracted to assist in curriculum development. Those who were active in developing the concept of the program were not particularly wedded to a specific provider model at this time. “The idea was just to explore which models might work and continue to refine them,” recalls Nagel. Much of what was evolving in the early part of the decade was still iterative.
At this point, Nagel was responsible for writing the proposed draft of federal standards under which the program, with its multiple levels, would operate. These standards included training and education requirements, modes of supervision, competencies, and scope of practice. These standards would need to be approved by the Community Health Aide Program Certification Board. Nagel developed “the requirements for the federal standards for each of…four or five different models,” and then embarked on a 2-year consensus-building process with tribal organizations, dental directors, members of the certification board, and other stakeholders to agree upon the standards. At this time, others who supported the concept of the program, such as Mary Williard, a dentist from Bethel, assisted Nagel in writing and revising these standards. With considerable assistance from private legal counsel retained by ANTHC, Myra Munson, an expert in Native and health law, they transformed their work into language that could be adopted and approved by the certification board.
With the creation of the Community Health Aide Program in 1968, the Community Health Aide Program Certification Board was established under the authority of the Indian Heath Care Improvement Act and the Snyder Act. As the standards and procedures now state, the Community Health Aide Program Certification Board “sets standards for the community health
3 Interview with Ron Nagel, April 14, 2010.

2-5
aide program and certifies individuals as community health aides and practitioners, dental health aides (including primary dental health aides, dental health aide hygienists, expanded function dental health aides, and therapists)…Each of these individuals is subject to specific requirements and engages in a specific scope of practice set forth in these Standards.”4 The standards for the dental health aide providers were adopted in 2002.
Meanwhile, Nagel was exploring the potential workforce models, having discussions with those who administered programs in Canada, and arranging a trip to New Zealand to observe their operations. The New Zealand program is the oldest, a school-based program started in 1921 in part because New Zealand experienced “trouble in recruiting soldiers from their school system,” largely because of the poor oral health of the recruits. Nagel was also participating in teleconference calls arranged by IHS among three universities interested in alternative dental workforce models.
After failing to get funding from a philanthropic organization for a collaborative effort with the University of Kentucky and the Forsyth Institute, Nagel approached the Rasmuson Foundation, a charitable organization that focuses its efforts on the people of Alaska. Rasmuson responded with a $1 million grant, its largest ever. Although the grant’s original intent was to use funds to hire clerical staff and to have the University of Kentucky continue with curriculum development, at Tucker’s urging, Nagel queried the dental directors to see if there was any interest in identifying students who they could send to the 2-year Dental Therapy program at the University of Otago in New Zealand. He pointed out that this was a “potential opportunity to kick start this notion of DHAT as part of our program.” Nagel worked with the Foundation and “reprogrammed that Rasmuson grant to not hire an administrative assistant but to pay tuition and stipend…to these students in New Zealand.”5
After obtaining critical support from the Boards of Directors of their tribal health associations, two dentists from western Alaska—the Yukon Kuskokwim Health Corporation and Maniilaq Association—responded affirmatively. The two dentists identified a total of six students near the close of 2002. Nagel states that “we did all the administrative stuff in 30 days and have the plane tickets…in five weeks to New Zealand. In January 2003, the first cohort of Alaskan students began their Dental Therapy training at the University of Otago in Dunedin, New Zealand. The two subsequent cohorts of students to be trained in New Zealand were
4 Community Health Aide Certification Board Standards and Procedures, amended June 19, 2008. 5 Interview with Ron Nagel, April 14, 2010.
2-6
recruited from among three other participating tribal associations: the Norton Sound Health Corporation, the Bristol Bay Health Corporation, and SEARHC.
2.5 Description of Supervision, Scope of Practice, and Standing Orders
The therapists’ scope of practice is outlined through the Community Health Aide Program’s Certification Board Standards and Procedures (available at http://www.akchap.org/2008%20Library/2008%20LIBRARY%20File/Certification%20Board/CHAPCB%20Standards%20&%20Procedures%20Amended%2006-19-08%20final.pdf). The therapists included in this study successfully completed the training requirements of the New Zealand Dental Health Aide Therapist Program as well as a preceptorship consisting of at least 3 months or 400 hours (whichever is longer). The students were required to demonstrate each procedure and service independently to the preceptor dentist’s satisfaction. Following completion of their training and preceptorship, the therapists continue to work under the general supervision of a dentist provided they have met all of the necessary requirements. The therapists must fulfill a biannual requirement for continuing education courses and must undergo recertification by the Community Health Aide Program’s Certification Board every 2 years.
Although the full range of activities and procedures therapists are allowed to perform is outlined through the Board Standards and Procedures, each supervising dentist may also develop a set of standing orders within which the therapist under their supervision must limit their practice when working remotely, under the general supervision of their supervisory dentist. Although the activities and procedures cannot exceed the therapist’s scope of practice, these standing orders can place further restrictions on the activities the therapist is allowed to perform, based on the supervising dentist’s preferences and the context in which the therapist is operating.
2.6 Concerns About Workforce Model
The Initiative was met with opposition by the American Dental Association (ADA) (ADA, 2005) and the Alaska Dental Society, which filed suit in Alaska Superior Court in January 2006 against ANTHC (Smith, 2007). ADA’s position was that, although it supported some aspects of the Dental Health Aide Initiative, it was opposed to concept of therapists, who were permitted to perform irreversible or “surgical” procedures. ADA felt that only licensed dentists are qualified to perform pulpotomies, perform amalgam and composite preparations and restorations, and extract teeth. After a ruling was handed down in favor of ANTHC, ADA and ANTHC reached a settlement. ADA pledged other forms of support to meet the dental needs of rural Alaska. A succinct summary of this period can be found in the Alaska Law Review (Smith, 2007).
2-7
2.7 Development of Evaluation Methods
In the original proposal in February 2008, we proposed to compare the experience in villages served by therapists with those of villages that currently do not have a therapist, whose residents rely on other means to obtain dental services, typically by itinerant dentists or through travel to a regional clinic.6 Such a design seemed like a straightforward approach to assessing the performance and impact of dental services provided by therapists compared to the status quo. Upon further investigation, however, several key factors influenced our redirection of the design.
First, our site visits, discussions with the Alaska Tribal Coordinating Committee (ATCC, which was a statewide project advisory committee), and additional research led us to realize that the burden of oral disease is quite substantial in Alaska and that it may take 10 years and many more therapists before a visible change in overall community oral health could reasonably be expected. In essence, there is a huge backload of unmet need. Second, there are other strong prevailing behavioral factors—such as diet and use of tobacco and alcohol—that influence oral health, and the therapist was likely to have little immediate control over these confounding factors. Third, the DHAT program is a young program; the longest-serving therapist at the time this program evaluation was initiated had been working for 3 years, and others had been on the job for only 1 year. Therefore, it would be premature to attempt to evaluate the DHAT experience on the basis of oral health outcomes at this time.
Rather, we felt it was appropriate to focus on evaluating program implementation, with particular attention to fidelity to program intent and any creation of unintended consequences, while concentrating on the two overriding topics of interest to the sponsoring foundations: provision of care and perceived changes in access to care. Moreover, the National Advisory Committee, in recognition that any long-term evaluation of the DHAT program will need a carefully designed and executed baseline assessment, recommended that this evaluation provide such a rigorous and foundational perspective for future use.
We learned from an April 2008 site visit to Alaska that each tribal health organization has some latitude in how a particular therapist is integrated into the existing dental health services system, depending upon local needs, resources, practices, and program philosophy. We further appreciated the tremendous diversity—in geography, number of villages, modes of transportation, and weather—that comprises the various regions of Alaska and that influences how a therapist is utilized. In essence, although each therapist has had similar training in a New
6 Regional clinics are typically located in larger communities (e.g., Bethel, Kotzebue) where the tribal health
organization’s hospital is located and where the DHAT’s supervisory dentist works.

2-8
Zealand-based program, each of the five tribal health organizations represents slightly different approaches to similar oral health needs. This variability, rather than posing a challenge, provides fertile ground, from the perspective of a program evaluation, for identifying best practices, as well as elucidating common barriers to implementation. For this reason, in our revised evaluation design, we planned to evaluate the DHAT component in one village in each of the five tribal programs where therapists are currently employed.
3-1
SECTION 3 METHODS
3.1 Composition of Project Study Team
Project team members included experts in clinical and research dentistry, medicine, epidemiology, health services research, biostatistics, community psychology, and program evaluation.
Two advisory committees provided input on study design and were periodically updated on study progress. The ATCC comprised representatives from the participating tribal health organizations, including medical and dental directors, community health service directors, and village elders. The National Advisory Committee included representatives of key stakeholder organizations such as ADA, the U.S. Public Health Service, and the National Congress of American Indians, as well as recognized experts in dental health services. Membership rosters for each committee are in Appendix B.
3.2 Patient Surveys of Satisfaction and Oral Health–Related Quality of Life
Participants (or their adult proxies) who agreed to participate in the oral health survey were first provided with a self-administered questionnaire to assess patient satisfaction. The instrument was adapted from the Agency for Healthcare Research and Quality’s (AHRQ’s) Consumer Assessment of Healthcare Providers and Systems (CAHPS) Dental Plan Survey (AHRQ, 2007) and was chosen to minimize the ceiling effect (in reporting levels of satisfaction) while eliciting dental patients’ actual experiences.7 Separate but parallel questionnaires were provided to those who were 18 years of age or older and those who ages 6 to 17. These age groups were chosen for administration of the instruments, as well as analysis of their results, on the basis of prior use of these age groups in instrument development and validation. The instrument asks about experiences with the therapist, with the experience of receiving care, and an overall rating for the “dental care system,” which includes all of the arrangements for receiving care at the site. Data collection forms are in Appendix C.
We administered two oral quality-of-life questionnaires to participants to assess their oral health–related quality of life (OHRQoL). For 110 adult respondents, we used the OHIP-14 instrument (Slade, 1997), an abbreviated version of the full Oral Health Impact Profile instrument. The purpose of the Oral Health Impact Profile is to provide a measure of the social impact of dental disease. The index provides a comprehensive measure of self-reported
7 The ceiling effect is the tendency for survey respondents to report high or highest responses to specific questions.
3-2
dysfunction, discomfort, and disability arising from oral conditions. Each of the several domains assesses various types of problems experienced. These instruments are included in Appendix D. Consistent with previous investigations (Slade et al., 2005), three OHRQoL estimates were derived from subjects’ responses: severity (cumulative OHIP-14 score), prevalence (proportion of items reported fairly/very often), and extent (number of items reported fairly/very often) of impacts were calculated as measures of OHRQoL.
For children ages 6 to 17, we used the Parents Perceptions Questionnaire, which was completed by 286 caregivers of children (Locker et al., 2002). Similar analytical approaches were used to determine Parental Perceptions Questionnaire (PPQ) estimates: severity (cumulative PPQ score), prevalence (proportion of items reported fairly/very often), and extent (number of items reported often/every day) of impacts were calculated as measures of OHRQoL.
We planned to use the Early Child Oral Health Impact Scale (ECOHIS) quality-of-life measure for children under 6 years old (Pahel, Rozier, & Slade, 2007), but there were only three participants in this age group; because of limited numbers, these data are not reported.
At four of the five sites, surveys were administered just prior to the oral health survey, typically in the waiting area of the clinic, and project staff were available to answer questions or clarify issues that arose. At one site, the questionnaires were distributed with consent forms by the school system to students.
3.3 Oral Health Surveys
Oral health surveys were conducted at each of the five sites. The survey methods were adapted from the World Health Organization (WHO, 1997). As noted earlier, the purpose of performing these oral health surveys was to provide an explicit, quantitative measure of the community context in which the therapists and other dental providers were operating and to provide a robust baseline assessment for future longitudinal studies. A basic dentition status examination and a community periodontal index (CPI) examination, an estimate of periodontal status, were performed. Appendix E presents both the detailed instructions for performing the examinations and the data collection form.
The intention was to examine 100 randomly selected individuals at each site: one-third adults (20 years or older), and two-thirds children (6–19 years), with priority given to younger children to facilitate comparisons with available regional and state data. Due to difficulties in scheduling examinations, the final samples were largely convenience samples; primarily because of time constraints associated with scheduling the site visits, we were unable to obtain lists of
3-3
eligible beneficiaries from the local village tribal authorities. In three of the sites where we had local project staff assisting us, we obtained from school administrative staff lists of children who were currently enrolled in the respective local school. These lists were used to draw a systematic sample of 66 school children per site. In these three sites, the adults who volunteered to participate had heard of the study by word of mouth. In the other two sites, both adults and children learned of the study by word of mouth. In these last two sites, the villages were small and self-contained, so we assume that virtually everyone in the community had heard that we were conducting the study.
Overall, across all five sites, there were between 61 and 106 individuals examined, including three 5-year-old children. Adults comprised 21% of examined subjects overall, ranging from 5% to 54% across sites.
The examinations were conducted by two examiners for Site A and by one of these examiners for Sites B–E. Examiners participated in a 3.5-day training session for all data collection procedures, of which approximately 2 days were devoted to the oral health survey. Following calibration with an experienced examiner, inter-examiner reliability across 10 subjects for cavitated caries vs. non-caries calls was 94%. Intra-examiner reliability was not assessed.
The reported outcome measures calculated from these surveys include (1) the percentage of subjects with untreated decay, (2) coronal DMF (decayed/missing/filled) score and components, (3) root DF (decayed/filled) score and components, and (4) for children ages 6 to 10, df score and components. These measures are reported for subjects in three age groups: dentate adults (20 year or older), adolescents (ages 11 to 19), and children (ages 6 to 10). These age groups were used for analysis to reflect the customary ages in assessing comparability with other studies of oral health, particularly those involving younger persons who may have a mix of primary and permanent teeth. In addition, the percentage of children ages 9 and 10 (estimated to be in third grade) with any caries experience (DMF/df > 0), untreated caries (D/d + DF/df > 0), or with any sealed teeth is compared to similar data for Alaska’s American Indian/Alaska Native population (Alaska Department of Health and Social Services Oral Health Program, 2007). Finally, from the CPI data, the distribution of highest (worst) CPI score from among the six sextant scores, was calculated for adults.
3.4 Clinical Technical Performance
Examiners recorded evaluations reflecting clinical technical performance during the oral health surveys and during periods of observation at the site’s dental clinic. Some of these evaluations are considered by many to measure the “quality of care” that has been provided,
3-4
although that interpretation equates quality of care with technical excellence while ignoring the more important consideration of patient outcomes. Also, no norms for comparison of technical performance using these evaluation measures are available. The following evaluations were conducted:
Sealant Placement: Evaluation of sealants required observation of four process steps: isolation, drying, surface preparation, and polymerization. The completed sealant was then evaluated clinically for retention and occlusion. Criteria, which are described on the recording form (Appendix F), were adapted from those employed in the Department of Pediatric Dentistry, University of North Carolina School of Dentistry. Due to differences in clinical activities during site visits, sealant placement procedures were available for evaluation at only three sites. Sealant materials were not assessed.
Composite and Amalgam Preparation and Restoration Evaluation: Composite and amalgam preparations and subsequent restorations were evaluated in each site’s dental clinic during the course of the clinic. These procedures were performed by therapists, and this was known by the evaluator. In addition, composite and amalgam restorations were evaluated during the oral health surveys. All evaluations of restorations during the oral health survey were blind (i.e., evaluated without the evaluator having knowledge of whether a therapist or other provider did the restoration). For one composite restoration at one site, the identity of the provider could not be determined. For purposes of this report, the evaluations of the restorations performed in the clinics and those presented during the oral health surveys have been combined. The evaluation criteria for preparations and restorations are listed on the data recording forms (Appendix G for composite, Appendix H for amalgam), and were adapted from those established by the Council of Interstate Testing Agencies (CITA) for their licensing examination (Council on Interstate Testing Agencies, 2010). Evaluators were trained through co-examination and discussion with experienced instructors from the Department of Operative Dentistry, University of North Carolina School of Dentistry. Inter-examiner reliability for acceptability of individual criteria across eight restorations was 93%. Intra-examiner reliability was not assessed.
Stainless Steel Crown Preparation and Restoration Evaluation: Similar to composite and amalgam procedures, preparations were to be observed in the course of clinical activities at the site, and restorations were evaluated both in the clinic and during the oral health examinations, where the evaluator was blind to the type of provider. Criteria were adapted from those employed by the Department of Pediatric Dentistry, University of North Carolina School of Dentistry, and are listed on the data collection forms (Appendix I). Training consisted of discussion and co-examination of previously placed crowns.
3-5
Counseling Interventions: The project protocol specified evaluation of two types of counseling interventions: oral hygiene instruction and tobacco cessation. However, it was possible to evaluate only oral hygiene instruction because tobacco cessation counseling was not performed by therapists at the visited sites. The evaluation focused on process, and recorded the use of seven behaviors: five deemed as positive, and two as negative. The behaviors are described on the oral hygiene instructions data collection form (Appendix J).
3.5 Performance Measures
Chart audits and facility evaluations were performed to collect information for several types of outcome measures. For all audits and observations, two auditors collected data at Site A, and one of these auditors collected data at Sites B–E. The auditors were the same individuals who performed the oral health status examinations. Audit data reflect all care provided to each audited patient by all providers at the site. This approach was adopted so that the complete care rendered to the patient was the basis of evaluation, rather than the possibly fragmented care provided by individual members of the care team. In most instances, the providers operating at a site during the period covered by the audit consisted of a single therapist. It should be noted that the only comparative data available for the effectiveness of care and use of services measures were reported in the papers describing the development of these measures (Bader et al., 1999a & 1999b). Comparative data are not available for other performance measures (Bader, 2009).
To collect data for calculating six sets of performance measures, it was planned to audit 100 records at each site, with approximately two-thirds being records of children. Due to time constraints and logistical problems, the actual number of audited records ranged from 66 to 77 at each site. A large number of charts needed to be reviewed in order to identify eligible charts for inclusion. Inclusion criteria for the assessment of performance measures required at least one visit in the preceding year (i.e., the 365 days preceding date of assessment) and at least one visit in the prior year. In three sites we tracked the number of records screened to identify eligible ones, with the percentage eligible ranging from 16.2% in one site, (71 of 437 screened) to 21.4% in a second site (111 of 495) to 35.0% in a third site (68 of 194). All of the performance measures reflect the clinic’s performance in the year or two years preceding the record audits.
Children’s records comprised between 51% and 73% of all records audited at each site. Procedures for identifying the records for audit and for data collection appear in Appendix K, along with the record audit data collection form. The six types of performance measures calculated from record audit data are:
3-6
1. Effectiveness of care measures: Seven effectiveness of care measures were calculated. These measures report the “success” of the site in assessing risk in the patient population, in providing preventive treatment for those deemed to be at risk, and in preventing new caries and minimizing extractions. These measures represent a subset of a slightly larger set of effectiveness of care measures that have been tested and validated in several clinical environments (Bader et al., 1999a; Bader et al., 1999b) These measures are calculated separately for children (ages 6 to 17) and adults (age 18 or older). The calculation of these measures is described in Appendix K. The measures reflect performance in the year preceding the audit.
2. Use of services measures: Two measures that report use of services in the preceding year were calculated: the percentage of patients receiving at least one prophylaxis (defined by CDT-4 procedure code 1120 and 1110: Coronal scaling and/or polishing to remove coronal plaque, calculus, and stains) and the ratio of preventive procedures to intracoronal restorations. These measures represent a subset of a larger set developed and tested as described above (Bader et al., 1999a; Bader et al., 1999b). The calculation of these measures is described in Appendix K.
3. Complication rates: The proportions of extraction procedures and restorative procedures accomplished in the preceding year where post-procedure complications arose were calculated. The exact criteria for identifying the occurrence of a post-procedure complication are described in Appendix K.
4. Provision of examinations and preventive procedures: The mean annual numbers of examinations, prophylaxes, and fluoride treatments per patient, and the percentages of patients receiving oral hygiene instruction and oral cancer exams were calculated separately for children (ages 6 to 17) and adults (age 18 or older). These rates were calculated to reflect the intensity of basic examination and prevention procedures across all patients.
5. Gingival bleeding assessment: The relative proportion of patients for whom a notation was made in the chart regarding the presence or absence of gingival bleeding was calculated as an additional outcome measure with which to portray attention to periodontal health.
6. Consultation with supervising dentist: The proportion of a therapist’s patients for whom one or more consultations were sought during the course of treatment was calculated.
3.6 Record-Based Process Evaluations
The record-based process review employed and chart audit assessment based on an Office Assessment Instrument (OAI) developed by MetLife, Inc. for use as a practice improvement tool in its “preferred provider program.” In turn, the OAI was based on the work of Morris, Bentley, and Vito (1987), which used expert opinion to develop important indicators of quality for assessing dental practices; however, there are no published reports on how practices
3-7
of licensed dentists comply with these measures. There are also no studies evaluating the association of these measures with independent quality of care or patient outcome assessments.
The process review evaluated treatment-related processes based on information available in patient records. All of the sampled records were of patients who had been treated by the therapist, but other providers may also have provided dental care and contributed to the patient’s record during the time interval under study. This review included evaluation of the organization and completeness of the record, the presence and appropriateness of the treatment plan, and the most current bite wing radiographs. Examiners received didactic training on the use of the process review instrument. Didactic training was supplemented by a hands-on review of 8 patient records at each public health clinic. From a total of 200 record audit ratings (25 items in 8 patient records), one examiner completely agreed with the trainer evaluator, and the other examiner disagreed on two ratings (1%).
Eight patient records at each site were evaluated. At Site A, both examiners participated in the process review. At Sites B–E, one of the examiners completed these evaluations. Missing data for some items in the process review resulted from the inadvertent inclusion of children’s dental records in the review sample at four sites. At one site, no patient ages were recorded. Because the process review was designed for use with patients 18 years or age and older, four items were excluded from the analysis.
3.7 Clinic Facilities, Policies, Personnel, and Procedures Evaluations
Aspects of the clinics were evaluated using a set of attributes and criteria based in part on the work of Morris et al. (1987). The purpose of collecting this information was to assist ANTHC in quality improvement activities and to gain a baseline of information. As noted earlier, this is a system-level assessment of the environment in which the therapists and other providers are operating. Such observations are informative but not fully attributable to a single individual provider because multiple individuals provide dental care to residents at each evaluation site.
The clinic evaluation consisted of 91 items assessing quality criteria, which were organized into 8 dimensions: facilities (8 items), equipment (10 items), personnel numbers and training (6 items), written descriptions of administrative systems for patient care (9 items), personnel and Occupational Safety and Health Administration (OSHA)-related elements of infection control (10 items), materials for patients (4 items), practice management (5 items), and sterilization and infection control (39 items). Each item received a satisfactory or unsatisfactory rating. The evaluation instrument used to collect data in the clinics is shown in Appendix L.
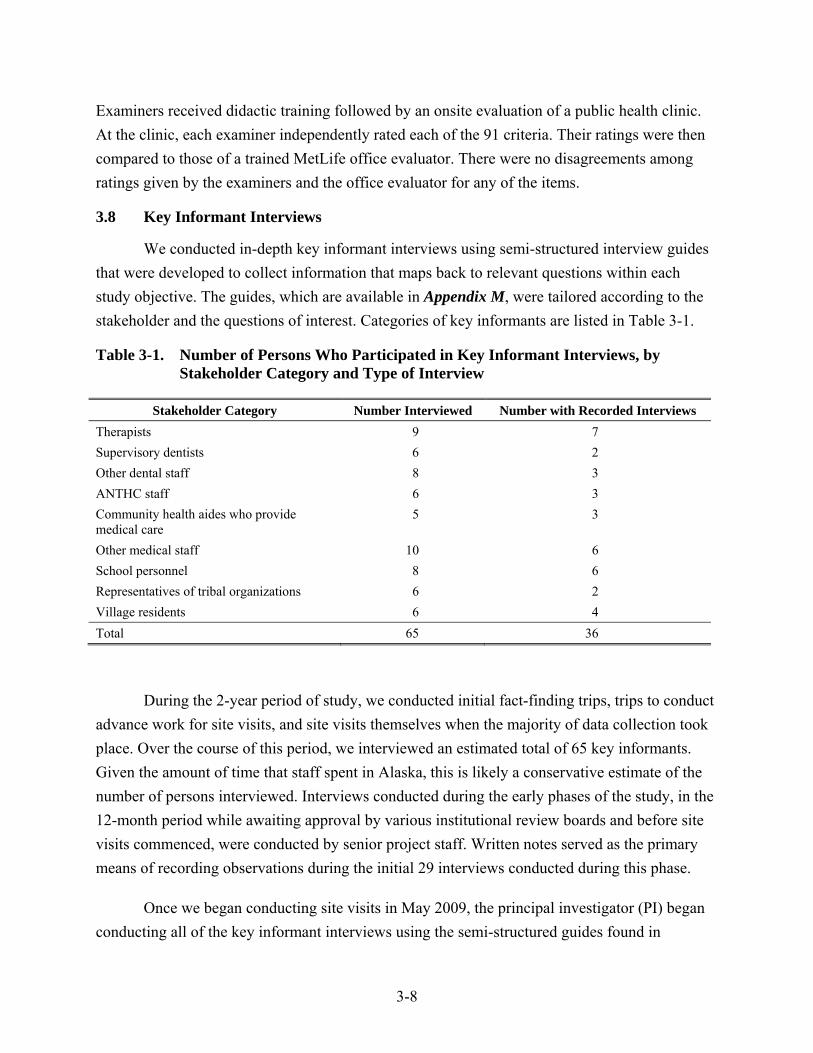
3-8
Examiners received didactic training followed by an onsite evaluation of a public health clinic. At the clinic, each examiner independently rated each of the 91 criteria. Their ratings were then compared to those of a trained MetLife office evaluator. There were no disagreements among ratings given by the examiners and the office evaluator for any of the items.
3.8 Key Informant Interviews
We conducted in-depth key informant interviews using semi-structured interview guides that were developed to collect information that maps back to relevant questions within each study objective. The guides, which are available in Appendix M, were tailored according to the stakeholder and the questions of interest. Categories of key informants are listed in Table 3-1.
Table 3-1. Number of Persons Who Participated in Key Informant Interviews, by Stakeholder Category and Type of Interview
Stakeholder Category Number Interviewed Number with Recorded Interviews Therapists 9 7 Supervisory dentists 6 2 Other dental staff 8 3 ANTHC staff 6 3 Community health aides who provide medical care
5 3
Other medical staff 10 6 School personnel 8 6 Representatives of tribal organizations 6 2 Village residents 6 4 Total 65 36
During the 2-year period of study, we conducted initial fact-finding trips, trips to conduct advance work for site visits, and site visits themselves when the majority of data collection took place. Over the course of this period, we interviewed an estimated total of 65 key informants. Given the amount of time that staff spent in Alaska, this is likely a conservative estimate of the number of persons interviewed. Interviews conducted during the early phases of the study, in the 12-month period while awaiting approval by various institutional review boards and before site visits commenced, were conducted by senior project staff. Written notes served as the primary means of recording observations during the initial 29 interviews conducted during this phase.
Once we began conducting site visits in May 2009, the principal investigator (PI) began conducting all of the key informant interviews using the semi-structured guides found in

3-9
Appendix M. For 36 of these interviews that were recorded, the respondent provided prior verbal consent, including consent to have the interviews recorded. Assurances were provided that no individual attribution would occur. Interviews ranged in length from approximately 10 minutes to over 3 hours. Interviews of the therapists and their supervisory dentists tended to be longer and usually lasted 30 to 60 minutes. Recorded interviews were transcribed using a professional transcription service that had signed a non-disclosure agreement with RTI.
To obtain interview data, the project team conducted multiple visits to Alaska. The PI conducted nine visits to Alaska, with each visit ranging from 1 to 2 weeks. This was supplemented by multiple telephone interviews. Other project staff, including those involved in village site visits for quantitative data collection, contributed an additional 13 person-visits, with each visit ranging from 1 to 2 weeks in duration. We were successful in interviewing 9 of the 11 New Zealand–trained therapists who became certified and practiced, as well as all of their current and former supervisory dentists.
The protocol covered several domains, including the perspectives of the sponsoring tribal health organization, the experiences of individual therapists, and the community context in which the therapist was operating. Inferences from these domains, and from quantitative data derived from other project components, were used to inform our sense of DHAT program benefits, adverse impacts, program challenges, and areas for improvement. Transcribed data were analyzed by two experienced researchers using NVivo version 8.0 software.
3.9 Alaska Site Selection
We evaluated a therapist placement in each of the five tribal organizations where the New Zealand-trained therapists were currently deployed. We worked closely with ANTHC, tribal health organizations, and specific tribal councils to identify and recruit suitable villages. In selecting therapists for their inclusion in this evaluation, we proposed that each therapist have at least 2 years of experience in order to assess a more mature point in the program. This requirement was met.
The actual selection of villages was a collaborative process with the tribal organizations and project consultants, one that permitted identification of a range of practice characteristics under which each therapist was operating. This diversity, as reflected in Table 3-2, served to provide insights that could be explored in our case study methodology. As noted earlier, our intention was not to compare villages on the basis of some metric of oral health; rather, we wished to take advantage of the natural variability in practice circumstances to assess issues related to DHAT program implementation under a variety of circumstances.
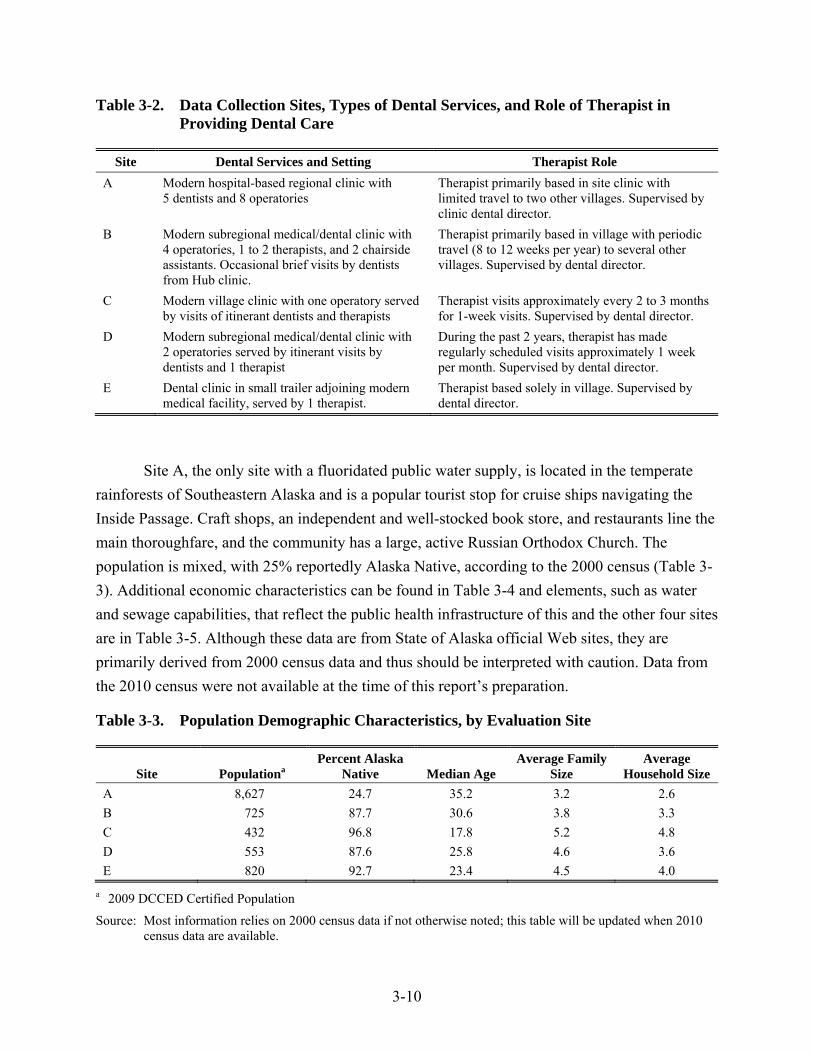
3-10
Table 3-2. Data Collection Sites, Types of Dental Services, and Role of Therapist in Providing Dental Care
Site Dental Services and Setting Therapist Role A Modern hospital-based regional clinic with
5 dentists and 8 operatories Therapist primarily based in site clinic with limited travel to two other villages. Supervised by clinic dental director.
B Modern subregional medical/dental clinic with 4 operatories, 1 to 2 therapists, and 2 chairside assistants. Occasional brief visits by dentists from Hub clinic.
Therapist primarily based in village with periodic travel (8 to 12 weeks per year) to several other villages. Supervised by dental director.
C Modern village clinic with one operatory served by visits of itinerant dentists and therapists
Therapist visits approximately every 2 to 3 months for 1-week visits. Supervised by dental director.
D Modern subregional medical/dental clinic with 2 operatories served by itinerant visits by dentists and 1 therapist
During the past 2 years, therapist has made regularly scheduled visits approximately 1 week per month. Supervised by dental director.
E Dental clinic in small trailer adjoining modern medical facility, served by 1 therapist.
Therapist based solely in village. Supervised by dental director.
Site A, the only site with a fluoridated public water supply, is located in the temperate rainforests of Southeastern Alaska and is a popular tourist stop for cruise ships navigating the Inside Passage. Craft shops, an independent and well-stocked book store, and restaurants line the main thoroughfare, and the community has a large, active Russian Orthodox Church. The population is mixed, with 25% reportedly Alaska Native, according to the 2000 census (Table 3-3). Additional economic characteristics can be found in Table 3-4 and elements, such as water and sewage capabilities, that reflect the public health infrastructure of this and the other four sites are in Table 3-5. Although these data are from State of Alaska official Web sites, they are primarily derived from 2000 census data and thus should be interpreted with caution. Data from the 2010 census were not available at the time of this report’s preparation.
Table 3-3. Population Demographic Characteristics, by Evaluation Site
Site Populationa Percent Alaska
Native Median Age Average Family
Size Average
Household Size A 8,627 24.7 35.2 3.2 2.6 B 725 87.7 30.6 3.8 3.3 C 432 96.8 17.8 5.2 4.8 D 553 87.6 25.8 4.6 3.6 E 820 92.7 23.4 4.5 4.0
a 2009 DCCED Certified Population
Source: Most information relies on 2000 census data if not otherwise noted; this table will be updated when 2010 census data are available.
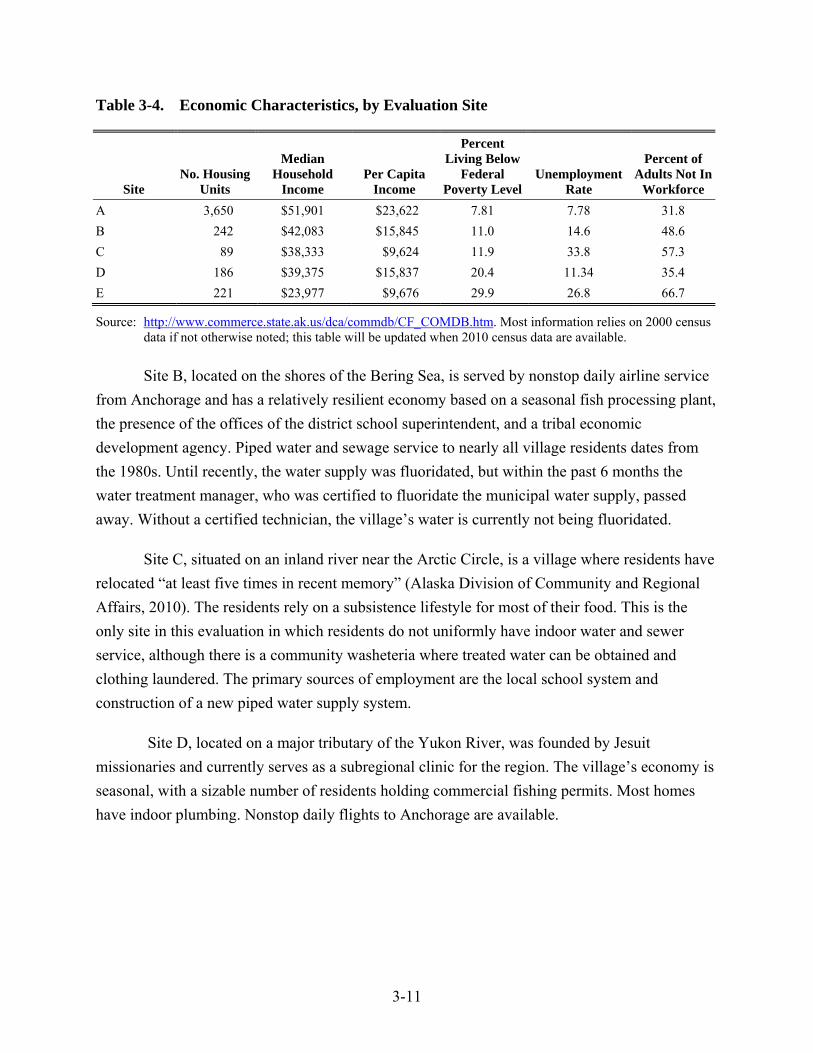
3-11
Table 3-4. Economic Characteristics, by Evaluation Site
Site No. Housing
Units
Median Household
Income Per Capita
Income
Percent Living Below
Federal Poverty Level
Unemployment Rate
Percent of Adults Not In
Workforce A 3,650 $51,901 $23,622 7.81 7.78 31.8 B 242 $42,083 $15,845 11.0 14.6 48.6 C 89 $38,333 $9,624 11.9 33.8 57.3 D 186 $39,375 $15,837 20.4 11.34 35.4 E 221 $23,977 $9,676 29.9 26.8 66.7
Source: http://www.commerce.state.ak.us/dca/commdb/CF_COMDB.htm. Most information relies on 2000 census data if not otherwise noted; this table will be updated when 2010 census data are available.
Site B, located on the shores of the Bering Sea, is served by nonstop daily airline service from Anchorage and has a relatively resilient economy based on a seasonal fish processing plant, the presence of the offices of the district school superintendent, and a tribal economic development agency. Piped water and sewage service to nearly all village residents dates from the 1980s. Until recently, the water supply was fluoridated, but within the past 6 months the water treatment manager, who was certified to fluoridate the municipal water supply, passed away. Without a certified technician, the village’s water is currently not being fluoridated.
Site C, situated on an inland river near the Arctic Circle, is a village where residents have relocated “at least five times in recent memory” (Alaska Division of Community and Regional Affairs, 2010). The residents rely on a subsistence lifestyle for most of their food. This is the only site in this evaluation in which residents do not uniformly have indoor water and sewer service, although there is a community washeteria where treated water can be obtained and clothing laundered. The primary sources of employment are the local school system and construction of a new piped water supply system.
Site D, located on a major tributary of the Yukon River, was founded by Jesuit missionaries and currently serves as a subregional clinic for the region. The village’s economy is seasonal, with a sizable number of residents holding commercial fishing permits. Most homes have indoor plumbing. Nonstop daily flights to Anchorage are available.
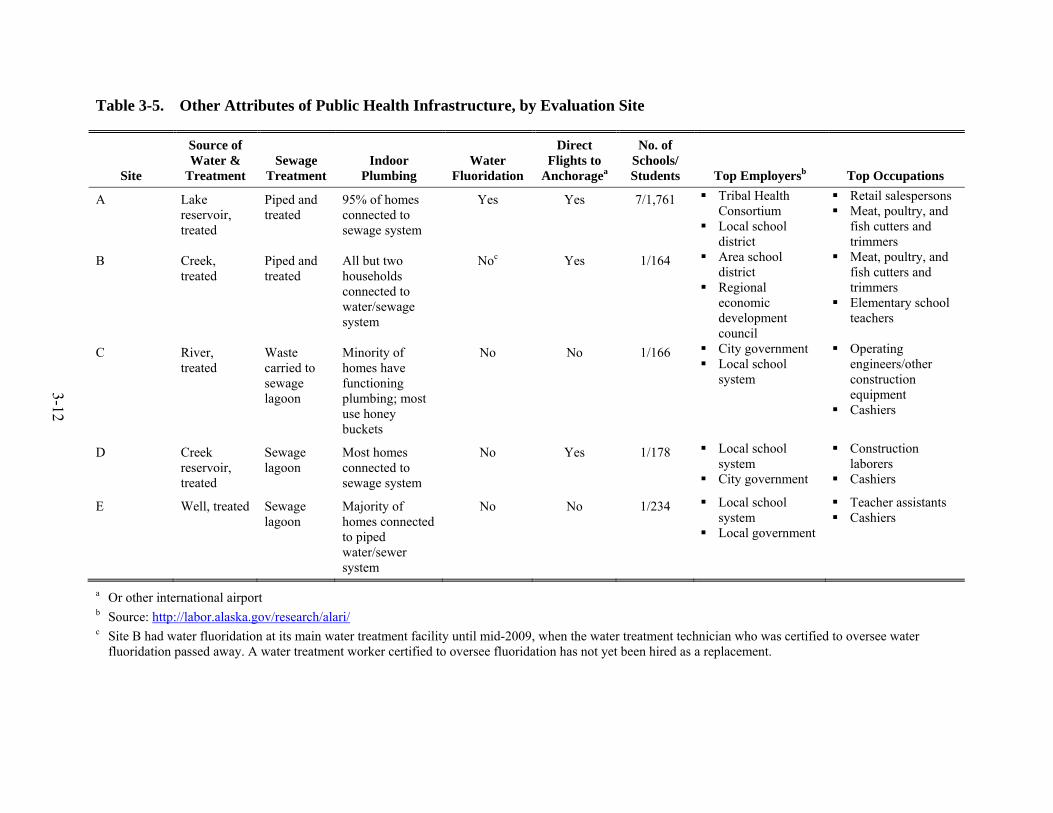
3-12
Table 3-5. Other Attributes of Public Health Infrastructure, by Evaluation Site
Site
Source of Water &
Treatment Sewage
Treatment Indoor
Plumbing Water
Fluoridation
Direct Flights to
Anchoragea
No. of Schools/ Students Top Employersb Top Occupations
A Lake reservoir, treated
Piped and treated
95% of homes connected to sewage system
Yes Yes 7/1,761 Tribal Health Consortium
Local school district
Retail salespersons Meat, poultry, and
fish cutters and trimmers
B Creek, treated
Piped and treated
All but two households connected to water/sewage system
Noc Yes 1/164 Area school district
Regional economic development council
Meat, poultry, and fish cutters and trimmers
Elementary school teachers
C River, treated
Waste carried to sewage lagoon
Minority of homes have functioning plumbing; most use honey buckets
No No 1/166 City government Local school
system
Operating engineers/other construction equipment
Cashiers
D Creek reservoir, treated
Sewage lagoon
Most homes connected to sewage system
No Yes 1/178 Local school system
City government
Construction laborers
Cashiers
E Well, treated Sewage lagoon
Majority of homes connected to piped water/sewer system
No No 1/234 Local school system
Local government
Teacher assistants Cashiers
a Or other international airport b Source: http://labor.alaska.gov/research/alari/ c Site B had water fluoridation at its main water treatment facility until mid-2009, when the water treatment technician who was certified to oversee water
fluoridation passed away. A water treatment worker certified to oversee fluoridation has not yet been hired as a replacement.

3-13
Site E is a small coastal village in Southwestern Alaska that has two fish processing plants, an active church community, and a large, newly constructed school where a dozen village elders arrive by bus each day to have lunch with the students. Nearly all homes are connected to the community water and sewer system or have individual wells and septic systems. Air travel to Anchorage is via small commercial plane with a transfer required at the regional Hub city.
3.10 Site Visit Methodology
Prior to each site visit, the PI conducted an advance visit to meet with all available stakeholders, including tribal and school representatives, elected officials, local medical staff, and other key members of the community, such as local store owners. Where available, we hired a local village resident to assist in site advance work, serve as liaison with the school system, and provide support for other logistical issues, including location of the community dental surveys.
Team composition included one or two experienced dental examiners, an experienced chairside assistant, a medical epidemiologist, a research assistant, and the locally hired staff member.
We planned for site visits to take 5 to 7 days, excluding travel, which was either by commercial airline or charter service. Site visits were conducted in May 2009 (Site A), October 2009 (Sites B and C), and February 2010 (Sites D and E).
3.11 Protection of Human Subjects
The Institutional Review Board (IRB) of RTI International reviewed and approved the study protocol, including all data collection instruments and consent/assent forms.8 The Alaska Area IRB also approved the protocol and instruments, as did each of the five participating tribal health organizations. Prior to each site visit for data collection, we contacted and met with representatives of the local tribal organizations to apprise them of the study and obtain their approval.
Before initiating any component of data collection from individual participants, written informed consent was obtained. For minors (ages 6 to 17), written informed assent was also obtained. We provided each study participant with a $20 U.S. Postal Money Order as a nominal stipend. To review dental records for assessing practice effectiveness of care and adequacy of record keeping, we were granted a HIPAA limited waiver.
8 RTI holds a Federalwide Assurance (FWA #3331) granted by the DHHS Office for Human Research Protections
(OHRP).

3-14
3.12 Data Analysis
Quantitative data from surveys, oral examinations, review of dental records, and observation of practice procedures were entered into a Microsoft Access database. Data were analyzed using SAS version 9.1. Data from interviews that had been transcribed were entered into NVivo 8 software and coded and analyzed by two examiners experienced in qualitative data analysis.
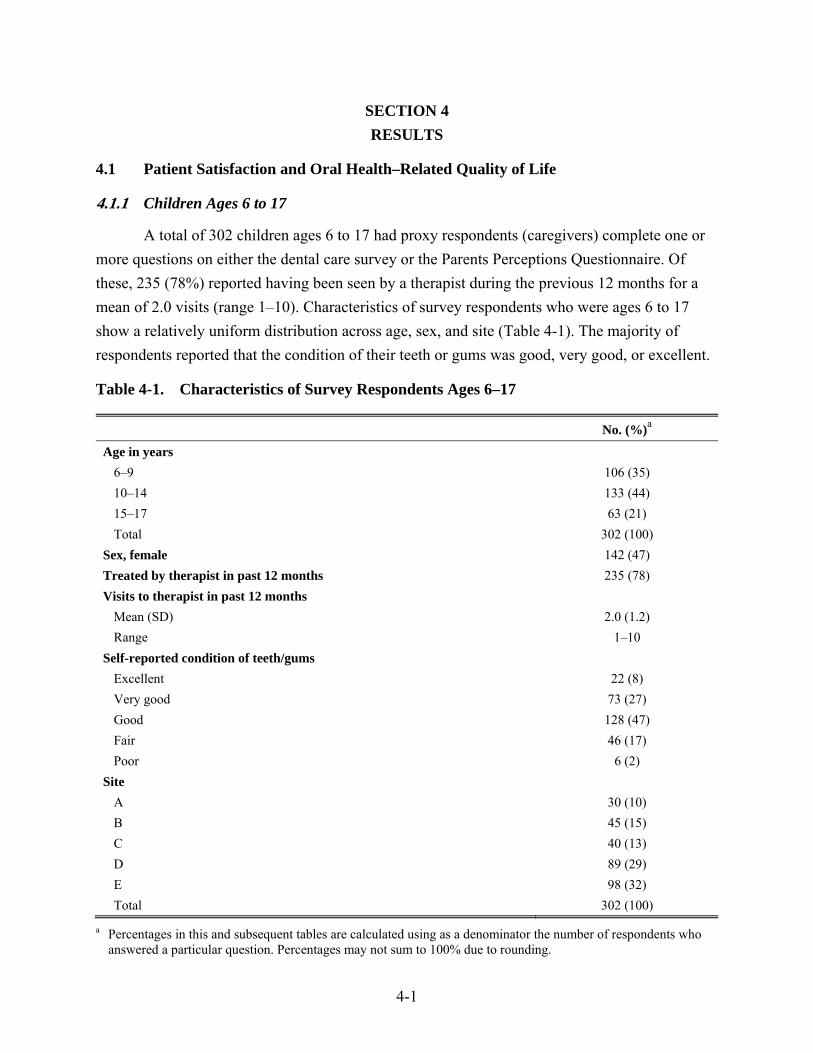
4-1
SECTION 4 RESULTS
4.1 Patient Satisfaction and Oral Health–Related Quality of Life
4.1.1 Children Ages 6 to 17
A total of 302 children ages 6 to 17 had proxy respondents (caregivers) complete one or more questions on either the dental care survey or the Parents Perceptions Questionnaire. Of these, 235 (78%) reported having been seen by a therapist during the previous 12 months for a mean of 2.0 visits (range 1–10). Characteristics of survey respondents who were ages 6 to 17 show a relatively uniform distribution across age, sex, and site (Table 4-1). The majority of respondents reported that the condition of their teeth or gums was good, very good, or excellent.
Table 4-1. Characteristics of Survey Respondents Ages 6–17
No. (%)a
Age in years 6–9 106 (35) 10–14 133 (44) 15–17 63 (21) Total 302 (100)
Sex, female 142 (47) Treated by therapist in past 12 months 235 (78) Visits to therapist in past 12 months
Mean (SD) 2.0 (1.2) Range 1–10
Self-reported condition of teeth/gums Excellent 22 (8) Very good 73 (27) Good 128 (47) Fair 46 (17) Poor 6 (2)
Site A 30 (10) B 45 (15) C 40 (13) D 89 (29) E 98 (32) Total 302 (100)
a Percentages in this and subsequent tables are calculated using as a denominator the number of respondents who answered a particular question. Percentages may not sum to 100% due to rounding.
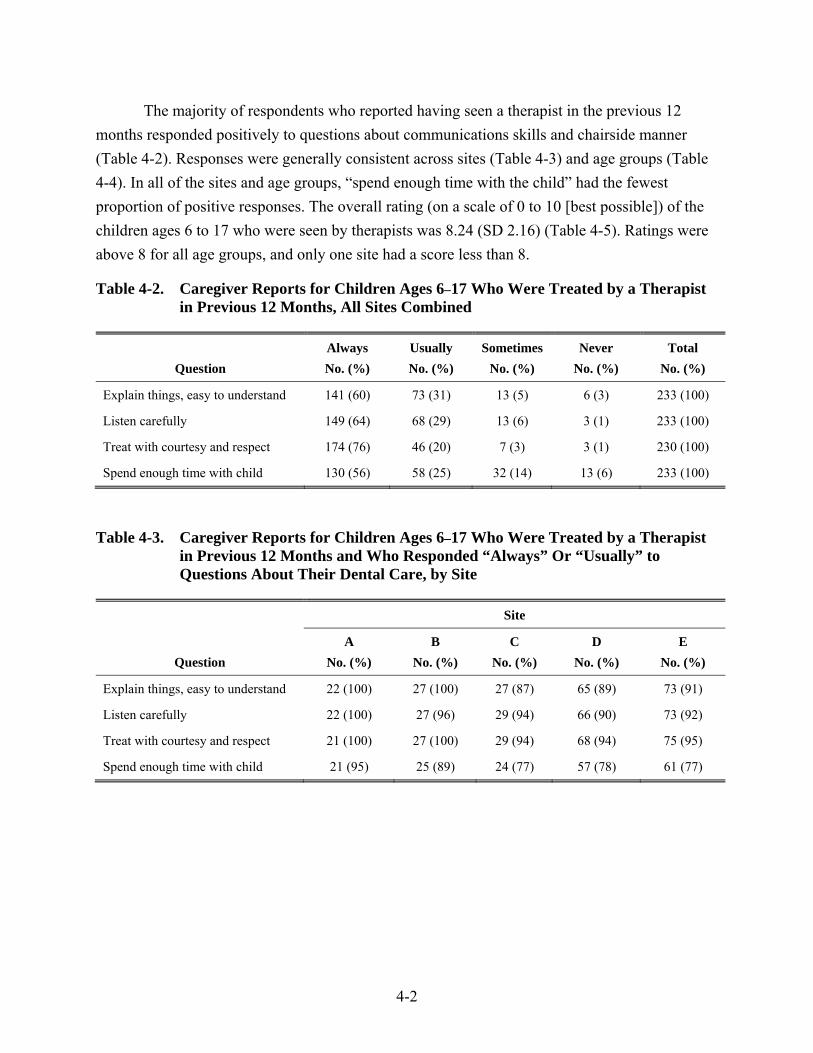
4-2
The majority of respondents who reported having seen a therapist in the previous 12 months responded positively to questions about communications skills and chairside manner (Table 4-2). Responses were generally consistent across sites (Table 4-3) and age groups (Table 4-4). In all of the sites and age groups, “spend enough time with the child” had the fewest proportion of positive responses. The overall rating (on a scale of 0 to 10 [best possible]) of the children ages 6 to 17 who were seen by therapists was 8.24 (SD 2.16) (Table 4-5). Ratings were above 8 for all age groups, and only one site had a score less than 8.
Table 4-2. Caregiver Reports for Children Ages 6–17 Who Were Treated by a Therapist in Previous 12 Months, All Sites Combined
Question Always Usually Sometimes Never Total No. (%) No. (%) No. (%) No. (%) No. (%)
Explain things, easy to understand 141 (60) 73 (31) 13 (5) 6 (3) 233 (100)
Listen carefully 149 (64) 68 (29) 13 (6) 3 (1) 233 (100)
Treat with courtesy and respect 174 (76) 46 (20) 7 (3) 3 (1) 230 (100)
Spend enough time with child 130 (56) 58 (25) 32 (14) 13 (6) 233 (100)
Table 4-3. Caregiver Reports for Children Ages 6–17 Who Were Treated by a Therapist in Previous 12 Months and Who Responded “Always” Or “Usually” to Questions About Their Dental Care, by Site
Question
Site
A B C D E No. (%) No. (%) No. (%) No. (%) No. (%)
Explain things, easy to understand 22 (100) 27 (100) 27 (87) 65 (89) 73 (91)
Listen carefully 22 (100) 27 (96) 29 (94) 66 (90) 73 (92)
Treat with courtesy and respect 21 (100) 27 (100) 29 (94) 68 (94) 75 (95)
Spend enough time with child 21 (95) 25 (89) 24 (77) 57 (78) 61 (77)
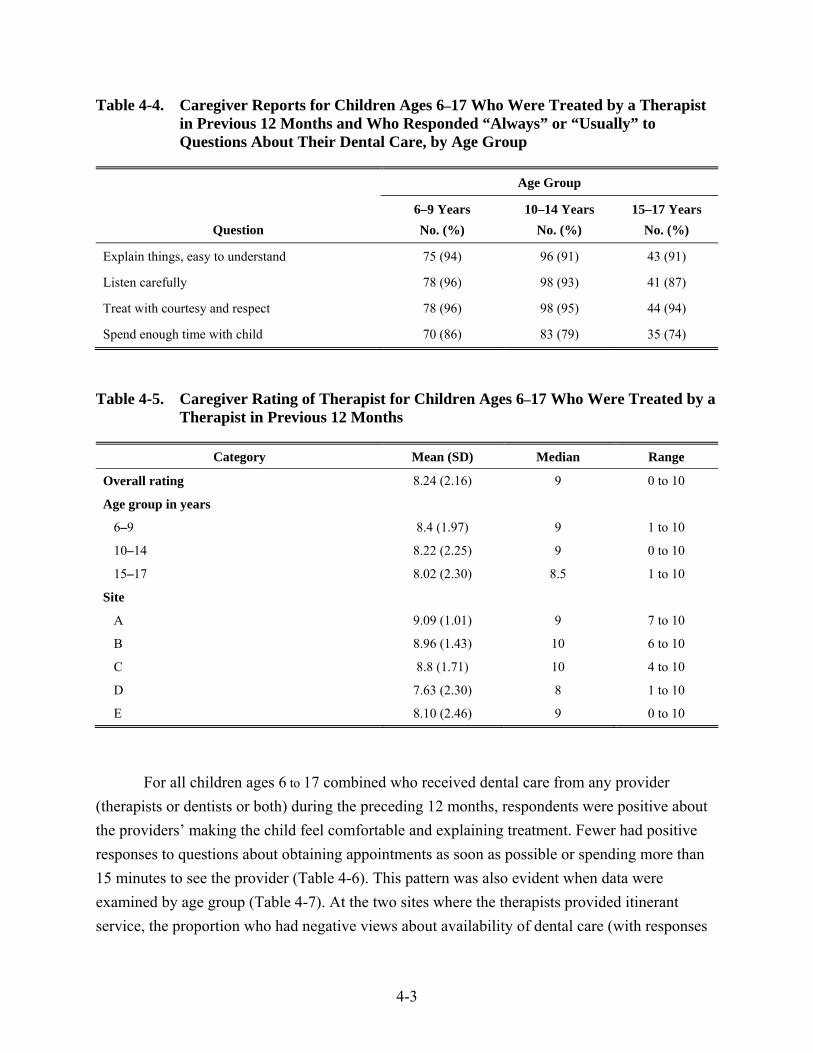
4-3
Table 4-4. Caregiver Reports for Children Ages 6–17 Who Were Treated by a Therapist in Previous 12 Months and Who Responded “Always” or “Usually” to Questions About Their Dental Care, by Age Group
Question
Age Group
6–9 Years 10–14 Years 15–17 Years No. (%) No. (%) No. (%)
Explain things, easy to understand 75 (94) 96 (91) 43 (91)
Listen carefully 78 (96) 98 (93) 41 (87)
Treat with courtesy and respect 78 (96) 98 (95) 44 (94)
Spend enough time with child 70 (86) 83 (79) 35 (74)
Table 4-5. Caregiver Rating of Therapist for Children Ages 6–17 Who Were Treated by a Therapist in Previous 12 Months
Category Mean (SD) Median Range
Overall rating 8.24 (2.16) 9 0 to 10
Age group in years
6–9 8.4 (1.97) 9 1 to 10
10–14 8.22 (2.25) 9 0 to 10
15–17 8.02 (2.30) 8.5 1 to 10
Site
A 9.09 (1.01) 9 7 to 10
B 8.96 (1.43) 10 6 to 10
C 8.8 (1.71) 10 4 to 10
D 7.63 (2.30) 8 1 to 10
E 8.10 (2.46) 9 0 to 10
For all children ages 6 to 17 combined who received dental care from any provider (therapists or dentists or both) during the preceding 12 months, respondents were positive about the providers’ making the child feel comfortable and explaining treatment. Fewer had positive responses to questions about obtaining appointments as soon as possible or spending more than 15 minutes to see the provider (Table 4-6). This pattern was also evident when data were examined by age group (Table 4-7). At the two sites where the therapists provided itinerant service, the proportion who had negative views about availability of dental care (with responses
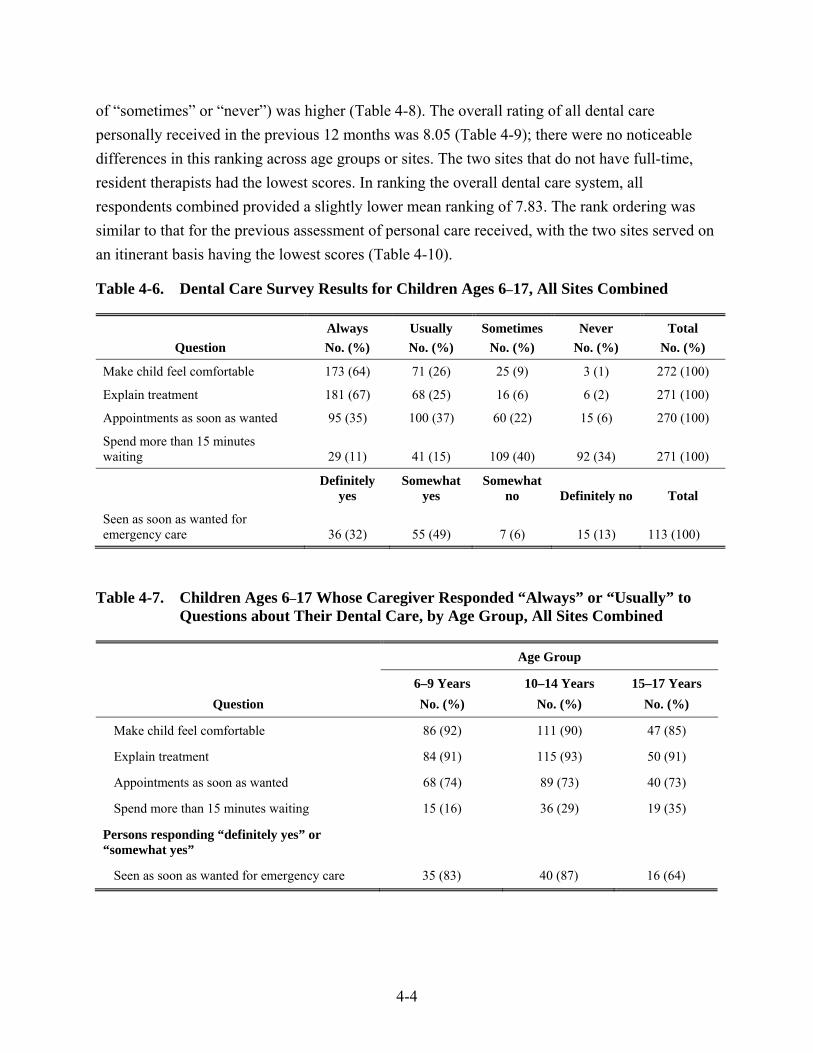
4-4
of “sometimes” or “never”) was higher (Table 4-8). The overall rating of all dental care personally received in the previous 12 months was 8.05 (Table 4-9); there were no noticeable differences in this ranking across age groups or sites. The two sites that do not have full-time, resident therapists had the lowest scores. In ranking the overall dental care system, all respondents combined provided a slightly lower mean ranking of 7.83. The rank ordering was similar to that for the previous assessment of personal care received, with the two sites served on an itinerant basis having the lowest scores (Table 4-10).
Table 4-6. Dental Care Survey Results for Children Ages 6–17, All Sites Combined
Question Always Usually Sometimes Never Total No. (%) No. (%) No. (%) No. (%) No. (%)
Make child feel comfortable 173 (64) 71 (26) 25 (9) 3 (1) 272 (100)
Explain treatment 181 (67) 68 (25) 16 (6) 6 (2) 271 (100)
Appointments as soon as wanted 95 (35) 100 (37) 60 (22) 15 (6) 270 (100)
Spend more than 15 minutes waiting 29 (11) 41 (15) 109 (40) 92 (34) 271 (100)
Definitely
yes Somewhat
yes Somewhat
no Definitely no Total
Seen as soon as wanted for emergency care 36 (32) 55 (49) 7 (6) 15 (13) 113 (100)
Table 4-7. Children Ages 6–17 Whose Caregiver Responded “Always” or “Usually” to Questions about Their Dental Care, by Age Group, All Sites Combined
Question
Age Group
6–9 Years 10–14 Years 15–17 Years No. (%) No. (%) No. (%)
Make child feel comfortable 86 (92) 111 (90) 47 (85)
Explain treatment 84 (91) 115 (93) 50 (91)
Appointments as soon as wanted 68 (74) 89 (73) 40 (73)
Spend more than 15 minutes waiting 15 (16) 36 (29) 19 (35)
Persons responding “definitely yes” or “somewhat yes”
Seen as soon as wanted for emergency care 35 (83) 40 (87) 16 (64)
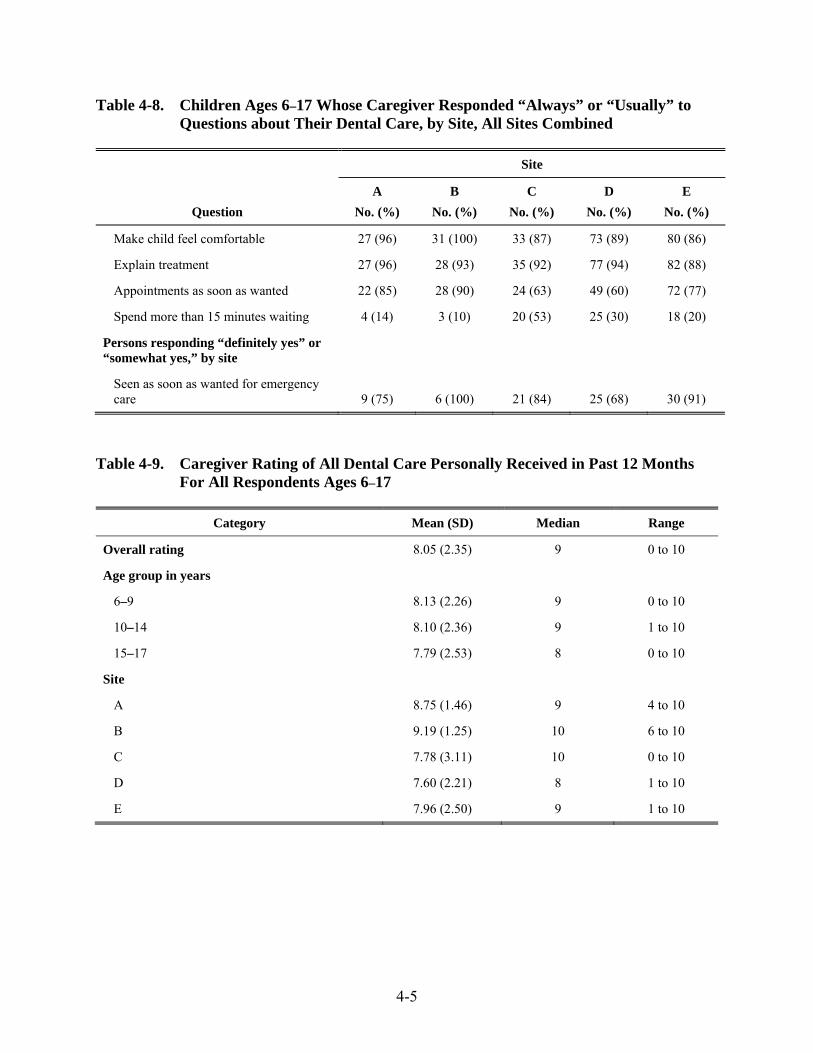
4-5
Table 4-8. Children Ages 6–17 Whose Caregiver Responded “Always” or “Usually” to Questions about Their Dental Care, by Site, All Sites Combined
Question
Site
A B C D E No. (%) No. (%) No. (%) No. (%) No. (%)
Make child feel comfortable 27 (96) 31 (100) 33 (87) 73 (89) 80 (86)
Explain treatment 27 (96) 28 (93) 35 (92) 77 (94) 82 (88)
Appointments as soon as wanted 22 (85) 28 (90) 24 (63) 49 (60) 72 (77)
Spend more than 15 minutes waiting 4 (14) 3 (10) 20 (53) 25 (30) 18 (20)
Persons responding “definitely yes” or “somewhat yes,” by site
Seen as soon as wanted for emergency care 9 (75) 6 (100) 21 (84) 25 (68) 30 (91)
Table 4-9. Caregiver Rating of All Dental Care Personally Received in Past 12 Months For All Respondents Ages 6–17
Category Mean (SD) Median Range
Overall rating 8.05 (2.35) 9 0 to 10
Age group in years
6–9 8.13 (2.26) 9 0 to 10
10–14 8.10 (2.36) 9 1 to 10
15–17 7.79 (2.53) 8 0 to 10
Site
A 8.75 (1.46) 9 4 to 10
B 9.19 (1.25) 10 6 to 10
C 7.78 (3.11) 10 0 to 10
D 7.60 (2.21) 8 1 to 10
E 7.96 (2.50) 9 1 to 10
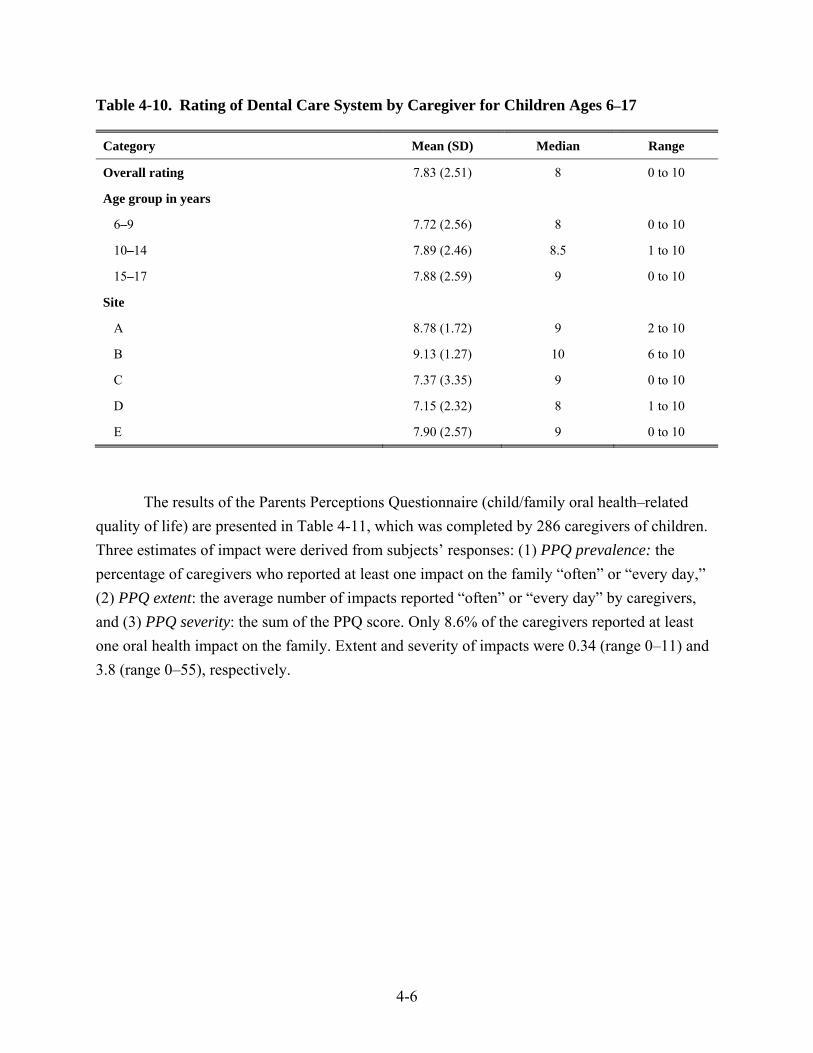
4-6
Table 4-10. Rating of Dental Care System by Caregiver for Children Ages 6–17
Category Mean (SD) Median Range
Overall rating 7.83 (2.51) 8 0 to 10
Age group in years
6–9 7.72 (2.56) 8 0 to 10
10–14 7.89 (2.46) 8.5 1 to 10
15–17 7.88 (2.59) 9 0 to 10
Site
A 8.78 (1.72) 9 2 to 10
B 9.13 (1.27) 10 6 to 10
C 7.37 (3.35) 9 0 to 10
D 7.15 (2.32) 8 1 to 10
E 7.90 (2.57) 9 0 to 10
The results of the Parents Perceptions Questionnaire (child/family oral health–related quality of life) are presented in Table 4-11, which was completed by 286 caregivers of children. Three estimates of impact were derived from subjects’ responses: (1) PPQ prevalence: the percentage of caregivers who reported at least one impact on the family “often” or “every day,” (2) PPQ extent: the average number of impacts reported “often” or “every day” by caregivers, and (3) PPQ severity: the sum of the PPQ score. Only 8.6% of the caregivers reported at least one oral health impact on the family. Extent and severity of impacts were 0.34 (range 0–11) and 3.8 (range 0–55), respectively.
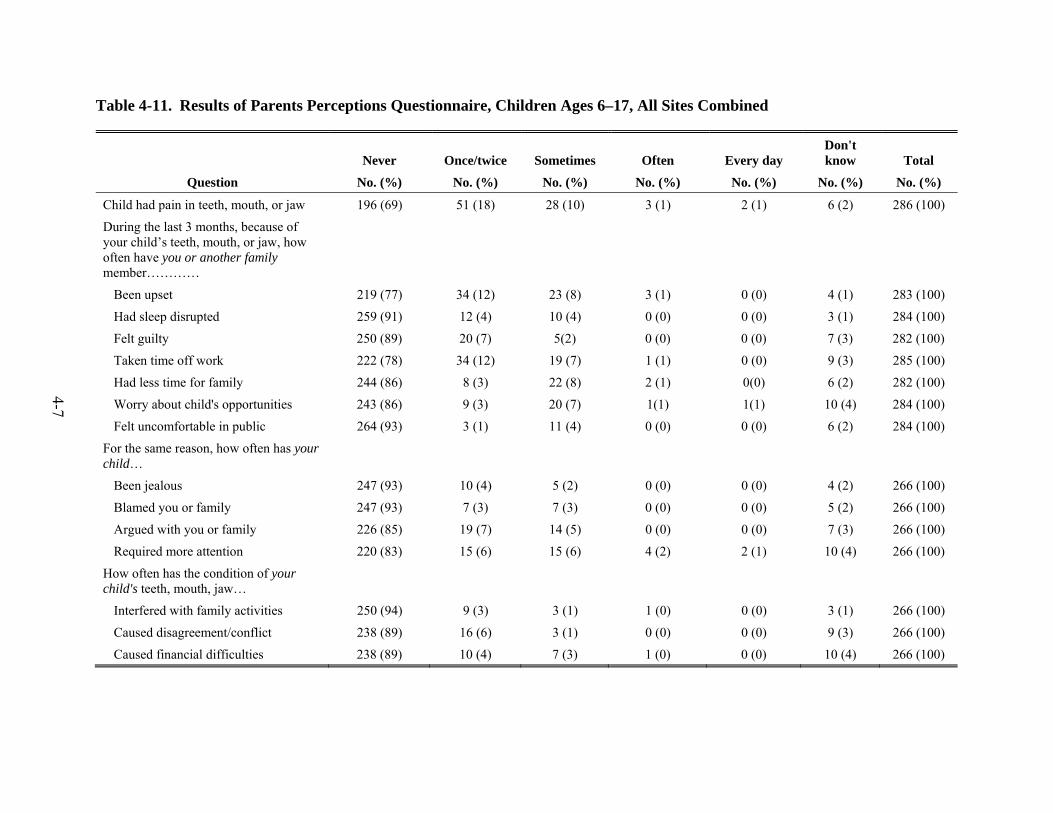
4-7
Table 4-11. Results of Parents Perceptions Questionnaire, Children Ages 6–17, All Sites Combined
Question
Never Once/twice Sometimes Often Every day Don't know Total
No. (%) No. (%) No. (%) No. (%) No. (%) No. (%) No. (%)
Child had pain in teeth, mouth, or jaw 196 (69) 51 (18) 28 (10) 3 (1) 2 (1) 6 (2) 286 (100)
During the last 3 months, because of your child’s teeth, mouth, or jaw, how often have you or another family member…………
Been upset 219 (77) 34 (12) 23 (8) 3 (1) 0 (0) 4 (1) 283 (100)
Had sleep disrupted 259 (91) 12 (4) 10 (4) 0 (0) 0 (0) 3 (1) 284 (100)
Felt guilty 250 (89) 20 (7) 5(2) 0 (0) 0 (0) 7 (3) 282 (100)
Taken time off work 222 (78) 34 (12) 19 (7) 1 (1) 0 (0) 9 (3) 285 (100)
Had less time for family 244 (86) 8 (3) 22 (8) 2 (1) 0(0) 6 (2) 282 (100)
Worry about child's opportunities 243 (86) 9 (3) 20 (7) 1(1) 1(1) 10 (4) 284 (100)
Felt uncomfortable in public 264 (93) 3 (1) 11 (4) 0 (0) 0 (0) 6 (2) 284 (100)
For the same reason, how often has your child…
Been jealous 247 (93) 10 (4) 5 (2) 0 (0) 0 (0) 4 (2) 266 (100)
Blamed you or family 247 (93) 7 (3) 7 (3) 0 (0) 0 (0) 5 (2) 266 (100)
Argued with you or family 226 (85) 19 (7) 14 (5) 0 (0) 0 (0) 7 (3) 266 (100)
Required more attention 220 (83) 15 (6) 15 (6) 4 (2) 2 (1) 10 (4) 266 (100)
How often has the condition of your child's teeth, mouth, jaw…
Interfered with family activities 250 (94) 9 (3) 3 (1) 1 (0) 0 (0) 3 (1) 266 (100)
Caused disagreement/conflict 238 (89) 16 (6) 3 (1) 0 (0) 0 (0) 9 (3) 266 (100)
Caused financial difficulties 238 (89) 10 (4) 7 (3) 1 (0) 0 (0) 10 (4) 266 (100)

4-8
4.1.2 Participants 18 Years of Age or Older
A total of 111 participants 18 years of age or older completed one or more questions from the Dental Care Survey or the Oral Health Impact Profile instrument (Table 4-12). The majority were 18 to 44 years of age, 56% of respondents were female, and 59% reported having been treated by a therapist during the previous 12 months. The majority (53%) reported that the condition of their teeth and gums was good, very good, or excellent.
Table 4-12. Characteristics of Survey Respondents 18 Years of Age or Older
Characteristic No. (%)
Age in years
18–24 41 (37)
25–34 27 (24)
35–44 29 (26)
45–54 10 (9)
55+ 4 (3.6)
Total 111 (100)
Sex, female 60 (56)
Treated by therapist in past 12 months 62 (59)
Visits to therapist in past 12 months
Mean (SD) 1.7 (0.8)
Range 1–5
Self-reported condition of teeth/gums
Excellent 5 (5)
Very good 14 (13)
Good 37 (35)
Fair 36 (34)
Poor 14 (13)
Site
A 39 (35)
B 13 (12)
C 29 (26)
D 18 (16)
E 12 (11)
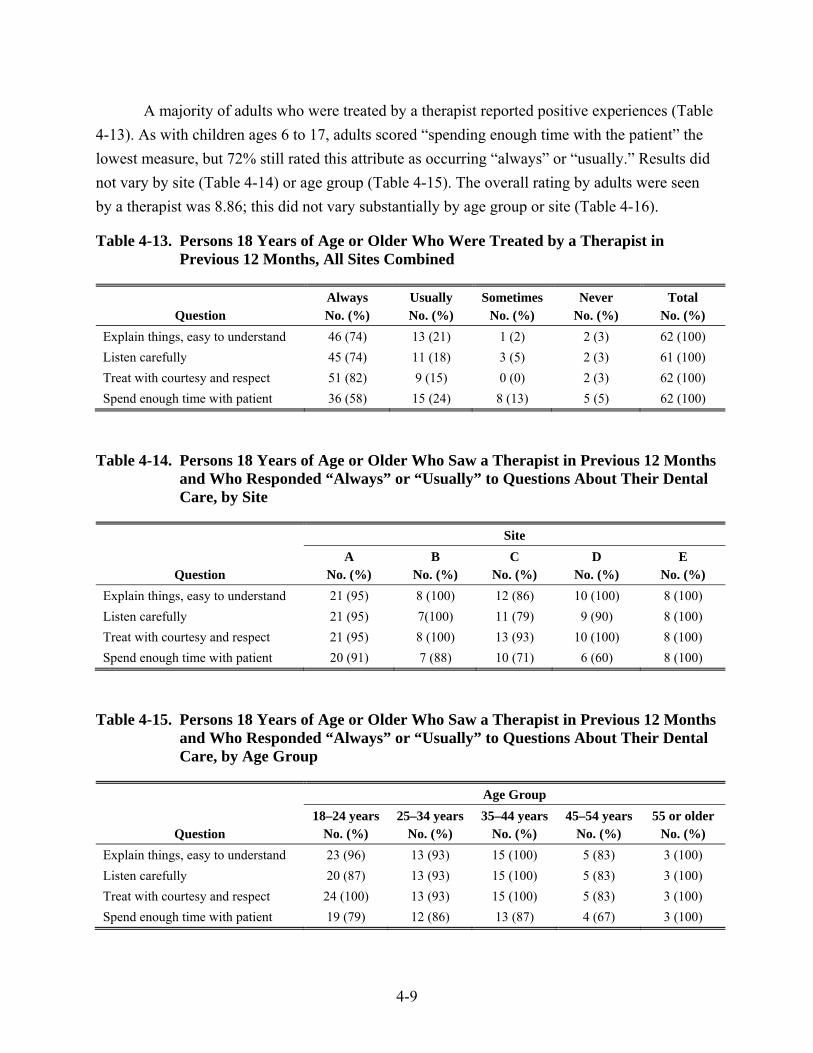
4-9
A majority of adults who were treated by a therapist reported positive experiences (Table 4-13). As with children ages 6 to 17, adults scored “spending enough time with the patient” the lowest measure, but 72% still rated this attribute as occurring “always” or “usually.” Results did not vary by site (Table 4-14) or age group (Table 4-15). The overall rating by adults were seen by a therapist was 8.86; this did not vary substantially by age group or site (Table 4-16).
Table 4-13. Persons 18 Years of Age or Older Who Were Treated by a Therapist in Previous 12 Months, All Sites Combined
Question Always Usually Sometimes Never Total No. (%) No. (%) No. (%) No. (%) No. (%)
Explain things, easy to understand 46 (74) 13 (21) 1 (2) 2 (3) 62 (100) Listen carefully 45 (74) 11 (18) 3 (5) 2 (3) 61 (100) Treat with courtesy and respect 51 (82) 9 (15) 0 (0) 2 (3) 62 (100) Spend enough time with patient 36 (58) 15 (24) 8 (13) 5 (5) 62 (100)
Table 4-14. Persons 18 Years of Age or Older Who Saw a Therapist in Previous 12 Months and Who Responded “Always” or “Usually” to Questions About Their Dental Care, by Site
Question
Site A B C D E
No. (%) No. (%) No. (%) No. (%) No. (%) Explain things, easy to understand 21 (95) 8 (100) 12 (86) 10 (100) 8 (100) Listen carefully 21 (95) 7(100) 11 (79) 9 (90) 8 (100) Treat with courtesy and respect 21 (95) 8 (100) 13 (93) 10 (100) 8 (100) Spend enough time with patient 20 (91) 7 (88) 10 (71) 6 (60) 8 (100)
Table 4-15. Persons 18 Years of Age or Older Who Saw a Therapist in Previous 12 Months and Who Responded “Always” or “Usually” to Questions About Their Dental Care, by Age Group
Question
Age Group 18–24 years 25–34 years 35–44 years 45–54 years 55 or older
No. (%) No. (%) No. (%) No. (%) No. (%) Explain things, easy to understand 23 (96) 13 (93) 15 (100) 5 (83) 3 (100) Listen carefully 20 (87) 13 (93) 15 (100) 5 (83) 3 (100) Treat with courtesy and respect 24 (100) 13 (93) 15 (100) 5 (83) 3 (100) Spend enough time with patient 19 (79) 12 (86) 13 (87) 4 (67) 3 (100)
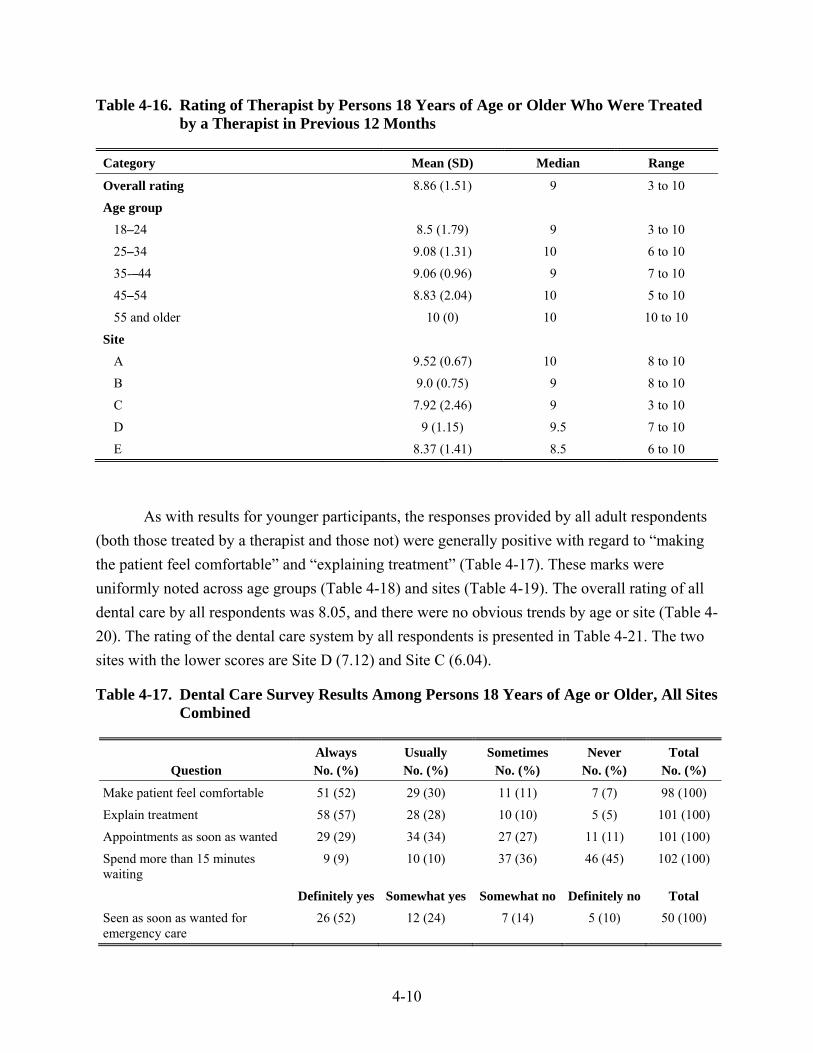
4-10
Table 4-16. Rating of Therapist by Persons 18 Years of Age or Older Who Were Treated by a Therapist in Previous 12 Months
Category Mean (SD) Median Range
Overall rating 8.86 (1.51) 9 3 to 10
Age group
18–24 8.5 (1.79) 9 3 to 10
25–34 9.08 (1.31) 10 6 to 10
35-–44 9.06 (0.96) 9 7 to 10
45–54 8.83 (2.04) 10 5 to 10
55 and older 10 (0) 10 10 to 10
Site
A 9.52 (0.67) 10 8 to 10
B 9.0 (0.75) 9 8 to 10
C 7.92 (2.46) 9 3 to 10
D 9 (1.15) 9.5 7 to 10
E 8.37 (1.41) 8.5 6 to 10
As with results for younger participants, the responses provided by all adult respondents (both those treated by a therapist and those not) were generally positive with regard to “making the patient feel comfortable” and “explaining treatment” (Table 4-17). These marks were uniformly noted across age groups (Table 4-18) and sites (Table 4-19). The overall rating of all dental care by all respondents was 8.05, and there were no obvious trends by age or site (Table 4-20). The rating of the dental care system by all respondents is presented in Table 4-21. The two sites with the lower scores are Site D (7.12) and Site C (6.04).
Table 4-17. Dental Care Survey Results Among Persons 18 Years of Age or Older, All Sites Combined
Question Always Usually Sometimes Never Total No. (%) No. (%) No. (%) No. (%) No. (%)
Make patient feel comfortable 51 (52) 29 (30) 11 (11) 7 (7) 98 (100)
Explain treatment 58 (57) 28 (28) 10 (10) 5 (5) 101 (100)
Appointments as soon as wanted 29 (29) 34 (34) 27 (27) 11 (11) 101 (100)
Spend more than 15 minutes waiting
9 (9) 10 (10) 37 (36) 46 (45) 102 (100)
Definitely yes Somewhat yes Somewhat no Definitely no Total Seen as soon as wanted for emergency care
26 (52) 12 (24) 7 (14) 5 (10) 50 (100)
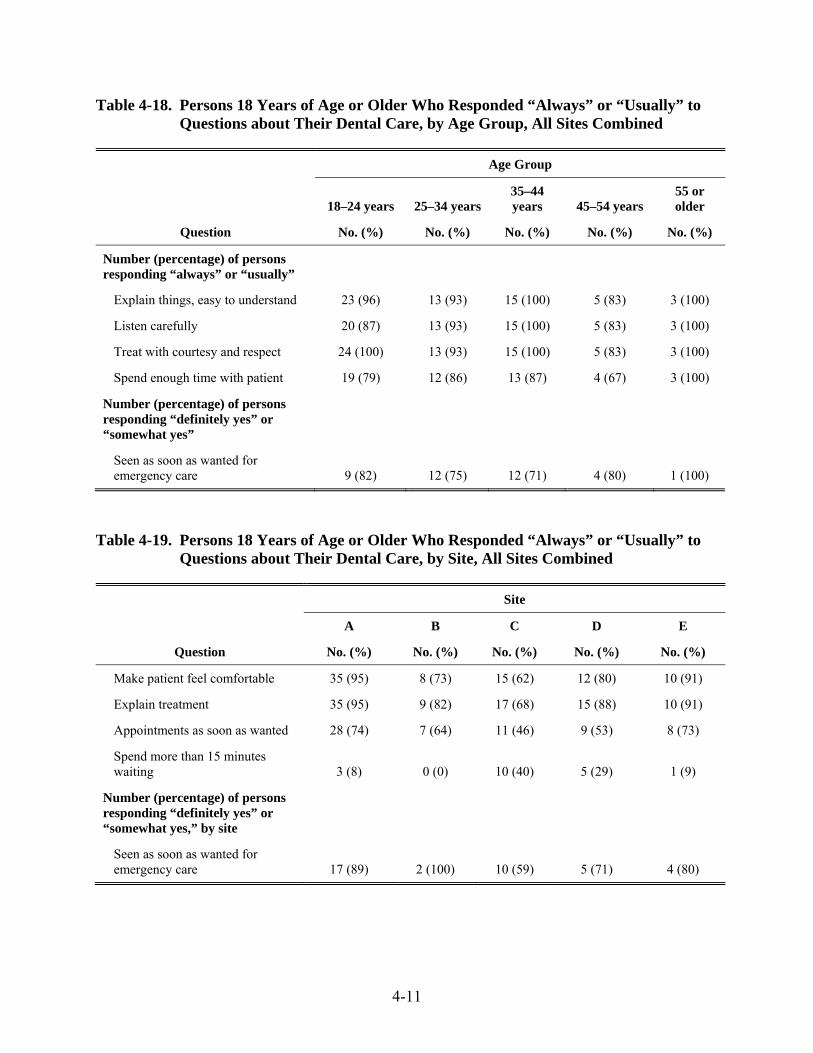
4-11
Table 4-18. Persons 18 Years of Age or Older Who Responded “Always” or “Usually” to Questions about Their Dental Care, by Age Group, All Sites Combined
Question
Age Group
18–24 years 25–34 years 35–44 years 45–54 years
55 or older
No. (%) No. (%) No. (%) No. (%) No. (%)
Number (percentage) of persons responding “always” or “usually”
Explain things, easy to understand 23 (96) 13 (93) 15 (100) 5 (83) 3 (100)
Listen carefully 20 (87) 13 (93) 15 (100) 5 (83) 3 (100)
Treat with courtesy and respect 24 (100) 13 (93) 15 (100) 5 (83) 3 (100)
Spend enough time with patient 19 (79) 12 (86) 13 (87) 4 (67) 3 (100)
Number (percentage) of persons responding “definitely yes” or “somewhat yes”
Seen as soon as wanted for emergency care 9 (82) 12 (75) 12 (71) 4 (80) 1 (100)
Table 4-19. Persons 18 Years of Age or Older Who Responded “Always” or “Usually” to Questions about Their Dental Care, by Site, All Sites Combined
Question
Site
A B C D E
No. (%) No. (%) No. (%) No. (%) No. (%)
Make patient feel comfortable 35 (95) 8 (73) 15 (62) 12 (80) 10 (91)
Explain treatment 35 (95) 9 (82) 17 (68) 15 (88) 10 (91)
Appointments as soon as wanted 28 (74) 7 (64) 11 (46) 9 (53) 8 (73)
Spend more than 15 minutes waiting 3 (8) 0 (0) 10 (40) 5 (29) 1 (9)
Number (percentage) of persons responding “definitely yes” or “somewhat yes,” by site
Seen as soon as wanted for emergency care 17 (89) 2 (100) 10 (59) 5 (71) 4 (80)
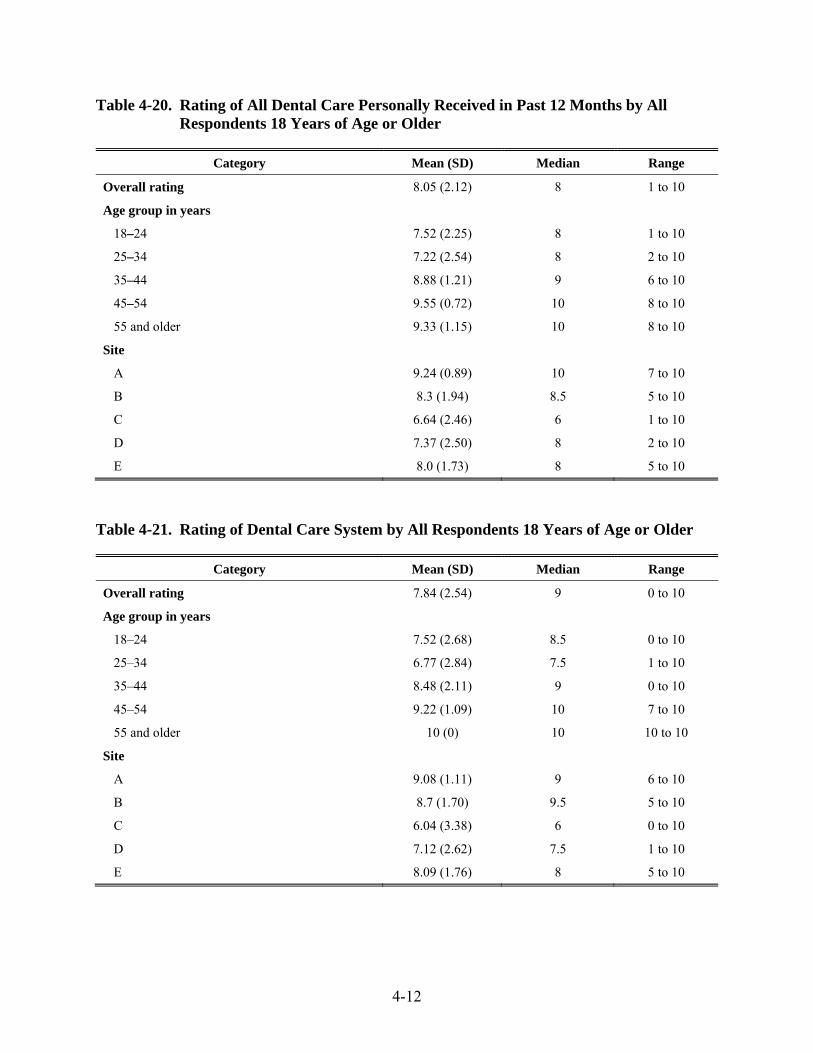
4-12
Table 4-20. Rating of All Dental Care Personally Received in Past 12 Months by All Respondents 18 Years of Age or Older
Category Mean (SD) Median Range
Overall rating 8.05 (2.12) 8 1 to 10
Age group in years
18–24 7.52 (2.25) 8 1 to 10
25–34 7.22 (2.54) 8 2 to 10
35–44 8.88 (1.21) 9 6 to 10
45–54 9.55 (0.72) 10 8 to 10
55 and older 9.33 (1.15) 10 8 to 10
Site
A 9.24 (0.89) 10 7 to 10
B 8.3 (1.94) 8.5 5 to 10
C 6.64 (2.46) 6 1 to 10
D 7.37 (2.50) 8 2 to 10
E 8.0 (1.73) 8 5 to 10
Table 4-21. Rating of Dental Care System by All Respondents 18 Years of Age or Older
Category Mean (SD) Median Range
Overall rating 7.84 (2.54) 9 0 to 10
Age group in years
18–24 7.52 (2.68) 8.5 0 to 10
25–34 6.77 (2.84) 7.5 1 to 10
35–44 8.48 (2.11) 9 0 to 10
45–54 9.22 (1.09) 10 7 to 10
55 and older 10 (0) 10 10 to 10
Site
A 9.08 (1.11) 9 6 to 10
B 8.7 (1.70) 9.5 5 to 10
C 6.04 (3.38) 6 0 to 10
D 7.12 (2.62) 7.5 1 to 10
E 8.09 (1.76) 8 5 to 10

4-13
Results of survey respondents to the Oral Health Impact Profile (OHIP) instrument are presented in Table 4-22. Three estimates of impact were derived from subjects’ responses: (1) OHIP prevalence: the percentage of subjects’ who reported at least one impact “fairly often” or “very often,” (2) OHIP extent: the average number of impacts reported by subjects “fairly often” or “very often,” and (3) OHIP severity: the sum of the OHIP-14. The prevalence of oral health impacts in our sample (19.3%) was slightly higher compared to nationally representative samples from other studies including the United States (15.3%) (Sanders et al., 2009), Australia (18.2%), and the United Kingdom (15.9%) (Slade et al., 2005), but lower when compared to a population sample from New Zealand (23.4%) (Hyde, Satariano, & Weinttraub, 2006). The mean OHIP-14 extent and severity scores were 1.26 (range 0–8) and 10.3 (range 0–54), respectively.
Table 4-22. Results of Oral Health Impact Profile Among Persons 18 Years of Age or Older
Questionnaire item
Never Hardly
ever Occasion-
ally Fairly often
Very often
Don't know Total
No. (%) No. (%) No. (%) No. (%) No. (%) No. (%) No. (%)
Trouble pronouncing words 62 (56) 31 (28) 12 (11) 3 (3) 0 (0) 2 (2) 110 (100)
Sense of taste has worsened 68 (62) 25 (23) 11 (10) 3 (3) 0 (0) 3 (3) 110 (100)
Painful aching in mouth 37 (34) 35 (32) 25 (23) 10 (9) 3 (3) 0 (0) 110 (100)
Uncomfortable to eat any foods
42 (38) 30 (27) 26 (24) 7 (6) 5 (5) 0 (0) 110 (100)
Been self-conscious 56 (51) 21 (19) 12 (11) 10 (9) 5 (5) 6 (5) 110 (100)
Felt tense 53 (48) 32 (29) 13 (12) 7 (6) 3 (3) 2 (2) 110 (100)
Had unsatisfactory diet 66 (60) 23 (21) 16 (15) 3 (3) 1 (1) 1 (1) 110 (100)
Had to interrupt meals 58 (53) 33 (30) 14 (13) 2 (2) 2 (2) 1 (1) 110 (100)
Found it difficult to relax 60 (55) 32 (29) 14 (13) 2 (2) 1 (1) 1 (1) 110 (100)
Have been a bit embarrassed 53 (48) 25 (23) 23 (21) 4 (4) 5 (5) 0 (0) 110 (100)
Irritable with other people 56 (51) 37 (34) 15 (14) 1 (1) 0 (0) 1 (1) 110 (100)
Difficulty doing usual jobs 76 (69) 29 (26) 4 (4) 1 (1) 0 (0) 0 (0) 110 (100)
Life in general was less satisfying
80 (73) 24 (22) 4 (4) 0 (0) 0 (0) 0 (0) 110 (110)
Totally unable to function 90 (83) 14 (13) 2 (2) 1 (1) 0 (0) 2 (2) 109 (100)
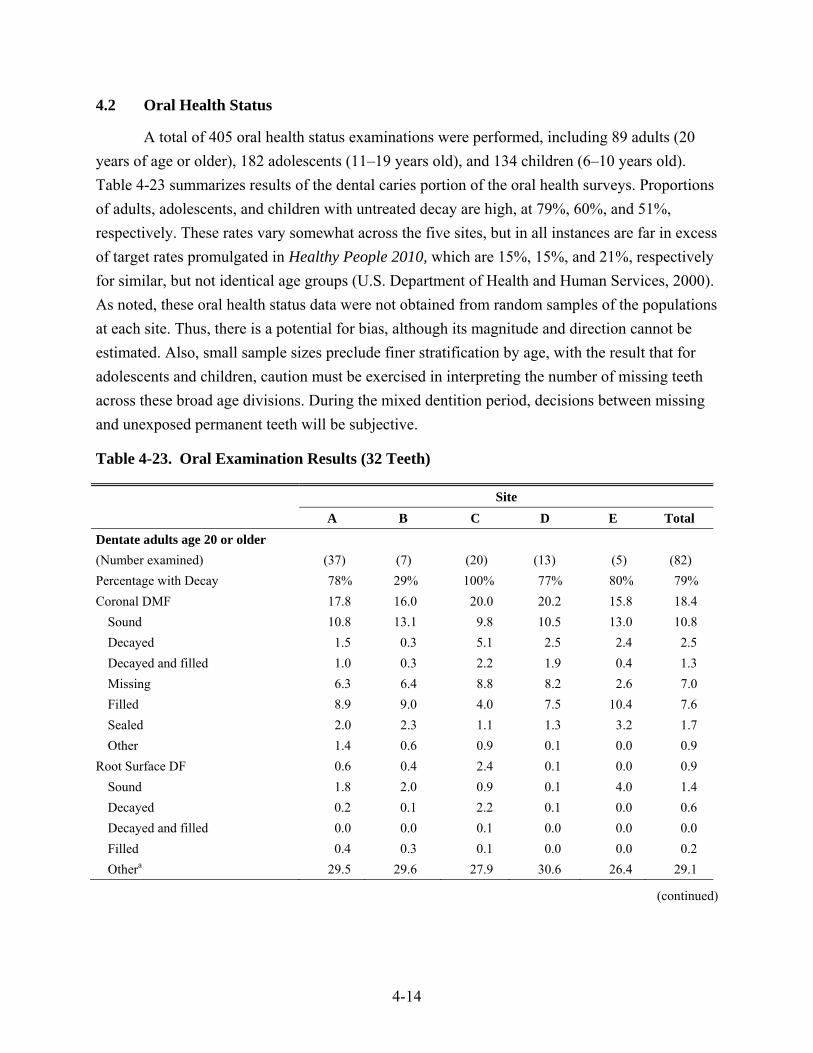
4-14
4.2 Oral Health Status
A total of 405 oral health status examinations were performed, including 89 adults (20 years of age or older), 182 adolescents (11–19 years old), and 134 children (6–10 years old). Table 4-23 summarizes results of the dental caries portion of the oral health surveys. Proportions of adults, adolescents, and children with untreated decay are high, at 79%, 60%, and 51%, respectively. These rates vary somewhat across the five sites, but in all instances are far in excess of target rates promulgated in Healthy People 2010, which are 15%, 15%, and 21%, respectively for similar, but not identical age groups (U.S. Department of Health and Human Services, 2000). As noted, these oral health status data were not obtained from random samples of the populations at each site. Thus, there is a potential for bias, although its magnitude and direction cannot be estimated. Also, small sample sizes preclude finer stratification by age, with the result that for adolescents and children, caution must be exercised in interpreting the number of missing teeth across these broad age divisions. During the mixed dentition period, decisions between missing and unexposed permanent teeth will be subjective.
Table 4-23. Oral Examination Results (32 Teeth)
Site A B C D E Total Dentate adults age 20 or older (Number examined) (37) (7) (20) (13) (5) (82) Percentage with Decay 78% 29% 100% 77% 80% 79% Coronal DMF 17.8 16.0 20.0 20.2 15.8 18.4
Sound 10.8 13.1 9.8 10.5 13.0 10.8 Decayed 1.5 0.3 5.1 2.5 2.4 2.5 Decayed and filled 1.0 0.3 2.2 1.9 0.4 1.3 Missing 6.3 6.4 8.8 8.2 2.6 7.0 Filled 8.9 9.0 4.0 7.5 10.4 7.6 Sealed 2.0 2.3 1.1 1.3 3.2 1.7 Other 1.4 0.6 0.9 0.1 0.0 0.9
Root Surface DF 0.6 0.4 2.4 0.1 0.0 0.9 Sound 1.8 2.0 0.9 0.1 4.0 1.4 Decayed 0.2 0.1 2.2 0.1 0.0 0.6 Decayed and filled 0.0 0.0 0.1 0.0 0.0 0.0 Filled 0.4 0.3 0.1 0.0 0.0 0.2 Othera 29.5 29.6 27.9 30.6 26.4 29.1
(continued)
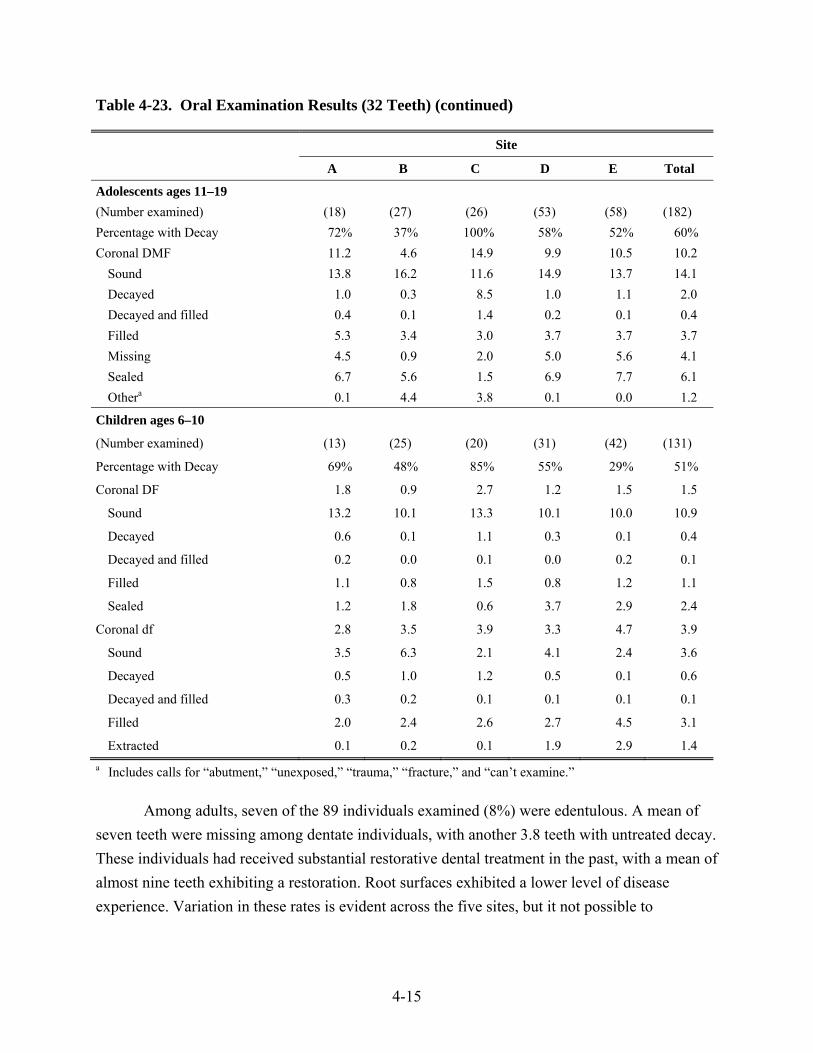
4-15
Table 4-23. Oral Examination Results (32 Teeth) (continued)
Site
A B C D E Total
Adolescents ages 11–19 (Number examined) (18) (27) (26) (53) (58) (182) Percentage with Decay 72% 37% 100% 58% 52% 60% Coronal DMF 11.2 4.6 14.9 9.9 10.5 10.2
Sound 13.8 16.2 11.6 14.9 13.7 14.1 Decayed 1.0 0.3 8.5 1.0 1.1 2.0 Decayed and filled 0.4 0.1 1.4 0.2 0.1 0.4 Filled 5.3 3.4 3.0 3.7 3.7 3.7 Missing 4.5 0.9 2.0 5.0 5.6 4.1 Sealed 6.7 5.6 1.5 6.9 7.7 6.1 Othera 0.1 4.4 3.8 0.1 0.0 1.2
Children ages 6–10
(Number examined) (13) (25) (20) (31) (42) (131)
Percentage with Decay 69% 48% 85% 55% 29% 51%
Coronal DF 1.8 0.9 2.7 1.2 1.5 1.5
Sound 13.2 10.1 13.3 10.1 10.0 10.9
Decayed 0.6 0.1 1.1 0.3 0.1 0.4
Decayed and filled 0.2 0.0 0.1 0.0 0.2 0.1
Filled 1.1 0.8 1.5 0.8 1.2 1.1
Sealed 1.2 1.8 0.6 3.7 2.9 2.4
Coronal df 2.8 3.5 3.9 3.3 4.7 3.9
Sound 3.5 6.3 2.1 4.1 2.4 3.6
Decayed 0.5 1.0 1.2 0.5 0.1 0.6
Decayed and filled 0.3 0.2 0.1 0.1 0.1 0.1
Filled 2.0 2.4 2.6 2.7 4.5 3.1
Extracted 0.1 0.2 0.1 1.9 2.9 1.4 a Includes calls for “abutment,” “unexposed,” “trauma,” “fracture,” and “can’t examine.”
Among adults, seven of the 89 individuals examined (8%) were edentulous. A mean of seven teeth were missing among dentate individuals, with another 3.8 teeth with untreated decay. These individuals had received substantial restorative dental treatment in the past, with a mean of almost nine teeth exhibiting a restoration. Root surfaces exhibited a lower level of disease experience. Variation in these rates is evident across the five sites, but it not possible to

4-16
determine the extent to which differences are due to small sample sizes as opposed to true differences in disease experience or availability of restorative treatment.
Examination results for adolescents show results similar to those for adults, suggesting that these teens and preteens are experiencing an oral health trajectory similar to that experienced by their parents. At all but one site, more than half of adolescents exhibited untreated decay, and DMF scores were high. However, this group also exhibited attention to caries prevention in that an average of six teeth had been sealed.
Children also display high levels of caries experience. About half the children had one permanent tooth and one primary tooth with unfilled decay. More than three primary teeth and one permanent tooth had received restorative care. Differences in rates at which permanent teeth had been sealed are evident across sites, ranging from less than one at the site where caries are most prevalent in all age groups, to almost four teeth.
Table 4-24 shows a comparison of three caries-related indicators for third grade children among the five sites and recent statewide data for American Indians and Alaska Natives. The proportion of 9- and 10-year-old children (third grader equivalents) from the five sites with caries experience (one or more decayed or filled teeth) was larger than the proportion in the statewide sample. However, the proportion of untreated caries was lower, and a larger proportion of children at the sites had received one or more sealants. This proportion (68%) exceeds the target for children 8 to 15 years old in Healthy People 2010, which are set at 50% (U.S. Department of Health and Human Services, 2000).
Table 4-24. Third Grade Comparisona
Site
A B C D E Total Alaskaa
(Number evaluated) (7) (8) (8) (12) (20) (55) (283)
Caries Experience 71% 100% 88% 83% 85% 85% 76%
Untreated Caries 43% 38% 75% 50% 15% 38% 39%
Sealants Present 57% 100% 50% 92% 100% 85% 68%
a Combined data from 9- and 10-year-olds, compared to data for third grade American Indians/Alaska Natives from the State of Alaska.
Source: Alaska Department of Health and Social Services Oral Health Program. 2007 Alaska Oral Health Basic Screening Survey.
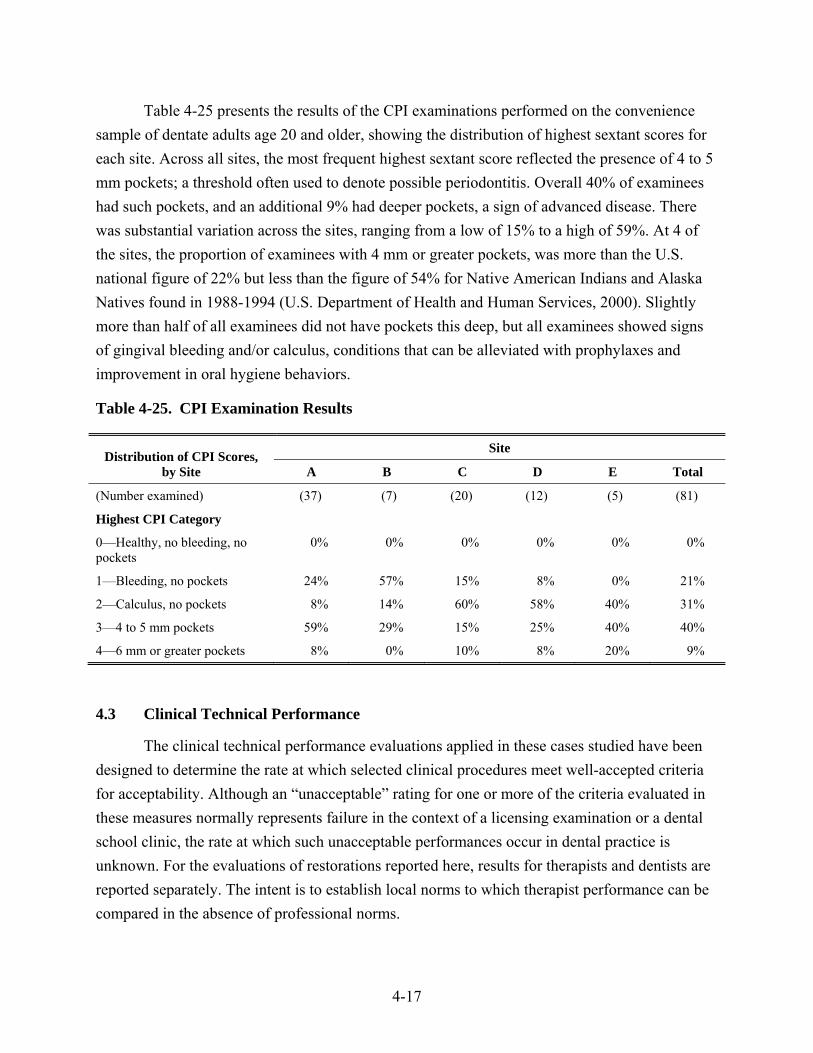
4-17
Table 4-25 presents the results of the CPI examinations performed on the convenience sample of dentate adults age 20 and older, showing the distribution of highest sextant scores for each site. Across all sites, the most frequent highest sextant score reflected the presence of 4 to 5 mm pockets; a threshold often used to denote possible periodontitis. Overall 40% of examinees had such pockets, and an additional 9% had deeper pockets, a sign of advanced disease. There was substantial variation across the sites, ranging from a low of 15% to a high of 59%. At 4 of the sites, the proportion of examinees with 4 mm or greater pockets, was more than the U.S. national figure of 22% but less than the figure of 54% for Native American Indians and Alaska Natives found in 1988-1994 (U.S. Department of Health and Human Services, 2000). Slightly more than half of all examinees did not have pockets this deep, but all examinees showed signs of gingival bleeding and/or calculus, conditions that can be alleviated with prophylaxes and improvement in oral hygiene behaviors.
Table 4-25. CPI Examination Results
Distribution of CPI Scores, by Site
Site
A B C D E Total
(Number examined) (37) (7) (20) (12) (5) (81)
Highest CPI Category
0—Healthy, no bleeding, no pockets
0% 0% 0% 0% 0% 0%
1—Bleeding, no pockets 24% 57% 15% 8% 0% 21%
2—Calculus, no pockets 8% 14% 60% 58% 40% 31%
3—4 to 5 mm pockets 59% 29% 15% 25% 40% 40%
4—6 mm or greater pockets 8% 0% 10% 8% 20% 9%
4.3 Clinical Technical Performance
The clinical technical performance evaluations applied in these cases studied have been designed to determine the rate at which selected clinical procedures meet well-accepted criteria for acceptability. Although an “unacceptable” rating for one or more of the criteria evaluated in these measures normally represents failure in the context of a licensing examination or a dental school clinic, the rate at which such unacceptable performances occur in dental practice is unknown. For the evaluations of restorations reported here, results for therapists and dentists are reported separately. The intent is to establish local norms to which therapist performance can be compared in the absence of professional norms.
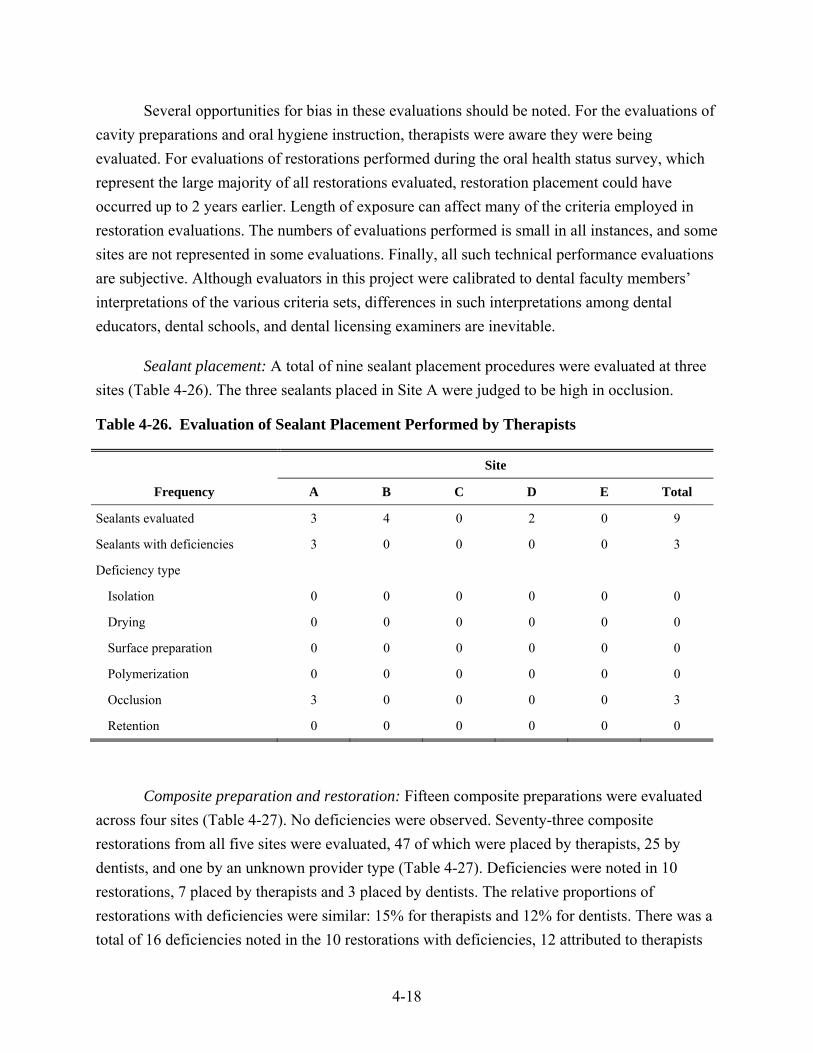
4-18
Several opportunities for bias in these evaluations should be noted. For the evaluations of cavity preparations and oral hygiene instruction, therapists were aware they were being evaluated. For evaluations of restorations performed during the oral health status survey, which represent the large majority of all restorations evaluated, restoration placement could have occurred up to 2 years earlier. Length of exposure can affect many of the criteria employed in restoration evaluations. The numbers of evaluations performed is small in all instances, and some sites are not represented in some evaluations. Finally, all such technical performance evaluations are subjective. Although evaluators in this project were calibrated to dental faculty members’ interpretations of the various criteria sets, differences in such interpretations among dental educators, dental schools, and dental licensing examiners are inevitable.
Sealant placement: A total of nine sealant placement procedures were evaluated at three sites (Table 4-26). The three sealants placed in Site A were judged to be high in occlusion.
Table 4-26. Evaluation of Sealant Placement Performed by Therapists
Site
Frequency A B C D E Total
Sealants evaluated 3 4 0 2 0 9
Sealants with deficiencies 3 0 0 0 0 3
Deficiency type
Isolation 0 0 0 0 0 0
Drying 0 0 0 0 0 0
Surface preparation 0 0 0 0 0 0
Polymerization 0 0 0 0 0 0
Occlusion 3 0 0 0 0 3
Retention 0 0 0 0 0 0
Composite preparation and restoration: Fifteen composite preparations were evaluated across four sites (Table 4-27). No deficiencies were observed. Seventy-three composite restorations from all five sites were evaluated, 47 of which were placed by therapists, 25 by dentists, and one by an unknown provider type (Table 4-27). Deficiencies were noted in 10 restorations, 7 placed by therapists and 3 placed by dentists. The relative proportions of restorations with deficiencies were similar: 15% for therapists and 12% for dentists. There was a total of 16 deficiencies noted in the 10 restorations with deficiencies, 12 attributed to therapists
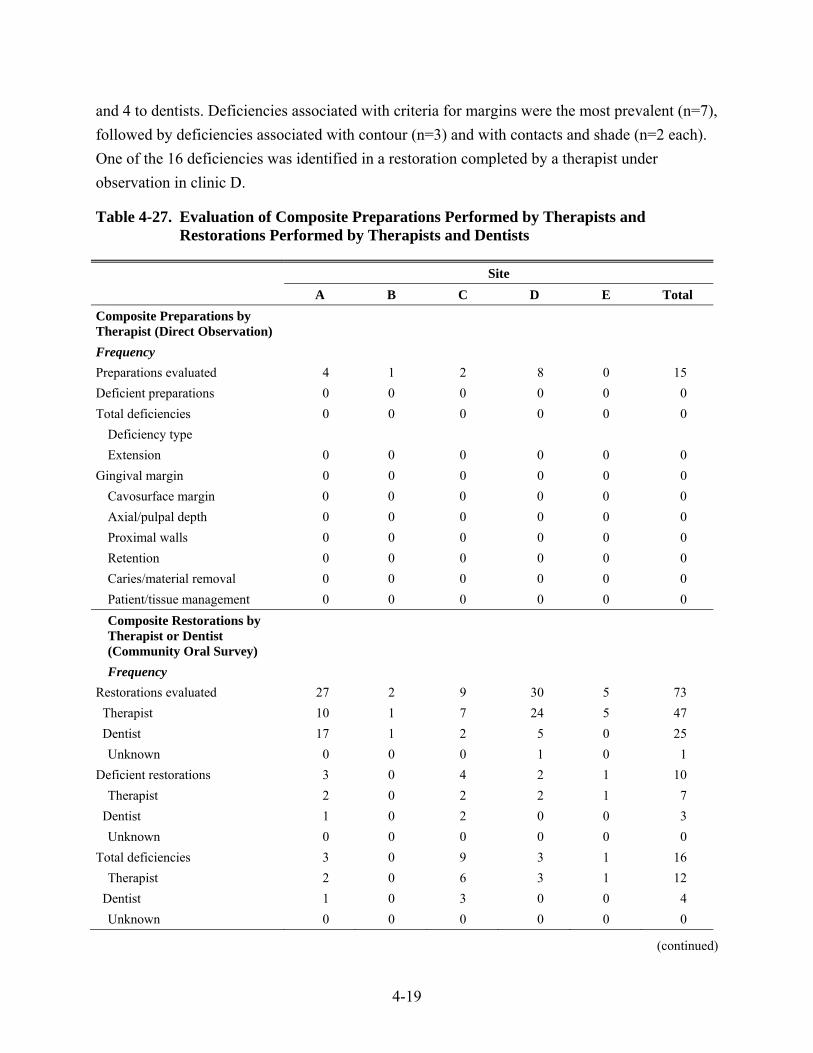
4-19
and 4 to dentists. Deficiencies associated with criteria for margins were the most prevalent (n=7), followed by deficiencies associated with contour (n=3) and with contacts and shade (n=2 each). One of the 16 deficiencies was identified in a restoration completed by a therapist under observation in clinic D.
Table 4-27. Evaluation of Composite Preparations Performed by Therapists and Restorations Performed by Therapists and Dentists
Site A B C D E Total
Composite Preparations by Therapist (Direct Observation)
Frequency Preparations evaluated 4 1 2 8 0 15 Deficient preparations 0 0 0 0 0 0 Total deficiencies 0 0 0 0 0 0
Deficiency type Extension 0 0 0 0 0 0
Gingival margin 0 0 0 0 0 0 Cavosurface margin 0 0 0 0 0 0 Axial/pulpal depth 0 0 0 0 0 0 Proximal walls 0 0 0 0 0 0 Retention 0 0 0 0 0 0 Caries/material removal 0 0 0 0 0 0 Patient/tissue management 0 0 0 0 0 0 Composite Restorations by Therapist or Dentist (Community Oral Survey)
Frequency Restorations evaluated 27 2 9 30 5 73 Therapist 10 1 7 24 5 47 Dentist 17 1 2 5 0 25
Unknown 0 0 0 1 0 1 Deficient restorations 3 0 4 2 1 10
Therapist 2 0 2 2 1 7 Dentist 1 0 2 0 0 3
Unknown 0 0 0 0 0 0 Total deficiencies 3 0 9 3 1 16
Therapist 2 0 6 3 1 12 Dentist 1 0 3 0 0 4
Unknown 0 0 0 0 0 0
(continued)
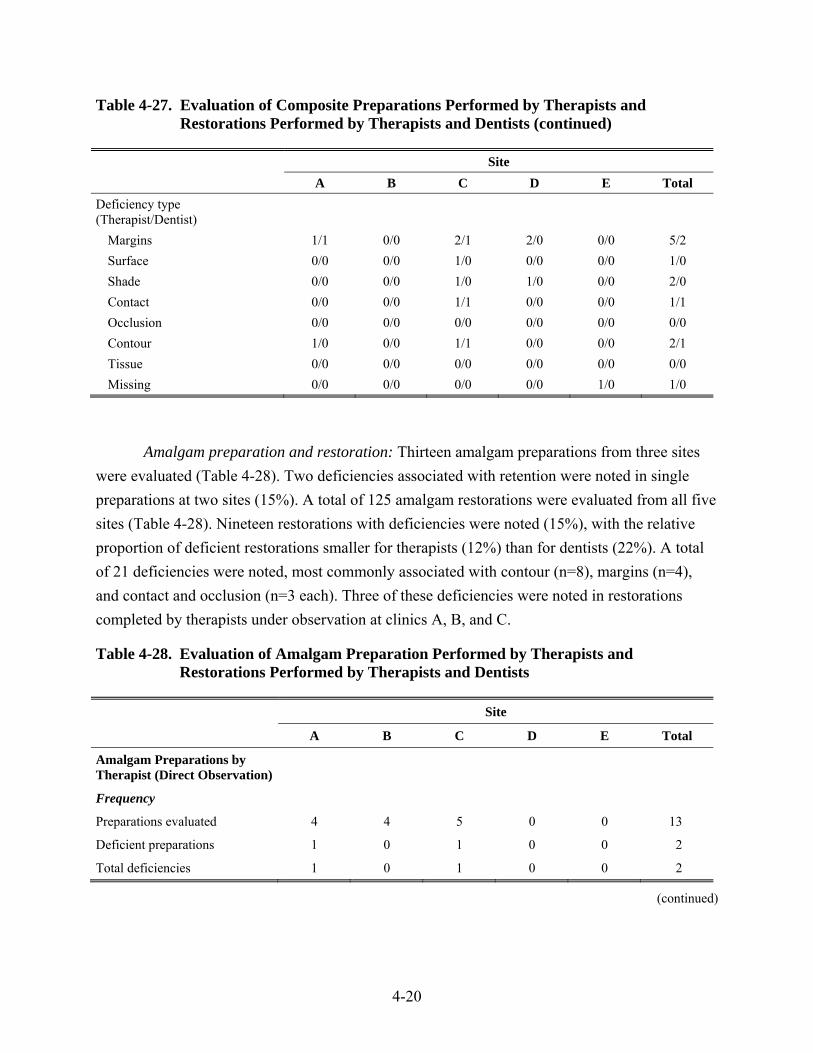
4-20
Table 4-27. Evaluation of Composite Preparations Performed by Therapists and Restorations Performed by Therapists and Dentists (continued)
Site A B C D E Total
Deficiency type (Therapist/Dentist)
Margins 1/1 0/0 2/1 2/0 0/0 5/2 Surface 0/0 0/0 1/0 0/0 0/0 1/0 Shade 0/0 0/0 1/0 1/0 0/0 2/0 Contact 0/0 0/0 1/1 0/0 0/0 1/1 Occlusion 0/0 0/0 0/0 0/0 0/0 0/0 Contour 1/0 0/0 1/1 0/0 0/0 2/1 Tissue 0/0 0/0 0/0 0/0 0/0 0/0 Missing 0/0 0/0 0/0 0/0 1/0 1/0
Amalgam preparation and restoration: Thirteen amalgam preparations from three sites were evaluated (Table 4-28). Two deficiencies associated with retention were noted in single preparations at two sites (15%). A total of 125 amalgam restorations were evaluated from all five sites (Table 4-28). Nineteen restorations with deficiencies were noted (15%), with the relative proportion of deficient restorations smaller for therapists (12%) than for dentists (22%). A total of 21 deficiencies were noted, most commonly associated with contour (n=8), margins (n=4), and contact and occlusion (n=3 each). Three of these deficiencies were noted in restorations completed by therapists under observation at clinics A, B, and C.
Table 4-28. Evaluation of Amalgam Preparation Performed by Therapists and Restorations Performed by Therapists and Dentists
Site
A B C D E Total
Amalgam Preparations by Therapist (Direct Observation)
Frequency
Preparations evaluated 4 4 5 0 0 13
Deficient preparations 1 0 1 0 0 2
Total deficiencies 1 0 1 0 0 2
(continued)
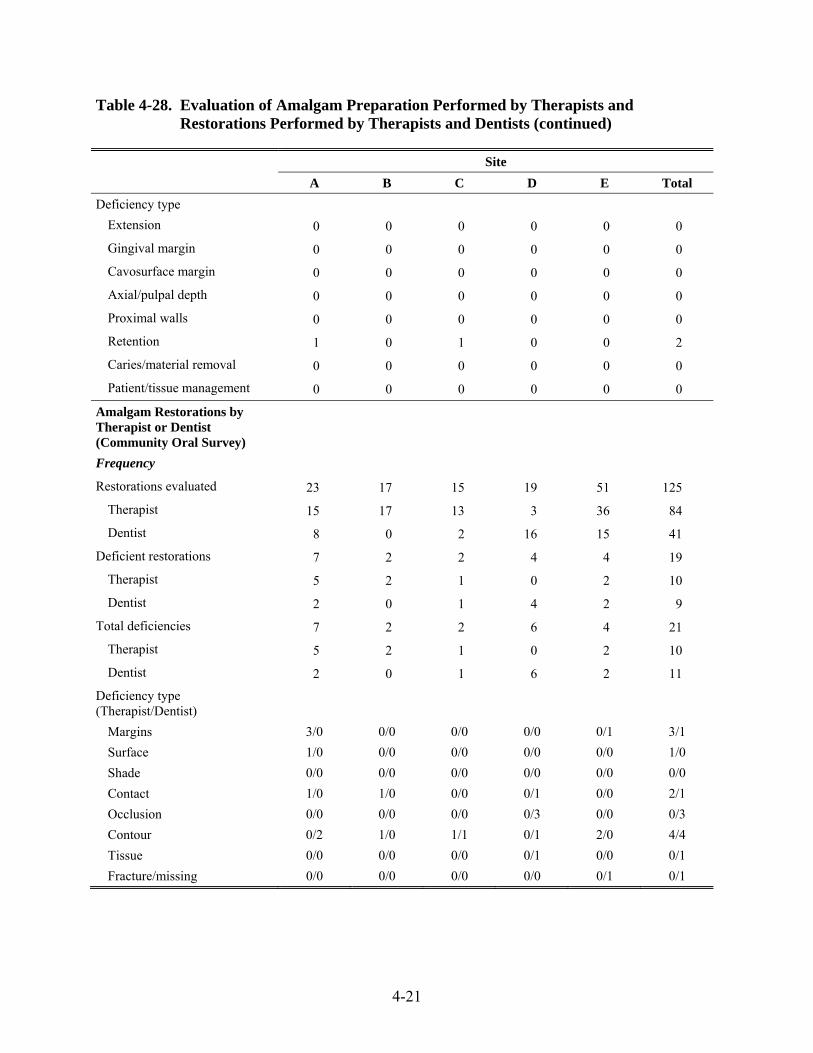
4-21
Table 4-28. Evaluation of Amalgam Preparation Performed by Therapists and Restorations Performed by Therapists and Dentists (continued)
Site A B C D E Total
Deficiency type Extension 0 0 0 0 0 0
Gingival margin 0 0 0 0 0 0
Cavosurface margin 0 0 0 0 0 0
Axial/pulpal depth 0 0 0 0 0 0
Proximal walls 0 0 0 0 0 0
Retention 1 0 1 0 0 2
Caries/material removal 0 0 0 0 0 0
Patient/tissue management 0 0 0 0 0 0
Amalgam Restorations by Therapist or Dentist (Community Oral Survey)
Frequency
Restorations evaluated 23 17 15 19 51 125
Therapist 15 17 13 3 36 84
Dentist 8 0 2 16 15 41
Deficient restorations 7 2 2 4 4 19
Therapist 5 2 1 0 2 10
Dentist 2 0 1 4 2 9
Total deficiencies 7 2 2 6 4 21
Therapist 5 2 1 0 2 10
Dentist 2 0 1 6 2 11
Deficiency type (Therapist/Dentist)
Margins 3/0 0/0 0/0 0/0 0/1 3/1 Surface 1/0 0/0 0/0 0/0 0/0 1/0 Shade 0/0 0/0 0/0 0/0 0/0 0/0 Contact 1/0 1/0 0/0 0/1 0/0 2/1 Occlusion 0/0 0/0 0/0 0/3 0/0 0/3 Contour 0/2 1/0 1/1 0/1 2/0 4/4 Tissue 0/0 0/0 0/0 0/1 0/0 0/1 Fracture/missing 0/0 0/0 0/0 0/0 0/1 0/1
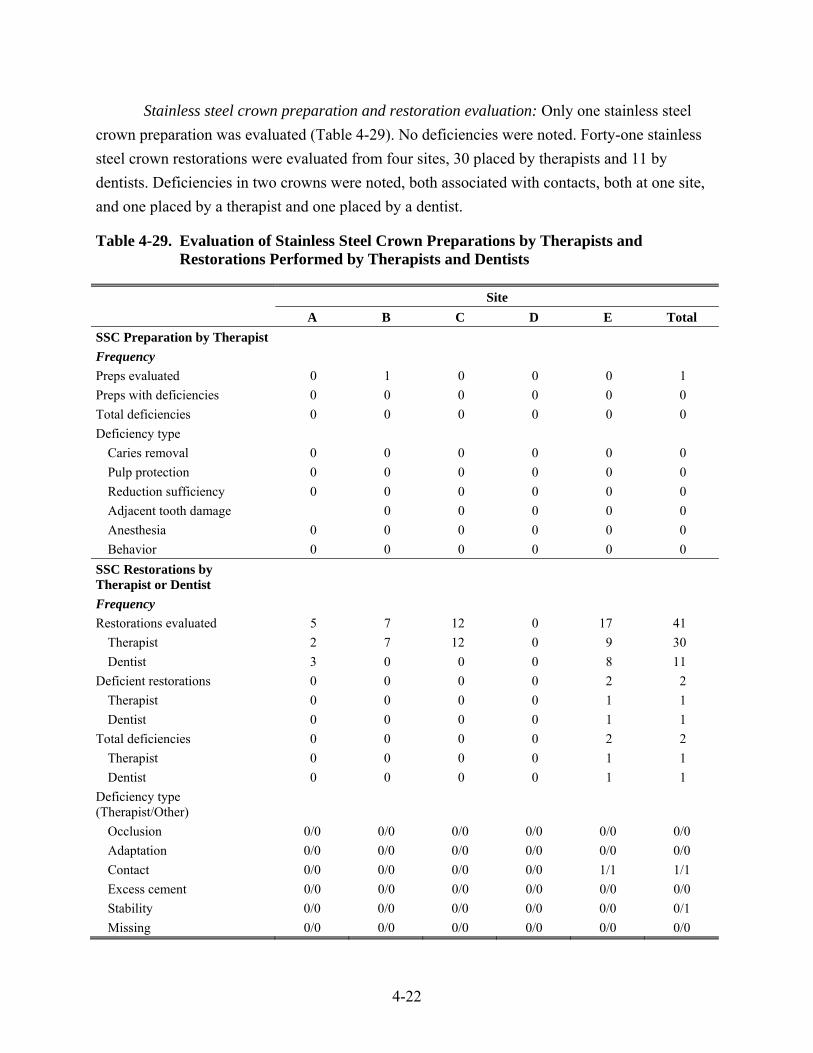
4-22
Stainless steel crown preparation and restoration evaluation: Only one stainless steel crown preparation was evaluated (Table 4-29). No deficiencies were noted. Forty-one stainless steel crown restorations were evaluated from four sites, 30 placed by therapists and 11 by dentists. Deficiencies in two crowns were noted, both associated with contacts, both at one site, and one placed by a therapist and one placed by a dentist.
Table 4-29. Evaluation of Stainless Steel Crown Preparations by Therapists and Restorations Performed by Therapists and Dentists
Site A B C D E Total SSC Preparation by Therapist Frequency Preps evaluated 0 1 0 0 0 1 Preps with deficiencies 0 0 0 0 0 0 Total deficiencies 0 0 0 0 0 0 Deficiency type
Caries removal 0 0 0 0 0 0 Pulp protection 0 0 0 0 0 0 Reduction sufficiency 0 0 0 0 0 0 Adjacent tooth damage 0 0 0 0 0 Anesthesia 0 0 0 0 0 0 Behavior 0 0 0 0 0 0
SSC Restorations by Therapist or Dentist
Frequency Restorations evaluated 5 7 12 0 17 41
Therapist 2 7 12 0 9 30 Dentist 3 0 0 0 8 11
Deficient restorations 0 0 0 0 2 2 Therapist 0 0 0 0 1 1 Dentist 0 0 0 0 1 1
Total deficiencies 0 0 0 0 2 2 Therapist 0 0 0 0 1 1 Dentist 0 0 0 0 1 1
Deficiency type (Therapist/Other)
Occlusion 0/0 0/0 0/0 0/0 0/0 0/0 Adaptation 0/0 0/0 0/0 0/0 0/0 0/0 Contact 0/0 0/0 0/0 0/0 1/1 1/1 Excess cement 0/0 0/0 0/0 0/0 0/0 0/0 Stability 0/0 0/0 0/0 0/0 0/0 0/1 Missing 0/0 0/0 0/0 0/0 0/0 0/0
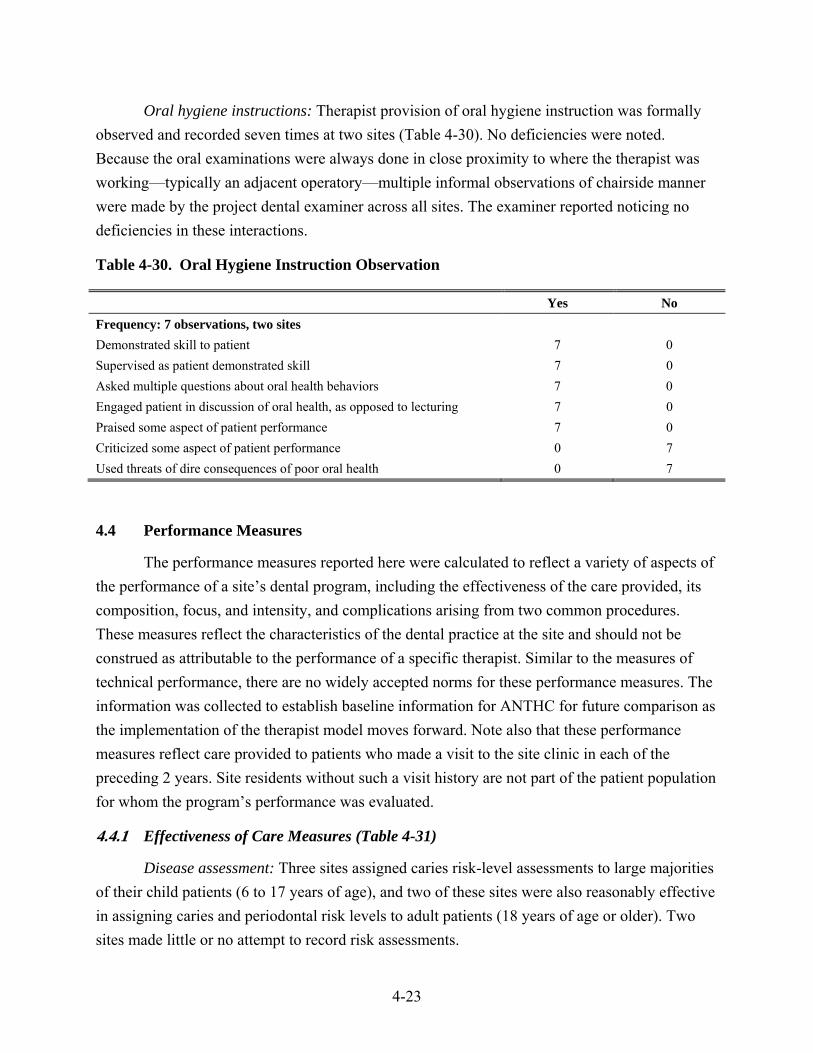
4-23
Oral hygiene instructions: Therapist provision of oral hygiene instruction was formally observed and recorded seven times at two sites (Table 4-30). No deficiencies were noted. Because the oral examinations were always done in close proximity to where the therapist was working—typically an adjacent operatory—multiple informal observations of chairside manner were made by the project dental examiner across all sites. The examiner reported noticing no deficiencies in these interactions.
Table 4-30. Oral Hygiene Instruction Observation
Yes No Frequency: 7 observations, two sites Demonstrated skill to patient 7 0 Supervised as patient demonstrated skill 7 0 Asked multiple questions about oral health behaviors 7 0 Engaged patient in discussion of oral health, as opposed to lecturing 7 0 Praised some aspect of patient performance 7 0 Criticized some aspect of patient performance 0 7 Used threats of dire consequences of poor oral health 0 7
4.4 Performance Measures
The performance measures reported here were calculated to reflect a variety of aspects of the performance of a site’s dental program, including the effectiveness of the care provided, its composition, focus, and intensity, and complications arising from two common procedures. These measures reflect the characteristics of the dental practice at the site and should not be construed as attributable to the performance of a specific therapist. Similar to the measures of technical performance, there are no widely accepted norms for these performance measures. The information was collected to establish baseline information for ANTHC for future comparison as the implementation of the therapist model moves forward. Note also that these performance measures reflect care provided to patients who made a visit to the site clinic in each of the preceding 2 years. Site residents without such a visit history are not part of the patient population for whom the program’s performance was evaluated.
4.4.1 Effectiveness of Care Measures (Table 4-31)
Disease assessment: Three sites assigned caries risk-level assessments to large majorities of their child patients (6 to 17 years of age), and two of these sites were also reasonably effective in assigning caries and periodontal risk levels to adult patients (18 years of age or older). Two sites made little or no attempt to record risk assessments.
4-24
Preventive treatment for high caries-risk individuals: Four sites were completely successful in providing preventive treatment to those children assigned as being at high caries risk, and the fifth provided this treatment for more than three-quarters of high-risk children. In two of the sites, however, the number of children assessed as being at high risk was extremely small.
Preventive treatment for low caries-risk individuals: Provision of caries preventive procedures to children assessed as being at low risk and those who were not assessed was not markedly different than for high-risk children, perhaps reflecting the fact that virtually all children exhibited some evidence of caries experience. A smaller proportion of low-risk and unassessed adults received preventive treatment.
New caries in high caries-risk individuals: In all but one site, a majority of high-risk children and adults experienced new caries in the year immediately preceding the record audit. It should be noted that this is a surrogate measure, with the incidence of caries presumed to be denoted by receipt of a restoration (Bader et al., 1999b).
New caries in low caries-risk individuals: Proportions of low risk and unassessed individuals who experienced new caries in the preceding year were generally lower than for high-risk individuals, but generally reflected new caries experienced by between one-sixth and one-half of all patients.
Preventive treatment for perio-present adults: Only two sites provided periodontal maintenance therapy for adults assessed as having periodontal disease, and neither site provided such treatment for a majority of these individuals. The receipt of treatment at two other sites was impossible to determine because no adults had been identified in the clinical record as having periodontal disease.
Tooth loss: No child at any site had a permanent tooth extraction in the previous year. At three sites, no adult experienced an extraction, while at the other two sites, 20% of adults lost one or more teeth in the previous year.
4.4.2 Use of Services Measures (Table 4-31)
Receipt of prophylaxis: At four sites, one-half or fewer children and adults received a prophylaxis in the previous year.
Preventive-to-restorative treatment ratio: For children, the overall ratio was 3.5 preventive procedures provided for every restorative procedure. The value ranged from 2.1 to 4.9
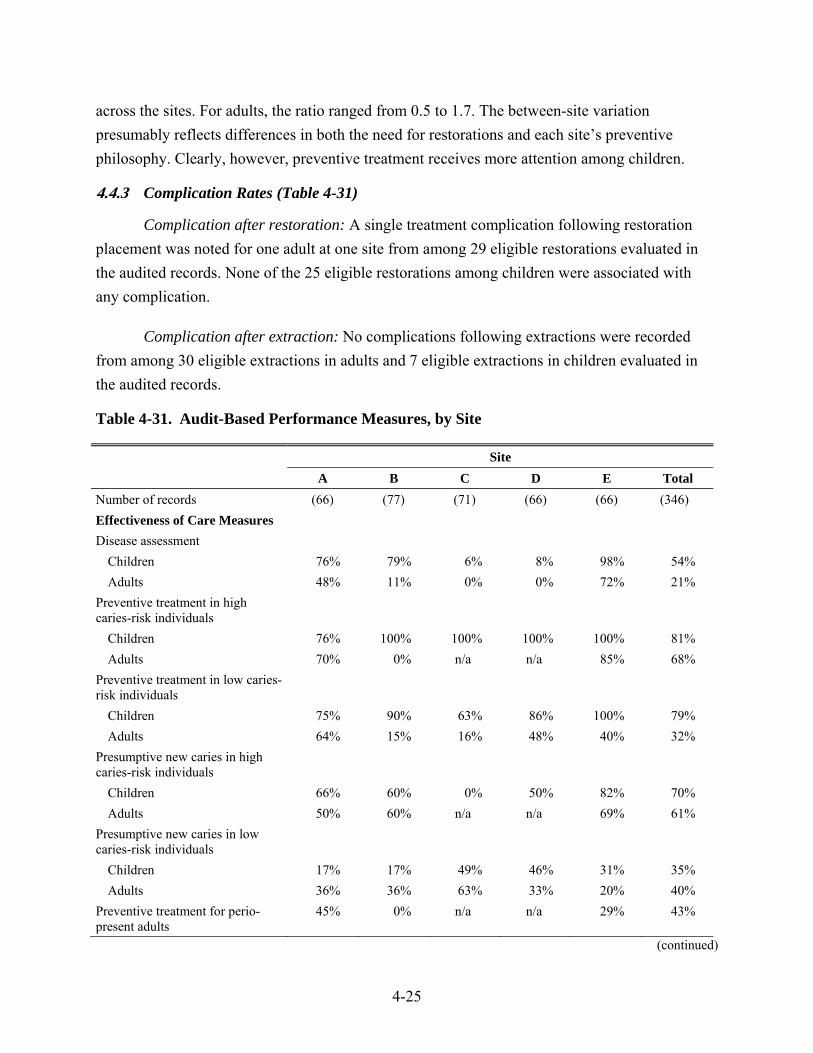
4-25
across the sites. For adults, the ratio ranged from 0.5 to 1.7. The between-site variation presumably reflects differences in both the need for restorations and each site’s preventive philosophy. Clearly, however, preventive treatment receives more attention among children.
4.4.3 Complication Rates (Table 4-31)
Complication after restoration: A single treatment complication following restoration placement was noted for one adult at one site from among 29 eligible restorations evaluated in the audited records. None of the 25 eligible restorations among children were associated with any complication.
Complication after extraction: No complications following extractions were recorded from among 30 eligible extractions in adults and 7 eligible extractions in children evaluated in the audited records.
Table 4-31. Audit-Based Performance Measures, by Site
Site A B C D E Total
Number of records (66) (77) (71) (66) (66) (346) Effectiveness of Care Measures
Disease assessment Children 76% 79% 6% 8% 98% 54% Adults 48% 11% 0% 0% 72% 21%
Preventive treatment in high caries-risk individuals
Children 76% 100% 100% 100% 100% 81% Adults 70% 0% n/a n/a 85% 68%
Preventive treatment in low caries-risk individuals
Children 75% 90% 63% 86% 100% 79% Adults 64% 15% 16% 48% 40% 32%
Presumptive new caries in high caries-risk individuals
Children 66% 60% 0% 50% 82% 70% Adults 50% 60% n/a n/a 69% 61%
Presumptive new caries in low caries-risk individuals
Children 17% 17% 49% 46% 31% 35% Adults 36% 36% 63% 33% 20% 40%
Preventive treatment for perio-present adults
45% 0% n/a n/a 29% 43%
(continued)
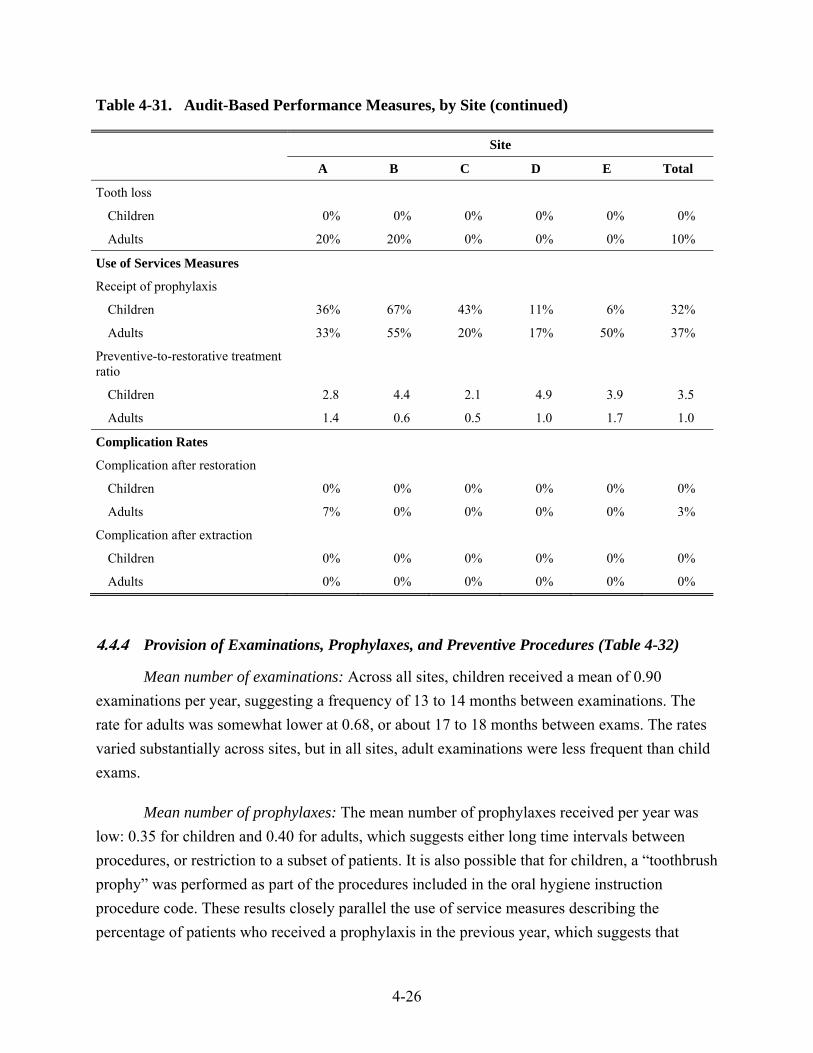
4-26
Table 4-31. Audit-Based Performance Measures, by Site (continued)
Site
A B C D E Total
Tooth loss
Children 0% 0% 0% 0% 0% 0%
Adults 20% 20% 0% 0% 0% 10%
Use of Services Measures
Receipt of prophylaxis
Children 36% 67% 43% 11% 6% 32%
Adults 33% 55% 20% 17% 50% 37%
Preventive-to-restorative treatment ratio
Children 2.8 4.4 2.1 4.9 3.9 3.5
Adults 1.4 0.6 0.5 1.0 1.7 1.0
Complication Rates
Complication after restoration
Children 0% 0% 0% 0% 0% 0%
Adults 7% 0% 0% 0% 0% 3%
Complication after extraction
Children 0% 0% 0% 0% 0% 0%
Adults 0% 0% 0% 0% 0% 0%
4.4.4 Provision of Examinations, Prophylaxes, and Preventive Procedures (Table 4-32)
Mean number of examinations: Across all sites, children received a mean of 0.90 examinations per year, suggesting a frequency of 13 to 14 months between examinations. The rate for adults was somewhat lower at 0.68, or about 17 to 18 months between exams. The rates varied substantially across sites, but in all sites, adult examinations were less frequent than child exams.
Mean number of prophylaxes: The mean number of prophylaxes received per year was low: 0.35 for children and 0.40 for adults, which suggests either long time intervals between procedures, or restriction to a subset of patients. It is also possible that for children, a “toothbrush prophy” was performed as part of the procedures included in the oral hygiene instruction procedure code. These results closely parallel the use of service measures describing the percentage of patients who received a prophylaxis in the previous year, which suggests that
4-27
infrequent rubber-cup prophylaxis was the general pattern. Again, there is substantial variation in provision rates across sites.
Mean number of fluoride treatments: Receipt of fluoride was more frequent than prophylaxis for both adults and children at all but one site. At that site, the rates were equal and low, suggesting that the two procedures were always provided together. At all other sites, the mean number of applications suggests a receipt frequency of twice a year or more, which is in keeping with ADA’s recent recommendation for fluoride applications for elevated caries risk patients (ADA, Council on Scientific Affairs, 2006).
Percentage receiving oral hygiene instruction: Two-thirds of children and slightly less than one-half of adults received oral hygiene instruction during the course of a year. For children, rates at two sites exceeded 90%, but the rate was 22% at another site. Variation was also present, but less extreme for adults, with the same sites displaying the highest and lowest rates.
Oral cancer examinations: Rates also varied widely across sites for oral cancer exam. The sites displaying the highest and lowest rates for this procedure were the same sites recording the highest and lowest rates for oral hygiene instruction. Overall, rates for oral cancer examinations were higher for children than for adults despite the fact that the incidence of oral cancer increases with increasing age. These overall rates for both children and adults exceeded goals set in Healthy People 2010 (U.S. Department of Health and Human Services, 2000).
4.4.5 Gingival Bleeding Assessment (Table 4-32)
Recording the presence/absence of gingival bleeding was infrequent. At two sites, no such notations appeared in patient records. At two sites, a little less than one-half of adult records had such a notation, with smaller percentages for child records. The remaining sites noted this assessment for one child record (2%).
4.4.6 Consultation (Table 4-32)
Consultations were noted at all but one site, generally involving less than 10% of patients seen. Of 21 consultations noted, 18 involved assistance with treatment decisions or implementation.
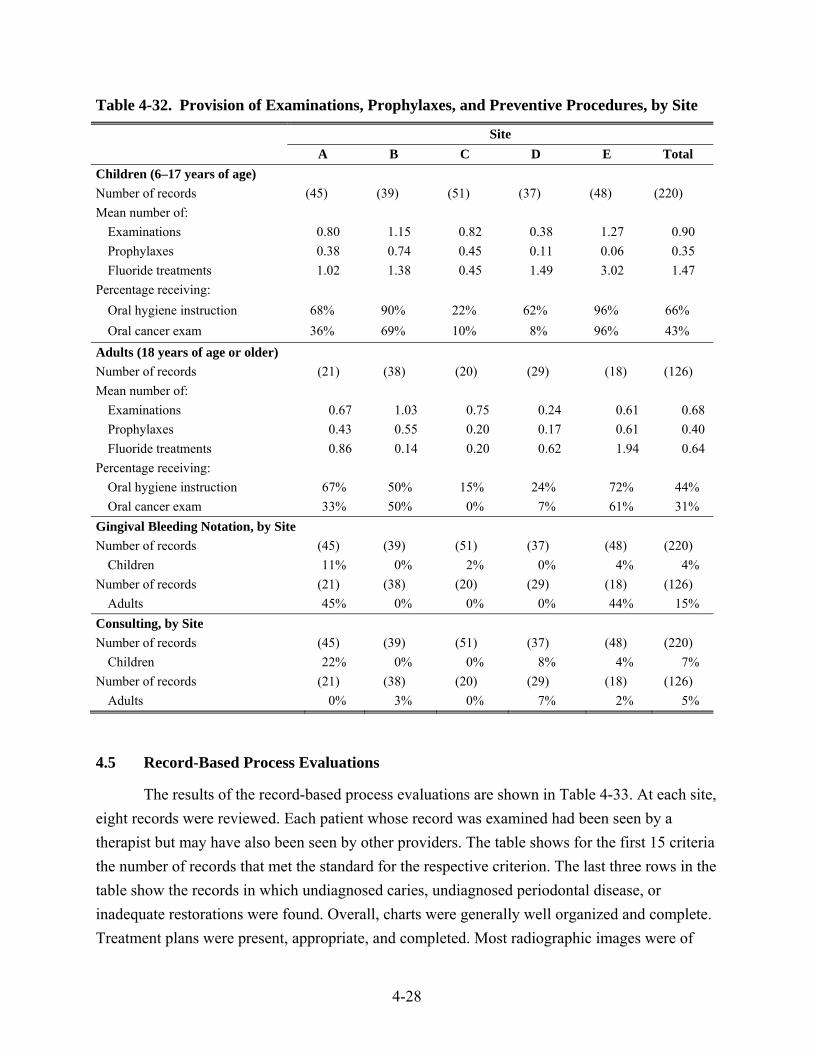
4-28
Table 4-32. Provision of Examinations, Prophylaxes, and Preventive Procedures, by Site
Site A B C D E Total
Children (6–17 years of age) Number of records (45) (39) (51) (37) (48) (220) Mean number of:
Examinations 0.80 1.15 0.82 0.38 1.27 0.90 Prophylaxes 0.38 0.74 0.45 0.11 0.06 0.35 Fluoride treatments 1.02 1.38 0.45 1.49 3.02 1.47
Percentage receiving: Oral hygiene instruction 68% 90% 22% 62% 96% 66% Oral cancer exam 36% 69% 10% 8% 96% 43%
Adults (18 years of age or older) Number of records (21) (38) (20) (29) (18) (126) Mean number of:
Examinations 0.67 1.03 0.75 0.24 0.61 0.68 Prophylaxes 0.43 0.55 0.20 0.17 0.61 0.40 Fluoride treatments 0.86 0.14 0.20 0.62 1.94 0.64
Percentage receiving: Oral hygiene instruction 67% 50% 15% 24% 72% 44% Oral cancer exam 33% 50% 0% 7% 61% 31%
Gingival Bleeding Notation, by Site Number of records (45) (39) (51) (37) (48) (220)
Children 11% 0% 2% 0% 4% 4% Number of records (21) (38) (20) (29) (18) (126)
Adults 45% 0% 0% 0% 44% 15% Consulting, by Site Number of records (45) (39) (51) (37) (48) (220)
Children 22% 0% 0% 8% 4% 7% Number of records (21) (38) (20) (29) (18) (126)
Adults 0% 3% 0% 7% 2% 5%
4.5 Record-Based Process Evaluations
The results of the record-based process evaluations are shown in Table 4-33. At each site, eight records were reviewed. Each patient whose record was examined had been seen by a therapist but may have also been seen by other providers. The table shows for the first 15 criteria the number of records that met the standard for the respective criterion. The last three rows in the table show the records in which undiagnosed caries, undiagnosed periodontal disease, or inadequate restorations were found. Overall, charts were generally well organized and complete. Treatment plans were present, appropriate, and completed. Most radiographic images were of
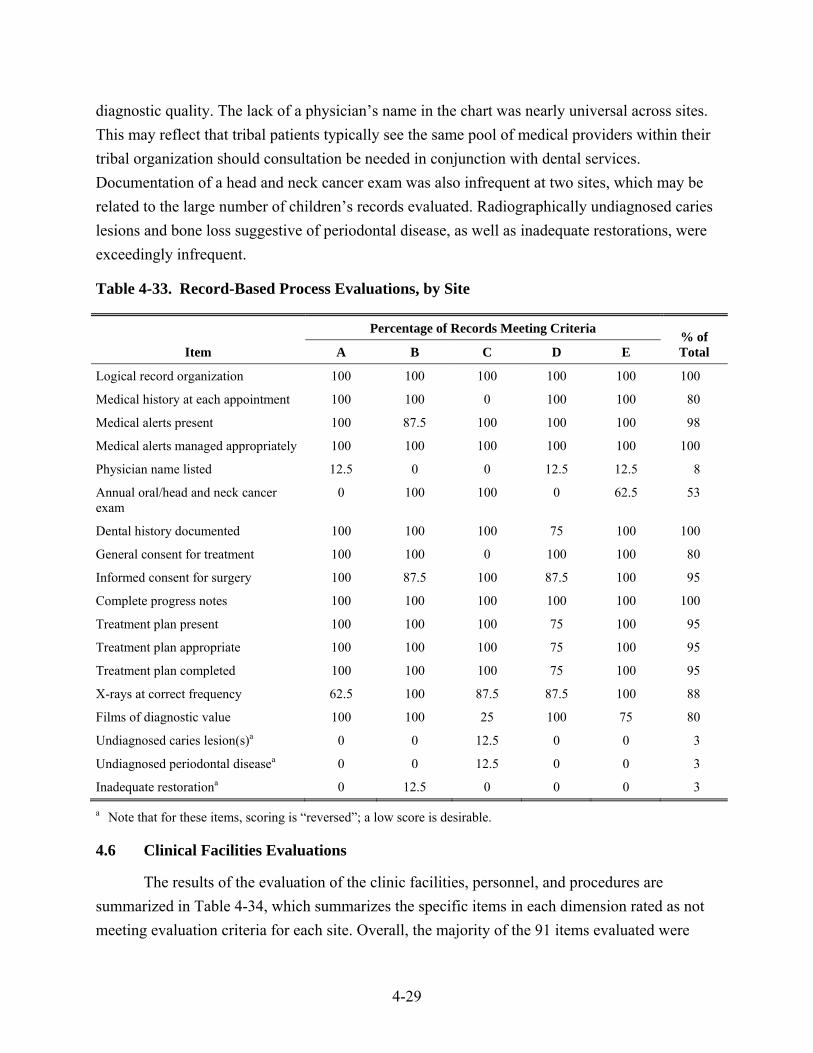
4-29
diagnostic quality. The lack of a physician’s name in the chart was nearly universal across sites. This may reflect that tribal patients typically see the same pool of medical providers within their tribal organization should consultation be needed in conjunction with dental services. Documentation of a head and neck cancer exam was also infrequent at two sites, which may be related to the large number of children’s records evaluated. Radiographically undiagnosed caries lesions and bone loss suggestive of periodontal disease, as well as inadequate restorations, were exceedingly infrequent.
Table 4-33. Record-Based Process Evaluations, by Site
Item
Percentage of Records Meeting Criteria % of Total A B C D E
Logical record organization 100 100 100 100 100 100
Medical history at each appointment 100 100 0 100 100 80
Medical alerts present 100 87.5 100 100 100 98
Medical alerts managed appropriately 100 100 100 100 100 100
Physician name listed 12.5 0 0 12.5 12.5 8
Annual oral/head and neck cancer exam
0 100 100 0 62.5 53
Dental history documented 100 100 100 75 100 100
General consent for treatment 100 100 0 100 100 80
Informed consent for surgery 100 87.5 100 87.5 100 95
Complete progress notes 100 100 100 100 100 100
Treatment plan present 100 100 100 75 100 95
Treatment plan appropriate 100 100 100 75 100 95
Treatment plan completed 100 100 100 75 100 95
X-rays at correct frequency 62.5 100 87.5 87.5 100 88
Films of diagnostic value 100 100 25 100 75 80
Undiagnosed caries lesion(s)a 0 0 12.5 0 0 3
Undiagnosed periodontal diseasea 0 0 12.5 0 0 3
Inadequate restorationa 0 12.5 0 0 0 3
a Note that for these items, scoring is “reversed”; a low score is desirable.
4.6 Clinical Facilities Evaluations
The results of the evaluation of the clinic facilities, personnel, and procedures are summarized in Table 4-34, which summarizes the specific items in each dimension rated as not meeting evaluation criteria for each site. Overall, the majority of the 91 items evaluated were
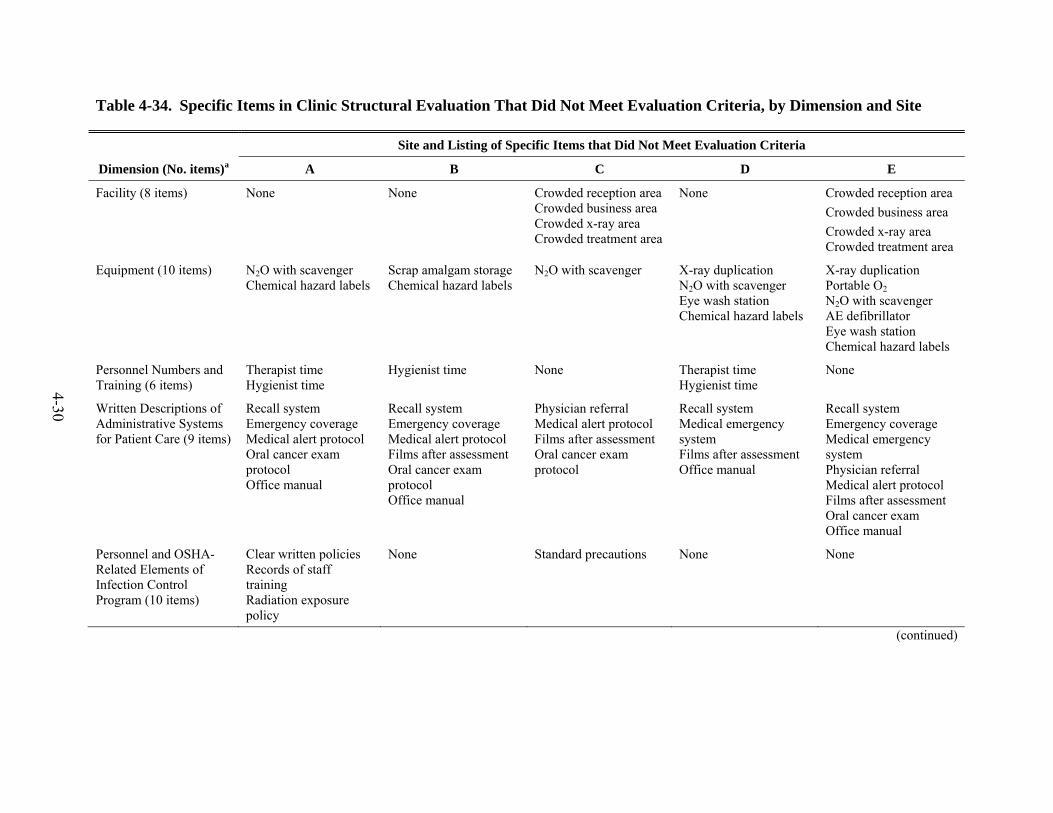
4-30
Table 4-34. Specific Items in Clinic Structural Evaluation That Did Not Meet Evaluation Criteria, by Dimension and Site
Site and Listing of Specific Items that Did Not Meet Evaluation Criteria
Dimension (No. items)a A B C D E
Facility (8 items) None None Crowded reception areaCrowded business area Crowded x-ray area Crowded treatment area
None Crowded reception area Crowded business area Crowded x-ray area Crowded treatment area
Equipment (10 items) N2O with scavenger Chemical hazard labels
Scrap amalgam storage Chemical hazard labels
N2O with scavenger
X-ray duplication N2O with scavenger Eye wash station Chemical hazard labels
X-ray duplication Portable O2 N2O with scavenger AE defibrillator Eye wash station Chemical hazard labels
Personnel Numbers and Training (6 items)
Therapist time Hygienist time
Hygienist time None Therapist time Hygienist time
None
Written Descriptions of Administrative Systems for Patient Care (9 items)
Recall system Emergency coverage Medical alert protocol Oral cancer exam protocol Office manual
Recall system Emergency coverage Medical alert protocol Films after assessment Oral cancer exam protocol Office manual
Physician referral Medical alert protocol Films after assessment Oral cancer exam protocol
Recall system Medical emergency system Films after assessment Office manual
Recall system Emergency coverage Medical emergency system Physician referral Medical alert protocol Films after assessment Oral cancer exam Office manual
Personnel and OSHA-Related Elements of Infection Control Program (10 items)
Clear written policies Records of staff training Radiation exposure policy
None Standard precautions None None
(continued)
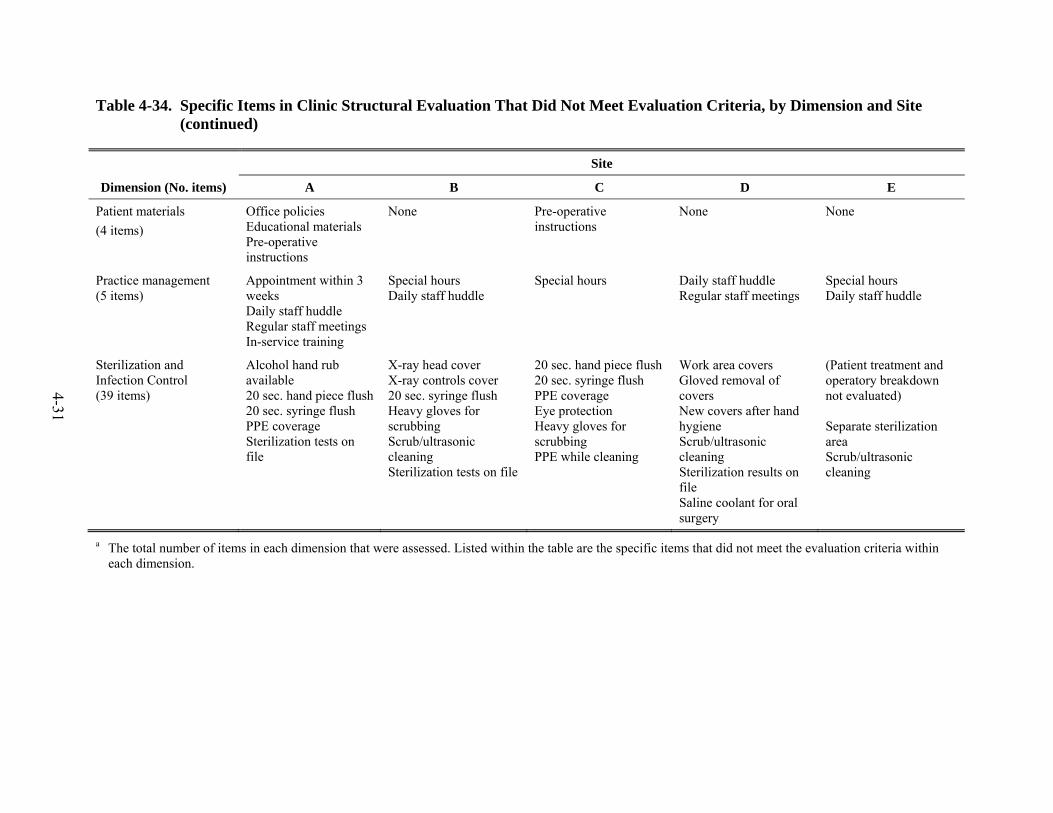
4-31
Table 4-34. Specific Items in Clinic Structural Evaluation That Did Not Meet Evaluation Criteria, by Dimension and Site (continued)
Site
Dimension (No. items) A B C D E
Patient materials (4 items)
Office policies Educational materials Pre-operative instructions
None Pre-operative instructions
None None
Practice management (5 items)
Appointment within 3 weeks Daily staff huddle Regular staff meetings In-service training
Special hours Daily staff huddle
Special hours Daily staff huddle Regular staff meetings
Special hours Daily staff huddle
Sterilization and Infection Control (39 items)
Alcohol hand rub available 20 sec. hand piece flush20 sec. syringe flush PPE coverage Sterilization tests on file
X-ray head cover X-ray controls cover 20 sec. syringe flush Heavy gloves for scrubbing Scrub/ultrasonic cleaning Sterilization tests on file
20 sec. hand piece flush20 sec. syringe flush PPE coverage Eye protection Heavy gloves for scrubbing PPE while cleaning
Work area covers Gloved removal of covers New covers after hand hygiene Scrub/ultrasonic cleaning Sterilization results on file Saline coolant for oral surgery
(Patient treatment and operatory breakdown not evaluated) Separate sterilization area Scrub/ultrasonic cleaning
a The total number of items in each dimension that were assessed. Listed within the table are the specific items that did not meet the evaluation criteria within each dimension.
4-32
deemed satisfactory across all sites. Unmet criteria were found most often in the facilities, equipment, administration (written descriptions of policies), and sterilization dimensions. Site E did not meet the criteria on 4 of 8 facilities items, 6 of 10 equipment items, and 8 of 9 administration items. Site B failed to meet the criteria in 2 of 10 equipment items, 6 out of 9 administration items, and 6 of 39 sterilization items. At Site C, 4 of 9 administration items were not met, and 6 of 39 sterilization items were not met. At Site A, 5 of 9 administrative items were not met, and 5 of the 39 sterilization items were not met. Site D failed to meet the items in 4 of the 9 administrative criteria and 6 of the 39 sterilization items.
4.7 Key Informant Interviews
4.7.1 Perspectives of Sponsoring Tribal Health Organizations
4.7.1.1 Decision to Participate in the DHAT Program
The decision to participate in the DHAT program ranged from early adopters—those in the two tribal organizations who sponsored the first cohort—to others who took a more reserved position. Two of the organizations that first sent students to New Zealand were “open to giving it a try right from the beginning.” They had every reason to be optimistic. One respondent said “[the program has] been used everywhere. There’s been success…why can’t we do that here?” This respondent admitted to having “no understanding of the political ramifications of this whole process.”
One respondent noted that he was not for “laying down new stuff. I see what works for others, what they’re doing and then if I like it, I adopt it.” Another dental director, although supportive of the DHAT concept, chose to wait on approaching his board for support of this novel program. His previous attempt to enhance orthodontic services, which required board approval and which did not turn out as positively as he had expected, made him hesitant to seek board approval until some time had elapsed. Other strong program proponents simply could not find qualified candidates, in part because the program launched on such short notice, as noted in Section 4.6.1.2.
A recurrent positive theme, particularly from the perspective of the boards of the tribal organizations and the dental directors, was that this program afforded a “real sense of empowerment in the community,” an opportunity to provide local workforce development while illustrating that “somebody from their community has been in training to a higher level and will be here for them.”
4-33
4.7.1.2 Recruitment Process
All respondents who were involved in the recruitment process noted that the key issue was to identify Alaska Natives, particularly those who were “of the community” and who would be willing return to their villages to practice as therapists. The intent was to have the therapists be “part of the fabric of the community,” and the belief was that selection of such individuals would ensure continuity of care. A key advantage was that the therapists would be able to “communicate in a culturally appropriate way to the patient” as well as to other members of the village.
The recruitment process varied across sites, but the dental directors, in describing potential candidates, “wanted a certain level of maturity and commitment to the principle of what…[they]…were trying to achieve.” One director insisted that potential candidates submit a resume as well as a narrative outlining why they should be selected. He wanted to find candidates that had “drive.” During one year, he was unable to find a suitable candidate for training. Although several of the candidates who went on to become practicing therapists in Alaska had experience in dentistry as dental assistants, others came from different backgrounds, including health education and outdoor construction (a common occupation in Alaska).
Challenges associated with the recruitment process included identifying suitable and motivated candidates and the short turnaround time for the process, particularly during the first year’s selection process. Several dentists pointed out that bureaucratic obstacles of the tribal health organizations hindered the process: “You can’t recruit for a position that isn’t funded, and the funding was still uncertain.” Nearly all of those responsible for recruitment felt that recruiting challenges will persist. A few indicated that it would be beneficial to become more systematic and start the process sooner.
4.7.1.3 Dental Philosophy of the DHAT Program
The philosophy of participating in the DHAT program was influenced by the expectations and needs of dental directors and their tribal organizations. For those who first sent students to New Zealand, the feeling was that it was a proven workforce model that could be employed in Alaska, particularly given their experience with the Community Health Aide Program.
Others took a more cautious approach (“putting our toes in the water”), but within a broader concept of “moving towards the medical model of treating caries, which basically has you treating tooth decay as a bacterial infection.” This respondent wanted his first therapist to be in a regional site where he could focus on “getting routine fillings taken care of, getting the holes

4-34
filled.” After that, they would “move the patients onto the next step with the antibacterial rinses, fluoride varnishes.”
Another dental director wanted his therapists to work exclusively in remote villages where he historically needed “somebody there all the time to work.” These sites typically had higher rates of disease, and the therapist was to become “their primary dental provider…to do the nuts and bolts like basic fillings, basic extractions.” This would free up the itinerant dentist to “see particular patients that…[have]…been identified first to see.” Thus, the dentist could travel to a village and perform “root canals on teeth that…[the therapist]… “accessed [did preliminary work to open the tooth for subsequent root canal procedure to relieve pain prior to root canal therapy performed by a dentist].” Not only was this a more efficient use of the dentist’s services, but this approach permitted an opportunity to save the teeth. This comported with the director’s belief that “if you keep offering extractions…you just keep the care in the very basic mode and you never get ahead. You increase the dental IQ when people want to retain their teeth.”
As a nuance of the “primary provider” model, the dental director in a tribal area with a large number of small, scattered villages—many with populations of less than 500—wants to eventually place a therapist in each of the subregional clinics where they would provide frontline restorative care. Within each of the other smaller villages within the service area of a particular subregional village, the director wants to train a village resident to serve as a Primary Dental Health Aide II, providing educational outreach as well as applying fluoride varnish and dental sealants. His concern is that “we lose these young kids somewhere between birth and entry into the Head Start program...” His vision is to provide village-based outreach to include pregnant women.
4.7.1.4 Placement of Therapists in Villages
The original intention of the DHAT program, in concert with the philosophy of the larger Community Health Aide Program, was to train persons who were from the community and who would return there. This factored into the recruitment process, with one dental director first identifying areas of need and then attempting to recruit candidates from those areas.
In general, the therapists were from their practice sites either because they were born and raised in the area or because of marriage or other familial association. In one instance, a tribal organization sponsored an Alaska Native who was from another distant part of Alaska.
An unanticipated barrier to placing the therapists is the chronic housing shortage in many villages in rural Alaska. In one instance, this shortage caused a delay in deploying the therapist to
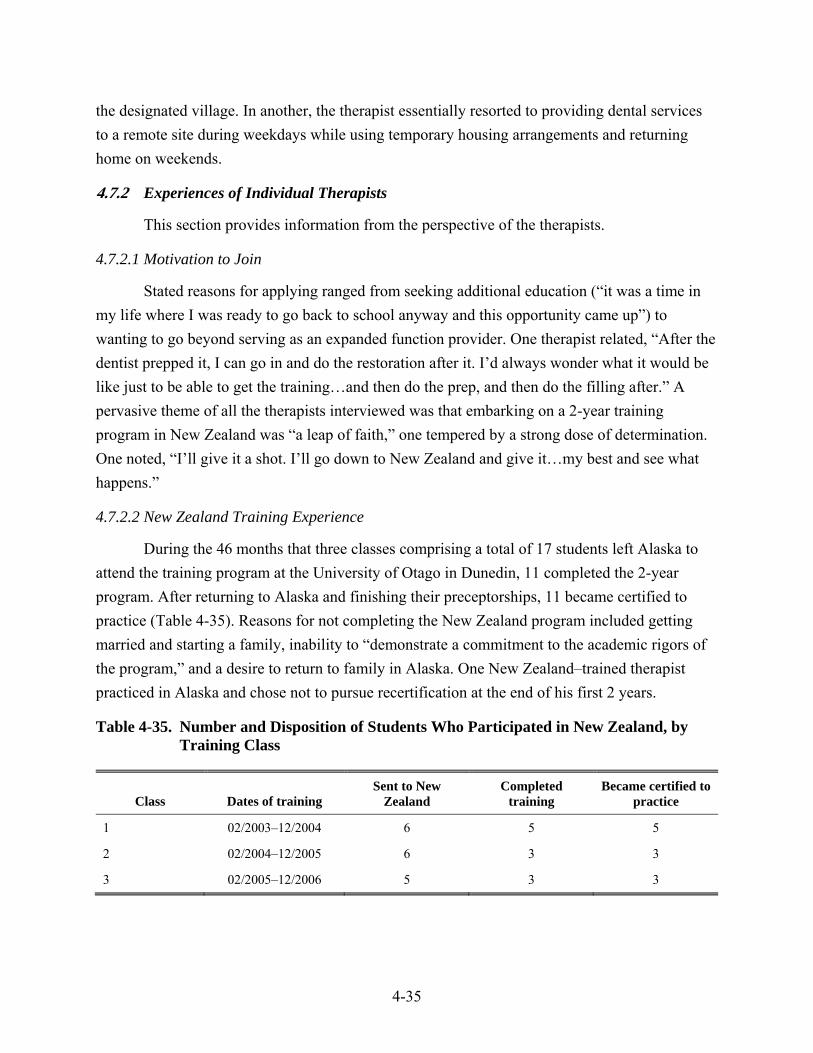
4-35
the designated village. In another, the therapist essentially resorted to providing dental services to a remote site during weekdays while using temporary housing arrangements and returning home on weekends.
4.7.2 Experiences of Individual Therapists
This section provides information from the perspective of the therapists.
4.7.2.1 Motivation to Join
Stated reasons for applying ranged from seeking additional education (“it was a time in my life where I was ready to go back to school anyway and this opportunity came up”) to wanting to go beyond serving as an expanded function provider. One therapist related, “After the dentist prepped it, I can go in and do the restoration after it. I’d always wonder what it would be like just to be able to get the training…and then do the prep, and then do the filling after.” A pervasive theme of all the therapists interviewed was that embarking on a 2-year training program in New Zealand was “a leap of faith,” one tempered by a strong dose of determination. One noted, “I’ll give it a shot. I’ll go down to New Zealand and give it…my best and see what happens.”
4.7.2.2 New Zealand Training Experience
During the 46 months that three classes comprising a total of 17 students left Alaska to attend the training program at the University of Otago in Dunedin, 11 completed the 2-year program. After returning to Alaska and finishing their preceptorships, 11 became certified to practice (Table 4-35). Reasons for not completing the New Zealand program included getting married and starting a family, inability to “demonstrate a commitment to the academic rigors of the program,” and a desire to return to family in Alaska. One New Zealand–trained therapist practiced in Alaska and chose not to pursue recertification at the end of his first 2 years.
Table 4-35. Number and Disposition of Students Who Participated in New Zealand, by Training Class
Class Dates of training Sent to New
Zealand Completed
training Became certified to
practice
1 02/2003–12/2004 6 5 5
2 02/2004–12/2005 6 3 3
3 02/2005–12/2006 5 3 3
4-36
The New Zealand training experience was challenging—logistically, culturally, and scholastically. This was particularly true with the first cohort, which was assembled in a very short period of time, but it was challenging for all of the students. One said, “We had to adjust a lot because I brought three of my children and my [spouse]. Basically moving a family of five to New Zealand has a lot more headaches and worries.” Another noted, “the first year was really hard for me because when I left [for New Zealand], my son was 8 days old.” A third gave birth in New Zealand to a healthy child, whom she affectionately dubbed, “My Es-Kiwi-mo.”
On the cultural front, several of the therapists pointed out the difficulty in understanding New Zealanders and the need to “adjust to their accent. They speak a lot faster.” One noted that in listening to New Zealanders they would have benefitted from “subtitles.” Another of the respondents described his initial ride into Dunedin with a sense of shock by saying, “There’s nothing but sheep and green fields all the way into town. I’ve never seen that many sheep in my life.” With a sense of resilience, he noted, “I just got used to eating pies and their language.”
The training experience began abruptly. “All of a sudden, when we started all the classes, everything was given to us. We were having to write papers and having to do lectures.” However, as one trainee pointed out, “their practical courses were really challenging and fun.” When first seeing patients, they began with oral examinations and prophylaxis, and then progressed to “alloys and composites, both complex and simple.” The “crown pulpotomies and extractions…were last.”
4.7.2.3 Preceptorship in Alaska
Although the program required that each returning therapist complete 400 hours of preceptorship under direct supervision of a dentist, in reality the length of the preceptorships was longer, particularly with the first cohort of students. A supervisory dentist said, “I didn’t know what to expect and it was my license on the line.” All of the supervisory dentists interviewed said they were comfortable with the technical competency of the therapists when they left to assume their positions under general supervision in villages or subregional clinics. A recurring theme, expressed by supervisory dentists and by the therapists, was that the dental disease experienced in Alaska was more severe than that seen in New Zealand. Nearly all attributed this to the nature of the New Zealand program—a well-established, longstanding, school-based program. In Alaska, there was greater unmet need and greater emphasis on adults. One preceptor pointed out that the therapists trained in New Zealand had less exposure to “larger amalgam restorations” and “stainless steel crown preps and pulpotomies on the baby teeth.” She pointed out that these
4-37
were areas that needed training emphasis when the therapists returned for their preceptorships in Alaska.
4.7.2.4 Scope of Practice
The scope of practice is explicitly delimited in the Standards and Procedures of the Certification Board of the Community Health Aide Program. All of the therapists and all of the dentists who supervised therapists indicated that therapists were very conscientious of the importance of staying within the prescribed scope of practice. One supervisory dentist said, “This was such a new program, and under such scrutiny, that everyone was very conservative.”
Work experiences varied across DHAT practice sites, due to the underlying needs of patients, available resources, and the program’s philosophy. Dispensing of medication by therapists had the most significant variation across sites. This was in part a function of how the supervisory dentist interpreted the Standards. In one locale the therapist relied on the dispensing authority of an onsite nurse practitioner or other medical provider. In another location, the supervisory dentist authorized the therapist to dispense, without supervisory consultation, non-narcotic prescriptions (e.g., ibuprofen) on the basis of the authority to provide pain relief, but administering other medications (e.g., acetaminophen with codeine) required direct consultation and approval by the supervisory dentist.
4.7.2.5 Supervisory Practices
Supervisory practices also varied across sites. Frequent, usually daily, contact characterized supervisory practices when therapists were first deployed. Typically, the therapist would begin the day with a phone call or e-mail to the supervisory dentist to review the upcoming schedule of patients. In some locales this continues to be the practice. In others, as the therapist and dentist became more comfortable with the therapist’s judgment and experience, the therapist would consult with the supervisor on an as-needed basis.
Means of communication varied across sites. In one setting where electronic dental records were available system-wide in all of the practice sites (including small villages), the therapist could consult with the supervisor, sharing both dental records and radiographs. In others, the therapist used the intraoral camera probe to send video images via the telemedicine system that links the remote clinic with the regional clinic. A third way was to send a digital x-ray via e-mail.
All of the therapists said that supervisory dentists were always available for consultation, regardless of the time or day of week.

4-38
4.7.2.6 Work Experience
The work experience varied across the five sites.9 The therapist assigned to a hospital clinic in Site A worked alongside full-time dentists. Patients were scheduled for him on a regular, 1-hour basis.10 The clinic operated from 9 a.m. to 5 p.m., 5 days a week. The therapist who was assigned full time to a subregional village also had patients assigned at 1-hour intervals, but the volume was considerably less, primarily because of broken appointments, which approached 50% according to her supervisory dentist. In the two sites where we observed therapists working on an itinerant basis, the therapists typically arrived on Monday morning and worked all week, from 8 a.m. to 8 p.m. There were broken appointments, but not nearly as many as in the other clinics we observed. All of the therapists were available for after hours emergency care, but this was a very infrequent occurrence.
The problem of broken appointments is not specific to the DHAT program; it is a system-wide issue and has multiple causes. Often a patient would schedule an appointment with one of the itinerant therapists (or a dentist) because of a toothache. When the itinerant therapist arrived the following week, the patient’s tooth no longer hurt, so he did not see the need to keep his appointment. In the villages where the therapist was stationed full time, the therapists reported that this availability appeared to make the patients complacent about keeping their appointments. Another factor that influenced clinic volume was the length of time each therapist had been practicing in the village. When one therapist first started going to a village 1 week per month 3 years ago, there were 16 pages of patients who needed treatment; by the time of our site visit, the number of pages had been reduced to four. One of the therapists did not have a chairside assistant and had to perform these functions as well. This therapist, located in a small village, could not find a local resident who was interested in the job, nor could the regional clinic support her. As a result, care was provided for emergency walk-ins only. Lastly, several dentists complained that in many sites there had been inadequate development of a system for identifying other patients available to be seen when appointments are missed or cancelled.
All of the therapists interviewed had positive feelings about their job experiences. They felt gratified that they could provide needed services for their villages. Several said that they liked having the opportunity to serve their people.
9 We observed clinic operations in four the five sites; in the fifth, the DHAT was on medical leave and not working. 10 The standard across all sites was 1-hour per DHAT appointment.

4-39
4.7.2.7 Relationships of Therapists with Dentists, Other Staff, the School System, and Others
All of the dentists interviewed reported having good, professional relationships with the therapists. They felt that all of the therapists’ work was technically competent. Because Alaska still uses many locum tenens dentists from the lower 48 states, the therapists encountered many dentists who may not have been familiar with their program. We heard of no complaints from these dentists, except one, a relatively recent dental graduate, who felt the therapists’ technical skills were adequate but that the therapist did not have the same sense of “diagnosis or etiology” he expected.
Relationships with other dental and medical clinic staff were also positive. One therapist reported having some tense moments with one of his chairside assistants in the first few weeks following his arrival, but he was soon able to develop a productive working relationship with the assistant. Several others also related that some of the community health aides resented the therapists because of their higher salary and status, but none of the community health aides we interviewed conveyed this to us. All of the medical staff—including two nurse practitioners—were very supportive of having the therapists available, because this meant they could refer patients with toothaches and other dental problems to them.
Relations with the school system varied. In several villages where there is a lot of outreach activity, the bonds were strong. In some villages, school staff were more concerned about any incursions on classroom time, and thus were less receptive.
4.7.2.8 Perceptions of Village Residents
The perceptions of the majority of village residents about the DHAT program were positive. The most commonly repeated theme was that the therapist serves as a role model, as someone who is improving himself while contributing to the community. As one therapist related, “A lot of the kids call me auntie and want to hug me…When they see me at the ball game and if they’re drinking a can of soda, they’re…trying to hide it or their candy.”
Being from the community provides village residents with continuity of care from someone who is from their culture. One therapist related that the patients feel more comfortable with her because she is a Native. She has a “few older women who request” her, even though a male dentist was available. “They’d call and make appointments with me or…come by the office at the beginning of the month and say, ‘I want that lady dentist.’ They always referred to me as the lady dentist.”
4-40
Many of the village residents appreciated having the therapist so that their dental problems can be addressed more quickly. As one woman related, “You don't have to go to Bethel or out of town to get your teeth worked on. Sometimes when the dentist finally comes out, not everybody could see him….If you go to Bethel or to Anchorage, it's months ahead of time that you have to make appointment. You don't know when you have a toothache, you have to wait for the dentist to come out or wait.”
We were told by two respondents of a few patients who refused to be seen by the therapist. They would rather go to Anchorage or elsewhere for care from a dentist. One respondent said, “I think some people really like [the DHAT program] and other people are very skeptical because there's no dentist.” An administrator stated, “I think there has been among…some individuals, some apprehension of not going to see a real dentist….But those are a minority of the patients.” He thought that the proportion of patients who do not want to be seen by a therapist “will continue to decrease as [the therapist’s] reputation and his patient population increases.” One dentist said, “It’s a little bit of an education process for the patients, educating them as to what the scope of service that the therapists can do.”
4.7.2.9 Therapist Retention
Upon completing the 2-year training program, the therapist is expected to serve in the sponsoring tribal health corporation for 4 years. A total of 11 participants completed the New Zealand training and became certified as therapists by the Community Health Aide Certification Board. Of the five in the first cohort, four completed their 4-year term in January 2009, and one chose not to seek recertification after the first 2 years of work as a therapist. All four who completed their terms in the first cohort continue in dental therapy practice. Three of these therapists have changed positions; one moved to live closer to family, one moved to get additional opportunities practicing in another tribal organization, and one assumed an administrative position (with part-time therapist work) at a regional clinic. Two of the therapists who left their original villages cited the need for better schools for their children as the reason for relocation.
The three certified therapists in the second cohort completed their term in January 2010. In this cohort, one continues at the original assignment, one continues to serve the villages of the original assignment but now does so by commuting on a weekly basis from a larger city, and the third is currently not working. The three therapists in the third cohort continue to work within their sponsoring tribal health organizations.
4-41
4.7.3 Community Context
Community characteristics of each of the five sites were unique and varied across several parameters. Site A is a commercially developed town that relies heavily on the tourist trade and is different from the other four, which are basically small bush towns in western Alaska. This section focuses primarily on these other four.
4.7.3.1 Diet
There are persons in each of the villages who continue to live a subsistence lifestyle, hunting moose, caribou, and sea mammals, and gathering berries and greens. Although healthy, subsistence living is very time consuming. Most respondents noted that there have been gradual changes in the diet over the past 20 to 30 years, with greater reliance on processed foods. One teacher said that children would “rather eat what they see on TV, like pizza and all that stuff,” which was hard for her to fathom because she “grew up eating Native food.”
Each of the villages had one or two small stores where food could be purchased. Fresh vegetables were available on a limited basis. Food is expensive: a gallon of milk is $9.00. An 8 oz bottle of water is $2.50, which is more expensive than soda pop. Most of the soda pop is non-diet. There is a prominent aisle that displays candy at the three- to-four-foot eye level.
In one of the villages, there are two restaurants; there were no restaurants in the other three. In one of the villages, several residents operate candy stores in the front rooms of their houses; all they sell is candy and soda pop.
4.7.3.2 Economy
The economic base of the four villages varied. One had a fish processing plant, the offices of the school district, and a tribal development authority. Another village had two fish processing plants. In the other two, the school system, the local store, and the local airport were the primary permanent employers.
4.7.3.3 Transportation
Closely linked to diet and economy is transportation. Two of the villages had nonstop service with Anchorage, which contributed significantly to the availability of certain foods, particularly fresh vegetables. Such a service also made it less expensive for families to travel to Anchorage periodically to stock up on provisions. If the village was two stops from Anchorage, the second leg was typically on a small prop plane that also ferried in goods. A therapist on the way to a remote village site repeatedly became frustrated because she “was sitting on one side of the plane and the other side of the plane, there was nothing but soda.”
4-42
4.7.3.4 Environmental Health
After the Hooper Bay incident in 1992, in which a resident died and others became ill from acute fluoride poisoning, the number of municipal water systems in rural Alaska that used fluoridation declined. The incident was the result of operator error, compounded by inoperative water treatment process and flow controls. Among the five sites, only Site A’s water was fluoridated. One of the four villages recently fluoridated its water, but the water plant operator who was certified to operate a fluoridation system recently died. Trained and certified technicians are required for water fluoridation, and communities either cannot afford or cannot find a suitable operator locally, even if they want their water fluoridated.
One of the villages did not have indoor running water in individual homes; water can be obtained at a central location and carried to their homes. The effect of not having running water can be dramatic. As one therapist put it, “In the villages [that] do not have running water, their rate of decay is out of control…They just drink soda pop after soda pop after soda pop, that’s their drink.”
4.7.3.5 Oral Health Habits of Community
Multiple observers noted that the oral health habits, and oral health, differed across communities. A therapist who travels to several villages put it this way: “[This village], after going through all the villages in north and south, we’re rated fairly high with oral health. You don’t see as much decay as the other villages. There’s still decay [here] but…not as much as you would see in the other villages.”
Numerous respondents were queried to explain these differences, but no one was convinced that he or she had the comprehensive answer. One recurrent theme, however, was that there seemed differences in the value residents placed on their teeth. A therapist said, “I think in some of the villages, they’re maybe a little more lax as far as what’s important to them and what’s going on in their life. Sometimes their teeth don’t seem like the highest thing on their priority list.”
In a similar vein, one speculated that “I think a lot of it has to do with, they just take care of themselves. They have more respect for themselves. I think having the school district here, they just…take better care of themselves all around.” One dentist emphasized the importance of family support and parental involvement. He said, “your prevention efforts will be undermined [if oral health] is not important to the parent. [If they] don’t have any motivation; why would it be important for their kids?”
4-43
Finally, the care-seeking behavior may be different across villages, with less emphasis on prevention. One therapist said, “There are a lot of people out, even in this village that are afraid of the dentist. I don’t know what will change, because most of the time, they are so used to coming in when they have a toothache. They’re not used to coming in just for a cleaning and exam. That’s just…their perceptive of dental [services]…‛Oh, I don’t need to go because I don’t have a toothache. My teeth are fine.’”
4.7.4 Community Outreach and Prevention Programs
The program for a Diploma in Dental Therapy at the University of Otago concentrated on producing graduates who had the knowledge and skills “to work as dental therapists in the School Dental Service.” Because it was school-based and had been in operation for over 80 years, a premium was placed on prevention.
Similarly, the DHAT program in Alaska focused its community outreach and preventive services on working through the schools. These included both Head Start programs and the K–12 village schools. The therapists who performed these outreach programs focused on providing toothbrushes and teaching proper brushing technique. Several of the therapists in the smaller villages visited the schools on a daily basis, others on a weekly basis. In three of the smaller villages, the clinic was a few minutes’ walk from the school. Other efforts included weekly visits to provide fluoride rinses and interactive classroom sessions for dental education. Most of the therapists performed dental screenings at the beginning of each school year. In those villages where the therapist lived full time as a member of the community, he or she could reinforce educational messages when meeting residents at the local store or other gathering spot.
As noted above, school support for these preventive efforts varied across systems, but clearly tended to be stronger in villages where therapists resided full time. This was due to the opportunity to forge stronger relationships with school officials on the basis of continuity and community membership. Having the time to visit the schools on a frequent basis was also critical. When therapists visited villages on an itinerant basis and worked 12-hour days on restorative dentistry, they did not have the time to perform school-based prevention activities. One dentist said that when the dental teams go to a particular remote village, “they never do a school fluoride rinse because they’re too busy…They’ve got [dental patients] in [the clinic] all day long. They’re sick.”
School support for preventive activities derived from recognition of its potential benefits in a holistic sense. One therapist said, “I know that the parents, along with the teachers…know how important teeth are. They're more aware of what causes [decay] and how [to prevent it].

4-44
They understand that healthier teeth is a healthier child. If a child is having any toothaches, that affects everything, including the work. They realize the importance of healthy teeth, healthy child.”
A public health nurse pointed out the change in perspective: “There's been a lot more looking at the public health aspect of it, there's been a lot more education and school promotion and prevention activities than…before. I think that's a big focus. That seems to be…a big purpose.”
One elementary school teacher thought there might be a spillover effect from teaching the children. “Dental hygiene is a really good thing, because the kids are more aware of what bad teeth are or what causes bad teeth. [The therapist]…encourages the kids to refrain from drinking sodas or eating lots of stuff that's really high in sugar and stuff. She encourages the kids to brush twice a day, in the morning and before you go to bed. They become very aware. I'm sure they go home to their parents to tell them this is what I learned today about teeth, or about my mouth or whatever it might have been that they get to pass on to their siblings or to their grandmas and grandpas.”
5-1
SECTION 5 DISCUSSION
The overall purpose of this project was to evaluate the implementation of the DHAT workforce model by providing a comprehensive assessment of the use of a small number of therapists in Alaska. Although additional persons have been trained as therapists in a training program established in Alaska, our study was restricted to members of the initial three classes who were trained in New Zealand. Each of the five therapists for whom we conducted site visits worked for different tribal organizations and under somewhat different circumstances, which afforded the opportunity to examine how these circumstances may be influencing their practice. Specific parameters of focus included
patient satisfaction, oral health–related quality of life, and perceived access to care;
oral health status;
clinical technical performance and performance measures;
record-based process measures and evaluation of clinical facilities; and
implementation of community-based preventive plans and programs.
5.1 Level of Patient Satisfaction and Access to Care
Level of patient satisfaction derived from surveys was generally high and did not vary across sites or by age. Therapists were rated as explaining things clearly, listening carefully, and treating patients with courtesy and respect. As a system characteristic, therapists and other dental providers were rated as making patients feel comfortable and generally not keeping their patients waiting for more than 15 minutes. Qualitative interviews indicated that most respondents expressed pride that an Alaska Native had been trained to provide these dental services, with the therapists serving as positive role models for the children of the village, particularly in the two village sites where the therapists reside permanently (Sites B and E). Many of the patients did not make the distinction between therapists and dentists, although in one site that had previously had a full-time dentist there were reports of a few people who were unwilling to be seen by the therapist.
Key informant interviews are important to take into account as the DHAT model moves from initial implementation toward wider scale implementation to improve access to care. It is clear that the dentist supervisors set the philosophy on how the first therapists were deployed. For example, one dental director placed his therapists in remote villages with high disease rates
5-2
to take care of basic needs so that when he visited the village he could perform higher order procedures such as root canals. The supervisory dentists indicated that the preceptorship period and scope of practice for the procedures that therapists were permitted to perform were conscientiously followed and that the therapists stayed within their scope of practice. Although the ways that the dentists and the therapists communicated differed somewhat across sites, all of the therapists indicated that their supervisory dentists were always available for consultation regardless of the time or day of week. Village residents who were interviewed appreciated being able to have dental problems addressed more quickly rather than waiting months for appointments in larger regional communities or having to wait with a toothache until a dentist may come out to the village. Prevention practices, however, differed across sites. Support for prevention in the schools was stronger in villages where therapists resided full time, perhaps because they were able to develop stronger relationships with school officials. These factors become important to consider as ANTHC begins to widely deploy therapists throughout tribal locations to improve access to care.
In this study, we did not attempt to quantify changes in access to care, in part because the duration that the therapists had been practicing was brief and they were limited in number. Many persons from the villages reported that they felt access to care had improved, such that they could now make appointments locally rather than travelling to a larger facility in another city. Clearly, there were differences between those sites where the therapists resided permanently and where treatment was still provided on an itinerant basis. In the two sites served itinerantly (Sites C and D), the therapists worked 12-hour days for a week’s visit, constantly seeing patients with little time to do anything else.
At the same time, at sites where the therapist resided permanently, there were other issues that impacted provision of services. A large proportion of broken appointments undermined the effectiveness of the therapist, since that time could not be used to provide services. Some village residents appeared to take the therapist’s availability for granted by assuming that the provider would be available just as readily the following day. The sense, particularly among the older study participants, that one does not visit a dental provider unless there is a problem, such as a toothache, may have contributed to the number of broken appointments, since the appointment was no longer seen as necessary if the pain subsided. A further impediment was when a village-based therapist could not hire and train a local assistant; she was effectively reduced to providing only emergency care.
The dental surveys of community residents illustrate the continuing high levels of unmet need across all age groups, with high proportions of participants with untreated decay.
5-3
5.2 Clinical Technical Performance and Performance Measures
Using well-accepted criteria for selected clinical procedures, the therapists were directly observed performing sealant placement, composite and amalgam preparations and placements, stainless steel crown placement, and oral health instruction. The sample sizes for each of these procedures were limited, ranging from 1 to 15 procedures. Nevertheless, the proportion of procedures with deficiencies was small, 8% overall. Prior restorations were assessed by a trained observer who was “blinded,” or unaware whether a therapist or dentist had been the provider, and rates and types of deficiencies were similar for these providers. Potential biases, as we have noted, include an observer effect and time elapsed since restoration, although we restricted this study component to restorations done in the previous 2 years. Finally, from the record audits, complications following restorative procedures were extremely infrequent, and no post-extraction complications were noted. These data indicate that the therapists who were observed are technically competent to perform these procedures within their scope of practice. Previous studies of the care provided by therapists in other countries (Ambrose, Hord, & Simpson, 1977) as well as two previous smaller studies of the therapists in Alaska (Fiset, 2005) and (Bolin, 2008) found similar results.
Performance measures indicate that risk assessment is well integrated into some but not all dental programs of tribal health organizations. Formal risk assessment is currently being promoted in dental schools, but has not yet become universally accepted in dental practices (Riley et al., 2010; Young et al., 2007). Regardless of risk assessment programs, virtually all children received appropriate caries preventive treatment, and two-thirds of children received oral hygiene instruction. Despite this attention to prevention, a majority of high-risk children experienced new disease in the course of a year. However, extraction of permanent teeth among children was relatively infrequent, which may be an early sign of generational improvement in oral health. A longitudinal assessment of the prevalence of lesions and restorations in adolescents and young adults will be necessary to determine if such improvement is taking place. The community examinations reported here represent the baseline for such analyses.
Receipt of caries preventive treatment by adults was lower than for children. The provision of periodontal maintenance care to adults assessed as having periodontal disease was infrequent. Prophylaxes were also relatively infrequent, with less than half of adult and child patients receiving such treatments in the course of a year. It should be noted that, although this service is relatively common in U.S. dental practices, the caries preventive benefit of semiannual prophylaxis alone has not been demonstrated. Notation of gingival bleeding status was performed for less than one quarter of adults. However, this notation was apparently not part of

5-4
the New Zealand Dental Therapy training. Two factors may have some bearing on the low provision of routine prophylaxes and provision of periodontal maintenance. First, according to the current ANTHC DHAT Training Director, routine prophylaxes (e.g., using a rubber cup and prophy paste to clean teeth) is not encouraged because there is limited data to show this is effective preventive treatment. Second, it appears that the preventive philosophy differs among tribal health organizations, with more emphasis on prevention in some tribal health organizations than others. The preventive to restorative procedures ratio demonstrated that children receive more attention on prevention than do adults. Between a third and half of adults received oral cancer screening or oral hygiene instruction during a year. In sum, attention to caries prevention is reasonably thorough for children, but less so for adults. Periodontal disease in adults receives less attention despite its prevalence and may be a reflection of the importance placed on provision of care for caries vs. periodontal disease by the supervising dentist. We need to note that these are speculative explanations that will require additional data to confirm or refute.
5.3 Record-Based Process Measures and Clinical Facilities Evaluation
The procedural audits of the records of patients treated by the therapist were very positive. Between 80% to 100% of the records reviewed were well organized and complete with thorough progress notes. Medical histories were obtained and regularly updated. Nearly all records included written treatment plans that were judged to be appropriate given the clinical findings recorded in the chart. The frequency and diagnostic quality of the radiographs were routinely acceptable. There was almost no evidence of undiagnosed caries lesions, periodontal disease, or inadequate restorations based on a review of the radiographs. The only low scoring items were that the physician’s name was not written in the chart and that a notation of a head and neck exam being conducted was absent. The lack of a physician’s name is not surprising given that most of the residents may not have a regular physician. The relatively small number of records noting head and neck exams may be due to a failure to note that the exam was actually conducted or it may be an indication that the head and neck examination was not part of the routine oral examination.
In four of the five sites, the therapist operates within a modern medical clinic constructed during the past 20 years. The number of chairs ranging from one (Site C) to eight (Site A). In Site E, the clinic is located in a doublewide trailer with two chairs. The trailer also provides temporary housing for itinerant staff. The air compressor is located in an unheated area and has periodically malfunctioned.
5-5
The evaluation of clinic facilities, policies, and personnel assessed 91 specific items, and most of these were satisfactory across all sites. Unmet criteria were noted in facilities, equipment, written descriptions of policies, and sterilization dimensions. There are no published data on how private practices or clinics in the United States would compare with the results on these 91 specific items. Generally, when such deficiencies are noted, sites are given a period of time to correct them. One of the purposes of this aspect of the study was to provide ANTHC with information on which to base a quality improvement program; hence these measurements were undertaken.
5.4 Development and Implementation of Community-Based Prevention Programs
The fundamental factor on the success of implementing prevention programs was whether the therapist was living permanently in the particular village. As noted above, the itinerant therapists did not have the time to divert from addressing backlogged dental needs; in addition, because of the short duration of their visits, they had fewer opportunities to develop relationships, particularly with critical school personnel who may need to be educated about the importance of oral health.
On the other hand, in Sites B and E, the therapists had the time—and perhaps more interest—to devote to prevention programs: oral health instruction, tooth brushing, fluoride rinses in the schools, even reminding the children about good oral health habits when meeting them at the local store or at a community social event. Other community factors may be influencing acceptance of prevention programs as well, such as the economic vitality of the village and the educational level of residents.
Few of the villages we visited currently fluoridate their water. A number of villages in rural Alaska reportedly stopped fluoridating in the wake of the Hooper Bay incident in 1992. Water fluoridation systems require a water operator to have a higher level of training and certification; these qualified technicians may not be locally available or the village cannot afford to employ them. It’s unlikely that the therapist will be able to influence adoption of water fluoridation in a village unless he or she has a strong leadership role in that village.
5.5 Challenges Facing Implementation of a Tribal Organization’s DHAT Program
Although the preceding suggests that the therapists we evaluated are functioning in a safe and technologically adequate manner, and doing so within an appropriate patient care environment, certain program processes, as well as the large amount of unmet need across all sites, will continue to provide challenges to implementing a tribal organization’s DHAT program.
5-6
5.5.1 Recruitment and Retention
Recruitment may become more of an issue in the future, although the DHAT training program operated in Anchorage and Bethel continues to attract qualified candidates. Identifying motivated and qualified candidates has been challenging for some of the dental directors, particularly as they attempt to place therapists in some of the smaller villages. In designing the program, the organizers wanted to emulate the success of the Community Health Aide Program, in which each health aide serves in his or her village. This appears to be the most effective approach, although it can limit the pool of candidates, especially in some of the more remote sites. If the therapist is from the village, placement can be somewhat easier, particularly given the chronic housing shortage in rural Alaska. If the therapist is not from the village, there needs to be a level of trust and acceptance that can take considerable time and effort to develop.
The effectiveness of the DHAT program ultimately depended on the tribal organization’s ability to commit sufficient support for the therapist, including providing onsite housing and supervising dentists who support the workforce concept and other necessary personnel, such as chairside assistants, to enable the therapist to function. Identifying capable persons to be trained and serve as assistants is not limited to therapists; that is a system-wide problem, but one that may be exacerbated by the smaller pool of candidates in rural villages. The dental directors working for the organizations differ in their length of service at a particular institution, which may range from less than 1 year to over 25 years. They may differ in their familiarity with the DHAT concept and willingness to enable the therapist to operate within his or her scope of practice rather than be used as an assistant for a licensed dentist.
Retention (after their 4-year payback period) may be more successful when the therapist has family ties to the community where he or she is living. Two of the therapists, however, chose to leave their assigned villages because they wanted to have better educational opportunities for their children. This is not a problem that is specific to the DHAT program, but it is one that needs to be addressed openly when attempting to build a sustainable, village-based program. The difficulty of serving as a therapist, with some sort of mix of itinerant care and week-long trips away from their families, must also be acknowledged as a factor that may influence retention.
5.5.2 Matching of Resources to Service Needs
The dental directors who were interviewed for this study spend significant time trying to juggle service needs with available resources. Travel schedules for dental teams to visit remote sites are drawn up months in advance and must take into account village size, the oral health needs of the community, the availability of providers, and weather and other logistical factors.
5-7
Making the correct match will also influence where therapists are most efficiently deployed to their “home” villages. A high proportion of broken appointments is an inefficient use of resources. However, as we noted, broken appointments may be indicative of the longstanding behaviors and attitudes of community residents who will be resistant to change. Effecting change within the context of community norms is the most daunting challenge facing dental services and improvements in oral health in rural Alaska.
5.5.3 Community Context
The paramount factors in the community context of oral health are diet and adoption of personal oral health practices: brushing and flossing. The 2004 Alaska Traditional Diet Survey was conducted by the Alaska Native Epidemiology Center of the Alaska Native Health Board to document the quantity of subsistence foods consumed by residents of rural Alaska villages. Food frequency questionnaires were administered in five areas of Alaska, four of which include the tribal organizations that participated in the DHAT program evaluation. In all four areas, soda pop or other sugared drinks were the first or second most frequently consumed food item by quantity. Soda pop is ubiquitous in the villages, and frequently we witnessed cases of soda pop occupy most of the cargo space on the small planes that supply these villages. In all of the village sites we visited, soda pop was much more common and less expensive than bottled water.
The oral health habits of the villages varied across sites. In Site C, where the percentage of participants with untreated decay ranged from 85% to 100%, the project dental examiner was struck by the number of teenage girls he examined who had extensive anterior interproximal caries (decay between their front teeth). He predicted than many would be edentulous (have no teeth) by their early 20s. Site B was where the smallest proportion of participants had untreated decay (29% to 48%). We can only speculate as to what accounts for these differences, but there appeared to be a greater awareness of the importance of brushing and flossing among the parents in Site B. Socioeconomic factors also likely contribute, as Site B has a more vibrant commercial economy. With nonstop air service to Anchorage, the residents have opportunities to have a more varied diet. In Site B, the therapist is operating a school-based educational program that includes fluoride rinses. In Site C, there is very limited contact between the therapist and the school. The evaluation, however, was not designed to answer these questions. Nonetheless, these are powerful contextual influences that reflect social norms that will take substantial time to change before oral health improves.
5-8
5.6 Future Directions
Finally, as we pointed out in the introduction to this report, this endeavor has been merely the first step in what should be considered an ongoing effort to evaluate the provision of oral health services within the unique circumstances found in Alaska. Such an effort naturally brings to light a series of next steps that should be explored to enhance programmatic activities to improve the overall oral health of Alaska Natives as well as others in the United States who currently lack adequate access to appropriate care. These next steps fall into three categories: those that are particular to the current Alaska-based program; those that are relevant to the multiple models currently under development to provide alternative modes of dental care using non-traditional providers; and, lastly, those that reflect the current and prevailing model of care provision led by licensed practicing dentists.
First, in conducting baseline assessments of the oral health in five communities, we have laid a foundation for longitudinal assessment of changes in oral health as the DHAT program continues to function and mature. Future assessments need to take into consideration the fact that the DHAT program is only one component of a more comprehensive approach that includes a role for other dental health aides who are village-based and who can provide educational outreach. Moreover, this project was limited to studying those therapists who had been trained in New Zealand. Subsequent classes of therapists have been trained in facilities in Alaska by local staff. The DHAT program will benefit from a similar assessment of the Alaska-based training program and the performance of its graduate therapists. In any future assessments of the DHAT program, one of the key parameters worthy of examining will be changes in residents’ perceptions of the importance of oral health as a component of a healthy lifestyle.
Second, a variety of organizations are currently developing programs to train new “mid-level” dental providers in the United States. As we point out in the Framework for Program Evaluation in Public Health (Milstein & Wetterhall, 1999), it is essential that plans for conducting a program evaluation be integrated into the conception and implementation of any new program; an evaluation will not be nearly as useful if it is simply tacked on as an afterthought once a program is already underway. Each of these alternative models for mid-level providers currently under consideration needs to be vigorously evaluated; the evaluation is an essential undertaking that should be a critical component included in the planning and implementation of these programs.
Finally, we have pointed out the lack of published data available to serve as valid sources for comparison to assess the technical competence and practice procedures of those in the DHAT

5-9
program. We have very little information about these qualities and characteristics from the practice settings in which the majority of private dentists in this country currently operate. To fill this void in knowledge, a random of sample of practicing dentists could be selected and recruited to participate in a study that employs methods similar to those used in this evaluation. A broad spectrum of key stakeholders could serve as scientific advisors to the project. Using external, objective observers, such a study could assess the clinical technical performance; performance measures; and clinic facilities, policies, and personnel of each participating practice. Such a study would be most illuminating and would inform many of the policy debates that are currently underway.
6-1
SECTION 6 CONCLUSIONS
In summary, the various indicators that were applied in this study to evaluate implementation of this program demonstrate that the therapists are performing well and operating safely within their scope of practice. Those who initially conceived of implementing a dental therapist program in Alaska recognized the magnitude of unmet need. They planned to use the therapists strategically deployed to the larger villages (those with populations of 800 or more) to address the considerable unmet need for restorative care. It was expected that the therapists when first deployed to a village would place their major emphasis on relieving pain from dental caries as a first line approach. All of the patient care data indicate that the therapists are practicing in this manner under the general supervision of the dentists to whom they are assigned and within a set scope of practice in compliance with the Community Health Aide Program Certification Standards and Procedures. The therapists included in this study are well accepted in the villages and serve as role models. As the burden of acute oral disease is brought under control, the second prong of this approach was to begin implementing preventive measures—including education—through the school system by village-based therapists. There are early indications that this model—implemented by resident therapists who have a well-respected role in the community—can begin to permit therapists to focus part of their efforts on preventive services. Such measures are needed as there continues to be substantial dental disease; and especially troublesome is the fact that many of the younger individuals are moving in the same trajectory as the adults seen in this study. Effecting change will take significant alterations in the oral health attitudes and behavior of Alaska Natives, and this will likely take years to accomplish. The therapists’ cultural awareness and credibility in the villages can help shape changes in behaviors.

7-1
SECTION 7 REFERENCES
Agency for Healthcare Research and Quality (2007). CAHPS dental plan survey. Rockville MD.
Retrieved from https://www.cahps.ahrq.gov/content/products/Dental/PROD_Dental_Intro.asp?p=1021&s=214.
Alaska Department of Health and Social Services Oral Health Program. (2007) Alaska oral health basic screening survey. Retrieved from http://www.hss.state.ak.us/dph/wcfh/Oralhealth/docs/2007_OralHealth_Children.pdf.
Alaska Division of Community and Regional Affairs. (2010) Alaska Community Database Community Information Summaries (CIS). Retrieved from http://www.commerce.state.ak.us/dca/commdb/CF_CIS.htm.
Ambrose, E. R., Hord, A. B., Simpson, W. J. (1977). A quality evaluation of specific dental services provided by the Saskatchewan dental plan: final report. Regina, Saskatchewan: Province of Saskatchewan Department of Health.
American Dental Association (2005). ADA position on the Dental Health Aide Program in Alaska. Retrieved from http://www.ada.org/sections/about/pdfs/position_dentalaide_alaska.pdf.
American Dental Association Council on Scientific Affairs. (2006). Professionally applied topical fluoride: Evidence-based clinical recommendations. Journal of the American Dental Association, 137(8), 1151–1159.
Alaska Native Tribal Health Consortium (ANTHC) (2008). Retrieved from http://www.anthc.org/.
Bader, J. D. (2009). Challenges in quality assessment of dental care. Journal of American Dental Association, 140, 1456–1464.
Bader, J., Shugars, D., White, B., & Rindal, D. (1999a). Development of effectiveness of care and use of services measures for dental care plans. Journal of Public Health Dentistry, 59, 142–149.
Bader, J., Shugars, D., White, B., & Rindal, D. (1999b). Evaluation of audit-based performance measures for dental care plans. Journal of Public Health Dentistry, 59, 150–157.
Bolin, K. A. (2008). Assessment of treatment provided by dental health aide therapists in Alaska. Journal of American Dental Association, 139, 1530–1539.
Bornstein, T. (2009). Crisis in access to dental care. Unpublished manuscript.
7-2
Council of Interstate Testing Agencies, Inc. (2010). Patient-based candidate examination manual. Retrieved from http://www.citaexam.com.
Fiset, L. (2005). A report on quality assessment of primary care provided by dental therapists to Alaska Natives. Seattle, WA: University of Washington School of Dentistry.
Fortuine, R. (2006). A century of adventure in northern health. PHS Commissioned Officers Association for the Advancement of Public Health, Landover, MD.
Harrison, T. J. (1965). Training for village health aides in the Kotzebue area of Alaska. Public Health Reports, 80, 565–572.
Hyde, S., Satariano, W. A., & Weintraub, J. A. (2006). Welfare dental intervention improves employment and quality of life. Journal of Dental Research, 85, 79–84.
Indian Health Service (2002). An oral health survey of American Indian and Alaska Native dental patients: Findings, regional differences, and national comparisons. Rockville, MD: Department of Health and Human Services, Indian Health Services, Division of Dental Services. Retrieved from http://www.dentist.ihs.gov/downloads/Oral_Health_1999_IHS_Survey.pdf.
Kunitz, S. J. (1996). The history and politics of U.S. health care policy for American Indians and Alaskan Natives. American Journal of Public Health, 86,1464–1473.
Locker, D., Jokovic, A., Stephens, M., Kenny, D., Tompson, B., & Guyatt, G. (2002). Family impact of child oral and oro-facial conditions. Community Dentistry and Oral Epidemiology, 30, 438–448.
Milstein, R. L., & Wetterhall, S. F. (1999). Framework for program evaluation in public health. Morbidity and Mortality Weekly Report, 48(RR-11), 1–40.
Morris, A. L, Bentley, J. M., & Vito, A. A. (1987). Training and calibrating evaluators for a national private dental office assessment program. Journal of Public Health Dentistry, 47, 165–171.
Nash, D. A. (2004). Developing a pediatric oral health therapist to help address oral health disparities among children. Journal of Dental Education, 68, 8–20.
Nash, D. A., & Nagel, R. J. (2005). Confronting oral health disparities among American Indian/Alaska Native Children: The pediatric oral health therapist. American Journal of Public Health, 95, 1325–1329.
Nash, D. A., Friedman, J. W., Kardos, T. B., Kardos, R. L., Schwarz, E., Satur, J., et al. (2008). Dental therapists: A global perspective. International Dental Journal, 58(2), 61–70.
Pahel, B. T., Rozier, R. G., & Slade, G. D. (2007). Parental perceptions of children’s oral health: The Early Child Oral Health Impact Scale (ECOHIS). Health and Quality of Life Outcomes, 5, 6.
7-3
Riley, J. L., III, Qvist, V., Fellows, J. L., Rindal, D. B., Richman, J. S., Gilbert, G. H., et al. (2010). DPBRN Collaborative Group. Dentists' use of caries risk assessment in children: Findings from the Dental Practice-Based Research Network. General Dentistry, 58(3), 230–234.
Sanders, A. E., Slade, G. D., Lim, S., & Reisine, S. T. (2009). Impact of oral disease on quality of life in the U.S. and Australian populations. Community Dentistry and Oral Epidemiology, 37(2), 171–181.
Slade, G. D. (1997). Derivation and validation of a short-form oral health impact profile. Community Dental and Oral Epidemiology, 25, 284–290.
Slade, G. D., Nuttall, N., Sanders, A. E., Steele, J. G., Allen, P. F., & Lahti, S. (2005). Impacts of oral disorders in the United Kingdom and Australia. British Dental Journal, 198, 489–493.
Smith, E. B. (2007). Dental therapists in Alaska: Addressing unmet needs and reviving competition in dental care. Alaska Law Review, 24, 105–143.
U.S. Department of Health and Human Services. (2000). Healthy People 2010: Understanding and Improving Health. 2nd ed. Volume II. Washington, DC: U.S. Government Printing Office. Retrieved from http://www.healthypeople.gov/Document/pdf/Volume2/21Oral.pdf
World Health Organization (WHO). (1997). Oral Health Surveys–Basic methods (4th ed.). Geneva: WHO. Retrieved from http://www.whocollab.od.mah.se/expl/methods.html.
Young, D. A., Buchanan, P. M., Lubman, R. G., & Badway, N. N. (2007). New directions in interorganizational collaboration in dentistry: The CAMBRA Coalition model. Journal of Dental Education, 71(5), 595–600.