
EVALUATION OF THE CAPACITY OF SIGNALISED TWO LANE ... · This report evaluates the capacity of two...
163
University of Southern Queensland Faculty of Engineering and Surveying EVALUATION OF THE CAPACITY OF SIGNALISED TWO LANE ROUNDABOUTS A dissertation submitted by Jarrod Lee Taylor In the fulfilment of the requirements of Courses: ENG4111 & ENG4112 Research Project Towards the degree of Bachelor of Engineering (Civil) October 2012
Transcript of EVALUATION OF THE CAPACITY OF SIGNALISED TWO LANE ... · This report evaluates the capacity of two...

University of Southern Queensland Faculty of Engineering and Surveying
EVALUATION OF THE CAPACITY OF SIGNALISED TWO LANE ROUNDABOUTS
A dissertation submitted by
Jarrod Lee Taylor
In the fulfilment of the requirements of
Courses: ENG4111 & ENG4112 Research Project
Towards the degree of
Bachelor of Engineering (Civil)
October 2012
ENG4111/ENG4112 Jarrod Taylor
Signalised Roundabouts Page ii
ABSTRACT
There has been ever increasing demand in the signalisation of roundabouts with the intention
of improving the capacity and safety of the intersection. The signalisation may be
incorporated to reduce reliance on gap acceptance in heavily saturated conditions, control the
dominance of a singular heavy leg demand, improve safety for cyclists and pedestrians or
control all entry flows into the roundabout intersection.
This report evaluates the capacity of two lane signalised roundabouts under saturated
conditions. Computer models were developed in LinSig and Excel to calculate the effective
capacity of the intersections up to a level of service F. Models were developed based on
differing variables such as inscribed diameters, queue discharge headways, phase sequences
and signal cycle times. Relationships between the variables and the impact they had on the
capacity of the signalised roundabout intersection were evaluated. The variables used in the
capacity models were based on field research conducted under Australian driving conditions
and research gathered from around the world. These models were then compared to un-
signalised capacities calculated from previous research across the world.
The conclusions from the project has found that a signalised roundabout using the standard
phasing technique is a viable option in replacing an existing un-signalised roundabout that is
failing to cater for capacities. This is compounded if the intersection has a high percentage of
right turn movements, pedestrian flows and is located in an urban environment. The
installation of signals to an existing roundabout is deemed to be a cost effective solution in
improving capacities.

ENG4111/ENG4112 Jarrod Taylor
Signalised Roundabouts Page iii
LIMITATIONS OF USE
University of Southern Queensland
Faculty of Engineering and Surveying
ENG4111 Research Project Part 1 & ENG4112 Research Project Part 2
Limitations of Use
The Council of the University of Southern Queensland, its Faculty of Engineering and Surveying, and the staff of the University of Southern Queensland, do not accept any responsibility for the truth, accuracy or completeness of material contained within or associated with this dissertation.
Persons using all or any part of this material do so at their own risk, and not at the risk of the Council of the University of Southern Queensland, its Faculty of Engineering and Surveying or the staff of the University of Southern Queensland.
This dissertation reports an educational exercise and has no purpose or validity beyond this exercise. The sole purpose of the course pair entitled “Research Project” is to contribute to the overall education within the student's chosen degree program. This document, the associated hardware, software, drawings, and other material set out in the associated appendices should not be used for any other purpose: if they are so used, it is entirely at the risk of the user.
Professor Frank Bullen Dean Faculty of Engineering and Surveying

ENG4111/ENG4112 Jarrod Taylor
Signalised Roundabouts Page v
ACKNOWLEDGEMENTS
I would like to thank firstly my project supervisor Soma Somasundaraswaran (USQ) and Mr
Ray Stafford (RMS) for helping me with information and guidance throughout this project. I
would also like to thank Andrew Dorrian (RMS) and John Nightingale (JCT) for the support
and help with the computer modelling software LinSig.
Lastly I would like to thank my family and friends for their support throughout the duration
of the project.

ENG4111/ENG4112 Jarrod Taylor
Signalised Roundabouts Page vi
TABLE OF CONTENTS
ABSTRACT ..................................................................................................................................................... ii
LIMITATIONS OF USE .................................................................................................................................... iii
CERTIFICATION..............................................................................................................................................iv
ACKNOWLEDGEMENTS ................................................................................................................................. v
TABLE OF CONTENTS .....................................................................................................................................vi
LIST OF FIGURES ............................................................................................................................................ ix
LIST OF TABLES .............................................................................................................................................. xi
GLOSSARY ................................................................................................................................................... xiv
1. INTRODUCTION ..................................................................................................................................... 1
1.1 Problem Statement ........................................................................................................................... 2
1.2 Project Objectives ............................................................................................................................. 2
2. BACKGROUND....................................................................................................................................... 4
2.1 Un‐signalised Roundabouts .............................................................................................................. 4 2.1.1 Australia ................................................................................................................................... 5
2.2 Signalised Roundabouts .................................................................................................................... 7
3. LITERATURE REVIEW ............................................................................................................................. 9
3.1 Un‐signalised roundabouts ............................................................................................................. 10 3.1.1 General ................................................................................................................................... 10 3.1.2 Capacity .................................................................................................................................. 12
3.2 Signalised Roundabouts .................................................................................................................. 18 3.2.1 General ................................................................................................................................... 18 3.2.2 Signalisation and Phasing ....................................................................................................... 19 3.2.3 Capacity .................................................................................................................................. 21
3.3 Traffic flow characteristics .............................................................................................................. 25 3.3.1 Gap Acceptance ..................................................................................................................... 25 3.3.2 Headways ............................................................................................................................... 27 3.3.3 Traffic Composition ................................................................................................................ 30 3.3.4 Saturation Flow ...................................................................................................................... 31 3.3.5 Roundabout Geometry .......................................................................................................... 31 3.3.6 Lane Widths ........................................................................................................................... 33
3.4 Analytical Methods & Capacity Measures ...................................................................................... 34 3.4.1 Analysis Methods for Un‐Signalised Roundabouts ................................................................ 34 3.4.2 Analysis Methods for Signalised Roundabouts ...................................................................... 37 3.4.3 Control Delay ......................................................................................................................... 37 3.4.4 Level of Service (LOS) ............................................................................................................. 38
3.5 Computer Software Modelling ........................................................................................................ 41 3.5.1 LinSig ...................................................................................................................................... 41 3.5.2 Level of Service (LOS) ............................................................................................................. 41

ENG4111/ENG4112 Jarrod Taylor
Signalised Roundabouts Page vii
4. DESIGN AND METHODOLOGY .............................................................................................................. 43
4.1 Aims and Objectives ........................................................................................................................ 43
4.2 Methodology ................................................................................................................................... 44
4.3 Data inputs for Linsig Models ......................................................................................................... 47
4.4 Phase Sequence .............................................................................................................................. 48 4.4.1 Signal Controller Settings ....................................................................................................... 49
4.5 Inscribed diameters of existing two lane roundabouts in NSW, Australia ...................................... 51
4.6 Field Research ................................................................................................................................. 55 4.6.1 Geometric Delay .................................................................................................................... 55 4.6.2 Queue Discharge Headways .................................................................................................. 58
4.7 Implications/Consequential Effects ................................................................................................. 63 4.7.1 Safety ..................................................................................................................................... 63 4.7.2 Sustainability .......................................................................................................................... 63
5. LINSIG MODELS ................................................................................................................................... 64
5.1 Signalised Roundabout 50m diameter ............................................................................................ 66 5.1.1 Standard Phasing ................................................................................................................... 66 5.1.2 UK Phasing ............................................................................................................................. 68
5.2 Signalised Roundabout 60m diameter ............................................................................................ 69 5.2.1 Standard Phasing ................................................................................................................... 70 5.2.2 UK Phasing ............................................................................................................................. 71
6. RESULTS .............................................................................................................................................. 74
6.1 Signalised Roundabout 50m diameter ............................................................................................ 74 6.1.1 Standard Phasing ................................................................................................................... 74 6.1.2 UK Phasing – No pedestrian movements ............................................................................... 84
6.2 Signalised Roundabout 60m diameter ............................................................................................ 87 6.2.1 Standard Phasing ................................................................................................................... 87 6.2.2 UK Phasing – No pedestrian movements ............................................................................... 90
7. CAPACITY OF SIGNALISED ROUNDABOUTS .......................................................................................... 93
7.1 Effects of inscribed diameter .......................................................................................................... 93 7.1.1 Standard Phasing ................................................................................................................... 93 7.1.2 UK Phasing – No pedestrian movements ............................................................................... 96
7.2 Effects of queue discharge headway .............................................................................................. 97 7.2.1 Standard Phasing ................................................................................................................... 97 7.2.2 UK Phasing – No pedestrian movements ............................................................................... 98
7.3 Effects of cycle times ....................................................................................................................... 99 7.3.1 Standard Phasing ................................................................................................................... 99 7.3.2 UK Phasing – No pedestrian movements ............................................................................. 100
7.4 Comparison to un‐signalised roundabouts ................................................................................... 101 7.4.1 Standard Phasing ................................................................................................................. 102 7.4.2 UK Phasing – No pedestrian movements ............................................................................. 103
8. RECOMMENDATIONS ......................................................................................................................... 104
9. AREAS OF FURTHER RESEARCH ........................................................................................................... 105
10. CONCLUSIONS .................................................................................................................................... 106

ENG4111/ENG4112 Jarrod Taylor
Signalised Roundabouts Page viii
11. REFERENCES ....................................................................................................................................... 107
APPENDIX A – PROJECT SPECIFICATION ...................................................................................................... 110
APPENDIX B – SAMPLE OF SIGNAL TIMINGS ............................................................................................... 111
APPENDIX C – DATA SHEETS FROM FIELD TESTS .......................................................................................... 112
APPENDIX D – DIAGRAMATIC VIEW OF UK PHASE SEQUENCE 60 SECOND PHASE ........................................ 116
APPENDIX E – SCALE A3 DRAWINGS OF ROUNDABOUT MODELS ................................................................ 118
APPENDIX F – LINSIG & EXCEL STANDARD PHASING RESULTS ..................................................................... 121
APPENDIX G – LINSIG UK PHASING RESULTS 50m INSCRIBED DIAMETER ..................................................... 135
APPENDIX H – LINSIG UK PHASING RESULTS 60m INSCRIBED DIAMETER ..................................................... 141
APPENDIX I – UN‐SIGNALISED ROUNDABOUT CAPACITIES .......................................................................... 147

ENG4111/ENG4112 Jarrod Taylor
Signalised Roundabouts Page ix
LIST OF FIGURES
Figure 3.1 – Geometric elements of a roundabout. (Austroads 2007, p 36) ................................................... 11
Figure 3.2 – Approach capacity of a two‐lane roundabout (FHWA 2000, p 88) .............................................. 14
Figure 3.3 – Capacity of Single‐Lane and Multilane entries (HCM 2010, Exhibit 21‐7) .................................... 15
Figure 3.4 – The relation of α and Lba (Tan 2001, Fig.1) ................................................................................. 16
Figure 3.5 – Capacity reduction factor for a two lane roundabout assuming pedestrian priority. (Brilon, Stuwe, and Drews 1993) ................................................................................................................. 17
Figure 3.6 – Geometric elements of a signalised roundabout without pedestrian and cyclist demand ...................................................................................................................................................... 18
Figure 3.7 – Geometric elements of a signalised roundabout with pedestrian and cyclist demand ................ 19
Figure 3.8 – General phasing structure of signalised roundabouts in the United Kingdom ............................ 20
Figure 3.9 – Staging of the phase sequence of signalised roundabouts in the United Kingdom ..................... 20
Figure 3.10 – Piazza Maggi Layout (Bernetti, ................................................................................................ 23
Figure 3.11 – Results comparison in terms of mean delays (Bernetti, ........................................................... 24
Figure 3.12 – Definition of a gap (Irvena 2010, Figure 3.3) ........................................................................... 25
Figure 3.13 – Definition of lag (Irvena, 2010, Figure 3.4) .............................................................................. 26
Figure 3.14 – Typical Gap Acceptance behaviour (Austroads 2008, Figure 5.1) .............................................. 26
Figure 3.15 – Critical gap with increased circulating flow (Akçelik, 2011) ...................................................... 27
Figure 3.16 – Definition of headway (Irvena 2010, Figure 3.6) ...................................................................... 28
Figure 3.17 – Definition follow‐up headway (Irvena 2010, Figure 3.5) .......................................................... 28
Figure 3.18 – Signalised intersection acceleration headways (HCM 2010, Exhibit 4‐6)................................... 29
Figure 3.19 – Concept of saturation flow rate and lost time (HCM 2010, Exhibit 4‐7) .................................... 29
Figure 3.20 – Effective intersection capacity and critical degree of saturation as a function of inscribed diameter estimated by Australian gap acceptance theory (Akçelik 2011, Figure 5) ........................ 31
Figure 3.21 – Step function nature of Level of Service (HCM 2010, Exhibit 5‐1) ............................................. 39
Figure 4.1 – Roundabout Analysis Methodology (HCM 2010, Exhibit 21‐9) ................................................... 44
Figure 4.2 – Signalised Intersection Analysis Methodology (HCM 2010, Exhibit 18‐11) .................................. 45
Figure 4.3 – Phase sequence used to examine capacity of signalised roundabout ......................................... 48
Figure 4.4 – All‐red time as a function of speed and clearance distance (Austroads 2003, Figure C.5) ........... 50
Figure 4.5 – Newcastle/Hunter Valley existing roundabout locations ........................................................... 51

ENG4111/ENG4112 Jarrod Taylor
Signalised Roundabouts Page x
Figure 4.6 – Central Coast existing roundabout locations ............................................................................. 52
Figure 4.7 – Grafton existing roundabout locations ...................................................................................... 53
Figure 4.8 – Geometric delay observations 52m inscribed diameter roundabout .......................................... 55
Figure 4.9 – Geometric delay observations 63m inscribed diameter roundabout .......................................... 56
Figure 4.10 – Test sites to determine headway and saturation flow through signals, semi rural urban environment East Maitland. .............................................................................................................. 58
Figure 4.11 – Test sites to determine headway and saturation flow through signals, urban environment Newcastle. ............................................................................................................................. 60
Figure 5.1 – Saturation flows and coefficients for opposed movements developed by JCT Consulting ........... 65
Figure 5.2 – 50m signalised roundabout LinSig Model – Standard phasing.................................................... 67
Figure 5.3 – 50m signalised roundabout LinSig Model – UK phasing ............................................................. 68
Figure 5.4 – 60m signalised roundabout LinSig Model – Standard phasing.................................................... 70
Figure 5.5 – 60m signalised roundabout LinSig Model – UK phasing ............................................................. 72
Figure 6.1 – Capacity of signalised roundabout based on 80 second control delay ........................................ 75
Figure 6.2 – Capacity of signalised roundabout based on hour interval ........................................................ 77
Figure 6.3 – Capacity of Signalised Roundabout with 3 second clearance time ............................................. 79
Figure 6.4 – Capacity of Signalised Roundabout with 2 second all‐red interval Urban environment .............. 80
Figure 6.5 – Capacity of signalised roundabout based on hour interval ........................................................ 82
Figure 6.6 – Capacity of Signalised Roundabout with 3 second clearance time ............................................. 84
Figure 6.7 – Capacity of Signalised Roundabout with 3 second clearance time Semi‐rural / Urban environment ............................................................................................................................................... 89
Figure 6.8 – Capacity of Signalised Roundabout with 3 second clearance time Urban environment .............. 89
Figure 7.1 – Capacity for signalised roundabout for different inscribed diameters ........................................ 93
Figure 7.2 – Capacity for signalised roundabout for different inscribed diameters ........................................ 95
Figure 7.3 – Capacity for signalised roundabout for different inscribed diameters ........................................ 95
Figure 7.4 – Capacity for signalised roundabout for different inscribed diameters UK phasing ...................... 96
Figure 7.5 – Difference in capacities based on queue discharge headways ................................................... 97
Figure 7.6 – Difference in capacities based on queue discharge headways .................................................. 100

ENG4111/ENG4112 Jarrod Taylor
Signalised Roundabouts Page xi
LIST OF TABLES
Table 3.2 – Descriptions of key roundabout features. .................................................................................. 11
Table 3.3 – Conversion factors for passenger car equivalents (pce) (HCM 2010, Exhibit 4‐5) ......................... 30
Table 3.4 – Analytical methods used across the world un‐signalised roundabouts (Bernetti, Dall’Acqua & Longo 2003, p 3) ..................................................................................................................... 34
Table 3.5 – Level of service definitions for vehicles based on delay (Source: Akçelik 2009, Table 4) .............. 38
Table 3.6 – Descriptions of Level of service for interrupted flow .................................................................. 39
Table 3.7 – Level of service definitions for vehicles based on both delay and degree of saturation (Source: Akçelik 2009, Table 5) .................................................................................................................... 40
Table 4.1 – Input data for LinSig models ...................................................................................................... 47
Table 4.2 – Austroads Signal Controller Settings .......................................................................................... 49
Table 4.3 –Newcastle/Hunter Valley inscribed diameters ............................................................................ 52
Table 4.4 –Central Coast inscribed diameters .............................................................................................. 53
Table 4.5 –Grafton inscribed diameters ....................................................................................................... 54
Table 4.6 – Average cruise speed and geometric delay for a 52m inscribed diameter roundabout ................ 56
Table 4.7 – Average cruise speed and geometric delay for a 63m inscribed diameter roundabout ................ 57
Table 4.8 – Distances of various turning movements for the corresponding roundabout diameters based on Austroad standards ...................................................................................................................... 57
Table 4.9 – Headway and saturation flow data East Maitland site ................................................................ 59
Table 4.10 – Headway and saturation flow data Newcastle site ................................................................... 61
Table 5.1 – 50m Inscribed diameter geometric elements ............................................................................. 66
Table 5.2 – All‐red interval time for 50m inscribed diameter ........................................................................ 67
Table 5.3 – 60m Inscribed diameter geometric elements ............................................................................. 70
Table 5.4 – All‐red interval time for 60m inscribed diameter ........................................................................ 71
Table 6.1 – Maximum U turn movements for 50m signalised roundabout .................................................... 74
Table 6.2 – Uniform traffic flows corresponding to total capacity of signalised roundabout ......................... 75
Table 6.3 – Capacity values Excel for 105s phase time Semi Rural / Urban Environment ............................... 76
Table 6.4 – Uniform traffic flows corresponding to total capacity of signalised roundabout ......................... 80
Table 6.5 – Capacity values Excel for 105s phase time Semi‐Rural / Urban Environment ............................... 81
Table 6.6 – Capacity values LinSig for 60s phase time Semi Rural / Urban Environment ................................ 85

ENG4111/ENG4112 Jarrod Taylor
Signalised Roundabouts Page xii
Table 6.7 – Capacity values LinSig for 60s phase time Urban Environment ................................................... 86
Table 6.8 – Maximum U turn movements for 60m signalised roundabout .................................................... 87
Table 6.9 – Capacity values LinSig for 60s phase time Semi Rural / Urban Environment ................................ 91
Table 6.10 – Capacity values LinSig for 60s phase time Urban Environment .................................................. 92
Table 7.1 – Excess clearance time at 30km/h entering vehicle speed ............................................................ 94
Table 7.2 – Coefficient values used for un‐signalised roundabout capacities using Tan (2001) formulae .................................................................................................................................................... 101
Table 7.3 – Capacities based on entry capacity for an hour interval ............................................................. 102
Table F.1 – Capacity values for 50m inscribed diameter LinSig model 60s phase time Semi Rural / Urban Environment .................................................................................................................................... 121
Table F.2 – Capacity values for 50m inscribed diameter LinSig model 75s phase time Semi Rural / Urban Environment .................................................................................................................................... 122
Table F.3 – Capacity values for 50m inscribed diameter LinSig model 90s phase time Semi Rural / Urban Environment .................................................................................................................................... 123
Table F.4 – Capacity values for 50m inscribed diameter LinSig model 105s phase time Semi Rural / Urban Environment .................................................................................................................................... 124
Table F.5 – Capacity values for 50m inscribed diameter LinSig model 60s phase time no all‐red interval Semi Rural / Urban Environment ................................................................................................... 125
Table F.6 – Capacity values for 50m inscribed diameter 3 second clearance time Excel values Semi Rural / Urban Environment ........................................................................................................................ 126
Table F.7 – Capacity values for 50m inscribed diameter LinSig model 60s phase time Urban Environment .............................................................................................................................................. 127
Table F.8 – Capacity values for 50m inscribed diameter LinSig model 75s phase time Urban Environment .............................................................................................................................................. 128
Table F.9 – Capacity values for 50m inscribed diameter LinSig model 90s phase time Urban Environment .............................................................................................................................................. 129
Table F.10 – Capacity values for 50m inscribed diameter LinSig model 105s phase time Urban Environment .............................................................................................................................................. 130
Table F.11 – Capacity values for 50m inscribed diameter LinSig model 60s phase time no all‐red interval Urban Environment ....................................................................................................................... 131
Table F.12 – Capacity values for 50m inscribed diameter 3 second clearance time Excel values Urban Environment .................................................................................................................................... 132
Table F.13 – Capacity values for 60m inscribed diameter 3 second clearance time Excel values Semi‐rural / Urban Environment ................................................................................................................ 133
Table F.14 – Capacity values for 60m inscribed diameter 3 second clearance time Excel values Urban Environment .................................................................................................................................... 134

ENG4111/ENG4112 Jarrod Taylor
Signalised Roundabouts Page xiii
Table G.1 – Controlled delay for journey times LinSig model 60s phase time Semi Rural / Urban Environment .............................................................................................................................................. 135
Table G.2 – Capacity values LinSig model 60s phase time Semi Rural / Urban Environment ......................... 136
Table G.3 – Controlled delay for journey times LinSig model 60s phase Urban Environment ........................ 138
Table G.4 – Capacity values LinSig model 60s phase time Urban Environment ............................................. 139
Table H.1 – Controlled delay for journey times LinSig model 60s phase time Semi Rural / Urban Environment .............................................................................................................................................. 141
Table H.2 – Capacity values LinSig model 60s phase time Semi Rural / Urban Environment ......................... 142
Table H.3 – Controlled delay for journey times LinSig model 60s phase time Urban Environment ................ 144
Table H.4 – Capacity values LinSig model 60s phase time Urban Environment ............................................. 145
Table I.1 – Capacity of un‐signalised roundabout based on uniform flow from HCM 2010 ........................... 147
Table I.2 – Capacity of un‐signalised roundabout based on uniform flow from Tan 2001 ............................. 147
Table I.3 – Capacity of un‐signalised roundabout based on variable flow from Tan 2001 ............................. 148

ENG4111/ENG4112 Jarrod Taylor
Signalised Roundabouts Page xiv
GLOSSARY Term Definition acceleration (m/s²) The act of accelerating; increase of speed or velocity all-red interval (s) The time interval between when all signals are under a red
phase. capacity (veh/hr) The maximum hourly rate at which persons or vehicles can
reasonably be expected to traverse a point or uniform section of a lane or roadway during a given time period under prevailing roadway, traffic and control conditions.
carriageway one of the two sides of a motorway/highway where traffic travels in one direction only usually in two or three lanes
cycle time (s) The total time for a signalised intersection to complete all its phases.
deflection The deviation of a vehicle from conducting a straight through movement
delay The period of time one is stopped from completing their desired movement
gap The time interval between the departure at a point of one vehicle and the arrival at the same point of the next vehicle.
geometric delay The distance one is forced to conduct from completing their desired movement
giveway The act of slowing down or stopping to check or stop for a an oncoming vehicle at an intersection.
grade separated interchange
An intersection that separates the two conflicting roads vertically so they are free to complete their desired movement without the act of giving way.
headway The distance in time or space that seperates two vehicles travelling the same route
intersection at grade An intersection where carriageways cross at a common level. lane saturation The volume of traffic that occupies the lane at present time
divided by the total capacity the lane is able to occupy. level of service A qualitative measure describing operational conditions
within a traffic stream, and their perception by motorists and/or passengers.
LinSig A computer software program developed in the UK to determine the capacities of intersections.
passenger car equivalent (pce)
The equivalent ratio that a mode of transport has on the capacity of the intersection compared to a single car.
passenger car unit (pcu)
The equivalent ratio that a mode of transport has on the capacity of the intersection compared to a single car.
pedestrian A person travelling on foot phase A singular element that is part of a cycle.

ENG4111/ENG4112 Jarrod Taylor
Signalised Roundabouts Page xv
queue A line of waiting people or vehicles red clearance time (s)
The time in seconds relating to the clearance between two entering vehicles into an intersection from two opposing legs.
roundabout A road junction at which traffic moves in one direction round a central island to reach one of the roads converging on it.
rural Of relating to, or characteristic of the country through lane A lane provided for the use of vehicles proceeding straight
ahead. traffic The passage of people or vehicles along routes of
transportation. traffic circle Large roundabouts that allowed entering traffic the right of
way. urban Of relating to, or located in a city. yield Refer to giveway
ENG4111/ENG4112 Jarrod Taylor
Signalised Roundabouts Page 1
1. INTRODUCTION
Roundabouts have been adopted throughout the world to govern the traffic flow at
intersections for variable traffic demands. They generally consist of four approaching legs of
traffic, that give way to circulating traffic navigating around a central island (usually
circular).
Roundabouts can be used in many different situations within a road network. They can be
adopted in both low and high traffic volumes with the measures to increase safety and
improve capacity of an intersection. A few key features determine what specific type of
roundabout is needed, these features include:
• traffic demand
• size
• environment
These factors impact on the design characteristics such as the speed of entry and exits, the
diameter of roundabout, number of circulating lanes and ability to service daily traffic flows.
The Federal Highway Administration (FHWA, 2010) class roundabouts into six main
categories, these include:
1. Small residential roundabouts
2. Compact urban roundabouts
3. Urban single lane roundabouts
4. Rural single lane roundabouts
5. Urban two lane roundabouts
6. Rural two lane roundabouts
There has been ever increasing demand in the signalisation of roundabouts with the intention
of improving the capacity and safety of the intersection. The signalisation may be
incorporated to reduce reliance on gap acceptance in heavily saturated conditions, control the
dominance of a singular heavy leg demand, improve safety for cyclists and pedestrians or
control all entry flows into the roundabout intersection.

ENG4111/ENG4112 Jarrod Taylor
Signalised Roundabouts Page 2
This report will examine the capacity for urban and rural two lane signalised roundabouts.
LinSig and excel computer software will be used to determine the capacities of signalised
roundabouts under a certain signal phase. Traffic flow characteristics will be input into the
LinSig and excel models based on an Australian analytical approaches with supportive
research based from around the world.
These capacities will be compared to conventional un-signalised roundabouts to determine if
the signalisation of a roundabout is an effective means to increase the capacity of the
intersection.
1.1 Problem Statement The research undertaken in this report has been developed in response of replacing existing
roundabouts that are failing to provide an adequate level of service to increasing traffic
demands. The normal progression in Australia has been to replace non-performing
roundabouts with a typical signalised intersection or to a greater extent grade separated
interchange. This incurs costs of removing the existing roundabout as well as its footprint and
reshaping the intersection to the desired signalised intersection geometry.
This report will examine whether installing (retro-fitting) signals to an existing un-signalised
roundabout will help improve the capacity of the roundabout and in turn improve the life
span of the intersection at a more cost effective solution than replacing with a new signalised
intersection layout.
1.2 Project Objectives
• A complete review of local and overseas researches on traffic flow characteristics at
un-signalised and signalised roundabouts.
• Develop traffic capacity models with various radii using Excel and LinSig, LinSig is a
computer software programme that assesses the design of signalised roundabouts and
intersections.
• Apply uniform traffic flows to each leg of the intersection and assess the impact of
traffic flows on level of service.

ENG4111/ENG4112 Jarrod Taylor
Signalised Roundabouts Page 3
• Establish relationships between design parameters (radius, cycle times, queue
discharge headways) and the capacity of a signalised roundabout.
• Compare the traffic flow capacity of signalised roundabouts to conventional un-
signalised roundabout designs.

ENG4111/ENG4112 Jarrod Taylor
Signalised Roundabouts Page 4
2. BACKGROUND This section aims to provide background information based from research sought globally on
the history, research and implementation of roundabouts around the world. The information
from the background will be used as the basis in the required aims and hypotheses of the
project.
2.1 Un-signalised Roundabouts ‘Traffic circles have been part of the transportation system in the United States since 1905,
when the Columbus Circle designed by William Phelps Eno opened in New York City’
(FHWA 2000, p 2). These traffic circles were unlike modern roundabouts today as they gave
entering traffic the right of way, thus causing the circulating traffic to give way. This
developed numerous problems with roundabouts which involved locking up of traffic around
the central island, aiding high speed entry and the merging and weaving of vehicles leading to
severe crashes.
After numerous traffic mishaps within these traffic circle intersections in the United States,
the Americans decided to abandon the traffic circle designed intersections. The British
decided to continue to develop and refine the design of these traffic circles and came up with
the mandatory give way rule that allowed the development of modern roundabouts to
continue to become safe and effective intersections.
‘In 1966, the United Kingdom adopted mandatory “give-way” rule at circular intersections,
which required entering traffic to give way, or yield, to circulating traffic’ (FHWA 2000, p
2). By adopting this rule, roundabouts became free flowing as it did not allow vehicles to
enter the roundabout until there was a sufficient gap in the circulating traffic.
The differences of modern roundabouts from the traditional traffic circles include:
• Roundabouts require entering drivers to give way to all traffic within the roundabout.
• Roundabouts allow the inner lane of a multi lane roundabout to exit.
• Deflection on entry is used to maintain low speed operation in roundabouts.
• Pedestrians are permitted from the central island of a roundabout.
• Modern roundabouts are much smaller in diameter than traffic circles.

ENG4111/ENG4112 Jarrod Taylor
Signalised Roundabouts Page 5
The United States of America finally adopted the design of the modern roundabout in 1990 in
Summerlin, Las Vegas. Since then USA have adopted the modern roundabout and as of
December 2009 the number of modern roundabouts in the USA was approximately 2,300.
In 1984, the French government adopted the mandatory give way rule to circulating traffic
and as of mid-1997 there are about 15,000 modern roundabouts in France (Jacquemart 1998).
In addition to their popularity in Great Britain and France, roundabouts are very common in
Germany, Switzerland, Spain and Portugal. ‘Outside of Europe the modern roundabout is a
standard feature in Australia and it is becoming more common in New Zealand, South Africa
and Israel’ (Jacquemart 1998, p 11).
2.1.1 Australia
Roundabouts were adopted extensively during the 1980’s in Australia due to the benefit of
less severe crashes and a relatively low crash rate between motor vehicles compared to other
intersections. The three main factors which have led to the replacement of roundabouts to a
signalised intersection are as follows:
1. Capacity issues in saturated flow periods.
2. Safety for Cyclists
3. Safety for Pedestrians
Capacity issues arise in saturated conditions due to limited gap space for entering vehicles.
This is compounded when there is a dominant leg which creates large queue lengths for the
opposing entering traffic. Capacity issues will be discussed more in depth in the next section
of the report.
Austroads (2011) states that in multi lane roundabouts the safety for cyclists is markedly less
than that of motor vehicles. A French study (Alphand, Noelle and Guichet 1991) determined
that there was twice as many injury crashes for cyclists at roundabouts than at signalised
intersections.

ENG4111/ENG4112 Jarrod Taylor
Signalised Roundabouts Page 6
A study in New South Wales by Robinson (1998) found:
• 6% of those injured at cross sections were cyclists compare with 18% at roundabouts.
• At non-metropolitan roundabouts, 32% of those injured in 2-party crashes were
cyclists.
• Cyclist were responsible for 16% of the crashes in which they were involved.
‘Under National Transport Commission, (Road Transport Legislation, Australian Road
Rules) Regulations 2006 vehicles leaving a roundabout are not obliged to give way to
pedestrians’ (Austroads 2011, p 48). This makes roundabouts inappropriate when there is a
high level demand of pedestrians.
These factors have influenced a trend particularly in the United Kingdom to adopt
signalisation at existing roundabouts to improve the above mentioned problems.

ENG4111/ENG4112 Jarrod Taylor
Signalised Roundabouts Page 7
2.2 Signalised Roundabouts
‘Signalisation of roundabouts was first experimented in 1959 in the United Kingdom (UK) to
prevent circulating traffic from blocking entering traffic during peak periods’ (DFT, 2009).
Although with the introduction to the mandatory give way rule in 1966, which allowed un-
signalised roundabouts to become more effective, they still had issues arising from
unbalanced flows causing limited gap space for entering vehicles.
‘There has been a rapid increase in the installation of signal controlled roundabouts in the UK
since the early 1990s’ (DFT, 2009). Table 2.1 shows a comparison from 1997 & 2006 of the
reasons for signalisation on roundabouts, taken from 49 authorities on 161 signalised
roundabouts within the United Kingdom.
Table 2.1 – Comparison of Surveys 1997/2006 (DFT, 2009)
Trends in signalisation of roundabouts
1997 (%)
2006 (%)
Location Urban (50 or 60 km/h limit) 55 62 Rural (70 km/h or greater limit) 45 38 Reasons for signalisation Queue Control 70 80 Increased capacity 67 70 Accident reduction 60 72 UTC linkage 27 15 Pedestrians/cyclists - 38 Other 24 - Type of Control Fully signalised 35 48 Pedestrians/cyclists facility 34 32 Full-time control 64 86 Appraisal tools TRANSYT - 83* LinSig - 33* VISSIM - Low Paramics - Low * Note: Some authorities use both packages

ENG4111/ENG4112 Jarrod Taylor
Signalised Roundabouts Page 8
The data received from the comparison show a greater trend towards full time signal control
to improve queue control, increase capacity and improve safety.
Safety of pedestrians and cyclists through roundabouts has been a major issue around the
world with various designs used to enable these movements throughout modern roundabouts.
Signalisation of roundabouts provides an effective and safe route for both pedestrians and
cyclists which have led to the increase in signalisation of roundabouts.
This report will analyse the impact signalisation has to the capacity of a two lane roundabout.

ENG4111/ENG4112 Jarrod Taylor
Signalised Roundabouts Page 9
3. LITERATURE REVIEW
This literature review will detail the necessary information to ensure the variables affecting
the capacity of roundabouts are understood and accounted for. This information will provide
the structure for the variable inputs into the computer software modelling to determine the
capacity of a two lane signalised roundabout.
This section will first provide general information about roundabouts and their key features.
It will then look into the important features of signalisation and traffic flow characteristics
that will impact on determining the capacity of a two lane roundabout. Finally it will describe
the features and limitations of the computer software modelling used in determining the
project objectives.

ENG4111/ENG4112 Jarrod Taylor
Signalised Roundabouts Page 10
3.1 Un-signalised roundabouts 3.1.1 General
‘Roundabouts are circular intersections with specific design and traffic control features.
These features include give-way control of all entering traffic, channelised approaches and
appropriate geometric curvature to ensure that travel speeds on the circulatory roadway are
typically less than 50km/h’ (FHWA 2000, p 5). Roundabouts can be classed into six main
categories as shown in Table 3.1 below.
Table 3.1 – Design characteristics for each six roundabout categories (FHWA 2000, p 13) Design Element
MiniRoundabout
Urban Compact
Urban SingleLane
Urban DoubleLane
Rural SingleLane
Rural DoubleLane
Recommended maximum entry design speed
25 km/h (15 mph)
25 km/h (15 mph)
35 km/h (20 mph)
40 km/h (25 mph)
40 km/h (25 mph)
50 km/h (30 mph)
Maximum number of
entering lanes per approach
1 1 1 2 1 2
Typical inscribed circle diameter
13m to 25m (45ft to 80ft)
25m to 30m
(80ft to 100ft)
30m to 40m (100ft to 130ft)
45m to 55m (150ft to 180ft)
35m to 40m (115ft to 130ft)
55m to 60m (180ft to 200ft)
Splitter island treatment
Raised if possible,
crosswalk cut if raised
Raised, with
crosswalk cut
Raised, with crosswalk cut
Raised, with crosswalk cut
Raised and extended, with
crosswalk cut
Raised and extended, with
crosswalk cut Typical daily
service volumes on 4‐leg
roundabout (veh/day)
10,000 15,000 20,000 40,000 to 50,000 20,000 40,000 to
50,000
This report will be focused on rural two lane roundabouts. The key geometric elements of a
rural two lane roundabout are shown in Figure 3.1.
Roundabouts introduce an entry curve to slow entering traffic down to give-way to
circulating traffic. The entry and exit curves are separated by a raised median called a splitter
island, which is designed to deflect and slow entering traffic in conjunction with the entry
curve. The vehicles then enter the roundabout when a sufficient gap is presented, than travel
within the circulating carriageway until they reach their desired exit.

ENG4111/ENG4112 Jarrod Taylor
Signalised Roundabouts Page 11
Figure 3.1 – Geometric elements of a roundabout. (Austroads 2007, p 36)
Table 3.2 – Descriptions of key roundabout features.
Feature Description Approach Curve The approached curve is used to slow the operating speed of vehicles
coming from a high speed environment. Entry Curve The entry curve is used to deflect and slow entering vehicles to an
appropriate speed to safely circulate the roundabout. Entry Width The entry width is the width of the entry where it meets the circulating
carriageway. Holding Line The holding line is pavement marking that defines where the vehicles
have to give way to the circulating traffic. It is generally marked along the inscribed circle.
Circulating Carriageway
The circulating carriageway is a curved path used by vehicles to travel around the central island. This is defined by painted line marking.
Circulating Carriageway Width
Defines the roadway width for vehicle circulation around the central island. The circulating carriageway width has to be wide enough to accommodate the largest design vehicles turning path.
Exit Width The exit width is the width of the exit where it meets the circulating carriageway.
Exit Curve The exit curve is generally bigger/flatter than the entry curve to allow vehicles to exit at a faster speed to improve traffic capacity and flow.

ENG4111/ENG4112 Jarrod Taylor
Signalised Roundabouts Page 12
3.1.2 Capacity
The Highway Capacity Manual (HCM, 2010) defines the capacity of a facility as ‘the
maximum hourly rate at which persons or vehicles can reasonably be expected to traverse a
point or uniform section of a lane or roadway during a given time period under prevailing
roadway, traffic and control conditions.’
The capacity of a roundabout depends on two major principles:
• The effect of traffic flow and driver behaviour,
• The effect of roundabout geometry.
3.1.2.1 Effect of traffic flow and driver behaviour Different driver behaviours are experienced around the world. Some drivers in certain
countries may approach a roundabout at a higher speed or accept a smaller gap upon entry
into the roundabout, which has an impact on the capacity of the roundabout.
There are several effects of driver behaviour that are consistent across the world that have an
impact on the capacity of a roundabout. The effects from driver behaviour on traffic flow are:
• Effect of exiting vehicles – The effect of exiting vehicles may have an impact on
when the entering vehicle feels comfortable to enter the circulating carriageway. This
effect is similar to a vehicle wishing to turn left into the lane a vehicle is exiting, the
driver may not feel comfortable to exit until the vehicle is in the motion of turning
even if the vehicle has indicated on turning left.
• Changes in effective priority – When the roundabout is under saturated conditions
driver behaviour becomes more aggressive. Instead of entering traffic providing the
required gap as to not disrupt the circulating traffic, the vehicles are more likely to
forcefully enter requiring the circulating traffic to give way to the entering traffic.
• Origin to destination patterns – This has an impact if there is a heavy through or right
turn movement from one leg. If there is continual traffic flow that is unimpeded from
a downstream leg it will not provide sufficient gaps for entering traffic causing long
delays and traffic queues from upstream legs.

ENG4111/ENG4112 Jarrod Taylor
Signalised Roundabouts Page 13
The effects of driver behaviour can be so variable that it is difficult to model for capacities
accurately based on computer software. Inputs for driver behaviour within computer software
modelling should be based on extensive field testing on real life conditions with similar
geographic conditions.
3.1.2.2 Effect of roundabout geometry
The geometry of a roundabout can have an impact on the capacity of a roundabout in the
following areas:
• ‘It affects the speed of vehicles through the intersection, thus influencing their travel
time by virtue of geometry alone (geometric delay)’ (FHWA 2010, p4-5).
• The larger the diameter of the roundabout provides more capacity within the
circulating carriageway.
• The width of the circulating carriageway, entry widths and exit widths have an impact
on the capacity and can govern the speed at which drivers feel comfortable to enter
and navigate around the roundabout.
• ‘It can affect the degree to which flow in a given lane is facilitated or constrained. For
example, the angle at which a vehicle enters affects the speed of that vehicle, with
entries that are more perpendicular requiring slower speeds and thus longer headways.
Likewise, the geometry of multilane entries may influence the degree to which drivers
are comfortable entering next to one another’ (FHWA 2010, p4-5).
• ‘It may affect the driver’s perception of how to navigate the roundabout and their
corresponding lane choice approaching the entry’ (FHWA 2010, p4-5).
The capacity of a roundabout is mainly dependent on the amount of approaching lanes and
circulating lanes. The capacity is also affected more subtly by entry curves, entry widths and
lane widths. There has been extensive research done into the capacity of two lane
roundabouts across the world. Generally it is found that the capacity of a two-lane
roundabout is expected to be between 40,000 to 50,000 vehicles per day.
The percentage of heavy vehicles is also a major factor to the capacity. The higher the
percentage the lower the capacity of the roundabout due to the slower travel and turning
speeds through the roundabout.

ENG4111/ENG4112 Jarrod Taylor
Signalised Roundabouts Page 14
Figure 3.2 shows research conducted by the Federal Highway Administration into the
capacity of a two lane roundabout. The capacity forecast is based on simplified UK empirical
regression methods that differ from Australia and USA methods of gap acceptance theory.
It identifies that the maximum entry flow reaches a maximum of 2400 veh/hr when there is
no circulatory flow. On the contrary it shows that when the circulatory flow reaches
approximately 3400 vehicle per hour, no vehicles are able to enter into the roundabout adding
to the capacity.
Figure 3.2 – Approach capacity of a two-lane roundabout (FHWA 2000, p 88)
The HCM (2010) defines the capacity of two lane roundabouts with two circulating flows as:
1Ce,R,pce = 1,130e(-0.0007)υc,pce
2Ce,L,pce = 1,130e(-0.00075)υc,pce
Where:
Ce,R,pce = capacity of the right entry lane, adjusted for heavy vehicles (pc/hr),
Ce,L,pce = capacity of the left entry lane, adjusted for heavy vehicles (pc/hr), and
υc,pce = conflicting flow rate (total of both lanes) (pc/hr).
1 Right lane corresponds to left lane in Australia and UK. 2 Left lane corresponds to right lane in Australia and UK.
(3.1)
(3.2)

ENG4111/ENG4112 Jarrod Taylor
Signalised Roundabouts Page 15
Figure 3.3 has been developed based on these equations to produce the capacity estimates of
single-lane and multilane entry capacities.
Figure 3.33 – Capacity of Single-Lane and Multilane entries (HCM 2010, Exhibit 21-7)
These findings represented in Figures 3.2 & 3.3 show the entering capacities for a leg into a
roundabout against a conflicting circulating flow rate. This can make it hard when comparing
the total capacity of the intersection to a signalised case. Tan (2001) determined a formula to
assess the full capacity (Qfcr) of a roundabout under fully saturated conditions. The formula
is:
Qfcr = 4F / {1/к + [β*Rh + 2Rr) + α ] *f} (3.3)
Where;
F = coefficient (represented in equation 3.4)
f = coefficient (represented in equation 3.4)
к = lane entry factor, 2 lanes in entry = 1.4 – 1.6
β = circulating carriageway lane factor, 2 lanes in circulating carriageway = 0.6 – 0.8
α = determined from Figure 3.4 (Lba is the distance between diverging point at exit
and converging point at entry)
Rh = Ratio of through movements to all movements
Rr = Ratio of right turn movements to all movements
3 Left lane corresponds to right lane and vice versa in Australia and UK.

ENG4111/ENG4112 Jarrod Taylor
Signalised Roundabouts Page 16
Here we can see the effect the right turn movements have on the capacity of the roundabout.
The entry capacity is affected by the right turn movements from the opposite entry lanes
along with the through and right turn movement from the entry lanes on the right side of the
entry.
Tan (2001) states that Swiss guide to roundabout design has determined the coefficients for F
and f for fully saturated conditions based on the entry capacity researched in England, France
and Switzerland (Qe):
Qe = F – Qg*f (3.4)
Where;
Qg = conflicting flow
The Swiss guide calculates the coefficients F & f based on:
Qe = к[1500 – (8/9)*Qg]
Therefore, F = 1500
f = 8/9
These coefficients are to reflect at saturated conditions.
Figure 3.4 – The relation of α and Lba (Tan 2001, Fig.1)

ENG4111/ENG4112 Jarrod Taylor
Signalised Roundabouts Page 17
Pedestrians can reduce the entry capacity of a roundabout if they assert right-of-way on
vehicles entering the roundabout. Worldwide there are different rules and regulations
regarding the right-of-way of pedestrians in regards to roundabouts. In Australia vehicles are
not obliged to give way to pedestrians upon exiting the roundabout according to the National
Transport Commission.
Research by (Brilon, Stuwe, and Drews 1993) determined a reduction factor for pedestrians
on the capacity for a two lane roundabout which is represented in Figure 3.5. This reduction
factor can be used to compare capacities to signalised roundabouts which gives priority to
pedestrians. This will provide similar intersection characteristics between un-signalised and
signalised roundabouts.
Figure 3.5 – Capacity reduction factor for a two lane roundabout assuming pedestrian
priority. (Brilon, Stuwe, and Drews 1993)
All these factors have to be considered when determining the capacity of a roundabout. Each
specific roundabout will have its own unique parameters due to geometry, driver behaviour
and traffic fleet. To determine the most accurate capacities for a roundabout, all the inputs of
these parameters should be based on research conducted to similar conditions that best relate
to the designed roundabout examined.

ENG4111/ENG4112 Jarrod Taylor
Signalised Roundabouts Page 18
3.2 Signalised Roundabouts 3.2.1 General
The geometric elements of a signalised roundabout are the same as the geometric elements of
a standard un-signalised roundabout, accept with the addition of traffic signals and possible
hold lines within the circulating carriageway. Hold lines within the roundabout are used when
there is a high pedestrian and cyclist demand to allow traffic completing a U-turn to give way
to crossing pedestrians and cyclists.
Shown in Figure 3.6 is a geometric layout of a proposed signalised roundabout without
pedestrian and cyclist demand.
Figure 3.6 – Geometric elements of a signalised roundabout without pedestrian and cyclist
demand

ENG4111/ENG4112 Jarrod Taylor
Signalised Roundabouts Page 19
Figure 3.7 shows a typical configuration of a signalised roundabout with pedestrian and
cyclist demand.
Figure 3.7 – Geometric elements of a signalised roundabout with pedestrian and cyclist
demand
3.2.2 Signalisation and Phasing
The addition of signalisation adds another dynamic to the control of the intersection. It
eliminates the need for gap acceptance and allows the ability to control phasing and also
control the time of these phases to gain the best outcome for traffic flow around the
intersection. It eliminates the dominance of a singular heavy demand and can cater safely for
pedestrians and cyclists.

ENG4111/ENG4112 Jarrod Taylor
Signalised Roundabouts Page 20
Shown below in Figures 3.8 and 3.9 is the general phasing structure used for signalised
roundabouts in the United Kingdom. The entry lanes are represented by the letters B, D, F, H
and the inner phase is represented by the letters A, C, E, G in Figure 3.7.
A
B
C
D
E
F
G
H
Figure 3.8 – General phasing structure of signalised roundabouts in the United Kingdom
A
B
1 Min >= 7
A
B
2 Min >= 7
C
D
1 Min >= 7
C
D
2 Min >= 7
E
F
1 Min >= 7
E
F
2 Min >= 7
G
H
1 Min >= 7
G
H
2 Min >= 7
Figure 3.9 – Staging of the phase sequence of signalised roundabouts in the United Kingdom

ENG4111/ENG4112 Jarrod Taylor
Signalised Roundabouts Page 21
The staging of the phase sequence can be seen from Figure 3.9 where the inner phases of A,
C, E and G proceed before the entry lanes represented by B, D, F and H. The phase sequence
follows a clockwise rotation around the roundabout with the inner phases proceeding before
the entry lane phase to clear the roundabout before the addition of more vehicles within the
circulating carriageway. This can be seen more diagrammatically in Appendix D.
The general inter-green time between all phases is set at two seconds to allow the clearance
of the last vehicle entering under the current green phase from the approach of the following
green phase. The phasing is optimised between both inner and outer phases that work
concurrently with other grouped inner and outer phases. For example phase A can run
concurrently with phases D, E and H and phase B can run concurrently with phases C, F and
G. Attached in Appendix B is an example of a signal timings scheme for a 60 second cycle
time.
Generally phase times within signalised roundabouts are kept short to allow quick rotation
between phases to clear the inner circulating carriageway. Using this procedure allows the
entering vehicles to be unaffected by stored queues within the circulating carriageway and
allows them to effectively navigate to their desired destination.
3.2.3 Capacity
The installation of traffic signals has numerous effects on the capacity of a roundabout both
in a saturated and un-saturated flow period. In saturated flows it eliminates the need for
vehicles to find an acceptable gap to enter the roundabout and can control queuing caused
from the demand of a singular heavy leg.
However it alters the traffic flow characteristics of the intersection to resemble a typical
signalised intersection. This makes the intersection insufficient when there is a low traffic
demand as it takes away the free flowing characteristics of an un-signalised roundabout
forcing vehicles to stop in accordance with the phasing.
In comparison to un-signalised roundabouts the difference in capacity of a signalised
roundabout specifically relies on headway during saturated flows. This is due to the

ENG4111/ENG4112 Jarrod Taylor
Signalised Roundabouts Page 22
signalisation eliminating the drivers need for gap acceptance, which heavily reduces the
impact on driver behaviour towards capacity.
The entry capacity for a signalised roundabout treatment can be effectively worked out by:
Q = su (3.5)
Where,
Q = capacity (veh/hr)
s = saturation flow rate (queue discharge) (veh/hr)
u = proportion of time vehicles can depart from the queue
In order to get the saturation flow rate for vehicles entering into the intersection the following
equation is used:
s = 3600/hs (3.6)
Where,
hs = queue discharge headway (seconds)
To find the proportion of time the vehicles are able to discharge into the intersection the
following equation is used:
u = g/c (3.7)
Where,
g = effective green time (seconds)
c = cycle time (seconds)
The capacity of a signalised roundabout is still affected by the roundabout geometry much the
same as the impact it has on un-signalised roundabouts.
There are three key features between signalised roundabouts and conventional signal
controlled intersections that impact on the capacity of the intersection. These are:
• The geometric elements of the intersections.
• The ability to store vehicles within the circulating carriageway of a roundabout.
• The use of the geometric layout of a roundabout to effectively use phasing to reduce
periods of no vehicle movement between phases.
ENG4111/ENG4112 Jarrod Taylor
Signalised Roundabouts Page 23
These features make comparing capacities of signalised roundabouts to signal controlled
intersections unreliable and should not be used as a basis to judge the capacity of a
signalised roundabout on.
Although there is extensive research done into the capacities of signalised intersections
and how they compare to un-signalised roundabouts, there is little research done into the
capacities of signalised roundabouts due to the relatively new implementation of them.
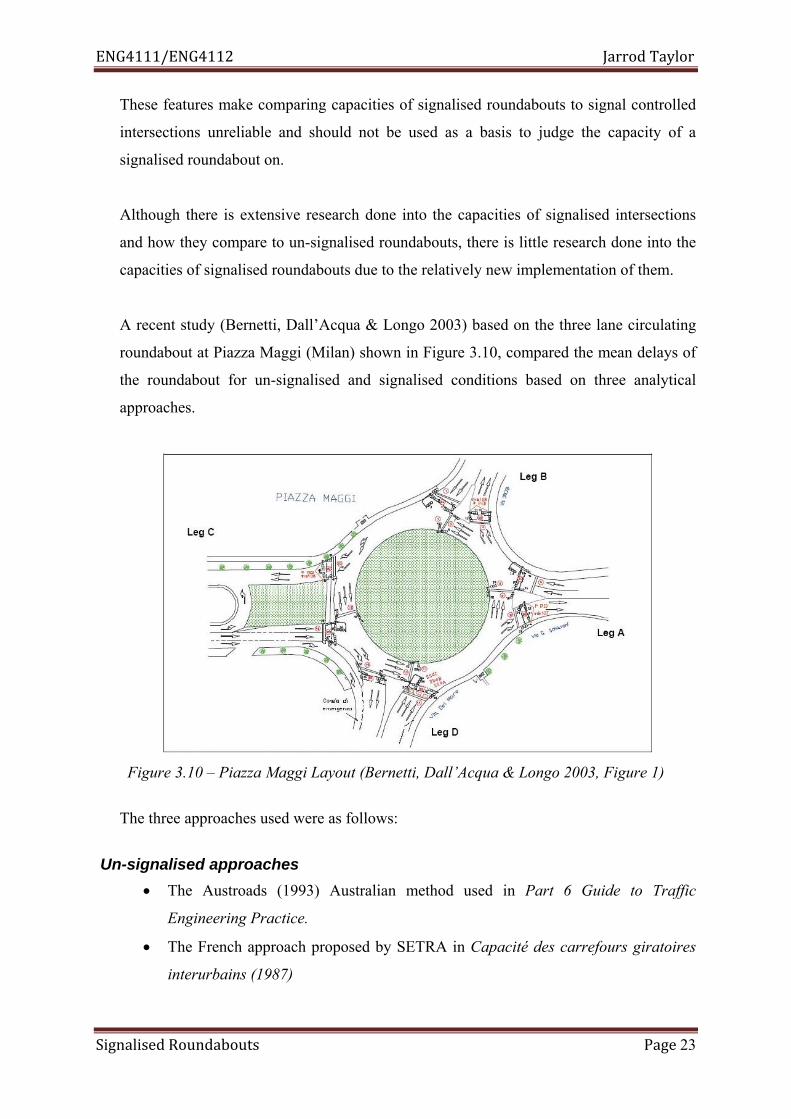
A recent study (Bernetti, Dall’Acqua & Longo 2003) based on the three lane circulating
roundabout at Piazza Maggi (Milan) shown in Figure 3.10, compared the mean delays of
the roundabout for un-signalised and signalised conditions based on three analytical
approaches.
Figure 3.10 – Piazza Maggi Layout (Bernetti, Dall’Acqua & Longo 2003, Figure 1)
The three approaches used were as follows:
Un-signalised approaches • The Austroads (1993) Australian method used in Part 6 Guide to Traffic
Engineering Practice.
• The French approach proposed by SETRA in Capacité des carrefours giratoires
interurbains (1987)

ENG4111/ENG4112 Jarrod Taylor
Signalised Roundabouts Page 24
Signalised approach • The mesoscopic model developed from proceedings of the European Transport
Conference A Mesoscopic model for evaluating Performance of signalised
intersections (2002).
Currently the intersection is a signalised four-leg roundabout that has approximately 7000
passenger car unit per hour pass through the intersection in peak hour flows. The average
entry and circulatory widths are 13m and the inscribed circle diameter is 100m. Figure
3.11 shows the comparison of the mean delays for each approach relating to a percentage
of the 7000 peak hour flow.
Figure 3.11 – Results comparison in terms of mean delays (Bernetti, Dall’Acqua & Longo
2003, Figure 6)
This figure immediately shows that when the percentage of traffic approaches peak hour
flows, the signalised control of the intersection keeps mean delays consistently around 30
seconds. If the roundabout were to be un-signalised the mean delay would rapidly
increase on approach to peak hour flows, increasing from 5 seconds at 80% of peak hour
flow to 70 seconds at 95% of peak hour flow.
There are similar traffic flow characteristics of signal controlled intersections that relate
to signalised roundabouts such as stop flow conditions, headways and pedestrian flows
which will be used in analysing the capacity of signalised roundabouts. These
characteristics will be discussed in further detail in the next section.

ENG4111/ENG4112 Jarrod Taylor
Signalised Roundabouts Page 25
3.3 Traffic flow characteristics As this report analyses the capacity of both signalised and un-signalised roundabouts, this
section will detail the parameters and characteristic used to determine the traffic flow of a
roundabout intersection.
There are several key characteristics of traffic flow that influence the capacity of roundabouts
such as gap acceptance, headway distribution, roundabout geometry, traffic fleet and lane
widths. These characteristics need to be analysed to suit the geographical behaviours of the
designed roundabout due to the varying nature of these characteristics across the world.
3.3.1 Gap Acceptance Gap acceptance is critical in dealing with capacities for un-signalised roundabouts, as a
vehicle has to assess when it is safe to enter into the circulating carriageway. The driver will
make a decision as to what they think is a safe gap which ideally will not impact the
circulating traffic. However during high circulating flow periods drivers tend to forcefully
enter causing circulating traffic to give-way to entering vehicles. This is known as a forced
gap and reversed priority.
Gap Austroads (2008) states that, a gap is the magnitude of the time interval considered
acceptable to undertake a manoeuvre into a conflicting traffic stream and depends on the road
geometry site, the characteristics of the traffic and the nature of the manoeuvre itself. The
definition of a gap presented to an entering vehicle is shown in Figure 3.12.
Figure 3.12 – Definition of a gap (Irvena 2010, Figure 3.3)

ENG4111/ENG4112 Jarrod Taylor
Signalised Roundabouts Page 26
Lag The gap accepted by the driver can be used by more than one vehicle. The following vehicles
that enter within the gap that the first vehicle accepts is said to be using the lag. Lag is the
distance in time between the entering vehicle and the successive vehicle in the major stream
and is shown in Figure 3.13 (Drew 1968, p 177).
Figure 3.13 – Definition of lag (Irvena, 2010, Figure 3.4)
Critical Gap During vehicle entry into the circulating carriageway there is a critical gap which all drivers
will accept. The gap is known as the critical gap which is the minimum accepted gap by all
drivers at all times. It is generally based on the observed gap acceptances and rejections at
existing roundabouts.
For example, ‘Raff and Hart (1950) proposed a method in which a diagram similar to Figure
3.14 is plotted from field observations and the critical gap is taken to be the gap ‘T’
corresponding to the intersection of the acceptance and rejection curves’ (Austroads 2008).
Figure 3.14 – Typical Gap Acceptance behaviour (Austroads 2008, Figure 5.1)

ENG4111/ENG4112 Jarrod Taylor
Signalised Roundabouts Page 27
‘Akçelik (2011) documented a critical gap range of 2.2 to 8.0 seconds and a follow-up
headway of 1.2 to 4.0 seconds’ (Seiberlich 2001). These figures were based on dominant and
subdominant lane utilisation discussed in section 3.4.1.1 of this report.
Further research from Akçelik (2011) shown in Figure 3.15 determines that when circulating
flow approaches a higher capacity the critical gap of the dominant lane will accept a smaller
gap. This relates to driver behaviour, as drivers experiencing longer delays will become more
aggressive in accepting gaps and may cause circulating traffic to give-way forcing reversed
priority.
Figure 3.15 – Critical gap with increased circulating flow (Akçelik, 2011)
3.3.2 Headways
Headway Distribution
Headway is the time between two following vehicles and is measured from the front of the
first vehicle to the front of the following vehicle. The headway distribution is used to describe
the traffic flow in the opposing traffic stream. Headway distribution has a great impact on the
capacity of un-signalised roundabouts. The definition of a headway is shown in Figure 3.16

ENG4111/ENG4112 Jarrod Taylor
Signalised Roundabouts Page 28
Figure 3.16 – Definition of headway (Irvena 2010, Figure 3.6)
Follow-up Headway The time that occurs between the first entering vehicle and successive following vehicles is
called the follow-up headway. This is the distance measured from the same reference point
on each successive car and can only be measured when there is a queue situation. This is
shown in Figure 3.17.
Figure 3.17 – Definition follow-up headway (Irvena 2010, Figure 3.5)
Under signalised conditions the follow-up headway is a major parameter when calculating
entry capacity of an intersection. Due to the red phase of signalisation causing a queue
situation the observed follow-up headway once the signal turns green for vehicles is shown in
Figure 3.18.

ENG4111/ENG4112 Jarrod Taylor
Signalised Roundabouts Page 29
Figure 3.18 – Signalised intersection acceleration headways (HCM 2010, Exhibit 4-6)
The observed headways are varied due to the acceleration of entry into the intersection. The
HCM (2010) shows that after the fourth vehicle follow-up headways become consistent.
The HCM (2010) recommends using the fifth vehicle following the beginning of a green as
the starting point for saturation flow measurements as shown in Figure 3.19.
Figure 3.19 – Concept of saturation flow rate and lost time (HCM 2010, Exhibit 4-7)
The value h represents the saturation headway which is the average constant headway
measured after the fourth entering vehicle after being stopped by a traffic signal. The
saturation flow rate is computed by:
s = 3600 / h
Where:
s = saturation flow rate (veh/hr)
h = saturation headway (s)
(3.8)
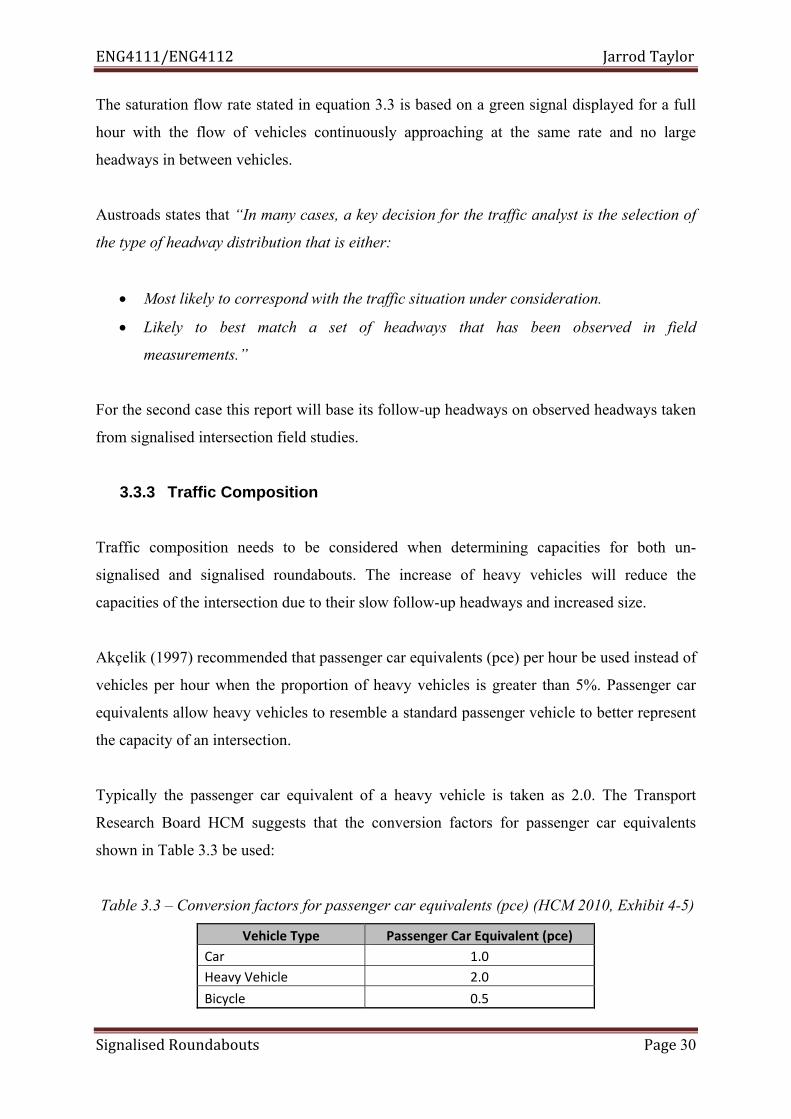
ENG4111/ENG4112 Jarrod Taylor
Signalised Roundabouts Page 30
The saturation flow rate stated in equation 3.3 is based on a green signal displayed for a full
hour with the flow of vehicles continuously approaching at the same rate and no large
headways in between vehicles.
Austroads states that “In many cases, a key decision for the traffic analyst is the selection of
the type of headway distribution that is either:
• Most likely to correspond with the traffic situation under consideration.
• Likely to best match a set of headways that has been observed in field
measurements.”
For the second case this report will base its follow-up headways on observed headways taken
from signalised intersection field studies.
3.3.3 Traffic Composition
Traffic composition needs to be considered when determining capacities for both un-
signalised and signalised roundabouts. The increase of heavy vehicles will reduce the
capacities of the intersection due to their slow follow-up headways and increased size.
Akçelik (1997) recommended that passenger car equivalents (pce) per hour be used instead of
vehicles per hour when the proportion of heavy vehicles is greater than 5%. Passenger car
equivalents allow heavy vehicles to resemble a standard passenger vehicle to better represent
the capacity of an intersection.
Typically the passenger car equivalent of a heavy vehicle is taken as 2.0. The Transport
Research Board HCM suggests that the conversion factors for passenger car equivalents
shown in Table 3.3 be used:
Table 3.3 – Conversion factors for passenger car equivalents (pce) (HCM 2010, Exhibit 4-5)
Vehicle Type Passenger Car Equivalent (pce) Car 1.0Heavy Vehicle 2.0
Bicycle 0.5

ENG4111/ENG4112 Jarrod Taylor
Signalised Roundabouts Page 31
3.3.4 Saturation Flow
Saturation flow measures the volume to capacity ratio of a lane. It is based on the ratio of the
volume of vehicles travelling through the lane to the capacity that the lane is able to provide.
When the degree of saturation reaches 100% the lane is unable to allow any extra demand in
vehicles, if more traffic demand is required the lane will be subject to increasing queue
lengths.
Typical values used in TRL UK methods, for lane saturation flows for signalised roundabouts
are 1900 pcu/hr. For turning movements under full signalised conditions a typical value of
1800 pcu/hr is used.
3.3.5 Roundabout Geometry
Inscribed diameter Un-signalised roundabouts Akçelik (2011) states that with increased inscribed diameter capacity increases for un-
signalised roundabouts and then decreases for very large diameters. Shown in Figure 3.20 is
the capacity and critical degree of saturation based on a percentage scale of a 40m un-
signalised diameter roundabout.
Figure 3.20 – Effective intersection capacity and critical degree of saturation as a function of
inscribed diameter estimated by Australian gap acceptance theory (Akçelik 2011, Figure 5)

ENG4111/ENG4112 Jarrod Taylor
Signalised Roundabouts Page 32
This shows that once the roundabout diameter approaches 4 times that of a 40m roundabout
(160m) the capacity actually decreases. As this report will be based on inscribed diameters of
40m to 60m which are the most common two lane roundabout sizes found within Australia, it
assumes that with the increased inscribed circle diameter the capacity of an un-signalised
roundabout will increase.
Inscribed diameter Signalised roundabouts Although there is not as much research into the effect of the inscribed diameter on signalised
roundabouts compared to un-signalised there are three key areas that the inscribed diameter
will impact on the capacity.
• It can cause longer clearance times between phases due to longer travel path of
vehicle around the central island.
• The ability to use the circulating carriageway as storage area for vehicles in between
phases
• The ability to use longer clearance times along with the geometry of the roundabout to
phase signals effectively so that vehicles are still travelling within phase changes.
These points will be assessed within this report and will examine what impact the
increased diameter has on the capacity of signalised roundabouts.
Entry Lane width and Number of entry lanes The Federal Highway Administration (2000), states that the number of entry lanes is a major
factor for capacity. The increased number of entry lanes effectively doubles the capacity of
the roundabout.
This report will be based on providing two entry lanes for all four approaches into the
circulating carriageway of the roundabout. The entry lane widths will be 4m wide providing
an entry width of 8m in total. These entry lane widths are based on Roads and Maritime
Services (RMS) NSW and Austroads guidelines found in Austroads (2011).
The entry lane width can be critical to the saturation flow through the lane on entering the
roundabout. If the lane widths are too narrow vehicles will feel squeezed on entering thus
reducing their entry speed and reducing the capacity of that lane.

ENG4111/ENG4112 Jarrod Taylor
Signalised Roundabouts Page 33
Circulating lanes Circulating lanes should correspond to the number of entry lanes provided into the
roundabout. This report will examine a two lane circulating carriageway with a circulating
road width of 11m based on RMS and Austroads (2011).
Entry angle The entry angle is governed by the bearing of the entry arm and the radius of the entry curve
into the roundabout. It is desirable to provide a sight angle between 70° to 90° to provide
efficient sight line for approaching traffic.
Entry angles for this research will be based on 90 degree intersection of entry arms with 50m
radius entry curves.
Grades ‘It is generally not desirable to locate roundabouts in locations where grades through the
intersection are greater than four percent’ (FHWA, 2000). Generally large two lane
roundabouts are constructed on relatively flat grades. Due to this case grading will not be
taken into account when calculating capacities of the roundabout.
3.3.6 Lane Widths Standard lane widths used in Australia at roundabout intersections are 3.5m lanes that
increase to 4m on entry into the circulating carriageway. The impact lane widths have on the
capacity of roundabouts is said to be negligible.
The 3.5m lane width has been tested to produce the most effective saturation of flow per lane
at a safe clearance width for vehicles and still is cost effective to build. The increase to 4m
upon approach to the roundabout intersection is to provide extra width for turning vehicles
within the entry radius and increase driver comfort with extra width for entering the
intersection.
The report will examine the effect varying lane widths have on the impact to the capacity of a
roundabout.

ENG4111/ENG4112 Jarrod Taylor
Signalised Roundabouts Page 34
3.4 Analytical Methods & Capacity Measures
3.4.1 Analysis Methods for Un-Signalised Roundabouts Across the world there has been the development of two dominant types of methods to
determine the capacities of un-signalised roundabouts. These include the gap acceptance
theory which is typically used in Australia & USA and empirical regression model which is
typically used in UK, France & Switzerland. Shown in Table 3.4 are the analytical methods
used throughout the world.
Table 3.4 – Analytical methods used across the world un-signalised roundabouts (Bernetti,
Dall’Acqua & Longo 2003, p 3)
Analysis Method Gap Acceptance
TheoryEmpirical Regression
Australia (Austroads) Capacity & Delay France (SETRA) Capacity & Delay France (CETUR) Capacity Germany (Brilon) Capacity Capacity Switzerland (VSS) Capacity Switzerland (Bovy) Capacity United Kingdom (Kimber) Capacity & Delay USA (HCM) Capacity & Delay
Findings from the National Cooperative Highway Research Program (NCHRP, 2007) on US
roundabouts found that the capacity of an un-signalised roundabout cannot be based on
geometry alone. In fact it found that driver behaviour is the largest variable affecting
roundabout performance although ‘geometry in the aggregate sense (number of lanes) has a
clear effect on the capacity of a roundabout entry’ (Akçelik 2009).
The empirical method calculates capacity based on geometry alone as it tried to establish a
worldwide analysis method that eliminates the variability of driver behaviour. The gap
acceptance theory identifies parameters for critical gap, lane utilisation, passenger car
equivalents (pce) of heavy vehicles and follow-up headways, along with the geometry of a
roundabout to better represent the true behaviour of an un-signalised roundabout intersection.
ENG4111/ENG4112 Jarrod Taylor
Signalised Roundabouts Page 35
The gap acceptance theory has been extensively developed by Akcelik who is the founder of
SIDRA Solutions. This theory has been adopted in Australia as parameters used in this theory
have been based on extensive field testing on Australian roads. This section will give a
background on the two dominant theories developed for determining capacities of un-
signalised roundabouts.
3.4.1.1 Analytical (Gap Acceptance)
The simplified gap acceptance theory is based on gap acceptance and headway measures
stated in section 3.1.1 and 3.1.2 respectively. It determines the effective gaps produced from
the circulating flow that allow entering vehicles into the roundabout. With increased
circulating flow, gap acceptance decreases for entering vehicles causing increased delay
times and queue lengths.
Akçelik (2007) claims that the approach of the SIDRA software gap acceptance approach
goes beyond the simplified gap acceptance theory approach. ‘The current Australian analysis
is largely based on field data collected and analysis procedures developed at ARRB’
(Troutbeck 1989).
The base parameters that define the capacity of the roundabout in this theory include:
• Inscribed circle diameter
• Average entry lane width
• Number of circulating lanes
• Number of entry lanes
• Entry capacity
• Ratio of entry flow to circulating flow
This theory also identifies the importance of dominant and subdominant entry lanes based on
their flows. This is due to the fact that dominant and subdominant lanes can have different
critical gap and follow up times. This identification differs from the old Australian NAASRA
1986 model where fixed gap-acceptance parameters were used where follow-up headways =
2.0s and critical gap = 4.0s.
ENG4111/ENG4112 Jarrod Taylor
Signalised Roundabouts Page 36
The importance of the dominant and subdominant approach plays an important role when
dealing with multi lane roundabouts. This is due to the fact that right lane entering vehicles
(left lane for US) have to find a gap across two lanes of circulating traffic where the left lane
can enter only giving away to one lane.
Also taken into account in Akçelik’s gap acceptance theory is the use of passenger car
equivalents (pce) to account for heavy vehicles. Akçelik (1997) recommended that pce per
hour be used in place of vehicles per hour when the proportion of heavy vehicles surpassed
5%.
3.4.1.2 Empirical Regression (Geometric)
The empirical regression model was first developed in the UK by Kimber (1980). ‘In
Kimber’s initial laboratory report (1980) he states that the dependence on entry capacity on
circulating flow depends on the roundabout geometry’ (Seiberlich 2001). The five geometric
elements Kimber defines as having an impact on the capacity of a roundabout are:
• Entry width
• Entry flare
• Inscribed circle diameter
• Angle of entry
• Radius of entry
Kimber (1980) makes two interesting remarks on the use of the gap acceptance theory.
Kimber states that the gap acceptance theory fails to represent the drivers behaviour in
giving-way on approach to the roundabout. He also comments that because of the variance in
driver behaviour it is not practical to apply this theory across the world.
These statements Kimber assumes are based on simple gap acceptance theories that were
developed in the 1980’s. Today Akçelik (2007) claims that the gap acceptance theory goes
beyond a simple approach and includes parameters based on extensive field research and
testing.

ENG4111/ENG4112 Jarrod Taylor
Signalised Roundabouts Page 37
The empirical method does not allow for unequal lane utilisation as it is not based on singular
lane approach use. This limits the empirical method as it does not cater for uneven approach
demands which can be a critical parameter in dealing with multi lane roundabouts.
3.4.2 Analysis Methods for Signalised Roundabouts
Analysis methods for signalised roundabouts will be based on traffic theory approaches
towards typical signal controlled sites. The main difference signalised roundabouts have to
the typical signal controlled site is:
• Roundabout geometry is larger, therefore requiring a longer travel time to navigate
through the intersection.
• The ability to store vehicles within the intersection.
• The ability to use longer clearance times along with the geometry of the roundabout to
phase signals effectively so that vehicles are still travelling within phase changes.
The analysis method will be based on computer simulation using the computer software
LinSig and Excel. The parameters used within Linsig are dealt within Section 3 of this report.
3.4.3 Control Delay Delay is an important measure when analysing interrupted flow system elements. There are
several types of delay, but control delay – the delay brought about by the presence of a traffic
control device – is the principal service measure in the HCM 2010 for evaluating the level of
service (LOS) at signalised and un-signalised intersections (HCM 2010, p 4-15).
Control delay incorporates the delay of a vehicle slowing down in advance of the
intersection, the time spent stopped on the approach and the time spent navigating within the
intersection to their desired exit upon reaching the vehicles desired speed. If the travellers’
desired speed is reached before the exit of the roundabout intersection, the traveller will still
experience geometric delay based on the travel path of the roundabout itself.

ENG4111/ENG4112 Jarrod Taylor
Signalised Roundabouts Page 38
Akçelik (2009) produces tables based on control delay relating to the level of service of the
intersection. The control delay times relating to level of service criteria is shown below in
Table 3.5.
Table 3.5 – Level of service definitions for vehicles based on delay (Source: Akçelik 2009,
Table 4)
This criteria will be used on assessing the capacity of signalised roundabouts along with
discussion of level of service in section 3.4.4.
3.4.4 Level of Service (LOS)
Austroads (2008) quotes “Level of service is a qualitative measure describing operational
conditions within a traffic stream, and their perception by motorists and/or passengers.”
The level of service criteria simplifies the traffic flow parameters such as delay, speed, travel
time, comfort, safety and freedom to manoeuvre into a simplified A to F scale, where A
represents ideal conditions based on the traveller’s perspective and F represents the worst
conditions.
The six levels of service criteria are represented in the Highway Capacity Manual (2010)
detail given in Table 3.6:

ENG4111/ENG4112 Jarrod Taylor
Signalised Roundabouts Page 39
Table 3.6 – Descriptions of Level of service for interrupted flow
LOS A
Primarily free flow operations at average travel speeds, usually about 90% of the FFS (free flow speed) for the given street class. Vehicles are completely unimpeded in their ability to manoeuvre within the traffic stream. Control delay at signalised intersections is minimal.
LOS B
Reasonably unimpeded operations at average travel speeds, usually about 70% of the FFS for the street class. The ability to manoeuvre within the traffic stream is only slightly restricted and control delays at signalised intersections are not significant.
LOS C
Stable operations; however, ability to manoeuvre and change lanes in mid-block locations may be more restricted than at LOS B and longer queues, adverse signal coordination, or both may contribute to lower average travel speeds of about 50% of the FFS for the street class.
LOS D
A range in which small increases in flow may cause substantial increases in delay and decreases in travel speed. LOS D may be due to adverse signal progression, inappropriate signal timing, high volumes, or a combination of these factors. Average travel speeds are about 40% of FFS.
LOS E
Characterised by significant delays and average travel speeds of 33% of the FFS or less. Such operations are caused by a combination of adverse progression, high signal density, high volumes, extensive delays at critical intersections and inappropriate signal timing.
LOS F Characterised by urban street flow at extremely low speeds, typically 25% to 33% of the FFS. Intersection congestion is likely at critical signalised locations, with high delays, high volumes and extensive queuing.
Level of service is based on a step function. HCM 2010 states ‘An increase in average
control delay of 12 s at a traffic signal, for example, may result in no change in LOS, a drop
of one level, or even a drop of two levels, depending on the starting value of delay.’ This is
represented in Figure 3.21.
Figure 3.21 – Step function nature of Level of Service (HCM 2010, Exhibit 5-1)

ENG4111/ENG4112 Jarrod Taylor
Signalised Roundabouts Page 40
This shows that a increase of delay of 12 seconds may not necessarily decrease the level of
service criteria as it depends on the original average delay. Even though the driver will
experience a decreased level of service through the intersection, this will not be reflected
under the A to F level of service criteria. This should be noted when assessing the delay of an
intersection based on level of service criteria.
Level of service can also relate to the degree of saturation. The degree of saturation is the
demand at the roundabout entry to the capacity of the entry. This is measured as a volume to
capacity ratio and can be used as well for the ratio of total entering volumes to the total
capacity of the roundabout.
Akçelik (2009) produces the table shown in Table 3.7 which determines the level of service
criteria to both the delay and degree of saturation.
Table 3.7 – Level of service definitions for vehicles based on both delay and degree of
saturation (Source: Akçelik 2009, Table 5)
Table 3.7 will be used as the basis in determining the limits of capacity for the examined
signalised roundabouts analysed using the LinSig software.
ENG4111/ENG4112 Jarrod Taylor
Signalised Roundabouts Page 41
3.5 Computer Software Modelling
The computer software modelling will take into account key design features stated in the
previous section and apply them in the development of the roundabout model to analyse the
capacity of the roundabout when applied with various traffic volumes. The computer
software modelling package that will be used for this project is LinSig.
3.5.1 LinSig
‘LinSig is a computer software package for the assessment and design of traffic signal
junctions either individually or as a network comprised of a number of junctions’ (JCT,
2011). The software was established in the United Kingdom and has been developed through
numerous versions since 1985.
‘It differs from other simpler computer software modelling packages such as SIDRA, as it
can be used for multiple traffic signal junctions, complex compound junctions such as
signalised roundabouts and road networks which may include traffic signal pedestrian
crossings and priority junctions as well as traffic signal junctions’ (JCT, 2011).
Linsig’s input data specifies traffic flows as sets of origin to destination matrices that gives
entry to exit movement. These movements form the basis of the lane flow diagrams LinSig is
able to develop.
3.5.2 Level of Service (LOS) Linsig allows the user to optimise the traffic flow of the intersection across two different
approaches. The two approaches are:
• Delay based assignment
• Entry lane balancing
Delay based assignment will assign traffic to routes so that the journey time between routes
with the same origin and destination zones are as equal as possible.

ENG4111/ENG4112 Jarrod Taylor
Signalised Roundabouts Page 42
Entry lane balancing will allocate traffic to routes in order to balance the entry arm lanes as
equally as possible.
Linsig also uses a maximum base degree saturation of 90% when optimising cycle times.
This makes the program alter cycle times to keep the degree of saturation of each lane
throughout the intersection to a maximum 90% degree of saturation.
The 90% value is used to leave a 10% margin of error when calculating the mean maximum
queue length over the hour period. This is used to eliminate peak values over the hour period
that will exceed the 90% value and allows the lane to stay under the 100% degree of
saturation. If the value was able to exceed the 100% degree of saturation, the intersection
would be subjected to an increasing queue length causing it to fail in the demand for capacity.

ENG4111/ENG4112 Jarrod Taylor
Signalised Roundabouts Page 43
4. DESIGN AND METHODOLOGY
4.1 Aims and Objectives The projects aim is to investigate the capacity of a two lane signalised roundabout based on
the phasing structure stated in section 3.2.2 and section 4.4.
The basic programme of the project is as follows:
• A complete review of local and overseas researches on traffic flow characteristics at
un-signalised and signalised roundabouts.
• Develop traffic capacity models with various radii using Excel and LinSig, which is a
computer software programme that assesses the design of signalised roundabouts and
intersections.
• Apply uniform traffic flows to each leg of the intersection and assess the impact of
traffic flows on queue lengths and level of service.
• Establish relationships between design parameters (radius, queue discharge headways,
phase cycle times) and the capacity of a signalised roundabout.
• Compare the traffic flow capacity of signalised roundabouts to conventional un-
signalised roundabout designs.

ENG4111/ENG4112 Jarrod Taylor
Signalised Roundabouts Page 44
4.2 Methodology The basis of determining the capacity of a roundabout can be seen from the HCM (2010)
shown in Figure 4.1.
Figure 4.1 – Roundabout Analysis Methodology (HCM 2010, Exhibit 21-9)

ENG4111/ENG4112 Jarrod Taylor
Signalised Roundabouts Page 45
Figure 4.2 represents the methodology determined from the HCM (2010) of calculating
automobile performance for a signalised intersection.
Figure 4.2 – Signalised Intersection Analysis Methodology (HCM 2010, Exhibit 18-11)

ENG4111/ENG4112 Jarrod Taylor
Signalised Roundabouts Page 46
The methodology described in Figure 4.2 has to be combined with Figure 4.1 to determine
the required inputs for the computer software packages LinSig and Excel. The required
methodology for this project is to:
• Research common inscribed diameter sizes used for two lane roundabouts across
Australia.
• Base input data on the research provided in section three of this report and also on
field research conducted. Data required to analyse the capacities of signalised
roundabouts can be found in Table 4.1.
• Develop LinSig and Excel models based on variable inscribed diameters designed
using Austroads (2011) standards for roundabout layouts.
• Input data based on research and field tests into the Linsig and Excel models to allow
the computer model to calculate capacities.
• Apply uniform demand flow rates for vehicles across all approach legs.
• Analyse LOS and degree of saturation of lanes to determine when the intersection
reaches capacity.
• Compare the flow rates with the capacity of an un-signalised case.
• Compare all documented results within LinSig and Excel from uniform demand flows
on both signalised/un-signalised cases.
• Discuss and report results.
• Conclude discussions based on results.

ENG4111/ENG4112 Jarrod Taylor
Signalised Roundabouts Page 47
4.3 Data inputs for Linsig Models
Table 4.1 represents the data inputs required to be input into the LinSig models to determine
the capacity, delay and LOS criteria.
Table 4.1 – Input data for LinSig models
Data Category Input Data Element Input Basis
Traffic Characteristics
Demand Flow Rate Variable flow rates applied Origin to destination matrix Variable matrices applied Percent Heavy Vehicles All flows will be in pcu Pedestrian flow rate Variable flow rates applied Bicycle flow rate Variable flow rates applied
Follow‐up headway Based on field research
Geometric Design
Number of lanes 2 Average lane width 3.5m
Number of receiving lanes 2 Lane Length greater than 500m
Geometric DelayBased on inscribed diameter inserted by
cruise times Approach grade 0%
Signal Control
Type of signal control Pre‐timed Phase sequence Refer to Figure 4.3 Section 4.4Green time Variable length ‐ same time for each leg
Yellow change time 3 seconds Red clearance Variable (refer to section 4.4.1)
Pedestrian/cyclist walk time Variable based on distance Pedestrian/cyclist clear time 6 seconds
Other Analysis period duration 60, 75, 90 and 105 second cycle time
Speed Limit 60km/h Area type Variable depending on inscribed diameter

ENG4111/ENG4112 Jarrod Taylor
Signalised Roundabouts Page 48
4.4 Phase Sequence The phase sequence used to analyse the signalised roundabout models is different to the
general phase sequence used in the United Kingdom and is shown in Figure 4.3.
Figure 4.3 – Phase sequence used to examine capacity of signalised roundabout
This phase sequence allows access for one approach leg to enter the circulating carriageway
during a single phase with the U-turn movements being subject to a red signal within the
circulating carriageway. Due to the small demand for this movement storage is provided
within the circulating carriageway.
The pedestrian movement to the right of the entering leg is phased green within this phase
when pedestrian demand is needed. Pedestrians and cyclist are able to walk to their desired
exit path within the central island and cross again when the corresponding phase is available.
Pedestrian movement timings from (Akçelik & Associates 2001) are based on a
recommended walking time of 1.0 and 1.2m/s corresponding to the 5th and 15th percentile
speeds, respectively. This represents that 15% of all pedestrians recorded moved slower than
the 1.2m/s speed and 5% moved slower than 1m/s.

ENG4111/ENG4112 Jarrod Taylor
Signalised Roundabouts Page 49
On transition between phases the stored U-turn movements within the circulating
carriageway are located ahead of the next entering phase and are able to complete their
desired movement whilst the next entering phase approaches.
Due to the rotation of the phase in a counter-clockwise manner, the geometry of the
roundabout is able to be utilised in such a way that vehicles can still be using the intersection
whilst the next phase can proceed. The majority of vehicles that will be travelling whilst the
following phase has been activated will be the right turn movements as these require the
longest travel times due to the geometric delay.
The UK general phasing technique will be analysed as well to determine the capacities it is
able to handle before reaching capacity. The general approach of the UK phasing can be seen
diagrammatically in Appendix D and is discussed in section 3.2.2.
4.4.1 Signal Controller Settings
Signal controller settings for the phase sequence have been based on the Austroads (2003,
Table C.2) guidelines and are shown below in Table 4.2
Table 4.2 – Austroads Signal Controller Settings
Through and Left-
Turn Movements (s)
Arrow-Controlled Right-
Turn Movements (s)
Pedestrian
Settings (s)
Minimum Green 5 – 10 5 – 6
Yellow Time 3.0 – 5.0 3.0 to 6.0
All-Red Time 1.0 – 3.0 1.0 – 3.0
Walk Time 5 – 16
Clearance Time 6 – 20
The all-red time or red clearance time is used between the end of the yellow phase for the
preceding signal phase and the beginning of the green on the next phase. Austroads (2003)
states that the purpose of the all-red interval is to provide a safe clearance for vehicles that
cross the stop line towards the end of the yellow interval since they may be in danger of
collision with vehicles or pedestrians released in the following phase or signal group.

ENG4111/ENG4112 Jarrod Taylor
Signalised Roundabouts Page 50
An all-red clearance time of 2 seconds will be assessed to comply with this table, however
due to the geometry of a signalised roundabout it is likely that a clearance time of 0 seconds
would be applied for the standard phasing technique as there is no distance a vehicle is
required to cross before the following phase can proceed.
Figure 4.4 taken from Austroads (2003) shows the all-red clearance time as a function of
speed and clearance distance. This will be used as a basis in providing an appropriate all-red
interval time for the UK phasing technique due to clearance times of entering vehicles
conflicting with green phase of the inner lane storage vehicles.
Figure 4.4 – All-red time as a function of speed and clearance distance (Austroads 2003,
Figure C.5)
This is subject to the all-red time being greater than one second in length.

ENG4111/ENG4112 Jarrod Taylor
Signalised Roundabouts Page 51
4.5 Inscribed diameters of existing two lane roundabouts in NSW, Australia
Current standards (Austroads 2011) used by the Roads and Maritime Services NSW state that
a desirable minimum of 40m be used for the inscribed diameter for a two lane roundabout,
when the largest design vehicle using the intersection is a 26.0m B-Double.
Three areas within New South Wales, Australia have been chosen as a sample set to
determine the average size used for two lane rural / urban roundabouts. These areas include:
• Newcastle / Hunter Valley Region
• Central Coast
• Grafton
Represented in Figure 4.5 and Table 4.3 are the roundabout locations and diameters within
the Newcastle/Hunter Region that represent a four leg two lane roundabout.
Figure 4.5 – Newcastle/Hunter Valley existing roundabout locations
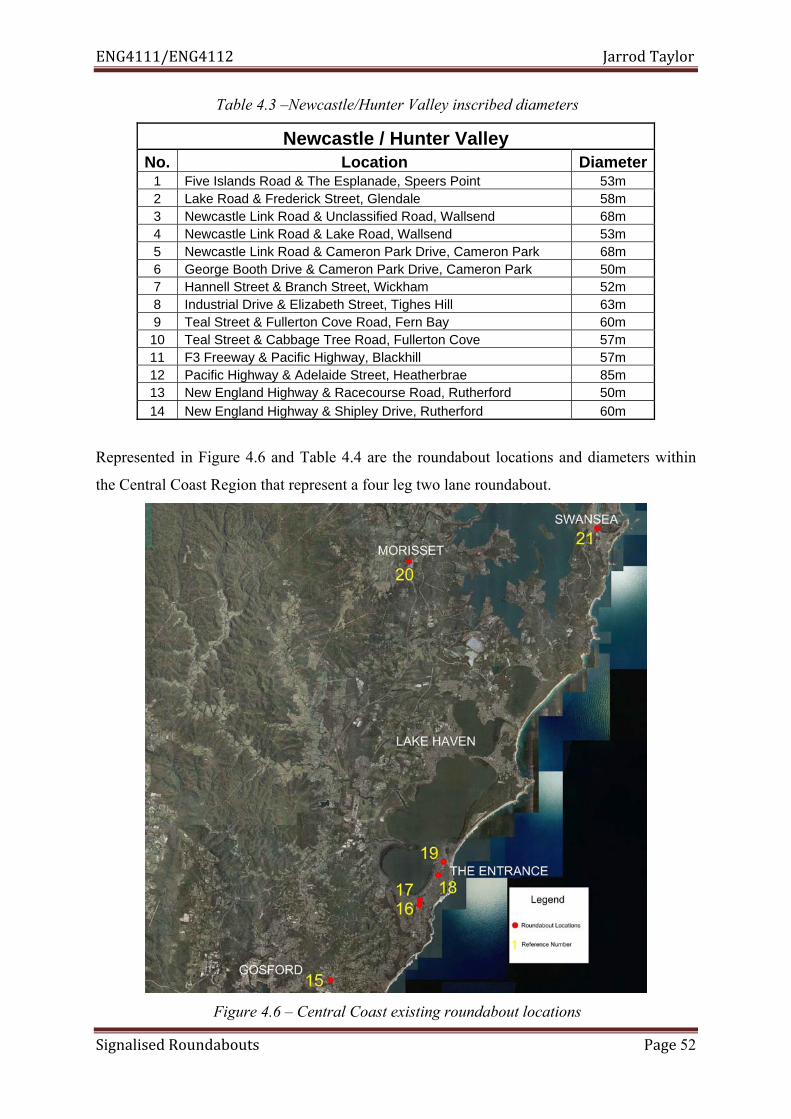
ENG4111/ENG4112 Jarrod Taylor
Signalised Roundabouts Page 52
Table 4.3 –Newcastle/Hunter Valley inscribed diameters
Newcastle / Hunter Valley No. Location Diameter
1 Five Islands Road & The Esplanade, Speers Point 53m 2 Lake Road & Frederick Street, Glendale 58m 3 Newcastle Link Road & Unclassified Road, Wallsend 68m 4 Newcastle Link Road & Lake Road, Wallsend 53m 5 Newcastle Link Road & Cameron Park Drive, Cameron Park 68m 6 George Booth Drive & Cameron Park Drive, Cameron Park 50m 7 Hannell Street & Branch Street, Wickham 52m 8 Industrial Drive & Elizabeth Street, Tighes Hill 63m 9 Teal Street & Fullerton Cove Road, Fern Bay 60m 10 Teal Street & Cabbage Tree Road, Fullerton Cove 57m 11 F3 Freeway & Pacific Highway, Blackhill 57m 12 Pacific Highway & Adelaide Street, Heatherbrae 85m 13 New England Highway & Racecourse Road, Rutherford 50m 14 New England Highway & Shipley Drive, Rutherford 60m
Represented in Figure 4.6 and Table 4.4 are the roundabout locations and diameters within
the Central Coast Region that represent a four leg two lane roundabout.
Figure 4.6 – Central Coast existing roundabout locations

ENG4111/ENG4112 Jarrod Taylor
Signalised Roundabouts Page 53
Table 4.4 –Central Coast inscribed diameters
Central Coast No. Location Diameter 15 The Entrance Road & Carlton Road, Erina Heights 37m 16 The Entrance Road & Eastern Road, Bateau Bay 43m 17 The Entrance Road & Wyong Road, Bateau Bay 45m 18 The Entrance Road & Oakland Avenue, The Entrance 32m 19 The Entrance Road & Coral Street, The Entrance 32m 20 Mandalong Road & Gateway Boulevard, Morisset 50m 21 Pacific Highway & Bowman Street, Swansea 50m
The roundabouts stated in Table 4.3 that are below an inscribed diameter of 40m (15, 18 and
19) are typically found in an urban environment. As this report is more focused on a rural
environment, inscribed diameters lower than 40m will be disregarded as it is not desirable,
according to NSW road standards.
Represented in Figure 4.7 and Table 4.5 are the roundabout locations and diameters within
the Grafton Region that represent a four leg two lane roundabout.
Figure 4.7 – Grafton existing roundabout locations

ENG4111/ENG4112 Jarrod Taylor
Signalised Roundabouts Page 54
Table 4.5 –Grafton inscribed diameters
Grafton No. Location Diameter 22 Summerland Way & Ryan Street, Grafton 38m 23 Summerland Way & Through Street, Grafton 34m 24 Pound Street & Duke Street, Grafton 40m 25 Summerland Way & Fitzroy Street, Grafton 34m 26 Summerland Way & Pound Street, Grafton 38m 27 Summerland Way & Dobie Street, Grafton 40m
After assessment of the roundabout diameters across the three sample areas it can be seen that
the majority of two lane roundabout diameters range from 40m to 60m in diameter.
Diameters smaller than 40m are typically found in a more urban environment and
roundabouts with a diameter larger than 60m are typically found at rural locations at the end
of major freeway / highway roads.
This report will assess two roundabout models based on a 50m and 60m inscribed diameter to
represent a common two lane rural roundabout example.

ENG4111/ENG4112 Jarrod Taylor
Signalised Roundabouts Page 55
4.6 Field Research
Field research was conducted to determine Australian driver characteristics for key variables
such as geometric delay and headway times which are heavily influenced on driver
behaviour. These variables were measured at existing locations within the Newcastle and
Hunter Region.
4.6.1 Geometric Delay
Geometric delay travel times were observed at two existing 52m and 63m inscribed diameter
roundabouts, these observations will be used as a basis for the geometric delay data input
within the computer modelling.
Each turn movement was observed from specific locations shown in Figures 4.8 and 4.9 for
the 52m and 63m inscribed diameter roundabouts respectively. The travelling time for the
vehicle entering and exiting the roundabout was recorded using a standard stopwatch.
Figure 4.8 – Geometric delay observations 52m inscribed diameter roundabout

ENG4111/ENG4112 Jarrod Taylor
Signalised Roundabouts Page 56
Figure 4.9 – Geometric delay observations 63m inscribed diameter roundabout
The travel lengths and average travel times for the 52m inscribed diameter roundabout based
on a large car are shown in Table 4.6. The data sheets used to determine this average can be
found in Appendix C.
Table 4.6 – Average cruise speed and geometric delay for a 52m inscribed diameter
roundabout
52m Inscribed Diameter Movement Distance
(m) Average Cruise Speed (km/h)
Average Geometric Delay (s)
Left turn movement 12 13.09 3.30 Through movement 53 26.34 7.24 Right turn movement 83 25.68 11.64
The travel lengths and average travel times for the 63m inscribed diameter roundabout based
on a large car are shown in Table 4.7. The data sheets used to determine this average can be
found in Appendix C.

ENG4111/ENG4112 Jarrod Taylor
Signalised Roundabouts Page 57
Table 4.7 – Average cruise speed and geometric delay for a 63m inscribed diameter
roundabout
63m Inscribed Diameter Movement Distance
(m) Average Cruise Speed (km/h)
Average Geometric Delay (s)
Left turn movement 19 16.33 4.19 Through movement 60 27.91 7.74 Right turn movement 102 25.79 14.24
It is to be noted that each result recorded was uninfluenced by on coming vehicles that may
cause the vehicle to increase in acceleration when entering the roundabout. This is to reflect
signalised conditions where a vehicle will not be forced to identify a suitable gap to enter the
roundabout, but will enter under a prioritised green phase during the signalised cycle time.
When entering this parameter into the LinSig models it will be entered based on average
cruise speeds and based on a distance that corresponds to the current standards (Austroads
2011) used in NSW for the corresponding inscribed diameter.
Distances for the corresponding movements and inscribed diameters based on the current
Austroad standards using a 50m entry and 100m exit curves are shown in Table 4.8.
Table 4.8 – Distances of various turning movements for the corresponding roundabout
diameters based on Austroad standards
50m Inscribed Diameter 60m Inscribed Diameter Movement Distance
(m) Movement Distance
(m) Left turn movement 12 Left turn movement 19 Through movement 47 Through movement 63 Right turn movement 76 Right turn movement 98
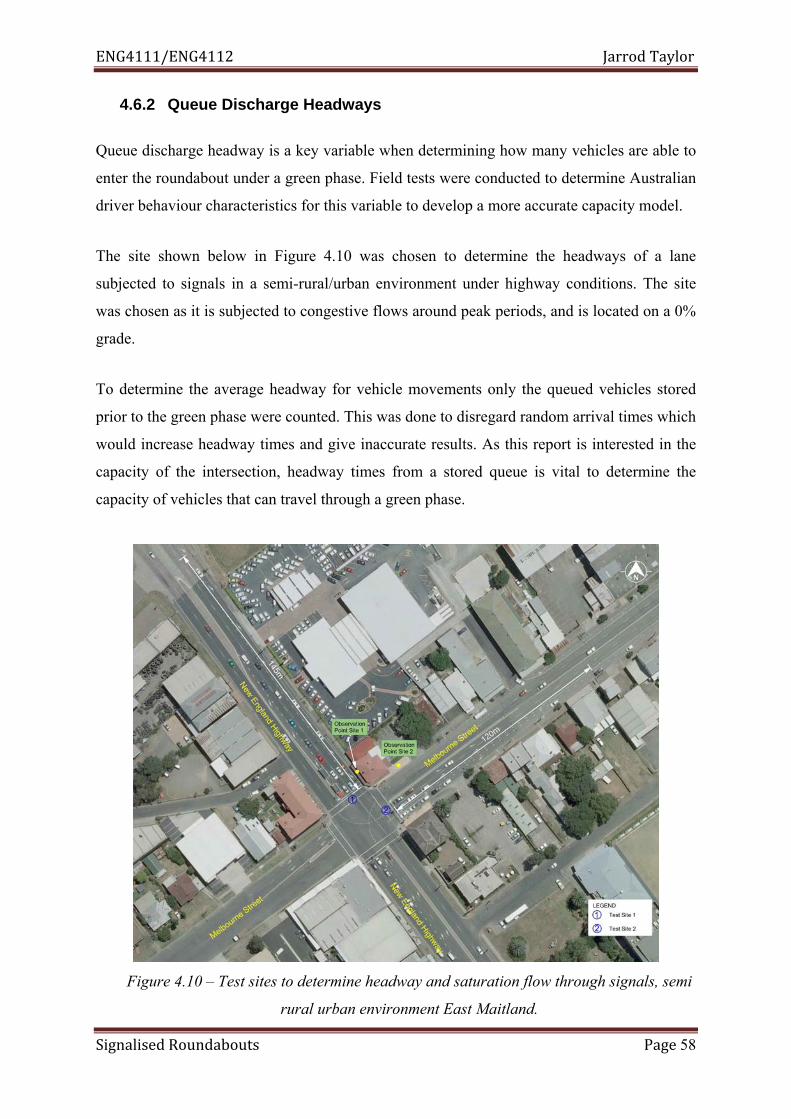
ENG4111/ENG4112 Jarrod Taylor
Signalised Roundabouts Page 58
4.6.2 Queue Discharge Headways
Queue discharge headway is a key variable when determining how many vehicles are able to
enter the roundabout under a green phase. Field tests were conducted to determine Australian
driver behaviour characteristics for this variable to develop a more accurate capacity model.
The site shown below in Figure 4.10 was chosen to determine the headways of a lane
subjected to signals in a semi-rural/urban environment under highway conditions. The site
was chosen as it is subjected to congestive flows around peak periods, and is located on a 0%
grade.
To determine the average headway for vehicle movements only the queued vehicles stored
prior to the green phase were counted. This was done to disregard random arrival times which
would increase headway times and give inaccurate results. As this report is interested in the
capacity of the intersection, headway times from a stored queue is vital to determine the
capacity of vehicles that can travel through a green phase.
Figure 4.10 – Test sites to determine headway and saturation flow through signals, semi
rural urban environment East Maitland.

ENG4111/ENG4112 Jarrod Taylor
Signalised Roundabouts Page 59
Table 4.9 – Headway and saturation flow data East Maitland site
Date 29/08/2012 Time 16:30 to 17:30 Date 30/08/2012 Time
16:30 to 17:30
Location East
Maitland Weather Fine Location East
Maitland Weather Fine
TEST SITE 1 TEST SITE 2
Test Time (s)
Number of
Vehicles
Headway (s)
Saturation flow
(veh/hr) Test
Time (s)
Number of
Vehicles
Headway (s)
Saturation flow
(veh/hr)
1 27.6 14 1.97 1826 1 10.8 5 2.16 1667 2 24.5 12 2.04 1763 2 19.1 9 2.12 1696 3 26.0 13 2.00 1800 3 17.2 8 2.15 1674 4 21.0 12 1.75 2057 4 14.1 6 2.35 1532 5 20.8 10 2.08 1731 5 19.5 9 2.17 1662 6 20.6 9 2.29 1573 6 22.5 11 2.05 1760 7 26.4 14 1.89 1909 7 22.5 12 1.88 1920 8 25.5 13 1.96 1835 8 19.8 10 1.98 1818 9 22.4 12 1.87 1929 9 17.0 8 2.13 1694 10 23.8 12 1.98 1815 10 16.8 8 2.10 1714 11 19.8 10 1.98 1818 11 18.8 9 2.09 1723 12 23.4 12 1.95 1846 12 14.8 7 2.11 1703 13 26.1 13 2.01 1793 13 14.6 7 2.09 1726 14 18.9 10 1.89 1905 14 20.2 10 2.02 1782 15 19.2 10 1.92 1875 15 22.8 12 1.90 1895 16 22.3 11 2.03 1776 16 18.6 9 2.07 1742 17 22.8 11 2.07 1737 17 13.4 6 2.23 1612 18 16.8 9 1.87 1929 18 20.4 10 2.04 1765 19 19.2 10 1.92 1875 19 19.5 10 1.95 1846
20 21.8 11 1.98 1817 20 16.8 8 2.10 1714
Average 1.97 1830 Average 2.08 1732
The average headway for the through movement (test site 1) for this site was 1.97 seconds
which equals to a lane saturation flow of 1830 veh/hr. The average headway time for the right
turn movement (test site 2) was a bit larger at 2.08 seconds giving a lane saturation value of
1732 veh/hr. The right turn movement seemed to incur a larger headway time due to the
driver’s caution when navigating the movement.

ENG4111/ENG4112 Jarrod Taylor
Signalised Roundabouts Page 60
The site shown below in Figure 4.11 was chosen to determine the queue discharge headway
of a lane subjected to signals in an urban environment. The site was chosen as it is subjected
to congestive flows around peak periods, low heavy vehicle traffic and is located on a 0%
grade.
Figure 4.11 – Test sites to determine headway and saturation flow through signals, urban
environment Newcastle.
Shown in Table 4.10 is the queue discharge headway data taken for the urban Newcastle site.
The average headway for a through movement (test site 1) was calculated to be 1.89 seconds
which equals to a saturation flow of 1903 veh/hr. The average headway time for the right turn
movement (test site 2) was a bit larger at 1.92 seconds giving a lane saturation value of 1878
veh/hr.

ENG4111/ENG4112 Jarrod Taylor
Signalised Roundabouts Page 61
Table 4.10 – Headway and saturation flow data Newcastle site
Date 6/08/2012 Time 08:00 to 09:00 Date 8/08/2012 Time
16:30 to 17:30
Location Newcastle Weather Fine Location Newcastle Weather Fine
TEST SITE 1 TEST SITE 2
Test Time (s)
Number of
Vehicles
Headway (s)
Saturation flow
(veh/hr) Test
Time (s)
Number of
Vehicles
Headway (s)
Saturation flow
(veh/hr)
1 18.9 10 1.89 1905 1 15.9 8 1.99 1811 2 21.8 11 1.98 1817 2 9.4 5 1.88 1915 3 21.0 11 1.91 1886 3 18.1 10 1.81 1989 4 20.9 11 1.90 1895 4 19.4 10 1.94 1856 5 15.5 8 1.94 1858 5 16.9 9 1.88 1917 6 18.2 9 2.02 1780 6 17.4 9 1.93 1862 7 25.6 14 1.83 1969 7 15.7 8 1.96 1834 8 16.4 9 1.82 1976 8 13.8 7 1.97 1826 9 23.1 13 1.78 2026 9 13.4 7 1.91 1881 10 26.4 14 1.89 1909 10 17.0 9 1.89 1906 11 23.4 13 1.80 2000 11 18.5 10 1.85 1946 12 21.2 11 1.93 1868 12 18.6 10 1.86 1935 13 19.0 10 1.90 1895 13 19.4 10 1.94 1856 14 15.3 8 1.91 1882 14 15.5 8 1.94 1858 15 17.9 9 1.99 1810 15 16.0 8 2.00 1800 16 17.2 9 1.91 1884 16 17.3 9 1.92 1873 17 23.3 13 1.79 2009 17 18.8 10 1.88 1915 18 17.5 9 1.94 1851 18 17.4 9 1.93 1862 19 21.0 11 1.91 1886 19 17.8 9 1.98 1820
20 25.8 14 1.84 1953 20 13.3 7 1.90 1895
Average 1.89 1903 Average 1.92 1878
The lane saturation flows between the two locations differ fairly significantly between the
corresponding movements. For the through movement the difference between locations is
73 veh/hr and for the right turn movements it is 146 veh/hr.
This difference may correspond to the driving environment, as in an urban environment
vehicles may be more used to signalised intersections and driving more closely behind
vehicles leading to a decreased headway and an increased saturation flow. Another
observation made was that within the urban location the road fleet was generally made up of
smaller vehicles that were able to accelerate more quickly than other larger vehicles such as
four wheel drives which were more common on the East Maitland site.
ENG4111/ENG4112 Jarrod Taylor
Signalised Roundabouts Page 62
The implications from these test show that it may be necessary to provide different models to
accurately evaluate the capacity of a roundabout depending on its intended location. When
evaluating the existing roundabout locations from section 4.5 of this report, it can be seen that
the majority of roundabouts are located in a semi-rural environment. This environment is
better represented by the test location conducted in East Maitland which represents a semi
rural highway intersecting with a major local road.
Due to these findings two models will be analysed to evaluate the differing capacities due to
the location of the roundabout. One model will represent the semi-rural/urban environment
which will have a queue discharge lane saturation flow of 1800 veh/hr. The other will
represent an urban environment which will have a queue discharge lane saturation flow of
1900 veh/hr.
The lane saturation flows were weighted more heavily to the through movement test values
(test site 1) than the right turn movements (test site 2), conducted at the signalised junctions
as the entering movement into a roundabout intersection is not as severe as the right turn
movements tested.
The saturation flows for the left turn movement is also expected to be greater than the
recorded average saturation flow of 1732 & 1878 veh/hr for the right turn movements. This is
due to the geometry of the left turn movement at a roundabout not being as severe as the right
turn movement at a signalised junction. Therefore it is expected that the saturation flow will
more closely resemble that of a through movement.

ENG4111/ENG4112 Jarrod Taylor
Signalised Roundabouts Page 63
4.7 Implications/Consequential Effects
4.7.1 Safety
The safety implications of the project are onsite field testing of follow-up headways. Each
specified site will have to be assessed to Roads and Maritime Services (RMS) requirements.
This involves a risk assessment of each site prior to commencement of survey to eliminate
any risks of injury sustained while gathering information under live traffic.
In relation to the aims and objectives of the project itself, the safety implications can be
beneficial to the community due to the safety benefits of signalisation of roundabouts towards
cyclists and pedestrians. Also with the signalisation of roundabouts it eliminates drivers
running the risk of entering under undesirable critical gap times which can lead to accidents.
Instead of current trends of replacing un-signalised roundabouts that have exceeded their
intended capacity into standard signalised traffic control sites that allow high angle collisions,
these existing roundabouts can be retro-fitted with signals which allows a safer and more
sustainable outcome for traffic.
4.7.2 Sustainability
Due to the large reliance on transport worldwide the benefits in determining sufficient
intersection treatments can have a significant impact on the sustainability of the road
network. Engineers today are responsible for designing for the future and being sustainable so
the impact of being able to retrofit existing un-signalised roundabouts with signalisation that
may increase the design life for years to come can have great benefits.
Increasing the capacity of an intersection can have a positive impact on the reduced emissions
of vehicles that would occur if they were forced to wait in queues stopping and starting for
extended periods of time. Also being able to retrofit existing roundabouts provides minimal
impact on the surrounding environment when a new intersection such as grade separated
interchange may be thought to be necessary.
This report will determine whether these issues will be able to be addressed through the
implementations of signalised roundabouts.
ENG4111/ENG4112 Jarrod Taylor
Signalised Roundabouts Page 64
5. LINSIG MODELS
Signalised roundabout models were set up in LinSig based on the variables determined from
both field research and research conducted worldwide. These models were then applied with
uniform traffic flows to determine when a section or the intersection as a whole reaches
capacity.
Variables such as the cruise speed of a vehicle and distance of the vehicle path around the
roundabout are put into the LinSig model by the lane connecters which join each specified
lane. The saturation flow, lane widths and phase sequence variables are determined from the
information placed in the lane component of the model. All the other parameters are set up in
their own specific area within the LinSig program.
Due to the variability of phase sequences that can be applied to a signalised roundabout the
capacities for both the general phase sequence used in the UK and the one specified in section
4 (standard phasing) will be determined for the capacity of a signalised roundabout.
The un-signalised model was developed using saturation flows based on the UK TRL method
which determine that a saturation flow of 1000 veh/hr is to be used for a give way junction at
a roundabout. A coefficient of 0.33 is used as the intercept value for the opposing circulating
carriageway flow to determine when a vehicle will enter the roundabout.
These values stated above are used in standard modelling practice within the UK by the
developers of the LinSig program. The saturation flows and coefficients for opposed
movements developed by JCT Consulting is shown in Figure 5.1.
This method does not take driver behaviour into account and when modelled using the above
mentioned values it provides a total capacity value of 4800 veh/hr. This is unrealistic as it
represents an ideal case where all traffic volumes are working in complete unison and does
not reflect real life conditions.

ENG4111/ENG4112 Jarrod Taylor
Signalised Roundabouts Page 65
Due to this the un-signalised LinSig models will not be included for evaluation. Therefore the
capacities of the signalised models that are determined will be compared to research
conducted by HCM (2010) and Tan (2001) for comparison to an un-signalised situation.
Shown in the following sections are diagrammatic views of the LinSig models
Figure 5.1 – Saturation flows and coefficients for opposed movements developed by JCT
Consulting

ENG4111/ENG4112 Jarrod Taylor
Signalised Roundabouts Page 66
5.1 Signalised Roundabout 50m diameter
The 50m roundabout models have been modelled using the parameters measured in the field
research to determine the effective capacities of the intersection. Two phasing structures have
been modelled, one which is based on standard traffic controlled signal (TCS) site practices
currently used in Australia and the other more complex phasing structure used in the United
Kingdom.
The 50m inscribed diameter roundabout geometry details developed, based on Austroads
(2011) standards are shown in Table 5.1. These values are developed based on a 50m entry
radius and a 100m exit radius. The design vehicle used is a 26.0m B double.
Table 5.1 – 50m Inscribed diameter geometric elements
ELEMENT LENGTH (m) CRUISE SPEEDS (km/h)
Entry Radius 50
Exit Radius 100
Left Turn Travel Distance 12 13
Through Movement Travel Distance 47 26
Right Turn Travel Distance 76 26
Inner lane Storage 14
5.1.1 Standard Phasing
This phasing structure is a simplistic method where one leg is signalised green and the other
three legs are stopped in the red phase. This can be represented in LinSig typically as a
standard four way traffic controlled signal site as shown in Figure 5.2, however special
consideration needs to be taken into account for U-turn movements.
If U-turn movements exceed the capacity of the inner lane storage within the phase time, this
will cause excessive delays due to the excess queues blocking access for right turn
movements within the intersection. When this event happens it will cause the intersection to
fail in handling capacities.

ENG4111/ENG4112 Jarrod Taylor
Signalised Roundabouts Page 67
50m Signalised RoundaboutPRC: -5.3 %Total Traffic Delay: 69.9 pcuHr
Arm
1 - South E
n try
1 250 0.0
1/13.50
500.01 /2
3.50
Arm
2 - North E
ntry
12500.0
2/13.50
500 .02/2
3.5 0
Arm 3 - East Entry
12
500.0 3/1 3.50500.0 3/2 3.50
Arm 4 - West Entry
12
500.04/13.50500.04/23.50
Arm 5 - West Exit
12
500.0 5/1 3.50500.0 5/2 3.50
Arm
6 - North E
x it
1 25 00.0
6/13.50
500.06/2
3.50
Arm 7 - East Exit
12
500.07/13.50500.07/23.50
Arm
8 -
Sou
th E
xit
1250
0 .0
8/1
3.5 0
500.
08 /
23 .
50
A
B
CD
Figure 5.2 – 50m signalised roundabout LinSig Model – Standard phasing
Due to the geometry of the roundabout, variable all-red interval times can be taken into
consideration depending upon the required safety wanted to be achieved by the governing
authority. Due to this factor all-red clearance times stated in Table 5.2 will be assessed along
with the governing reason.
Table 5.2 – All-red interval time for 50m inscribed diameter
All-red interval time
(s) Reason
2 To comply with the middle value of Table 4.2 requirements.
0 Allow clearance time based purely on geometric delay
-1 Allow clearance time based on a desirable 3 second clearance time provided by the geometric delay. This is based on a 35m distance to the conflict point and an average vehicle acceleration speed of 30km/h. The vehicle entry speed is based on saturated flows, thus taken from Appendix C values.
The yellow circles shown at the front of each entering lane represent that the lane is under
signalised control. The green circles at the end of each exit lane show that the lane is
uninterrupted and is able to be used at the lane saturation flow limit. The letters in the triangle
shapes represent the origins/destinations of each vehicle for traffic flow input.

ENG4111/ENG4112 Jarrod Taylor
Signalised Roundabouts Page 68
A 13 second minimum phase time will be used for any one stage to allow for sufficient time
for pedestrians to complete the required 14m walking movement into the central median. This
equates to a 1.08m/s walking time which falls between the recommended 1 to 1.2m/s walking
time specified from (Akçelik & Associates 2001).
5.1.2 UK Phasing
The United Kingdom phasing structure is a bit more complex as it utilises its internal signals
a lot more than the standard phasing structure. The phasing structure can be seen
diagrammatically attached to Appendix D where the green lanes represent the lanes under a
green phase and the red lanes represent the lanes under a red phase. Shown below in Figure
5.3 is the model developed in LinSig for this phasing structure.
UK Phase 50m diameterPRC: 76.6 %Total Traffic Delay: 18.1 pcuHr
C1 Stream 1
0
1
27
2 60
C1 Stream 227
1
3
260
C1 Stream 3
2
1
30
260
C1 Stream 431
1
59
260
Arm 1 - North Entry
12500.0
1/1
3.50
500.0
1/2
3.50
Arm 2 - East Entry
12 500.0
2/13.50
500.02/2
3.50
Arm 3 - South Entry
1 2500.0
3/13.50
500.03/2
3.50
Arm 4 - West Entry
12
500.0
4/1
3.50
500.0
4/2
3.50
Arm 5 - North Inner Lane
12
14.05/13.5017.35/23.50
Arm
6 -
Eas
t Inn
e r L
ane
1214
.06/
13.
5017
.36/
23.
50
Arm 7 - South Inner Lane
12
14.0 7/1 3.5017.3 7/2 3.50
Arm
8 - West Inner Lane
1 214.0
8/13.50
17.38/2
3. 50
Arm
9 -
North
Exit
1 2
500.
0
9/1
3.50
500.
0
9/2
3.50
Arm 10 - East Exit
12
500.0
10/1
3.50
500.0
10/2
3.50
Arm
11
- Sou
th E
xit
12
500.
011
/13.
50
500.
011
/23.
50
Arm 12 - West Exit
12
500.012/1
3.50
500.012/2
3.50
A
B
C
D
Figure 5.3 – 50m signalised roundabout LinSig Model – UK phasing

ENG4111/ENG4112 Jarrod Taylor
Signalised Roundabouts Page 69
The yellow circles shown at the front of each entering lane represent that the lane is under
signalised control. The green circles at the end of each exit lane show that the lane is
uninterrupted and is able to be used at the lane saturation flow limit. The letters in the triangle
shapes represent the origins/destinations of each vehicle for traffic flow input.
It is to be noted that this phasing structure has a heavy reliance on the inner lane storage.
When the inner lane storage is exceeded it will cause the through movement to be blocked
and will cause the intersection to fail. This requires right turn movements to be provided with
short phase times to clear the circulating carriageway effectively.
A 2 second all-red interval will be provided based on Figure 4.4 as a minimum for conflicting
flows that require an entry lane to clear before an inner lane is phased green. The conflicting
flow requires an approximate 24m of clearance before the inner lane phase has a clear
movement.
Also to be noted this phasing structure does not provide for pedestrians to gain access within
the central median. Due to the short phase time required for the circulating carriageway to
clear pedestrian movements do not have enough time to cross the exit lanes safely. For this
reason pedestrian movements have not been considered in the UK phasing structure.
5.2 Signalised Roundabout 60m diameter
The 60m roundabout models have been modelled using the parameters measured in the field
research to determine the effective capacities of the intersection. Two phasing structures have
been modelled, one which is based on standard TCS site practices currently used in Australia
and the other more complex phasing structure used in the United Kingdom.
The 60m inscribed diameter roundabout geometry details developed based on Austroads
(2011) standards are shown in Table 5.3. These values are developed based on a 50m entry
radius and a 100m exit radius. The design vehicle used is a 26.0m B double.

ENG4111/ENG4112 Jarrod Taylor
Signalised Roundabouts Page 70
Table 5.3 – 60m Inscribed diameter geometric elements
ELEMENT LENGTH (m) CRUISE SPEEDS (km/h)
Entry Radius 50m
Exit Radius 100m
Left Turn Travel Distance 19m 16
Through Movement Travel Distance 63m 28
Right Turn Travel Distance 98m 26
Inner lane Storage 11m
5.2.1 Standard Phasing
This phasing structure is a simplistic method where one leg is signalised green and the other
three legs are stopped in the red phase. This can be represented in LinSig typically as a
standard four way traffic controlled signal site as shown in Figure 5.4, however special
consideration needs to be taken into account for U-turn movements.
60m Signalised RoundaboutPRC: -12.8 %Total Traffic Delay: 103.4 pcuHr
C1
0
1
23
2
45
3
67
4
90
Arm
1 - Sout h E
ntry
1 2500.0
1/13 .50
500 .01/2
3.50
Arm
2 - North E
nt ry
12500 .0
2 /13.50
500.02/ 2
3 .50
Arm 3 - East Entry
12
500.0 3/1 3.50500.0 3/2 3.50
Arm 4 - West Entry
12
500.04/13.50500.04/23.50
Arm 5 - West Exit
12
500.0 5/1 3.50500.0 5/2 3.50
Arm
6 - North E
xit
1 25 00.0
6 /13.50
500.06/2
3.5 0
Arm 7 - East Exit
12
500.07/13.50500.07/23.50
Arm
8 -
Sou
t h E
xit
1250
0.0
8 /1
3 .50
5 00 .
08/
23 .
50
A
B
CD
Figure 5.4 – 60m signalised roundabout LinSig Model – Standard phasing

ENG4111/ENG4112 Jarrod Taylor
Signalised Roundabouts Page 71
If U-turn movements exceed the capacity of the inner lane storage within the phase time, this
will cause excessive delays due to the excess queues blocking access for through movements
within the intersection. When this event happens it will cause the intersection to fail in
handling capacities.
Due to the geometry of the roundabout, variable all-red interval times can be taken into
consideration depending upon the required safety wanted to be achieved by the governing
authority. Due to this factor all-red clearance times stated in Table 5.4 will be assessed for the
60m inscribed diameter along with the governing reason.
Table 5.4 – All-red interval time for 60m inscribed diameter
All-red interval time
(s) Reason
2 To comply with the middle value of Table 4.2 requirements.
0 Allow clearance time based purely on geometric delay
-2 Allow clearance time based on a desirable 3 second clearance time provided by the geometric delay. This is based on a 43m distance to the conflict point and an average vehicle acceleration speed of 30km/h. The vehicle entry speed is based on saturated flows, thus taken from Appendix C values.
The yellow circles shown at the front of each entering lane represent that the lane is under
signalised control. The green circles at the end of each exit lane show that the lane is
uninterrupted and is able to be used at the lane saturation flow limit. The letters in the triangle
shapes represent the origins/destinations of each vehicle for traffic flow input.
A 13 second minimum phase time will be used for any one stage to allow for sufficient time
for pedestrians to complete the required 14m walking movement into the central median. This
equates to a 1.08m/s walking time which falls between the recommended 1 to 1.2m/s walking
time specified from (Akçelik & Associates 2001).
5.2.2 UK Phasing
The United Kingdom phasing structure is a bit more complex as it utilises its internal signals
a lot more than the standard phasing structure. The phasing structure can be seen
diagrammatically attached to Appendix D where the green lanes represent the lanes under a

ENG4111/ENG4112 Jarrod Taylor
Signalised Roundabouts Page 72
green phase and the red lanes represent the lanes under a red phase. Shown below in Figure
5.5 is the model developed in LinSig for this phasing structure.
UK Phase 60m diameterPRC: 14.0 %Total Traffic Delay: 37.4 pcuHr
C1 Stream 1
0
1
28
260
C1 Stream 2
22
1
53
2
60
C1 Stream 3
56
1
25
260
C1 Stream 427
1
57
260
Arm 1 - North Entry
12500.0
1/1
3.50
500.0
1/2
3.50
Arm 2 - East Entry
12 500.0
2/13.50
500.02/2
3.50
Arm 3 - South Entry
1 2500.0
3/1
3.50
500.0
3/2
3.50
Arm 4 - West Entry
12
500.0
4/1
3.50
500.0
4/2
3.50
Arm 5 - North Inner Lane
12
11.05/13.5011.05/23.50
Arm
6 -
Eas
t Inn
er L
ane
1211
.06/
13.
50
11.0
6/2
3.50
Arm 7 - South Inner Lane
12
11.0 7/1 3.5011.0 7/2 3.50
Arm
8 - West Inner Lane
1 211 .0
8/13.50
11.08/2
3.50
Arm
9 -
North
Exi
t1 2
500.
0
9/1
3.50
500.
0
9/2
3.50
Arm 10 - East Exit
12
500.0
10/1
3.50
500.0
10/2
3.50
Arm
11
- Sou
th E
xit
12
500.
011
/1
3.50
500.
011
/2
3.50
Arm 12 - West Exit
12
500.012/1
3.50
500.012/2
3.50
A
B
C
D
Figure 5.5 – 60m signalised roundabout LinSig Model – UK phasing
The yellow circles shown at the front of each entering lane represent that the lane is under
signalised control. The green circles at the end of each exit lane show that the lane is
uninterrupted and is able to be used at the lane saturation flow limit. The letters in the triangle
shapes represent the origins/destinations of each vehicle for traffic flow input.
It is to be noted that this phasing structure has a heavy reliance on the inner lane storage.
When the inner lane storage is exceeded it will cause the through movement to be blocked
and will cause the intersection to fail. This requires right turn movements to be provided with
short phase times to clear the circulating carriageway effectively.
A 2 second all-red interval will be provided based on Figure 4.4 as a minimum for conflicting
flows that require an entry lane to clear before an inner lane is phased green. The conflicting
flow requires an approximate 26m of clearance before the inner lane phase has a clear
movement.

ENG4111/ENG4112 Jarrod Taylor
Signalised Roundabouts Page 73
Also to be noted this phasing structure does not provide for pedestrians to gain access within
the central median. Due to the short phase time required for the circulating carriageway to
clear pedestrian movements do not have enough time to cross the exit lanes safely. For this
reason pedestrian movements have not been considered in the UK phasing structure.

ENG4111/ENG4112 Jarrod Taylor
Signalised Roundabouts Page 74
6. RESULTS
6.1 Signalised Roundabout 50m diameter
The results are combined into both standard phasing and UK phasing sections. For the
standard phasing an excel spreadsheet has been developed to assess the capacity of the
signalised roundabout intersection to compare with the LinSig models. The excel spreadsheet
will also use the queue discharge values taken from the field tests and apply these to
equations 3.3 to 3.5.
6.1.1 Standard Phasing
The capacity results are based on that the required U turn movements do not exceed the
capacity of the inner lane storage length of 14m for the green phase period.
The right inner lane storage of 14m is found to be able to comfortably store two vehicles, but
if necessary 3 vehicles can store within the limit of the 19m storage before impedance on a
vehicles through movement. Two vehicles are also able to be stored in the left inner lane if
required, the left lane will be assumed to be used if the right inner lane exceeds capacity
within the green phase. This gives a total storage capacity of 5 passenger car units.
U turn movements were not modelled in as they will not impact on the capacity unless they
exceed the values stated in Table 6.1.
Table 6.1 – Maximum U turn movements for 50m signalised roundabout
Cycle Time (s)
All-red interval (s)
Maximum U-turn movements (veh/hr)
60 2 1385 0 1200 -1 1125
75 2 1075 0 960 -1 911
90 2 878 0 800 -1 766
105 2 742 0 686 -1 661

ENG4111/ENG4112 Jarrod Taylor
Signalised Roundabouts Page 75
6.1.1.1 Semi-rural / Urban Environment Saturation flow 1800 veh/hr
Case 1: 2 second all-red interval
A uniform traffic flow was entered into the LinSig model to determine the capacity of the
signalised roundabout. The uniform traffic flows were increased until level of service F
requirements were met from Table 3.7, with control delay of up to 80 seconds and a lane
saturation of 100%.
Shown in Figure 6.1 are the total capacities for the signalised intersection based on different
cycle times. The measure of the capacity here is the control delay requirements of 80s
representing a level of service F. The data tables are attached to Appendix F in Tables F.1 to
F.4.
Figure 6.1 – Capacity of signalised roundabout based on 80 second control delay
The corresponding uniform traffic flows for each leg that achieves the capacities in Figure
6.1 are shown below in Table 6.2.
Table 6.2 – Uniform traffic flows corresponding to total capacity of signalised roundabout
Cycle Time (s)
Left Turn (veh/hr)
Through Movement (veh/hr)
Right Turn (veh/hr)
Total Entry (veh/hr)
60 268 268 268 804 75 273 273 273 819 90 275 275 275 825
105 277 277 277 831

ENG4111/ENG4112 Jarrod Taylor
Signalised Roundabouts Page 76
An excel table was developed to check the capacity of the LinSig model. For equal flows
from all four legs of the roundabout and a 105 second phase time the standard phasing
capacity to allow for no continually increasing queue and a control delay of 79 seconds is
shown in Table 6.3.
Table 6.3 – Capacity values Excel for 105s phase time Semi Rural / Urban Environment
Saturation flow 1800 veh/hr Cycle time 105 sec Clearance time 2 sec Phase 1 Phase 2 Phase 3 Phase 4 Total Effective Green time (s) 24.25 24.25 24.25 24.25 Proportion of time (u) 0.23 0.23 0.23 0.23 Q (one lane) 416 416 416 416 1663 Q (two lanes) 831 831 831 831 3326 Control Delay (s) 26 26 26 26 79
A level of service for a control delay of 79 seconds corresponds to approximately a LOS F,
therefore this capacity best represents the total effective capacity of the signalised roundabout
before reaching the LOS F requirements.
Here the average control delay per passenger car unit is approximately 80 seconds,
corresponding to a LOS F. The demand flow that corresponds to this requirement is 416
vehicles per lane of entry and 831 vehicles per entry (two lanes).
We see here that the LinSig value closely resemble the Excel value, this is due to the control
delay both representing approximately 80 seconds. This shows that the LinSig model
represents the queue discharge values found from the field research, thus various origin and
destination matrices can be applied and the capacities calculated effectively.
The governing capacity before the lanes reach 100% saturation flow and an excess of 80
second control delay is 3324 veh/hr in a semi-rural/urban environment. This represents a
queue discharge headway of 1800 veh/hr.
From Table F.4 the average maximum queue length under a cycle time of 105 seconds
reaches 17 passenger car units which corresponds to a total of approximately 100m in length.

ENG4111/ENG4112 Jarrod Taylor
Signalised Roundabouts Page 77
The total capacity the intersection is able to produce within an hour interval is determined
based on the equations stated in section 3.2.3. These capacities are smaller than the capacities
governed by the control delay requirement as it does not account for the queued vehicles that
have not entered into the roundabout intersection. The capacities for each cycle time that the
intersection is able to produce within an hour interval are shown in Figure 6.2.
Figure 6.2 – Capacity of signalised roundabout based on hour interval

ENG4111/ENG4112 Jarrod Taylor
Signalised Roundabouts Page 78
Case 2: 0 second all-red interval time When providing a 0 second all-red interval the clearance from the following green phase will
be based purely on the geometric delay provided by the roundabout. From Table 4.8 the
through movement distance is 47m, however the distance to the first conflict point is
approximately 35m.
From the field research it shows that from a stopped start the average cruise speed is
26.34km/hr with a maximum speed recorded of 31.8km/hr. Therefore to obtain a desirable 3
second clearance time as stated in Table 4.2 a vehicle travelling through the end of the yellow
phase would be impacted upon if an entering vehicle was exceeding 42km/hr from the start
of the following green phase.
Due to this speed being greater than the maximum speed recorded from the field test it is
feasible to have the following green phase start immediately after the preceding phase yellow
time.
As there is no lost time due to all-red intervals, the capacity for all cycle times per lane can be
worked out simply from equation 3.5 as:
Q = su
Q = 1800 veh/hr x 1
Q = 1800 veh/hr per lane of entry flow
Therefore due to two lanes of flow, the capacity will be equal to 3600 veh/hr.
When assessing the capacity based on a control delay of 80 seconds to relate it to level of
service F requirements stated in Table 3.7, the optimal phase time would be a 60 second
phase time according to Figure 6.1. A 60 second phase time is used as the minimum cycle
time to still provide for pedestrian movements.
The results obtained from the LinSig output which can be seen from Table F.5 is that a
capacity of 3708 veh/hr is able to be achieved before an 80 second control delay is
experienced by any vehicle. This would be the maximum capacity able to be achieved based
on the control delay LOS F requirements.

ENG4111/ENG4112 Jarrod Taylor
Signalised Roundabouts Page 79
Case 3: 3 second clearance time (-1 second all-red interval)
Due to the LinSig model unable to overlap signal timings the capacities calculated based on a
3 second clearance time will be assessed using excel and the equations represented in section
3.2.3. The results are tabulated in Table F.6 in Appendix F. Figure 6.3 shows the capacity the
intersection is able to provide and the corresponding cycle time.
Figure 6.3 – Capacity of Signalised Roundabout with 3 second clearance time
These capacities reflect the total capacity the roundabout is able to handle within an hour
interval and does not represent LOS F requirements for 80 second controlled delay. It
represents the total amount of vehicles that are able to enter into the intersection within an
hour interval.

ENG4111/ENG4112 Jarrod Taylor
Signalised Roundabouts Page 80
6.1.1.2 Urban Environment Saturation flow 1900 veh/hr
Case 1: 2 second all-red interval A uniform traffic flow was entered into the LinSig model to determine the capacity of the
signalised roundabout. The uniform traffic flows were increased until LOS F requirements
were met from Table 3.7, with control delay of up to 80 seconds and a lane saturation of
100%.
Shown in Figure 6.4 are the total capacities for the signalised intersection based on different
cycle times. The data tables are attached to Appendix F in Tables F.7 to F.10.
Figure 6.4 – Capacity of Signalised Roundabout with 2 second all-red interval Urban
environment
The corresponding uniform traffic flows for each leg that achieved the capacities are shown
below in Table 6.4.
Table 6.4 – Uniform traffic flows corresponding to total capacity of signalised roundabout
Cycle Time (s)
Left Turn
(veh/hr)
Through Movement
(veh/hr) Right Turn
(veh/hr) Total Entry
(veh/hr) 60 283 283 283 849 75 289 289 289 867 90 292 292 292 876 105 293 293 293 879

ENG4111/ENG4112 Jarrod Taylor
Signalised Roundabouts Page 81
An excel table was developed to check the capacity of the LinSig model. For equal flows
from all four legs of the roundabout and a 105 second phase time the standard phasing
capacity to allow for no continually increasing queue and a control delay of 79 seconds is
shown in Table 6.5.
Table 6.5 – Capacity values Excel for 105s phase time Semi-Rural / Urban Environment
Saturation flow 1800 veh/hr Cycle time 105 sec Clearance time 2 sec Phase 1 Phase 2 Phase 3 Phase 4 Total Effective Green time (s) 24.25 24.25 24.25 24.25 Proportion of time (u) 0.23 0.23 0.23 0.23 Q (one lane) 439 439 439 439 1755 Q (two lanes) 878 878 878 878 3510 Control Delay (s) 26 26 26 26 79
A level of service for a control delay of 79 seconds corresponds to approximately a LOS F,
therefore this capacity best represents the total effective capacity of the signalised roundabout
before reaching the LOS F requirements.
Here the average control delay per passenger car unit is approximately 80 seconds,
corresponding to a LOS F. The demand flow that corresponds to this requirement is 439
vehicles per lane of entry and 878 vehicles per entry (two lanes).
We see here that the LinSig value closely resemble the Excel value, this is due to the control
delay both representing approximately 80 seconds. This shows that the LinSig model
represents the queue discharge values found from the field research, thus various origin and
destination matrices can be applied and the capacities calculated effectively.
The governing capacity before the lanes reach 100% saturation flow and an excess of 80
second control delay is 3510 veh/hr in an urban environment where the queue discharge
resembles 1900 veh/hr.
From Table F.10 the average maximum queue length under a cycle time of 105 seconds
reaches 18 passenger car units which corresponds to an approximate total length of 105m.

ENG4111/ENG4112 Jarrod Taylor
Signalised Roundabouts Page 82
The total capacity the intersection is able to produce within an hour interval is determined
based on the equations stated in section 3.2.3. These capacities are smaller than the capacities
governed by the control delay requirement as it does not account for the queued vehicles that
have not entered into the roundabout intersection. The capacities for each cycle time that the
intersection is able to produce within an hour interval are shown in Figure 6.5.
Figure 6.5 – Capacity of signalised roundabout based on hour interval
Case 2: 0 second all-red interval time When providing a 0 second all-red interval the clearance from the following green phase will
be based purely on the geometric delay provided by the roundabout. From Table 4.8 the
through movement distance is 47m, however the distance to the first conflict point is
approximately 35m.
From the field research it shows that from a stopped start the average cruise speed is
26.34km/h with a maximum speed recorded of 31.8km/h. Therefore to obtain a desirable 3
second clearance time as stated in Table 4.2 a vehicle travelling through the end of the yellow
phase would be impacted upon if an entering vehicle was exceeding 42km/h from the start of
the following green phase.
Due to this speed being greater than the maximum speed recorded from the field test it is
feasible to have the following green phase start immediately after the preceding phase yellow
time.

ENG4111/ENG4112 Jarrod Taylor
Signalised Roundabouts Page 83
As there is no lost time due to all-red intervals the capacity for all cycle times per lane can be
worked out simply from equation 3.5 as:
Q = su
Q = 1900 veh/hr x 1
Q = 1900 veh/hr per lane of entry flow
Therefore due to two lanes of flow, the capacity will be equal to 3800 veh/hr.
When assessing the capacity based on a control delay of 80 seconds to relate it to LOS F
requirements stated in Table 3.7, the optimal phase time would be a 60 second phase time. A
60 second phase time is used as the minimum cycle time to still provide for pedestrian
movements.
The results obtained from the LinSig output which can be seen from Table F.11 is that a
capacity of 3935 veh/hr is able to be achieved before an 80 second control delay is
experienced by any vehicle.
Case 3: 3 second clearance time (-1 second all-red interval)
Due to the LinSig model unable to overlap signal timings the capacities calculated based on a
3 second clearance time will be assessed using Excel and the equations represented in section
3.2.3. The results are tabulated in Table F.12 in Appendix F. Figure 6.6 shows the capacity
the intersection is able to provide under an urban environment and the corresponding cycle
time.
These capacities reflect the total capacity the roundabout is able to handle and does not
represent LOS F requirements for 80 second controlled delay. It represents the total amount
of vehicles that are able to enter into the intersection within an hour interval.
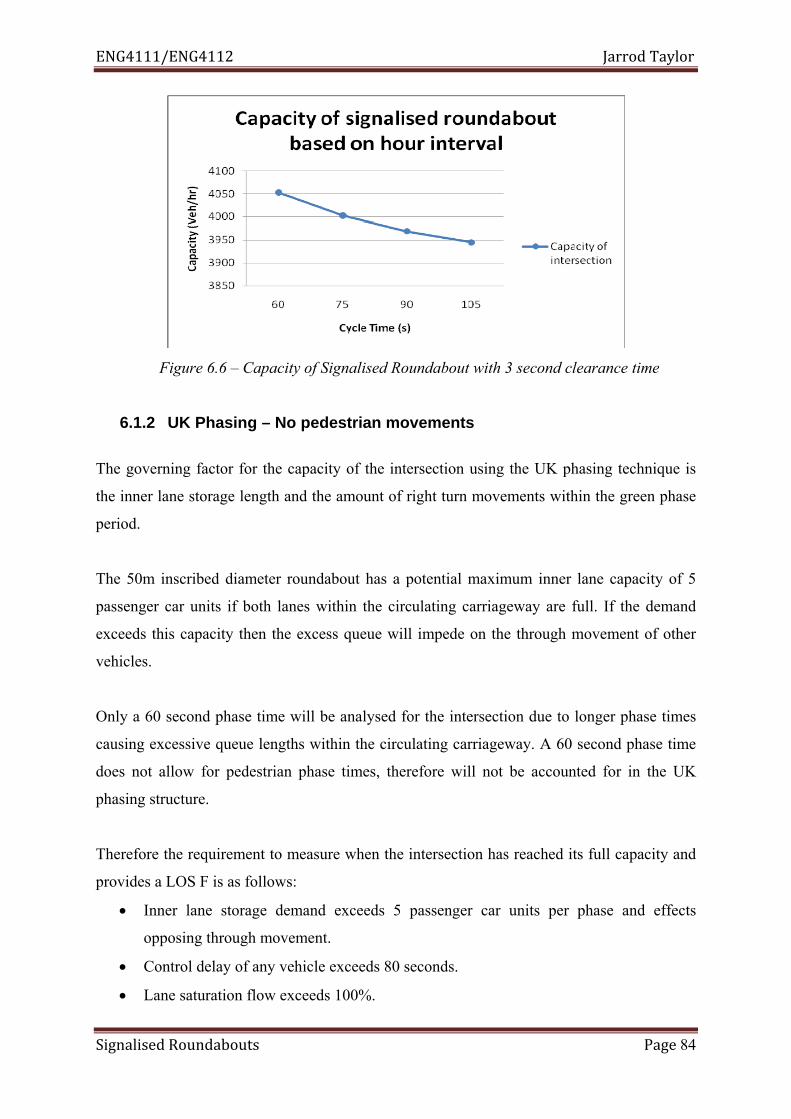
ENG4111/ENG4112 Jarrod Taylor
Signalised Roundabouts Page 84
Figure 6.6 – Capacity of Signalised Roundabout with 3 second clearance time
6.1.2 UK Phasing – No pedestrian movements
The governing factor for the capacity of the intersection using the UK phasing technique is
the inner lane storage length and the amount of right turn movements within the green phase
period.
The 50m inscribed diameter roundabout has a potential maximum inner lane capacity of 5
passenger car units if both lanes within the circulating carriageway are full. If the demand
exceeds this capacity then the excess queue will impede on the through movement of other
vehicles.
Only a 60 second phase time will be analysed for the intersection due to longer phase times
causing excessive queue lengths within the circulating carriageway. A 60 second phase time
does not allow for pedestrian phase times, therefore will not be accounted for in the UK
phasing structure.
Therefore the requirement to measure when the intersection has reached its full capacity and
provides a LOS F is as follows:
• Inner lane storage demand exceeds 5 passenger car units per phase and effects
opposing through movement.
• Control delay of any vehicle exceeds 80 seconds.
• Lane saturation flow exceeds 100%.

ENG4111/ENG4112 Jarrod Taylor
Signalised Roundabouts Page 85
6.1.2.1 Semi-rural / Urban Environment Saturation flow 1800 veh/hr
60 Second Phase Time When applied with a uniform traffic flow as previously done in the standard phasing results
the capacity achieved is 3696 veh/hr as shown by the origin to destination volumes in Table
6.6.
Table 6.6 – Capacity values LinSig for 60s phase time Semi Rural / Urban Environment
Destination
Origin
A B C D Total
A 0 308 308 308 924
B 308 0 308 308 924
C 308 308 0 308 924
D 308 308 308 0 924
Tot. 924 924 924 924 3696
As seen in Table G.2 in Appendix G the north, west and south inner lane ahead lanes have
exceeded its 2 passenger car unit limit. The limit has been set at 14m length which is equal to
2.4 passenger car units which is why the values at 2.4 are highlighted in red. This is due to
the 14m length of storage based on the Austroad (2011) design guidelines for a 50m inscribed
diameter roundabout.
Due to the through lane proceeding whilst this excess queue has not had a chance to clear this
will cause the intersection to fail rapidly.
The saturation flow and journey times are shown in Table G.1 in Appendix G where the
longest movement from Zone B to Zone A requires a journey time of 73.87 seconds which is
approaching the value of 80 seconds (LOS F) in control delay.
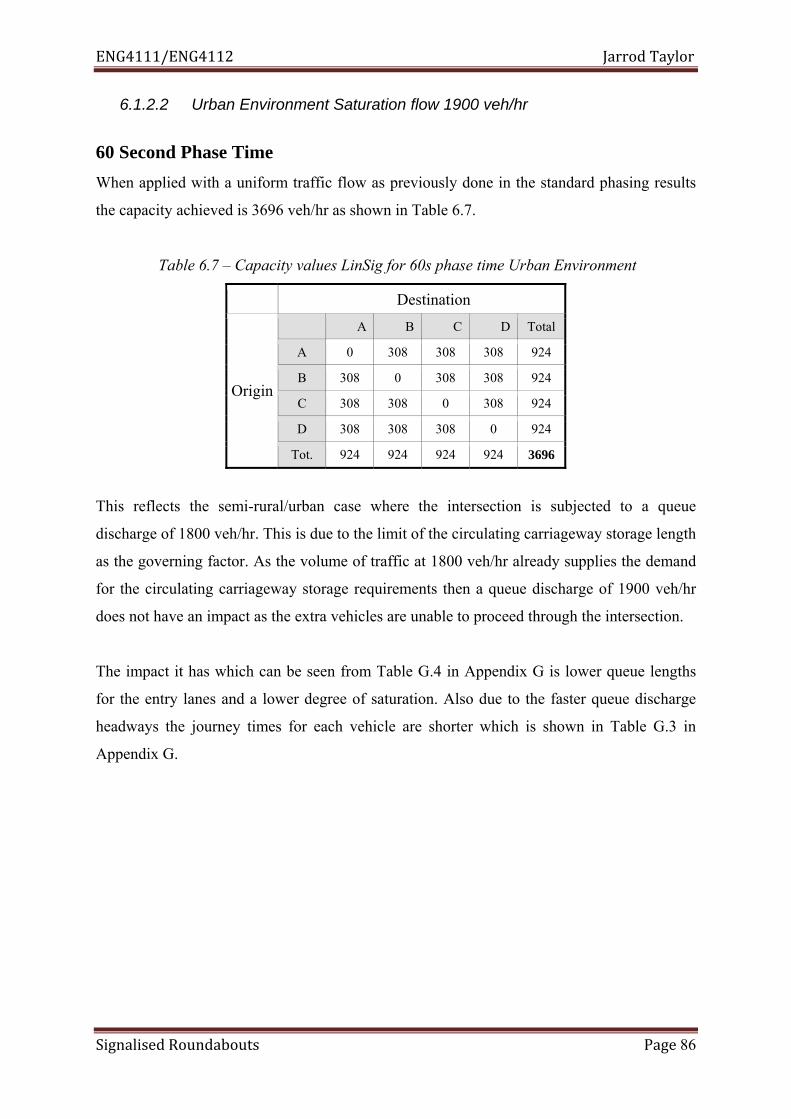
ENG4111/ENG4112 Jarrod Taylor
Signalised Roundabouts Page 86
6.1.2.2 Urban Environment Saturation flow 1900 veh/hr
60 Second Phase Time When applied with a uniform traffic flow as previously done in the standard phasing results
the capacity achieved is 3696 veh/hr as shown in Table 6.7.
Table 6.7 – Capacity values LinSig for 60s phase time Urban Environment
Destination
Origin
A B C D Total
A 0 308 308 308 924
B 308 0 308 308 924
C 308 308 0 308 924
D 308 308 308 0 924
Tot. 924 924 924 924 3696
This reflects the semi-rural/urban case where the intersection is subjected to a queue
discharge of 1800 veh/hr. This is due to the limit of the circulating carriageway storage length
as the governing factor. As the volume of traffic at 1800 veh/hr already supplies the demand
for the circulating carriageway storage requirements then a queue discharge of 1900 veh/hr
does not have an impact as the extra vehicles are unable to proceed through the intersection.
The impact it has which can be seen from Table G.4 in Appendix G is lower queue lengths
for the entry lanes and a lower degree of saturation. Also due to the faster queue discharge
headways the journey times for each vehicle are shorter which is shown in Table G.3 in
Appendix G.

ENG4111/ENG4112 Jarrod Taylor
Signalised Roundabouts Page 87
6.2 Signalised Roundabout 60m diameter
The results are combined into both standard phasing and UK phasing sections. For the
standard phasing the results simulated that of a 50m inscribed diameter roundabout with only
the impact of the U turn movements being affected due to the different circulating
carriageway storage lengths.
The inner lane storage length of the 60m diameter roundabout is 11m in length which is less
than the 14m storage length for the 50m inscribed diameter roundabout. Therefore due to this
it has been modelled that only 2 passenger car units are able to occupy the circulating
carriageway lanes for each lane.
6.2.1 Standard Phasing
Due to the rotation of the phasing going counter clockwise the diameter of the inscribed
roundabout does not have an impact on the capacity that it can handle for the 0 and 2 second
all-red intervals. The only impact the diameter has is for providing the desirable 3 second
clearance time due to longer geometric delay for a vehicle to navigate around the roundabout
and the storage length for vehicles making a U turn manoeuvre.
The storage length within the circulating carriageway is able to handle 4 passenger car units
per phase. Therefore the following U turn movements in Table 6.8 are not to be exceeded for
each phase time for the capacity of the 60m inscribed diameter model to allow it to differ
from the 50m inscribed diameter model.
Table 6.8 – Maximum U turn movements for 60m signalised roundabout
Cycle Time (s)
All-red interval (s)
Maximum U-turn movements (veh/hr)
60 2 1108 0 960 -2 847
75 2 860 0 768 -1 729
90 2 702 0 640 -2 588
105 2 594 0 549 -2 510

ENG4111/ENG4112 Jarrod Taylor
Signalised Roundabouts Page 88
Thus the 0 and 2 second all-red interval capacities calculated for the 50m inscribed diameter
can be applied for the 60m inscribed diameter intersection. Therefore only the 3 second
clearance value will be analysed for the 60m inscribed diameter roundabout.
Case 2: 0 second all-red interval time When providing a 0 second all-red interval the clearance from the following green phase will
be based purely on the geometric delay provided by the roundabout. From Table 4.8 the
through movement distance is 63m, however the distance to the first conflict point is
approximately 43m.
From the field research it shows that from a stopped start the average cruise speed is
27.91km/h with a maximum speed recorded of 30.00km/h. Therefore to obtain a desirable 3
second clearance time as stated in Table 4.2 a vehicle travelling through the end of the yellow
phase would have to be exceeding 51.6km/h to impact on a vehicle entering at the end of the
yellow phase.
Due to this speed being greater than the maximum speed recorded from the field test it is
feasible to not provide any all-red interval and have the following green phase start
immediately after the preceding phase yellow time.
Case 3: 3 second clearance time (-2 second all-red interval) Due to the longer geometric delay provided by the 60m inscribed diameter the following
phase is able to start 2 seconds before the end of the preceding yellow phase and still provide
a 3 second clearance time. The capacities have also been calculated in Excel and represent the
total capacity within an hour interval that the intersection is able to account for.
These capacities reflect the total capacity the roundabout is able to handle and does not
represent LOS F requirements for 80 second controlled delay. It represents the total amount
of vehicles that are able to pass through the intersection within an hour interval.
Figure 6.7 represents the semi-rural/urban environment where a queue discharge of
1800 veh/hr is experienced. The tabulated values are shown in Table F.13 attached in
Appendix F.

ENG4111/ENG4112 Jarrod Taylor
Signalised Roundabouts Page 89
Figure 6.7 – Capacity of Signalised Roundabout with 3 second clearance time Semi-rural
/ Urban environment
Figure 6.8 represents an urban environment where a queue discharge of 1900 veh/hr is
experienced. The tabulated values are shown in Table F.14 attached in Appendix F.
Figure 6.8 – Capacity of Signalised Roundabout with 3 second clearance time Urban
environment

ENG4111/ENG4112 Jarrod Taylor
Signalised Roundabouts Page 90
6.2.2 UK Phasing – No pedestrian movements
The governing factor for the capacity of the intersection using the UK phasing technique is
the inner lane storage length and the amount of right turn movements within the green phase
period.
The 60m inscribed diameter roundabout has a potential maximum inner lane capacity of 4
passenger car units if both lanes within the circulating carriageway are full. If the demand
exceeds this capacity then the excess queue will impede on the through movement of other
vehicles.
Only a 60 second phase time will be analysed for the intersection due to longer phase times
causing excessive queue lengths within the circulating carriageway. A 60 second phase time
does not allow for pedestrian phase times, therefore will not be accounted for in the UK
phasing structure.
Therefore the requirement to measure when the intersection has reached its full capacity and
provides a LOS F is as follows:
• Inner lane storage demand exceeds 4 passenger car units per phase and effects
opposing through movement.
• Control delay of any vehicle exceeds 80 seconds.
• Lane saturation flow exceeds 100%.

ENG4111/ENG4112 Jarrod Taylor
Signalised Roundabouts Page 91
6.2.2.1 Semi-rural / Urban Environment Saturation flow 1800 veh/hr
60 Second Phase Time
When applied with a uniform traffic flow as previously done in the standard phasing results
the capacity achieved is 2940 veh/hr as shown in the origin to destination traffic volumes in
Table 6.9.
Table 6.9 – Capacity values LinSig for 60s phase time Semi Rural / Urban Environment
Destination
Origin
A B C D Total
A 0 245 245 245 735
B 245 0 245 245 735
C 245 245 0 245 735
D 245 245 245 0 735
Tot. 735 735 735 735 2940
As seen in Table H.2 in Appendix H all the inner right turn ahead lanes have exceeded its 2
passenger car unit limit. The limit has been set at 11.5m length which is equal to 2.0
passenger car units which is why the values at 2.0 or above are highlighted in red. This is due
to the 11.5m length of storage based on the Austroad (2011) design guidelines for a 60m
inscribed diameter roundabout.
Due to the through lane proceeding whilst this excess queue has not had a chance to clear
this will cause the intersection to fail rapidly.
The saturation flow and journey times are shown in Table H.1 in Appendix H where the
movement from Zone D to Zone C requires a journey time of 62.11 seconds which is not
relatively close to reaching the value of 80 seconds (LOS F) in control delay. The control
delay requirement is not met before the excess queuing of the inner lane storage.

ENG4111/ENG4112 Jarrod Taylor
Signalised Roundabouts Page 92
6.2.2.2 Urban Environment Saturation flow 1900 veh/hr
60 Second Phase Time
When applied with a uniform traffic flow as previously done in the standard phasing results
the capacity achieved is 2940 veh/hr as shown in the origin to destination traffic volumes in
Table 6.10.
Table 6.10 – Capacity values LinSig for 60s phase time Urban Environment
Destination
Origin
A B C D Total
A 0 245 245 245 735
B 245 0 245 245 735
C 245 245 0 245 735
D 245 245 245 0 735
Tot. 735 735 735 735 2940
This reflects the semi-rural/urban case where the intersection is subjected to a queue
discharge of 1800 veh/hr. This is due to the limit of the circulating carriageway storage length
as the governing factor. As the volume of traffic at 1800 veh/hr already supplies the demand
for the circulating carriageway storage requirements then a queue discharge of 1900 veh/hr
does not have an impact as the extra vehicles are unable to proceed through the intersection.
The impact it has which can be seen from Table H.4 in Appendix H is lower queue lengths
for the entry lanes and a lower degree of saturation. Also due to the faster queue discharge
headways the journey times for each vehicle is shorter which is shown in Table H.3 in
Appendix H compared to that of Table H.1.

ENG4111/ENG4112 Jarrod Taylor
Signalised Roundabouts Page 93
7. CAPACITY OF SIGNALISED ROUNDABOUTS Due to the variability of phasing techniques, roundabout geometry and traffic flow
characteristics there are numerous impacts these factors can have on the capacity of a
signalised roundabout. This section will discuss these factors based on the determined results
stated in the previous section.
7.1 Effects of inscribed diameter
The effects of the inscribed diameter had different impacts to the capacity depending upon
the phasing technique used. For the standard phasing technique the effect of the inscribed
diameter was minimal towards the capacity, only affecting the geometric delay and red
clearance times. For the UK phasing the inscribed diameter affected the capacity significantly
due to the amount of inner lane capacity it was able to provide.
This is discussed in detail in the following sections.
7.1.1 Standard Phasing
Shown in Figure 7.1 are the capacities for both 50m and 60m inscribed diameters based on
the 0 second all-red interval time between phases. These capacities reflect the total entry
capacity within an hour interval for the signalised roundabout intersections.
Figure 7.1 – Capacity for signalised roundabout for different inscribed diameters

ENG4111/ENG4112 Jarrod Taylor
Signalised Roundabouts Page 94
From Figure 7.1 it can be seen that the inscribed diameter has no impact on the capacity when
applied with a 0 second all-red interval. This also applies to any all-red interval time above 0
seconds, noting that two constraints are met:
• U turn movements are not to exceed the inner lane storage capacity for any green
phase period
• A maximum cycle phase of 105 seconds is to be used so vehicles aren’t exposed to a
control delay greater than 80 seconds.
The reasoning behind this is that the phasing technique only allows one leg to enter the
roundabout during a green phase period, therefore the geometry of the roundabout does not
have an effect on the entering capacity of the roundabout.
The inscribed diameter does not have an impact on the capacity of the roundabout directly,
however due to the larger inscribed diameter there is potential to start the following green
phase earlier due to the larger geometric delay provided by the geometry of the roundabout.
Taking both the 50m and 60m examples and looking at saturated conditions where an
entering vehicle will be taking off from a stopped start. Table 7.1 shows the excess clearance
time available when providing for a desirable 3 second clearance time from an entering
vehicle. The speed of the entering vehicle will be taken as an average acceleration speed of
30km/h, based on the field research conducted on the geometric delay at roundabouts.
Table 7.1 – Excess clearance time at 30km/h entering vehicle speed
Inscribed diameter
(m)
Distance to conflict point
(m)
Excess clearance
distance after 3 seconds (m)
Excess clearance time after 3 seconds
(s) 50 35 10 1.2 60 43 18 2.16
The conditions stated in Table 7.1 have been modelled in the results section for both 50m and
60m inscribed diameter lengths. The results showed that in both semi-rural/urban and urban
environments the 60m inscribed diameter allowed greater entry capacities due to the longer
clearance time it could provide between phases due to its larger clearance distance. Figures
7.2 and 7.3 shows the comparison of capacities between both models.
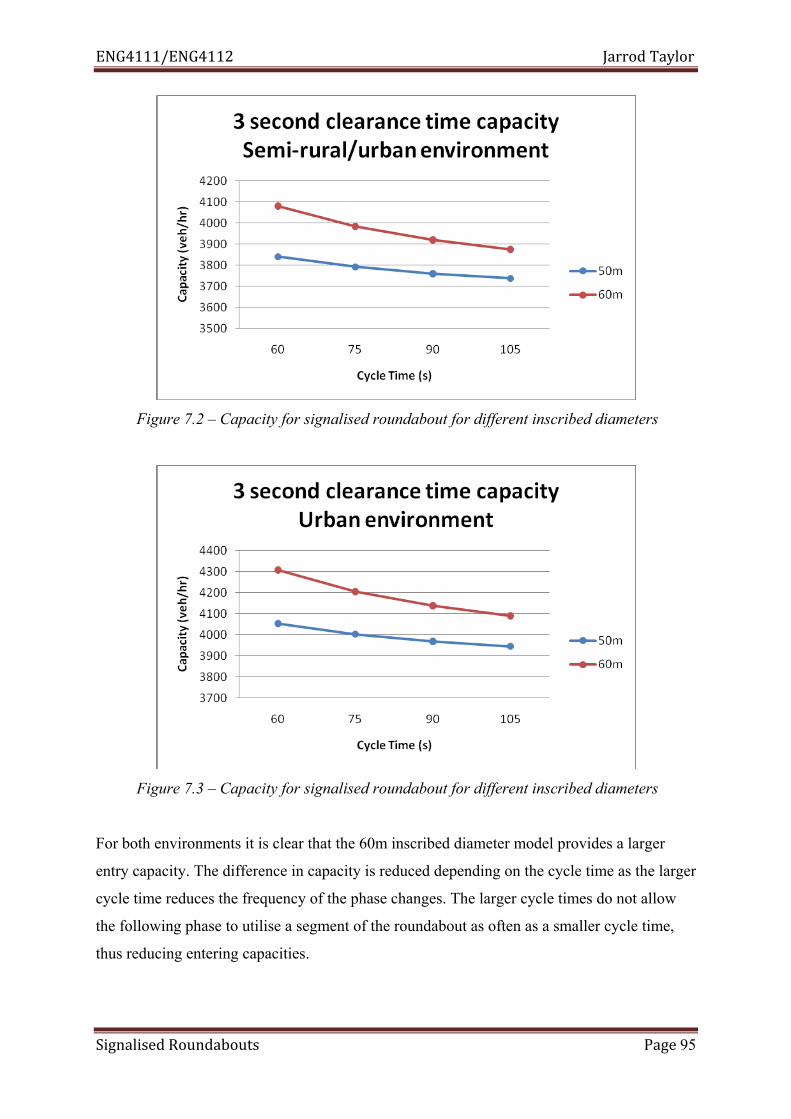
ENG4111/ENG4112 Jarrod Taylor
Signalised Roundabouts Page 95
Figure 7.2 – Capacity for signalised roundabout for different inscribed diameters
Figure 7.3 – Capacity for signalised roundabout for different inscribed diameters
For both environments it is clear that the 60m inscribed diameter model provides a larger
entry capacity. The difference in capacity is reduced depending on the cycle time as the larger
cycle time reduces the frequency of the phase changes. The larger cycle times do not allow
the following phase to utilise a segment of the roundabout as often as a smaller cycle time,
thus reducing entering capacities.

ENG4111/ENG4112 Jarrod Taylor
Signalised Roundabouts Page 96
7.1.2 UK Phasing – No pedestrian movements
The effect the inscribed diameter had on the UK phasing structure significantly impacted on
the capacity of the intersection. Shown in Figure 7.4 is the difference in capacities the
intersection was able to handle during a 60 second cycle time.
Figure 7.4 – Capacity for signalised roundabout for different inscribed diameters UK phasing
The main difference that affects the capacity of the roundabout is the inner lane storage
capacity. The 50m inscribed diameter model was modelled on the basis of being able to store
up to 5 passenger car units within the inner lane storage lanes and the 60m inscribed diameter
model only being able to store 4 passenger car units.
It was expected the larger diameter roundabout would be able to hold a larger inner lane
capacity, however based on Austroads (2011) standards, the perpendicular symmetry and the
entry and exit curves applied, this was not the case. Due to the variability in geometry that
can be applied to a roundabout intersection, the capacities will be based on inner lane storage
capacities and it will be assumed that generally larger diameter roundabouts will be able to
hold a larger inner lane capacity within its circulating carriageway.
The inscribed diameter for the UK phasing technique can greatly improve the capacity of the
intersection if it increases the inner lane storage capacities. The traffic volumes and their
origin and destination flows have to be thoroughly assessed to insure that the inner lane
storage capacities are not to be over saturated, as this has a detrimental effect to the

ENG4111/ENG4112 Jarrod Taylor
Signalised Roundabouts Page 97
performance of the intersection. From Figure 7.4 if the inner lane capacities drop from 5
passenger car units to 4 it has an impact of approximately 700 veh/hr due to the over
saturation of the inner lanes.
Generally this phasing technique would only be considered on large roundabouts with
substantial inner lane capacities. It is also beneficial if this was aided with low right turn
movements and heavy through and left turn movements.
7.2 Effects of queue discharge headway
The effects of the queue discharge headway was assessed after finding that in different
environments, traffic flows would have different queue discharges at signalised intersections.
In a semi-rural/urban environment the queue discharge of approximately 1800 veh/hr was
observed, where in a more urban environment a queue discharge of approximately 1900 veh/hr
was observed.
7.2.1 Standard Phasing The queue discharge headway has a significant impact on the standard phasing technique as it
directly reflects the equation 3.5 of Q = su. Figure 7.5 shows the difference in capacities for
both the different queue discharges using the 2 second all-red interval phasing structure.
Figure 7.5 – Difference in capacities based on queue discharge headways

ENG4111/ENG4112 Jarrod Taylor
Signalised Roundabouts Page 98
This shows that there is approximately an extra 180 to 200 veh/hr travelling through the
intersection when the queue discharge is 1900 veh/hr instead of 1800 veh/hr. This
corresponds to the extra 200 veh/hr that is able to travel through the intersection when there is
no all-red interval applied between phasing.
Therefore the impact the queue discharge has on the signalised intersection using the standard
phasing technique directly reflects equation 3.5. The increased capacity reflects the increased
queue discharge flow travelling through the total effective green time.
7.2.2 UK Phasing – No pedestrian movements The two variable queue discharge headways of 1800 veh/hr and 1900 veh/hr had no impact
on the capacity of the intersection. This was due to the capacity of the inner lanes being over
saturated, therefore the higher queue discharge of 1900 veh/hr was not utilised as the demand
for the capacities were being achieved at 1800 veh/hr.
Along with this, due to the small capacities of 4 and 5 passenger car units over two lanes,
both queue discharge rates were able to empty the inner lanes within their allocated green
phase period.
These two situations determined that for the UK phasing in roundabouts up to 60m, the effect
of the queue discharge headway times has no impact on the capacities for a 60 second cycle
time with uniform flow.

ENG4111/ENG4112 Jarrod Taylor
Signalised Roundabouts Page 99
7.3 Effects of cycle times
The cycle times can have a major impact on allowing vehicles to enter the intersection in an
effective manner. A long cycle time may cause vehicles to experience excessive delay times
and a short cycle time might lose effective green times for vehicles to travel through the
intersection. The impacts the cycle times had on the capacities of the signalised roundabout
intersections are discussed in the following sections.
7.3.1 Standard Phasing
The cycle times impacted on the capacity proportionally to the variable all-red interval times
and red clearance times between each phase. When an all-red interval time of 2 seconds was
used in the standard phasing cycle, it requires that for a 2 second period no vehicles could
enter into the intersection. When this was used in parallel with a short cycle time, it increased
the total time of vehicles unable to enter the intersection during the hour interval, thus
reducing its capacity.
Conversely when a 3 second clearance time was used, allowing the following phase to
proceed before the end of the preceding phase, the short cycle time increased capacities as for
a short period of time it allowed two legs of traffic to enter the intersection. The short cycle
time increased the time period this situation was able to take place, thus increasing the
entering capacity of the signalised roundabout intersection.
Shown below in Figure 7.6 is an example of the two situations described above
corresponding to different cycle times. The example is taken from the 60m inscribed diameter
roundabout in an urban environment.
It has been determined that for the 2 second all-red interval phasing technique the increase in
cycle time increases the capacity from 3396 veh/hr at a 60 second cycle time to 3516 veh/hr
for a 105 second cycle time. This is inversely related when providing a 3 second clearance
time that allows the following phase to proceed 2 seconds before the end of the preceding
phase as shown in the red line. Here we can see that the capacity of 4307 veh/hr at a 60
second cycle time is reduced to 4090 veh/hr at a 105 second cycle time.
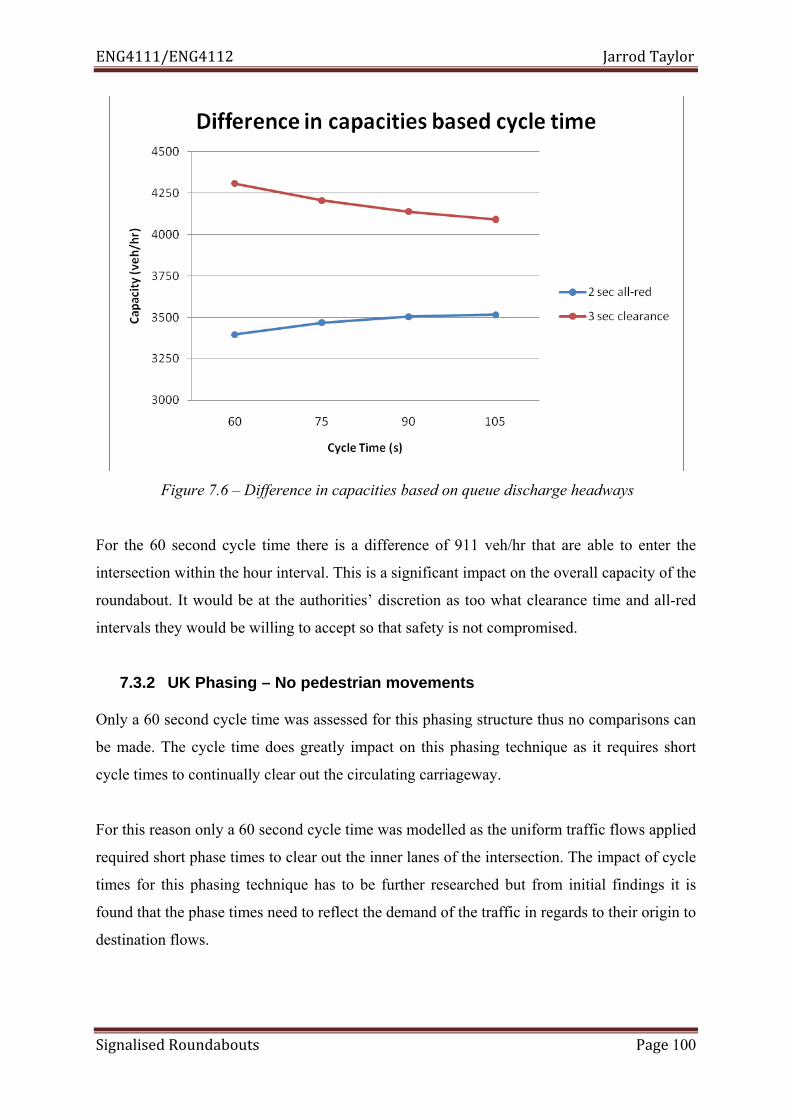
ENG4111/ENG4112 Jarrod Taylor
Signalised Roundabouts Page 100
Figure 7.6 – Difference in capacities based on queue discharge headways
For the 60 second cycle time there is a difference of 911 veh/hr that are able to enter the
intersection within the hour interval. This is a significant impact on the overall capacity of the
roundabout. It would be at the authorities’ discretion as too what clearance time and all-red
intervals they would be willing to accept so that safety is not compromised.
7.3.2 UK Phasing – No pedestrian movements Only a 60 second cycle time was assessed for this phasing structure thus no comparisons can
be made. The cycle time does greatly impact on this phasing technique as it requires short
cycle times to continually clear out the circulating carriageway.
For this reason only a 60 second cycle time was modelled as the uniform traffic flows applied
required short phase times to clear out the inner lanes of the intersection. The impact of cycle
times for this phasing technique has to be further researched but from initial findings it is
found that the phase times need to reflect the demand of the traffic in regards to their origin to
destination flows.

ENG4111/ENG4112 Jarrod Taylor
Signalised Roundabouts Page 101
7.4 Comparison to un-signalised roundabouts
The two techniques used by both the HCM (2010) and Tan (2001) will be used to compare
the calculated capacities of the signalised roundabout intersections to a corresponding un-
signalised case.
The HCM (2010) capacities are tabulated in Table I.1 showing the total capacity from a
uniform flow for a variable circulating flow. Looking at saturated conditions the capacities
highlighted in blue are the most likely to represent the actual capacities due to an expected
high circulating flow.
The capacities based on the Tan (2001) formulae are tabulated in Tables I.2 and I.3. The
values of the coefficients chosen are shown in Table 7.2 below. The coefficient of α was
taken as 0.1 to represent both the 50m and 60m inscribed diameter cases due to the distance
of Lba being between 21m and 28m for both diameters. From Figure 3.4 it can be seen that
the coefficient α does not change within the Lba interval of 21m to 28m.
Table 7.2 – Coefficient values used for un-signalised roundabout capacities using Tan (2001)
formulae
Coefficients Value F 1500 f 8/9 к 1.5 β 0.8 α 0.1
The capacities for the signalised roundabout intersections will be based on the total entry
capacity of the intersection within an hour interval period.

ENG4111/ENG4112 Jarrod Taylor
Signalised Roundabouts Page 102
7.4.1 Standard Phasing
The standard phasing capacities for both 50m and 60m inscribed diameters for the variable
all-red intervals are shown in Table 7.3.
Table 7.3 – Capacities based on entry capacity for an hour interval
SEMI-RURAL / URBAN ENVIRONMENT50m Inscribed Diameter Capacities
(veh/hr) 60m Inscribed Diameter Capacities
(veh/hr) Cycle Times (s) Cycle Times (s)
all red-interval (s) 60 75 90 105 all red-
interval (s) 60 75 90 105
2 3120 3216 3280 3326 2 3120 3216 3280 3326 0 3600 3600 3600 3600 0 3600 3600 3600 3600 -1 3840 3792 3760 3737 -2 4080 3984 3920 3874
URBAN ENVIRONMENT50m Inscribed Diameter Capacities
(veh/hr) 60m Inscribed Diameter Capacities
(veh/hr) Cycle Times (s) Cycle Times (s)
all red-interval (s) 60 75 90 105 all red-
interval (s) 60 75 90 105
2 3293 3395 3462 3510 2 3293 3395 3462 3510 0 3800 3800 3800 3800 0 3800 3800 3800 3800 -1 4053 4003 3969 3945 -2 4307 4205 4138 4090
The HCM (2010) and Tan (2001) methods for un-signalised roundabouts calculated the
capacity under a uniform flow to be approximately 4100 veh/hr. In order to achieve this
capacity, the 3 second clearance method (-2 and -1 second all-red intervals) would have to be
implemented. It would appear that using this technique located in an urban environment
complemented with a short cycle time would improve capacities through the intersection.
As this standard phasing technique is unaffected by the percentage of right turn movements
the signalised roundabout is a much better option when the right turn movements make up
40% or more of the total movements. This can be seen by the tabulated capacity results from
Table I.3.
The signalised roundabout intersection is also able to cater for pedestrians and cyclists
running parallel with the corresponding green time movement for vehicles, where the un-
signalised case does not cater for these movements.

ENG4111/ENG4112 Jarrod Taylor
Signalised Roundabouts Page 103
7.4.2 UK Phasing – No pedestrian movements
The UK phasing technique for a 60 second cycle time is only able to provide up to
approximately 3700 veh/hr when the inner lane storage capacity is equal to 5 passenger car
units. After this the traffic volumes cause the inner lane capacities to overflow and block the
through movents, thus rapidly causing the intersection to fail.
This is still 400 veh/hr less than the expected volumes an un-signalised roundabout is able to
cater for, thus making the phasing technique not effective in improving capacities. The main
criteria that effects an un-signalised roundabout is the percentage of right turn movements.
This is also the case for the UK phasing structure therefore along with variable traffic flows
the UK phasing technique would still not be able to increase capacities for the intersection.
Due to the high risk of traffic volumes causing the circulating carriageway to experience
saturated conditions and overflow of storage capacities, it would not be recommended to
replace an un-signalised roundabout intersection with this phasing technique. This also is the
case if high percentages of heavy vehicles are expected to navigate through the intersection.

ENG4111/ENG4112 Jarrod Taylor
Signalised Roundabouts Page 104
8. RECOMMENDATIONS
It is recommended that on provision of the safety requirements from the governing authority
that a red clearance time of 3 seconds be adopted to utilise the roundabouts geometry to
benefit the traffic volume capacities through the intersection.
If adopting a 3 second red clearance time it is also recommended to adopt a small cycle time
to utilise the roundabouts geometry and increase capacities. However the cycle time should
still be long enough to provide pedestrians the required time to walk to the central median
under their corresponding green phase.
The standard phasing technique is to be used over the UK phasing technique due to the
following factors:
• Lower risk of capacity failing due to overflowing inner lane storage capacities
• The intersection provides for pedestrians
• The phasing technique is simpler and more effective
• The phasing technique can cater for a greater variety of origin to destination flow
patterns.
Retro-fitting an un-signalised roundabout that is failing to provide for capacities is a cost
effective solution in improving capacities particularly under the following conditions:
• High demand of right turn movements throughout the intersection
• High demand of pedestrian and cyclist movements.
A signalised roundabout is even more effective in improving capacities in an environment
that experiences high queue discharge flows at signalised intersections. Therefore if an un-
signalised roundabout is failing to cater for capacities in an urban environment, it would be
recommended in retro-fitting the roundabout with signals to improve the capacities for the
intersection.
ENG4111/ENG4112 Jarrod Taylor
Signalised Roundabouts Page 105
9. AREAS OF FURTHER RESEARCH Further areas of research are required to determine how the capacity is affected when the
traffic volumes are applied non-uniformly. Under this research it appears that using the
standard phasing technique the capacity will not change greatly with variable traffic flow
demands. However, the UK phasing is predicted to improve its capacity when subjected to a
greater through and left turn movement than right turn movements.
The research provided here does not assess the impact of heavy vehicle movements within
the intersections. All capacities are based on passenger car units. An appropriate factor
relating to passenger car units would have to be applied in parallel with the percentage of
heavy vehicles as to the time required for the heavy vehicle to accelerate through the
intersection.
Another factor is to analyse the impact that grades can have on the queue discharge headways
for vehicles and how this affects the capacities through the intersection. It is assumed an
increase in grade for accelerating vehicles will cause lower queue discharge headway flows
and in turn reduce the capacity of the intersection.
When providing a comparison to the un-signalised case it would be beneficial to film a
roundabout intersection working at saturated flows and determine the capacity of the
roundabout and how it reflects the studies from the HCM (2010) and Tan (2001). This would
give the best indication as it would better incorporate driver behaviour characteristics.
ENG4111/ENG4112 Jarrod Taylor
Signalised Roundabouts Page 106
10. CONCLUSIONS
The report identified that the inscribed diameter does have an impact on the signalised
roundabout intersection. For the standard phasing technique the impact the inscribed diameter
had was when a 3 second clearance time was applied between phases. The increase in
diameter size allowed the following phase to proceed before the end of the preceding yellow
phase. The length was directly related by the amount of geometric delay the increase in
diameter was able to achieve. This impacted on capacities by increasing the entry capacity for
the intersection.
The increase in diameter also impacts on the inner lane storage capacities. This has a major
impact on the capacities for the UK phasing technique with the increase in inner lane storage
capacity greatly increasing the intersections total capacity. This factor is not as important for
the standard phasing technique unless significantly high U turn movements are expected.
Queue discharge headways have a large impact on the standard phasing technique but not on
the UK phasing technique. It was found that the lower queue discharge headway flows were
still able to provide enough traffic volume to fill the inner lane storage requirements for the
UK phasing techniques. A queue discharge flow of 1900 veh/hr compared to 1800 veh/hr was
found to improve capacities by approximately 200 veh/hr for the standard phasing technique.
The cycle time has an impact on the intersections capacity depending upon the time between
phase changes. If an all-red interval time of greater than 0 seconds is required for the standard
phasing technique than it is better to provide a longer cycle time. If it is not required than a
shorter cycle time is recommended to improve capacities. A short cycle time is recommended
for the UK phasing technique to clear the circulating carriageway and keep it from
overflowing.
This report has found that a signalised roundabout using the standard phasing technique is a
viable option to replace an existing un-signalised roundabout that is failing to cater for
capacities. This is compounded if the intersection has a high percentage of right turn
movements, pedestrian flows and is located in an urban environment. The installation of
signals to a roundabout is deemed to be a cost effective solution in improving capacities.

ENG4111/ENG4112 Jarrod Taylor
Signalised Roundabouts Page 107
11. REFERENCES
AKÇELIK, R. 1997, ‘Lane-by-Lane Modelling of Unequal Lane Use and Flares at
Roundabouts and Signalised Intersections: the SIDRA Solution’, Traffic Engineering &
Control, vol. 38, No. 7/8.
AKÇELIK, R. 2007, ‘A review of gap-acceptance capacity models’, 29th Conference of
Australian Institutes of Transport Research (CAITR 2007), Adelaide, Australia.
AKÇELIK, R. 2009, ‘Evaluating Roundabout Capacity, Level of Service and Performance’,
ITE Annual Meeting, San Antonio, Texas, USA.
AKÇELIK, R. 2011, ‘Roundabout metering signals: capacity, performance and timing’, 6th
International Symposium on Highway Capacity and Quality of Service, Stockholm, Sweden.
AKÇELIK & ASSOCIATES. 2001, An Investigation of Pedestrian Movement
Characteristics at Mid-Block Signalised Crossings. Technical Report, Akçelik and
Associates Pty Ltd, Melbourne, Australia.
ALPHAND, F, NOELLE, U & GUICHET, B 1991, ‘Roundabouts and Road Safety: State of
the Art in France.’ Intersections without Traffic Signals 2 (W.Brilon, ed.), Springer-Verlag,
Germany, p. 107-125.
AUSTROADS 1993, Guide to Traffic Engineering Practice Part 6: Roundabouts, Sydney,
Australia.
AUSTROADS 2003, Guide to Traffic Engineering Practice Part 7: Traffic Signals, AP-
G11.7/03, Austroads Incorporated, Sydney, Australia.
AUSTROADS 2007, Guide to Traffic Management Part 6: Intersections, Interchanges and
Crossings, Sydney, Australia.
AUSTROADS 2008, Guide to Traffic Management Part 2: Traffic Theory, Sydney,
Australia.
AUSTROADS 2011, Guide to Road Design Part 4B: Roundabouts, Sydney, Australia.

ENG4111/ENG4112 Jarrod Taylor
Signalised Roundabouts Page 108
BERNETTI, G., DALL'ACQUA, G. & LONGO, G. 2003, Unsignalised vs signalised
roundabouts under critical traffic conditions: A quantitative comparison. University of
Trieste.
BRILON, W., B. STUWE, and O. DREWS 1993, Sicherheit und Leistungsfähigkeit von
Kreisverkehrsplätzen (Safety and Capacity of Roundabouts).Research Report. Ruh-
University Bochum.
(DFT) DEPARTMENT FOR TRANSPORT 2009, Signal Controlled Roundabouts, Great
Britain, TSO.
DREW, D.R 1968, Traffic flow theory control. New York, N.y.: McGraw-Hill
(FHWA) FEDERAL HIGHWAY ADMINISTRATION 2000, Roundabouts: An
informational Guide, Department of Transportation, Washington, D.C.
(FHWA) FEDERAL HIGHWAY ADMINISTRATION 2010, Roundabouts: An
informational Guide, Department of Transportation, Washington, D.C.
(HCM) HIGHWAY CAPACITY MANUAL 2010, TRB, National Research Council,
Washington, DC.
IRVENA, J. & RANDAHL, S. 2010, Analysis of gap acceptance in a saturated two-lane
roundabout and implementation of critical gaps in VISSIM, Lund University.
JACQUEMART, P.E. (1998). Modern Roundabout Practice in the United States. NCHRP
Synthesis 264. Washington, D.C: Transportation Research Board National Research Council.
(JCT) JCT CONSULTANCY PTY LTD 2011. LinSig 3.1 User Guide, In: MOORE, P. (ed.).
Lincoln.
KIMBER, R.M. (1980) The traffic capacity of roundabouts, TRRL Laboratory Report LR
942. Crowthorne, England: Transport and Road Research Laboratory.
(NCHRP) NATIONAL COOPERATIVE HIGHWAY RESEARCH PROGRAM 2007,
Roundabouts in the United States, Transportation Research Board, Washington, D.C, USA.

ENG4111/ENG4112 Jarrod Taylor
Signalised Roundabouts Page 109
RAFF, MS & HART, JW 1950, A volume warrant for urban stop signs, The Eno Foundation
for Highway Traffic Control, Saugatuck, CN, USA.
ROBINSON, DL 1998, ‘Accidents at roundabouts in New South Wales’, Roads and
Transport Research, vol 7, no.1, pp. 3-12.
SEIBERLICH, E.L. 2001, A formulation to evaluate capacity delay of multilane roundabouts
in the United States for implementation into a travel forecasting model, The University of
Wisconsin-Milwaukee.
TAN, J.-A. 2001. ‘Comparison of capacity between roundabout design and signalised
junction design’, 1st Swiss Transport Research Conference, Monte Verita, Ascona.
TROUTBECK, R.J 1989, Evaluating the Performance of a Roundabout, Special Report
SR45. ARRB Transport Research Ltd, Vermont South, Australia.
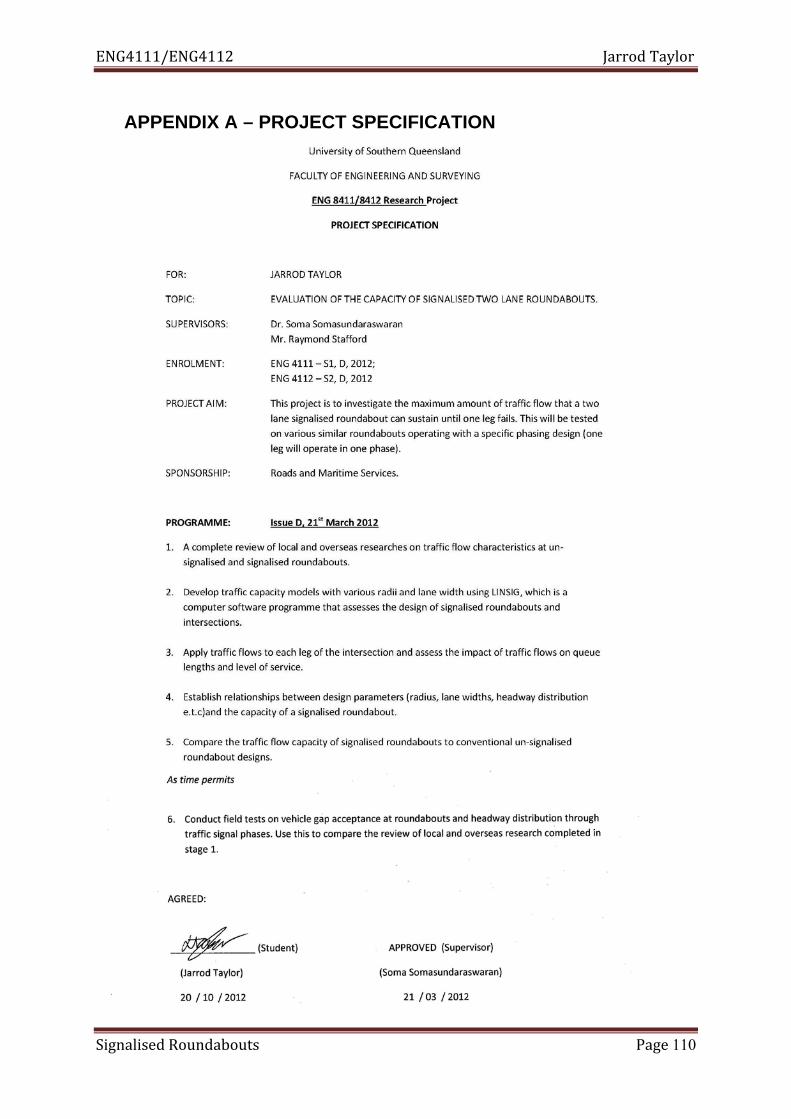
ENG4111/ENG4112 Jarrod Taylor
Signalised Roundabouts Page 110
APPENDIX A – PROJECT SPECIFICATION
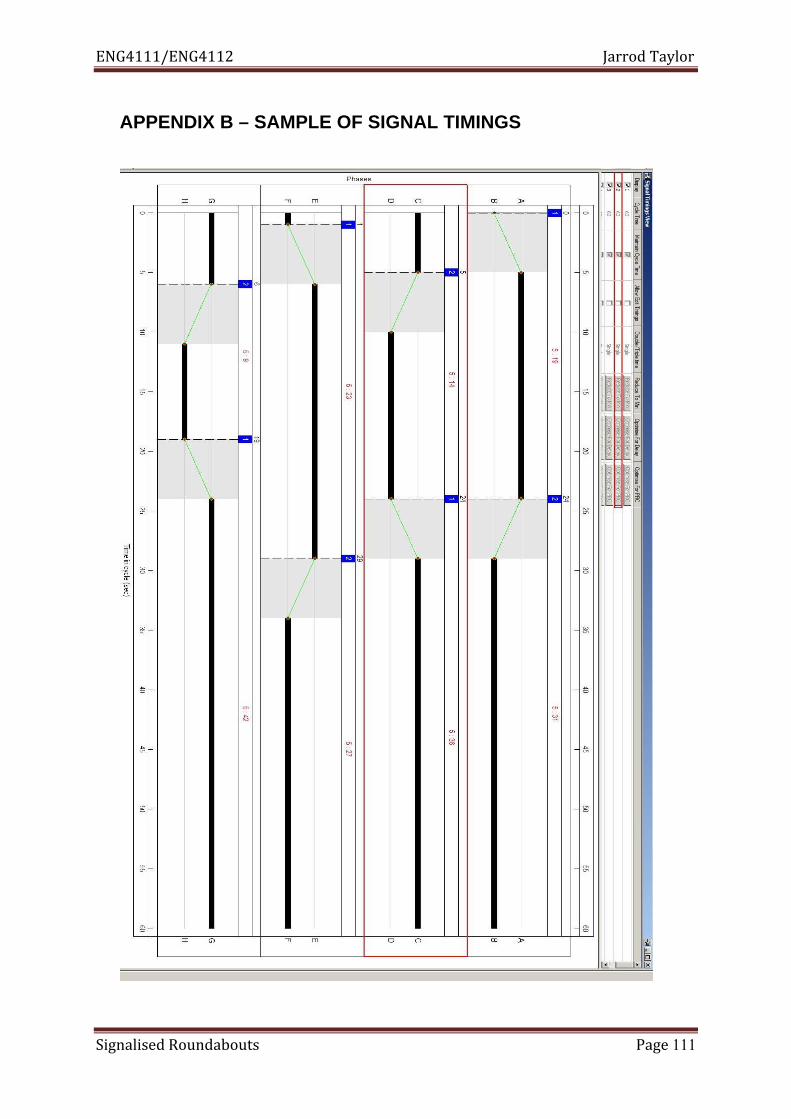
ENG4111/ENG4112 Jarrod Taylor
Signalised Roundabouts Page 111
APPENDIX B – SAMPLE OF SIGNAL TIMINGS

ENG4111/ENG4112 Jarrod Taylor
Signalised Roundabouts Page 112
APPENDIX C – DATA SHEETS FROM FIELD TESTS
Data counts for 52m inscribed diameter roundabout at Wickham.
Right Turn Movement for 52m inscribed diameter roundabout
Test Vehicle Travel Time (s)
Approach Speed (km/h)
Distance (m)
Average Cruise Speed (km/h)
1 Large Car 11.3 0 83 26.4 2 Large Car 12.2 0 83 24.5 3 Large Car 12.6 0 83 23.7 4 Medium Car 10.8 0 83 27.7 5 Large Car 10.1 0 83 29.6 6 Small Car 11.2 0 83 26.7 7 Large Car 11.2 0 83 26.7 8 Large Car 10.5 0 83 28.5 9 Large Car 11.8 0 83 25.3 10 Large Car 11.6 0 83 25.8 11 Large Car 12.8 0 83 23.3 12 Medium Car 11.9 0 83 25.1 13 Large Car 13.2 0 83 22.6 14 Small Car 11.1 0 83 26.9 15 Medium Car 11.8 0 83 25.3 16 Medium Car 11.5 0 83 26.0 17 Small Car 12.0 0 83 24.9 18 Large Car 12.5 0 83 23.9 19 Large Car 12.4 0 83 24.1 20 Small Car 11.2 0 83 26.7
Through Movement for 52m inscribed diameter roundabout
Test Vehicle Travel Time (s)
Approach Speed (km/h)
Distance (m)
Average Cruise Speed (km/h)
1 Small Car 7.2 0 53 26.5 2 Small Car 7.7 0 53 24.8 3 Medium Car 7.6 0 53 25.1 4 Large Car 7.4 0 53 25.8 5 Large Car 7.9 0 53 24.2 6 Small Car 7.4 0 53 25.8 7 Medium Car 7.6 0 53 25.1 8 Small Car 6.2 0 53 30.8 9 Medium Car 6 0 53 31.8 10 Large Car 7.4 0 53 25.8

ENG4111/ENG4112 Jarrod Taylor
Signalised Roundabouts Page 113
11 Small Car 6.5 0 53 29.4 12 Medium Car 7.3 0 53 26.1 13 Large Car 7.4 0 53 25.8 14 Large Car 7.1 0 53 26.9 15 Large Car 7.1 0 53 26.9 16 Medium Car 7.3 0 53 26.1 17 Small Car 6.9 0 53 27.7 18 Small Car 7.1 0 53 26.9 19 Large Car 7.3 0 53 26.1 20 Large Car 7.6 0 53 25.1
Left Turn Movement for 52m inscribed diameter roundabout
Test Vehicle Travel Time (s)
Approach Speed (km/h)
Distance (m)
Average Cruise Speed (km/h)
1 Large Car 3.4 0 12 12.7 2 Large Car 3.2 0 12 13.5 3 Small Car 3.0 0 12 14.4 4 Large Car 3.4 0 12 12.7 5 Large Car 3.3 0 12 13.1 6 Medium Car 3.5 0 12 12.3 7 Medium Car 3.2 0 12 13.5 8 Large Car 3.6 0 12 12.0 9 Large Car 3.0 0 12 14.4 10 Large Car 3.2 0 12 13.5 11 Small Car 3.1 0 12 13.9 12 Large Car 3.5 0 12 12.3 13 Medium Car 3.2 0 12 13.5 14 Small Car 3.3 0 12 13.1 15 Small Car 3.3 0 12 13.1 16 Large Car 3.5 0 12 12.3 17 Large Car 3.2 0 12 13.5 18 Large Car 3.4 0 12 12.7 19 Medium Car 3.4 0 12 12.7 20 Large Car 3.5 0 12 12.3

ENG4111/ENG4112 Jarrod Taylor
Signalised Roundabouts Page 114
Right Turn Movement for 63m inscribed diameter roundabout
Test Vehicle Travel Time (s)
Approach Speed (km/h)
Distance (m)
Average Cruise Speed
(km/h) 1 Large Car 14.6 0 102 25.15 2 Large Car 13.4 0 102 27.40 3 Large Car 13.5 0 102 27.20 4 Medium Car 12.3 0 102 29.85 5 Large Car 13.1 0 102 28.03 6 Large Car 17.8 0 102 20.63 7 Large Car 16.4 0 102 22.39 8 Large Car 14.5 0 102 25.32 9 Small Car 12.8 0 102 28.69 10 Small Car 13.7 0 102 26.80 11 Large Car 13.2 0 102 27.82 12 Large Car 15.1 0 102 24.32 13 Large Car 14.7 0 102 24.98 14 Large Car 14.3 0 102 25.68 15 Large Car 16.1 0 102 22.81 16 Medium Car 15.0 0 102 24.48 17 Large Car 13.8 0 102 26.61 18 Small Car 13.3 0 102 27.61 19 Large Car 14.1 0 102 26.04 20 Large Car 15.3 0 102 24.00
Through Movement for 63m inscribed diameter roundabout
Test Vehicle Travel Time (s)
Approach Speed (km/h)
Distance (m)
Average Cruise Speed (km/h)
1 Large Car 7.9 0 60 27.34 2 Large Car 9.1 0 60 23.74 3 Medium Car 7.6 0 60 28.42 4 Medium Car 7.5 0 60 28.80 5 Large Car 7.8 0 60 27.69 6 Small Car 7.8 0 60 27.69 7 Large Car 7.2 0 60 30.00 8 Large Car 7.5 0 60 28.80 9 Small Car 7.4 0 60 29.19 10 Medium Car 7.8 0 60 27.69 11 Large Car 8.2 0 60 26.34 12 Medium Car 7.6 0 60 28.42 13 Large Car 7.9 0 60 27.34 14 Small Car 7.4 0 60 29.19

ENG4111/ENG4112 Jarrod Taylor
Signalised Roundabouts Page 115
15 Medium Car 7.7 0 60 28.05 16 Large Car 7.8 0 60 27.69 17 Large Car 8.1 0 60 26.67 18 Small Car 7.4 0 60 29.19 19 Medium Car 7.2 0 60 30.00 20 Large Car 8.3 0 60 26.02
Left Turn Movement for 63m inscribed diameter roundabout
Test Vehicle Travel Time (s)
Approach Speed (km/h)
Distance (m)
Average Cruise Speed (km/h)
1 Small Car 3.9 0 19 17.54 2 Large Car 4.1 0 19 16.68 3 Large Car 4.2 0 19 16.29 4 Medium Car 4.1 0 19 16.68 5 Large Car 4.5 0 19 15.20 6 Large Car 4.6 0 19 14.87 7 Large Car 4.3 0 19 15.91 8 Large Car 4.1 0 19 16.68 9 Small Car 4.0 0 19 17.10 10 Small Car 3.8 0 19 18.00 11 Large Car 4.2 0 19 16.29 12 Large Car 4.2 0 19 16.29 13 Large Car 4.4 0 19 15.55 14 Large Car 3.9 0 19 17.54 15 Medium Car 4.0 0 19 17.10 16 Large Car 4.2 0 19 16.29 17 Medium Car 4.3 0 19 15.91 18 Large Car 4.6 0 19 14.87 19 Large Car 4.2 0 19 16.29 20 Large Car 4.4 0 19 15.55

ENG4111/ENG4112 Jarrod Taylor
Signalised Roundabouts Page 116
APPENDIX D – DIAGRAMATIC VIEW OF UK PHASE SEQUENCE 60 SECOND PHASE
0 seconds 1 second
2 seconds
5 seconds 22 seconds 25 seconds
27 seconds 28 seconds 30 seconds
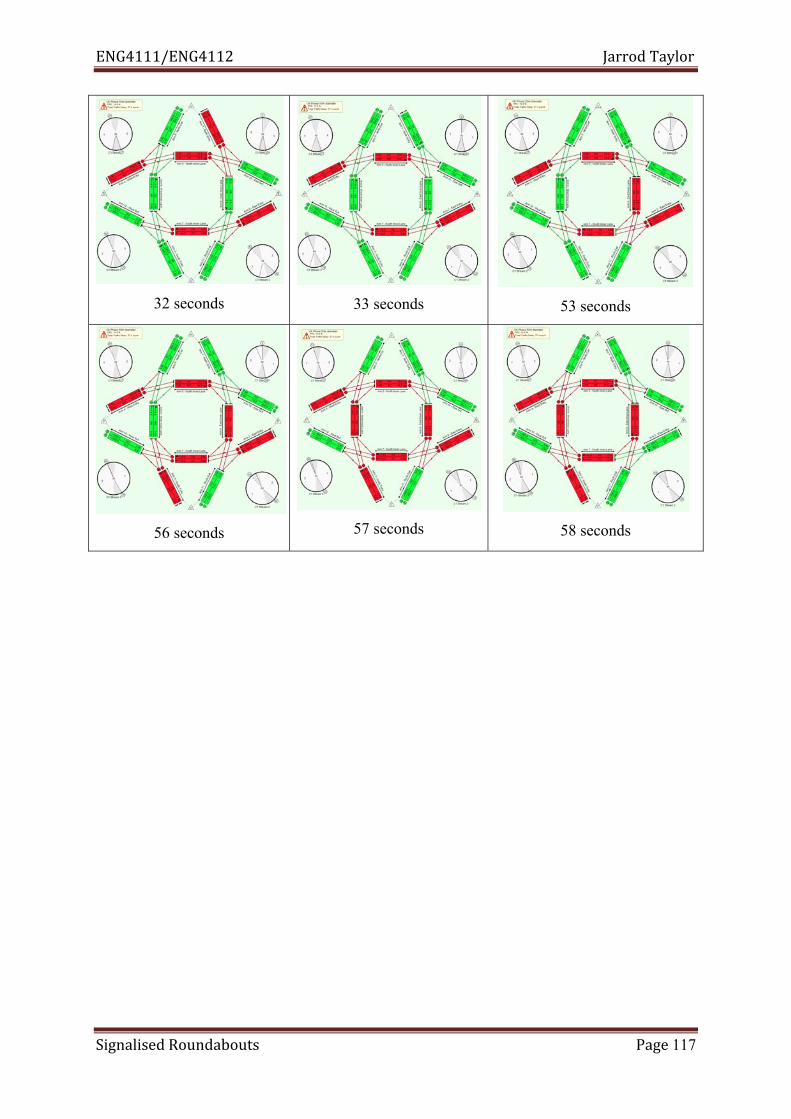
ENG4111/ENG4112 Jarrod Taylor
Signalised Roundabouts Page 117
32 seconds
33 seconds
53 seconds
56 seconds 57 seconds
58 seconds

ENG4111/ENG4112 Jarrod Taylor
Signalised Roundabouts Page 118
APPENDIX E – SCALE A3 DRAWINGS OF ROUNDABOUT MODELS
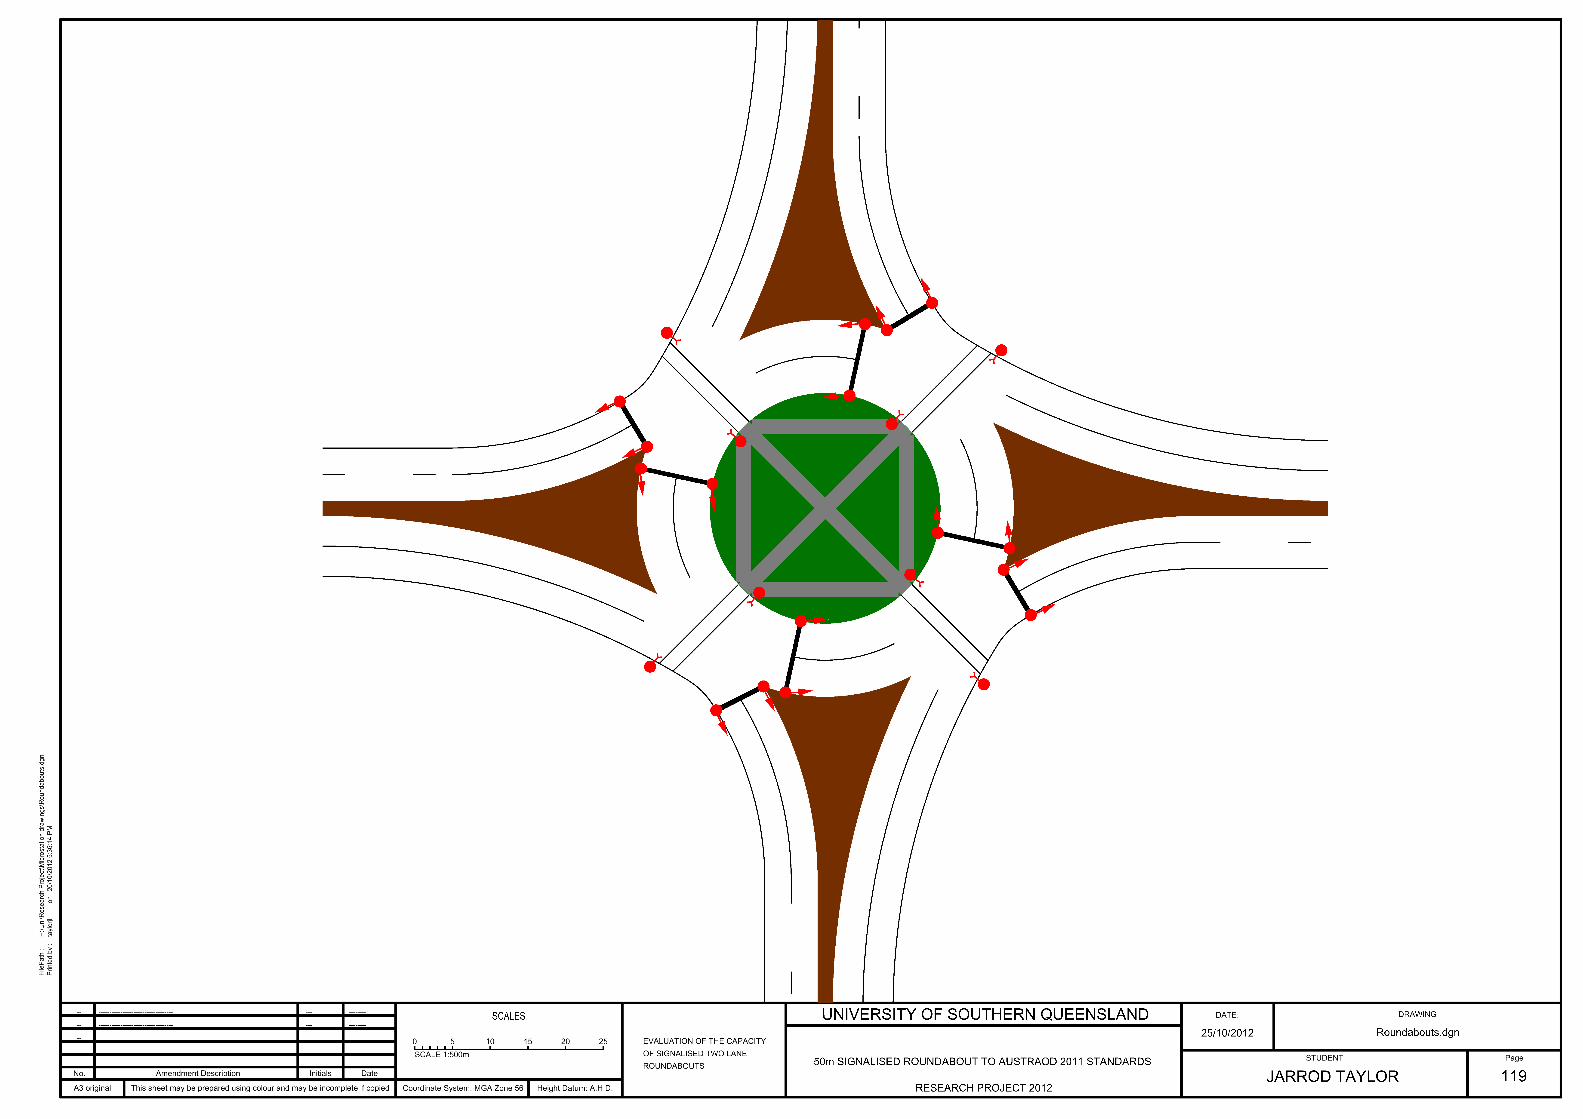

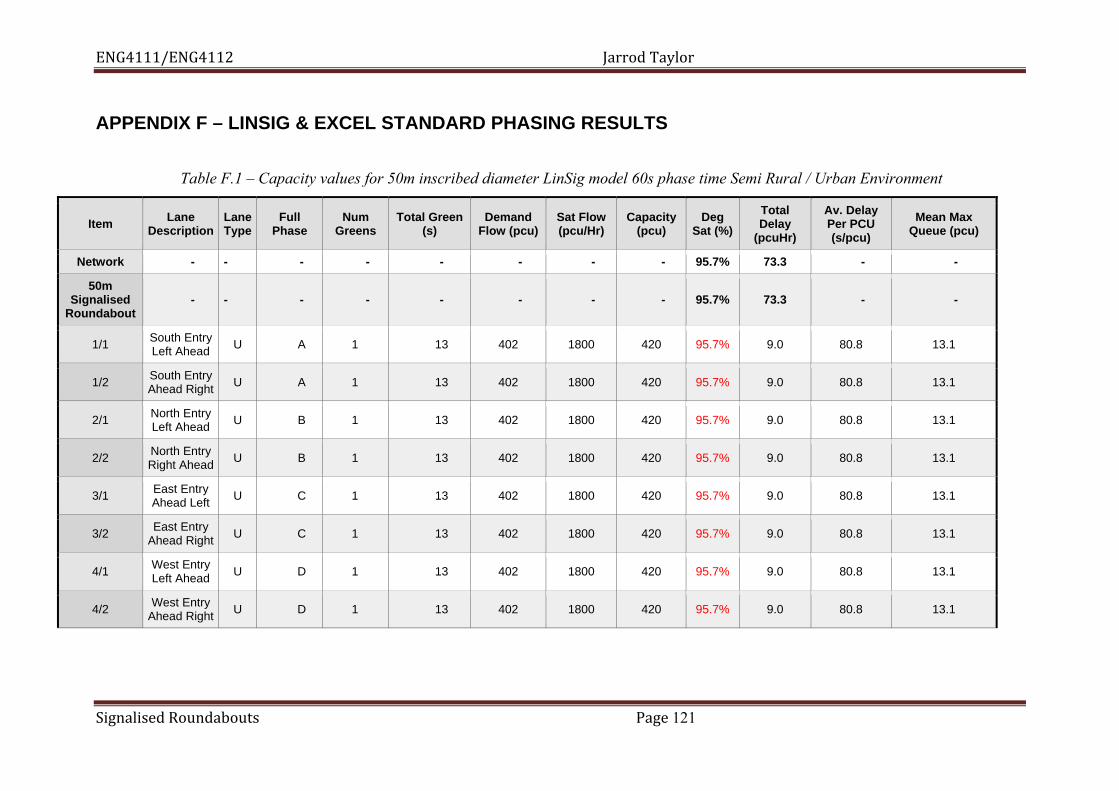
ENG4111/ENG4112 Jarrod Taylor
Signalised Roundabouts Page 121
APPENDIX F – LINSIG & EXCEL STANDARD PHASING RESULTS
Table F.1 – Capacity values for 50m inscribed diameter LinSig model 60s phase time Semi Rural / Urban Environment
Item Lane Description
Lane Type
Full Phase
Num Greens
Total Green (s)
Demand Flow (pcu)
Sat Flow (pcu/Hr)
Capacity (pcu)
Deg Sat (%)
Total Delay
(pcuHr)
Av. Delay Per PCU (s/pcu)
Mean Max Queue (pcu)
Network - - - - - - - - 95.7% 73.3 - -
50m Signalised
Roundabout - - - - - - - - 95.7% 73.3 - -
1/1 South Entry Left Ahead U A 1 13 402 1800 420 95.7% 9.0 80.8 13.1
1/2 South Entry Ahead Right U A 1 13 402 1800 420 95.7% 9.0 80.8 13.1
2/1 North Entry Left Ahead U B 1 13 402 1800 420 95.7% 9.0 80.8 13.1
2/2 North Entry Right Ahead U B 1 13 402 1800 420 95.7% 9.0 80.8 13.1
3/1 East Entry Ahead Left U C 1 13 402 1800 420 95.7% 9.0 80.8 13.1
3/2 East Entry Ahead Right U C 1 13 402 1800 420 95.7% 9.0 80.8 13.1
4/1 West Entry Left Ahead U D 1 13 402 1800 420 95.7% 9.0 80.8 13.1
4/2 West Entry Ahead Right U D 1 13 402 1800 420 95.7% 9.0 80.8 13.1

ENG4111/ENG4112 Jarrod Taylor
Signalised Roundabouts Page 122
Table F.2 – Capacity values for 50m inscribed diameter LinSig model 75s phase time Semi Rural / Urban Environment
Item Lane Description
Lane Type
Full Phase
Num Greens
Total Green
(s) Demand
Flow (pcu) Sat Flow (pcu/Hr)
Capacity (pcu)
Deg Sat (%)
Total Delay
(pcuHr)
Av. Delay Per PCU (s/pcu)
Mean Max Queue (pcu)
Network - - - - - - - - 94.9% 83.7 - -
50m Signalised Roundabout - - - - - - - - 94.9% 83.7 - -
1/1 South Entry Left Ahead U A 1 16 410 1800 432 94.7% 9.1 79.8 14.2
1/2 South Entry Ahead Right U A 1 16 409 1800 432 94.9% 9.2 80.9 14.3
2/1 North Entry Left Ahead U B 1 17 409 1800 432 94.7% 9.1 79.8 14.2
2/2 North Entry Right Ahead U B 1 17 410 1800 432 94.9% 9.2 80.9 14.3
3/1 East Entry Ahead Left U C 1 17 409 1800 432 94.7% 9.1 79.8 14.2
3/2 East Entry Ahead Right U C 1 17 410 1800 432 94.9% 9.2 80.9 14.3
4/1 West Entry Left Ahead U D 1 17 409 1800 432 94.7% 9.1 79.8 14.2
4/2 West Entry Ahead Right U D 1 17 410 1800 432 94.9% 9.2 80.9 14.3
C1 PRC for Signalled Lanes (%): -11.7 Total Delay for Signalled Lanes (pcuHr): 82.53 Cycle Time (s): 75 PRC Over All Lanes (%): -11.7 Total Delay Over All Lanes(pcuHr): 83.71

ENG4111/ENG4112 Jarrod Taylor
Signalised Roundabouts Page 123
Table F.3 – Capacity values for 50m inscribed diameter LinSig model 90s phase time Semi Rural / Urban Environment
Item Lane Description
Lane Type
Full Phase
Num Greens
Total Green
(s) Demand
Flow (pcu) Sat Flow (pcu/Hr)
Capacity (pcu)
Deg Sat (%)
Total Delay
(pcuHr)
Av. Delay Per PCU (s/pcu)
Mean Max Queue (pcu)
Network - - - - - - - - 93.9% 87.6 - -
50m Signalised Roundabout - - - - - - - - 93.9% 87.6 - -
1/1 South Entry Left Ahead U A 1 21 412 1800 440 93.6% 9.1 79.9 15.4
1/2 South Entry Ahead Right U A 1 21 413 1800 440 93.9% 9.3 80.8 15.5
2/1 North Entry Left Ahead U B 1 21 412 1800 440 93.6% 9.1 79.9 15.4
2/2 North Entry Right Ahead U B 1 21 413 1800 440 93.9% 9.3 80.8 15.5
3/1 East Entry Ahead Left U C 1 20 412 1800 440 93.6% 9.1 79.9 15.4
3/2 East Entry Ahead Right U C 1 20 413 1800 440 93.9% 9.3 80.8 15.5
4/1 West Entry Left Ahead U D 1 20 412 1800 440 93.6% 9.1 79.9 15.4
4/2 West Entry Ahead Right U D 1 20 413 1800 440 93.9% 9.3 80.8 15.5
C1 PRC for Signalled Lanes (%): -9.3 Total Delay for Signalled Lanes (pcuHr): 86.37 Cycle Time (s): 90 PRC Over All Lanes (%): -9.3 Total Delay Over All Lanes(pcuHr): 87.56

ENG4111/ENG4112 Jarrod Taylor
Signalised Roundabouts Page 124
Table F.4 – Capacity values for 50m inscribed diameter LinSig model 105s phase time Semi Rural / Urban Environment
Item Lane Description
Lane Type
Full Phase
Num Greens
Total Green
(s) Demand
Flow (pcu) Sat Flow (pcu/Hr)
Capacity (pcu)
Deg Sat (%)
Total Delay
(pcuHr)
Av. Delay Per PCU (s/pcu)
Mean Max Queue (pcu)
Network - - - - - - - - 93.3% 75.0 - -
50m Signalised Roundabout - - - - - - - - 93.3% 75.0 - -
1/1 South Entry Left Ahead U A 1 25 415 1800 446 93.1% 9.5 78.7 16.8
1/2 South Entry Ahead Right U A 1 25 416 1800 446 93.3% 9.7 79.6 17.0
2/1 North Entry Left Ahead U B 1 24 415 1800 446 93.1% 9.5 78.7 16.8
2/2 North Entry Right Ahead U B 1 24 416 1800 446 93.3% 9.7 79.6 17.0
3/1 East Entry Ahead Left U C 1 24 415 1800 446 93.1% 9.5 78.7 16.8
3/2 East Entry Ahead Right U C 1 24 416 1800 446 93.3% 9.7 79.6 17.0
4/1 West Entry Left Ahead U D 1 24 415 1800 446 93.1% 9.5 78.7 16.8
4/2 West Entry Ahead Right U D 1 24 416 1800 446 93.3% 9.7 79.6 17.0
C1 PRC for Signalled Lanes (%): -3.7 Total Delay for Signalled Lanes (pcuHr): 73.82 Cycle Time (s): 105 PRC Over All Lanes (%): -3.7 Total Delay Over All Lanes(pcuHr): 75.02
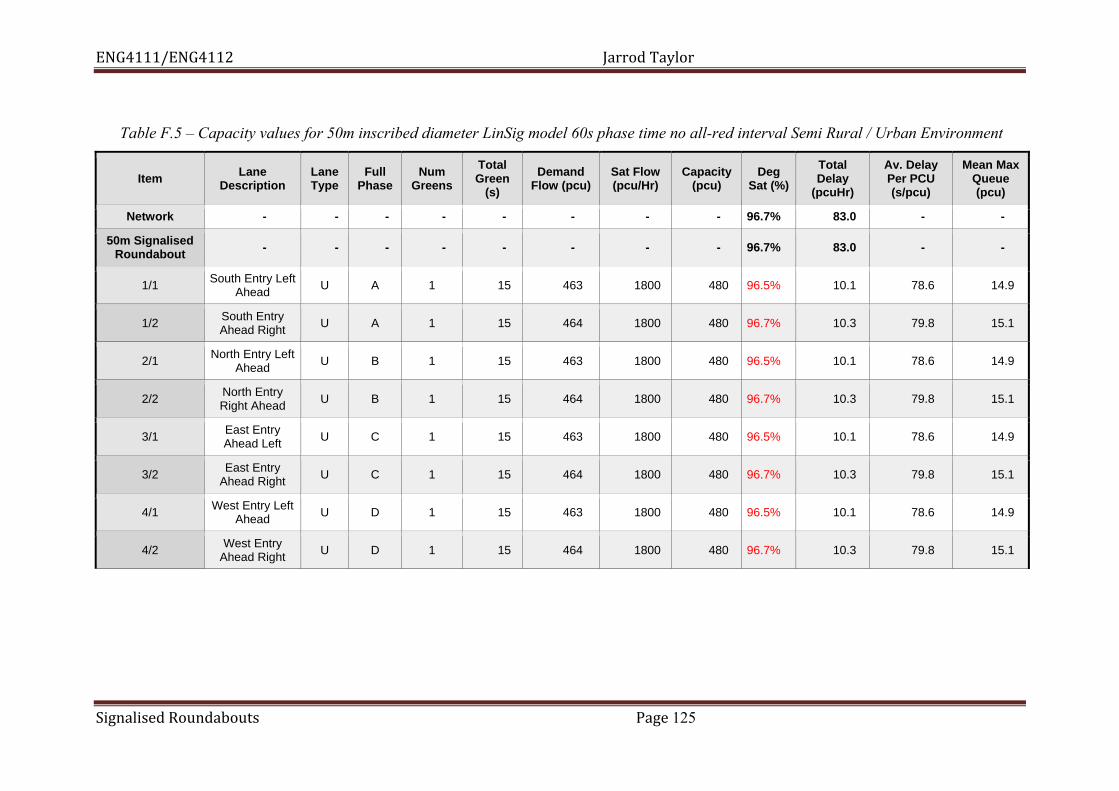
ENG4111/ENG4112 Jarrod Taylor
Signalised Roundabouts Page 125
Table F.5 – Capacity values for 50m inscribed diameter LinSig model 60s phase time no all-red interval Semi Rural / Urban Environment
Item Lane Description
Lane Type
Full Phase
Num Greens
Total Green
(s) Demand
Flow (pcu) Sat Flow (pcu/Hr)
Capacity (pcu)
Deg Sat (%)
Total Delay
(pcuHr)
Av. Delay Per PCU (s/pcu)
Mean Max Queue (pcu)
Network - - - - - - - - 96.7% 83.0 - -
50m Signalised Roundabout - - - - - - - - 96.7% 83.0 - -
1/1 South Entry Left Ahead U A 1 15 463 1800 480 96.5% 10.1 78.6 14.9
1/2 South Entry Ahead Right U A 1 15 464 1800 480 96.7% 10.3 79.8 15.1
2/1 North Entry Left Ahead U B 1 15 463 1800 480 96.5% 10.1 78.6 14.9
2/2 North Entry Right Ahead U B 1 15 464 1800 480 96.7% 10.3 79.8 15.1
3/1 East Entry Ahead Left U C 1 15 463 1800 480 96.5% 10.1 78.6 14.9
3/2 East Entry Ahead Right U C 1 15 464 1800 480 96.7% 10.3 79.8 15.1
4/1 West Entry Left Ahead U D 1 15 463 1800 480 96.5% 10.1 78.6 14.9
4/2 West Entry Ahead Right U D 1 15 464 1800 480 96.7% 10.3 79.8 15.1

ENG4111/ENG4112 Jarrod Taylor
Signalised Roundabouts Page 126
Table F.6 – Capacity values for 50m inscribed diameter 3 second clearance time Excel values Semi Rural / Urban Environment
Saturation flow 1800 veh/hr Saturation flow 1800 veh/hr Cycle time 60 sec Cycle time 90 sec Clearance time -1 sec Clearance time -1 sec
Phase
1 Phase
2 Phase
3 Phase
4 Total Phase
1 Phase
2 Phase
3 Phase
4 Total Effective Green time (s) 16 16 16 16 Effective Green time (s) 23.5 23.5 23.5 23.5 Proportion of time (u) 0.27 0.27 0.27 0.27 Proportion of time (u) 0.26 0.26 0.26 0.26 Q one lane (veh/hr) 480 480 480 480 1920 Q (one lane) 470 470 470 470 1880 Q two lanes (veh/hr) 960 960 960 960 3840 Q (two lanes) 940 940 940 940 3760 Control Delay (s) 15 15 15 15 45 Control Delay (s) 23 23 23 23 68 Saturation flow 1800 veh/hr Saturation flow 1800 veh/hr Cycle time 75 sec Cycle time 105 sec Clearance time -1 sec Clearance time -1 sec
Phase
1 Phase
2 Phase
3 Phase
4 Total Phase
1 Phase
2 Phase
3 Phase
4 Total Effective Green time (s) 19.75 19.75 19.75 19.75 Effective Green time (s) 27.25 27.25 27.25 27.25 Proportion of time (u) 0.26 0.26 0.26 0.26 Proportion of time (u) 0.26 0.26 0.26 0.26 Q (one lane) 474 474 474 474 1896 Q (one lane) 467 467 467 467 1869 Q (two lanes) 948 948 948 948 3792 Q (two lanes) 934 934 934 934 3737 Control Delay (s) 19 19 19 19 56 Control Delay (s) 26 26 26 26 79

ENG4111/ENG4112 Jarrod Taylor
Signalised Roundabouts Page 127
Table F.7 – Capacity values for 50m inscribed diameter LinSig model 60s phase time Urban Environment
Item Lane Description
Lane Type
Full Phase
Num Greens
Total Green
(s) Demand
Flow (pcu) Sat Flow (pcu/Hr)
Capacity (pcu)
Deg Sat (%)
Total Delay (pcuHr)
Av. Delay Per PCU (s/pcu)
Mean Max Queue (pcu)
Network - - - - - - - - 95.9% 71.8 - -
50m Signalised Roundabout - - - - - - - - 95.9% 71.8 - -
1/1 South Entry Left Ahead U A 1 13 424 1900 443 95.6% 9.2 78.2 13.5
1/2 South Entry Ahead Right U A 1 13 425 1900 443 95.9% 9.4 79.5 13.7
2/1 North Entry Left Ahead U B 1 13 424 1900 443 95.6% 9.2 78.2 13.5
2/2 North Entry Right Ahead U B 1 13 425 1900 443 95.9% 9.4 79.5 13.7
3/1 East Entry Ahead Left U C 1 13 424 1900 443 95.6% 9.2 78.2 13.5
3/2 East Entry Ahead Right U C 1 13 425 1900 443 95.9% 9.4 79.5 13.7
4/1 West Entry Left Ahead U D 1 13 424 1900 443 95.6% 9.2 78.2 13.5
4/2 West Entry Ahead Right U D 1 13 425 1900 443 95.9% 9.4 79.5 13.7
C1 PRC for Signalled Lanes (%): -6.5 Total Delay for Signalled Lanes (pcuHr): 70.61 Cycle Time (s): 60 PRC Over All Lanes (%): -6.5 Total Delay Over All Lanes(pcuHr): 71.76

ENG4111/ENG4112 Jarrod Taylor
Signalised Roundabouts Page 128
Table F.8 – Capacity values for 50m inscribed diameter LinSig model 75s phase time Urban Environment
Item Lane Description
Lane Type
Full Phase
Num Greens
Total Green
(s) Demand
Flow (pcu) Sat Flow (pcu/Hr)
Capacity (pcu)
Deg Sat (%)
Total Delay
(pcuHr)
Av. Delay Per PCU (s/pcu)
Mean Max Queue (pcu)
Network - - - - - - - - 95.2% 88.1 - -
50m Signalised Roundabout - - - - - - - - 95.2% 88.1 - -
1/1 South Entry Left Ahead U A 1 17 433 1900 456 95.0% 9.5 79.1 14.9
1/2 South Entry Ahead Right U A 1 17 434 1900 456 95.2% 9.7 80.2 15.1
2/1 North Entry Left Ahead U B 1 17 433 1900 456 95.0% 9.5 79.1 14.9
2/2 North Entry Right Ahead U B 1 17 434 1900 456 95.2% 9.7 80.2 15.1
3/1 East Entry Ahead Left U C 1 17 433 1900 456 95.0% 9.5 79.1 14.9
3/2 East Entry Ahead Right U C 1 17 434 1900 456 95.2% 9.7 80.2 15.1
4/1 West Entry Left Ahead U D 1 17 433 1900 456 95.0% 9.5 79.1 14.9
4/2 West Entry Ahead Right U D 1 17 434 1900 456 95.2% 9.7 80.2 15.1
C1 PRC for Signalled Lanes (%): -12.0 Total Delay for Signalled Lanes (pcuHr): 86.96 Cycle Time (s): 75 PRC Over All Lanes (%): -12.0 Total Delay Over All Lanes(pcuHr): 88.14

ENG4111/ENG4112 Jarrod Taylor
Signalised Roundabouts Page 129
Table F.9 – Capacity values for 50m inscribed diameter LinSig model 90s phase time Urban Environment
Item Lane Description
Lane Type
Full Phase
Num Greens
Total Green
(s) Demand
Flow (pcu) Sat Flow (pcu/Hr)
Capacity (pcu)
Deg Sat (%)
Total Delay
(pcuHr)
Av. Delay Per PCU (s/pcu)
Mean Max Queue (pcu)
Network - - - - - - - - 94.3% 94.1 - -
50m Signalised Roundabout - - - - - - - - 94.3% 94.1 - -
1/1 South Entry Left Ahead U A 1 21 438 1900 464 94.3% 9.8 80.8 16.5
1/2 South Entry Ahead Right U A 1 21 438 1900 464 94.3% 9.8 80.8 16.5
2/1 North Entry Left Ahead U B 1 21 438 1900 464 94.3% 9.8 80.8 16.5
2/2 North Entry Right Ahead U B 1 21 438 1900 464 94.3% 9.8 80.8 16.5
3/1 East Entry Ahead Left U C 1 21 438 1900 464 94.3% 9.8 80.8 16.5
3/2 East Entry Ahead Right U C 1 21 438 1900 464 94.3% 9.8 80.8 16.5
4/1 West Entry Left Ahead U D 1 21 438 1900 464 94.3% 9.8 80.8 16.5
4/2 West Entry Ahead Right U D 1 21 438 1900 464 94.3% 9.8 80.8 16.5
C1 PRC for Signalled Lanes (%): -9.8 Total Delay for Signalled Lanes (pcuHr): 92.91 Cycle Time (s): 90 PRC Over All Lanes (%): -9.8 Total Delay Over All Lanes(pcuHr): 94.11
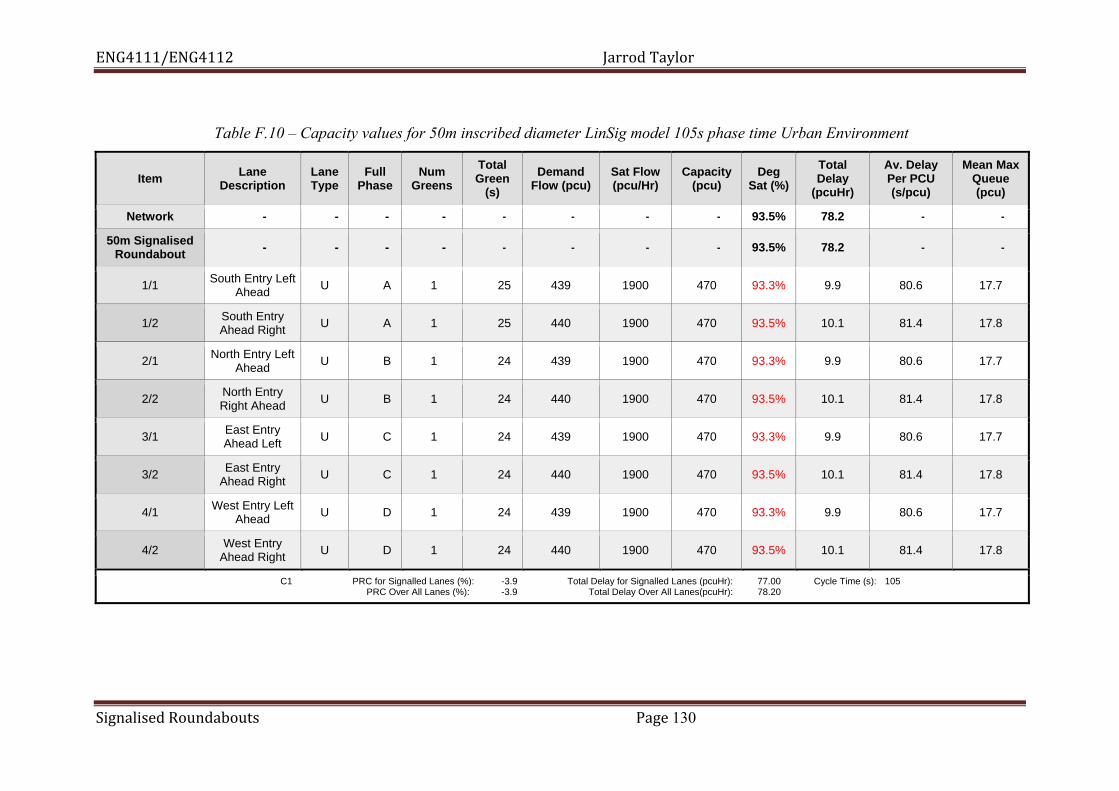
ENG4111/ENG4112 Jarrod Taylor
Signalised Roundabouts Page 130
Table F.10 – Capacity values for 50m inscribed diameter LinSig model 105s phase time Urban Environment
Item Lane Description
Lane Type
Full Phase
Num Greens
Total Green
(s) Demand
Flow (pcu) Sat Flow (pcu/Hr)
Capacity (pcu)
Deg Sat (%)
Total Delay
(pcuHr)
Av. Delay Per PCU (s/pcu)
Mean Max Queue (pcu)
Network - - - - - - - - 93.5% 78.2 - -
50m Signalised Roundabout - - - - - - - - 93.5% 78.2 - -
1/1 South Entry Left Ahead U A 1 25 439 1900 470 93.3% 9.9 80.6 17.7
1/2 South Entry Ahead Right U A 1 25 440 1900 470 93.5% 10.1 81.4 17.8
2/1 North Entry Left Ahead U B 1 24 439 1900 470 93.3% 9.9 80.6 17.7
2/2 North Entry Right Ahead U B 1 24 440 1900 470 93.5% 10.1 81.4 17.8
3/1 East Entry Ahead Left U C 1 24 439 1900 470 93.3% 9.9 80.6 17.7
3/2 East Entry Ahead Right U C 1 24 440 1900 470 93.5% 10.1 81.4 17.8
4/1 West Entry Left Ahead U D 1 24 439 1900 470 93.3% 9.9 80.6 17.7
4/2 West Entry Ahead Right U D 1 24 440 1900 470 93.5% 10.1 81.4 17.8
C1 PRC for Signalled Lanes (%): -3.9 Total Delay for Signalled Lanes (pcuHr): 77.00 Cycle Time (s): 105 PRC Over All Lanes (%): -3.9 Total Delay Over All Lanes(pcuHr): 78.20

ENG4111/ENG4112 Jarrod Taylor
Signalised Roundabouts Page 131
Table F.11 – Capacity values for 50m inscribed diameter LinSig model 60s phase time no all-red interval Urban Environment
Item Lane Description
Lane Type
Full Phase
Num Greens
Total Green
(s) Demand
Flow (pcu) Sat Flow (pcu/Hr)
Capacity (pcu)
Deg Sat (%)
Total Delay
(pcuHr)
Av. Delay Per PCU (s/pcu)
Mean Max Queue (pcu)
Network - - - - - - - - 97.1% 89.3 - -
50m Signalised Roundabout - - - - - - - - 97.1% 89.3 - -
1/1 South Entry Left Ahead U A 1 15 492 1900 507 97.1% 11.0 80.4 16.1
1/2 South Entry Ahead Right U A 1 15 492 1900 507 97.1% 11.0 80.4 16.1
2/1 North Entry Left Ahead U B 1 15 492 1900 507 97.1% 11.0 80.4 16.1
2/2 North Entry Right Ahead U B 1 15 492 1900 507 97.1% 11.0 80.4 16.1
3/1 East Entry Ahead Left U C 1 15 492 1900 507 97.1% 11.0 80.4 16.1
3/2 East Entry Ahead Right U C 1 15 492 1900 507 97.1% 11.0 80.4 16.1
4/1 West Entry Left Ahead U D 1 15 492 1900 507 97.1% 11.0 80.4 16.1
4/2 West Entry Ahead Right U D 1 15 492 1900 507 97.1% 11.0 80.4 16.1

ENG4111/ENG4112 Jarrod Taylor
Signalised Roundabouts Page 132
Table F.12 – Capacity values for 50m inscribed diameter 3 second clearance time Excel values Urban Environment
Saturation flow 1900 veh/hr Saturation flow 1900 veh/hr Cycle time 60 sec Cycle time 90 sec Clearance time -1 sec Clearance time -1 sec
Phase
1 Phase
2 Phase
3 Phase
4 Total Phase
1 Phase
2 Phase
3 Phase
4 Total Effective Green time (s) 16 16 16 16 Effective Green time (s) 23.5 23.5 23.5 23.5 Proportion of time (u) 0.27 0.27 0.27 0.27 Proportion of time (u) 0.26 0.26 0.26 0.26 Q one lane (veh/hr) 507 507 507 507 2027 Q (one lane) 496 496 496 496 1984 Q two lanes (veh/hr) 1013 1013 1013 1013 4053 Q (two lanes) 992 992 992 992 3969 Control Delay (s) 15 15 15 15 45 Control Delay (s) 23 23 23 23 68 Saturation flow 1900 veh/hr Saturation flow 1900 veh/hr Cycle time 75 sec Cycle time 105 sec Clearance time -1 sec Clearance time -1 sec
Phase
1 Phase
2 Phase
3 Phase
4 Total Phase
1 Phase
2 Phase
3 Phase
4 Total Effective Green time (s) 19.75 19.75 19.75 19.75 Effective Green time (s) 27.25 27.25 27.25 27.25 Proportion of time (u) 0.26 0.26 0.26 0.26 Proportion of time (u) 0.26 0.26 0.26 0.26 Q (one lane) 500 500 500 500 2001 Q (one lane) 493 493 493 493 1972 Q (two lanes) 1001 1001 1001 1001 4003 Q (two lanes) 986 986 986 986 3945 Control Delay (s) 19 19 19 19 56 Control Delay (s) 26 26 26 26 79

ENG4111/ENG4112 Jarrod Taylor
Signalised Roundabouts Page 133
Table F.13 – Capacity values for 60m inscribed diameter 3 second clearance time Excel values Semi-rural / Urban Environment
Saturation flow 1800 veh/hr Saturation flow 1800 veh/hr Cycle time 60 sec Cycle time 90 sec Clearance time -2 sec Clearance time -2 sec
Phase
1 Phase
2 Phase
3 Phase
4 Total Phase
1 Phase
2 Phase
3 Phase
4 Total Effective Green time (s) 17 17 17 17
Effective Green time (s) 24.5 24.5 24.5 24.5
Proportion of time (u) 0.28 0.28 0.28 0.28 Proportion of time (u) 0.27 0.27 0.27 0.27 Q one lane (veh/hr) 510 510 510 510 2040 Q (one lane) 490 490 490 490 1960 Q two lanes (veh/hr) 1020 1020 1020 1020 4080 Q (two lanes) 980 980 980 980 3920 Control Delay (s) 15 15 15 15 45 Control Delay (s) 23 23 23 23 68 Saturation flow 1800 veh/hr Saturation flow 1800 veh/hr Cycle time 75 sec Cycle time 105 sec Clearance time -2 sec Clearance time -2 sec
Phase
1 Phase
2 Phase
3 Phase
4 Total Phase
1 Phase
2 Phase
3 Phase
4 Total Effective Green time (s) 20.75 20.75 20.75 20.75
Effective Green time (s) 28.25 28.25 28.25 28.25
Proportion of time (u) 0.28 0.28 0.28 0.28 Proportion of time (u) 0.27 0.27 0.27 0.27 Q (one lane) 498 498 498 498 1992 Q (one lane) 484 484 484 484 1937 Q (two lanes) 996 996 996 996 3984 Q (two lanes) 969 969 969 969 3874 Control Delay (s) 19 19 19 19 56 Control Delay (s) 26 26 26 26 79

ENG4111/ENG4112 Jarrod Taylor
Signalised Roundabouts Page 134
Table F.14 – Capacity values for 60m inscribed diameter 3 second clearance time Excel values Urban Environment
Saturation flow 1900 veh/hr Saturation flow 1900 veh/hr Cycle time 60 sec Cycle time 90 sec Clearance time -2 sec Clearance time -2 sec
Phase
1 Phase
2 Phase
3 Phase
4 Total Phase
1 Phase
2 Phase
3 Phase
4 Total Effective Green time (s) 17 17 17 17
Effective Green time (s) 24.5 24.5 24.5 24.5
Proportion of time (u) 0.28 0.28 0.28 0.28 Proportion of time (u) 0.27 0.27 0.27 0.27 Q one lane (veh/hr) 538 538 538 538 2153 Q (one lane) 517 517 517 517 2069 Q two lanes (veh/hr) 1077 1077 1077 1077 4307 Q (two lanes) 1034 1034 1034 1034 4138 Control Delay (s) 15 15 15 15 45 Control Delay (s) 23 23 23 23 68 Saturation flow 1900 veh/hr Saturation flow 1900 veh/hr Cycle time 75 sec Cycle time 105 sec Clearance time -2 sec Clearance time -2 sec
Phase
1 Phase
2 Phase
3 Phase
4 Total Phase
1 Phase
2 Phase
3 Phase
4 Total Effective Green time (s) 20.75 20.75 20.75 20.75
Effective Green time (s) 28.25 28.25 28.25 28.25
Proportion of time (u) 0.28 0.28 0.28 0.28 Proportion of time (u) 0.27 0.27 0.27 0.27 Q (one lane) 526 526 526 526 2103 Q (one lane) 511 511 511 511 2045 Q (two lanes) 1051 1051 1051 1051 4205 Q (two lanes) 1022 1022 1022 1022 4090 Control Delay (s) 19 19 19 19 56 Control Delay (s) 26 26 26 26 79

ENG4111/ENG4112 Jarrod Taylor
Signalised Roundabouts Page 135
APPENDIX G – LINSIG UK PHASING RESULTS 50m INSCRIBED DIAMETER Table G.1 – Controlled delay for journey times LinSig model 60s phase time Semi Rural / Urban Environment
Route Number Origin Zone Origin Lane Destination Zone Destination Lane Time (s)
1 A 1/1 B 10/1 57.14
3 A 1/1 C 11/1 60.14
4 A 1/2 C 11/2 59.89
5 B 2/1 C 11/1 57.14
6 C 3/1 A 9/1 60.14
7 C 3/2 A 9/2 59.89
9 B 2/1 D 12/1 60.14
10 B 2/2 D 12/2 59.89
11 C 3/1 D 12/1 57.14
12 D 4/1 A 9/1 57.14
13 D 4/1 B 10/1 60.14
14 D 4/2 B 10/2 59.89
15 A 1/2 D 12/2 70.86
17 C 3/2 B 10/2 72.86
21 D 4/2 C 11/2 69.88
23 B 2/2 A 9/2 73.86
28 D 4/2 C 11/1 69.87
29 A 1/2 D 12/1 70.87
34 B 2/2 A 9/1 73.87
39 C 3/2 B 10/1 72.87
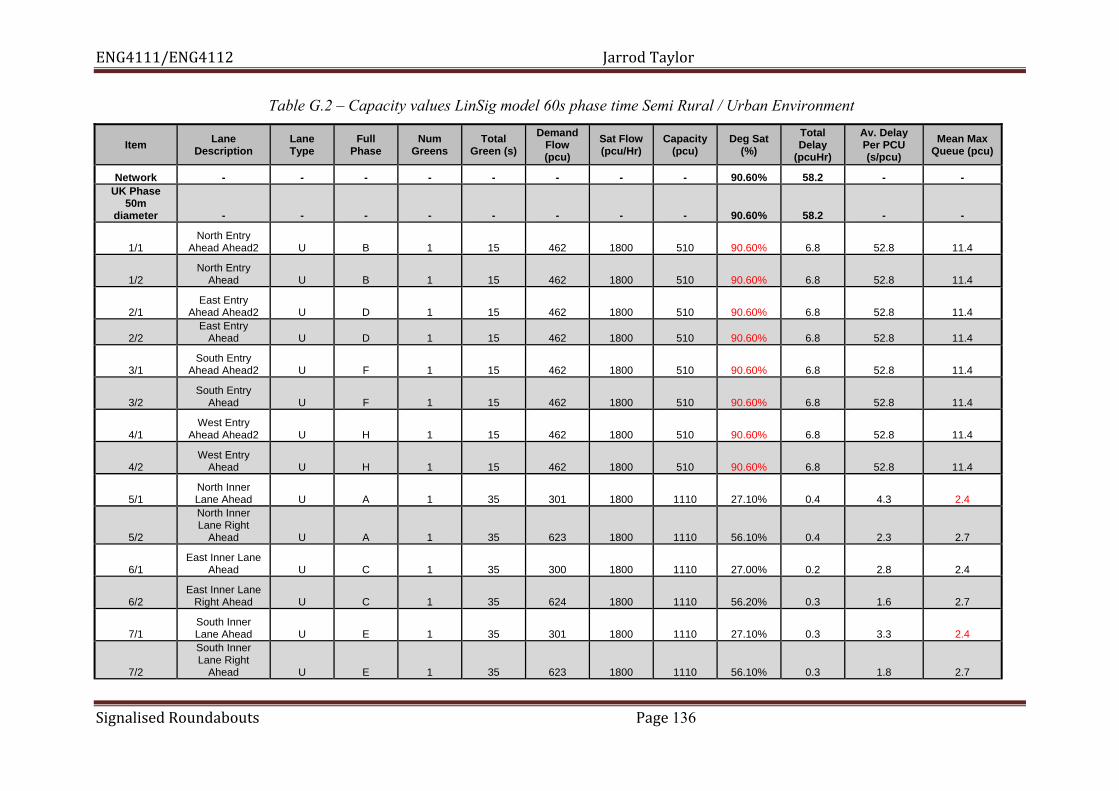
ENG4111/ENG4112 Jarrod Taylor
Signalised Roundabouts Page 136
Table G.2 – Capacity values LinSig model 60s phase time Semi Rural / Urban Environment
Item Lane Description
Lane Type
Full Phase
Num Greens
Total Green (s)
Demand Flow (pcu)
Sat Flow (pcu/Hr)
Capacity (pcu)
Deg Sat (%)
Total Delay
(pcuHr)
Av. Delay Per PCU (s/pcu)
Mean Max Queue (pcu)
Network - - - - - - - - 90.60% 58.2 - - UK Phase
50m diameter - - - - - - - - 90.60% 58.2 - -
1/1 North Entry
Ahead Ahead2 U B 1 15 462 1800 510 90.60% 6.8 52.8 11.4
1/2 North Entry
Ahead U B 1 15 462 1800 510 90.60% 6.8 52.8 11.4
2/1 East Entry
Ahead Ahead2 U D 1 15 462 1800 510 90.60% 6.8 52.8 11.4
2/2 East Entry
Ahead U D 1 15 462 1800 510 90.60% 6.8 52.8 11.4
3/1 South Entry
Ahead Ahead2 U F 1 15 462 1800 510 90.60% 6.8 52.8 11.4
3/2 South Entry
Ahead U F 1 15 462 1800 510 90.60% 6.8 52.8 11.4
4/1 West Entry
Ahead Ahead2 U H 1 15 462 1800 510 90.60% 6.8 52.8 11.4
4/2 West Entry
Ahead U H 1 15 462 1800 510 90.60% 6.8 52.8 11.4
5/1 North Inner Lane Ahead U A 1 35 301 1800 1110 27.10% 0.4 4.3 2.4
5/2
North Inner Lane Right
Ahead U A 1 35 623 1800 1110 56.10% 0.4 2.3 2.7
6/1 East Inner Lane
Ahead U C 1 35 300 1800 1110 27.00% 0.2 2.8 2.4
6/2 East Inner Lane
Right Ahead U C 1 35 624 1800 1110 56.20% 0.3 1.6 2.7
7/1 South Inner Lane Ahead U E 1 35 301 1800 1110 27.10% 0.3 3.3 2.4
7/2
South Inner Lane Right
Ahead U E 1 35 623 1800 1110 56.10% 0.3 1.8 2.7

ENG4111/ENG4112 Jarrod Taylor
Signalised Roundabouts Page 137
8/1 West Inner Lane
Ahead U G 1 35 301 1800 1110 27.10% 0.4 4.8 2.4
8/2 West Inner Lane
Right Ahead U G 1 35 623 1800 1110 56.10% 0.4 2.6 2.7

ENG4111/ENG4112 Jarrod Taylor
Signalised Roundabouts Page 138
Table G.3 – Controlled delay for journey times LinSig model 60s phase Urban Environment
Route Number Origin Zone Origin Lane Destination Zone Destination Lane Time (s)
1 A 1/1 B 10/1 50.82
3 A 1/1 C 11/1 53.80
4 A 1/2 C 11/2 54.07
5 B 2/1 C 11/1 46.70
6 C 3/1 A 9/1 49.71
7 C 3/2 A 9/2 49.46
9 B 2/1 D 12/1 49.71
10 B 2/2 D 12/2 49.46
11 C 3/1 D 12/1 46.71
12 D 4/1 A 9/1 46.71
13 D 4/1 B 10/1 49.71
14 D 4/2 B 10/2 49.46
15 A 1/2 D 12/2 65.07
17 C 3/2 B 10/2 62.68
21 D 4/2 C 11/2 59.67
23 B 2/2 A 9/2 63.68
28 D 4/2 C 11/1 59.68
29 A 1/2 D 12/1 65.06
34 B 2/2 A 9/1 63.67
39 C 3/2 B 10/1 62.67

ENG4111/ENG4112 Jarrod Taylor
Signalised Roundabouts Page 139
Table G.4 – Capacity values LinSig model 60s phase time Urban Environment
Item Lane Description
Lane Type
Full Phase
Num Greens
Total Green (s)
Demand Flow (pcu)
Sat Flow (pcu/Hr)
Capacity (pcu)
Deg Sat (%)
Total Delay
(pcuHr)
Av. Delay Per PCU (s/pcu)
Mean Max Queue (pcu)
Network - - - - - - - - 88.60% 48.7 - - UK Phase
50m diameter - - - - - - - - 88.60% 48.7 - -
1/1 North Entry
Ahead Ahead2 U B 1 15 447 1800 510 87.60% 5.8 46.4 10.3
1/2 North Entry
Ahead U B 1 15 477 1900 538 88.60% 6.2 46.9 11
2/1 East Entry
Ahead Ahead2 U D 1 15 462 1900 538 85.80% 5.4 42.3 10
2/2 East Entry
Ahead U D 1 15 462 1900 538 85.80% 5.4 42.3 10
3/1 South Entry
Ahead Ahead2 U F 1 15 462 1900 538 85.80% 5.4 42.3 10
3/2 South Entry
Ahead U F 1 15 462 1900 538 85.80% 5.4 42.3 10
4/1 West Entry
Ahead Ahead2 U H 1 15 462 1900 538 85.80% 5.4 42.3 10
4/2 West Entry
Ahead U H 1 15 462 1900 538 85.80% 5.4 42.3 10
5/1 North Inner Lane Ahead U A 1 35 299 1900 1172 25.50% 0.4 4.3 2.4
5/2
North Inner Lane Right
Ahead U A 1 35 625 1900 1172 53.30% 0.4 2.4 2.7
6/1 East Inner Lane
Ahead U C 1 35 285 1900 1172 24.30% 0.2 3.1 2.4
6/2 East Inner Lane
Right Ahead U C 1 35 639 1900 1172 54.50% 0.3 1.6 2.7
7/1 South Inner Lane Ahead U E 1 35 299 1900 1172 25.50% 0.3 3.3 2.4
7/2
South Inner Lane Right
Ahead U E 1 35 625 1900 1172 53.30% 0.3 1.8 2.7

ENG4111/ENG4112 Jarrod Taylor
Signalised Roundabouts Page 140
8/1 West Inner Lane
Ahead U G 1 35 299 1900 1172 25.50% 0.4 4.8 2.4
8/2 West Inner Lane
Right Ahead U G 1 35 625 1900 1172 53.30% 0.5 2.7 2.7

ENG4111/ENG4112 Jarrod Taylor
Signalised Roundabouts Page 141
APPENDIX H – LINSIG UK PHASING RESULTS 60m INSCRIBED DIAMETER Table H.1 – Controlled delay for journey times LinSig model 60s phase time Semi Rural / Urban Environment
Route Number Origin Zone Origin Lane Destination Zone Destination Lane Time (s)
1 A 1/1 B 10/1 41.04
3 A 1/1 C 11/1 45.04
4 A 1/2 C 11/2 45.00
5 B 2/1 C 11/1 47.12
6 C 3/1 A 9/1 45.04
7 C 3/2 A 9/2 45.00
9 B 2/1 D 12/1 51.12
10 B 2/2 D 12/2 51.18
11 C 3/1 D 12/1 41.04
12 D 4/1 A 9/1 47.12
13 D 4/1 B 10/1 51.12
14 D 4/2 B 10/2 51.18
15 A 1/2 D 12/2 55.91
17 C 3/2 B 10/2 55.91
21 D 4/2 C 11/2 62.11
23 B 2/2 A 9/2 60.18
28 D 4/2 C 11/1 62.11
29 A 1/2 D 12/1 55.89
34 B 2/2 A 9/1 60.18
39 C 3/2 B 10/1 55.89

ENG4111/ENG4112 Jarrod Taylor
Signalised Roundabouts Page 142
Table H.2 – Capacity values LinSig model 60s phase time Semi Rural / Urban Environment
Item Lane Description
Lane Type
Full Phase
Num Greens
Total Green (s)
Demand Flow (pcu)
Sat Flow (pcu/Hr)
Capacity (pcu)
Deg Sat (%)
Total Delay
(pcuHr)
Av. Delay Per PCU (s/pcu)
Mean Max Queue (pcu)
Network - - - - - - - - 81.8% 34.2 - - UK Phase
50m diameter
- - - - - - - - 81.8% 34.2 - -
1/1 North Entry
Ahead Ahead2 U B 1 14 367 1800 480 76.5% 3.6 35.8 7.2
1/2 North Entry
Ahead U B 1 14 368 1800 480 76.7% 3.7 35.9 7.2
2/1 East Entry
Ahead Ahead2 U D 1 13 367 1800 450 81.6% 4.3 41.8 7.8
2/2 East Entry
Ahead U D 1 13 368 1800 450 81.8% 4.3 42.1 7.9
3/1 South Entry
Ahead Ahead2 U F 1 14 367 1800 480 76.5% 3.6 35.8 7.2
3/2 South Entry
Ahead U F 1 14 368 1800 480 76.7% 3.7 35.9 7.2
4/1 West Entry
Ahead Ahead2 U H 1 13 367 1800 450 81.6% 4.3 41.8 7.8
4/2 West Entry
Ahead U H 1 13 368 1800 450 81.8% 4.3 42.1 7.9
5/1 North Inner Lane Ahead U A 1 36 238 1800 1140 20.9% 0.2 2.8 1.8
5/2
North Inner Lane Right
Ahead U A 1 36 497 1800 1140 43.6% 0.2 1.5 2.1
6/1 East Inner Lane
Ahead U C 1 37 239 1800 1170 20.4% 0.2 2.8 1.9
6/2 East Inner Lane
Right Ahead U C 1 37 496 1800 1170 42.4% 0.2 1.5 2.1
7/1 South Inner Lane Ahead U E 1 36 238 1800 1140 20.9% 0.2 2.8 1.8
7/2
South Inner Lane Right
Ahead U E 1 36 497 1800 1140 43.6% 0.2 1.5 2.1

ENG4111/ENG4112 Jarrod Taylor
Signalised Roundabouts Page 143
8/1 West Inner Lane
Ahead U G 1 37 238 1800 1170 20.3% 0.1 1.9 1.7
8/2 West Inner Lane
Right Ahead U G 1 37 497 1800 1170 42.5% 0.1 1.0 2.0

ENG4111/ENG4112 Jarrod Taylor
Signalised Roundabouts Page 144
Table H.3 – Controlled delay for journey times LinSig model 60s phase time Urban Environment
Route Number Origin Zone Origin Lane Destination Zone Destination Lane Time (s)
1 A 1/1 B 10/1 37.93
3 A 1/1 C 11/1 41.93
4 A 1/2 C 11/2 41.85
5 B 2/1 C 11/1 42.36
6 C 3/1 A 9/1 41.93
7 C 3/2 A 9/2 41.85
9 B 2/1 D 12/1 46.36
10 B 2/2 D 12/2 46.34
11 C 3/1 D 12/1 37.93
12 D 4/1 A 9/1 42.36
13 D 4/1 B 10/1 46.36
14 D 4/2 B 10/2 46.34
15 A 1/2 D 12/2 52.91
17 C 3/2 B 10/2 52.91
21 D 4/2 C 11/2 57.45
23 B 2/2 A 9/2 55.53
28 D 4/2 C 11/1 57.46
29 A 1/2 D 12/1 52.92
34 B 2/2 A 9/1 55.55
39 C 3/2 B 10/1 52.92

ENG4111/ENG4112 Jarrod Taylor
Signalised Roundabouts Page 145
Table H.4 – Capacity values LinSig model 60s phase time Urban Environment
Item Lane Description
Lane Type
Full Phase
Num Greens
Total Green (s)
Demand Flow (pcu)
Sat Flow (pcu/Hr)
Capacity (pcu)
Deg Sat (%)
Total Delay
(pcuHr)
Av. Delay Per PCU (s/pcu)
Mean Max Queue (pcu)
Network - - - - - - - - 77.5% 31.0 - - UK Phase
50m diameter
- - - - - - - - 77.5% 31.0 - -
1/1 North Entry
Ahead Ahead2 U B 1 14 367 1900 507 72.4% 3.3 32.7 6.8
1/2 North Entry Ahead U B 1 14 368 1900 507 72.6% 3.3 32.8 6.8
2/1 East Entry
Ahead Ahead2 U D 1 13 367 1900 475 77.3% 3.8 37.1 7.3
2/2 East Entry
Ahead U D 1 13 368 1900 475 77.5% 3.8 37.2 7.3
3/1 South Entry
Ahead Ahead2 U F 1 14 367 1900 507 72.4% 3.3 32.7 6.8
3/2 South Entry
Ahead U F 1 14 368 1900 507 72.6% 3.3 32.8 6.8
4/1 West Entry
Ahead Ahead2 U H 1 13 367 1900 475 77.3% 3.8 37.1 7.3
4/2 West Entry
Ahead U H 1 13 368 1900 475 77.5% 3.8 37.2 7.3
5/1 North Inner Lane Ahead U A 1 36 238 1900 1203 19.8% 0.2 2.9 1.8
5/2
North Inner Lane Right
Ahead U A 1 36 497 1900 1203 41.3% 0.2 1.6 2.0
6/1 East Inner Lane
Ahead U C 1 37 238 1900 1235 19.3% 0.2 2.9 1.9
6/2 East Inner Lane
Right Ahead U C 1 37 497 1900 1235 40.2% 0.2 1.6 2.1
7/1 South Inner Lane Ahead U E 1 36 238 1900 1203 19.8% 0.2 2.9 1.8
7/2
South Inner Lane Right
Ahead U E 1 36 497 1900 1203 41.3% 0.2 1.6 2.0
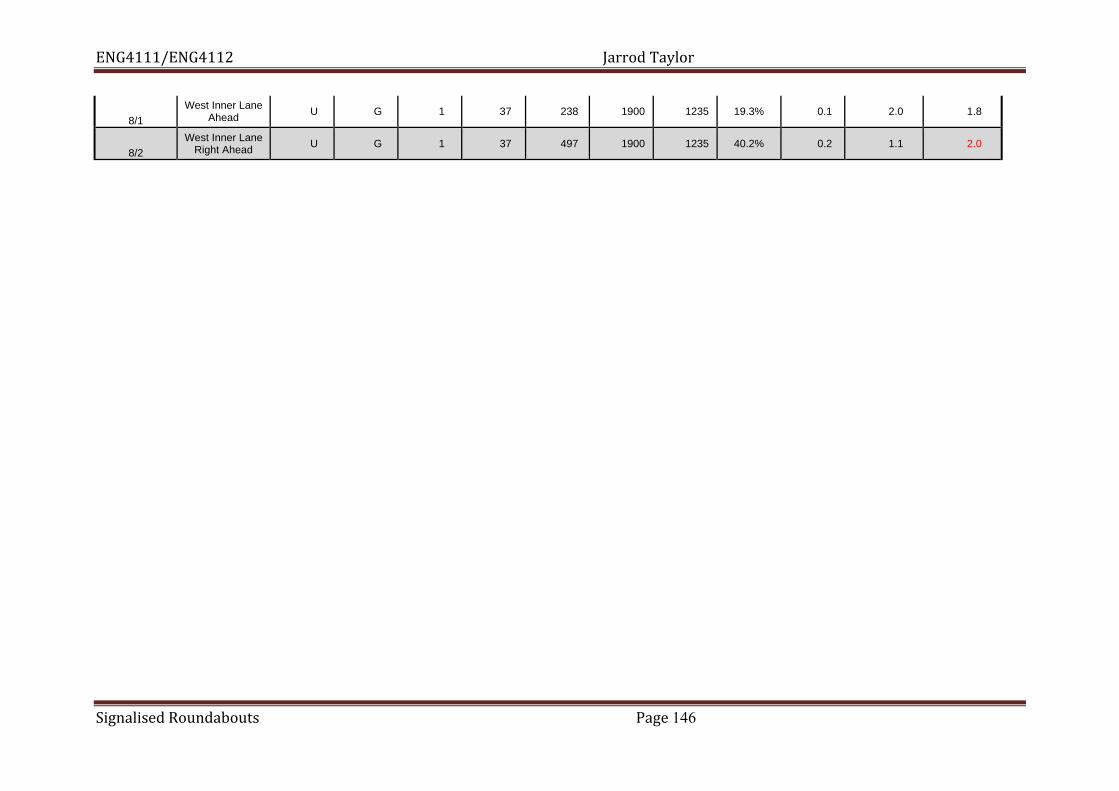
ENG4111/ENG4112 Jarrod Taylor
Signalised Roundabouts Page 146
8/1 West Inner Lane
Ahead U G 1 37 238 1900 1235 19.3% 0.1 2.0 1.8
8/2 West Inner Lane
Right Ahead U G 1 37 497 1900 1235 40.2% 0.2 1.1 2.0

ENG4111/ENG4112 Jarrod Taylor
Signalised Roundabouts Page 147
APPENDIX I – UN-SIGNALISED ROUNDABOUT CAPACITIES
Table I.1 – Capacity of un-signalised roundabout based on uniform flow from HCM 2010
Circulating Flow (veh/hr)
Left Entry
(veh/hr)
Right Entry
(veh/hr)
One Leg Entry
(veh/hr)
Total Entry
(veh/hr)
Total Capacity (veh/hr)
1500 395 367 762 3049 4549 1750 332 304 636 2544 4294 2000 279 252 531 2123 4123 2250 234 209 443 1772 4022 2500 196 173 370 1479 3979 2750 165 144 309 1234 3984 3000 138 119 257 1030 4030 3250 116 99 215 860 4110 3500 98 82 179 717 4217
Table I.2 – Capacity of un-signalised roundabout based on uniform flow from Tan 2001 % of Left
Turn % of
Through % of Right
Turn Total Capacity
(veh/hr) 33 33 33 4111

ENG4111/ENG4112 Jarrod Taylor
Signalised Roundabouts Page 148
Table I.3 – Capacity of un-signalised roundabout based on variable flow from Tan 2001 % of Left
Turn % of
Through % of Right
Turn Total Capacity
(veh/hr) % of Left
Turn % of
Through % of Right
Turn Total Capacity
(veh/hr) 10 55 35 3649 10 40 50 3426 15 55 30 3814 15 40 45 3571 20 55 25 3994 20 40 40 3729 25 55 20 4193 25 40 35 3902 30 55 15 4412 30 40 30 4091 35 55 10 4655 35 40 25 4299 40 55 5 4927 40 40 20 4530
% of Left
Turn % of
Through % of Right
Turn Total Capacity
(veh/hr) % of Left
Turn % of
Through % of Right
Turn Total Capacity
(veh/hr) 10 50 40 3571 10 35 55 3358 15 50 35 3729 15 35 50 3497 20 50 30 3902 20 35 45 3649 25 50 25 4091 25 35 40 3814 30 50 20 4299 30 35 35 3994 35 50 15 4530 35 35 30 4193 40 50 10 4787 40 35 25 4412
% of Left
Turn % of
Through % of Right
Turn Total Capacity
(veh/hr) % of Left
Turn % of
Through % of Right
Turn Total Capacity
(veh/hr) 10 45 45 3497 10 30 60 3293 15 45 40 3649 15 30 55 3426 20 45 35 3814 20 30 50 3571 25 45 30 3994 25 30 45 3729 30 45 25 4193 30 30 40 3902 35 45 20 4412 35 30 35 4091 40 45 15 4655 40 30 30 4299


![Signalised Intersections [170309]](https://static.fdocuments.net/doc/165x107/577cde291a28ab9e78ae8510/signalised-intersections-170309.jpg)


