Evaluation of the Business Case for Quality, Phase II: …€¦ · Evaluation of the Business Case...
26
Evaluation of the Business Case for Quality, Phase II: Cincinnati Children’s Hospital Medical Center Case Study May 2013 Mathematica: Erin Fries Taylor Dominick Esposito Kristin Andrews Keith Kranker Lei Rao University of North Carolina, Chapel Hill: Sandra Greene Kristin Reiter Charlotte Williams Stephanie Pierson
Transcript of Evaluation of the Business Case for Quality, Phase II: …€¦ · Evaluation of the Business Case...

Evaluation of the Business Case
for Quality, Phase II: Cincinnati
Children’s Hospital Medical Center
Case Study
May 2013
Mathematica: Erin Fries Taylor Dominick Esposito Kristin Andrews Keith Kranker Lei Rao University of North Carolina, Chapel Hill: Sandra Greene Kristin Reiter Charlotte Williams Stephanie Pierson

UNDERSTANDING THE BUSINESS CASE FOR IMPROVING PEDIATRIC ASTHMA CARE: RESULTS FROM CINCINNATI CHILDREN’S HOSPITAL MEDICAL CENTER
Contract Number: 100493
Mathematica Reference Number: 06430.700
Submitted to: Center for Health Care Strategies 200 American Metro Blvd. Suite 119 Hamilton, NJ 08619 Project Officer: Allison Hamblin
Submitted by: Mathematica Policy Research P.O. Box 2393 Princeton, NJ 08543-2393 Telephone: (609) 799-3535 Facsimile: (609) 799-0005 Project Director: Dominick Esposito
Evaluation of the Business Case for
Quality, Phase II: Cincinnati
Children’s Hospital Medical Center
Case Study
May 2013
Mathematica: Erin Fries Taylor Dominick Esposito Kristin Andrews Keith Kranker Lei Rao University of North Carolina, Chapel Hill: Sandra Greene Kristin Reiter Charlotte Williams Stephanie Pierson

BCQII: Cincinnati Plan Case Study Mathematica Policy Research
3
The Case Study at a Glance
The Asthma Improvement Collaborative (AIC) at Cincinnati Children’s Hospital Medical Center (Cincinnati Children’s) sought to improve and better coordinate asthma care across multiple settings in its system, with the goal of reducing asthma-related inpatient and emergency department (ED) use for Medicaid-insured children. It also provides asthma care and patient education in outpatient settings.
The Intervention: The three primary components of the AIC reflect Cincinnati Children’s interest in a system-wide approach to improving asthma care: an inpatient asthma quality improvement effort, care coordination, and a home health program. This work on improving pediatric asthma care is driven by Cincinnati Children’s culture and history of focusing on quality improvement, its mission to provide high quality health care to all children served by its providers, and the potential for a positive return on investment (ROI) by replacing avoidable admissions for asthma with higher revenue admissions.
The Business Case: Cincinnati Children’s is paid on a fee-for-service (FFS) basis by capitated health plans and these financing arrangements were not modified by the intervention. While Cincinnati Children’s had few direct financial incentives to improve pediatric asthma care, leadership perceived this work as having strong potential for a positive ROI. Cincinnati Children’s sought to generate evidence that care improvements would lead to cost savings—thereby providing the basis for payers to modify how Cincinnati Children’s is paid. Staff also believed this work would improve efficiency, which was perceived as important to the institution’s future success.
Findings: Cincinnati Children’s inpatient process measures improved over time, including the percentage of children having asthma medications in hand at discharge and that were referred to case management. In the outpatient setting, there was some evidence of improvement in the proportion receiving written asthma care plans and, among those receiving coaching, substantial improvement in proper use of tools for administering asthma medication. We also examined changes in outcomes for Medicaid-insured children in Hamilton County—since Cincinnati Children’s is the predominant provider in the county and this initiative was broad based—and compared them to changes in outcomes in three comparison counties in Ohio. The outcomes analysis indicates that Cincinnati Children’s had some limited success at reducing the rate of ED visits among children in Hamilton County with less severe asthma (as measured by previous visits for asthma). The decrease during the intervention period, however, may be due to the long-term, preexisting downward trend in ED use by children with asthma in this geographic area, rather than to program impacts. The intervention did, however, affect use of controller and rescue medications, with the proportion with any use and the number of fills increasing over the study period.
Implications for the Business Case in Medicaid: The AIC initiative provides a strong example of changing health care delivery in multiple settings of the system. The initiative made strides at improving processes of care, reflecting its success in actively engaging patients and providers. But this work did not affect the rate of hospitalizations, and had limited effect on the rate of ED visits, suggesting that even large, broad-based interventions that show improvements in process can find it challenging to affect utilization at the population level. This lack of observed impacts highlights the importance of focusing an intervention on high-risk patient populations with the greatest potential to benefit from participation, if a positive ROI and cost savings are key goals. Cincinnati Children’s has recently negotiated contracts with MCOs that include financial support for care coordination and home health, resulting in part from its substantial process improvements and general downward trends in ED use.

BCQII: Cincinnati Plan Case Study Mathematica Policy Research
4
I. Introduction
The Business Case for Quality Phase II (BCQII) initiative, sponsored by the Center for Health Care Strategies (CHCS) and funded by the Robert Wood Johnson Foundation and the Commonwealth Fund, focuses on improving pediatric asthma care. A follow-up to an earlier initiative, BCQII is designed to deliver robust and actionable results through rigorous study design, measurement of clinical quality, and business case analyses for multiple stakeholders. The initiative also sought to identify financing misalignments that impede investments in quality and suggest strategies for correcting them. BCQII includes three grantees operating in different settings and pursuing distinct approaches to improving pediatric asthma care. This case study focuses on the BCQII intervention of Cincinnati Children’s.
Cincinnati Children’s AIC is composed of a wide array of quality improvement activities that reflect a system-wide approach to improving pediatric asthma care in Hamilton County, Ohio. These activities occur in the hospital, at affiliated outpatient clinics, and in the homes of patients through a home health program. This multifaceted approach is intended to improve appropriate use of asthma medications; reduce the rate of ED and hospital visits for asthma; provide more coordinated, standardized care; and improve the overall quality of asthma care.
II. Cincinnati Children’s Asthma Improvement Collaborative
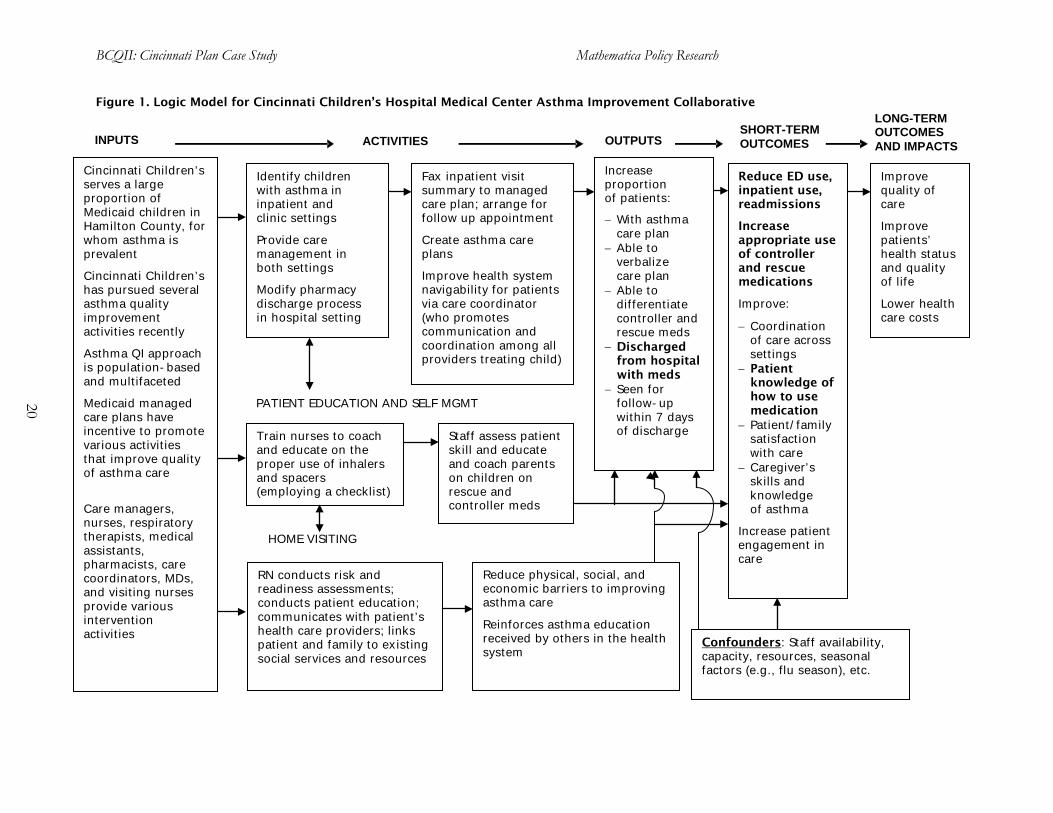
Cincinnati Children’s AIC involves a comprehensive, system-wide approach to improving pediatric asthma care. In the words of one staff member, the approach of addressing asthma care on multiple fronts seeks to create a “fail-safe process” so children with asthma do not slip through the cracks as they move through the Cincinnati Children’s system. We provide detailed descriptions of these activities below and a logic model in Figure 1 (at the end of this document), which shows how these activities are intended to meet their ultimate objectives. For additional background, see McCarthy and Cohen (2012). A. Intervention Details
The inpatient quality improvement initiative focuses on the two units of the hospital that handle 95 percent of asthma patient admissions.1
1 At the start of BCQII, these units received only 70 percent of asthma patients, but over time the hospital has
streamlined its approach to asthma admissions. This has allowed staff involved with this initiative to focus on implementing and standardizing the approach to asthma assessment, education, and medication management in these units—rather than having to train hospital staff in other units who rarely see asthma patients. Nonetheless, there are still occasions when a high patient census means that some asthma patients will be placed in other units.
A primary objective of this work is increasing the proportion of children who take their medications home at the time of discharge (as a result of a relabeling process that permits patients to take home the remaining portion of single dose medications that were partially used in the inpatient setting); this proportion has increased substantially over time. In addition, through a separate process with the outpatient pharmacy, additional multi-dosage medications needed to manage asthma over the next 30 days are dispensed so that the family leaves the hospital with them in hand. The initiative also includes the provision of (1) real-time notification to the child’s managed care organization (MCO) about the inpatient admission, and (2) a fax discharge summary to the plan. In addition, children and their caregivers

BCQII: Cincinnati Plan Case Study Mathematica Policy Research
5
receive an asthma action plan to support their understanding of follow-up care and use of care management services.
As part of this initiative, the hospital has also standardized its approach to asthma assessment. The asthma skills checklist is now used regularly on the hospital floor, as well as in the primary care clinics and the home health program.2
An important culture change that resulted from these inpatient activities is a shift in mindset from treating the acute episode to focusing on asthma as a chronic disease. Cincinnati Children’s reported that these activities helped to emphasize the chronicity of asthma and allowed staff to recognize the importance of educating children and their families while they are in the hospital.
Hospital staff now conduct a revised version of the Child Asthma Risk Assessment Tool on more than 90 percent of admitted patients. In addition, in May 2010, the hospital hired an education specialist who provides asthma education and skills teaching at the bedside. Finally, the hospital has worked to standardize education materials across inpatient departments—given that slight differences in wording and language in previous versions were potentially confusing to patients.
As part of the care coordination component of the initiative, two full-time care coordinators work with children seen in Cincinnati Children’s primary care practices and their families on self-management of asthma. In particular, the care coordinators (1) help them gain access to medications; (2) provide education; (3) help coordinate care across settings (such as specialty and inpatient care and, in some cases, communicating with school nurses); (4) communicate information to MCOs as appropriate; and (5) connect patients to community resources as needed. The care coordinators also prepare a care plan for each child that is available in the electronic medical record to any provider within the CCHMC system and is shared through secure electronic means with external care team members. The coordinators work closely with physicians in the clinic, as well as a nurse practitioner who focuses on patients with the most severe asthma.3
Targeting coordination efforts to children who might benefit the most, care coordinators focus on those with substantial amounts of hospital care but whose cases are not so severe that they might require extensive intervention. Specifically, they target children with one to three hospital admissions for asthma or two to four ED visits for asthma in the past year. Using a list, which is updated monthly, of children who meet these utilization criteria, the care coordinators identify children by comparing those scheduled for an office visit, either in advance or on the day of the visit. During the child’s first visit, the care coordinator assesses the patient’s asthma severity, as well as self-management skills, engagement, and the readiness of the child and family to change. The
In addition, the care coordinators were able to track patients’ fill and refill patterns for asthma medications through a web-based pharmacy claims database supported by the Ohio Department of Family and Job Services. This claims database, however, is no longer available due to the decentralization of pharmacy benefits to the MCOs. Cincinnati Children’s now has access to claims for some of patients via claims-based tools of the MCOs, but this is not as efficient as the single repository site.
2 Staff use a mask checklist and a mouthpiece checklist to assess whether the patient is using the equipment
properly. Staff ask the child and/or caregiver to show them how he/she uses the metered dose inhaler and spacer with either the mask or mouthpiece, and records whether each step was done correctly.
3 The nurse practitioner and care coordinator sometimes see patients together, with the nurse practitioner focusing on the medical side of asthma and asthma care (such as explaining the pathophysiology) and the care coordinator focusing on its social aspects and available social services.

BCQII: Cincinnati Plan Case Study Mathematica Policy Research
6
coordinator typically conducts a telephone follow-up within two weeks of the first visit and has the child come for a second office visit within a month. At that point, follow-up depends on the child’s specific situation, but is typically three to six months later. Thus, although the coordinator’s initial work with each child is fairly intensive, follow-up is generally less so, and its timing is variable and tailored to children’s needs. Parents can access the care coordinator whenever needed.
Each of the care coordinators has a caseload of 75 to 100 children.4
In 2010, as a part of a broader home health program, Cincinnati Children’s also created a home health visiting program, known as the Home Health Asthma Pathway (HHAP), for children with asthma. HHAP helps bridge inpatient and outpatient care by bringing care management and self-management support by a registered nurse (RN) into children’s homes. Children are often referred to HHAP following an inpatient stay, though referrals also come from Cincinnati Children’s outpatient clinics (requested by the primary care physician or care coordinator), specialists (such as pulmonologists), community physicians, or a managed care plan. Accordingly, children who receive HHAP services tend to be high risk.
Both care coordinators work primarily at the Pediatric Primary Care (PPC) Center, and most of their patients are from the PPC. One of the coordinators, however, also sees patients at Cincinnati Children’s Hopple Street Center clinic, while the other sees patients at the Fairfield Primary Care clinic.
An RN assesses the home environment for asthma triggers and offers education through a series of home visits (typically at least three) lasting 45 minutes to one hour each. The standardized Asthma Control Test and a review of the child’s asthma action plan are completed at each visit. The RN’s initial visit focuses on the child’s and family’s understandings of asthma as a chronic disease and identifies asthma triggers. In the first visit, the RN also confirms whether the child has the appropriate medications and understands how to use them. Coordination with the physician occurs if the RN has medication or treatment concerns. While some discussion of self-management may occur during this visit, the second visit tends to focus on this more. Patient education and self-management builds over time as the RN has an opportunity to reinforce content. Most children receive at least three visits; some receive up to five.
HHAP also employs asthma resource RNs who initiate the plan of care for home health, often contacting the child’s family while still in the hospital setting, either by telephone or in person. The resource RNs help coordinate communications between their program and the child’s primary care provider and, when relevant, the outpatient care coordinator, specialists such as an allergist or pulmonologist, and the hospital. HHAP staff developed a short form with which its staff communicate to the primary care physician and/or pulmonologist the three to five most important pieces of information gathered after each home visit. In addition to facilitating these clinical conversations and communications, the resource RNs also handle the paperwork for each case.
Collaboration across activities. Close collaboration across Cincinnati Children’s various asthma quality improvement activities is an important feature of the asthma care work. For example,
4 Cincinnati Children’s is still trying to determine the optimal caseload for each care coordinator. While a caseload of 75 patients is feasible, this works only because patients vary in their needs, and many do not need much additional intervention after an initial visit. Moreover, Cincinnati Children’s also uses “graduation” criteria—that is, no ED visit or hospital admission for asthma in 365 days—to identify children for whom active care coordination is no longer necessary.
BCQII: Cincinnati Plan Case Study Mathematica Policy Research
7
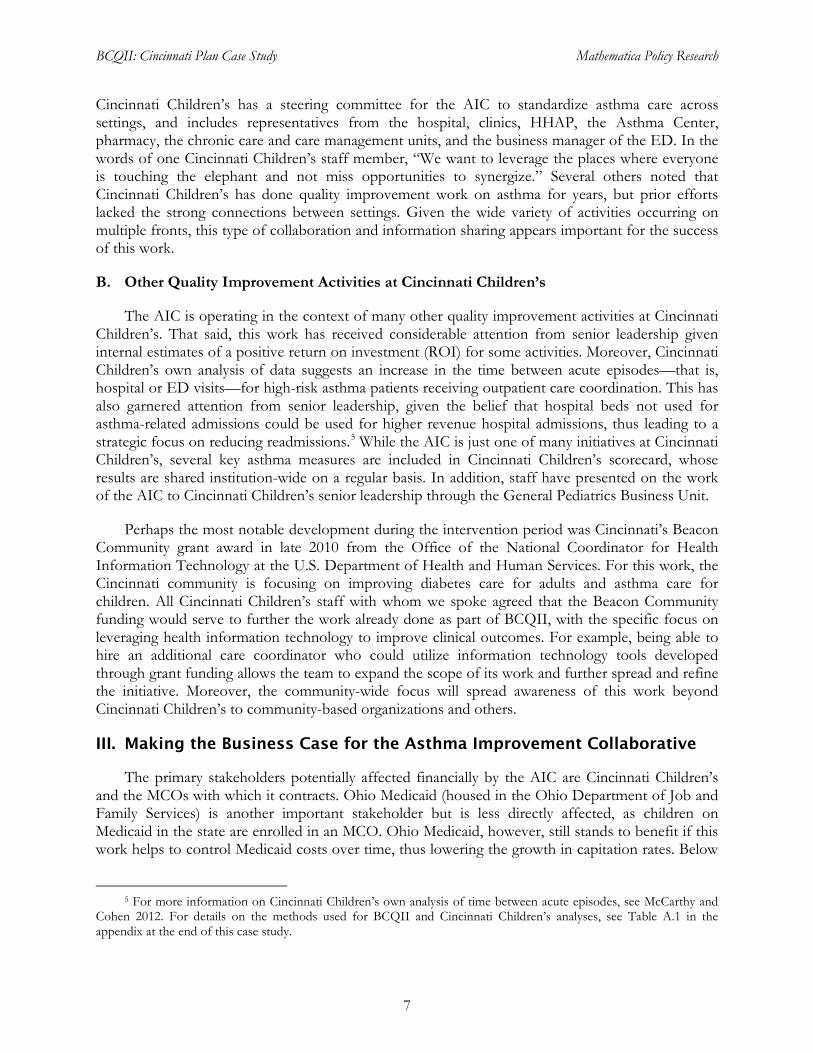
Cincinnati Children’s has a steering committee for the AIC to standardize asthma care across settings, and includes representatives from the hospital, clinics, HHAP, the Asthma Center, pharmacy, the chronic care and care management units, and the business manager of the ED. In the words of one Cincinnati Children’s staff member, “We want to leverage the places where everyone is touching the elephant and not miss opportunities to synergize.” Several others noted that Cincinnati Children’s has done quality improvement work on asthma for years, but prior efforts lacked the strong connections between settings. Given the wide variety of activities occurring on multiple fronts, this type of collaboration and information sharing appears important for the success of this work.
B. Other Quality Improvement Activities at Cincinnati Children’s
The AIC is operating in the context of many other quality improvement activities at Cincinnati Children’s. That said, this work has received considerable attention from senior leadership given internal estimates of a positive return on investment (ROI) for some activities. Moreover, Cincinnati Children’s own analysis of data suggests an increase in the time between acute episodes—that is, hospital or ED visits—for high-risk asthma patients receiving outpatient care coordination. This has also garnered attention from senior leadership, given the belief that hospital beds not used for asthma-related admissions could be used for higher revenue hospital admissions, thus leading to a strategic focus on reducing readmissions.5
Perhaps the most notable development during the intervention period was Cincinnati’s Beacon Community grant award in late 2010 from the Office of the National Coordinator for Health Information Technology at the U.S. Department of Health and Human Services. For this work, the Cincinnati community is focusing on improving diabetes care for adults and asthma care for children. All Cincinnati Children’s staff with whom we spoke agreed that the Beacon Community funding would serve to further the work already done as part of BCQII, with the specific focus on leveraging health information technology to improve clinical outcomes. For example, being able to hire an additional care coordinator who could utilize information technology tools developed through grant funding allows the team to expand the scope of its work and further spread and refine the initiative. Moreover, the community-wide focus will spread awareness of this work beyond Cincinnati Children’s to community-based organizations and others.
While the AIC is just one of many initiatives at Cincinnati Children’s, several key asthma measures are included in Cincinnati Children’s scorecard, whose results are shared institution-wide on a regular basis. In addition, staff have presented on the work of the AIC to Cincinnati Children’s senior leadership through the General Pediatrics Business Unit.
III. Making the Business Case for the Asthma Improvement Collaborative
The primary stakeholders potentially affected financially by the AIC are Cincinnati Children’s and the MCOs with which it contracts. Ohio Medicaid (housed in the Ohio Department of Job and Family Services) is another important stakeholder but is less directly affected, as children on Medicaid in the state are enrolled in an MCO. Ohio Medicaid, however, still stands to benefit if this work helps to control Medicaid costs over time, thus lowering the growth in capitation rates. Below
5 For more information on Cincinnati Children’s own analysis of time between acute episodes, see McCarthy and
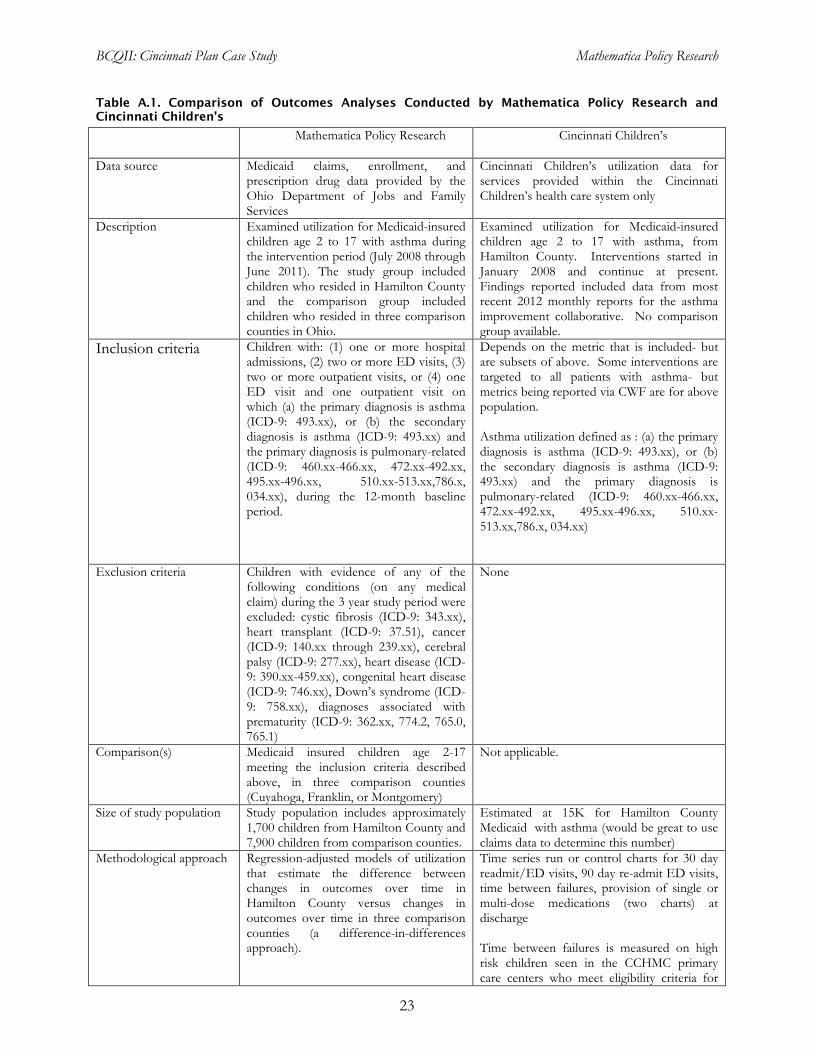
Cohen 2012. For details on the methods used for BCQII and Cincinnati Children’s analyses, see Table A.1 in the appendix at the end of this case study.

BCQII: Cincinnati Plan Case Study Mathematica Policy Research
8
we describe the business case for improving pediatric asthma care for the three primary areas of quality improvement activities, describing them from the perspectives of Cincinnati Children’s and the Medicaid MCOs.
The current payment structure for Medicaid services provides few direct incentives for Cincinnati Children’s to better coordinate or improve the quality of its asthma care. Providing reimbursement for care coordination and restructuring hospital payment toward a value-based approach, for example, are two changes that could have important effects in realigning the payment system toward high-quality care while containing costs.
A. Existing Financial Arrangements and Associated Incentives
Cincinnati Children’s care for children under Medicaid is financed through its contracts with each of the three Medicaid MCOs in Hamilton County. These MCOs are paid by the state on a capitated basis. While the MCOs are capitated, Cincinnati Children’s is paid on an FFS basis for all outpatient services and home visits from all three of these organizations. Similarly, it is paid FFS based on diagnosis-related groups for hospital-based care (see Figure 2, at the end of this document). Despite having few direct incentives to improve quality, Cincinnati Children’s leadership believes this quality improvement work is strongly aligned with the organization’s mission of providing high-quality care to all children. Moreover, as discussed below, there may be important business-related reasons for pursuing these types of initiatives over the longer term.
Hospital quality improvement work. Inpatient asthma care quality improvement work occurs within the context of existing hospital activities. Since this work relies only on existing staff, Cincinnati Children’s has not developed clear estimates of its costs.6 However, staff perceive that even if the direct costs are relatively small, there are also opportunity costs associated with this work—meaning that it has occurred at the expense of other possible initiatives. That said, staff believe this work has the potential to result in positive financial benefits in the form of reductions in wasted medication, reduced refill costs of discarded medication, lower hospital readmission rates, and lower rates of ED visits. Rough estimates by Cincinnati Children’s finance staff suggest that in one year, Cincinnati Children’s relabeling of asthma medication could prevent $31,000 in medications from being thrown out by the hospital, while avoiding redundant costs to third-party payers in the range of $7,000 to $15,000 from filling these medications later. Ensuring that patients leave the hospital with medications in hand also may reduce readmissions, thus potentially reducing third-party payers’ hospital payments as well as Cincinnati Children’s costs (average hospital costs exceed the Medicaid reimbursement Cincinnati Children’s receives).7
Outpatient care coordination. Since Ohio Medicaid does not reimburse Cincinnati Children’s for asthma-related care coordination efforts in its outpatient clinics, the care coordinators’ salaries are funded through grants such as Cincinnati Children’s Patient Innovation Fund and the Beacon
From a financial perspective, reducing readmissions will become even more important in the future if Ohio Medicaid pursues a policy of reduced reimbursement for readmissions for the same condition within 30 days—an approach that is becoming more prevalent among public payers.
6 While the education specialist was hired during the period of BCQII, she was not hired for the AIC work per se. 7 See presentation by Michael Lake, Cincinnati Children’s. “AIC Asthma Business Case Analysis: Re-labeling
Asthma Inpatient Medication.” November 29, 2010. This analysis assumes a 5.7-percentage-point reduction in readmissions.

BCQII: Cincinnati Plan Case Study Mathematica Policy Research
9
Community funding. While this approach works in the short term, the longer-term sustainability of providing care coordinators using this funding approach is in question. That said, Cincinnati Children’s leadership is attentive to recent improvements in measures related to care coordination and appear to recognize and support its potential benefits (that is, Cincinnati Children’s own analysis suggesting an increase in the elapsed time between acute care episodes for pediatric asthma, as measured by the number of days between ED or hospital visits for these patients), which it attributes to the work of the care coordinators. Senior leadership is paying increasing attention to this measure as an indicator of improved quality and perhaps of reduced costs, since the average costs of inpatient services exceed the associated Medicaid revenue.
Even though average costs exceed Medicaid reimbursement for hospital admissions, the revenue nonetheless helps offset fixed costs and contributes financially to the organization (as long as the reimbursement exceeds the marginal cost of an admission). When asthma-related admissions are reduced, Cincinnati Children’s loses revenue; however, it still believes it can forgo this income, because it potentially can replace the lost bed days with other, more lucrative cases—as it is a large tertiary-care setting with high regional volume. Despite Cincinnati Children’s ambitious goals at the start of BCQII to reduce asthma-related hospital and ED visits dramatically, staff now perceive that improving population health outcomes will take longer than anticipated, with the ability to shift admissions substantially to other types of patients following a similarly delayed timeline.
Home health pathway. Home visits are reimbursed on an FFS basis by Medicaid. Cincinnati Children’s staff report that Medicaid reimbursement for these asthma-related home visits do not cover all HHAP costs. Nonetheless, Cincinnati Children’s as an organization appears committed to HHAP, because the home environment plays such an important role in effective asthma management, particularly for high-risk cases. Moreover, other components of the home health program (such as infusion pharmacy) are profitable, and Cincinnati Children’s evaluates financial performance for the program as a whole, not for individual components.
B. Stakeholder Perspectives: Return on Investment
Cincinnati Children’s has pursued its AIC work because, in the words of several staff, it is “the right thing to do.” The organizational culture has long been focused on quality improvement, and staff have begun to focus on its ROI analysis of the AIC work. Several staff described the AIC as allowing Cincinnati Children’s to do enough quality improvement work across settings to begin to “move the needle” in terms of outcomes and costs. Moreover, increased attention to value-based purchasing in the health system writ large (discussed more later) may further strengthen Cincinnati Children’s leadership’s focus on the business case for these types of quality improvement efforts.
MCOs that contract with Cincinnati Children’s did not pay directly for care coordination or quality improvement efforts undertaken by Cincinnati Children’s during the intervention period. That said, over the past few years, Cincinnati Children’s convened periodic meetings with mid-level management at the MCOs to discuss its quality improvement work and associated estimates of ROI. One Cincinnati Children’s physician leader noted that “practically, until now, we haven’t really had enough data to make a case. . . . I think we are in a much better position for this dialogue [given our work on BCQII].” Indeed, a key benefit of managed care over FFS is that plans have a strong incentive to control costs under capitation, and have the flexibility to design provider payment arrangements with incentives for achieving those goals. Due in part to the success of the AIC work, Cincinnati Children’s has been able to negotiate a contract with one Medicaid MCO (among three in

BCQII: Cincinnati Plan Case Study Mathematica Policy Research
10
Southwest Ohio) that includes financial support for care coordination activities and the home health pathway for asthma patients.
IV. Evaluation Findings
To evaluate the AIC quality improvement initiative, we identified Medicaid-insured children with asthma who visited a Cincinnati Children’s outpatient clinic, the ED, or the hospital at any time from July 2007 to June 2010. For a variety of outcome measures, we examined changes over time in Hamilton County relative to changes in three comparison counties (Cuyahoga, Franklin, and Montgomery) via a difference-in-differences analysis. Given Cincinnati Children’s population-based approach to improving pediatric asthma care, and its large reach in serving children (especially those in Medicaid) in Hamilton County, selecting a rigorous comparison group of other Medicaid children within the county was not possible. We therefore compared the utilization of these children to that of children who met the same eligibility criteria in the three comparison counties (the other three most urban counties in Ohio).8
A. Changes in Care Processes Within the Cincinnati Children’s System
In addition to the outcomes analysis, we examined Cincinnati Children’s reported process measures that gauge the progress of AIC implementation. The process measures were available only for Cincinnati Children’s patients, not all children in Hamilton County. Descriptions of the sample selection process, outcome measures, and methods are included in the BCQII Final Report, Chapter II and Appendix A (Andrews et al. 2012).
Cincinnati Children’s tracked a number of inpatient and ambulatory measures during the intervention, and used them internally to monitor progress and, to some extent, modify intervention activities as needed. While the results are qualitatively useful in understanding what effects the intervention potentially may have had on a number of process metrics, these data were available only for the post-intervention period and were not compared to a control or comparison group. Therefore, any observed changes in these measures cannot be attributed solely to intervention activities. Nonetheless, tracking of these measures made program staff more attuned to the goals of the intervention and provided some sense of the potential progress toward meeting them. See the Table A.2 in the appendix to this case study for full results.
Inpatient Process Measures
The two primary areas of focus for the inpatient intervention included making sure children had asthma medications in hand at discharge and getting children connected with case management services. Trends in the process measures associated with these activities suggested notable process improvements in the inpatient setting during the intervention period.
Asthma medications in hand at discharge. In the first month of the intervention period, Cincinnati Children’s reported that less than one quarter (24 percent) of children with asthma were discharged with single-dose asthma medications in hand. In early 2009, when Cincinnati Children’s was able to calculate this measure more reliably, the proportion was 47 percent. While this measure fluctuated somewhat from month to month, the results suggest a general upward trend, with 65 to
8 We also conducted several analyses in which we examined subgroups of these children, such as those with higher
severity asthma.

BCQII: Cincinnati Plan Case Study Mathematica Policy Research
11
70 percent of patients being discharged with single-dose medications by the last quarter of the intervention period (April-June 2011). Similarly, Cincinnati Children’s also tracked the percentage of hospital patients with asthma who were discharged with multi-dose medications. Depending on the month, this measure was 15 to 25 percent in early 2009 (when Cincinnati Children’s obtained better data for calculating this measure’s denominator). As with the single-dose measure, the proportion receiving multi-dose medications increased over time, and by the last quarter of the intervention was between 80 and 90 percent.
Real-time identification to managed care case management. At the start of the intervention in summer 2008, generally 70 to 75 percent of children in Medicaid managed care were actively identified and MCOs were notified in real time of the admission. Through close communication with Medicaid managed care plans, Cincinnati Children’s was able to increase this measure, and the proportion of inpatient admissions for which MCOs were notified remained at 100 percent for the final 1.5 years of the intervention. Cincinnati Children’s staff report that this has allowed patients to leverage benefits available through plan-based case management, such as transportation to office visits or access to durable medical equipment.
Ambulatory Process Measures
Cincinnati Children’s care coordination activities in the clinic setting were intended to provide patient education and assist with self-management, better coordinate care and improve information flow between clinical settings, and connect patients to social services if needed. Cincinnati Children’s tracked several process measures, including the development of written asthma care plans for each patient, coaching on mask and mouthpiece use for asthma medication (among new patients and those who had demonstrated difficulty in the past), and demonstration of good asthma medication mouthpiece and mask use among those receiving coaching.
Written asthma care plan. Cincinnati Children’s tracked the proportion of patients with written care plans for the Hopple and PPC clinics. At Hopple, the proportion of patients with written care plans was about 65 percent at the start of the intervention and increased to about 77 percent by the end of the intervention. At PPC, the proportion was 60 percent at the start and about 65 percent at the end. Staff attributed the differences in results between clinics to the nature of the PPC—namely its large size and the turnover of its clinical staff (many of whom are medical residents)—which made implementation of the intervention somewhat difficult.
Coaching for new learners and performers. This measure tracked the proportion of patients who received coaching, among those who performed poorly on a previous assessment or had never had one performed. While the measure varied considerably from month to month, it started and ended with about 80 percent of patients receiving coaching.
Patients demonstrating good MDI and aerochamber skills. This measure reflected the percentage of children with fewer than two incorrect responses on the mouthpiece or mask assessment, among those who should have received coaching based on assessment. In November 2008 (the first month for which a refined calculation for this measure is available), 27 percent of patients demonstrated good MDI and aerochamber skills. By May 2010 (the last month for which data are available before Cincinnati Children’s changed its electronic medical record platform), 67 percent of patients demonstrated good skills.
BCQII: Cincinnati Plan Case Study Mathematica Policy Research
12
B. Outcome Measures
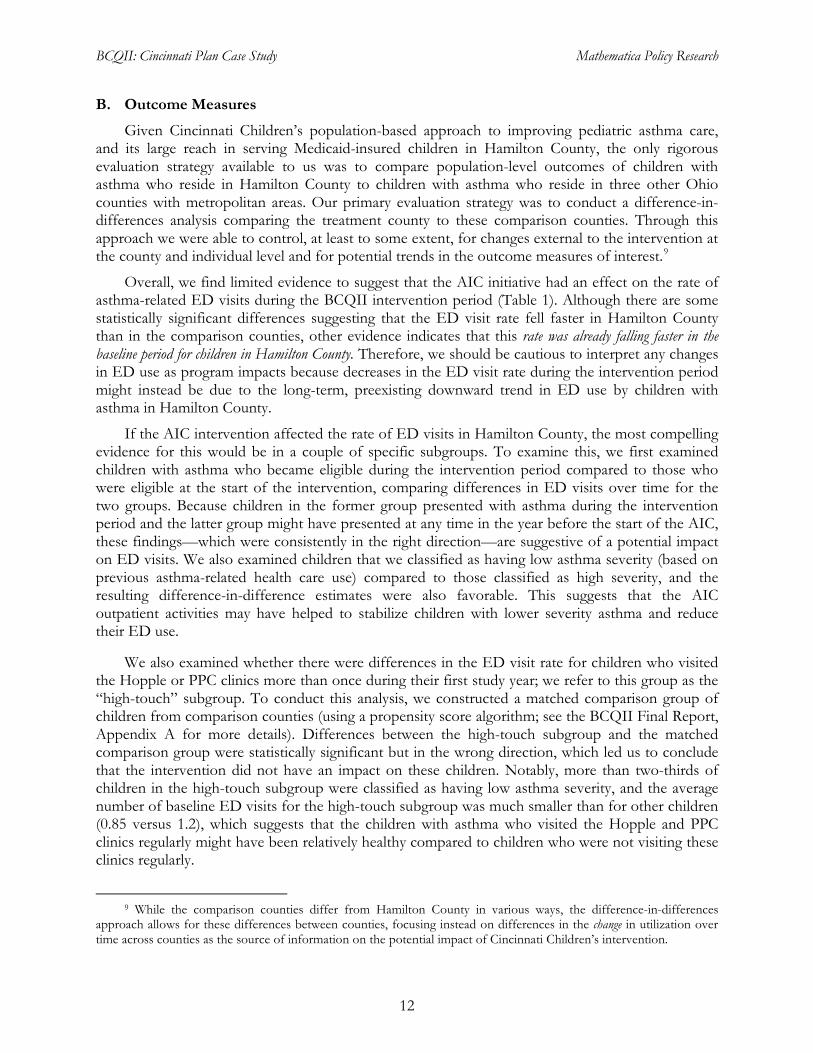
Given Cincinnati Children’s population-based approach to improving pediatric asthma care, and its large reach in serving Medicaid-insured children in Hamilton County, the only rigorous evaluation strategy available to us was to compare population-level outcomes of children with asthma who reside in Hamilton County to children with asthma who reside in three other Ohio counties with metropolitan areas. Our primary evaluation strategy was to conduct a difference-in-differences analysis comparing the treatment county to these comparison counties. Through this approach we were able to control, at least to some extent, for changes external to the intervention at the county and individual level and for potential trends in the outcome measures of interest.9
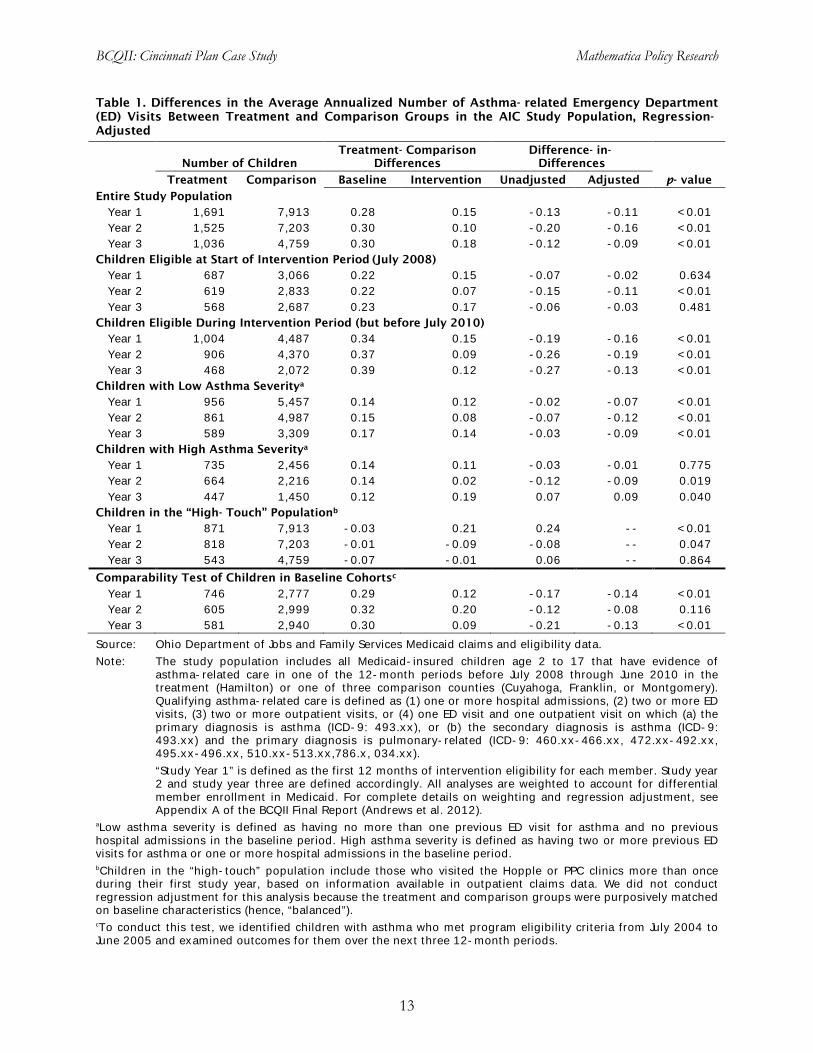
Overall, we find limited evidence to suggest that the AIC initiative had an effect on the rate of asthma-related ED visits during the BCQII intervention period (Table 1). Although there are some statistically significant differences suggesting that the ED visit rate fell faster in Hamilton County than in the comparison counties, other evidence indicates that this rate was already falling faster in the baseline period for children in Hamilton County. Therefore, we should be cautious to interpret any changes in ED use as program impacts because decreases in the ED visit rate during the intervention period might instead be due to the long-term, preexisting downward trend in ED use by children with asthma in Hamilton County.
If the AIC intervention affected the rate of ED visits in Hamilton County, the most compelling evidence for this would be in a couple of specific subgroups. To examine this, we first examined children with asthma who became eligible during the intervention period compared to those who were eligible at the start of the intervention, comparing differences in ED visits over time for the two groups. Because children in the former group presented with asthma during the intervention period and the latter group might have presented at any time in the year before the start of the AIC, these findings—which were consistently in the right direction—are suggestive of a potential impact on ED visits. We also examined children that we classified as having low asthma severity (based on previous asthma-related health care use) compared to those classified as high severity, and the resulting difference-in-difference estimates were also favorable. This suggests that the AIC outpatient activities may have helped to stabilize children with lower severity asthma and reduce their ED use.
We also examined whether there were differences in the ED visit rate for children who visited the Hopple or PPC clinics more than once during their first study year; we refer to this group as the “high-touch” subgroup. To conduct this analysis, we constructed a matched comparison group of children from comparison counties (using a propensity score algorithm; see the BCQII Final Report, Appendix A for more details). Differences between the high-touch subgroup and the matched comparison group were statistically significant but in the wrong direction, which led us to conclude that the intervention did not have an impact on these children. Notably, more than two-thirds of children in the high-touch subgroup were classified as having low asthma severity, and the average number of baseline ED visits for the high-touch subgroup was much smaller than for other children (0.85 versus 1.2), which suggests that the children with asthma who visited the Hopple and PPC clinics regularly might have been relatively healthy compared to children who were not visiting these clinics regularly.
9 While the comparison counties differ from Hamilton County in various ways, the difference-in-differences
approach allows for these differences between counties, focusing instead on differences in the change in utilization over time across counties as the source of information on the potential impact of Cincinnati Children’s intervention.
BCQII: Cincinnati Plan Case Study Mathematica Policy Research
13
Table 1. Differences in the Average Annualized Number of Asthma- related Emergency Department (ED) Visits Between Treatment and Comparison Groups in the AIC Study Population, Regression-Adjusted
Number of Children
Treatment- Comparison Differences
Difference- in-Differences
p- value Treatment Comparison Baseline Intervention Unadjusted Adjusted
Entire Study Population Year 1 1,691 7,913 0.28 0.15 -0.13 -0.11 <0.01 Year 2 1,525 7,203 0.30 0.10 -0.20 -0.16 <0.01 Year 3 1,036 4,759 0.30 0.18 -0.12 -0.09 <0.01
Children Eligible at Start of Intervention Period (July 2008) Year 1 687 3,066 0.22 0.15 -0.07 -0.02 0.634 Year 2 619 2,833 0.22 0.07 -0.15 -0.11 <0.01 Year 3 568 2,687 0.23 0.17 -0.06 -0.03 0.481
Children Eligible During Intervention Period (but before July 2010) Year 1 1,004 4,487 0.34 0.15 -0.19 -0.16 <0.01 Year 2 906 4,370 0.37 0.09 -0.26 -0.19 <0.01 Year 3 468 2,072 0.39 0.12 -0.27 -0.13 <0.01
Children with Low Asthma Severitya Year 1 956 5,457 0.14 0.12 -0.02 -0.07 <0.01 Year 2 861 4,987 0.15 0.08 -0.07 -0.12 <0.01 Year 3 589 3,309 0.17 0.14 -0.03 -0.09 <0.01
Children with High Asthma Severitya Year 1 735 2,456 0.14 0.11 -0.03 -0.01 0.775 Year 2 664 2,216 0.14 0.02 -0.12 -0.09 0.019 Year 3 447 1,450 0.12 0.19 0.07 0.09 0.040
Children in the “High- Touch” Populationb Year 1 871 7,913 -0.03 0.21 0.24 -- <0.01 Year 2 818 7,203 -0.01 -0.09 -0.08 -- 0.047 Year 3 543 4,759 -0.07 -0.01 0.06 -- 0.864
Comparability Test of Children in Baseline Cohortsc Year 1 746 2,777 0.29 0.12 -0.17 -0.14 <0.01 Year 2 605 2,999 0.32 0.20 -0.12 -0.08 0.116 Year 3 581 2,940 0.30 0.09 -0.21 -0.13 <0.01
Source: Ohio Department of Jobs and Family Services Medicaid claims and eligibility data. Note: The study population includes all Medicaid-insured children age 2 to 17 that have evidence of
asthma-related care in one of the 12-month periods before July 2008 through June 2010 in the treatment (Hamilton) or one of three comparison counties (Cuyahoga, Franklin, or Montgomery). Qualifying asthma-related care is defined as (1) one or more hospital admissions, (2) two or more ED visits, (3) two or more outpatient visits, or (4) one ED visit and one outpatient visit on which (a) the primary diagnosis is asthma (ICD-9: 493.xx), or (b) the secondary diagnosis is asthma (ICD-9: 493.xx) and the primary diagnosis is pulmonary-related (ICD-9: 460.xx-466.xx, 472.xx-492.xx, 495.xx-496.xx, 510.xx-513.xx,786.x, 034.xx).
“Study Year 1” is defined as the first 12 months of intervention eligibility for each member. Study year 2 and study year three are defined accordingly. All analyses are weighted to account for differential member enrollment in Medicaid. For complete details on weighting and regression adjustment, see Appendix A of the BCQII Final Report (Andrews et al. 2012).
aLow asthma severity is defined as having no more than one previous ED visit for asthma and no previous hospital admissions in the baseline period. High asthma severity is defined as having two or more previous ED visits for asthma or one or more hospital admissions in the baseline period. bChildren in the “high-touch” population include those who visited the Hopple or PPC clinics more than once during their first study year, based on information available in outpatient claims data. We did not conduct regression adjustment for this analysis because the treatment and comparison groups were purposively matched on baseline characteristics (hence, “balanced”). cTo conduct this test, we identified children with asthma who met program eligibility criteria from July 2004 to June 2005 and examined outcomes for them over the next three 12-month periods.

BCQII: Cincinnati Plan Case Study Mathematica Policy Research
14
In addition to examining ED use, we also examined impacts on asthma medication use, outpatient use, and hospital admissions. Children in Hamilton County were more likely to have both rescue medications and controller medications filled (any fill and number of fills), relative to those in comparison counties during the intervention period (Table 2). There were also some small but statistically significant effects on the average number of outpatient visits for asthma, with the number of visits decreasing in the second and third years of the intervention relative to the comparison group (Table 3). The intervention had no impact on hospital use, and we were unable to estimate regression-adjusted effects of hospital readmissions for the small number of patients with readmissions.
Table 2. Differences in Asthma Medication Use Between Treatment and Comparison Groups in the AIC Study Population, Regression- Adjusted
Number of Children Treatment- Comparison
Differences Difference-
in-Differences p- value Treatment Comparison Baseline Intervention
Proportion with Any Controller Medication Fill Year 1 1,691 7,913 0.19 2.61 2.42 0.102 Year 2 1,525 7,203 0.16 6.03 5.88 <0.01 Year 3 1,036 4,759 -1.42 6.98 8.40 <0.01
Average Number of Controller Medication Fills Year 1 687 3,066 -0.15 0.10 0.24 0.187 Year 2 619 2,833 -0.17 0.26 0.42 0.02 Year 3 568 2,687 -0.49 0.61 1.11 <0.01
Proportion with Any Rescue Medication Fill Year 1 1,004 4,487 0.46 3.83 3.37 <0.01 Year 2 906 4,370 0.66 4.53 3.88 <0.01 Year 3 468 2,072 0.64 6.69 6.05 <0.01
Average Number of Rescue Medication Fills Year 1 956 5,457 0.10 0.30 0.20 0.10 Year 2 861 4,987 0.11 0.44 0.33 <0.01 Year 3 589 3,309 0.09 0.61 0.52 <0.01
Source: Ohio Department of Jobs and Family Services Medicaid claims and eligibility data. Note: The study population includes all Medicaid-insured children age 2 to 17 that have evidence of
asthma-related care in one of the 12-month periods before July 2008 through June 2010 in the treatment (Hamilton) or one of three comparison counties (Cuyahoga, Franklin, or Montgomery). Qualifying asthma-related care is defined as (1) one or more hospital admissions, (2) two or more ED visits, (3) two or more outpatient visits, or (4) one ED visit and one outpatient visit on which (a) the primary diagnosis is asthma (ICD-9: 493.xx), or (b) the secondary diagnosis is asthma (ICD-9: 493.xx) and the primary diagnosis is pulmonary-related (ICD-9: 460.xx-466.xx, 472.xx-492.xx, 495.xx-496.xx, 510.xx-513.xx,786.x, 034.xx).
“Study Year 1” is defined as the first 12 months of intervention eligibility for each member. Study year 2 and study year three are defined accordingly. All analyses are weighted to account for differential member enrollment in Medicaid. For complete details on weighting and regression adjustment, see Appendix A of the BCQII Final Report (Andrews et al. 2012).
Controller medications include inhaled corticosteroids, leukotriene inhibitors, long-acting bronchodilators, and mast-cell stabilizers. Rescue medications include short-acting beta agonists and noninhaled corticosteroids.

BCQII: Cincinnati Plan Case Study Mathematica Policy Research
15
Table 3. Differences in Outpatient Use Between Treatment and Comparison Groups in the AIC Study Population, Regression- Adjusted
Treatment- Comparison Differences
Difference-in-
Differences p- value Baseline Intervention Year 1
Number of children 1,691 7,913 Proportion with any visit 0.07 -0.45 -0.52 0.081 Average number of any visits 0.41 -0.01 -0.41 0.581 Proportion with an asthma-related visit 1.28 3.45 2.17 0.019 Average number of asthma-related visits 0.51 0.40 -0.11 0.764
Year 2 Number of children 1,525 7,203 Proportion with any visit 0.04 -0.47 -0.52 0.163 Average number of any visits 0.30 -0.14 -0.42 0.569 Proportion with an asthma-related visit 1.22 -0.04 -1.26 0.239 Average number of asthma-related visits 0.55 -0.11 -0.45 <0.01
Year 3 Number of children 1,036 4,759 Proportion with any visit 0.06 -1.40 -1.45 0.017 Average number of any visits 0.05 -0.15 -0.19 0.742 Proportion with an asthma-related visit 1.17 -0.29 -1.45 0.247 Average number of asthma-related visits 0.64 -0.04 -0.37 <0.01
Source: Ohio Department of Jobs and Family Services Medicaid claims and eligibility data. Note: The study population includes all Medicaid-insured children age 2 to 17 that have evidence of
asthma-related care in one of the 12-month periods before July 2008 through June 2010 in the treatment (Hamilton) or one of three comparison counties (Cuyahoga, Franklin, or Montgomery). Qualifying asthma-related care is defined as (1) one or more hospital admissions, (2) two or more ED visits, (3) two or more outpatient visits, or (4) one ED visit and one outpatient visit on which (a) the primary diagnosis is asthma (ICD-9: 493.xx), or (b) the secondary diagnosis is asthma (ICD-9: 493.xx) and the primary diagnosis is pulmonary-related (ICD-9: 460.xx-466.xx, 472.xx-492.xx, 495.xx-496.xx, 510.xx-513.xx,786.x, 034.xx). “Study Year 1” is defined as the first 12 months of intervention eligibility for each member. Study year 2 and study year three are defined accordingly. All analyses are weighted to account for differential member enrollment in Medicaid. For complete details on weighting and regression adjustment, see Appendix A of the BCQII Final Report (Andrews et al. 2012).
C. Return on Investment
For the Cincinnati Children’s ROI analysis, we estimated three different scenarios (worst-case, most likely, and best-case) because there was little to no reimbursement to Cincinnati Children’s for intervention activities during the implementation period. Estimating the ROI under different assumptions allowed us to simulate potential ROI scenarios for those who might implement similar initiatives. The assumptions underlying each scenario vary based on (1) the reimbursement that Cincinnati Children’s received or could have received for AIC activities, and (2) estimated patient substitution effects. (See Table 4.) For example, in the most likely scenario, we assumed reimbursement for home health visits at four visits per child monitored by a care coordinator and that any reductions in asthma inpatient admissions (relative to the comparison group) were replaced

BCQII: Cincinnati Plan Case Study Mathematica Policy Research
16
with Medicaid-covered, general pediatric patients.10
In the worst case scenario we assumed fewer visits per child for home health services and no revenue replacement for reduced inpatient utilization. The best case scenario represents our best guess at potential reimbursement for the intervention and includes 5 home health visits per child and reimbursement in the second and third years for care coordination services (the two years in which those services were offered). Calculation of utilization-related gains and/or losses, grant funding, investment, and operating costs remain unchanged across scenarios. Nonetheless, the scenarios differ considerably in potential revenues, and offer different perspectives on potential ROI.
Table 4. Assumptions for Cincinnati Children’s Return on Investment Scenarios
Scenario
Factors Most Likely Best Case Worst Case
Potential reimbursement
Equal to reimbursement for home health visits (assuming 4 visits per child).
Equal to reimbursement for home health visits (assuming 5 visits per child) and care coordination services in the second and third intervention years (assuming a monthly caseload of 100 per coordinator).
Equal to reimbursement for home health visits (assuming 3 visits per child).
Patient substitution effects
Reduced asthma inpatient admissions are replaced with Medicaid-covered, general pediatrics patients.
Reduced asthma inpatient admissions are replaced with commercially insured hematology patients.
Reduced asthma inpatient admissions are not replaced with other patients.
Under all scenarios, the net present value of the AIC intervention was negative and the ROI
was less than 1, indicating that the AIC recouped less than $1 for every dollar invested (Table 5). The primary driver of this result was that the intervention was relatively expensive to implement at approximately $1.2 million (discounted at a 3 percent rate) over the three-year intervention period, as reported by Cincinnati Children’s. Among other things, these costs included salaries for the lead research team, administrative support, data analysts, and salaries for the care coordinators. Under the best case scenario, potential reimbursement for some of its intervention activities (including estimated reimbursement for home health visits, which Medicaid reimburses on a fee-for-service basis, and estimated potential reimbursement for care coordination services, which are not currently reimbursed by Medicaid), non-BCQII grant funding, and financial gains related to utilization savings and patient substitution effects all helped to offset the costs of implementing the intervention, but not enough to break even financially.11
10 Substituting visits by children with asthma with general pediatric patients was only one option available.
Assuming substitution with higher (or lower) margin visits would result in higher (lower) discounted revenue overall but not enough to materially affect the results.
11 Cincinnati Children’s did not receive reimbursement for care coordination services during the BCQII intervention period. Hence, the best case scenario represents only the potential ROI that the AIC could have achieved and does not reflect actual ROI for the intervention.

BCQII: Cincinnati Plan Case Study Mathematica Policy Research
17
Table 5. Return on Investment for the Cincinnati Children’s AIC Intervention Scenario
Worst Case Most Likely Best Case
Estimated Potential Reimbursement 13,933 27,866 269,372 Grant Fundingb 430,732 430,732 430,732 Utilization-Related Gains (Losses)c (103,980) (103,980) (103,980) Patient Substitution Effectsd -- 87,232 322,968 Total discounted revenue 340,686 441,850 919,093 Investment Costs 259,911 259,911 259,911 Operating Costs 930,117 930,117 930,117 Total Discounted Intervention Costs 1,190,029 1,190,029 1,190,029 Net Present Value $(849,343) $(748,179) $(270,936) Cost-Benefit Ratio 0.29 0.37 0.77
Sources: Ohio Department of Jobs and Family Services Medicaid claims and enrollment data and Cincinnati Children’s
financial data. Note: We assumed a 3 percent discount rate. aIncludes estimated Medicaid reimbursement for home health visits, and estimated potential reimbursement for care coordination services (which are not currently reimbursed, but could be in the future) provided as part of the AIC intervention. We calculated reimbursement assuming a $100 per-visit reimbursement for home health visits and a $100 PMPM reimbursement for care coordination services. Number of visits/ services provided vary across the three scenarios. bIncludes funding from Cincinnati Children’s Patient Innovations Fund and Beacon Grant. BCQII Grant funding is excluded. cUtilization-related gains and/or losses are computed using actual number of admissions calculated by the evaluation team. Incremental reductions in admissions are assumed if there is a reduction in the number of admissions in the treatment group (intervention year - baseline year) that exceeds the reduction in admissions in the comparison group (intervention year - baseline year), which was the case in the second year of the intervention. Incremental increases in admissions in the treatment group (which occurred in the first and third years) are not included in the analysis as the logic of the intervention was to reduce, not increase, hospital admissions. All scenarios assume that direct (variable), but not indirect (fixed), costs are eliminated when inpatient admissions are reduced, and that direct costs equate to 53 percent to 63 percent of the average cost of an inpatient visit for Medicaid-insured children with asthma, as reported by Cincinnati Children’s. dPatient substitution effects are estimated as the gain or loss to Cincinnati Children’s if reduced asthma admissions are replaced with other types of non-asthma-related admissions. We estimated such effects only for the second intervention year because the rate of hospitalization was smaller during that year in the treatment group compared to the comparison group. We assumed that 75 percent of freed-up capacity would be used by other patients. In the most likely scenario we assumed capacity would be used by general pediatric patients and in the best case scenario, we assumed that capacity would b used by higher-margin patients (hematology). Data on visit margins were obtained from Cincinnati Children’s. All scenarios estimate the gain or loss using contribution margin per admission [average revenue per admission less average direct (variable) cost per admission] rather than total margin [average revenue per admission less total average cost per admission]. V. Limitations
While the evaluation findings presented here represent a relatively rigorous difference-in-difference analysis that included a number of sensitivity checks, these findings are limited by the methods used. Specifically, a more rigorous approach of a randomized controlled design was not possible for this analysis. Moreover, while the core analysis was population-based (that is, comparing utilization trends for Hamilton County relevant to three other comparison counties), the use of claims data for tracking utilization among Medicaid-insured children with asthma undoubtedly eliminates some number of “healthier” children with asthma (e.g., those who do not have any hospital admissions or ED visits for asthma, and in the ambulatory setting, is seen for well child care and asthma but does not present with asthma exacerbation or asthma-specific visits). In addition, the analysis hinges on the difference-in-difference approach, and if factors other than the intervention differentially affected Hamilton County children over time (who are seen at a large pediatric center) relative to children from comparison counties (who may not have been seen at a

BCQII: Cincinnati Plan Case Study Mathematica Policy Research
18
large pediatric center), this could affect our estimates of program impact. Similarly, if data completeness in Medicaid claims varies by county over time for any reason, this could affect our impact estimates. Finally, the calculation of return on investment required us to make various assumptions regarding reimbursement for intervention activities, substitution of patients in the inpatient setting, and financial margins associated with various types of patients. Thus, our estimates should be interpreted as providing a plausible range for ROI rather than a definitive estimate.
VI. Implications for the Business Case in Medicaid
The AIC initiative is a strong example of changing health care delivery in multiple settings. While Cincinnati Children’s experienced some challenges in engaging the MCOs to work with it to improve patient care and realign incentives, Cincinnati Children’s staff from a variety of settings and levels recognize the rapidly changing policy environment at the national level and the general movement of health care toward accountability for costs and quality. In the words of one finance executive, “Caring for patients in a comprehensive and cost-effective way is where things are headed.” Although Cincinnati Children’s currently bears little or no risk for the Medicaid patients it serves, many noted that an initiative such as BCQII drives the organization to continue to improve quality outcomes while controlling or even reducing costs. As one Cincinnati Children’s physician leader noted: “All the talk now around accountable care organizations and capitated payments is pushing this discussion.”
Although the AIC did not have an effect on the rate of ED visits or hospitalizations, it made strides at improving processes of care and some intermediate outcome measures that demonstrate promise for the future. Findings from the AIC evaluation hold lessons for organizations that might consider similar quality improvement initiatives, as follows.
Lessons on Achieving a Positive ROI Findings from the AIC intervention suggest that targeting high-risk patients makes it more likely that an intervention might achieve its objectives on quality outcomes and show a positive ROI. Among children in the study population, only about a third of all children who visited Cincinnati Children’s primary care clinics were classified as high-risk (defined as having a previous asthma-related hospitalization or two or more ED visits) and only about 9 percent of all children classified as high-risk also visited the primary care clinics. If Cincinnati Children’s had been able to engage a greater proportion of high-risk children in the clinic setting where care coordination activities were most prominent, it might have been able to have an impact on quality outcomes such as ED visits, which would have increased the potential for achieving a positive ROI.
Lessons on Implementing Quality Improvement Initiatives
Cincinnati Children’s demonstrated that engaging providers is a key factor for a successful implementation. Cincinnati Children’s staff did so actively throughout different health care settings to implement the various components of the AIC initiative. Moreover, a key element of the initiative included not only its multifaceted approach to improving quality across the continuum of care, but also its focus on communicating and collaborating across settings. It is likely that the AIC would not have had success at improving its processes of care, such as the proportion of children with medication in hand at discharge and children whose asthma management skills have improved, without commitment and engagement from providers in all settings.
BCQII: Cincinnati Plan Case Study Mathematica Policy Research
19
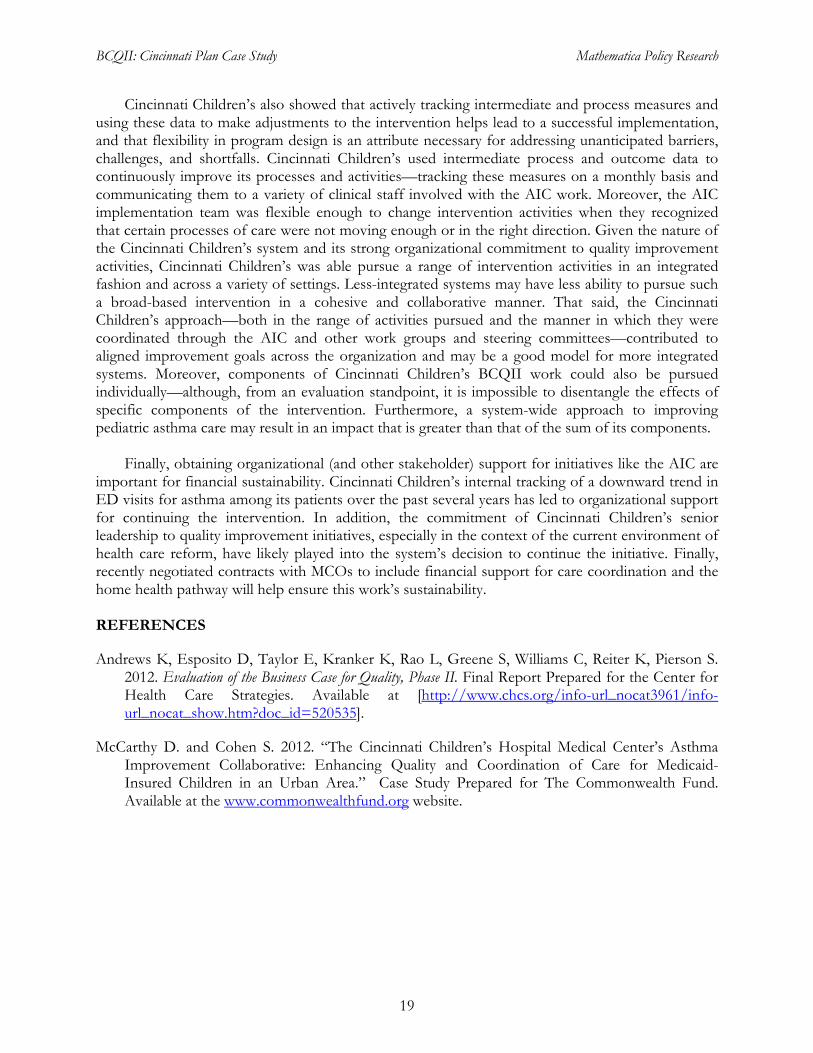
Cincinnati Children’s also showed that actively tracking intermediate and process measures and using these data to make adjustments to the intervention helps lead to a successful implementation, and that flexibility in program design is an attribute necessary for addressing unanticipated barriers, challenges, and shortfalls. Cincinnati Children’s used intermediate process and outcome data to continuously improve its processes and activities—tracking these measures on a monthly basis and communicating them to a variety of clinical staff involved with the AIC work. Moreover, the AIC implementation team was flexible enough to change intervention activities when they recognized that certain processes of care were not moving enough or in the right direction. Given the nature of the Cincinnati Children’s system and its strong organizational commitment to quality improvement activities, Cincinnati Children’s was able pursue a range of intervention activities in an integrated fashion and across a variety of settings. Less-integrated systems may have less ability to pursue such a broad-based intervention in a cohesive and collaborative manner. That said, the Cincinnati Children’s approach—both in the range of activities pursued and the manner in which they were coordinated through the AIC and other work groups and steering committees—contributed to aligned improvement goals across the organization and may be a good model for more integrated systems. Moreover, components of Cincinnati Children’s BCQII work could also be pursued individually—although, from an evaluation standpoint, it is impossible to disentangle the effects of specific components of the intervention. Furthermore, a system-wide approach to improving pediatric asthma care may result in an impact that is greater than that of the sum of its components.
Finally, obtaining organizational (and other stakeholder) support for initiatives like the AIC are
important for financial sustainability. Cincinnati Children’s internal tracking of a downward trend in ED visits for asthma among its patients over the past several years has led to organizational support for continuing the intervention. In addition, the commitment of Cincinnati Children’s senior leadership to quality improvement initiatives, especially in the context of the current environment of health care reform, have likely played into the system’s decision to continue the initiative. Finally, recently negotiated contracts with MCOs to include financial support for care coordination and the home health pathway will help ensure this work’s sustainability.
REFERENCES
Andrews K, Esposito D, Taylor E, Kranker K, Rao L, Greene S, Williams C, Reiter K, Pierson S. 2012. Evaluation of the Business Case for Quality, Phase II. Final Report Prepared for the Center for Health Care Strategies. Available at [http://www.chcs.org/info-url_nocat3961/info-url_nocat_show.htm?doc_id=520535].
McCarthy D. and Cohen S. 2012. “The Cincinnati Children’s Hospital Medical Center’s Asthma Improvement Collaborative: Enhancing Quality and Coordination of Care for Medicaid-Insured Children in an Urban Area.” Case Study Prepared for The Commonwealth Fund. Available at the www.commonwealthfund.org website.
BCQII: Cincinnati Plan Case Study Mathematica Policy Research
20
Figure 1. Logic Model for Cincinnati Children’s Hospital Medical Center Asthma Improvement Collaborative
PATIENT EDUCATION AND SELF MGMT
HOME VISITING
Cincinnati Children’s serves a large proportion of Medicaid children in Hamilton County, for whom asthma is prevalent
Cincinnati Children’s has pursued several asthma quality improvement activities recently
Asthma QI approach is population-based and multifaceted
Medicaid managed care plans have incentive to promote various activities that improve quality of asthma care
Care managers, nurses, respiratory therapists, medical assistants, pharmacists, care coordinators, MDs, and visiting nurses provide various intervention activities
Identify children with asthma in inpatient and clinic settings
Provide care management in both settings
Modify pharmacy discharge process in hospital setting
Train nurses to coach and educate on the proper use of inhalers and spacers (employing a checklist)
RN conducts risk and readiness assessments; conducts patient education; communicates with patient’s health care providers; links patient and family to existing social services and resources
Fax inpatient visit summary to managed care plan; arrange for follow up appointment
Create asthma care plans
Improve health system navigability for patients via care coordinator (who promotes communication and coordination among all providers treating child)
Increase proportion of patients: − With asthma
care plan − Able to
verbalize care plan
− Able to differentiate controller and rescue meds
− Discharged from hospital with meds
− Seen for follow-up within 7 days of discharge Staff assess patient
skill and educate and coach parents on children on rescue and controller meds
Reduce physical, social, and economic barriers to improving asthma care
Reinforces asthma education received by others in the health system
Reduce ED use, inpatient use, readmissions
Increase appropriate use of controller and rescue medications
Improve:
− Coordination of care across settings
− Patient knowledge of how to use medication
− Patient/family satisfaction with care
− Caregiver’s skills and knowledge of asthma
Increase patient engagement in care
Improve quality of care
Improve patients’ health status and quality of life
Lower health care costs
Confounders: Staff availability, capacity, resources, seasonal factors (e.g., flu season), etc.
INPUTS ACTIVITIES OUTPUTS SHORT-TERM OUTCOMES
LONG-TERM OUTCOMES AND IMPACTS

BCQII: Cincinnati Plan Case Study Mathematica Policy Research
21
Figure 2. Flow of Dollars into Cincinnati Children’s for Pediatric Asthma Services
Outpatient clinics (PPC, Hopple, and Fairfield) • Pediatricians and other
primary care clinicians • Specialists • Care coordinators
Hospital
• Physician • RNs • Respiratory therapists • Education specialist • Inpatient pharmacy
Ohio State Medicaid
MCOs are paid a capitated amount per beneficiary
Purchaser
Payment based on DRGs with risk
adjustment
FFS payment for home visits (up to a certain number of visits) FFS payment for all
outpatient services
Home health
• RNs who conduct home visits
• Asthma resource RNs
Cincinnati Children’s Hospital Medical Center
Medicaid managed care organizations • CareSource (~64% of MMC market, as of 11/2010) • Amerigroup (~23% of MMC market) • Molina (~13 % of MMC market)
Insurers/payers

APPENDIX
BCQII: Cincinnati Plan Case Study Mathematica Policy Research
23
Table A.1. Comparison of Outcomes Analyses Conducted by Mathematica Policy Research and Cincinnati Children’s
Mathematica Policy Research Cincinnati Children’s
Data source Medicaid claims, enrollment, and prescription drug data provided by the Ohio Department of Jobs and Family Services
Cincinnati Children’s utilization data for services provided within the Cincinnati Children’s health care system only
Description Examined utilization for Medicaid-insured children age 2 to 17 with asthma during the intervention period (July 2008 through June 2011). The study group included children who resided in Hamilton County and the comparison group included children who resided in three comparison counties in Ohio.
Examined utilization for Medicaid-insured children age 2 to 17 with asthma, from Hamilton County. Interventions started in January 2008 and continue at present. Findings reported included data from most recent 2012 monthly reports for the asthma improvement collaborative. No comparison group available.
Inclusion criteria Children with: (1) one or more hospital admissions, (2) two or more ED visits, (3) two or more outpatient visits, or (4) one ED visit and one outpatient visit on which (a) the primary diagnosis is asthma (ICD-9: 493.xx), or (b) the secondary diagnosis is asthma (ICD-9: 493.xx) and the primary diagnosis is pulmonary-related (ICD-9: 460.xx-466.xx, 472.xx-492.xx, 495.xx-496.xx, 510.xx-513.xx,786.x, 034.xx), during the 12-month baseline period.
Depends on the metric that is included- but are subsets of above. Some interventions are targeted to all patients with asthma- but metrics being reported via CWF are for above population. Asthma utilization defined as : (a) the primary diagnosis is asthma (ICD-9: 493.xx), or (b) the secondary diagnosis is asthma (ICD-9: 493.xx) and the primary diagnosis is pulmonary-related (ICD-9: 460.xx-466.xx, 472.xx-492.xx, 495.xx-496.xx, 510.xx-513.xx,786.x, 034.xx)
Exclusion criteria Children with evidence of any of the following conditions (on any medical claim) during the 3 year study period were excluded: cystic fibrosis (ICD-9: 343.xx), heart transplant (ICD-9: 37.51), cancer (ICD-9: 140.xx through 239.xx), cerebral palsy (ICD-9: 277.xx), heart disease (ICD-9: 390.xx-459.xx), congenital heart disease (ICD-9: 746.xx), Down’s syndrome (ICD-9: 758.xx), diagnoses associated with prematurity (ICD-9: 362.xx, 774.2, 765.0, 765.1)
None
Comparison(s) Medicaid insured children age 2-17 meeting the inclusion criteria described above, in three comparison counties (Cuyahoga, Franklin, or Montgomery)
Not applicable.
Size of study population Study population includes approximately 1,700 children from Hamilton County and 7,900 children from comparison counties.
Estimated at 15K for Hamilton County Medicaid with asthma (would be great to use claims data to determine this number)
Methodological approach Regression-adjusted models of utilization that estimate the difference between changes in outcomes over time in Hamilton County versus changes in outcomes over time in three comparison counties (a difference-in-differences approach).
Time series run or control charts for 30 day readmit/ED visits, 90 day re-admit ED visits, time between failures, provision of single or multi-dose medications (two charts) at discharge
Time between failures is measured on high risk children seen in the CCHMC primary care centers who meet eligibility criteria for

BCQII: Cincinnati Plan Case Study Mathematica Policy Research
24
care coordination
Focus of analyses Examined differences-in-differences for each sample member’s first, second, and third “study” years, defined as the first, second, and third 12-month periods eligible for the intervention. Outcomes included:
Average annualized hospitalizations and emergency department visits (also proportion with any visits) for any reason and for asthma
Outpatient visits (proportion and average number) for any reason and for asthma
Controller and rescue medication use(proportion with any fill and average number of fills)
30 and 90 day readmissions/ED visits among those with an index admission to CCHMC ( approximately 550 admits/year- 543 in 2008, 498 in 2009, 597 in 2010, and 591 in 2011) Numbers are for Hamilton County Medicaid ages 2-17
Time to failure (ED or hospital visit), among patients seeing care coordinator in outpatient setting – 217 patients ever enrolled)
Single dose medications and multi-dose medications) in-hand at discharge. ( admitted patients- N’s above)
Subgroup analyses Three subgroup analyses
1. High touch. Focused on children who visited the Hopple or PPC clinics more than once during their first study year. Outcomes for this subgroup were compared to outcomes for a matched comparison group (based on propensity score analysis).
2. Asthma severity. Focused on children with either “high” asthma severity (defined as having two or more previous ED visits for asthma or one or more hospital admissions) or “low” asthma severity (defined as having no more than one previous ED visit for asthma and no previous hospital admissions).
3. Date of Eligibility. Separate outcomes analysis of children eligible at the start of intervention (before July 2008) and children who became eligible during intervention period (but before 2010).
Not applicable

BCQII: Cincinnati Plan Case Study Mathematica Policy Research
25
Table A.2. Cincinnati Children’s: Process Measures for Treatment Group Children at Intervention Start and Finish
Measure Start of
Interventiona End of
Interventionb Approximate
Percentage Change
Inpatient Measures
Single-dose asthma medications in hand at discharge
47%
(January 2009)
70%
(July 2011) 49.6%
Multi-dose asthma medications in hand at discharge
24%
(January 2009)
80%
(July 2011) 229.2%
Real-time identification of patient to managed care case management
75%
(July 2008)
100%
(July 2011) 33.3%
Ambulatory Care Measures
Asthma written care plan – Hopple 65%
(July 2008)
77%
(July 2011) 19.0%
Asthma written care plan – PPC 60%
(July 2008)
65%
(July 2011) 8.7%
Targeting new learners and performers 78%
(November 2008)
79%
(May 2011) 1.2%
Children with good MDI and aerochamber skills
27%
(November 2008)
67%
(May 2011) 146.7%
Source: Cincinnati Children’s process measure data. aDate when measure is first available is noted parenthetically. bDate when measure is last available is noted parenthetically. C By July 2011, discharge summaries were reliably sent to MCOs via EPIC EMR. However, what is reported is percent of time MCO staff documented to CCHMC that they received the summary. Despite multiple PDSA cycles, the team was unable to achieve a reliable process on the MCO receiving end for ensuring discharge summary reached personnel doing care management/data tracking.

www.mathematica-mpr.com
Improving public well-being by conducting high-quality, objective research and surveys
Princeton, NJ ■ Ann Arbor, MI ■ Cambridge, MA ■ Chicago, IL ■ Oakland, CA ■ Washington, DC
Mathematica® is a registered trademark of Mathematica Policy Research