Evaluation of the Bright Start Demonstration - DSHS
76
ECONOMICS • FINANCE • PLANNING Evaluation of the Bright Start Demonstration State of Washington Department of Social and Health Services 888 SW Fifth Avenue Suite 1460 Portland, Oregon 97204 503-222-6060 www.econw.com September 2008 3130 Fairview Park Drive Falls Church, VA 22042 703-269-5528 Copyright 2008 ECONorthwest
Transcript of Evaluation of the Bright Start Demonstration - DSHS

ECONOMICS • FINANCE • PLANNING
Evaluation of the Bright Start Demonstration
State of Washington Department of Social and Health Services
888 SW Fifth Avenue
Suite 1460
Portland, Oregon 97204
503-222-6060www.econw.com
September 2008
3130 Fairview Park Drive Falls Church, VA 22042
703-269-5528
Copyright 2008 ECONorthwest


Table of Contents
Executive Summary ......................................................................................................... i Introduction ..........................................................................................................................................i Bright Start’s interventions..................................................................................................................i Findings .............................................................................................................................................. ii Lessons learned................................................................................................................................ iii Management recommendations........................................................................................................v
Chapter 1 Introduction .................................................................................................1-1 Background on Bright Start............................................................................................................ 1-1 Planned interventions .................................................................................................................... 1-2 Organization of the report .............................................................................................................. 1-4
Chapter 2 Determinants of In-Hospital Paternity Establishment Rates.........................2-1 Introduction ..................................................................................................................................... 2-1 Variation in hospital-based paternity establishment..................................................................... 2-2 Differences in demographics ......................................................................................................... 2-4 Regression analysis .....................................................................................................................2-14 Establishing performance benchmarks.......................................................................................2-15
Chapter 3 Impact of Efforts to Improve In-Hospital Paternity Establishment Programs 3-1 Background..................................................................................................................................... 3-1 Impacts on in-hospital paternity establishment ............................................................................ 3-2
Chapter 4 Feasibility and Efficacy of Expanded Services ............................................4-1 Background..................................................................................................................................... 4-1 Genetic testing................................................................................................................................ 4-2 Parenting plans .............................................................................................................................. 4-8 Marriage education ......................................................................................................................4-12 Conclusion.................................................................................................................................... 4-13
Chapter 5 Findings, Lessons Learned and Recommendations .....................................5-1 Bright Start’s findings ..................................................................................................................... 5-1 Lessons learned............................................................................................................................. 5-2 Management recommendations.................................................................................................... 5-5
Appendix Actual and Benchmark Performance at Bright Start Hospitals..................... A-1 Error! Bookmark not defined.

2008 Bright Start Evaluation ECONorthwest/Lewin September 2008 Page i
Executive Summary
INTRODUCTION In mid-2005, the federal Office of Child Support Enforcement (OCSE)
awarded Washington State’s Division of Child Support (DCS) a Section 1115(a) demonstration grant to implement and rigorously evaluate enhancements to its pioneering work in voluntary paternity establishment. The demonstration project—called Bright Start— sought to demonstrate that a renewed and reinvigorated relationship with hospital staff could measurably improve rates of in-hospital paternity establishment. The project also sought to test the feasibility and demand for three complementary services that could be offered during a hospital stay: genetic testing, parenting plans, and marriage education. Broadly speaking, the demonstration accomplished these goals and, in doing so, exposed a number of important issues for DCS management to consider as the demonstration comes to a conclusion. This report serves as an evaluation of the demonstration at the conclusion of the traditional three-year funding cycle for an 1115(a) grant.
BRIGHT START’S INTERVENTIONS The Bright Start Program sought to strengthen paternity establishment
and reduce adversarial actions between parents through two informal strategies:
Strategy 1: Strengthen delivery of the existing voluntary paternity establishment program. The range in voluntary paternity establishment rates across DCS field offices strongly suggested great variation in program implementation at birthing hospitals and in the approach of DCS field office staff to encouraging success at the hospital-based programs. To reduce barriers to voluntary establishment, DCS redoubled its in-hospital efforts in the four DCS catchment areas comprising the demonstration region: Fife, Tacoma, Vancouver, and Yakima. In 16 demonstration hospitals, DCS:
• Reintroduced the paternity establishment program to hospital staff,
• Recruited and paid for the training of additional hospital-based notaries,
• Targeted recruitment of hospital-based social workers to collaborate in the establishment efforts
and
Page ii September 2008 ECONorthwest/Lewin Group 2008 Bright Start Evaluation
• Revamped DCS’s paternity establishment video and information booklet outlining new services
Strategy 2: Expand the range of services associated with the Paternity Affidavit program. In addition to improving delivery of the existing program, DCS additionally sought to expand the range of services associated with voluntary paternity establishment. Specifically, DCS:
• Offered no-cost genetic testing for parents who did not sign the paternity affidavit at the hospital
• Facilitated parenting plans
• Attempted to offer no-cost marriage education programs.
FINDINGS The Bright Start project sought to demonstrate that a renewed and
reinvigorated relationship with hospital staff could measurably improve rates of in-hospital paternity establishment. The project also sought to test the feasibility and demand for three complementary services that could be offered during a hospital stay: genetic testing, parenting plans, and marriage education.
Bright Start had some success in improving rates of in-hospital paternity establishment. Establishment rates improved significantly, relative to the rest of the state’s hospitals, in four of the 16 hospitals. DCS’s hypothesis that notary availability was a key driver of establishment rates proved accurate. However, Bright Start was generally unsuccessful in turning average performing hospitals into above average performers. In hospitals that were already establishing paternity for half or more of their unwed parents, the demonstration simply did not translate into increased effort despite stated support by hospital staff.
Looking at Bright Start’s related services, genetic testing proved attractive to a small but important share of unwed couples and was met with near-universal support of hospital staff. An application process and the typical three- to four-week wait for a testing appointment did not deter most interested couples.
Bright Start’s efforts to offer parenting plans and marriage education were considerably less successful and neither is a candidate for post-demonstration implementation. For parenting plans, the hospital environment proved to be the wrong time and place to introduce concepts of visitation and custody. Even subsequent offers through mass mailings by DCS field offices generated little interest among unwed parents with older children. Marriage education referrals never materialized because Yakima and Lakewood-based providers simply were not up and running in time to serve the demonstration. But even if the marriage education programs had
2008 Bright Start Evaluation ECONorthwest/Lewin September 2008 Page iii
been operational, hospital staff expressed some hesitation in participating during Bright Start’s rollout.
LESSONS LEARNED Fundamentally, the paternity affidavit process in hospitals consists of two
steps: Ensuring unwed parents are made aware of the affidavit along with the consequences of signing it and making staff available to notarize the document. While the process is simple, the context in which the process takes place poses significant challenges. Parents are inundated with a wide array of information. Taking precedent over paternity are concerns about the immediate and longer-term health of mother and child, neo-natal vaccinations, breastfeeding decisions and consultations, and health insurance coverage and payment. Thanks to cooperation from the DOH and the 16 demonstration hospitals, DCS managers have learned much about what makes a program work, as well as what pulls a program off track.
• In a well-performing program, the statewide rate of in-hospital establishments should reach 61 percent—or 9 percentage points above the 2007 rate. Even higher rates are possible but would require changes in state rules and statutes. Our statistical analysis indicates that, if all hospitals staffed their programs appropriately and adopted the best practices discussed below, establishment would reach 61 percent. Had hospitals performed at that level, 2,400 additional unmarried mothers would have left the hospital with paternity established in 2007. Movement beyond rates in the 60s is possible. For example, Texas reported a statewide, in-hospital acknowledgment rate of 73 percent during the first three quarters of federal fiscal year 2008 and, within Washington, the highest-functioning hospitals have sustained rates in the 70s. However, for Washington to bring the statewide average to that level, the Legislature would have to strengthen the state’s affidavit statute and compel hospitals to actively participate in the program and related training. In short, Washington statutory requirement, which requires hospitals to simply “provide an opportunity” to sign an affidavit, may be too weak to generate high in-hospital establishment rates.
• High performing hospitals have at least one staff member who owns the program; however, processes that rely on a single person inevitably underperform. As with virtually all public programs, staff enthusiasm and ownership is a key to the success. We saw no evidence in the demonstration hospitals of an unwillingness to participate in the affidavit program. All hospital staff recognized the permanency of the affidavit program and understood its longer-term importance to newborns. From our observations, it didn’t appear to matter who owned the program, but it was important that at least one person in the hospital did.
Page iv September 2008 ECONorthwest/Lewin Group 2008 Bright Start Evaluation
Weak programs often put the responsibility of the affidavit program on a single staff member. Even if that person buys into the program and works diligently, performance suffers when that staff member isn’t working—on weekends, evenings, or during vacation time. Even small hospitals have to recognize that a single person cannot operate the affidavit program.
• Successful programs establish a “focusing event” to ensure every unmarried mother is aware of the affidavit. Hospital stays for new mothers are emotional, hectic, and typically brief. Finding time to introduce and explain the affidavit is challenging. Strong programs build checks into their system to remind nursing, vital records, and social work staff to offer the affidavit. Some hospitals include paternity establishment on discharge checklists. Others hospitals tie the affidavit conversation to the completion of the official and complementary birth certificates.
• Prenatal outreach and second efforts can propel programs even further. Recognizing the increased difficulty of conveying information during a hospital stay, a handful of programs introduce the affidavit to unmarried mothers during prenatal orientations.
• Genetic testing is an appropriate complement to the paternity affidavit program. Hospital staff embraced the service and saw it as filling a gap for couples that were unsure about paternity of a newborn.
• A waiting period does not dampen participation in genetic testing. Couples interested in genetic testing had to apply to Bright Start for services and then wait an average 3.9 weeks to take the test. Despite the wait and required travel, 90 percent of applicants appeared for their test appointments.
• Very weak demand for parenting plans at hospitals suggests visitation and custody issues are not the top concerns of new parents. The demonstration’s intent was to gauge interest in no-cost parenting plans among new parents. During May 2006–December 2007, DCS received only 16 applications for parenting plans that originated from hospitals. Of those applicants, only five couples followed the process through to complete a parenting plan. Dispute resolution counselors advanced a number of reasons for the very low interest. First and foremost was inappropriate timing. The parents were just getting used to their new responsibilities and, for many, it may be premature to consider potential, future conflicts around visitation and custody. In other cases, some mothers unilaterally decided not to participate despite interest by the father. In those instances, Bright Start’s informal, non-judicial approach could not compel an unwilling mother to cooperate.
2008 Bright Start Evaluation ECONorthwest/Lewin September 2008 Page v
MANAGEMENT RECOMMENDATIONS As the three-year demonstration period concludes, DCS managers will
need to consider possible changes to the scope of in-hospital services and how those services are managed. Below, we outline a number of actions management should consider to strengthen the affidavit program.
• Initiate annual hospital trainings in conjunction with the Department of Health. The Bright Start demonstration exposed that DCS had fallen out of contact with hospitals and the key staff who implement the program. Some hospitals hadn’t had an in-person meeting with DCS staff for several years. Given the natural turnover of hospital staff, DCS should reestablish periodic training sessions at hospitals. The goal would be two-fold: remind hospitals of the mission of the program and improve the quality and consistency of implementation. The periodic training sessions should be paired with DOH training on the birth certificate.
• Reestablish a role for a centralized paternity affidavit program and clarify the associated responsibilities of local paternity coordinators. DCS-hospital ties have weakened during the period of decentralization, and the program—as it operates outside of the Bright Start demonstration—lacks a clear owner. Going forward, DCS should consider a role for a centralized statewide paternity coordinator. The coordinator would be in charge of the annual training meetings with hospital staff and would disseminate affidavits, brochures, and videos. The position would closely monitor performance and make special visits to hospitals that persistently fall below their benchmark performance level or that exhibit highly variable performance over time. Finally, the statewide coordinator would administer the notary and genetic testing programs, assuming they become permanent at the conclusion of the Bright Start demonstration.
• Maintain hospital benchmarking. Prior to Bright Start, neither DCS nor the hospitals could identify the difference between a strong in-hospital program and mediocre one. Now DCS has a method to produce benchmark establishment rates tailored to specific demographic and economic conditions of every hospital in the state. As those benchmarks were reported for demonstration sites, hospital staff reacted positively and constructively to the findings. Going forward, DCS should disseminate reports quarterly and harness the naturally competitive environment of the hospital industry to foster continuing improvement of the affidavit program.
• Continue Bright Start’s subsidy of notary training costs. As long as Washington DOH requires a notarized affidavit, DCS should continue to pay for the cost of notary training in hospitals. Our statistical analysis indicated improved notary coverage would
Page vi September 2008 ECONorthwest/Lewin Group 2008 Bright Start Evaluation
increase the weekend establishment rates by more than four percentage points, and additional notaries would also boost performance around holidays and traditional vacation periods.
• Standardize notary training Notaries interviewed during site visits varied in their views about what was and wasn’t acceptable identification for a prospective signee. Some accepted only state-issued driver’s licenses, residence cards, or US Passports. Others were willing to accept identification issued by local governments in foreign countries, particularly Mexico. Some accepted school-issued identification. And, it was not uncommon for practices around acceptable ID to differ across notaries located in the same hospital. The variability in practice produces unequal access to the affidavit process.
Given DOH is ultimately responsible for the integrity of affidavit documents and process, some standardization in notary training is called for.
• Continue the genetic testing program. The offer of free genetic tests fills a hole in the affidavit program. For years, hospital staff have been providing the opportunity to attest to paternity but could offer no advice to mothers who were unsure about the paternity of their newborn. The relatively low take-up rate suggests that only those couples that are truly in doubt about paternity request the test. The program benefits the people who take the test, while simultaneously boosting the reputation of the affidavit among hospital staff.
2008 Bright Start Evaluation ECONorthwest/Lewin September 2008 Page 1-1
Chapter 1 Introduction
BACKGROUND ON BRIGHT START In mid-2005, the federal Office of Child Support Enforcement (OCSE)
awarded Washington State’s Division of Child Support (DCS) a Section 1115(a) demonstration grant to implement and rigorously evaluate enhancements to its pioneering work in voluntary paternity establishment. Specifically, the demonstration, called the Bright Start Program, sought to mitigate the existing barriers to in-hospital paternity establishment and expand the scope of services to include genetic testing, parenting plans, and marriage education. This report serves as an evaluation of the demonstration at the conclusion of the traditional three-year funding cycle for an 1115(a) grant.
Washington launched the concept of in-hospital paternity establishment in the early 1990s, which the US Congress quickly adopted as a national model. Since then, the state has fared well on its paternity establishment percentage (PEP). Given its pioneering role and generally strong performance, Washington seemed, in some respects, an unlikely candidate for an improvement grant.
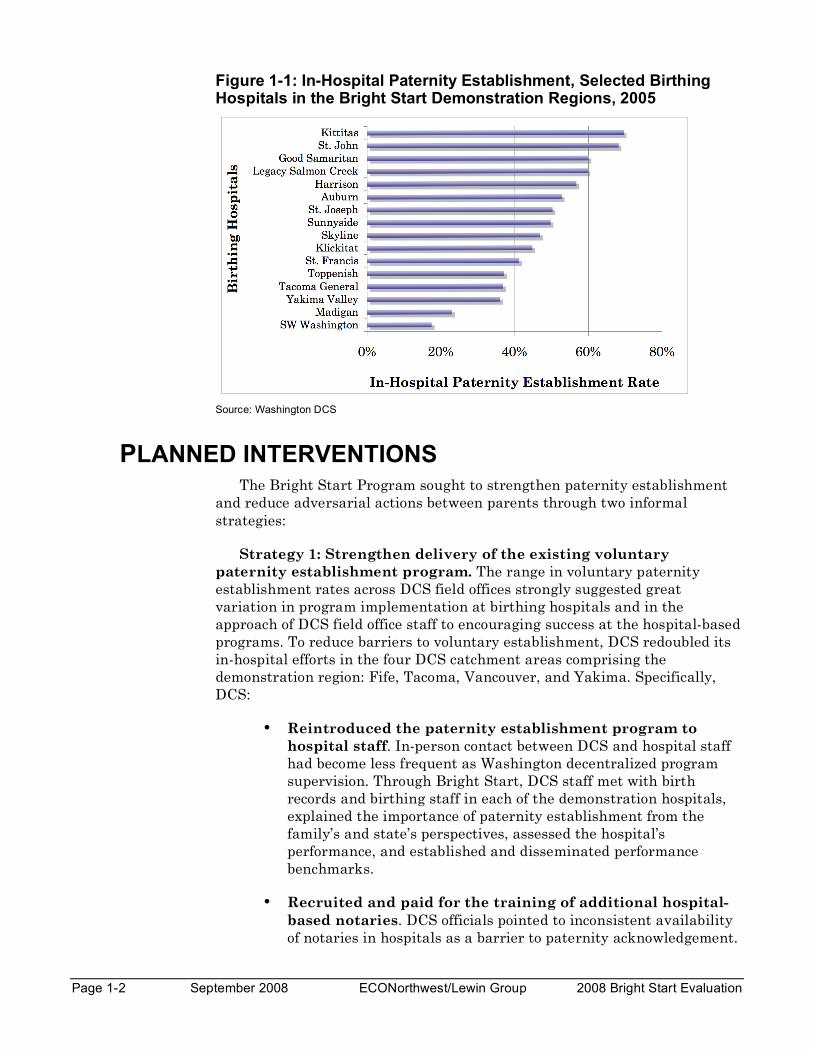
But state managers pointed to highly uneven establishment outcomes across birthing hospitals as justification for the demonstration. Looking across the 16 hospitals that ultimately participated in Bright Start, in-hospital establishment rates varied from 18 to 70 percent in 2005 (See Figure 1-1). In-person contact between DCS and hospital staff was infrequent, so managers could only speculate as to why some hospitals yielded higher establishment than others. While DCS managers recognized that socio-economic characteristics of unwed parents caused some of the variation, they also expected that hospitals varied greatly in their efforts to facilitate voluntary paternity establishment.
The Bright Start demonstration provided an opportunity to examine and reinvigorate a program that—by the agency’s admission—had not received close scrutiny in several years. And, in addition to improving the core paternity establishment function, the demonstration sought to expand the scope of services offered to unwed parents in the hospital. For these expanded services, described in detail below, Bright Start would investigate interest among unwed parents, evaluate the cost of providing the services, and generally assess the feasibility of a broader post-demonstration rollout.
Page 1-2 September 2008 ECONorthwest/Lewin Group 2008 Bright Start Evaluation
Figure 1-1: In-Hospital Paternity Establishment, Selected Birthing Hospitals in the Bright Start Demonstration Regions, 2005
Source: Washington DCS
PLANNED INTERVENTIONS The Bright Start Program sought to strengthen paternity establishment
and reduce adversarial actions between parents through two informal strategies:
Strategy 1: Strengthen delivery of the existing voluntary paternity establishment program. The range in voluntary paternity establishment rates across DCS field offices strongly suggested great variation in program implementation at birthing hospitals and in the approach of DCS field office staff to encouraging success at the hospital-based programs. To reduce barriers to voluntary establishment, DCS redoubled its in-hospital efforts in the four DCS catchment areas comprising the demonstration region: Fife, Tacoma, Vancouver, and Yakima. Specifically, DCS:
• Reintroduced the paternity establishment program to hospital staff. In-person contact between DCS and hospital staff had become less frequent as Washington decentralized program supervision. Through Bright Start, DCS staff met with birth records and birthing staff in each of the demonstration hospitals, explained the importance of paternity establishment from the family’s and state’s perspectives, assessed the hospital’s performance, and established and disseminated performance benchmarks.
• Recruited and paid for the training of additional hospital-based notaries. DCS officials pointed to inconsistent availability of notaries in hospitals as a barrier to paternity acknowledgement.
2008 Bright Start Evaluation ECONorthwest/Lewin September 2008 Page 1-3
Notaries are required to verify the identity of affidavit signers. Through Bright Start, DCS worked with hospitals to ensure that a sufficient number of certified notaries are available to notarize affidavits during peak workday hours and, to the extent possible, during off-peak night and weekend hours.
• Targeted recruitment of hospital-based social workers. DCS recognized that nurses and other medical staff in hospitals are primarily concerned with the immediate health and wellbeing of the mother and child during the hospital stay. As part of the demonstration, DCS encouraged hospitals to recruit non-medical social work professionals to serve as the key hospital-based coordinators of the affidavit program.
• Revamped DCS’s paternity establishment video and information booklet outlining new services. DCS encouraged all hospitals to allow parents to view a six-minute video that explains the benefits and responsibilities inherent in signing a paternity affidavit. For the demonstration project hospitals, Bright Start enhanced the video and developed a new information booklet that was easy to read and understand.
Strategy 2: Expand the range of services associated with the Paternity Affidavit program. In addition to improving delivery of the existing program, DCS additionally sought to expand the range of services associated with voluntary paternity establishment. Specifically, DCS:
• Offered no-cost genetic testing for parents who do not sign the paternity affidavit at the hospital. For some parents, the key barrier to signing the affidavit is the lack of certainty about paternity. As part of the demonstration, DCS offered buccal swab genetic testing through contracted genetic testing facilities located in areas served by the demonstration. Bright Start paid the cost of the test at the state rate of about $126 (which compares well with the private sector rate of about $600). Bright Start staff provided the man who is tested with a paternity affidavit and an information booklet entitled Establish Paternity for Your Child’s Sake to encourage voluntary paternity establishment if paternity is confirmed. The program’s hope and expectation was that after a man was shown to be the biological father of a child, the man would sign a voluntary paternity affidavit.
• Facilitated parenting plans. With the help of hospital staff, DCS offered no-cost access to dispute resolution centers for the purpose of developing parenting plans. Impartial trained mediators facilitated sessions that helped new parents resolve conflict around issues of custody and visitation schedules. Hospital staff were to offer these services only if a couple first signed a paternity affidavit.
Page 1-4 September 2008 ECONorthwest/Lewin Group 2008 Bright Start Evaluation
• Attempted to offer no-cost marriage education programs. Bright Start’s launch coincided with the expansion of federally funded marriage education programs in Yakima and Lakewood, Washington. Bright Start intended to inform unwed parents about no-cost marriage education programs, which outlined basic relationship skills and promoted healthy marriages. As discussed in the body the report, this intervention was never implemented.
By strengthening and enhancing the program, DCS anticipated measurable increases in the rate of voluntary paternity establishment among unmarried couples with children. DCS expected that the increase in voluntary paternity acknowledgements would ultimately produce a corresponding decrease in the number of expensive court-ordered paternity establishments, freeing court docket time and saving public resources.
DCS also anticipated that an early emphasis on non-adversarial methods of child support enforcement would foster a long-term cooperative relationship with both parents, which should, in turn, improve payment rates for current support and avoid the accrual of arrears.
ORGANIZATION OF THE REPORT The balance of this report consists of the following chapters:
• Chapter 2: Determinants of In-Hospital Paternity Establishment Rates. A variety of socio-economic characteristics affect the likelihood that a child born to unwed parents will leave the hospital with paternity in place. This chapter details statistical work that uses a mother’s characteristics to predict paternity establishment rates and outlines a method to create performance expectations for birthing hospitals.
• Chapter 3: Impact of Efforts to Improve In-Hospital Paternity Establishment Programs. Bright Start sought to increase in-hospital paternity establishment rates by reintroducing the program to hospital staff, encouraging an expansion in the number of notaries in hospitals, and improving DCS booklets and videos. This chapter outlines where these efforts made a difference and where they did not.
• Chapter 4: Feasibility and Efficacy of Bright Start’s Expanded Services. Bright Start sought to offer no-cost genetic testing, parenting plans, and marriage education programs. This chapter examines the hospitals’ ability to make parents aware of the services, the varying interest levels demonstrated by parents, and the feasibility of providing the service.
• Chapter 5: Findings, Lessons Learned and Recommendations. The Bright Start demonstration provides Washington DCS with a much deeper understanding of the

2008 Bright Start Evaluation ECONorthwest/Lewin September 2008 Page 1-5
strengths and weaknesses of its existing in-hospital paternity program, as well as a clearer picture of what it could expect from its hospital partners. Moreover, the demonstration sheds light on the usefulness of three services that could, in theory, complement existing in-hospital programs. This final chapter summarizes the lessons learned through the demonstration and outlines a number of recommendations that DCS managers should consider as they contemplate a possible continuation of expanded services.

Page 1-6 September 2008 ECONorthwest/Lewin Group 2008 Bright Start Evaluation
2008 Bright Start Evaluation ECONorthwest/Lewin September 2008 Page 2-1
Determinants of In-Hospital Chapter 2 Paternity Establishment Rates
INTRODUCTION Rates of voluntary paternity establishment vary greatly across
Washington’s 73 birthing hospitals. This variability in hospital-level outcomes was the key impetus for the Bright Start demonstration. Early in the project, state managers recognized that before they could improve in-hospital paternity rates, they needed a clearer understanding of why some hospitals performed better than others.
Determinants of in-hospital establishment rates fall into two broad categories: those outside the hospital management’s control and those inside a hospital’s control. Factors outside a hospital’s control include the socio-economic characteristics of the unwed parents they serve. For example, teen mothers might be less likely to leave a hospital with an affidavit in place than older mothers, and some hospitals serve more teens than others. The key factors within the hospital’s control include the availability of notaries to witness and sign affidavits. Hospitals that don’t make notaries available on weekends—holding other factors constant—will have lower establishment rates than hospitals with weekend notary coverage.
Analyses presented in this chapter illustrate why some hospitals yield higher paternity establishment rates than others. The work is based on an examination of more than 110,000 unmarried births that occurred in Washington State between January 2004 and April 2008. These analyses serve two purposes:
• First, the statistical work forms the foundation of our empirical evaluation of the Bright Start program—presented in detail in Chapter 3. That is, having isolated and controlled for the effects of a host of demographic and economic characteristics on the likelihood of paternity establishment, we can then refine our statistical model to determine whether Bright Start significantly impacted paternity establishment rates following the demonstration’s launch in March 2006.
• Second, the work supports the creation of performance benchmarks tailored to the socio-economic characteristics of patients served by each birthing hospital in the state. The benchmarks could be updated monthly or annually and used by DCS to enhance training sessions with hospital staff.
The balance of this chapter describes the variation in establishment rates and patient characteristics across hospitals and then reports findings on the independent effects of a number of key patient characteristics on paternity
Page 2-2 September 2008 ECONorthwest/Lewin Group 2008 Bright Start Evaluation
establishment rates. The chapter concludes with a presentation of hospital performance benchmarks developed for the demonstration hospitals.
VARIATION IN HOSPITAL-BASED PATERNITY ESTABLISHMENT
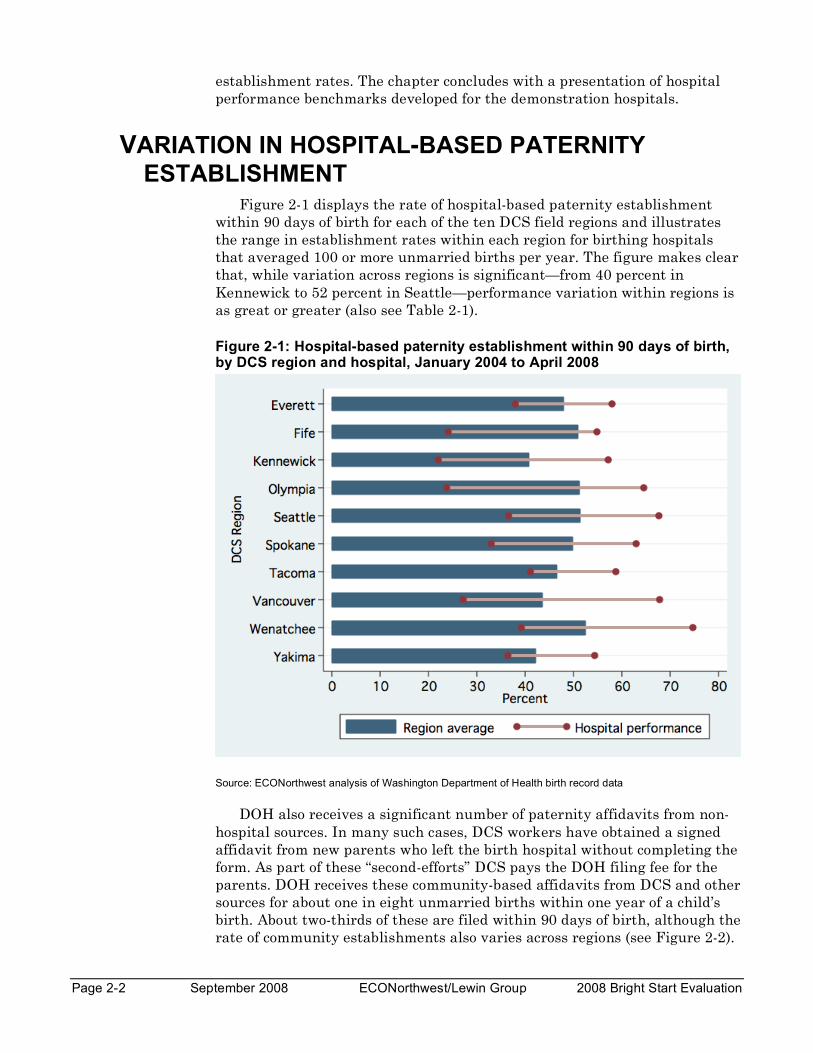
Figure 2-1 displays the rate of hospital-based paternity establishment within 90 days of birth for each of the ten DCS field regions and illustrates the range in establishment rates within each region for birthing hospitals that averaged 100 or more unmarried births per year. The figure makes clear that, while variation across regions is significant—from 40 percent in Kennewick to 52 percent in Seattle—performance variation within regions is as great or greater (also see Table 2-1).
Figure 2-1: Hospital-based paternity establishment within 90 days of birth, by DCS region and hospital, January 2004 to April 2008
Source: ECONorthwest analysis of Washington Department of Health birth record data
DOH also receives a significant number of paternity affidavits from non-hospital sources. In many such cases, DCS workers have obtained a signed affidavit from new parents who left the birth hospital without completing the form. As part of these “second-efforts” DCS pays the DOH filing fee for the parents. DOH receives these community-based affidavits from DCS and other sources for about one in eight unmarried births within one year of a child’s birth. About two-thirds of these are filed within 90 days of birth, although the rate of community establishments also varies across regions (see Figure 2-2).
2008 Bright Start Evaluation ECONorthwest/Lewin September 2008 Page 2-3
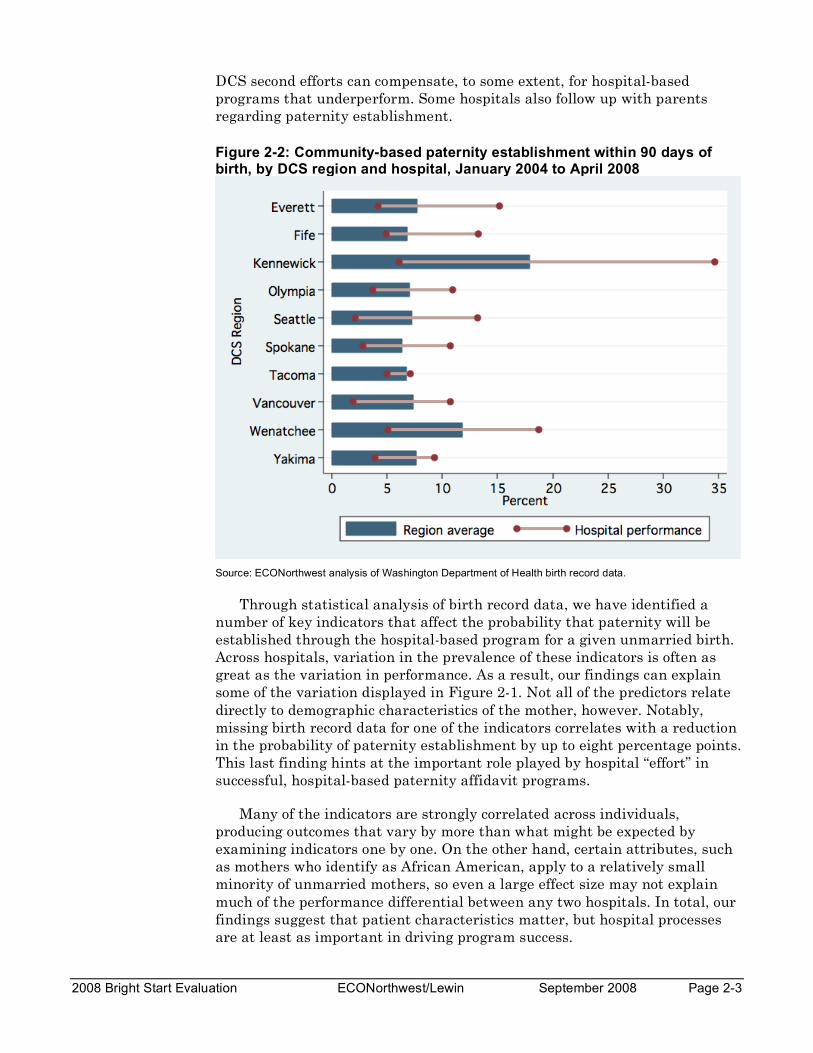
DCS second efforts can compensate, to some extent, for hospital-based programs that underperform. Some hospitals also follow up with parents regarding paternity establishment.
Figure 2-2: Community-based paternity establishment within 90 days of birth, by DCS region and hospital, January 2004 to April 2008
Source: ECONorthwest analysis of Washington Department of Health birth record data.
Through statistical analysis of birth record data, we have identified a number of key indicators that affect the probability that paternity will be established through the hospital-based program for a given unmarried birth. Across hospitals, variation in the prevalence of these indicators is often as great as the variation in performance. As a result, our findings can explain some of the variation displayed in Figure 2-1. Not all of the predictors relate directly to demographic characteristics of the mother, however. Notably, missing birth record data for one of the indicators correlates with a reduction in the probability of paternity establishment by up to eight percentage points. This last finding hints at the important role played by hospital “effort” in successful, hospital-based paternity affidavit programs.
Many of the indicators are strongly correlated across individuals, producing outcomes that vary by more than what might be expected by examining indicators one by one. On the other hand, certain attributes, such as mothers who identify as African American, apply to a relatively small minority of unmarried mothers, so even a large effect size may not explain much of the performance differential between any two hospitals. In total, our findings suggest that patient characteristics matter, but hospital processes are at least as important in driving program success.
Page 2-4 September 2008 ECONorthwest/Lewin Group 2008 Bright Start Evaluation
DIFFERENCES IN DEMOGRAPHICS This section illustrates the differences, across DCS regions and across
hospitals within each region, in the most important predictors of paternity establishment identified: mother’s age, residential tenure, number of other living children, race, ethnicity, education, source of payment for birth, employment status, and the completeness of the birth record data relating to these indicators.
Our mid-term evaluation report also noted the significant impact that the day of the week and related calendar-based indicators of a child’s birth has on paternity establishment. These impacts appear directly related to the availability of support staff during weekdays versus weekends and holidays. For example, unmarried births that occur on Thursday through Saturday are four percentage points less likely to have paternity established through the hospital-based process.
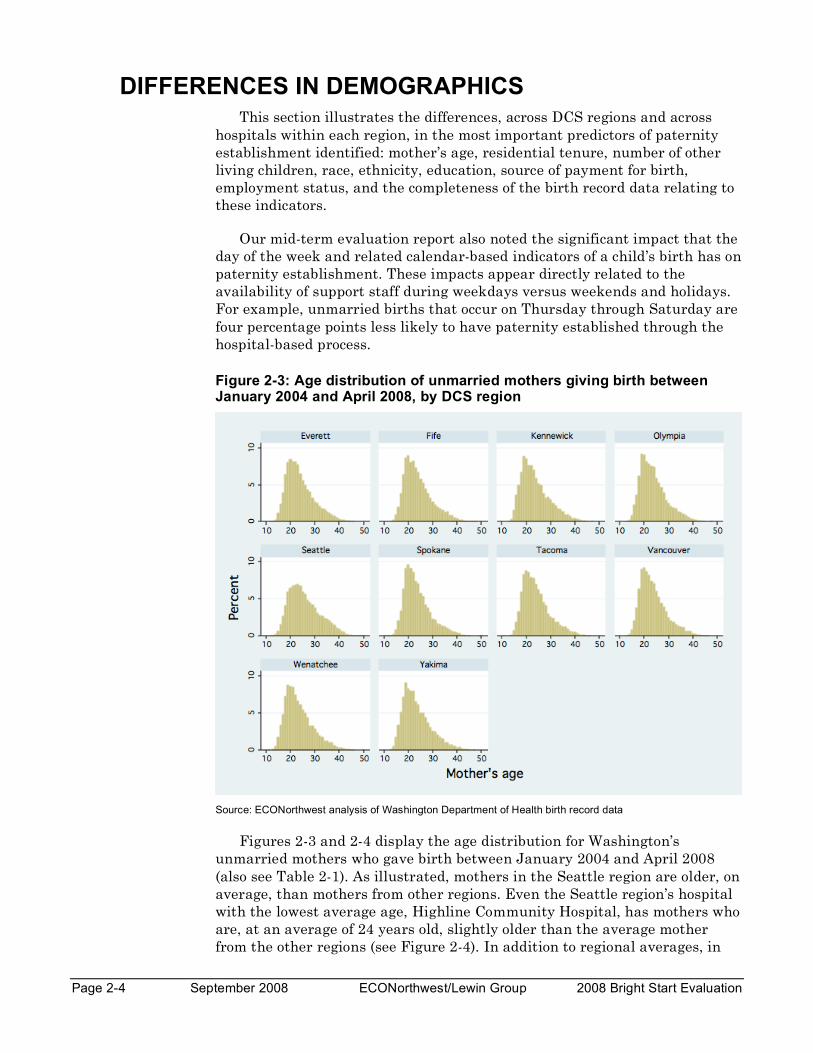
Figure 2-3: Age distribution of unmarried mothers giving birth between January 2004 and April 2008, by DCS region
Source: ECONorthwest analysis of Washington Department of Health birth record data
Figures 2-3 and 2-4 display the age distribution for Washington’s unmarried mothers who gave birth between January 2004 and April 2008 (also see Table 2-1). As illustrated, mothers in the Seattle region are older, on average, than mothers from other regions. Even the Seattle region’s hospital with the lowest average age, Highline Community Hospital, has mothers who are, at an average of 24 years old, slightly older than the average mother from the other regions (see Figure 2-4). In addition to regional averages, in
2008 Bright Start Evaluation ECONorthwest/Lewin September 2008 Page 2-5
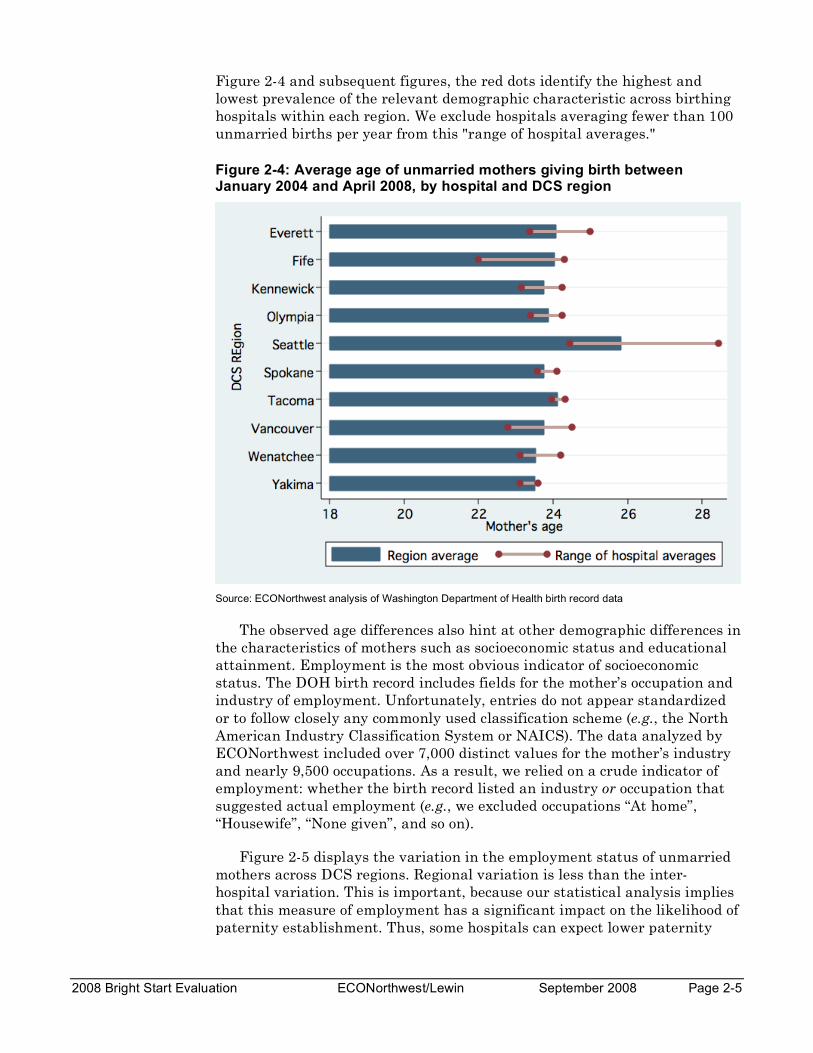
Figure 2-4 and subsequent figures, the red dots identify the highest and lowest prevalence of the relevant demographic characteristic across birthing hospitals within each region. We exclude hospitals averaging fewer than 100 unmarried births per year from this "range of hospital averages."
Figure 2-4: Average age of unmarried mothers giving birth between January 2004 and April 2008, by hospital and DCS region
Source: ECONorthwest analysis of Washington Department of Health birth record data
The observed age differences also hint at other demographic differences in the characteristics of mothers such as socioeconomic status and educational attainment. Employment is the most obvious indicator of socioeconomic status. The DOH birth record includes fields for the mother’s occupation and industry of employment. Unfortunately, entries do not appear standardized or to follow closely any commonly used classification scheme (e.g., the North American Industry Classification System or NAICS). The data analyzed by ECONorthwest included over 7,000 distinct values for the mother’s industry and nearly 9,500 occupations. As a result, we relied on a crude indicator of employment: whether the birth record listed an industry or occupation that suggested actual employment (e.g., we excluded occupations “At home”, “Housewife”, “None given”, and so on).
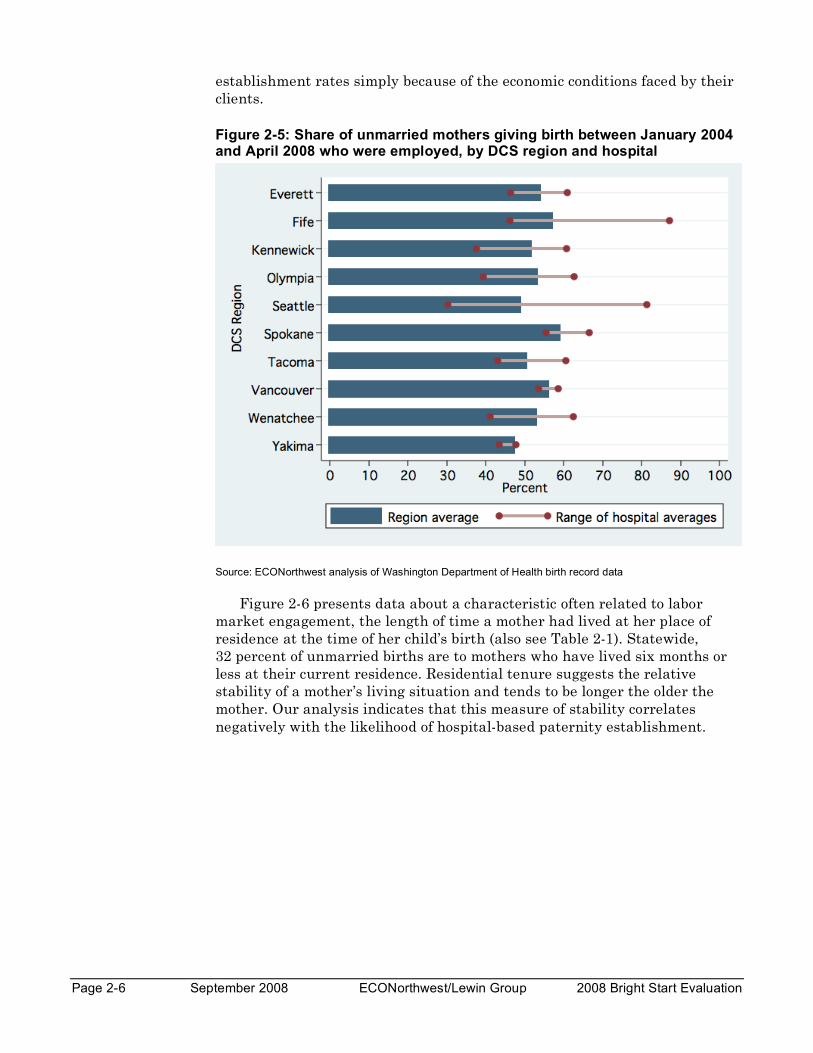
Figure 2-5 displays the variation in the employment status of unmarried mothers across DCS regions. Regional variation is less than the inter-hospital variation. This is important, because our statistical analysis implies that this measure of employment has a significant impact on the likelihood of paternity establishment. Thus, some hospitals can expect lower paternity
Page 2-6 September 2008 ECONorthwest/Lewin Group 2008 Bright Start Evaluation
establishment rates simply because of the economic conditions faced by their clients.
Figure 2-5: Share of unmarried mothers giving birth between January 2004 and April 2008 who were employed, by DCS region and hospital
Source: ECONorthwest analysis of Washington Department of Health birth record data
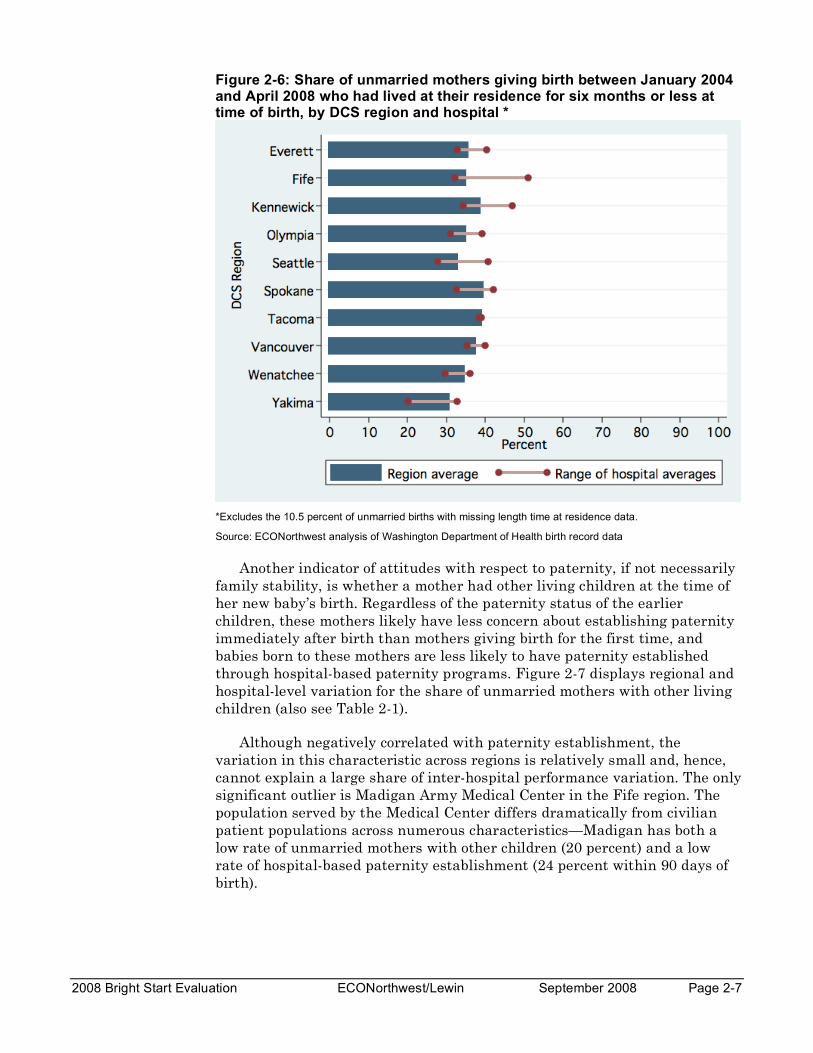
Figure 2-6 presents data about a characteristic often related to labor market engagement, the length of time a mother had lived at her place of residence at the time of her child’s birth (also see Table 2-1). Statewide, 32 percent of unmarried births are to mothers who have lived six months or less at their current residence. Residential tenure suggests the relative stability of a mother’s living situation and tends to be longer the older the mother. Our analysis indicates that this measure of stability correlates negatively with the likelihood of hospital-based paternity establishment.
2008 Bright Start Evaluation ECONorthwest/Lewin September 2008 Page 2-7
Figure 2-6: Share of unmarried mothers giving birth between January 2004 and April 2008 who had lived at their residence for six months or less at time of birth, by DCS region and hospital *
*Excludes the 10.5 percent of unmarried births with missing length time at residence data.
Source: ECONorthwest analysis of Washington Department of Health birth record data
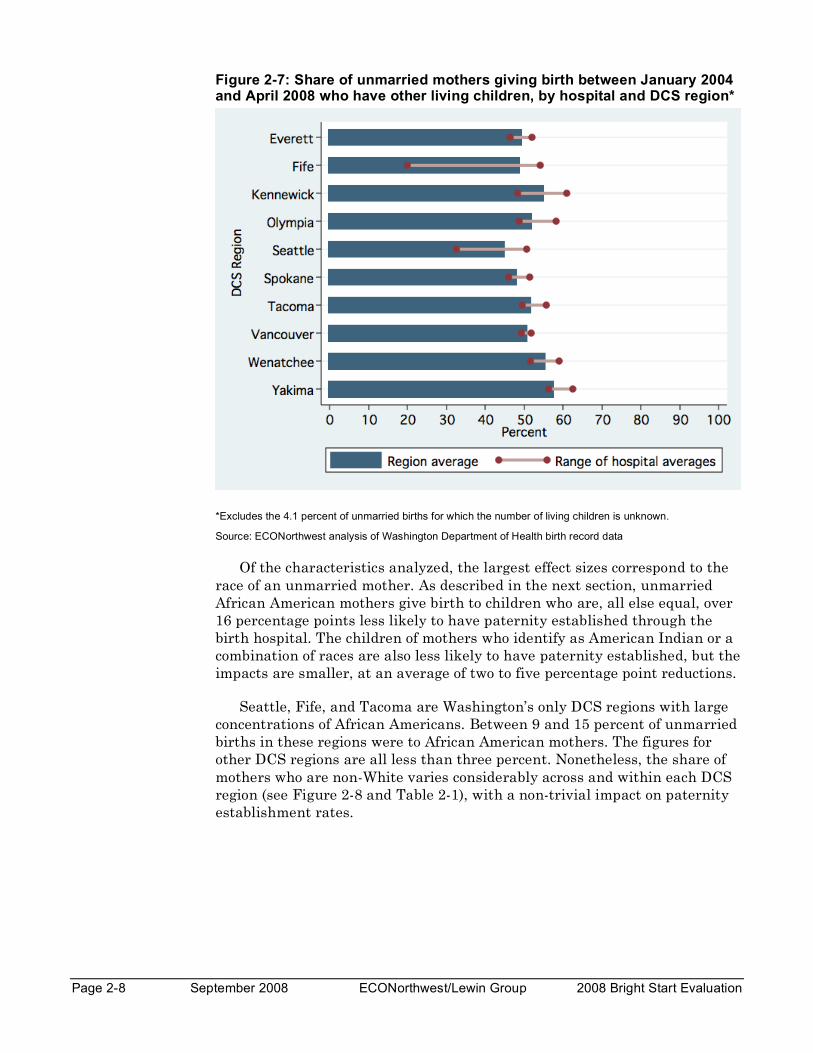
Another indicator of attitudes with respect to paternity, if not necessarily family stability, is whether a mother had other living children at the time of her new baby’s birth. Regardless of the paternity status of the earlier children, these mothers likely have less concern about establishing paternity immediately after birth than mothers giving birth for the first time, and babies born to these mothers are less likely to have paternity established through hospital-based paternity programs. Figure 2-7 displays regional and hospital-level variation for the share of unmarried mothers with other living children (also see Table 2-1).
Although negatively correlated with paternity establishment, the variation in this characteristic across regions is relatively small and, hence, cannot explain a large share of inter-hospital performance variation. The only significant outlier is Madigan Army Medical Center in the Fife region. The population served by the Medical Center differs dramatically from civilian patient populations across numerous characteristics—Madigan has both a low rate of unmarried mothers with other children (20 percent) and a low rate of hospital-based paternity establishment (24 percent within 90 days of birth).
Page 2-8 September 2008 ECONorthwest/Lewin Group 2008 Bright Start Evaluation
Figure 2-7: Share of unmarried mothers giving birth between January 2004 and April 2008 who have other living children, by hospital and DCS region*
*Excludes the 4.1 percent of unmarried births for which the number of living children is unknown.
Source: ECONorthwest analysis of Washington Department of Health birth record data
Of the characteristics analyzed, the largest effect sizes correspond to the race of an unmarried mother. As described in the next section, unmarried African American mothers give birth to children who are, all else equal, over 16 percentage points less likely to have paternity established through the birth hospital. The children of mothers who identify as American Indian or a combination of races are also less likely to have paternity established, but the impacts are smaller, at an average of two to five percentage point reductions.
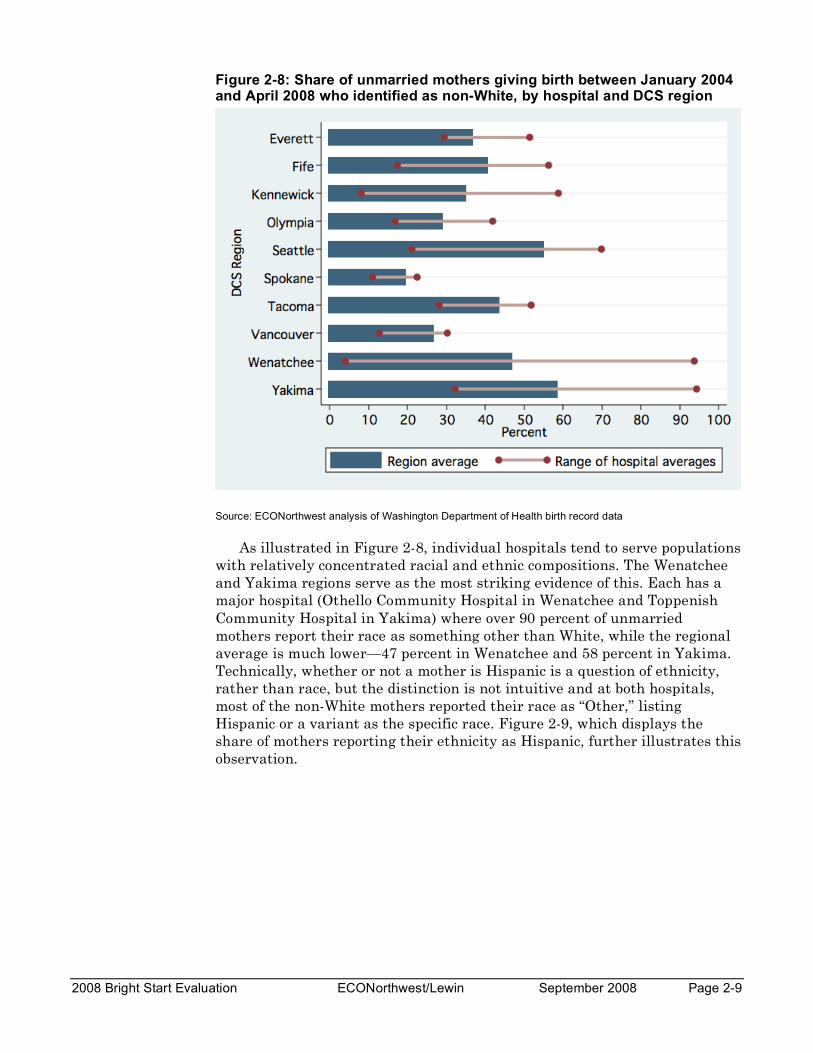
Seattle, Fife, and Tacoma are Washington’s only DCS regions with large concentrations of African Americans. Between 9 and 15 percent of unmarried births in these regions were to African American mothers. The figures for other DCS regions are all less than three percent. Nonetheless, the share of mothers who are non-White varies considerably across and within each DCS region (see Figure 2-8 and Table 2-1), with a non-trivial impact on paternity establishment rates.
2008 Bright Start Evaluation ECONorthwest/Lewin September 2008 Page 2-9
Figure 2-8: Share of unmarried mothers giving birth between January 2004 and April 2008 who identified as non-White, by hospital and DCS region
Source: ECONorthwest analysis of Washington Department of Health birth record data
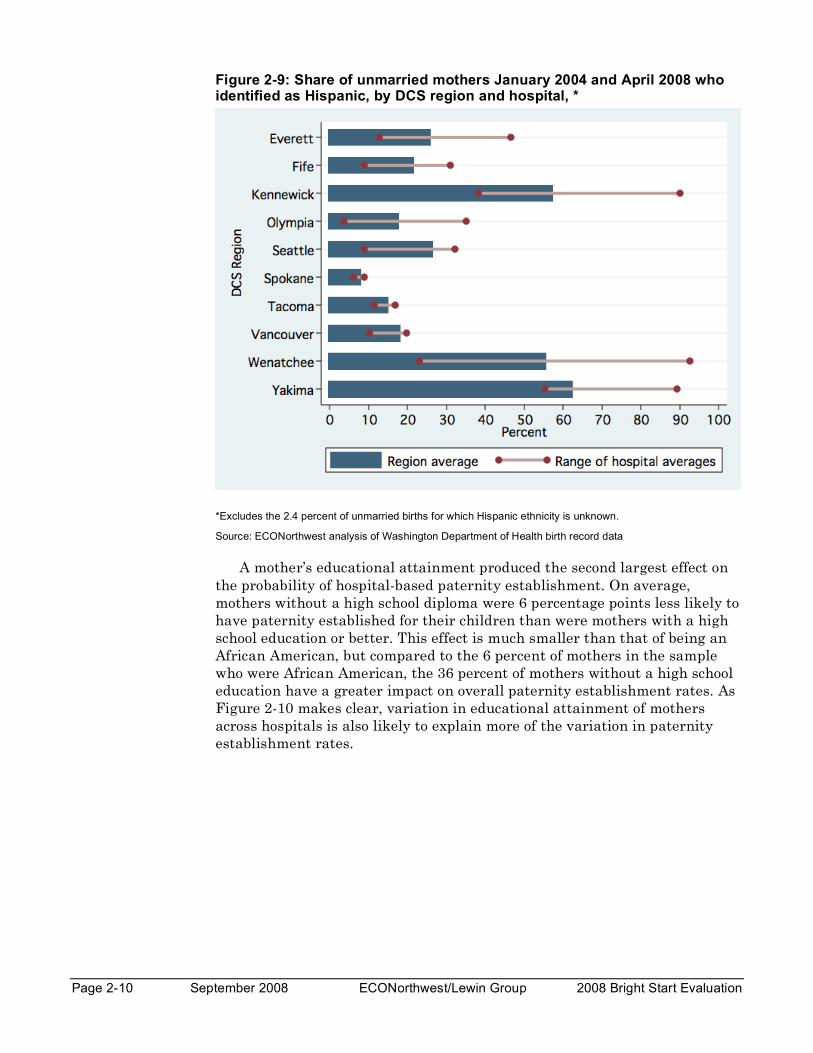
As illustrated in Figure 2-8, individual hospitals tend to serve populations with relatively concentrated racial and ethnic compositions. The Wenatchee and Yakima regions serve as the most striking evidence of this. Each has a major hospital (Othello Community Hospital in Wenatchee and Toppenish Community Hospital in Yakima) where over 90 percent of unmarried mothers report their race as something other than White, while the regional average is much lower—47 percent in Wenatchee and 58 percent in Yakima. Technically, whether or not a mother is Hispanic is a question of ethnicity, rather than race, but the distinction is not intuitive and at both hospitals, most of the non-White mothers reported their race as “Other,” listing Hispanic or a variant as the specific race. Figure 2-9, which displays the share of mothers reporting their ethnicity as Hispanic, further illustrates this observation.
Page 2-10 September 2008 ECONorthwest/Lewin Group 2008 Bright Start Evaluation
Figure 2-9: Share of unmarried mothers January 2004 and April 2008 who identified as Hispanic, by DCS region and hospital, *
*Excludes the 2.4 percent of unmarried births for which Hispanic ethnicity is unknown.
Source: ECONorthwest analysis of Washington Department of Health birth record data
A mother’s educational attainment produced the second largest effect on the probability of hospital-based paternity establishment. On average, mothers without a high school diploma were 6 percentage points less likely to have paternity established for their children than were mothers with a high school education or better. This effect is much smaller than that of being an African American, but compared to the 6 percent of mothers in the sample who were African American, the 36 percent of mothers without a high school education have a greater impact on overall paternity establishment rates. As Figure 2-10 makes clear, variation in educational attainment of mothers across hospitals is also likely to explain more of the variation in paternity establishment rates.
2008 Bright Start Evaluation ECONorthwest/Lewin September 2008 Page 2-11
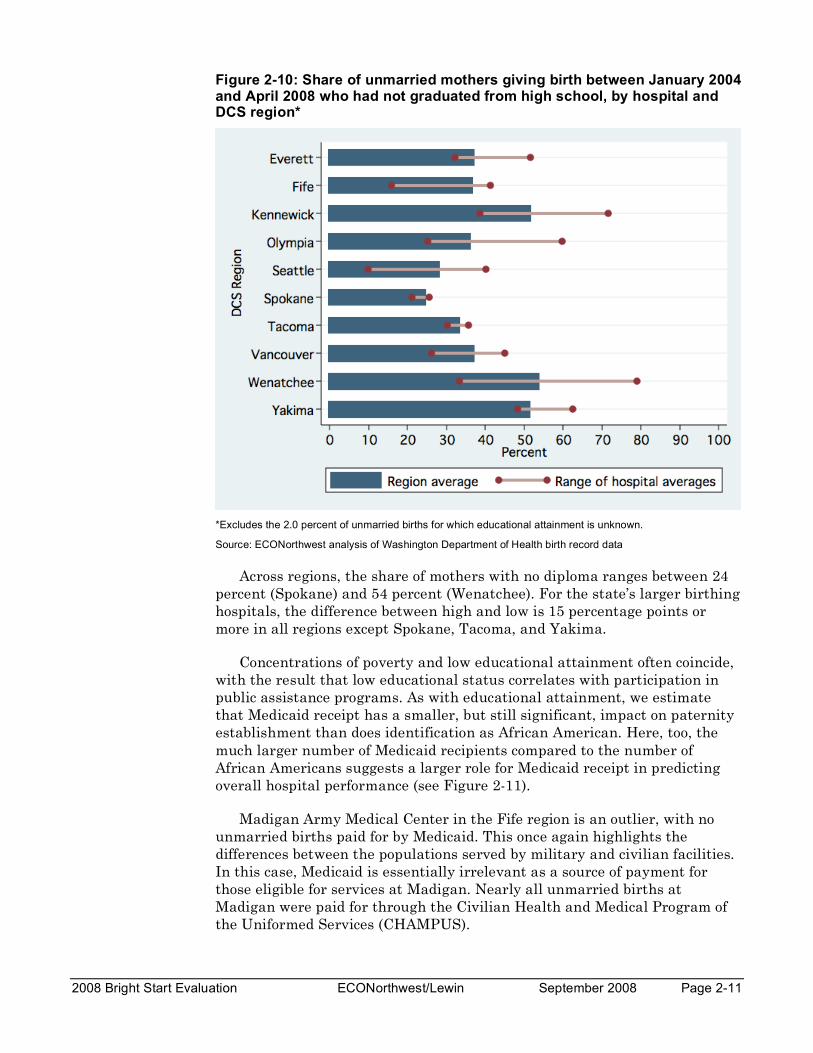
Figure 2-10: Share of unmarried mothers giving birth between January 2004 and April 2008 who had not graduated from high school, by hospital and DCS region*
*Excludes the 2.0 percent of unmarried births for which educational attainment is unknown.
Source: ECONorthwest analysis of Washington Department of Health birth record data
Across regions, the share of mothers with no diploma ranges between 24 percent (Spokane) and 54 percent (Wenatchee). For the state’s larger birthing hospitals, the difference between high and low is 15 percentage points or more in all regions except Spokane, Tacoma, and Yakima.
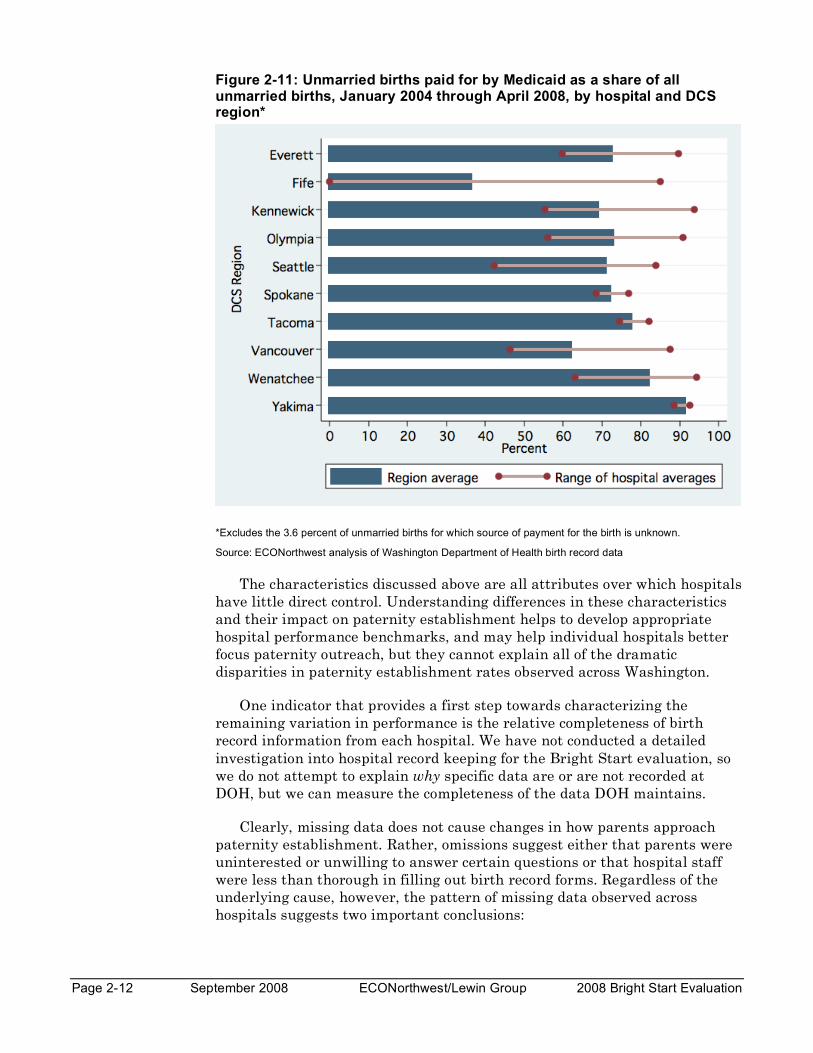
Concentrations of poverty and low educational attainment often coincide, with the result that low educational status correlates with participation in public assistance programs. As with educational attainment, we estimate that Medicaid receipt has a smaller, but still significant, impact on paternity establishment than does identification as African American. Here, too, the much larger number of Medicaid recipients compared to the number of African Americans suggests a larger role for Medicaid receipt in predicting overall hospital performance (see Figure 2-11).
Madigan Army Medical Center in the Fife region is an outlier, with no unmarried births paid for by Medicaid. This once again highlights the differences between the populations served by military and civilian facilities. In this case, Medicaid is essentially irrelevant as a source of payment for those eligible for services at Madigan. Nearly all unmarried births at Madigan were paid for through the Civilian Health and Medical Program of the Uniformed Services (CHAMPUS).
Page 2-12 September 2008 ECONorthwest/Lewin Group 2008 Bright Start Evaluation
Figure 2-11: Unmarried births paid for by Medicaid as a share of all unmarried births, January 2004 through April 2008, by hospital and DCS region*
*Excludes the 3.6 percent of unmarried births for which source of payment for the birth is unknown.
Source: ECONorthwest analysis of Washington Department of Health birth record data
The characteristics discussed above are all attributes over which hospitals have little direct control. Understanding differences in these characteristics and their impact on paternity establishment helps to develop appropriate hospital performance benchmarks, and may help individual hospitals better focus paternity outreach, but they cannot explain all of the dramatic disparities in paternity establishment rates observed across Washington.
One indicator that provides a first step towards characterizing the remaining variation in performance is the relative completeness of birth record information from each hospital. We have not conducted a detailed investigation into hospital record keeping for the Bright Start evaluation, so we do not attempt to explain why specific data are or are not recorded at DOH, but we can measure the completeness of the data DOH maintains.
Clearly, missing data does not cause changes in how parents approach paternity establishment. Rather, omissions suggest either that parents were uninterested or unwilling to answer certain questions or that hospital staff were less than thorough in filling out birth record forms. Regardless of the underlying cause, however, the pattern of missing data observed across hospitals suggests two important conclusions:
2008 Bright Start Evaluation ECONorthwest/Lewin September 2008 Page 2-13
1. The fathers of children whose birth records lack data for one or more of the characteristics we discuss are less likely to establish paternity through the birth hospital’s paternity affidavit program.
2. Birth records associated with low-performing hospitals tend to have more missing data than those associated with better-performing hospitals.
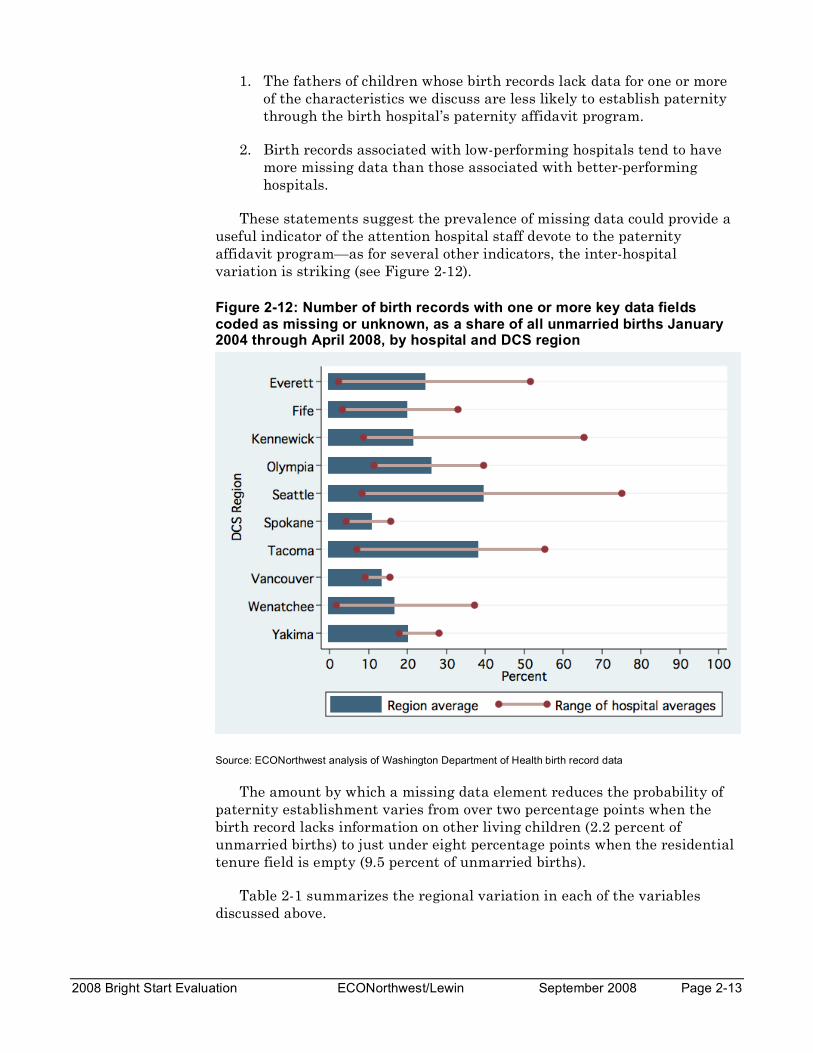
These statements suggest the prevalence of missing data could provide a useful indicator of the attention hospital staff devote to the paternity affidavit program—as for several other indicators, the inter-hospital variation is striking (see Figure 2-12).
Figure 2-12: Number of birth records with one or more key data fields coded as missing or unknown, as a share of all unmarried births January 2004 through April 2008, by hospital and DCS region
Source: ECONorthwest analysis of Washington Department of Health birth record data
The amount by which a missing data element reduces the probability of paternity establishment varies from over two percentage points when the birth record lacks information on other living children (2.2 percent of unmarried births) to just under eight percentage points when the residential tenure field is empty (9.5 percent of unmarried births).
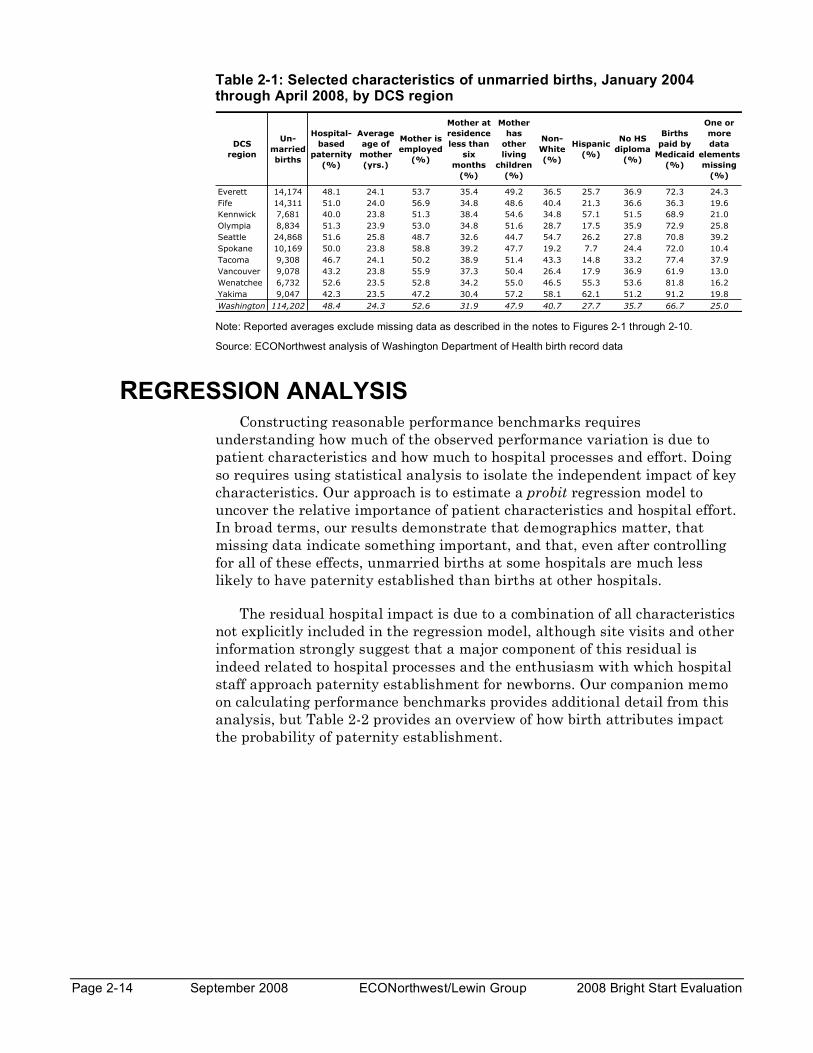
Table 2-1 summarizes the regional variation in each of the variables discussed above.
Page 2-14 September 2008 ECONorthwest/Lewin Group 2008 Bright Start Evaluation
Table 2-1: Selected characteristics of unmarried births, January 2004 through April 2008, by DCS region
DCS
region
Un-
married
births
Hospital-
based
paternity
(%)
Average
age of
mother
(yrs.)
Mother is
employed
(%)
Mother at
residence
less than
six
months
(%)
Mother
has
other
living
children
(%)
Non-
White
(%)
Hispanic
(%)
No HS
diploma
(%)
Births
paid by
Medicaid
(%)
One or
more
data
elements
missing
(%)
Everett 14,174 48.1 24.1 53.7 35.4 49.2 36.5 25.7 36.9 72.3 24.3
Fife 14,311 51.0 24.0 56.9 34.8 48.6 40.4 21.3 36.6 36.3 19.6
Kennwick 7,681 40.0 23.8 51.3 38.4 54.6 34.8 57.1 51.5 68.9 21.0
Olympia 8,834 51.3 23.9 53.0 34.8 51.6 28.7 17.5 35.9 72.9 25.8
Seattle 24,868 51.6 25.8 48.7 32.6 44.7 54.7 26.2 27.8 70.8 39.2
Spokane 10,169 50.0 23.8 58.8 39.2 47.7 19.2 7.7 24.4 72.0 10.4
Tacoma 9,308 46.7 24.1 50.2 38.9 51.4 43.3 14.8 33.2 77.4 37.9
Vancouver 9,078 43.2 23.8 55.9 37.3 50.4 26.4 17.9 36.9 61.9 13.0
Wenatchee 6,732 52.6 23.5 52.8 34.2 55.0 46.5 55.3 53.6 81.8 16.2
Yakima 9,047 42.3 23.5 47.2 30.4 57.2 58.1 62.1 51.2 91.2 19.8
Washington 114,202 48.4 24.3 52.6 31.9 47.9 40.7 27.7 35.7 66.7 25.0
Note: Reported averages exclude missing data as described in the notes to Figures 2-1 through 2-10.
Source: ECONorthwest analysis of Washington Department of Health birth record data
REGRESSION ANALYSIS Constructing reasonable performance benchmarks requires
understanding how much of the observed performance variation is due to patient characteristics and how much to hospital processes and effort. Doing so requires using statistical analysis to isolate the independent impact of key characteristics. Our approach is to estimate a probit regression model to uncover the relative importance of patient characteristics and hospital effort. In broad terms, our results demonstrate that demographics matter, that missing data indicate something important, and that, even after controlling for all of these effects, unmarried births at some hospitals are much less likely to have paternity established than births at other hospitals.
The residual hospital impact is due to a combination of all characteristics not explicitly included in the regression model, although site visits and other information strongly suggest that a major component of this residual is indeed related to hospital processes and the enthusiasm with which hospital staff approach paternity establishment for newborns. Our companion memo on calculating performance benchmarks provides additional detail from this analysis, but Table 2-2 provides an overview of how birth attributes impact the probability of paternity establishment.
2008 Bright Start Evaluation ECONorthwest/Lewin September 2008 Page 2-15
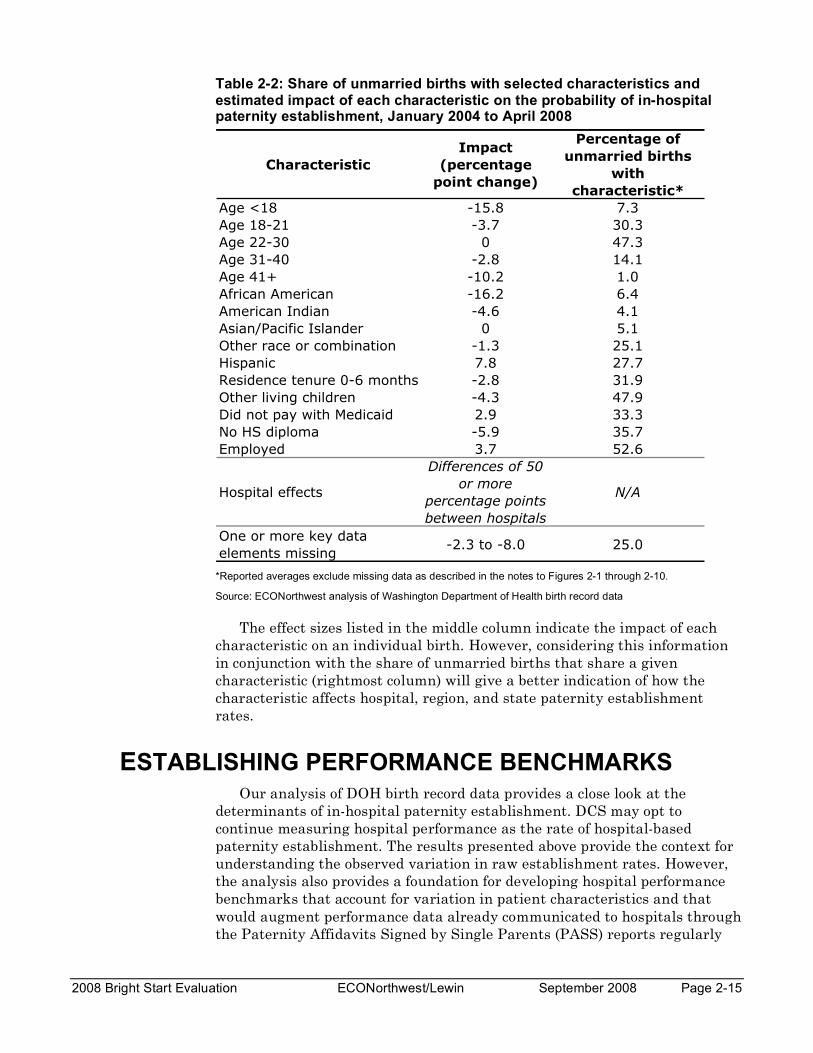
Table 2-2: Share of unmarried births with selected characteristics and estimated impact of each characteristic on the probability of in-hospital paternity establishment, January 2004 to April 2008
*Reported averages exclude missing data as described in the notes to Figures 2-1 through 2-10.
Source: ECONorthwest analysis of Washington Department of Health birth record data
The effect sizes listed in the middle column indicate the impact of each characteristic on an individual birth. However, considering this information in conjunction with the share of unmarried births that share a given characteristic (rightmost column) will give a better indication of how the characteristic affects hospital, region, and state paternity establishment rates.
ESTABLISHING PERFORMANCE BENCHMARKS Our analysis of DOH birth record data provides a close look at the
determinants of in-hospital paternity establishment. DCS may opt to continue measuring hospital performance as the rate of hospital-based paternity establishment. The results presented above provide the context for understanding the observed variation in raw establishment rates. However, the analysis also provides a foundation for developing hospital performance benchmarks that account for variation in patient characteristics and that would augment performance data already communicated to hospitals through the Paternity Affidavits Signed by Single Parents (PASS) reports regularly
Characteristic
Impact
(percentage
point change)
Percentage of
unmarried births
with
characteristic*
Age <18 -15.8 7.3
Age 18-21 -3.7 30.3
Age 22-30 0 47.3
Age 31-40 -2.8 14.1
Age 41+ -10.2 1.0
African American -16.2 6.4
American Indian -4.6 4.1
Asian/Pacific Islander 0 5.1
Other race or combination -1.3 25.1
Hispanic 7.8 27.7
Residence tenure 0-6 months -2.8 31.9
Other living children -4.3 47.9
Did not pay with Medicaid 2.9 33.3
No HS diploma -5.9 35.7
Employed 3.7 52.6
Hospital effects
Differences of 50
or more
percentage points
between hospitals
N/A
One or more key data
elements missing-2.3 to -8.0 25.0
Page 2-16 September 2008 ECONorthwest/Lewin Group 2008 Bright Start Evaluation
produced by DCS. The benchmarks would nonetheless hold hospitals responsible for performance deficits that are not attributable to differences in the patient populations served.
As part of the Bright Start evaluation, we created a set of hospital benchmarks that assumed hospitals could, after adjusting for challenges posed by patient demographics, perform as well as the 70th percentile hospital. In other words, about 30 percent of unmarried births occur at hospitals that outperform the benchmark hospital. While nearly ten percentage points above the current statewide average, our observations suggest this performance goal is within reach for most hospitals.
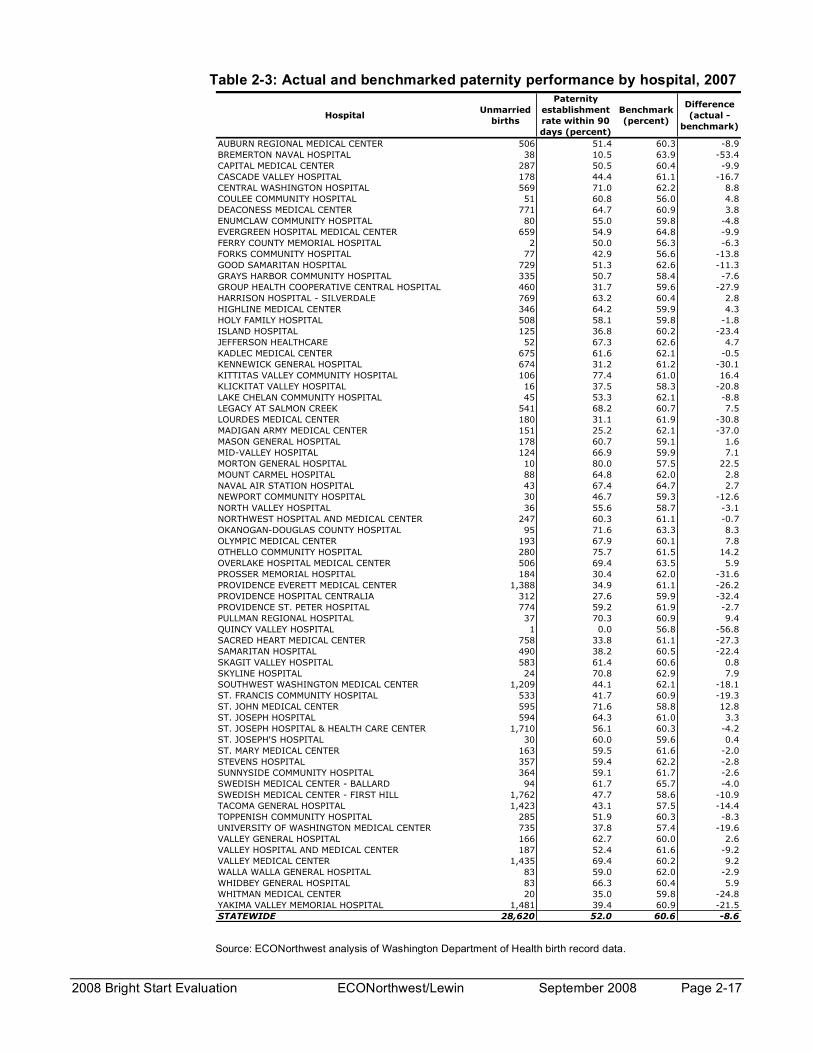
To create the benchmarks, we apply findings from our regression analysis to the population of unmarried mothers giving birth at each hospital. Table 2-3, on the next page, lists the resulting 2007 benchmarks for each of Washington’s birthing hospitals. The statewide benchmark indicates the expected in-hospital paternity establishment rate that would have prevailed in 2007 if all hospitals had performed as well as the hospital at the 70th percentile. An appendix provides a graphical illustration of actual and benchmark performance for each Bright Start hospital during 2007.
2008 Bright Start Evaluation ECONorthwest/Lewin September 2008 Page 2-17
Table 2-3: Actual and benchmarked paternity performance by hospital, 2007
HospitalUnmarried
births
Paternity
establishment
rate within 90
days (percent)
Benchmark
(percent)
Difference
(actual -
benchmark)
AUBURN REGIONAL MEDICAL CENTER 506 51.4 60.3 -8.9
BREMERTON NAVAL HOSPITAL 38 10.5 63.9 -53.4
CAPITAL MEDICAL CENTER 287 50.5 60.4 -9.9
CASCADE VALLEY HOSPITAL 178 44.4 61.1 -16.7
CENTRAL WASHINGTON HOSPITAL 569 71.0 62.2 8.8
COULEE COMMUNITY HOSPITAL 51 60.8 56.0 4.8
DEACONESS MEDICAL CENTER 771 64.7 60.9 3.8
ENUMCLAW COMMUNITY HOSPITAL 80 55.0 59.8 -4.8
EVERGREEN HOSPITAL MEDICAL CENTER 659 54.9 64.8 -9.9
FERRY COUNTY MEMORIAL HOSPITAL 2 50.0 56.3 -6.3
FORKS COMMUNITY HOSPITAL 77 42.9 56.6 -13.8
GOOD SAMARITAN HOSPITAL 729 51.3 62.6 -11.3
GRAYS HARBOR COMMUNITY HOSPITAL 335 50.7 58.4 -7.6
GROUP HEALTH COOPERATIVE CENTRAL HOSPITAL 460 31.7 59.6 -27.9
HARRISON HOSPITAL - SILVERDALE 769 63.2 60.4 2.8
HIGHLINE MEDICAL CENTER 346 64.2 59.9 4.3
HOLY FAMILY HOSPITAL 508 58.1 59.8 -1.8
ISLAND HOSPITAL 125 36.8 60.2 -23.4
JEFFERSON HEALTHCARE 52 67.3 62.6 4.7
KADLEC MEDICAL CENTER 675 61.6 62.1 -0.5
KENNEWICK GENERAL HOSPITAL 674 31.2 61.2 -30.1
KITTITAS VALLEY COMMUNITY HOSPITAL 106 77.4 61.0 16.4
KLICKITAT VALLEY HOSPITAL 16 37.5 58.3 -20.8
LAKE CHELAN COMMUNITY HOSPITAL 45 53.3 62.1 -8.8
LEGACY AT SALMON CREEK 541 68.2 60.7 7.5
LOURDES MEDICAL CENTER 180 31.1 61.9 -30.8
MADIGAN ARMY MEDICAL CENTER 151 25.2 62.1 -37.0
MASON GENERAL HOSPITAL 178 60.7 59.1 1.6
MID-VALLEY HOSPITAL 124 66.9 59.9 7.1
MORTON GENERAL HOSPITAL 10 80.0 57.5 22.5
MOUNT CARMEL HOSPITAL 88 64.8 62.0 2.8
NAVAL AIR STATION HOSPITAL 43 67.4 64.7 2.7
NEWPORT COMMUNITY HOSPITAL 30 46.7 59.3 -12.6
NORTH VALLEY HOSPITAL 36 55.6 58.7 -3.1
NORTHWEST HOSPITAL AND MEDICAL CENTER 247 60.3 61.1 -0.7
OKANOGAN-DOUGLAS COUNTY HOSPITAL 95 71.6 63.3 8.3
OLYMPIC MEDICAL CENTER 193 67.9 60.1 7.8
OTHELLO COMMUNITY HOSPITAL 280 75.7 61.5 14.2
OVERLAKE HOSPITAL MEDICAL CENTER 506 69.4 63.5 5.9
PROSSER MEMORIAL HOSPITAL 184 30.4 62.0 -31.6
PROVIDENCE EVERETT MEDICAL CENTER 1,388 34.9 61.1 -26.2
PROVIDENCE HOSPITAL CENTRALIA 312 27.6 59.9 -32.4
PROVIDENCE ST. PETER HOSPITAL 774 59.2 61.9 -2.7
PULLMAN REGIONAL HOSPITAL 37 70.3 60.9 9.4
QUINCY VALLEY HOSPITAL 1 0.0 56.8 -56.8
SACRED HEART MEDICAL CENTER 758 33.8 61.1 -27.3
SAMARITAN HOSPITAL 490 38.2 60.5 -22.4
SKAGIT VALLEY HOSPITAL 583 61.4 60.6 0.8
SKYLINE HOSPITAL 24 70.8 62.9 7.9
SOUTHWEST WASHINGTON MEDICAL CENTER 1,209 44.1 62.1 -18.1
ST. FRANCIS COMMUNITY HOSPITAL 533 41.7 60.9 -19.3
ST. JOHN MEDICAL CENTER 595 71.6 58.8 12.8
ST. JOSEPH HOSPITAL 594 64.3 61.0 3.3
ST. JOSEPH HOSPITAL & HEALTH CARE CENTER 1,710 56.1 60.3 -4.2
ST. JOSEPH'S HOSPITAL 30 60.0 59.6 0.4
ST. MARY MEDICAL CENTER 163 59.5 61.6 -2.0
STEVENS HOSPITAL 357 59.4 62.2 -2.8
SUNNYSIDE COMMUNITY HOSPITAL 364 59.1 61.7 -2.6
SWEDISH MEDICAL CENTER - BALLARD 94 61.7 65.7 -4.0
SWEDISH MEDICAL CENTER - FIRST HILL 1,762 47.7 58.6 -10.9
TACOMA GENERAL HOSPITAL 1,423 43.1 57.5 -14.4
TOPPENISH COMMUNITY HOSPITAL 285 51.9 60.3 -8.3
UNIVERSITY OF WASHINGTON MEDICAL CENTER 735 37.8 57.4 -19.6
VALLEY GENERAL HOSPITAL 166 62.7 60.0 2.6
VALLEY HOSPITAL AND MEDICAL CENTER 187 52.4 61.6 -9.2
VALLEY MEDICAL CENTER 1,435 69.4 60.2 9.2
WALLA WALLA GENERAL HOSPITAL 83 59.0 62.0 -2.9
WHIDBEY GENERAL HOSPITAL 83 66.3 60.4 5.9
WHITMAN MEDICAL CENTER 20 35.0 59.8 -24.8
YAKIMA VALLEY MEMORIAL HOSPITAL 1,481 39.4 60.9 -21.5
STATEWIDE 28,620 52.0 60.6 -8.6
Source: ECONorthwest analysis of Washington Department of Health birth record data.

2008 Bright Start Evaluation ECONorthwest/Lewin September 2008 Page 3-1
Impact of Efforts to Improve In-Hospital Chapter 3 Paternity Establishment Programs
BACKGROUND Even with Washington’s long history of success with hospital-based
paternity affidavit programs, the state’s birthing hospitals display enormous variation in performance. This variation exists not only across hospitals, but also within hospitals—many exhibit relatively large fluctuations from one year to the next and, in some cases, from month to month. As described in Chapter 2, demographics have a significant impact on the likelihood that the child of an unmarried mother ultimately has paternity established, but a large amount of variation remains unexplained even after controlling for patient characteristics.
A key goal of the Bright Start demonstration was to understand and address the factors driving the unexplained gaps in hospital performance, evidenced by the range in hospital efforts described in Chapter 2. The hope was that relatively inexpensive and informal interventions could shore up paternity establishment rates at underperforming hospitals, benefiting families and saving taxpayers money.
The hospital-based efforts also served a well-understood need to reintroduce hospital staff to the paternity affidavit program and related issues. In particular, direct contact between DCS and hospital staff had become less frequent as Washington decentralized program supervision. As part of Bright Start, DCS staff met with birth records and birthing staff in each of the demonstration hospitals to explain the importance of paternity establishment to families and to DCS. The meetings also allowed DCS to assess each hospital’s performance and to distribute performance benchmarks. Bright Start also provided updated videos and information booklets for hospitals to distribute to unmarried parents.
The Bright Start demonstration also sought to intervene directly at a suspected point of failure for many hospital paternity programs—namely, limited notary coverage. Notaries are required to verify the identity of affidavit signers. Through Bright Start, DCS worked with hospitals to ensure that a sufficient number of certified notaries are available to notarize affidavits during peak, workday hours and, to the extent possible, during off-peak night and weekend hours.
In the remainder of this chapter, we present our estimates for the overall “treatment effect” of the Bright Start intervention, present supporting analyses from a monthly survey of Bright Start hospitals, and conclude with a closer look the successes of Bright Start’s offer of notary training.
Page 3-2 September 2008 ECONorthwest/Lewin Group 2008 Bright Start Evaluation
IMPACTS ON IN-HOSPITAL PATERNITY ESTABLISHMENT
Although available data cannot support separate impact estimates for specific in-hospital interventions (e.g., notary training versus the new paternity video), we can reasonably attribute observed improvement in paternity establishment to changes in hospital programs rather than to the enhanced services offered by Bright Start. As described in the next chapter, the marriage education and parenting plan services offered through Bright Start never developed to any appreciable degree, and could not have had a measurable impact on paternity establishment rates. The offer of no-cost genetic testing, while popular with staff and patients, and successful by all accounts, was, nevertheless, not designed to impact the rate of hospital-based paternity establishment.
The analysis below relies primarily on DOH birth record data covering unmarried births during the period January 2004 through April 2008, covering 28 months prior to Bright Start implementation and 24 months post-implementation. We supplement the DOH data with responses to an online survey of program hospitals. ECONorthwest deployed the brief, web-based survey to gather data about the paternity affidavit program at each of the Bright Start hospitals. Evaluators reiterated the value of the survey data to hospital staff during each round of site visits and, although the hospitals responding varied by month, the overall response rate of about 75 percent provides confidence in conclusions based on the survey data.
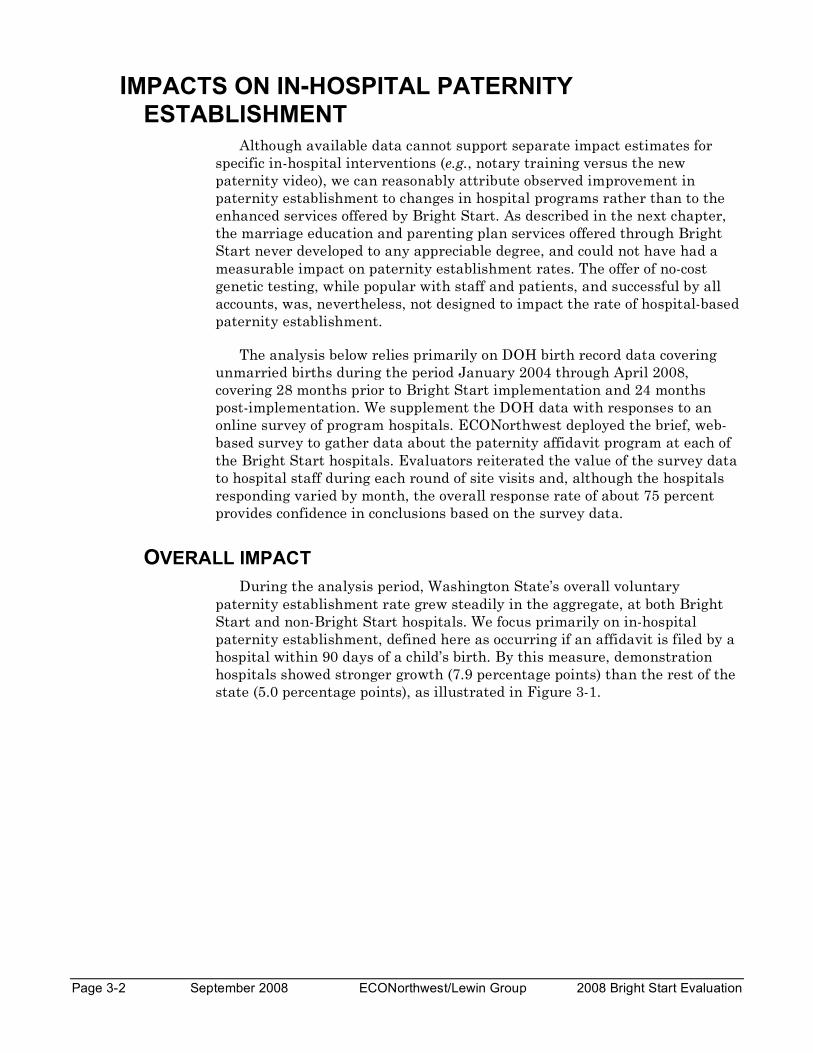
OVERALL IMPACT During the analysis period, Washington State’s overall voluntary
paternity establishment rate grew steadily in the aggregate, at both Bright Start and non-Bright Start hospitals. We focus primarily on in-hospital paternity establishment, defined here as occurring if an affidavit is filed by a hospital within 90 days of a child’s birth. By this measure, demonstration hospitals showed stronger growth (7.9 percentage points) than the rest of the state (5.0 percentage points), as illustrated in Figure 3-1.
2008 Bright Start Evaluation ECONorthwest/Lewin September 2008 Page 3-3
Figure 3-1: In-hospital paternity establishment rates, pre- and post-Bright Start implementation
Source: ECONorthwest analysis of Washington Department of Health birth record data.
The incremental gain demonstrated by the Bright Start hospitals of about three percentage points gives a rough “differences-in-differences” impact estimate for the program. This growth provides only indirect evidence of the program improvements fostered through Bright Start because the demonstration hospitals were not chosen randomly, and because numerous factors other than Bright Start may have affected paternity establishment during this time period (e.g., changing patient demographics). Thus, we cannot necessarily attribute all of the increase in establishment to the program.
We employed rigorous statistical analysis, based on the methods described in Chapter 2, to control for other factors that might have differed between Bright Start and non-Bright Start hospitals. The results support two conclusions:
• Full program implementation took time. Paternity establishment at the 16 demonstration hospitals grew no faster than the rest of the state for the first six months of Bright Start. Thereafter, the increase in paternity establishment rates at Bright Start hospitals averaged more than two percentage points higher than for all other hospitals. The relatively short demonstration period may understate the potential impact of implementing best practices statewide.
• Program impact varied considerably across hospitals. Four of the 16 hospitals outperformed the rest of the state. One additional
Page 3-4 September 2008 ECONorthwest/Lewin Group 2008 Bright Start Evaluation
hospital, Legacy Salmon Creek Hospital, performed well during Bright Start, but was not in operation prior to Bright Start. Growth in paternity establishment at the remaining hospitals was generally positive, but not significantly above the growth observed in non-Bright Start hospitals. Results from our monthly survey of hospital staff suggest that this variation is due, at least in part, to hospital effort and willingness to participate.
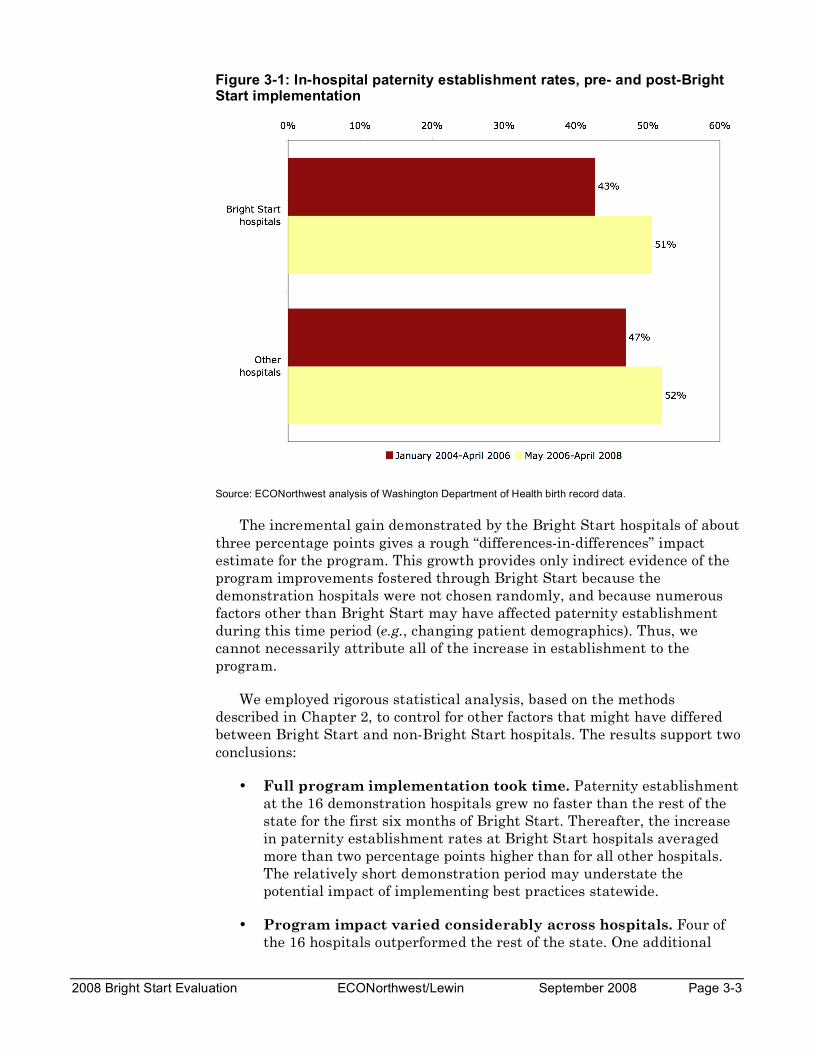
Figure 3-2 illustrates these findings. As a group, the four hospitals showing statistically significant improvement, relative to trend, during the Bright Start period were relative underperformers prior to Bright Start, but had caught up with the statewide average by the end of the demonstration. The group of hospitals for which we found no statistically meaningful improvement were average performers both pre- and post-implementation. The three hospitals demonstrating a statistically significant decline begin the demonstration as above average before the demonstration, but regressed to the statewide average after Bright Start began.
Figure 3-2: Ninety-day paternity establishment rates at Washington’s birthing hospitals by significance of program impact, January 2004-April 2008
Note: The shaded region identifies the time spanned by the Bright Start demonstration. Hospital establishment rates are weighted by number of unmarried births.
Source: ECONorthwest analysis of Washington Department of Health birth record data.
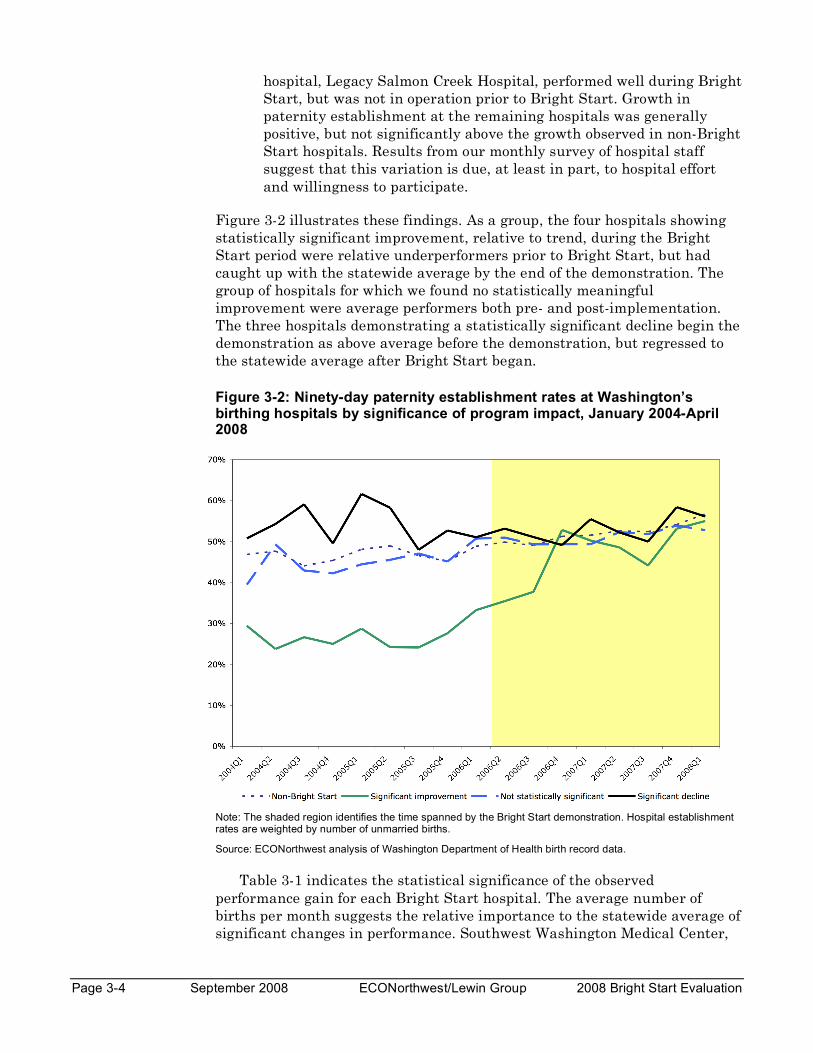
Table 3-1 indicates the statistical significance of the observed performance gain for each Bright Start hospital. The average number of births per month suggests the relative importance to the statewide average of significant changes in performance. Southwest Washington Medical Center,
2008 Bright Start Evaluation ECONorthwest/Lewin September 2008 Page 3-5
one of the state’s largest hospitals, accounts for a large share of the increase in paternity establishment across the Bright Start region, but other moderately sized hospitals also showed significant gains.
Table 3-1: Hospital size, improvement in paternity establishment, and statistical significance of improvement relative to the statewide trend for Bright Start hospitals
*Klickitat Valley stopped delivering babies in Summer 2007.
**Legacy Salmon Creek had no unmarried births prior to August 2005.
Notes: Births per month averaged over May 2006-April 2008. Improvement measured as the change in hospital-based paternity establishment within ninety days of birth between January 2004-April 2006 and May 2006-April 2008. “Significance” indicates whether the observed change is statistically meaningful and greater than (+) or less than (-) the increase attributable to the statewide trend.
Source: ECONorthwest analysis of Washington Department of Health birth record data.
As noted in Chapter 2, both hospitals and DCS field office staff frequently contact parents who have not established paternity after they have left the hospital. These “second efforts” result in a significant number of community establishments, although the DOH data do not identify whether a community establishment necessarily resulted from hospital or DCS follow-up efforts. The impact of Bright Start on overall paternity establishment will be less than the impact on in-hospital rates to the extent that Bright Start reduced community establishments. At a minimum, however, Bright Start would have accelerated establishment whenever parents submitted an affidavit through the hospital rather than after leaving the hospital.
HOSPITAL ATTENTION TO PATERNITY ESTABLISHMENT Our regression analysis alone cannot prove that the Bright Start
demonstration caused the increase in paternity establishment for unmarried births, but the pattern of survey responses supports this conclusion and is consistent with one of the overarching themes suggested by our analysis—
Hospital
Average
unmarried
births per
months
Improvement
(percentage
pts.)
Significance
Auburn Regional Medical Center 27 -0.2 -Good Samaritan Community Healthcare 38 -4.6
Harrison Medical Center, Silverdale 46 0.9 -Kittitas Valley Community Hospital 6 4.8
Klickitat Valley Health Services* 1 2.4
Legacy Salmon Creek Hospital** 31 N/A
Madigan Army Medical Hospital 6 0.4
Skyline Hospital 2 25.9 +St. Francis Hospital 25 -1.5 -PeaceHealth, St. John Medical Center 38 -0.8
St. Joseph Medical Center 93 7.0
Sunnyside Community Hospital 22 12.0 +Southwest Washington Medical Center 53 23.5 +Tacoma General Hospital 64 5.4
Toppenish Community Hospital 15 12.0 +Yakima Valley Memorial Hospital 63 3.5
All Others 1,008 4.6 N/A
Page 3-6 September 2008 ECONorthwest/Lewin Group 2008 Bright Start Evaluation
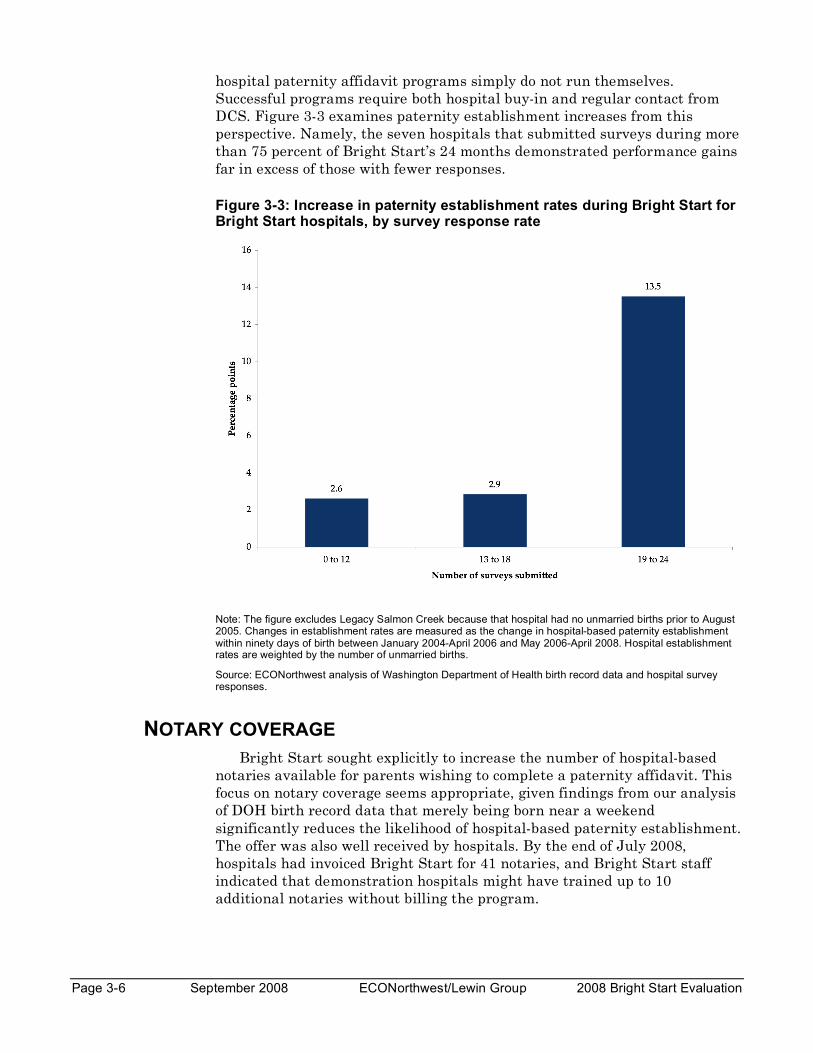
hospital paternity affidavit programs simply do not run themselves. Successful programs require both hospital buy-in and regular contact from DCS. Figure 3-3 examines paternity establishment increases from this perspective. Namely, the seven hospitals that submitted surveys during more than 75 percent of Bright Start’s 24 months demonstrated performance gains far in excess of those with fewer responses.
Figure 3-3: Increase in paternity establishment rates during Bright Start for Bright Start hospitals, by survey response rate
Note: The figure excludes Legacy Salmon Creek because that hospital had no unmarried births prior to August 2005. Changes in establishment rates are measured as the change in hospital-based paternity establishment within ninety days of birth between January 2004-April 2006 and May 2006-April 2008. Hospital establishment rates are weighted by the number of unmarried births.
Source: ECONorthwest analysis of Washington Department of Health birth record data and hospital survey responses.
NOTARY COVERAGE Bright Start sought explicitly to increase the number of hospital-based
notaries available for parents wishing to complete a paternity affidavit. This focus on notary coverage seems appropriate, given findings from our analysis of DOH birth record data that merely being born near a weekend significantly reduces the likelihood of hospital-based paternity establishment. The offer was also well received by hospitals. By the end of July 2008, hospitals had invoiced Bright Start for 41 notaries, and Bright Start staff indicated that demonstration hospitals might have trained up to 10 additional notaries without billing the program.
2008 Bright Start Evaluation ECONorthwest/Lewin September 2008 Page 3-7
Hospital invoices do not, however, indicate the extent to which notaries are available to patients during off-hours, and turnover may have reduced coverage even at hospitals that billed Bright Start for notary training. While the total reported number of notaries at the 16 hospitals increased from just over 50 at the beginning of the demonstration to 80 or more during the final year of services, even averaging the total over three-month periods leaves variations of 10 percent or more from period to period (see Table 3-2).
Table 3-2: Number of notaries reported by Bright Start hospitals, May 2006-April 2008
QuarterNumber of Notaries
(3-month average)
May-Jul 06 52
Aug-Oct 06 67
Nov 06-Jan 07 73
Feb-Apr 07 71
May-Jul 07 82
Aug-Oct 07 88
Nov 07-Jan 08 78
Feb-Apr 08 80
Source: ECONorthwest analysis of Washington Department of Health birth record data and hospital survey responses.
We did not have access to comprehensive data on notary coverage at Washington’s birthing hospitals, but the hospital survey responses nonetheless provide supporting evidence that better notary coverage can indeed improve hospital performance. In particular, having more notaries available is less important than having at least one notary available during more hours of the week. In theory having more notaries available should be more important for larger hospitals. However, we were unable to uncover any meaningful relationship between the number of notaries per unmarried birth and paternity establishment.
It is possible that the small number of hospitals surveyed and reporting errors obscure an important relationship. On the other hand, each paternity affidavit requires relatively little notary time and the number of unmarried births occurring on any given day is small, even at large hospitals. In this context, having at least one notary available to parents at any given time likely provides nearly as much benefit as would access to a pool of notaries. Differences in hospital size and patient populations caution against direct comparison of reported notary coverage and paternity establishment.
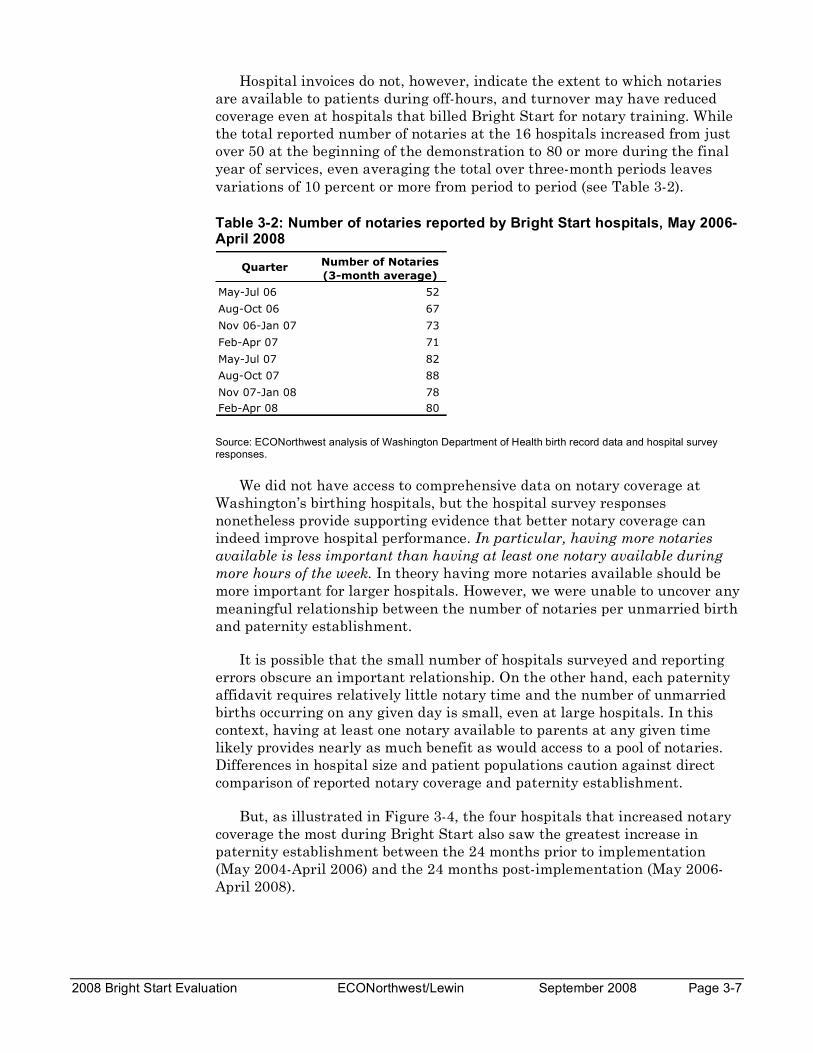
But, as illustrated in Figure 3-4, the four hospitals that increased notary coverage the most during Bright Start also saw the greatest increase in paternity establishment between the 24 months prior to implementation (May 2004-April 2006) and the 24 months post-implementation (May 2006-April 2008).
Page 3-8 September 2008 ECONorthwest/Lewin Group 2008 Bright Start Evaluation
Figure 3-4: Increase in paternity establishment rate at Bright Start hospitals, by reported increase in notary coverage in hours per week
Note: The figure excludes Legacy Salmon Creek because that hospital had no unmarried births prior to August 2005. Changes in establishment rates are measured as the change in hospital-based paternity establishment within ninety days of birth between January 2004-April 2006 and May 2006-April 2008. Notary coverage measured between May-July 2006 and February-April 2008. Hospital establishment rates are weighted by number of unmarried births.
Source: ECONorthwest analysis of Washington Department of Health birth record data and hospital survey responses.
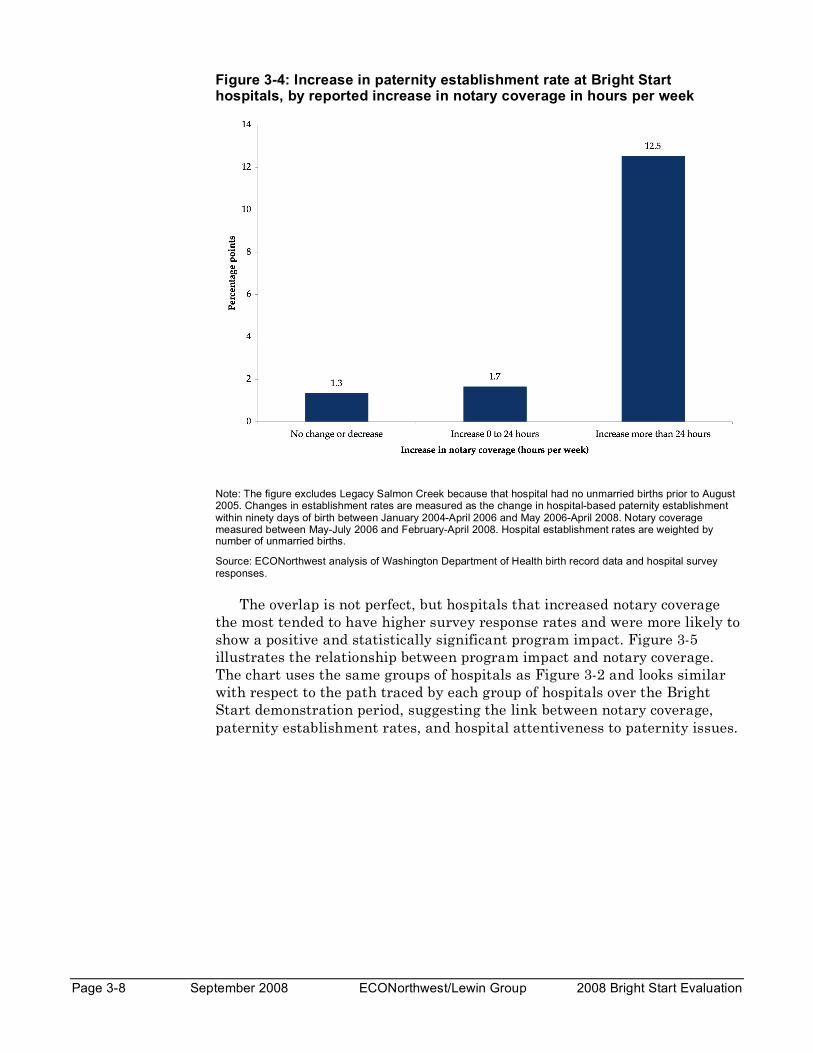
The overlap is not perfect, but hospitals that increased notary coverage the most tended to have higher survey response rates and were more likely to show a positive and statistically significant program impact. Figure 3-5 illustrates the relationship between program impact and notary coverage. The chart uses the same groups of hospitals as Figure 3-2 and looks similar with respect to the path traced by each group of hospitals over the Bright Start demonstration period, suggesting the link between notary coverage, paternity establishment rates, and hospital attentiveness to paternity issues.
2008 Bright Start Evaluation ECONorthwest/Lewin September 2008 Page 3-9
Figure 3-5: Change in notary coverage for Bright Start hospitals, by significance of program impact
Source: ECONorthwest analysis of Washington Department of Health birth record data and hospital survey responses.
CONCLUSION Overall, the data suggest that Bright Start had modest success in
improving hospital-based paternity establishment rates. A closer inspection, however, reveals more dramatic improvement at several formerly underperforming hospitals. Although we cannot prove causation, birth record data and responses to our hospital survey support that Bright Start had the greatest impact where hospitals had the most room to improve and were willing and able to work towards improvement. We use survey response rates and increase in notary coverage as proxies for hospital efforts to improve. Notary coverage in particular likely played an important role in the observed performance improvements.

Page 3-10 September 2008 ECONorthwest/Lewin Group 2008 Bright Start Evaluation
2008 Bright Start Evaluation ECONorthwest/Lewin September 2008 Page 4-1
Feasibility and Efficacy of Chapter 4 Expanded Services
BACKGROUND Voluntary in-hospital paternity establishment programs work because the
postpartum hospital stay is the right time to ask a father to legally make a connection to his newborn child. A majority of unmarried fathers are present at the hospital and, if asked, the majority of those present attest to paternity. A key goal of the Bright Start demonstration was to determine whether other, complementary services might also be appropriate at the time of a child’s birth.
In conceiving the expanded services, DCS managers looked for informal, non-judicial approaches that could reduce future conflict between parents of newborns. Bright Start eventually selected three services:
• Genetic testing. DCS managers recognized that not all mothers were certain about the paternity of their newborn. Hospital staff had few, if any, suggestions for mothers who declined to sign an affidavit because of uncertainty about paternity. Consequently, DCS staff viewed the offer of no-cost genetic tests as a logical complement to the affidavit program. The offer could eliminate some inappropriate affidavits signed by men who are not biological fathers and could encourage additional affidavits among men who, before the test, were uncertain about paternity.
• Parenting plans. The issues of child support, custody, and visitation are inextricably linked in the minds of parents but can involve separate legal and administrative processes. DCS managers believed that an appreciable share of unwed parents would be interested in no-cost mediation services to develop parenting plans. The plans would govern custody and visitation issues for the child. Developing such plans requires time and legal expertise that is too expensive for many parents to afford, so DCS managers anticipated great interest in the service.
• Marriage education. In the early 2000s, the US Department of Health and Human Services (US DHHS) launched its Healthy Marriage Initiative, which sought to fund education programs that would teach relationship and parenting skills. Coincident with the beginning of the Bright Start grant, US DHHS funded two marriage education programs in Washington State. DCS managers selected Bright Start’s demonstration regions to overlap with the emerging marriage programs and expected that some unwed parents would express interest and participate.
Page 4-2 September 2008 ECONorthwest/Lewin Group 2008 Bright Start Evaluation
At the outset of the Bright Start demonstration, DCS managers had no data on the potential popularity of any of the services. While Texas was operating a pilot program on in-hospital genetic tests, their findings had not been disseminated. And no state had experience offering parenting plans or marriage education to new parents in hospitals. During a pre-implementation conference, Bright Start’s manager queried a group of DCS field staff and nurses about interest in the services. Guesses varied widely, but child support and hospital staff believed the genetic testing and parenting plans would be more popular than marriage education. On average, staff believed 1 in 5 couples would request a genetic test, and another 1 in 5 couples would request help with a parenting plan. Couples requesting a genetic test would not be offered a parenting plan. Staff did not anticipate strong interest in marriage education and predicted only 1 in 20 eligible couples would take up the offer.
The balance of this chapter examines the successes and challenges associated with the implementation of each service. Of the three, only genetic tests proved sufficiently popular for consideration as a permanent feature of Washington’s voluntary paternity affidavit program.
GENETIC TESTING Giving couples the opportunity to resolve uncertainty about paternity
through no-cost genetic testing could provide paternity affidavit programs two complimentary benefits. First, men confirmed as a child’s biological father may be more likely to sign a paternity affidavit upon receiving test results. On the other hand, men excluded as the biological father would be unlikely to inappropriately acknowledge paternity. The certainty provided through testing could thus improve outcomes for a family regardless of the test result. To avoid situations where parents who are already certain about paternity request a test simply because it is free, Bright Start instructed hospital staff to offer the test only when parents expressed uncertainty about paternity. If a couple chose not to complete an affidavit, however, hospitals were to offer testing information without further questioning.
Bright Start forwarded completed test requests to its testing provider, LabCorp. LabCorp was responsible for scheduling the test at a location reasonably near the parents. They regularly scheduled tests at twelve sites across the Fife, Tacoma, and Vancouver regions, but travel may nonetheless have presented a barrier for some parents—Bright Start was not able to find a site in the Yakima region until 2008.
Bright Start paid the state rate of about $126 for each test, a considerable savings over the $600 or so an individual would have to pay for a similar service. Bright Start staff provided the man who is tested with a paternity affidavit and an information booklet entitled Establish Paternity for Your Child’s Sake to encourage voluntary paternity establishment if paternity is confirmed.
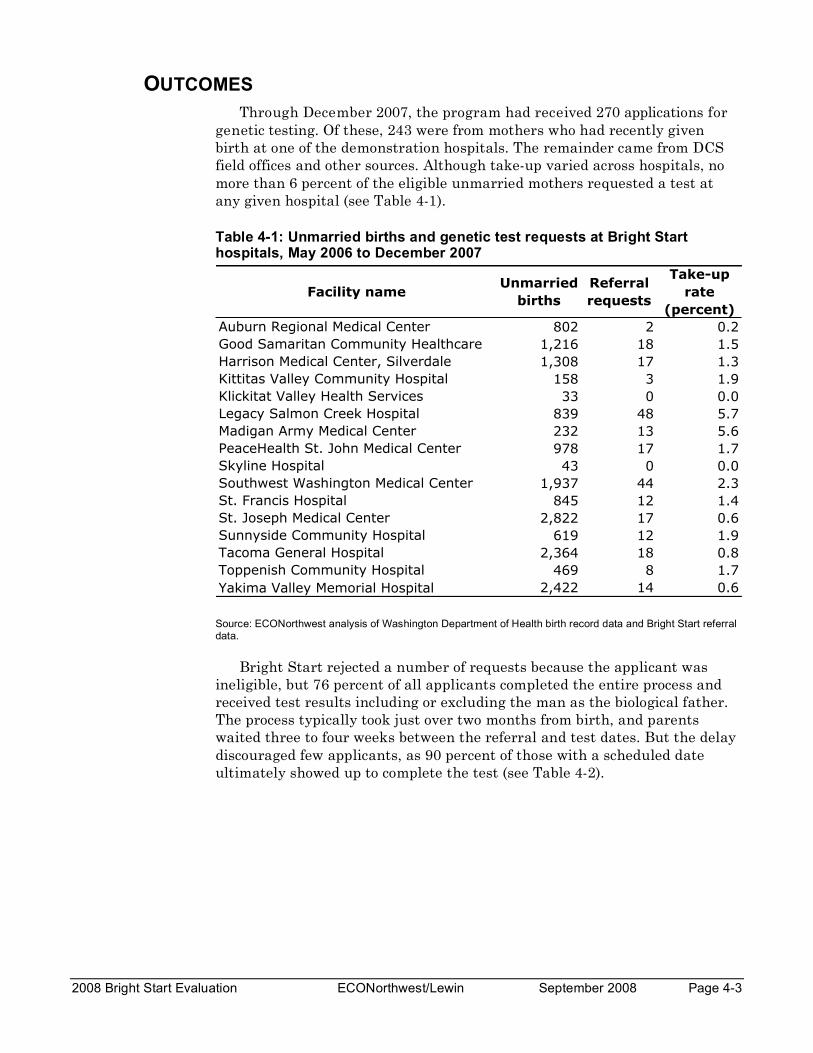
2008 Bright Start Evaluation ECONorthwest/Lewin September 2008 Page 4-3
OUTCOMES Through December 2007, the program had received 270 applications for
genetic testing. Of these, 243 were from mothers who had recently given birth at one of the demonstration hospitals. The remainder came from DCS field offices and other sources. Although take-up varied across hospitals, no more than 6 percent of the eligible unmarried mothers requested a test at any given hospital (see Table 4-1).
Table 4-1: Unmarried births and genetic test requests at Bright Start hospitals, May 2006 to December 2007
Facility nameUnmarried
births
Referral
requests
Take-up
rate
(percent)
Auburn Regional Medical Center 802 2 0.2
Good Samaritan Community Healthcare 1,216 18 1.5
Harrison Medical Center, Silverdale 1,308 17 1.3
Kittitas Valley Community Hospital 158 3 1.9
Klickitat Valley Health Services 33 0 0.0
Legacy Salmon Creek Hospital 839 48 5.7
Madigan Army Medical Center 232 13 5.6
PeaceHealth St. John Medical Center 978 17 1.7
Skyline Hospital 43 0 0.0
Southwest Washington Medical Center 1,937 44 2.3
St. Francis Hospital 845 12 1.4
St. Joseph Medical Center 2,822 17 0.6
Sunnyside Community Hospital 619 12 1.9
Tacoma General Hospital 2,364 18 0.8
Toppenish Community Hospital 469 8 1.7
Yakima Valley Memorial Hospital 2,422 14 0.6
Source: ECONorthwest analysis of Washington Department of Health birth record data and Bright Start referral data.
Bright Start rejected a number of requests because the applicant was ineligible, but 76 percent of all applicants completed the entire process and received test results including or excluding the man as the biological father. The process typically took just over two months from birth, and parents waited three to four weeks between the referral and test dates. But the delay discouraged few applicants, as 90 percent of those with a scheduled date ultimately showed up to complete the test (see Table 4-2).
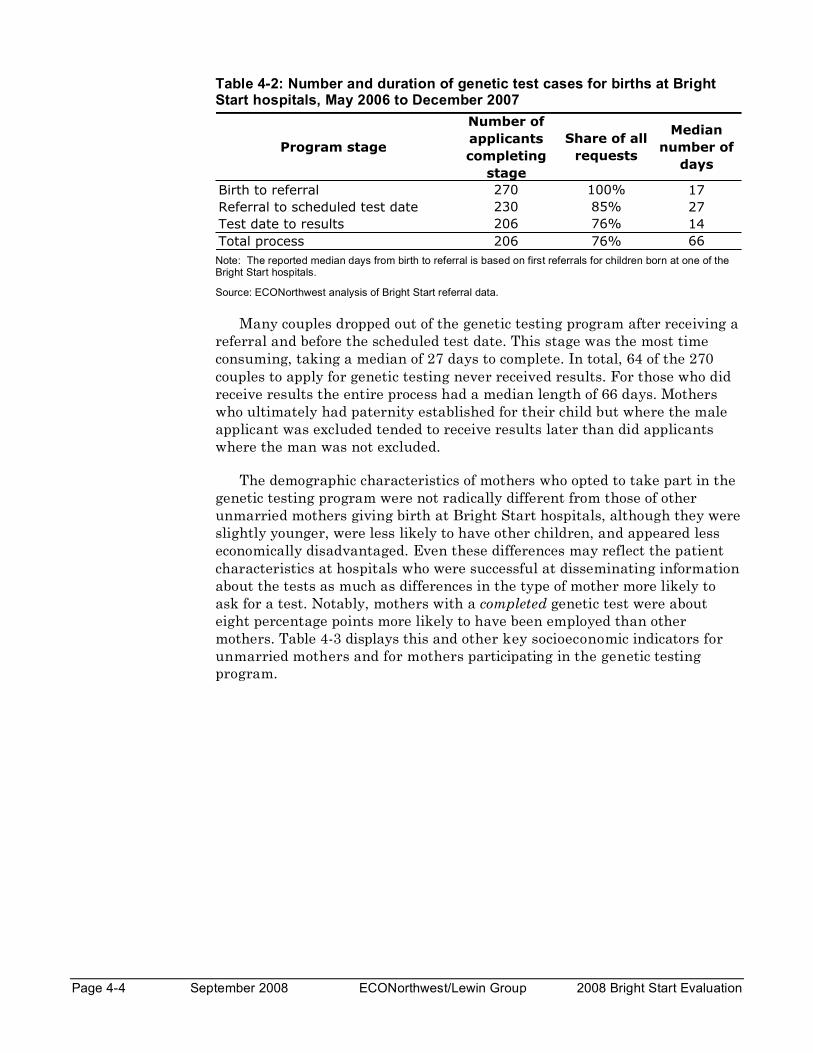
Page 4-4 September 2008 ECONorthwest/Lewin Group 2008 Bright Start Evaluation
Table 4-2: Number and duration of genetic test cases for births at Bright Start hospitals, May 2006 to December 2007
Note: The reported median days from birth to referral is based on first referrals for children born at one of the Bright Start hospitals.
Source: ECONorthwest analysis of Bright Start referral data.
Many couples dropped out of the genetic testing program after receiving a referral and before the scheduled test date. This stage was the most time consuming, taking a median of 27 days to complete. In total, 64 of the 270 couples to apply for genetic testing never received results. For those who did receive results the entire process had a median length of 66 days. Mothers who ultimately had paternity established for their child but where the male applicant was excluded tended to receive results later than did applicants where the man was not excluded.
The demographic characteristics of mothers who opted to take part in the genetic testing program were not radically different from those of other unmarried mothers giving birth at Bright Start hospitals, although they were slightly younger, were less likely to have other children, and appeared less economically disadvantaged. Even these differences may reflect the patient characteristics at hospitals who were successful at disseminating information about the tests as much as differences in the type of mother more likely to ask for a test. Notably, mothers with a completed genetic test were about eight percentage points more likely to have been employed than other mothers. Table 4-3 displays this and other key socioeconomic indicators for unmarried mothers and for mothers participating in the genetic testing program.
Program stage
Number of
applicants
completing
stage
Share of all
requests
Median
number of
days
Birth to referral 270 100% 17
Referral to scheduled test date 230 85% 27
Test date to results 206 76% 14
Total process 206 76% 66
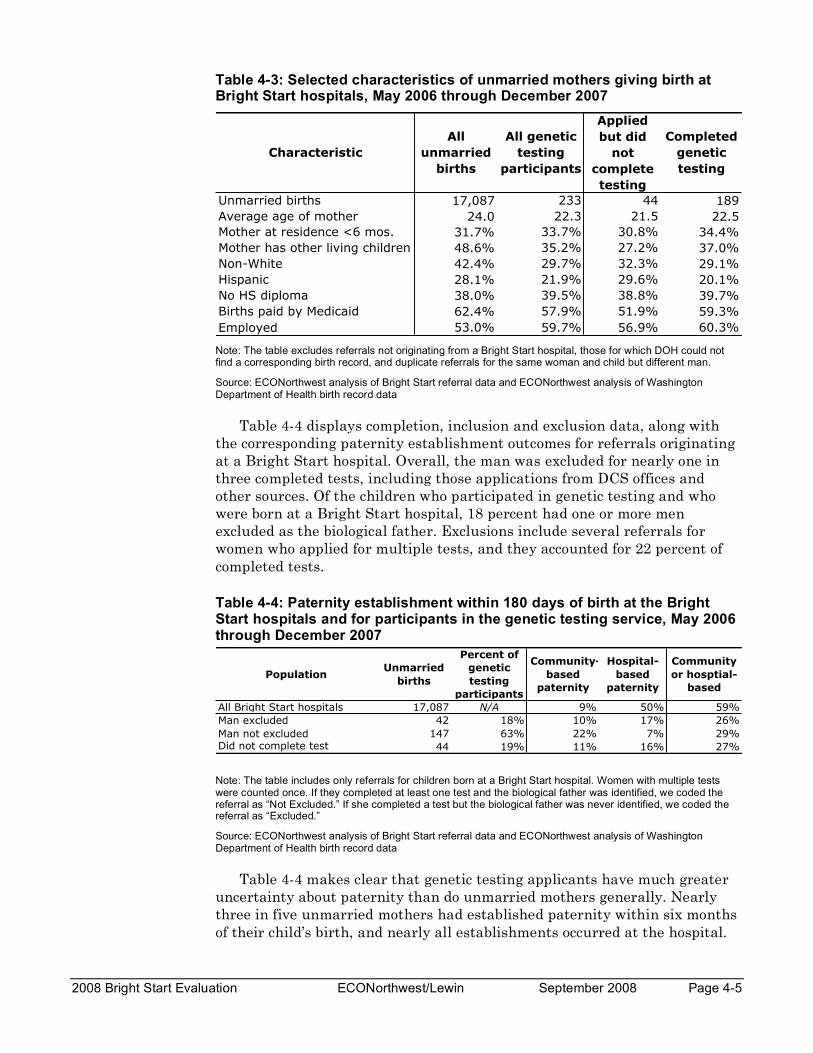
2008 Bright Start Evaluation ECONorthwest/Lewin September 2008 Page 4-5
Table 4-3: Selected characteristics of unmarried mothers giving birth at Bright Start hospitals, May 2006 through December 2007
Characteristic
All
unmarried
births
All genetic
testing
participants
Applied
but did
not
complete
testing
Completed
genetic
testing
Unmarried births 17,087 233 44 189
Average age of mother 24.0 22.3 21.5 22.5
Mother at residence <6 mos. 31.7% 33.7% 30.8% 34.4%
Mother has other living children 48.6% 35.2% 27.2% 37.0%
Non-White 42.4% 29.7% 32.3% 29.1%
Hispanic 28.1% 21.9% 29.6% 20.1%
No HS diploma 38.0% 39.5% 38.8% 39.7%
Births paid by Medicaid 62.4% 57.9% 51.9% 59.3%
Employed 53.0% 59.7% 56.9% 60.3%
Note: The table excludes referrals not originating from a Bright Start hospital, those for which DOH could not find a corresponding birth record, and duplicate referrals for the same woman and child but different man.
Source: ECONorthwest analysis of Bright Start referral data and ECONorthwest analysis of Washington Department of Health birth record data
Table 4-4 displays completion, inclusion and exclusion data, along with the corresponding paternity establishment outcomes for referrals originating at a Bright Start hospital. Overall, the man was excluded for nearly one in three completed tests, including those applications from DCS offices and other sources. Of the children who participated in genetic testing and who were born at a Bright Start hospital, 18 percent had one or more men excluded as the biological father. Exclusions include several referrals for women who applied for multiple tests, and they accounted for 22 percent of completed tests.
Table 4-4: Paternity establishment within 180 days of birth at the Bright Start hospitals and for participants in the genetic testing service, May 2006 through December 2007
PopulationUnmarried
births
Percent of
genetic
testing
participants
Community-
based
paternity
Hospital-
based
paternity
Community
or hosptial-
based
All Bright Start hospitals 17,087 N/A 9% 50% 59%
Man excluded 42 18% 10% 17% 26%
Man not excluded 147 63% 22% 7% 29%Did not complete test 44 19% 11% 16% 27%
Note: The table includes only referrals for children born at a Bright Start hospital. Women with multiple tests were counted once. If they completed at least one test and the biological father was identified, we coded the referral as “Not Excluded.” If she completed a test but the biological father was never identified, we coded the referral as “Excluded.”
Source: ECONorthwest analysis of Bright Start referral data and ECONorthwest analysis of Washington Department of Health birth record data
Table 4-4 makes clear that genetic testing applicants have much greater uncertainty about paternity than do unmarried mothers generally. Nearly three in five unmarried mothers had established paternity within six months of their child’s birth, and nearly all establishments occurred at the hospital.

Page 4-6 September 2008 ECONorthwest/Lewin Group 2008 Bright Start Evaluation
In contrast, less than 30 percent of testing participants had established paternity through an administrative process within six months (see Figure 4-1). The genetic testing also apparently resolved a significant amount of uncertainty, as mothers for whom a man was identified as the biological father established paternity through a DCS office or other community resource at a much higher rate (22 percent) than did all unmarried mothers (9 percent).
The sample size is too small to draw firm conclusions about how paternity establishment varies by testing outcome, but the data are suggestive. When a man was identified as the biological father, the rate of community-based paternity was about twice that for all unmarried births. When the biological father was not identified, the rate was equal to the overall average. Presumably, the excluded men were not signing the affidavits in the few cases where paternity was established. Intriguingly, in-hospital paternity establishment was relatively more frequent when testing had not identified the biological father than when the father was determined. Again, however, this result is likely due to small sample sizes rather than a quirk in the in-hospital process.
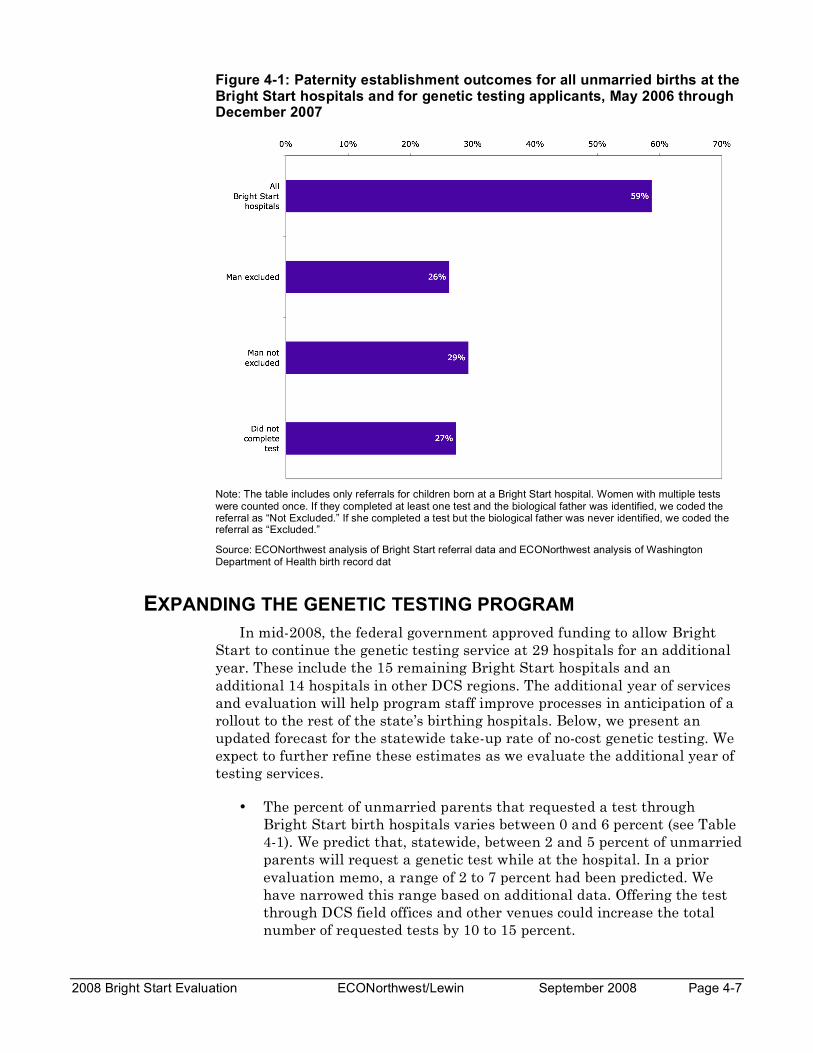
2008 Bright Start Evaluation ECONorthwest/Lewin September 2008 Page 4-7
Figure 4-1: Paternity establishment outcomes for all unmarried births at the Bright Start hospitals and for genetic testing applicants, May 2006 through December 2007
Note: The table includes only referrals for children born at a Bright Start hospital. Women with multiple tests were counted once. If they completed at least one test and the biological father was identified, we coded the referral as “Not Excluded.” If she completed a test but the biological father was never identified, we coded the referral as “Excluded.”
Source: ECONorthwest analysis of Bright Start referral data and ECONorthwest analysis of Washington Department of Health birth record dat
EXPANDING THE GENETIC TESTING PROGRAM In mid-2008, the federal government approved funding to allow Bright
Start to continue the genetic testing service at 29 hospitals for an additional year. These include the 15 remaining Bright Start hospitals and an additional 14 hospitals in other DCS regions. The additional year of services and evaluation will help program staff improve processes in anticipation of a rollout to the rest of the state’s birthing hospitals. Below, we present an updated forecast for the statewide take-up rate of no-cost genetic testing. We expect to further refine these estimates as we evaluate the additional year of testing services.
• The percent of unmarried parents that requested a test through Bright Start birth hospitals varies between 0 and 6 percent (see Table 4-1). We predict that, statewide, between 2 and 5 percent of unmarried parents will request a genetic test while at the hospital. In a prior evaluation memo, a range of 2 to 7 percent had been predicted. We have narrowed this range based on additional data. Offering the test through DCS field offices and other venues could increase the total number of requested tests by 10 to 15 percent.

Page 4-8 September 2008 ECONorthwest/Lewin Group 2008 Bright Start Evaluation
• Unmarried births in Washington have grown rapidly at an annual rate of 7 to 8 percent over the last two years, although this rapid growth will not continue indefinitely. If, however, growth continues at this rate through 2009, Washington should expect up to 33,000 unmarried births in 2008 and up to 36,000 in 2009, generating between 1,000 completed tests (2 percent application rate and 75% completion rate) and 2,600 completed tests (5 percent application rate and 75% completion rate).
PARENTING PLANS Bright Start offered unmarried parents who signed a Washington State
Paternity Affidavit form the opportunity to create a parenting plan. Bright Start referred interested parents to a trained mediator at a county dispute resolution center. The trained DRC mediators facilitated three-to-four hour sessions, and multiple sessions were needed in some cases. Parenting plans typically address:1
• The child’s residential schedule, which establishes where the child resides each day of the year, including provisions for holidays, birthdays of family members, and delineates what contact the child will have with each parent. The residential schedule also determines who is designated as the child’s custodial parent.
• The child’s school schedule, which establishes which parent the child will reside with for the purposes of school enrollment, as well as the schedule for school breaks.
• Transportation arrangements, which determine how the child will be transported between and during visits with parents.
• Sharing of information about the child. The parenting plan can detail each parent’s rights to information about the wellbeing of the child, including access to copies of report cards, school meeting notices, results of standardized tests, and communications from healthcare providers.
• Special events. The plan can spell out a parent’s rights to attend extracurricular activities (e.g., sports or music recitals) when the child is not residing with that parent.
• Telephone contact with the nonresident parent. The plan can establish a parent’s right to contact a child when the child is residing with the other parent.
1 Descriptions are drawn from the Pierce County DRC’s Instructional Teaching Tool.
2008 Bright Start Evaluation ECONorthwest/Lewin September 2008 Page 4-9
The mediators keep the information from sessions confidential and destroy any notes. In addition, mediators may not be subpoenaed to appear in court. Selected mediators must complete an extensive training process that usually lasts more than a year to be certified to provide services through their agencies.
Bright Start covered the cost of a full mediation session ($400) and reimbursed DRCs $50 for each applicant couple that did not show at their appointment. Couples that completed the plans and wanted to formally file them in court were responsible for paying the associated filing fees.
OUTCOMES During the rollout of Bright Start, interviews with hospital staff revealed strong support for the parenting plan component of the initiative. Almost all staff agreed that many parents could benefit from a formalized parenting plan. However, this enthusiasm was tempered with predictions that the take-up rate for services would be relatively low. Staff suggested that many parents would be preoccupied at the time of the birth and may not be thinking about longer-term parenting issues. Similarly, staff suggested that many parents, especially the younger ones, would not follow through with the time-intensive steps required to establish a plan.
These predictions proved accurate. During May 2006-December 2007, only 16 applications for parenting plans originated from demonstration hospitals (see Table 4-5). Of the hospital-related applications, only five couples worked through the entire mediation process and developed a parenting plan.
Because of the weak demand, Bright Start managers extended the offer of the parenting plan services beyond hospitals. DCS and Community Service Office (CSO) staff offered mediation services to parents, and Bright Start sent letters offering the mediation services to a sample of parents with young children already in the child support system. Together, these special efforts generated 43 applications through December 2007. Only eight of these applicant-couples ultimately completed parenting plans.
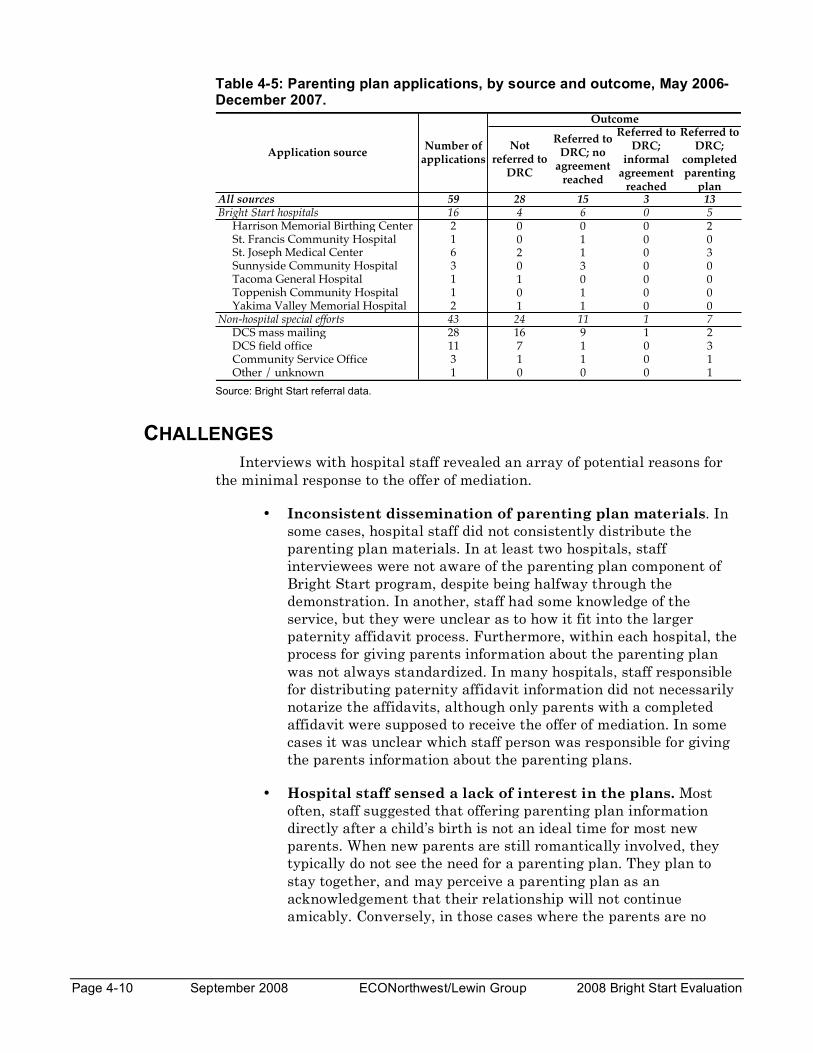
Page 4-10 September 2008 ECONorthwest/Lewin Group 2008 Bright Start Evaluation
Table 4-5: Parenting plan applications, by source and outcome, May 2006-December 2007.
Source: Bright Start referral data.
CHALLENGES Interviews with hospital staff revealed an array of potential reasons for
the minimal response to the offer of mediation.
• Inconsistent dissemination of parenting plan materials. In some cases, hospital staff did not consistently distribute the parenting plan materials. In at least two hospitals, staff interviewees were not aware of the parenting plan component of Bright Start program, despite being halfway through the demonstration. In another, staff had some knowledge of the service, but they were unclear as to how it fit into the larger paternity affidavit process. Furthermore, within each hospital, the process for giving parents information about the parenting plan was not always standardized. In many hospitals, staff responsible for distributing paternity affidavit information did not necessarily notarize the affidavits, although only parents with a completed affidavit were supposed to receive the offer of mediation. In some cases it was unclear which staff person was responsible for giving the parents information about the parenting plans.
• Hospital staff sensed a lack of interest in the plans. Most often, staff suggested that offering parenting plan information directly after a child’s birth is not an ideal time for most new parents. When new parents are still romantically involved, they typically do not see the need for a parenting plan. They plan to stay together, and may perceive a parenting plan as an acknowledgement that their relationship will not continue amicably. Conversely, in those cases where the parents are no
Not referred to
DRC
Referred to DRC; no
agreement reached
Referred to DRC;
informal agreement
reached
Referred to DRC;
completed parenting
planAll sources 59 28 15 3 13
Bright Start hospitals 16 4 6 0 5 Harrison Memorial Birthing Center 2 0 0 0 2 St. Francis Community Hospital 1 0 1 0 0 St. Joseph Medical Center 6 2 1 0 3 Sunnyside Community Hospital 3 0 3 0 0 Tacoma General Hospital 1 1 0 0 0 Toppenish Community Hospital 1 0 1 0 0 Yakima Valley Memorial Hospital 2 1 1 0 0Non-hospital special efforts 43 24 11 1 7 DCS mass mailing 28 16 9 1 2 DCS field office 11 7 1 0 3 Community Service Office 3 1 1 0 1 Other / unknown 1 0 0 0 1
Outcome
Application sourceNumber of
applications
2008 Bright Start Evaluation ECONorthwest/Lewin September 2008 Page 4-11
longer in a relationship, staff suggested that the mother often does not want the father involved in the child’s life.
Regardless of the relationship status of the parents, staff expressed concern that new parents are unlikely to be receptive to parenting plan services immediately following the birth. Many parents are overwhelmed with the birth experience and, in preparing for the immediate needs of the child (e.g., how to breastfeed, setting up the baby’s room), they are not focused on either the long-term challenges associated with being a parent or on the potential benefit of a parenting plan. Staff suggested that parents would be more receptive to parenting plan information either before the birth (e.g., pre-natal visits) or several months following the birth when the new parents’ lives will likely have become slightly less hectic.
Challenges with the parenting plans did not end with outreach at the hospital. Once a couple applied for services, the DRC had difficulty getting both parties to agree to a mediation time. Mediators admitted that developing parenting plans for unwed parents was uncommon and proved surprisingly difficult. They listed a number of reasons why never-married parents may be inherently more difficult to work with than divorced parents, including:
• Unwed parents are less likely to have had joint problem-solving experiences. Unlike divorced parents, unwed parents were never a “team” to begin with and may have little or no history attempting to work together to solve problems. As one mediator put it “the parents lack a ‘couples’ dynamic.”
• Many unwed mothers were unwilling to participate in a voluntary process. Bright Start staff and mediators reported that interest in parenting plans was often one-sided and initiated by the father. Some mothers had no interest in continuing a relationship with the father and in the voluntary Bright Start framework, the father had no means of compelling the mother’s participation. Given the difficulty in securing participation, one DRC director concluded that formal court-based referrals may be only viable approach for interested fathers to develop a parenting plan.
• Time intensity of the mediation session proved challenging for parents. Most applicant parents had low incomes and inflexible work schedules. So, even though Bright Start paid the full cost of the mediation services, the parents still potentially faced the additional costs of lost wages, childcare, and transportation.
• Fully subsidized mediation may have devalued the service. Some DRC representatives suspect that because parents were not
Page 4-12 September 2008 ECONorthwest/Lewin Group 2008 Bright Start Evaluation
expected to pay anything for the mediation, they may have perceived the service to be of little or no value, suggesting that requiring a nominal co-payment might have increased interest and participation.
MARRIAGE EDUCATION Bright Start intended to offer referrals to marriage education services for
those couples that signed the paternity affidavit and expressed an interest. Bright Start’s ability to offer these referrals was contingent on the availability of appropriate marriage education programs in the hospital catchment areas. By the originally scheduled end of the demonstration, Bright Start had not been able to recruit a viable marriage education provider to serve interested parents.
Bright Start staff expected to leverage existing marriage education services in counties in two of the four target regions: Pierce County (Tacoma region) and Yakima County (Yakima region). Washington was one of 13 states to receive a Section 1115 waiver from the federal Administration for Children and Families (ACF) to operate a healthy marriage initiative using child support funds. ACF funded two sites in Washington—Lakewood (Pierce County) and Yakima.
As documented in the initial process study, neither site was operational when Bright Start began offering services in 2006. Bright Start staff maintained contact with the program managers at both sites in the hope of beginning referrals once the sites were operating. However, several barriers arose that prevented Bright Start from providing any referrals to these programs.
For both sites, delays in the rollout of marriage education services created the primary impediment. The Yakima program manager did not anticipate offering services before Spring 2007. The Lakewood program did begin offering services, but the site had limited capacity (only two trainers, classes are only offered once a week with sessions beginning approximately every other month). Furthermore, the Lakewood program manager was initially concerned that the terms and conditions of the federal waiver limited marriage education services to residents of Lakewood. Because there is no birthing hospital in Lakewood, few unmarried parents were expected to be eligible for the marriage education services. More recently, the Lakewood site received federal guidance that it can expand its catchment area to include the “greater Lakewood area.” However, Bright Start staff remained concerned that even with the broader criterion, only a small proportion of parents would be eligible and that hospitals would have difficulty identifying the few eligible couples.
Bright Start staff pursued several other options for marriage education when it became clear that the Lakewood and Yakima programs were not viable options. Conversations with several private marriage education providers in areas being served by Bright Start failed to produce any feasible
2008 Bright Start Evaluation ECONorthwest/Lewin September 2008 Page 4-13
options. In addition, Bright Start staff considered the possibility of providing written marriage education information to interested parents. However, after reviewing several different books and curricula, they decided against this option as well. In addition to concerns that few couples would read the materials provided, Bright Start staff had some difficulty finding materials appropriate for unmarried couples.
CONCLUSION Bright Start offered three services to enhance the standard in-hospital
paternity affidavit program. At the conclusion of the three-year demonstration period, no-cost genetic testing had proven successful enough to secure federal approval for an additional year of services and evaluation research. The offer of parenting plan mediation services for parents who signed an affidavit at the hospital proved valuable to a handful of couples, but was considered only marginally successful overall, in large part because the timing of the offer did not align well with parents’ needs. Bright Start never offered the final service, marriage education, because providers were not ready to accept Bright Start referrals during the demonstration.

Page 4-14 September 2008 ECONorthwest/Lewin Group 2008 Bright Start Evaluation
2008 Bright Start Evaluation ECONorthwest/Lewin September 2008 Page 5-1
Findings, Lessons Learned Chapter 5 and Recommendations
BRIGHT START’S FINDINGS The Bright Start project sought to demonstrate that a renewed and
reinvigorated relationship with hospital staff could measurably improve rates of in-hospital paternity establishment. The project also sought to test the feasibility and demand for three complementary services that could be offered during a hospital stay: genetic testing, parenting plans, and marriage education. Broadly speaking, the demonstration accomplished these goals and, in doing so, exposed a number of important issues for DCS management to consider as the demonstration comes to a conclusion.
Bright Start had some success in improving rates of in-hospital paternity establishment. Establishment rates improved significantly, relative to the state’s non-Bright Start hospitals, in four facilities. DCS’s hypothesis that notary availability was a key driver of establishment rates proved accurate. However, Bright Start was generally unsuccessful in turning average-performing hospitals into above average performers. In hospitals that were already establishing paternity for half or more of their unwed parents, the demonstration simply didn’t translate into increased effort despite stated support by hospital staff.
Looking at Bright Start’s related services, genetic testing proved attractive to a small and but important share of unwed couples and was met with near-universal support of hospital staff. An application process and the typical three- to four-week wait for a a testing appointment did not deter most interested couples. Bright Start’s efforts to offer parenting plans and marriage education were considerably less successful and neither is candidate for post-demonstration implementation. For parenting plans, the hospital environment proved to be the wrong time and place to introduce concepts of visitation and custody. Even subsequent offers through mass mailings by DCS field offices generated little interest among unwed parents with older children. Marriage education referrals never materialized because Yakima and Lakewood-based providers simply weren’t up and running in time to serve the demonstration. But even if the marriage education programs had been operational, hospital staff expressed some hesitation in participating during Bright Start’s rollout.
The balance of this chapter focuses on more specific lessons learned for each of the Bright Start interventions. The chapter concludes with action recommendations for consideration by DCS management.

Page 5-2 September 2008 ECONorthwest/Lewin Group 2008 Bright Start Evaluation
LESSONS LEARNED Fundamentally, the paternity affidavit process in hospitals consists of two
steps: Ensuring unwed parents are made aware of the affidavit along with the consequences of signing it and making staff available to notarize the document. Despite the program’s simplicity, wide variations in performance existed across the demonstration hospitals prior to Bright Start.
While the process is simple, the context in which the process takes place poses significant challenges. Parents are inundated with a wide array of information. Taking precedent over paternity are concerns about the immediate and longer-term health of mother and child, neo-natal vaccinations, breastfeeding decisions and consultations, and health insurance coverage and payment. All of this activity takes place in the context of hospital stays that are generally shorter than they were when Washington invented the in-hospital approach almost two decades ago. The challenge met by good programs is identifying a brief but focused period of time during the stay to introduce and accurately explain the affidavit.
Thanks to cooperation from the DOH and the 16 demonstration hospitals, DCS managers have learned much about what makes a program work, as well as what pulls a program off track.
• In a well-performing program, the statewide rate of in-hospital establishments should reach 61 percent—or 9 percentage points above the 2007 rate. Even higher rates are possible but would require changes in state rules and statutes. Our statistical analysis was able to disentangle the effects of demographics, economic conditions, and hospital effort on the varying rates of in-hospital paternity establishment across the state. The analysis indicates that, if all hospitals staffed their programs appropriately and adopted the best practices discussed below, establishment would reach 61 percent. Had hospitals performed at that level, 2,400 additional unmarried mothers would have left the hospital with paternity established in 2007.
Movement beyond rates in the 60s is possible. For example, Texas reported a statewide, in-hospital acknowledgment rate of 73 percent during the first three quarters of federal fiscal year 2008 and, within Washington, the highest-functioning hospitals have sustained rates in the 70s. However, for Washington to bring the statewide average to that level, the Legislature would have to strengthen the state’s affidavit statute and compel hospitals to actively participate in the program and related training.
Conversations with DCS managers have highlighted specific features of the Texas program that may support higher paternity establishment rates in that state. Most prominently, Texas law does not require their paternity document to be notarized or witnessed. Some also feel that Washington’s statutory
2008 Bright Start Evaluation ECONorthwest/Lewin September 2008 Page 5-3
requirements that hospitals provide an opportunity for parents to sign a paternity affidavit are too ambiguous and too weak.
• Timely assembly of birth certificate information is the critical first step of the affidavit program. Before any conversation about the affidavit can be introduced, birthing clerks and nurses must know who the unmarried mothers are. While not endemic, staff in some hospitals noted that birth certificate clerks were occasionally slow in gathering information about the marital status of mothers or didn’t press them for information when clear inconsistencies in answers about marital status arose. In short, if clerks are slow to collect accurate information on the birth certificate, and the marital status of the mother is unclear, the affidavit program breaks down.
• High performing hospitals have at least one staff member who owns the program. As with virtually all public programs, staff enthusiasm and ownership is a key to the success. We saw no evidence in the demonstration hospitals of an unwillingness to participate in the affidavit program. All hospital staff recognized the permanency of the affidavit program and understood its longer-term importance to newborns. That said, on-site interviews exposed varying levels of effort. In some cases, Bright Start managers were greeted by a broad cross-section of nurses, vital records staff, and social workers. In other cases, Bright Start meetings were limited to one or two managers. The best performing hospitals had not only broad buy-in and participation but also a single lead, who served as the primary liaison with DCS and ensured that new hospital staff understood the program and their role in it. Where that person appeared in the hospital’s organization chart didn’t seem to matter. In many cases, a birth certificate clerk played the role but in other cases it was the nurse manager, a social worker, or a birthing center secretary. From our observations, it didn’t appear to matter who owned the program, but it was important that at least one person did.
• Processes that rely on a single person inevitably underperform. Weak programs often put the responsibility of the affidavit program on a single staff member. Even if that person buys into the program and works diligently, performance suffers when that staff member isn’t working—on weekends, evenings, or during vacation time. Even small hospitals have to recognize that a single person cannot operate the affidavit program. Our statewide statistical analysis of affidavits underscored this point. We found children of unmarried parents who were discharged on weekends or holidays were less likely to leave the hospital with paternity established due, in large part, to a lack of notaries. Bright Start’s offer of free notary training directly addressed this problem and encouraged hospitals to diversify the number of people associated with the affidavit effort.
Page 5-4 September 2008 ECONorthwest/Lewin Group 2008 Bright Start Evaluation
• Successful programs establish a “focusing event” to ensure every unmarried mother is aware of the affidavit. Hospital stays for new mothers are emotional, hectic, and typically brief. Finding time to introduce and explain the affidavit is challenging. Strong programs build checks into their system to remind nursing, vital records, and social work staff to offer the affidavit. Some hospitals include paternity establishment on discharge checklists. Others hospitals tie the affidavit conversation to the completion of the official and complementary birth certificates. In the case of the birth certificates, staff will remind unmarried parents that the father’s name cannot appear on the birth certificate unless the father has legally acknowledged paternity.
• Prenatal outreach and second efforts can propel programs even further. Recognizing the increased difficulty of conveying information during a hospital stay, a handful of programs introduce the affidavit to unmarried mothers during prenatal orientations. While no signatures are collected at the time, the distribution of the form gives staff an opportunity to discuss the purpose of the affidavit in a less stressful setting. A number of hospitals, typically smaller ones, also follow up with non-signing parents after discharge. This can include telephone calls and reminders about the affidavit during neo-natal checkups. Such prenatal and second efforts on the part of hospitals would both complement and reduce the need for subsequent outreach by DCS staff.
• Genetic testing is an appropriate complement to the paternity affidavit program. At Bright Start’s outset, child support and hospital staff concurred that referrals to no-cost genetic testing would be attractive to some unwed couples, but no one had a sense what share would request testing. While the take-up rate never approached a pre-demonstration estimate (20 percent), all but two of the hospitals generated some referrals, and one sizable hospital had more than 5 percent of unwed couples apply for a test. Hospital staff embraced the service and saw it as filling a gap for couples that were unsure about paternity of a newborn.
• A waiting period does not dampen participation in genetic testing. Couples interested in genetic testing had to apply to Bright Start for services and then wait an average 3.9 weeks to take the test. Despite the wait and required travel, 90 percent of applicants appeared for their test appointments.
• Very weak demand for parenting plans at hospitals suggests visitation and custody issues are not the top concerns of new parents. The demonstration’s intent was to gauge interest in no-cost parenting plans among new parents. During May 2006–December 2007, DCS received only 16
2008 Bright Start Evaluation ECONorthwest/Lewin September 2008 Page 5-5
applications for parenting plans that originated from hospitals. Of those applicants, only five couples followed the process through to complete a parenting plan. Dispute resolution counselors advanced a number of reasons for the very low interest. First and foremost was inappropriate timing. The parents were just getting used to their new responsibilities and, for many, it may be premature to consider potential, future conflicts around visitation and custody. In other cases, some mothers unilaterally decided not to participate despite interest by the father. In those instances, Bright Start’s informal, non-judicial approach could not compel an unwilling mother to cooperate.
MANAGEMENT RECOMMENDATIONS As the three-year demonstration period concludes, DCS managers will
need to consider possible changes to the scope of in-hospital services and how those services are managed. Below, we outline a number of actions management should consider to strengthen the affidavit program.
• Initiate annual hospital trainings in conjunction with the Department of Health. The Bright Start demonstration exposed that DCS had fallen out of contact with hospitals and the key staff who implement the program. Some hospitals hadn’t had an in-person meeting with DCS staff for several years. The lack of attention has resulted in variable program delivery. Hospitals vary in the number of people involved in the program, and those who are involved vary in their depth of understanding about the affidavit and consequences of signing it. Given the natural turnover of hospital staff, DCS should reestablish periodic training sessions at hospitals. The goal would be two-fold: remind hospitals of the mission of the program and improve the quality and consistency of implementation. Without these periodic sessions, knowledge about and attention to the program drifts. During a number of site visits, staff from demonstration hospitals asked questions about information that was covered in the DCS’s affidavit video. Many interviewees were not clear about the steps an affidavit signee could take to disavow paternity.
The periodic training sessions should be paired with DOH training on the birth certificate. Our visits revealed a number of staff questions that couldn’t be answered by DCS. Some hospital interviewees were concerned with DOH audits that score the completeness of birth certificates, and sought advice on how to improve their performance. In some cases, hospital staff were unclear about deadlines for submittal of the birth certificate and the paternity affidavit information and how those deadlines related, if at all.
Joint DCS-DOH trainings would reestablish a practice from the 1990s and ensure sufficient material and topics to justify annual
Page 5-6 September 2008 ECONorthwest/Lewin Group 2008 Bright Start Evaluation
visits. During our interviews, hospital staff uniformly embraced the idea of birth certificate/affidavit trainings and indicated annual meetings would be appropriate.
• Reestablish a role for a centralized paternity affidavit program and clarify the associated responsibilities of local paternity coordinators. Over time, DCS has employed different management models for the affidavit program. In the early 1990s, the program was centrally administered with most hospital contacts made with staff in Olympia. Beginning in 1996, DCS transitioned management responsibility to paternity coordinators in field offices. Generally, DCS-hospital ties have weakened during the period of decentralization, and the program—as it operates outside of the Bright Start demonstration—lacks a clear owner within DCS. While field offices track overall paternity establishment efforts, few DCS staff pay close attention to establishment rates at the hospital level. Field staff was quick to admit that, while they understood the importance of the affidavit program, collection of current and past cash support dominated the energy and efforts of local offices. Raising the profile of the affidavit in local offices could be challenging, not only because of the dominating role of cash collections, but because most affidavit signees are not associated with a child support case at the time the child is born, and some signees never will have a child support case.
Going forward, the State should consider a role for a centralized statewide paternity coordinator. The coordinator would be in charge of the annual training meetings with hospital staff and would disseminate affidavits, brochures, and videos. The position would closely monitor performance and make special visits to hospitals that persistently fall below their benchmark performance level or that exhibit highly variable performance over time. Finally, the statewide coordinator would administer the notary and genetic testing programs, assuming they become permanent at the conclusion of the Bright Start demonstration.
The statewide coordinator would complement the work of local paternity coordinators—not substitute for it. Local paternity coordinators would attend the annual trainings and, over the course of the year, would continue playing the roles they do today: answering the hospitals’ routine questions about the affidavit, accepting and notarizing affidavits from parents, initiating outreach efforts to improve the dissemination of the affidavit, and overseeing cases referred to the prosecutor for judicial establishment.
• Maintain hospital benchmarking. Prior to Bright Start, neither DCS nor the hospitals could identify the difference between a strong in-hospital program and a mediocre one. Now,

2008 Bright Start Evaluation ECONorthwest/Lewin September 2008 Page 5-7
DCS has a method to produce benchmark establishment rates tailored to specific demographic and economic conditions of every hospital in the state. As those benchmarks were reported for demonstration sites, hospital staff reacted positively and constructively to the findings. Staff members in high-performing hospitals were pleased to receive and share the findings. Staff members in low-performing hospitals understood their weaknesses (typically too few staff) and were eager to hear about best practices. Members in nearly every hospital requested future progress reports. Going forward, DCS should disseminate reports quarterly and harness the naturally competitive environment of the hospital industry to foster continuing improvement of the affidavit program.
• Continue Bright Start’s subsidy of notary training costs. As long as Washington DOH requires a notarized affidavit, DCS should continue to pay for the cost of notary training in hospitals. Our statistical analysis indicated improved notary coverage would increase the weekend establishment rates by more than four percentage points, and additional notaries would also boost performance around holidays and traditional vacation periods. In chronically underperforming hospitals, the impact could be even larger as evidenced by the strong improvement of Southwest Washington Medical Center’s performance during the demonstration.
The offer—costing between $200 and $250 per notary—is a cost-effective way to demonstrate to hospitals that DCS is committed to affidavit program and is willing to share in its costs.
• Standardize notary training. Notaries interviewed during site visits varied in their views about what was and wasn’t acceptable identification for a prospective signee. Some notaries accepted only state-issued driver’s licenses, residence cards, or US Passports. Others were willing to accept identification issued by local governments in foreign countries, particularly Mexico. Some accepted school-issued identification. And, it was not uncommon for practices around acceptable ID to differ across notaries located in the same hospital. The variability in practice produces unequal access to the affidavit process.
Given DOH is ultimately responsible for the integrity of affidavit documents and process, some standardization in notary training is called for. DOH should address the question of acceptable identification as a standard component of the joint DCS-DOH hospital trainings described above. In conjunction with notary training vendors, DOH should also develop a consensus list of forms of identification that are sufficient for the purposes of signing the affidavit.

Page 5-8 September 2008 ECONorthwest/Lewin Group 2008 Bright Start Evaluation
• Continue the genetic testing program. The offer of free genetic tests fills a hole in the affidavit program. For years, hospital staff have been providing the opportunity to attest to paternity but could offer no advice to mothers who were unsure about the paternity of their newborn. The relatively low take-up rate suggests that only those couples that are truly in doubt about paternity request the test. The program benefits the people who take the test while simultaneously boosting the reputation of the affidavit among hospital staff.
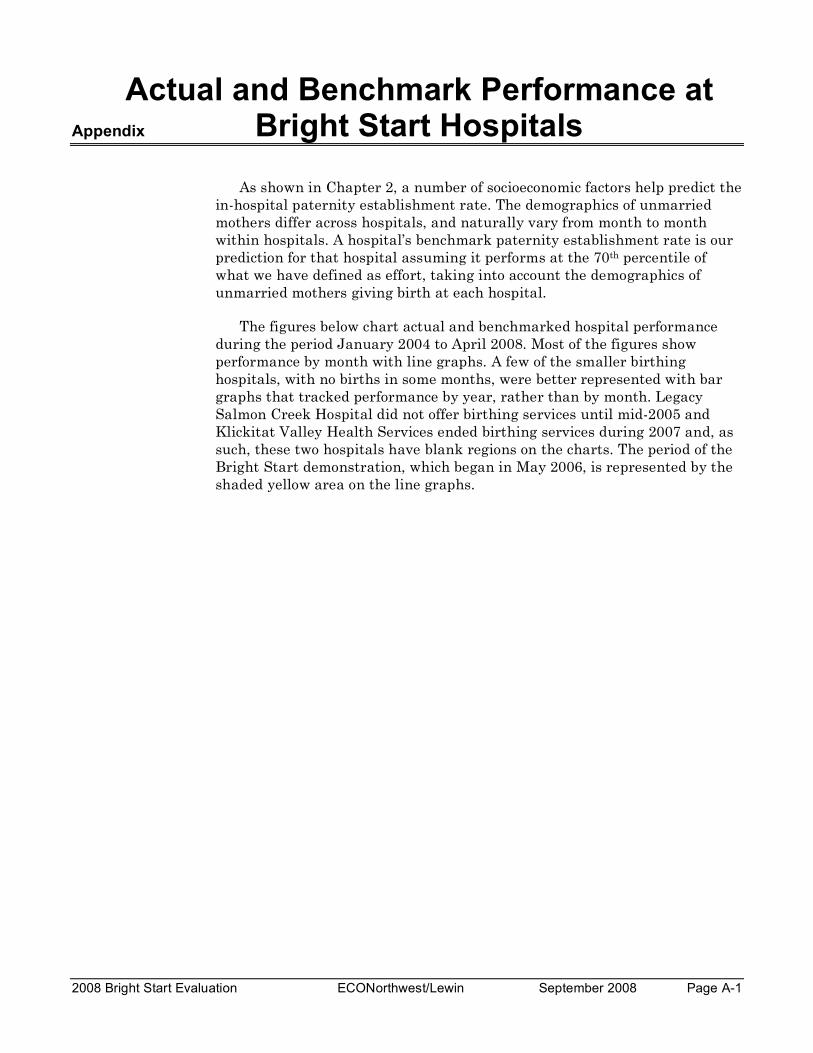
2008 Bright Start Evaluation ECONorthwest/Lewin September 2008 Page A-1
Actual and Benchmark Performance at Appendix Bright Start Hospitals
As shown in Chapter 2, a number of socioeconomic factors help predict the in-hospital paternity establishment rate. The demographics of unmarried mothers differ across hospitals, and naturally vary from month to month within hospitals. A hospital’s benchmark paternity establishment rate is our prediction for that hospital assuming it performs at the 70th percentile of what we have defined as effort, taking into account the demographics of unmarried mothers giving birth at each hospital.
The figures below chart actual and benchmarked hospital performance during the period January 2004 to April 2008. Most of the figures show performance by month with line graphs. A few of the smaller birthing hospitals, with no births in some months, were better represented with bar graphs that tracked performance by year, rather than by month. Legacy Salmon Creek Hospital did not offer birthing services until mid-2005 and Klickitat Valley Health Services ended birthing services during 2007 and, as such, these two hospitals have blank regions on the charts. The period of the Bright Start demonstration, which began in May 2006, is represented by the shaded yellow area on the line graphs.
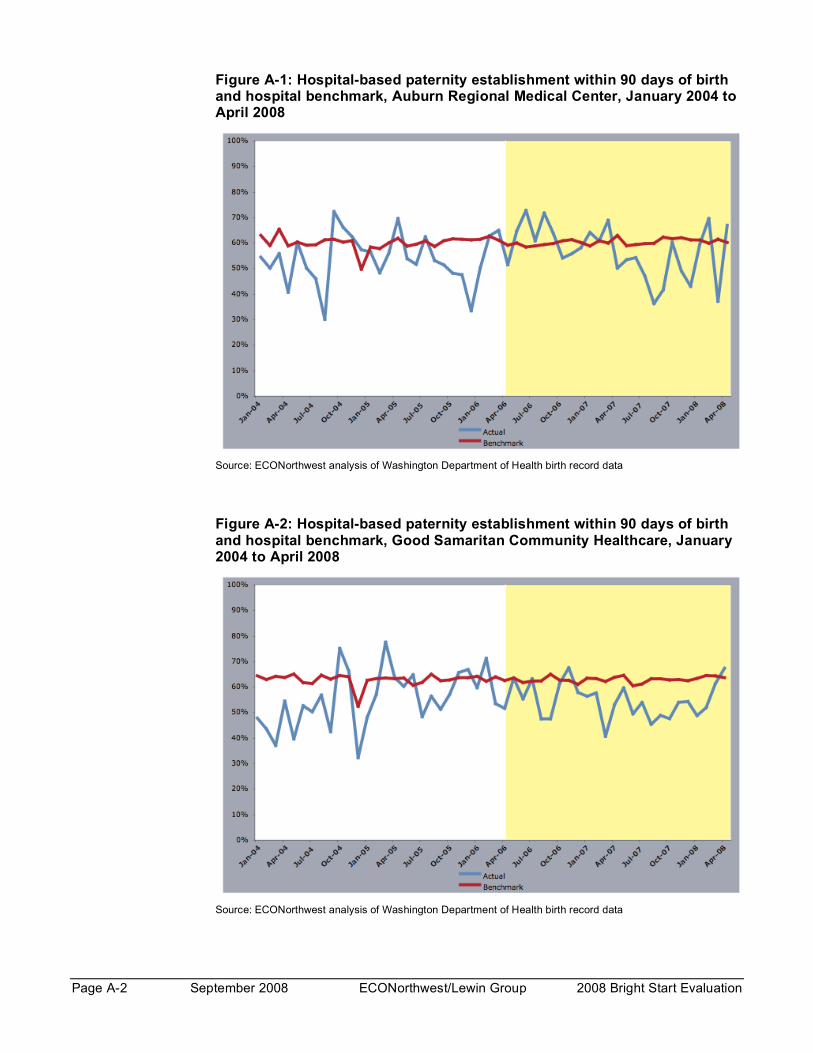
Page A-2 September 2008 ECONorthwest/Lewin Group 2008 Bright Start Evaluation
Figure A-1: Hospital-based paternity establishment within 90 days of birth and hospital benchmark, Auburn Regional Medical Center, January 2004 to April 2008
Source: ECONorthwest analysis of Washington Department of Health birth record data
Figure A-2: Hospital-based paternity establishment within 90 days of birth and hospital benchmark, Good Samaritan Community Healthcare, January 2004 to April 2008
Source: ECONorthwest analysis of Washington Department of Health birth record data
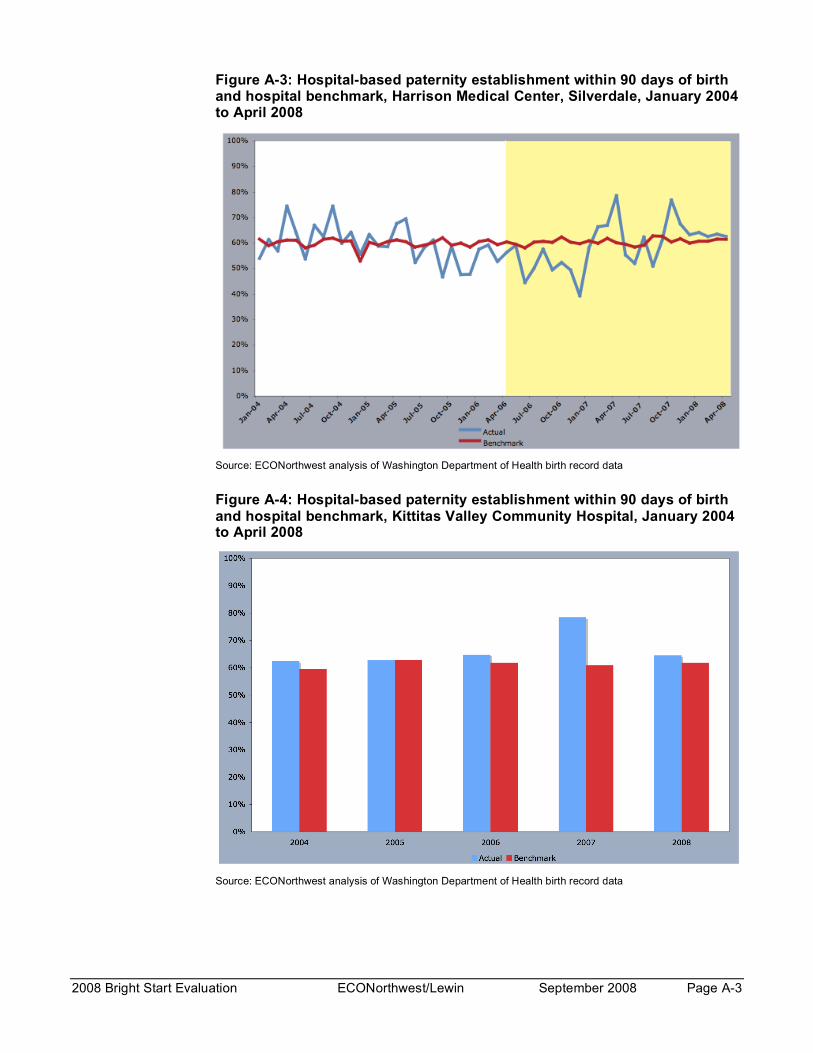
2008 Bright Start Evaluation ECONorthwest/Lewin September 2008 Page A-3
Figure A-3: Hospital-based paternity establishment within 90 days of birth and hospital benchmark, Harrison Medical Center, Silverdale, January 2004 to April 2008
Source: ECONorthwest analysis of Washington Department of Health birth record data
Figure A-4: Hospital-based paternity establishment within 90 days of birth and hospital benchmark, Kittitas Valley Community Hospital, January 2004 to April 2008
Source: ECONorthwest analysis of Washington Department of Health birth record data
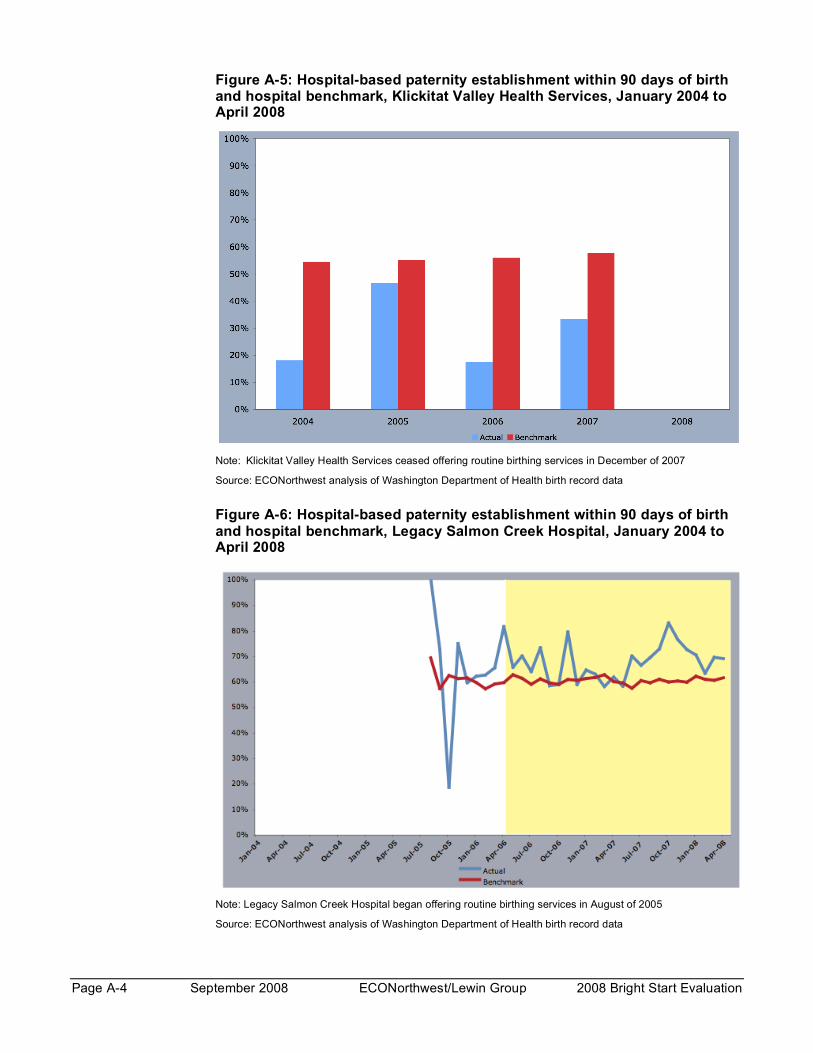
Page A-4 September 2008 ECONorthwest/Lewin Group 2008 Bright Start Evaluation
Figure A-5: Hospital-based paternity establishment within 90 days of birth and hospital benchmark, Klickitat Valley Health Services, January 2004 to April 2008
Note: Klickitat Valley Health Services ceased offering routine birthing services in December of 2007
Source: ECONorthwest analysis of Washington Department of Health birth record data
Figure A-6: Hospital-based paternity establishment within 90 days of birth and hospital benchmark, Legacy Salmon Creek Hospital, January 2004 to April 2008
Note: Legacy Salmon Creek Hospital began offering routine birthing services in August of 2005
Source: ECONorthwest analysis of Washington Department of Health birth record data

2008 Bright Start Evaluation ECONorthwest/Lewin September 2008 Page A-5
Figure A-7: Hospital-based paternity establishment within 90 days of birth and hospital benchmark, Madigan Army Medical Center, January 2004 to April 2008
Source: ECONorthwest analysis of Washington Department of Health birth record data
Figure A-8: Hospital-based paternity establishment within 90 days of birth and hospital benchmark, PeaceHealth, St. John Medical Center, January 2004 to April 2008
Source: ECONorthwest analysis of Washington Department of Health birth record data

Page A-6 September 2008 ECONorthwest/Lewin Group 2008 Bright Start Evaluation
Figure A-9: Hospital-based paternity establishment within 90 days of birth and hospital benchmark, Skyline Hospital, January 2004 to April 2008
Source: ECONorthwest analysis of Washington Department of Health birth record data
Figure A-10: Hospital-based paternity establishment within 90 days of birth and hospital benchmark, Southwest Washington Medical Center, Center Campus, January 2004 to April 2008
Source: ECONorthwest analysis of Washington Department of Health birth record data
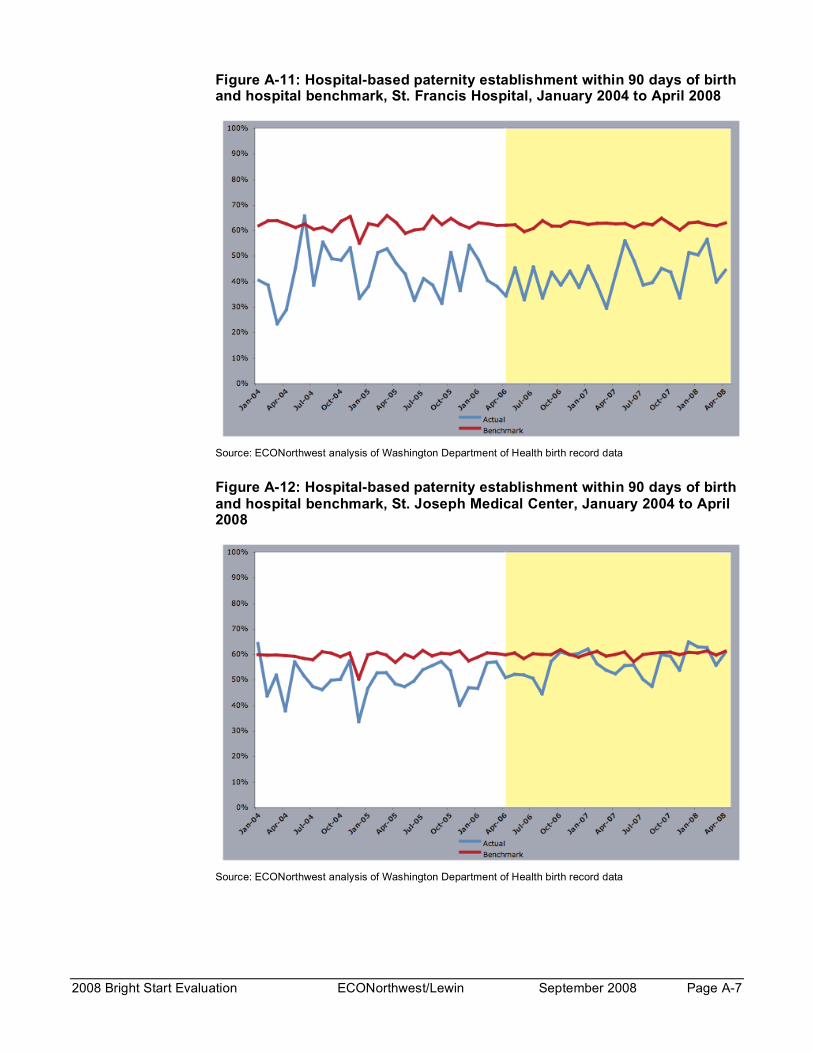
2008 Bright Start Evaluation ECONorthwest/Lewin September 2008 Page A-7
Figure A-11: Hospital-based paternity establishment within 90 days of birth and hospital benchmark, St. Francis Hospital, January 2004 to April 2008
Source: ECONorthwest analysis of Washington Department of Health birth record data
Figure A-12: Hospital-based paternity establishment within 90 days of birth and hospital benchmark, St. Joseph Medical Center, January 2004 to April 2008
Source: ECONorthwest analysis of Washington Department of Health birth record data
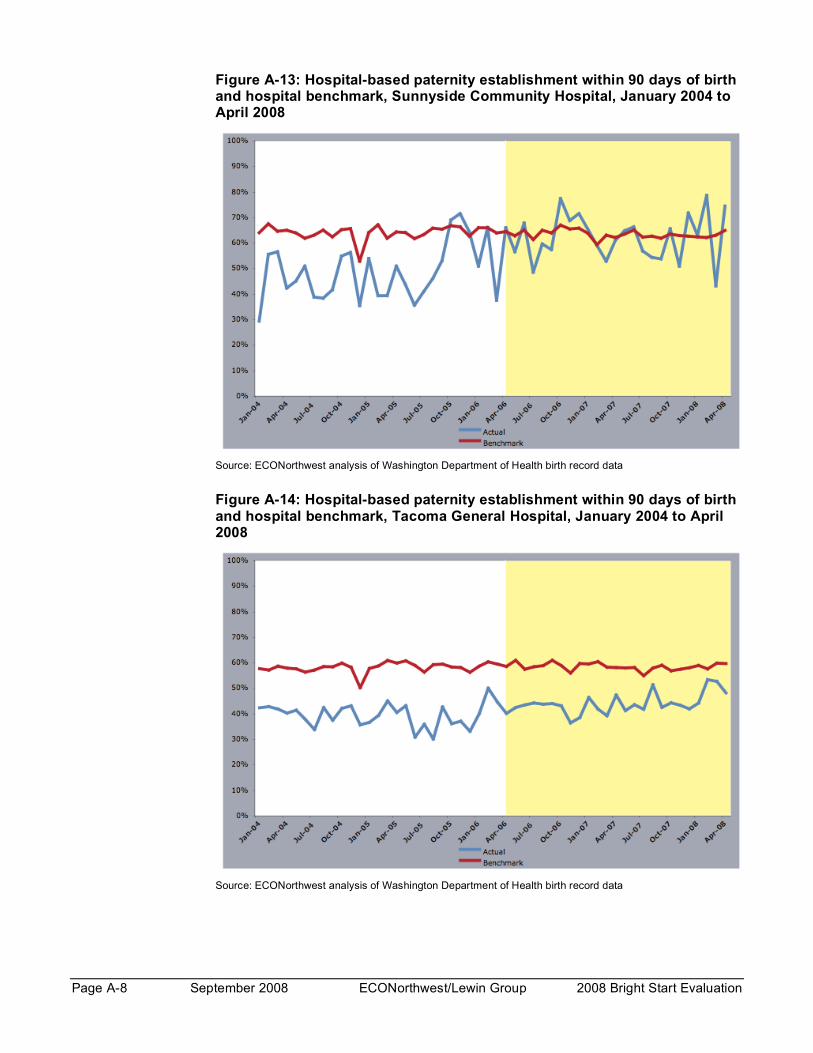
Page A-8 September 2008 ECONorthwest/Lewin Group 2008 Bright Start Evaluation
Figure A-13: Hospital-based paternity establishment within 90 days of birth and hospital benchmark, Sunnyside Community Hospital, January 2004 to April 2008
Source: ECONorthwest analysis of Washington Department of Health birth record data
Figure A-14: Hospital-based paternity establishment within 90 days of birth and hospital benchmark, Tacoma General Hospital, January 2004 to April 2008
Source: ECONorthwest analysis of Washington Department of Health birth record data
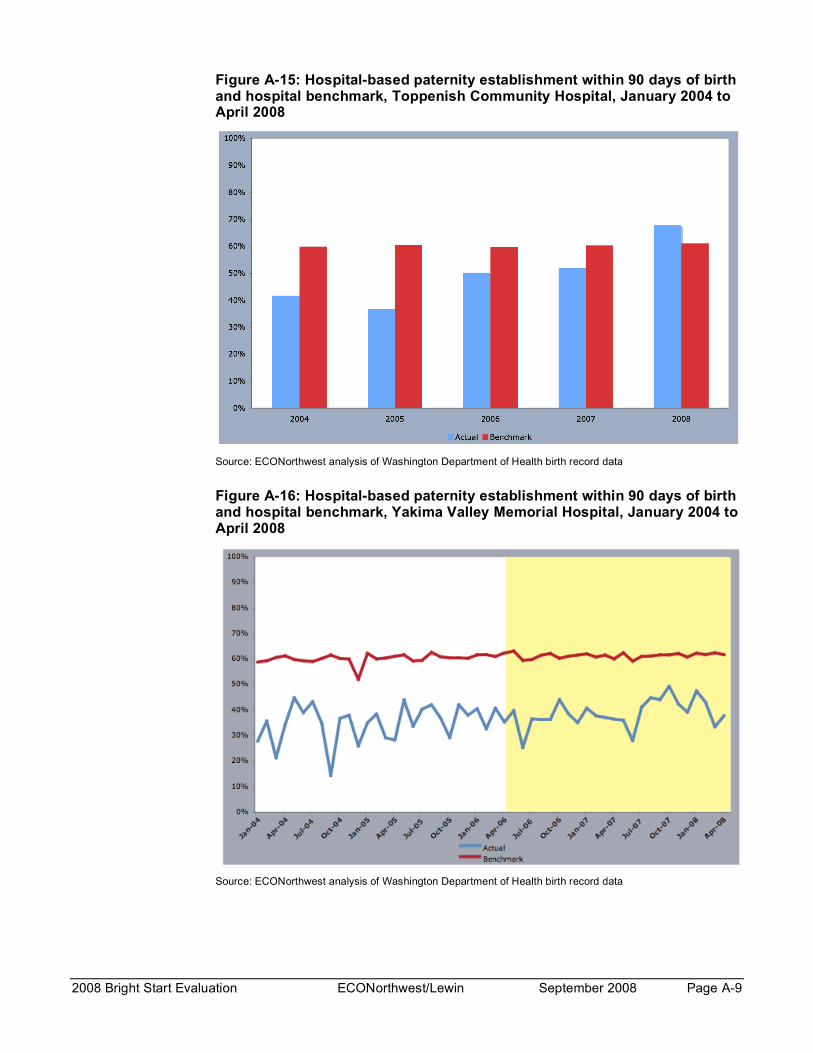
2008 Bright Start Evaluation ECONorthwest/Lewin September 2008 Page A-9
Figure A-15: Hospital-based paternity establishment within 90 days of birth and hospital benchmark, Toppenish Community Hospital, January 2004 to April 2008
Source: ECONorthwest analysis of Washington Department of Health birth record data
Figure A-16: Hospital-based paternity establishment within 90 days of birth and hospital benchmark, Yakima Valley Memorial Hospital, January 2004 to April 2008
Source: ECONorthwest analysis of Washington Department of Health birth record data
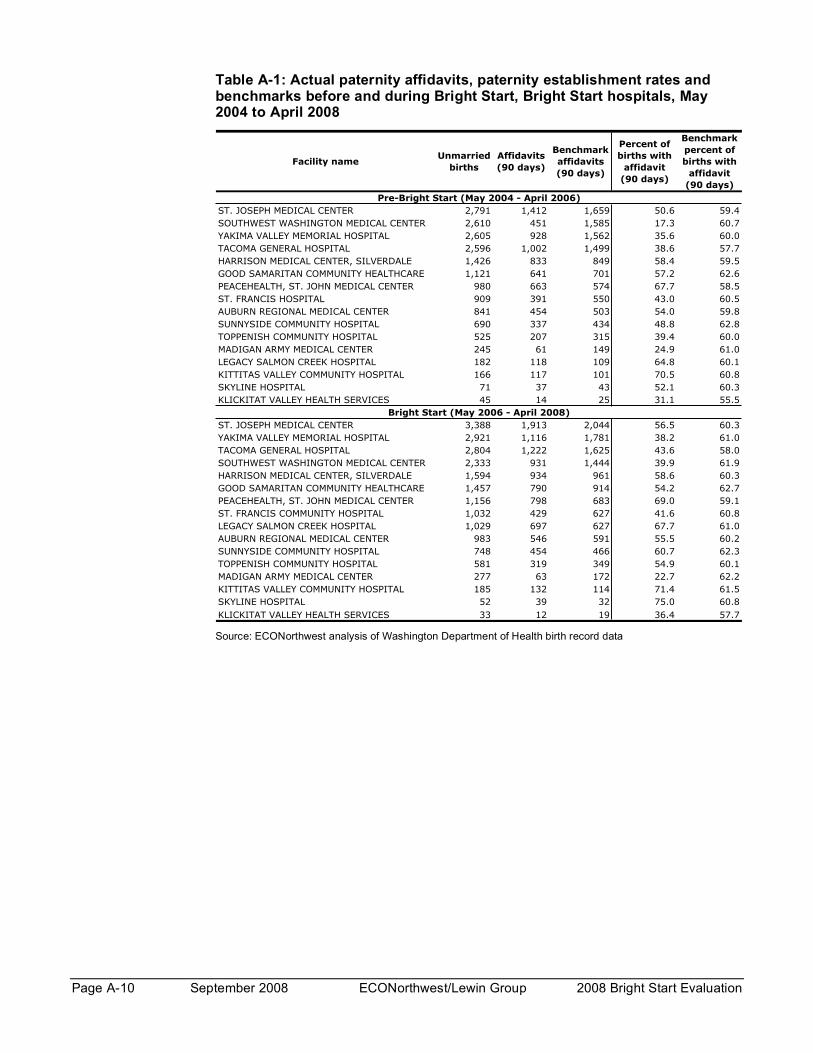
Page A-10 September 2008 ECONorthwest/Lewin Group 2008 Bright Start Evaluation
Table A-1: Actual paternity affidavits, paternity establishment rates and benchmarks before and during Bright Start, Bright Start hospitals, May 2004 to April 2008
Facility nameUnmarried
births
Affidavits
(90 days)
Benchmark
affidavits
(90 days)
Percent of
births with
affidavit
(90 days)
Benchmark
percent of
births with
affidavit
(90 days)
ST. JOSEPH MEDICAL CENTER 2,791 1,412 1,659 50.6 59.4
SOUTHWEST WASHINGTON MEDICAL CENTER 2,610 451 1,585 17.3 60.7
YAKIMA VALLEY MEMORIAL HOSPITAL 2,605 928 1,562 35.6 60.0
TACOMA GENERAL HOSPITAL 2,596 1,002 1,499 38.6 57.7
HARRISON MEDICAL CENTER, SILVERDALE 1,426 833 849 58.4 59.5
GOOD SAMARITAN COMMUNITY HEALTHCARE 1,121 641 701 57.2 62.6
PEACEHEALTH, ST. JOHN MEDICAL CENTER 980 663 574 67.7 58.5
ST. FRANCIS HOSPITAL 909 391 550 43.0 60.5
AUBURN REGIONAL MEDICAL CENTER 841 454 503 54.0 59.8
SUNNYSIDE COMMUNITY HOSPITAL 690 337 434 48.8 62.8
TOPPENISH COMMUNITY HOSPITAL 525 207 315 39.4 60.0
MADIGAN ARMY MEDICAL CENTER 245 61 149 24.9 61.0
LEGACY SALMON CREEK HOSPITAL 182 118 109 64.8 60.1
KITTITAS VALLEY COMMUNITY HOSPITAL 166 117 101 70.5 60.8
SKYLINE HOSPITAL 71 37 43 52.1 60.3
KLICKITAT VALLEY HEALTH SERVICES 45 14 25 31.1 55.5
ST. JOSEPH MEDICAL CENTER 3,388 1,913 2,044 56.5 60.3
YAKIMA VALLEY MEMORIAL HOSPITAL 2,921 1,116 1,781 38.2 61.0
TACOMA GENERAL HOSPITAL 2,804 1,222 1,625 43.6 58.0
SOUTHWEST WASHINGTON MEDICAL CENTER 2,333 931 1,444 39.9 61.9
HARRISON MEDICAL CENTER, SILVERDALE 1,594 934 961 58.6 60.3
GOOD SAMARITAN COMMUNITY HEALTHCARE 1,457 790 914 54.2 62.7
PEACEHEALTH, ST. JOHN MEDICAL CENTER 1,156 798 683 69.0 59.1
ST. FRANCIS COMMUNITY HOSPITAL 1,032 429 627 41.6 60.8
LEGACY SALMON CREEK HOSPITAL 1,029 697 627 67.7 61.0
AUBURN REGIONAL MEDICAL CENTER 983 546 591 55.5 60.2
SUNNYSIDE COMMUNITY HOSPITAL 748 454 466 60.7 62.3
TOPPENISH COMMUNITY HOSPITAL 581 319 349 54.9 60.1
MADIGAN ARMY MEDICAL CENTER 277 63 172 22.7 62.2
KITTITAS VALLEY COMMUNITY HOSPITAL 185 132 114 71.4 61.5
SKYLINE HOSPITAL 52 39 32 75.0 60.8
KLICKITAT VALLEY HEALTH SERVICES 33 12 19 36.4 57.7
Pre-Bright Start (May 2004 - April 2006)
Bright Start (May 2006 - April 2008)
Source: ECONorthwest analysis of Washington Department of Health birth record data