Vibration analysis of hybrid laminated composite beam Omar ...

Evaluation of Stress-Laminated T-Beam BridgesConstructed of Laminated Veneer Lumber
Michael Ritter, Paula Hilbrich Lee, James Kainz, Forest Products Laboratory,USDA Forest Service
Christopher Meyer, Trus Joist MacMillan
AbstractGrowing interest in wood bridges during the pastdecade has led to the use of new wood products andinnovative designs for bridges. One new woodbridge system that is becoming increasingly popularinvolves solid, laminated veneer lumber T-beamsthat are stress laminated together. As part of the de-velopment of these bridges, an evaluation program tomonitor field performance of six bridges was imple-mented. This paper describes results of field perfor-mance related to bar force, moisture content, andcondition assessment, with presentation of load testand analytical evaluations for two of the six bridges.
made from sheets of rotary-peeled wood veneer thatare glued together with waterproof adhesive to formstructural members (Figure 1). The thickness of theveneer laminations is commonly 2.5 to 6.4 mm (0.10to 0.25 in.). In contrast to plywood, LVL lamina-tions are oriented with the grain direction parallel,rather than having some laminations at right angles.
Several characteristics of LVL make it desirable forstructural applications. Because it is a manufacturedproduct, LVL can be produced in a variety of sizesand shapes. The laminating process disperses the nat-ural strength-reducing characteristics of wood, which
Keywords: Bridges, Wood, Laminated veneer lum-ber, Field performance, Stress laminated.
IntroductionThe objective of the Timber Bridge Initiative (TBI),passed by the U.S. Congress in 1988, was to furtherdevelop and extend the use of wood as a bridge mate-rial (USDA 1995). As part of this objective, empha-sis has been placed on the use of new engineeredwood products and innovative bridge designs. Oneengineered wood product that has recently beenadapted for bridge applications is laminated veneerlumber (LVL). LVL, which is a subcategory of newwood products called structural composite lumber, is
92
Figure 1 – Typical LVL beams.

reduces product variability and provides improveddesign strength and stiffness compared to sawn lum-ber. Because of this, design values of up to 20.2 MPa(2,900 lb/in 2) in bending and 13,800 MPa(2,000,000 lb/in2) for modulus of elasticity (MOE)are possible. LVL also provides improved treatabil-ity with wood preservatives because of small lathechecks in the veneers that facilitate preservative pen-etration. The result is generally full preservative pen-etration of structural components (Tschernitz et al.1974). Most LVL is produced from either Douglas-fir or Southern Pine veneers, but hemlock, yellow-poplar, oak, and spruce have also been used.
LVL is not a new material. It originated in the 1940swhen research was being conducted for high strengthaircraft structures (Forest Products Laboratory 1987)and has been produced commercially for more than25 years. The primary use for LVL has historicallybeen in residential and commercial building applica-tions, such as beams and headers, chords of trusses,and the flange component of prefabricated wood Ijoists. The first known LVL bridge constructed in theUnited States was built in 1977 of "press-lam," atype of LVL developed at the USDA Forest Service,Forest Products Laboratory (FPL). This prototypestructure, jointly sponsored by the Forest Service andthe Virginia State Highway Department, consists ofa 79-mm- (3.13-in.-) thick LVL deck supported on114- by 508-mm (4.5- by 20-in.) LVL beams spaced762 mm (30 in.) on-center (Youngquist et al. 1979).One of the next known uses of LVL in bridges wasin 1988 when a 22.25-m (73-ft) span experimentalstress-laminated T-beam bridge was constructed inWest Virginia using LVL for the web components.For this structure, flanges constructed of nominal 38-by 229-mm (1.5- by 9-in.) oak lumber laminationswere stress laminated between 152- by 1,145-mm (6-
by 45-in.) LVL webs spaced 915 mm (36 in.) on-center (Dickson and GangaRao 1989).
The first effort to develop and market a bridge sys-tem constructed entirely of LVL was initiated byTrus Joist MacMillan in the late 1980s. Thesebridges consisted of a series of fully laminated T-beams that were stress laminated together throughthe flange to form the bridge width (Figure 2). By1993, approximately 20 bridges of this type wereconstructed in the western United States, with clearspans of 7.3 to 15.2 m (24 to 50 ft) and widths of 3.0to 11.0 m (10 to 36 ft). One obstacle to acceptanceof the bridges was the lack of LVL design values inthe Standard Specifications for Highway Bridgespublished by the American Association of StateHighway and Transportation Officials (AASHTO).
This was subsequently resolved, and design valuesfor LVL bridges were included in the 1995 interimspecifications (AASHTO 1992). As a result the sys-tem is becoming more popular as an alternative fornew construction and bridge replacement. Thebridges are also currently being constructed of an-other type of structural composite lumber known asparallel strand lumber (PSL) (Meyer 1995).
During the development process for stress-laminatedLVL T-beam bridges, a field evaluation program wasconsidered necessary to fully evaluate bridge perfor-mance and optimize design methodology. As a re-sult, FPL was contacted to assist in field monitoring,load testing, and analytical evaluations, and a bridgemonitoring program was initiated in 1991 for sixbridges. The objective of the monitoring was to eval-uate performance characteristics and improve designprocedures for LVL T-beam bridges through fieldevaluation and analytical modeling. The scope of this
Figure 2 – Typical stress-laminated LVL T-beam showing (top) the end section of a solidLVL T-beam and (bottom) a completed bridge.
93

paper is limited to results of field performance re-lated to bar force, moisture content, and conditionassessment, with presentation of load test and analyt-ical evaluations for two bridges.
Description of BridgesOf the numerous LVL T-beam bridges constructed,six bridges located in the northwestern U.S. wereselected as representative examples for field evalua-tion purposes. As shown in Figure 3, the bridgesranged in length from 7.92 to 13.41 m (26 to 44 ft)with widths of 4.88 to 11.43 m (16 to 37.5 ft). Thesize of the individual LVL T-beams varied for eachbridge depending on specific design requirementsand ranged from 610 to 635 mm (24 to 25 in. ) wideand 356 to 711 mm (14 to 28 in. ) deep, with a flangethickness of 152 mm (6 in.) and a web width of203 mm (8 in.). Four bridges included LVL boxbeams along the edges of the bridge to improvedimensional stability.
All bridges were stress laminated with ASTM A 722high strength steel bars spaced 762 mm (30 in.) on-center (ASTM 1988). The design bar force of133 kN (30,000 lb) provided an interlaminar com-pression of approximately 1.15 MPa (167 lb/in2) be-tween the flanges. The LVL for all bridges was pres-sure treated with pentachlorophenol in heavy oil inaccordance with American Wood Preservers’ Asso-ciation (AWPA) Standard C 14 (AWPA 1990). Withthe exception of the Kenally Creek bridge, whichwas provided with lumber running planks, allbridges were constructed with an asphalt wearingsurface. A detailed description of the South Canaland Mill Creek bridges (discussed later in this paper)follows.
South Canal BridgeThe South Canal Bridge is located in OwyheeCounty, Idaho, and is a single-lane bridge with aspan of 7.71 m (25.3 ft) center-to-center of bearingsand an out-to-out width of 4.88 m (16 ft) (Figure 4).The bridge consists of 8 LVL T-beams, 610 mm(24 in.) wide and 356 mm (14 in.) deep.
Mill Creek BridgeThe Mill Creek Bridge is located in Stevens County,Washington. It is a two-lane bridge with a span of8.93 m (29.3 ft) center-to-center of bearings and anout-to-out width of 7.32 m (24 ft) (Figure 5). TheT-beams are 610 mm (24 in.) wide and 406 mm(16 in.) deep. The exterior box beams are 610 mm(24 in.) wide and 406 mm (16 in.) deep, with a topflange thickness of 152 mm (6 in. ) and a bottomflange thickness and web width of 114 mm (4.5 in.).
Evaluation MethodologyEvaluation of the LVL T-beam bridges utilized pro-cedures and equipment previously developed by FPL(Ritter et al. 1991). A description of the methodol-ogy for moisture content and bar force measurement,load test behavior, analytical evaluation, and condi-tion assessment follows.
Moisture ContentMoisture content measurements were taken on theunderside of the deck at web and flange locationsusing an electrical-resistance moisture meter with 76-mm (3-in.) probe pins in accordance with ASTMD4444-84 procedures (ASTM 1990). Measurementswere obtained by driving the pins to depths of 25 to51 mm (1 to 2 in.), recording the moisture contentvalue, and adjusting the values for LVL temperatureand species based on factors obtained from Trus JoistMacMillan. Moisture content measurements of thePetty Creek bridge were taken approximatelymonthly for 2.5 years. Moisture content measure-ments for the other bridges were taken prior to instal-lation and at the time of load testing.
Bar ForceBar force for the Petty Creek bridge was measuredon a monthly basis using two load cells developed byFPL. Load cell strain measurements were obtainedwith a portable strain indicator and converted to unitsof bar tensile force by applying a laboratory conver-sion factor to the strain indicator reading. At the con-clusion of the monitoring period, the load cells wereremoved, checked for zero balance shift, and recali-brated to determine time-related changes in the initialload cell calibration. Bar force for the other bridgeswas measured with a hydraulic jack at the time ofconstruction and load testing.
Load Test BehaviorStatic load testing consisted of positioning loaded testvehicles on the bridge deck and measuring the result-ing deflections at a series of transverse locations atmidspan. Measurement of bridge deflections weretaken prior to testing (unloaded), for each load posi-tion (loaded), and at the conclusion of testing(unloaded). Deflection measurement from an un-loaded to loaded condition was obtained by placing acalibrated rule at the bottom center of each web andreading values with a surveyor’s level to the nearest0.8 mm (0.03 in.).
The load test vehicles at both bridges were fullyloaded three-axle dump trucks (Figure 6). At theSouth Canal bridge, a single truck with a gross vehi-cle weight (GVW) of 304 kN (68,500 lb) was used.
94

Figure 3–Typical configuration details for the LVL T-beam bridges.
95

Figure 4–South Canal bridge, OwyheeCounty, Idaho.
Figure 5-Mill Creek bridge, Stevens County,Washington.
At Mill Creek, two trucks were used: truck 20 witha GVW of 232 kN (52,200 lb) and truck 13 with aGVW of 227 kN (51,100 lb). The vehicles were po-sitioned longitudinally on the bridges so that the tworear axles were centered at midspan and the frontaxles were off the bridge span. Transversely, differ-ent vehicles positions were used for single-lane anddouble-lane bridges. At South Canal, the three loadpositions included load position 1 with the vehiclecentered on the bridge width and load positions 2 and3 with the truck wheel line over the longitudinalbridge centerline (Figure 7). For the Mill Creekbridge, six load positions were used with the vehicles
Figure 6 – Load test truck configurations andaxle loads. The transverse vehicle track width,measured center-to-center of the rear wheellines, was 1.82 m (6 ft).
Analytical EvaluationThe load test behavior of each bridge was evaluatedanalytically to further understand bridge behaviorand form a basis for development of design load dis-tribution criteria. Previous research showed thatstress-laminated bridge decks could be accuratelymodeled as orthotropic plates (Oliva et al. 1990).Given the relatively compact section of the T-beams,an orthotropic plate analysis similar to that developedat FPL for stress-laminated decks was investigated.This was done so that the T-beam design criteriacould parallel that for stress-laminated decks(currently under devdopment at FPL). To completethe orthotropic plate analysis, the plate thickness wastaken as the T-beam flange thickness. To reflect theincrease in longitudinal stiffness as a result of theT-beam webs, a transformed section analysis was
0.61 m (2 ft) from centerline for load positions 1through 3 and 1.22 m (4 ft) from centerline for loadpositions 4 through 6 (Figure 8).
96

Figure 7 –Load test vehicle positions for theSouth Canal bridge (looking west). For all loadpositions, the two rear axles were centeredover the bridge midspan with the front axle offthe span.
completed to determine the equivalent longitudinalMOE of the plate. Properties in the transverse direc-tion for MOE and shear modulus were based on thelevel of interlaminar compression in the bridge inaccordance with the following equations.
(1)
(2)
whereETS = transverse MOE in MPa (lb/in2)GTS = transverse shear modulus in MPa (lb/in2)FP = interlaminar compression in MPa (lb/in2)
An analytical evaluation was completed for eachbridge based on load vehicles and conditions, includ-ing the level of interlaminar compression at the timeof testing. Analysis was also completed for the sameload test conditions and transverse vehicle positionsusing AASHTO HS 20-44 truck loading (AASHTO1992).
Figure 8 –Load test vehicle positions for theMill Creek bridge (looking east). For all loadpositions, the truck rear axles were centeredover the bridge midspan with the front axlesoff the span.
97

Condition AssessmentThe general condition of each of the LVL T-beambridges was assessed at the time of load testing. Theassessments involved visual inspections, measure-ments, and photographic documentation of the bridgecondition. Items of specific interest included thebridge geometry, condition of the LVL components,and the condition of the stressing bars and anchoragesystems.
Results and DiscussionResults of the performance of the LVL T-beambridges follow. Results for moisture content and barforce are based primarily on the Petty Creek bridge,which was continuously monitored for 2.5 years.Load test results and analysis are for the South Canaland Mill Creek bridges.
Moisture ContentAll T-beam bridges were installed at a moisture con-tent of 9%-12%. Measurements after installation in-dicated that the moisture content of the LVL re-sponds relatively quickly to changes in environmen-tal conditions. This is because the lathe checks in theveneers, which facilitate preservative penetration,also allow rapid moisture movement. For the PettyCreek bridge, the average moisture content increasedfrom approximately 12% at the time of constructionto approximately 26% at the conclusion of the2.5-year monitoring program. During this time, vari-ations in moisture content of 5% to 10% were notedon an annual basis as a result of seasonal climaticchanges. The 12% increase in moisture content overthe monitoring period is due in part to the shelteredlocation of the bridge, which hinders the drying ofthe deck, and the last and greatest moisture contentreadings were taken following the rainy period of theyear.
Bar ForceThe average bar force for the Petty Creek bridge isshown in Figure 9. At the time of load cell installa-tion in December 1990, the bar force was approxi-mately 112.1 kN (25,200 lb) or 0.97 MPa(140 lb/in2) interlaminar compression. After increas-ing slightly, the bar force declined to approximately90.3 kN (20,300 lb) or 0.78 MPa (113 lb/in2) inter-laminar compression in July 1991. For the remaining2 years of the monitoring period, bar force remainedrelatively stable with fluctuations following seasonalclimatic changes, which affected the moisture contentand dimensional stability of the LVL. At the end ofthe monitoring period, the average bar force was82.7 kN (18,600 lb), which is approximately0.71 MPa (103 lb/in2) interlaminar compression.
98
Figure 9–Average trend in bar force for thePetty Creek bridge.
For all the LVL T-beam bridges, the design interlam-inar compression of 1.15 MPa (167 lb/in2) is sub-stantially greater than the 0.69 MPa (100 lb/in2)commonly used for stress-laminated sawn lumberdecks. At this high level, the bar force initially de-clines due to stress relaxation in the LVL, then stabi-lizes or increases slightly as the LVL absorbs mois-ture and expands. Based on the high initial interlami-nar compression and initial swelling of the LVL, it isexpected that future bar tensioning will not berequired for the LVL T-beam bridges.
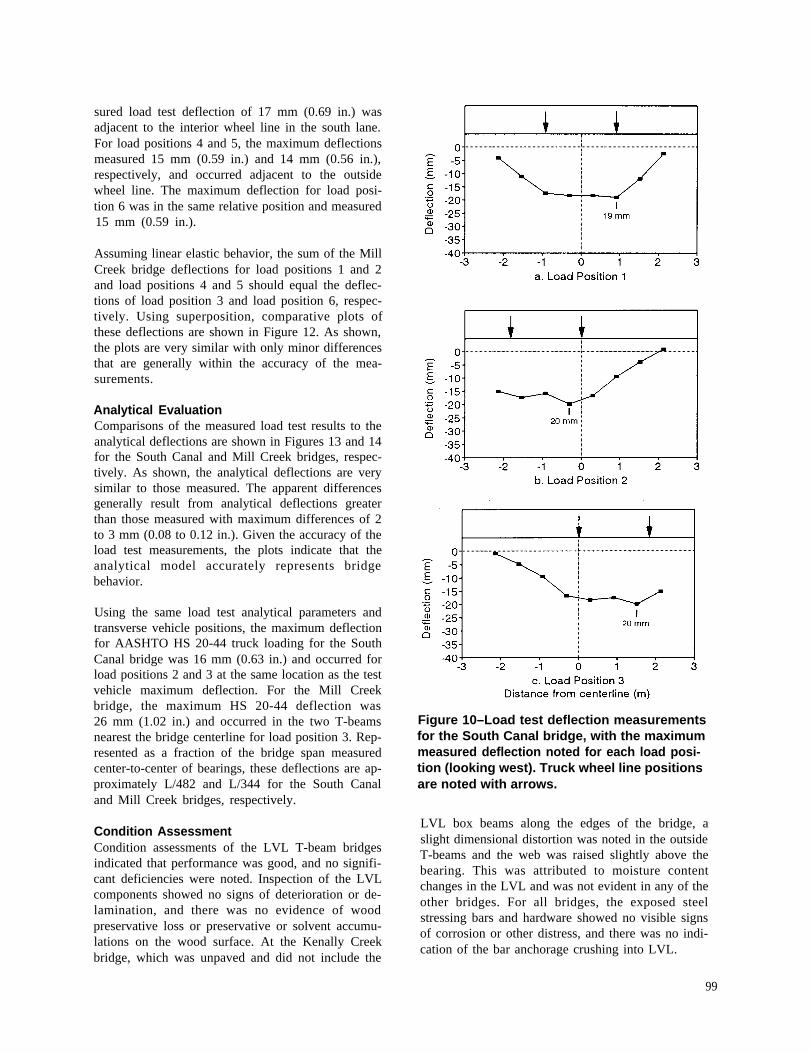
Load Test BehaviorLoad test transverse deflections for the South Canaland Mill Creek bridges are presented in Figures 10and 11, respectively. The interlaminar compressionat the time of the testing was 0.94 MPa (137 lb/in2)for the South Canal bridge and 1.19 MPa (172 lb/in2)for the Mill Creek bridge. For both bridges, the de-flection plots are similar to the orthotropic plate be-havior of stress-laminated deck bridges constructedof sawn lumber (Ritter et al. 1995). At the SouthCanal bridge, the maximum deflection for load posi-tion 1 measured 19 mm (0.75 in.) and occurred un-der the north wheel line. For load positions 2 and 3,the deflection profiles are approximately symmetricalwith maximum deflections of 20 mm (0.78 in.),occurring adjacent to the wheel line at the bridgecenterline, and adjacent to the north wheel line,respectively.
At the Mill Creek bridge, the maximum measureddeflections for load positions 1 and 2 measured14 mm (0.56 in.) and occurred at the interior T beamadjacent to the outside wheel line. With both vehicleson the bridge for load position 3, the maximum mea-
sured load test deflection of 17 mm (0.69 in.) wasadjacent to the interior wheel line in the south lane.For load positions 4 and 5, the maximum deflectionsmeasured 15 mm (0.59 in.) and 14 mm (0.56 in.),respectively, and occurred adjacent to the outsidewheel line. The maximum deflection for load posi-tion 6 was in the same relative position and measured15 mm (0.59 in.).
Assuming linear elastic behavior, the sum of the MillCreek bridge deflections for load positions 1 and 2and load positions 4 and 5 should equal the deflec-tions of load position 3 and load position 6, respec-tively. Using superposition, comparative plots ofthese deflections are shown in Figure 12. As shown,the plots are very similar with only minor differencesthat are generally within the accuracy of the mea-surements.
Analytical EvaluationComparisons of the measured load test results to theanalytical deflections are shown in Figures 13 and 14for the South Canal and Mill Creek bridges, respec-tively. As shown, the analytical deflections are verysimilar to those measured. The apparent differencesgenerally result from analytical deflections greaterthan those measured with maximum differences of 2to 3 mm (0.08 to 0.12 in.). Given the accuracy of theload test measurements, the plots indicate that theanalytical model accurately represents bridgebehavior.
Using the same load test analytical parameters andtransverse vehicle positions, the maximum deflectionfor AASHTO HS 20-44 truck loading for the SouthCanal bridge was 16 mm (0.63 in.) and occurred forload positions 2 and 3 at the same location as the testvehicle maximum deflection. For the Mill Creekbridge, the maximum HS 20-44 deflection was26 mm (1.02 in.) and occurred in the two T-beamsnearest the bridge centerline for load position 3. Rep-resented as a fraction of the bridge span measuredcenter-to-center of bearings, these deflections are ap-proximately L/482 and L/344 for the South Canaland Mill Creek bridges, respectively.
Condition AssessmentCondition assessments of the LVL T-beam bridgesindicated that performance was good, and no signifi-cant deficiencies were noted. Inspection of the LVLcomponents showed no signs of deterioration or de-lamination, and there was no evidence of woodpreservative loss or preservative or solvent accumu-lations on the wood surface. At the Kenally Creekbridge, which was unpaved and did not include the
Figure 10–Load test deflection measurementsfor the South Canal bridge, with the maximummeasured deflection noted for each load posi-tion (looking west). Truck wheel line positionsare noted with arrows.
LVL box beams along the edges of the bridge, aslight dimensional distortion was noted in the outsideT-beams and the web was raised slightly above thebearing. This was attributed to moisture contentchanges in the LVL and was not evident in any of theother bridges. For all bridges, the exposed steelstressing bars and hardware showed no visible signsof corrosion or other distress, and there was no indi-cation of the bar anchorage crushing into LVL.
99

Figure 11 –Load test deflection measurements for the Mill Creek bridge, with the maximum mea-sured deflection noted for each load position (looking east). Truck wheel line positions are notedwith arrows.
Concluding Remarks •
Field evaluation of six stress-laminated LVL T-beambridges indicates that structural and serviceabilityperformance is good, and the bridges should providemany years of acceptable service. Based on monitor-ing results, the following conclusions can be made.
• It is feasible and practical to construct stress- •
laminated bridges using LVL T-beams.
The moisture content of the T-beams at installationis typically 9%-12%. After installation, the LVLresponds relatively quickly to changes in environ-mental conditions. The moisture content of onebridge in the monitoring program increased from12% to 26% during 2.5 years.
Loss of bar force has not been a problem withstress-laminated LVL T-beams. Swelling of theLVL as the material gains moisture tends to main-tain a relatively high bar force, despite the effectsof wood stress relaxation.
100

Figure 12–Load position comparisons for theMill Creek bridge, showing load positions 1and 2 compared with load position 3 and loadpositions 4 and 5 compared with load position6
•
•
(looking east).
Response of the bridges to static truck loading islinear elastic and similar to that for stress-laminated decks constructed of sawn lumber.
The static load behavior of stress-laminated LVLT-beam bridges can be accurately modeled usinga transformed section and orthotropic plateanalysis.
Figure 13–Comparisons of the South Canalbridge measured deflections to the analyticaldeflections based on orthotropic plate analysis(looking west).
101

Figure 14—Comparisons of the Mill Creek bridge measured deflections to the analytical deflectionsbased on orthotropic plate analysis (looking east).
References
102

103

In: Ritter, M.A.; Duwadi, S.R.; Lee, P.D.H., ed(s). Nationalconference on wood transportation structures; 1996 October23-25; Madison, WI. Gen. Tech. Rep. FPL- GTR-94.Madison, WI: U.S. Department of Agriculture, Forest Service,Forest Products Laboratory.