EVALUATION OF SEAT VIBRATION SOURCES IN …jestec.taylors.edu.my/Vol 6 Issue 3 Junel...
18
Journal of Engineering Science and Technology Vol. 6, No. 3 (2011) 339 - 356 © School of Engineering, Taylor’s University 339 EVALUATION OF SEAT VIBRATION SOURCES IN DRIVING CONDITION USING SPECTRAL ANALYSIS MOHAMMAD HOSSEINI FOULADI 1, *, MOHD. JAILANI MOHD. NOR 2 , OTHMAN INAYATULLAH 3 , AHMAD KAMAL ARIFFIN 2 1 School of Engineering, Taylor’s University, Taylor’s Lakeside Campus No. 1 Jalan Taylor’s, 47500 Subang Jaya, Selangor DE, Malaysia 2 Department of Mechanical and Materials Engineering, Faculty of Engineering, Universiti Kebangsaan Malaysia, 43600 Bangi, Selangor, Malaysia 3 School of Manufacturing Engineering, Universiti Malaysia Perlis, 2600 Arau Perlis, Malaysia *Corresponding Author: [email protected] Abstract Seat vibration is one of the major causes of discomfort in moving vehicle. Tyre, engine, drivetrain and aerodynamic forces excite the cabin and interior through various pathways. In this paper, the contributions of tyre and engine vibration to seat excitations are studied. Virtual Source Analysis (VSA) is implemented to decompose the source signals into incoherent phenomena. Studying these phenomena (virtual sources) shows the amount and frequency bands that physical sources affect the seat vibration as the response channel. Experiment is conducted while riding on smooth and bumpy roads. Road roughness is characterized using International Roughness Index (IRI). VSA technique approve that tyre is the main source of seat vibration for the moving vehicle. Seat vibration has significant values below 400 Hz and tyre is found to be the dominant source of excitations for both smooth and bumpy roads. For smooth road, strong engine harmonics below 200 Hz also has some involvements. But in bumpy road, tyre vibration rise up and become the dominant broadband source of excitations. Tyre damper and engine mount Frequency Response Function (FRF) analysis show that these parts are designed to be highly efficient below 1400 Hz and 200 Hz, respectively. These ranges are identical with those that were found as the critical operational frequency spans in VSA. Keywords: Moving vehicle, Vibration of seat, Tyre and engine, IRI, VSA, Multi-channel spectral analysis, FRF.
Transcript of EVALUATION OF SEAT VIBRATION SOURCES IN …jestec.taylors.edu.my/Vol 6 Issue 3 Junel...

Journal of Engineering Science and Technology Vol. 6, No. 3 (2011) 339 - 356 © School of Engineering, Taylor’s University
339
EVALUATION OF SEAT VIBRATION SOURCES IN DRIVING CONDITION USING SPECTRAL ANALYSIS
MOHAMMAD HOSSEINI FOULADI1,*, MOHD. JAILANI MOHD. NOR
2,
OTHMAN INAYATULLAH3, AHMAD KAMAL ARIFFIN
2
1School of Engineering, Taylor’s University, Taylor’s Lakeside Campus
No. 1 Jalan Taylor’s, 47500 Subang Jaya, Selangor DE, Malaysia 2Department of Mechanical and Materials Engineering, Faculty of Engineering,
Universiti Kebangsaan Malaysia, 43600 Bangi, Selangor, Malaysia 3School of Manufacturing Engineering, Universiti Malaysia Perlis,
2600 Arau Perlis, Malaysia
*Corresponding Author: [email protected]
Abstract
Seat vibration is one of the major causes of discomfort in moving vehicle. Tyre,
engine, drivetrain and aerodynamic forces excite the cabin and interior through
various pathways. In this paper, the contributions of tyre and engine vibration to
seat excitations are studied. Virtual Source Analysis (VSA) is implemented to
decompose the source signals into incoherent phenomena. Studying these
phenomena (virtual sources) shows the amount and frequency bands that
physical sources affect the seat vibration as the response channel. Experiment is
conducted while riding on smooth and bumpy roads. Road roughness is
characterized using International Roughness Index (IRI). VSA technique
approve that tyre is the main source of seat vibration for the moving vehicle.
Seat vibration has significant values below 400 Hz and tyre is found to be the
dominant source of excitations for both smooth and bumpy roads. For smooth
road, strong engine harmonics below 200 Hz also has some involvements. But
in bumpy road, tyre vibration rise up and become the dominant broadband
source of excitations. Tyre damper and engine mount Frequency Response
Function (FRF) analysis show that these parts are designed to be highly
efficient below 1400 Hz and 200 Hz, respectively. These ranges are identical
with those that were found as the critical operational frequency spans in VSA.
Keywords: Moving vehicle, Vibration of seat, Tyre and engine, IRI, VSA,
Multi-channel spectral analysis, FRF.
340 M. Hosseini Fouladi et al.
Journal of Engineering Science and Technology June 2011, Vol. 6(3)
Nomenclatures
COPxy Coherent output power between channel x and y
Gxx(f) Autospectrum of channel x
Gxy(f) Cross spectrum between channel x and y
Hij Frequency response function for signal i and j
Spp Autospectrum of p inputs
Spq Cross-spectrum between input channel p and input channel q
Xi,j Conditioned signal i from signal j
xij jth value of the ith line of [X]pk
[S(f)]pp Cross-spectral matrix of p inputs
[U]pk Matrix of left eigenvectors for p inputs and k non-negligible eigenvalues
[X]pk Matrix of virtual sources for p inputs and k non-negligible eigenvalues
Greek Symbols
)(2fxyγ Ordinary coherence function between channel x and y
[σ]kk Diagonal matrix of square roots for k non-negligible eigenvalues
ω Frequency
ωo Frequency that calculation is conducted
1. Introduction
Seat vibration has great influence on human comfort while riding. Transfer paths
of vibration to passenger may be stated as seat, foot rest pad, steering wheel,
acceleration pedal and clutch lever. According to British Standards Institution [1],
exposure to vibration results in complex distribution of oscillatory forces within
the body. It may have effects on human activities as below:
• Ability of senses to achieve and processing information: even small
movements of an image on the retina can easily affect the vision. Vibration
may have small effects on hearing and touch senses and influence the
perception of body orientation and sitting stability.
• Amount of excitement, motivation or fatigue: observations have shown
that vibration can either improve or reduce the human performance.
• Intentional actions: whole body vibration may cause speech modulation.
Moreover it can highly affect the human ability in movements and doing tasks.
Up to 12 Hz, vibration affects all the human organs while vibrations above
12 Hz have a local effect. Low frequency (4-6 Hz) cyclic motions like those
caused by tyres rolling over an uneven road can put the body into resonance [2].
Biodynamic researches have shown that long term exposure with high intensity
whole body vibration increases the risk of health impairment. Lumbar spine and
connected nervous can be affected, metabolic and other internal factors may also
have additional effects. Degeneration of discs, vertebrae and muscle pain are
other outcomes of body vibration [3].
Bazrgari et al. [4] utilised a finite element model of the spine to study the
nonlinear load and direction-dependent properties of lumbar segments. They
implemented an iterative technique to predict low frequency trunk biodynamics in
vehicle seat’s vibration. Stein et al. [5] proposed a fore-and-aft suspension system

Evaluation of Seat Vibration Sources in Driving Condition 341
Journal of Engineering Science and Technology June 2011, Vol. 6(3)
model of seat, based on both experimental measurement and simulations. They
optimized the suspension elements parameters and identified the maximum
achievable attenuation by mathematical modeling. Lee, and Kim [6] analyzed
vibration characteristics of an automobile tyre that passes a cleat. They proposed
tyre design factors to reduce tyre and wheel vibration energy. Lee and Singh [7]
studied the non-linear and frequency dependent engine mount. The measured
dynamic stiffness properties of the isolator were implemented to predict the effects
of engine mount on the vehicle response. Maeda et al. [8] utilised frequency
weightings and root mean square (r.m.s) averaging as specified in ISO 2631-1 and
modeled the ride comfort of a vehicle seat. Amman et al. [9] conducted a research
on seat vibration comfort of vehicle. They subjectively and objectively quantified
idle vibration felt at the seat during steady-state idle conditions.
In previous paper [10] two methods were implemented to evaluate vibro-
acoustical sources of interior noise in stationary vehicle with neutral gear. Data
acquisition was convenient and measurement was controlled in motionless
condition. Furthermore, experiment may be conducted in anechoic chamber to
isolate the system from environmental noise and vibration. It was mentioned that
Virtual Source Analysis (VSA) technique was much faster and straight forward
compared to Conditioned Spectral Analysis (CSA) method which needed source
ranking and step by step signal conditioning. Motion of system was not a
dependent analysis variable; hence those techniques should be valid in driving
condition as well. A study is accomplished to check this validation by finding the
contribution of two sources; engine and tyre to seat vibration in driving situation.
Movement is a complicated process; various non-stationary sources may affect
the system and instrumentation needs extra care and expertise.
The rule of vibration isolators is to reduce the force transmission from sources
to receivers. These isolators are very useful at frequencies higher than a resonant
frequency. At frequencies equal or below the resonance, it is the duty of dampers
(elastomeric materials) to attenuate amplitudes of vibration response of the body,
engine, suspension or drivetrain [11]. Engine and drivetrain may be assumed as a
six degree of freedom system exhibiting axial, lateral, vertical displacement and
also yaw, pitch and roll rotations. The purpose of engine mount is to isolate or
attenuate these forces and moments to achieve the following goals [12]:
• To limit the engine and powertrain movement during ride and prevent high
cyclic stresses to damage engine, powertrain or chassis.
• To maintain the drivability.
• For reduction of structure-borne noise and vibration.
Moreover, they absorb the energy of engine vibration before reaching the radiator,
electronic controls and other components. For a successful engine mount, mobility of
both engine and chassis must be low at the mounting position. Tyre dampers (shock
absorbers) are placed at each vehicle wheel to control spring rebound and
compression. The purpose of suspension system can be mentioned as [13]:
• To sustain the vehicle weight
• To soften the vehicle movement when traveling over bumps and holes.
• To keep traction between the tyres and road; reduction in tyre tendency to
lift off the road surface.
• To maintain the wheels alignment.

342 M. Hosseini Fouladi et al.
Journal of Engineering Science and Technology June 2011, Vol. 6(3)
• Prevention/attenuation of the self excited vibration produced during the ride.
• To dampen shock impulse and dissipate kinetic energy.
Tyre damper helps to improve the ride quality by reducing the effects of
traveling over rough surfaces.
2. Methodology
2.1. Setup and instrumentation
The test vehicle was a mid-size Malaysian executive vehicle, Proton Perdana,
with a V-6 engine. It is a four-door sedan with a curb weight of 1336 kg. With 16-
inch rims and Lotus-tuned suspension settings, the car handles well through tight
corners and is a good high-speed cruiser.
Different sources affect the interior vibration of a moving vehicle such as
engine and drivetrain vibration, road profile and aerodynamic forces. In this
experiment, response channel was the seat vibration and involvement of only two
references, i.e. tyre and engine vibration was investigated. Brüel & Kjær portable
and multi-channel PULSE analyser type 3560D with five ENDEVCO isotron
accelerometers (uni-axial) type 751-100 were utilised in measurement devices.
Brüel & Kjær calibration exciter type 4294 was implemented to calibrate the
accelerometers. Transducer mounting is one of the most critical factors in
achieving accurate results. Poor attachment reduces the mounted resonance
frequency and severely limits the useful frequency range of the accelerometer.
Epoxy hard glue only slightly reduces the resonance frequency [14] and was a
good choice for measurement in moving condition. Triboelectric noise was
prevented by using low noise cables which were fixed to the structure by adhesive
tape. Two of the accelerometers were mounted before (engine bracket) and after
(engine chassis) the engine mount, the other two were fixed before (lower arm)
and after (strut mount) the front left damper. The last one was connected to a seat
base and all of them measured vibration in vertical axis. Experiment was carried
out over smooth and bumpy roads at 20 km/h and 40 km/h speeds. Figures 1 to 5
show the position of accelerometers which were connected to the vehicle body.
Figure 6 presents a schematic of the measurement assembly.
Fig. 1. Accelerometer Positions:
a) Before the Engine Mount, b) After the Tyre Damper.

Evaluation of Seat Vibration Sources in Driving Condition 343
Journal of Engineering Science and Technology June 2011, Vol. 6(3)
Fig. 2. Accelerometer Positions:
a) Before the Engine Mount, b) After the Engine Mount.
Fig. 3. Accelerometer Connected before the Engine Mount.
Fig. 4. Accelerometer Mounted at the Seat Base.
b

344 M. Hosseini Fouladi et al.
Journal of Engineering Science and Technology June 2011, Vol. 6(3)
Fig. 5. Accelerometer Mounted at the Lower Arm (before Damper).
Fig. 6. Schematic of the Measurement Plan.
2.2. Data acquisition and spectral analysis
Data was acquired over 3.2 kHz span with sampling frequency of 8.2 kHz.
Hanning window (general purpose for continues signals) with 75 percent overlap
was implemented for FFT analysis. The non-stationary signals (an example is
shown in Fig. 7) were averaged exponentially and 1000 spectral averages utilised
to reduce random error.
VSA technique was carried out for post processing of data and source
identification as mentioned in previous paper [10]. It was stated that first step is to
construct the cross-spectral matrix of input channels:
[ ]
⋅⋅
⋅⋅⋅⋅⋅
⋅⋅⋅⋅⋅
⋅⋅
⋅⋅
=
pppp
p
p
pp
SSS
SSS
SSS
fS
21
22221
11211
)( (1)

Evaluation of Seat Vibration Sources in Driving Condition 345
Journal of Engineering Science and Technology June 2011, Vol. 6(3)
Fig. 7. Non-Stationary Signal Measured at the Lower Arm,
Smooth Road, V= 40 km/h.
where p is the total number of inputs, elements on the main diagonal of [S(f)]pp
are auto-spectrum and the rest are cross-spectrum functions of input channels.
The number of incoherent sources (incoherent phenomena join in the deformation
of structure) are equal to the number of non-negligible eigenvalues of the cross
spectral matrix of inputs. Then Singular Value Decomposition (SVD) should be
applied to the cross spectral matrix of inputs at each frequency as below:
[S(f)]=USU* (2)
where U is the matrix of left eigenvectors and U* is conjugate transpose of U.
S is the diagonal matrix of eigenvalues. Hence the matrix of incoherent virtual
sources [X]pk can be derived as:
[X]pk= [U]pk [δ]kk (3)
where [U]pk is the matrix of left eigenvectors and [δ]kk is a diagonal matrix
which elements of its main diagonal are square roots of the corresponding k non-
negligible eigenvalues. For both of these matrices, only the first k columns are kept
and the rest are eliminated. This kind of decomposition is called principal
component analysis because each column of [X]pk characterizes one of the k
incoherent phenomena. Virtual coherence γij (signature) presents the amount of
coherency between a virtual source and an input channel. It is calculated as a result
of dividing the contribution of the virtual source j to the input channel i; | xij|2 by the
auto-spectrum of the corresponding input channel Sii as shown in Eq. (4):
ii
ij
ijS
x2
=γ (4)
Virtual sources are incoherent phenomena extracted from the physical sources
using SVD approach. Virtual coherence is an appropriate tool to link virtual

346 M. Hosseini Fouladi et al.
Journal of Engineering Science and Technology June 2011, Vol. 6(3)
sources to physical ones. For the ease of understanding, signatures can be shown
in a matrix form. Each row is related to a physical source. Horizontal axis shows
frequency spectrum and the colorbar presents the amount of coherency. This
matrix shows that how much every physical source is linearly related to a virtual
one along the frequency spectrum. By comparing the signatures of virtual sources
and their contribution to the response channel, contributions of each input channel
to the response are calculated.
Five uni-axial accelerometers are mounted then five data acquisition channels
are needed on the analyzer. Hence, index p in Eq. (2) is equal to five and the
square cross spectral matrix of sources has 5×5 dimensions. Afterward, SVD was
carried out and virtual sources were calculated. At the end, virtual coherence
functions linked the virtual sources to the physical ones.
2.3. Evaluation of international roughness index (IRI)
There are many formulae that can potentially be applied to describe the road
roughness. The most important analyses are moving average, Power Spectral Density
(PSD), Ride Number (RN) and IRI. Most analyses which were utilised before have
not accepted broadly because they are not widely available in the form of software.
They have high correlation with IRI and there is no need to use them again. IRI is
known as a general purpose roughness index that is strongly correlated to most kinds
of interesting vehicle responses. Road profiler users have shared experiences
measuring IRI; results from different states or countries are largely compatible and
may be compared. It is reproducible, portable, and stable with time [15]. Mohd. Nor et
al. [16] showed that IRI has good correlation with kurtosis and driver comfort. Two
type of roads, namely; smooth and bumpy are addressed in this paper. The purpose of
utilizing IRI is giving some idea to the reader about what it means by smooth and
bumpy. Then harshness of the road is quantified using IRI as a familiar standard
international value. IRI value can be defined approximately as below [17]:
8016.0
v
IRI
arms = (5)
where v is the vehicle speed in km/h and arms is weighted r.m.s acceleration of
seat base. Using Eq. (5), the IRI value of each road can be estimated at constant
vehicle speed read from the speed panel. Then roads may be characterized by
their IRI values.
The r.m.s weighted accelerations were determined by weightings obtained
from ISO 2631-1 [3]. The acceleration was frequency-weighted over the range of
0.5 to 80 Hz. The r.m.s vibration values were calculated from the frequency-
weighted accelerations using Eq. (6) [2]:
dttaT
a
T
wrms ⋅= ∫0
2 )(1 (6)
where aw(t) is weighted acceleration as a function of time and T is the
duration of measurement. Then arms was implemented in Eq. (5) to calculate the
IRI values and characterise the smooth and bumpy roads.
Evaluation of Seat Vibration Sources in Driving Condition 347
Journal of Engineering Science and Technology June 2011, Vol. 6(3)
2.4. Evaluation of frequency response function (FRF)
A linear system may be described as a frequency domain model, where the output
spectrum Y(f) is stated as the input spectrum X(f) weighted by a system descriptor
H(f). System descriptor H(f) is called FRF and defined as [18]:
)(
)()(
fX
fYfH = (7)
The Y(f) and X(f) are matrices of complex numbers having magnitude and
phase or real and imaginary components. Therefore each component of matrix
may Y(f) be divided by the corresponding component of matrix X(f) to produce
the related component of matrix H(f) throughout the frequency spectrum. Hence,
components of matrix H(f) are also complex numbers. It represents the ratio
between complex output and input numbers as a function of frequency f. In
practical situations, FRF is calculated differently in order to avoid errors due to
zeros in the denominator. One way is to use H1 estimator as below:
)(
)()(1
fG
fGfH
XX
XY= (8)
where GXX is autospectrum of input and GXY is cross spectrum between input
and output signals. In “Macro” level there is one system; the vehicle chassis.
Inputs are signals from transducers which were connected after engine mount
(engine chassis) and after tyre damper (strut mount). Output is the signal from the
seat base transducer. In “Micro” level, each component can be considered as a
system, e.g. engine mount. Then signal from the engine bracket is input and
acquired signal from the chassis after engine mount is the output. The same may
be defined for tyre damper; signal from the lower arm is input and signal from the
strut mount (after damper) is output.
The way to check the non-linearities or output noise is to estimate signal-to-
noise ratio at the output. It is the ratio between coherent and non-coherent power
at the output of a system:
)(
)()(
fNCOP
fCOPf
N
S= (9)
where COP and NCOP are coherent and non-coherent output powers as a
function of frequency, respectively. Presence of output noise or non-linear
components will result in low coherency and low signal-to-noise ratio. This
function at a component’s output, e.g. engine chassis is presented in Fig. 8. The
higher signal-to-noise ratio from zero dB is the better. Because it shows that the
linear component of output (COP or main signal as named by signal processing
engineers) is higher than the non-linear component (NCOP or noise component).
Passing a horizontal line at zero dB will show that many data are laying below
this; have contaminated by output noise and signal-to-noise ratio is low.
H1 estimator has great advantage in non-linear systems of automobile such as
engine mount and tyre damper. Normally, input signal measurement may be
controlled very well and there is less possibility to be influenced by noise. But
system response modifies the output signal and can be easily contaminated, e.g. at
antiresonances [19]. By calibrating the transducers, mounting correctly and using
standard low noise cables, negligible noise is available on the input signal and the

348 M. Hosseini Fouladi et al.
Journal of Engineering Science and Technology June 2011, Vol. 6(3)
input autospectrum GXX is measured correctly. Then by considering a sufficiently
large number of averages, the non-linear contribution or the output noise is
averaged out in the cross-spectrum GXY.
Fig. 8. Signal-to-Noise ratio Calculated at Engine Mount Output,
i.e. Engine Chassis, Smooth Road, V= 40 km/h.
2.5. Multiple coherence function
The multiple coherence function is an extension of the concept of ordinary
coherence that provides a measure of the linear dependence between a collection
of p inputs and an output. It is independent of the correlation among the inputs.
The multiple coherence function 2
!: pyγ can be shown as a function of ordinary and
partial coherence functions [20]:
)]1)...(1)(1[(1 2
)!1(
2
12
2
1
2
!: −⋅⋅ −−−−= ppyyypy γγγγ (10)
where the number of inputs are p and y is the output spectrum.
2.6. Error analysis
Coherence function )(2 fγ is the basis for signature analysis and estimated from auto
and cross spectrum density function with a limited accuracy. The normalized random
(standard) error for coherence function assessment may be estimated as below [21]:
[ ]d
r
nf
ff
⋅
−=
)(
))(1(2)(ˆ
2
22
γ
γγε (11)
where nd is number of spectral averages and )( fγ2 is coherence function. The
normalized random error rε for the magnitude of H1 can be estimated using Eq.
(9) [20]:

Evaluation of Seat Vibration Sources in Driving Condition 349
Journal of Engineering Science and Technology June 2011, Vol. 6(3)
[ ]d
rnf
ffH
2)(
)(1)(ˆ
2
2
1⋅
−=
γ
γε (12)
By using 1000 averages, random error for coherence function calculation even
at low coherency of 0.1 is found to be 0.13 (13 percent) which is still an
acceptable value. At the same condition, random error for FRF evaluation is 0.07
(seven percent) and shows that H1 is an adequate estimator for this analysis.
3. Results and Observations
The weighted r.m.s accelerations for smooth and bumpy roads where 0.2 m/s2 and
0.6 m/s2,
respectively which were calculated using frequency weighted
accelerations at 40 km/h. They were utilised in Eq. (5) and IRI values
approximated for smooth and bumpy roads as 2.1 (m/km) and 5.3 (m/km),
respectively. By looking for these values in IRI chart [15], the smooth road may
be attributed to a new pavement while bumpy road can be recognized as older
pavement, maintained or unpaved road.
Signals from transducers which were connected after engine mount, after tyre
damper and to seat base were utilised for source evaluations. Post processing was
accomplished and multiple virtual coherences between two virtual sources and all
the channels were calculated. Figure 9 shows that for bumpy road at 20 km/h,
considering two virtual sources is a proper choice since they have high coherence
over all the channels. The same results were obtained for other road and speeds.
Although only engine and tyre vibration were studied as available sources, but the
multiple coherence function was still high. Using more sources in the future
research (e.g. including drivetrain vibration) will improve this coherency and
move it to unity. The reason is that, using more sources will reduce the value of
)]1)...(1)(1[( 2
)!1(
2
12
2
1 −⋅⋅ −−− ppyyy γγγ in Eq. (10) by adding more coherencies. On the
contrary, this reduction will increase 2
!: pyγ at the left side of that equation.
Fig. 9. Multiple Coherence Function between the Two Virtual Sources
over all the Channels, V=20 km/h, Bumpy Road.

350 M. Hosseini Fouladi et al.
Journal of Engineering Science and Technology June 2011, Vol. 6(3)
Next, seat vibration was investigated for both roads as shown in Figs. 10
and 11. These graph show that the critical seat vibration region was below
400 Hz. It implies that dominant seeking sources might have excitations
below 400 Hz.
Fig. 10. Autospectrum of Seat Base Vibration, Smooth Road, V= 40 km/h.
Fig. 11. Autospectrum of Seat Base Vibration, Bumpy road, V= 40 km/h.
Signatures of virtual sources for smooth and bumpy roads while driving at
40 km/h are shown in Figs. 12 to 15. Almost the same patterns were obtained for
20 km/h and they were not added here. As fully described before [10], each row
shows the frequency contents of one source throughout the spectrum. Colorbar on
the right side of a graph presents the magnitude of coherence functions. For
smooth road, inspecting the first virtual source (Fig. 12) implied that tyre
vibration was the dominant source of excitations.

Evaluation of Seat Vibration Sources in Driving Condition 351
Journal of Engineering Science and Technology June 2011, Vol. 6(3)
Engine vibration mostly had contributions at some harmonics below 200 Hz
and few peeks around 300 Hz and 360 Hz. The second virtual source (Fig. 13)
included peeks from the engine vibration around 80, 280 and 380 Hz and was
not affected by tyre vibrations. Study of the virtual sources that were calculated
for bumpy road (Figs. 14 and 15) shows that engine vibration involvements
were reduced. Dominant peaks for engine vibration were less than 100 Hz and
some were around 200 Hz. Tyre vibration excited interior as a broadband
dominant source.
Fig. 12. Signatures of Virtual Source#1, Smooth Road, V= 40 km/h.
Fig. 13. Signatures of Virtual Source#2, Smooth Road, V= 40 km/h.
352 M. Hosseini Fouladi et al.
Journal of Engineering Science and Technology June 2011, Vol. 6(3)
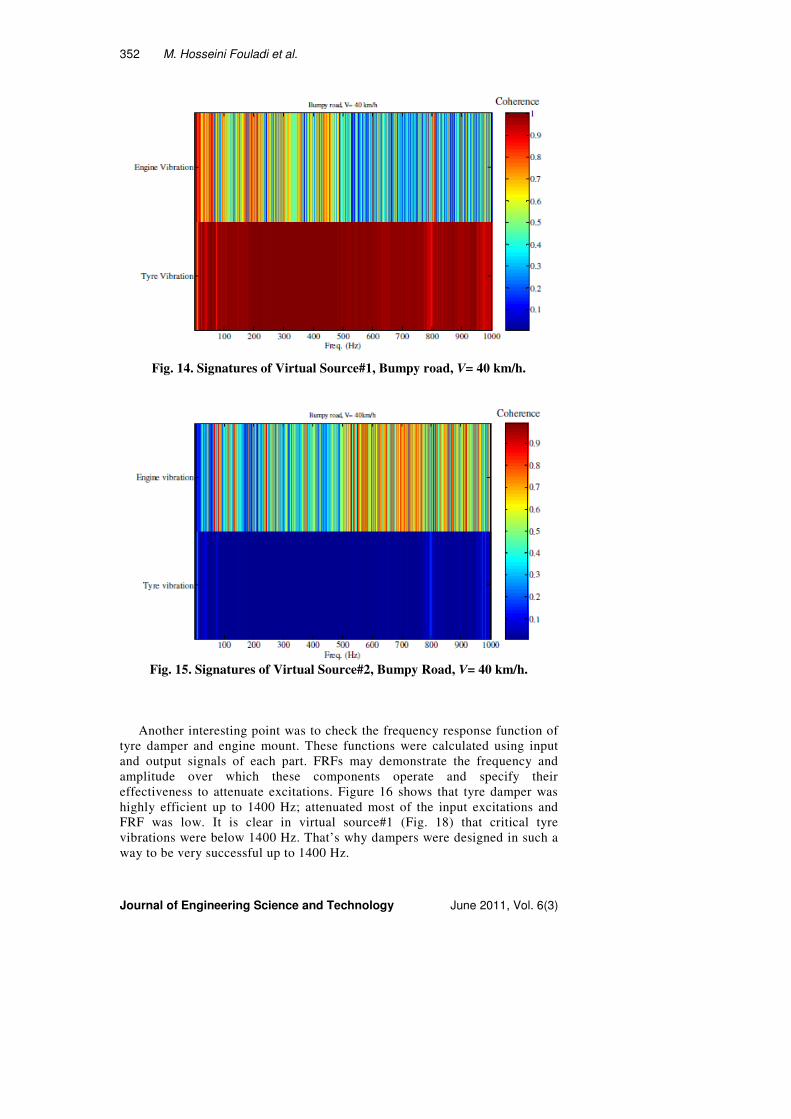
Fig. 14. Signatures of Virtual Source#1, Bumpy road, V= 40 km/h.
Fig. 15. Signatures of Virtual Source#2, Bumpy Road, V= 40 km/h.
Another interesting point was to check the frequency response function of
tyre damper and engine mount. These functions were calculated using input
and output signals of each part. FRFs may demonstrate the frequency and
amplitude over which these components operate and specify their
effectiveness to attenuate excitations. Figure 16 shows that tyre damper was
highly efficient up to 1400 Hz; attenuated most of the input excitations and
FRF was low. It is clear in virtual source#1 (Fig. 18) that critical tyre
vibrations were below 1400 Hz. That’s why dampers were designed in such a
way to be very successful up to 1400 Hz.

Evaluation of Seat Vibration Sources in Driving Condition 353
Journal of Engineering Science and Technology June 2011, Vol. 6(3)
Fig. 16. Frequency Response Function of Tyre Damper,
Smooth Road, V= 40 km/h.
Of course excitations could not be dampening by hundred percent and still
tyre vibration was the dominant source in this region. Same concept can be
observed from Figs. 17 and 18 for engine vibrations. Figure 17 shows that engine
mount was very effective in damping components below 200 Hz. As fully
discussed in previous paper [10] and can be seen in Fig. 18, this span includes the
dominant engine resonances and their harmonics. Therefore engine mount was
designed specially to be highly effective below 200 Hz and reduce the engine
vibrations before transmission to chassis.
Fig. 17. Frequency Response Function of Engine Mount,
Smooth Road, V= 40 km/h.

354 M. Hosseini Fouladi et al.
Journal of Engineering Science and Technology June 2011, Vol. 6(3)
Fig. 18. Signatures of Virtual Source#1, Smooth Road,
V= 40 km/h, 3000 Hz Frequency Span.
4. Conclusions
Spectral analysis technique was implemented successfully and sources were
separated in driving condition. Involvements of engine and tyre shaking to seat
vibration were studied while driving on smooth and bumpy roads. These roads
were characterized using IRI values. Seat vibration showed that frequencies
below 400 Hz had significant magnitudes and higher than that were negligible.
Results verified that tyre was the dominant source of excitations for both smooth
and bumpy roads. Engine harmonics below 200 Hz had more contribution in
smooth road. These peeks became weaker in bumpy road and tyre vibration grew
up to be the dominant broadband source of excitations. In bumpy road, tyre is
impacted by high amplitude random excitations. As a result, seat vibration will
have more contribution from these strong excitations rather than low amplitude
engine vibrations as before. Then changes may be observed as increase in virtual
coherences related to tyre and reduction of virtual coherences attributed to engine
in the signature results as shown in Fig. 14.
Moreover, FRFs of engine mount and tyre damper were of interest in this
study. Because these components had non-linear behaviours, signal-to-noise ratio
at their outputs was low. Therefore, H1 estimator was implemented as a special
function which had the ability to average out the non-linear contribution and
output noise. Investigation of tyre damper and engine mount FRFs implied that
these parts were designed to be highly efficient below 1400 Hz and 200 Hz
respectively. These ranges were identical with those found to be the critical
frequency boundaries in virtual source analysis. Utilisation of more sensors in the
future research will take account of more sources and make the reconstruction
approach more detailed and complete, e.g. mounting accelerometers to drive train
(e.g. gearbox) and all the tyres.

Evaluation of Seat Vibration Sources in Driving Condition 355
Journal of Engineering Science and Technology June 2011, Vol. 6(3)
References
1. British Standards Institution (1987). Measurement and evaluation of human
exposure to whole-body mechanical vibration and repeated shock, BS 684.
2. Griffin, M.J. (1996). Handbook of Human Vibration. (1st Ed.), Elsevier
Academic Press, ISBN: 0-12-303041-2.
3. International Organization for Standardization (1997). Mechanical vibration
and shock- Evaluation of human exposure to whole-body vibration. ISO
2631-1: 1997 (E).
4. Bazrgari, B.; Shirazi-Adl, A.; and Kasra, M. (2008). Seated whole body
vibrations with high-magnitude accelerations-relative roles of inertia and
muscle forces. Journal of Biomechanics, 41(12), 2639-2646.
5. Stein, G.J.; Zahoransky, R.; Gunston, T.P.; Burstrom, L.; and Meyer, L.
(2008). Modelling and simulation of a fore-and-aft driver’s seat suspension
system with road excitation. International Journal of Industrial Ergonomics,
38(5-6), 396-409.
6. Lee, T.K.; and Kim, B.S. (2008). Vibration analysis of automobile tire due to
bump impact. Applied Acoustics, 69(6), 473-478.
7. Lee, J.H.; and Singh, R. (2008). Nonlinear frequency responses of quarter
vehicle models with amplitude-sensitive engine mounts. Journal of Sound
and Vibration, 313(3-5), 784-805.
8. Maeda, S.; Mansfield, N.J.; and Shibata, N. (2008). Evaluation of subjective
responses to whole-body vibration exposure: Effect of frequency content.
International Journal of Industrial Ergonomics, 38(5-6), 509-515.
9. Amman, S.; Pielemeier, W.; Meier, R.; Bergeon, S.; Shiau, N.M.; and
Gorodisher, A. (2003). Subjective and objective quantification of steady-state
idle vibration felt through the seat. SAE Paper 2003-01-1512.
10. Hosseini Fouladi, M.; Mohd. Nor, M.J.; Ariffin, A.K. (2009). Spectral
analysis methods for vehicle interior vibro-acoustics identification.
Mechanical Systems and Signal Processing, 23(2), 489-500.
11. Wyerman, B.; Dinsmore, M.; Saha, P.; Baker, B.; Carey, A.; and Hadi, R.
(2003). Automotive noise and vibration control practices in the new
millennium. SAE Paper 2003-01-1589.
12. Harrison, M. (2004). Vehicle refinement-controlling noise and vibration in
road vehicle. Elsevier Butterworth-Heinemann publication, SAE, ISBN:
0768015057.
13. Crouse, W.H.; and Anglin, D.L. (1993). Automotive Mechanics. (10th
Ed.),
Career Education, ISBN: 0-02-800943-6.
14. Brüel & Kjær. (1998). Vibration transducers and signal Conditioning.
Lecture Note BA 7675-12.
15. Sayers, M.W.; and Karamihas, S.M. (1998). The little book of profiling.
Regent of the University of Michigan.
16. Mohd. Nor, M.J.; Hosseini Fouladi, M.H.; Nahvi, H.; and Ariffin, A.K.
(2008). Index for vehicle acoustical comfort inside a passenger car. Applied
Acoustics, 69(4), 343-353.
356 M. Hosseini Fouladi et al.
Journal of Engineering Science and Technology June 2011, Vol. 6(3)
17. Ahlin, K.; Tech, S.E.; and Granlund, J. (2001). International roughness index,
IRI, and ISO 2631 vibration evaluation. Washington DC: Transportation
Research Board.
18. Dossing, O. (1988). Structural testing, Part I: Mechanical mobility
measurements. Technical Note BR 0458-12, Brüel & Kjær.
19. Randall, R.B. (1987). Frequency analysis. (3rd
Ed.), Brüel & Kjær Publi-
cation BT 0007-11, ISBN: 8787355078.
20. Bendat, J.S.; and Piersol, A.G. (1980). Engineering applications of correlation
and spectral analysis. Wiley-Interscience, New York.
21. Herlufsen, H. (1984). Dual channel FFT analysis. Technical Review, No. 2,
Brüel & Kjær.