Exercises for spine - Guide 2 - Stabilising and strengthening

Economía Agraria y Recursos Naturales. ISSN: 1578-0732. e-ISSN: 2174-7350. Vol. 17,1. (2017). pp. 03-23
Evaluation of risk management tools for stabilising farm income under CAP 2014-2020Alba Castañeda-Veraa,b and Alberto Garridoa
a Research Centre for the Management of Agricultural and Environmental Risks (CEIGRAM). Technical Uni-versity of Madrid (UPM), Spain.b Agricultural Systems Group, Dpto. Producción Vegetal: Fitotecnia. Technical University of Madrid (UPM), Spain.
Acknowledgements: This research was funded by the project MULCLIVAR, from the Spanish Ministerio de Economía y Competitividad (MINECO) CGL2012-38923-C02-02, A. Castañeda-Vera has a PhD grant from UPM. We thank Isabel Bardají (Technical University of Madrid) for the clarifying discussions on public support to risk management tools in the EU and Spain.
Correspondence Author: Alba Castañeda-Vera. E-mail: [email protected].
Cite as: Castañeda-Vera & Garrido, A. (2017). Evaluation of risk management tools for stabilising farm income under CAP 2017-2020. Economía Agraria y Recursos Naturales - Agricultural and Resource Economics, 17(1), 3-23. doi: https://doi.org/10.7201/earn.2017.01.01.
Received on October 2016. Accepted on April 2017.
ABSTRACT: Guaranteeing farm income stability is an objective of the European Union’s and the Spanish agricultural policies. In this paper, CAP direct payments, diversification, crop insurance and an Income Stabilisation Tool (IST) were compared considering (i) their effect on farm income and income stability, (ii) the expected farmers’ willingness for adoption, and (iii) the efficiency of public expenditure invested in supporting them. Main conclusions point at direct payments and crop diversification as the most effective measures in decreasing income variability. Nevertheless, using crop insurance or an IST has potential for both improving farm resilience to income variability and limiting public expenditure.
KEYWORDS: Crop insurance, direct payments, diversification, income stabilisation fund, income volatility.
Evaluación de herramientas de gestión del riego para la estabilización de la renta agraria en el marco de la PAC 2014-2020
RESUMEN: Garantizar la estabilidad de la renta agraria es uno de los objetivos de las políticas agrarias española y comunitaria. Se comparan los pagos directos, la diversificación, los seguros agrarios y un Instrumento de Estabilización de Rentas (IER) respecto a (i) su efecto en la renta agraria y su estabilidad, (ii) la predisposición de los productores a adoptarlos y (iii) la eficiencia del gasto público. Los pagos directos y la diversificación son las medidas más eficaces para estabilizar la renta. El seguro y el IER mejoran la estabilidad de la renta con una alta eficiencia del gasto público.
PALABRAS CLAVE: Diversificación, fondo de estabilización de rentas, pagos directos, seguro agrario, volatilidad de la renta.
JEL classification / Clasificación JEL: Q10, Q18.
DOI: https://doi.org/10.7201/earn.2017.01.01.

4 Catañeda-Vera, A. and Garrido, A.
1. Introduction
Farm income is volatile due to fluctuating yields and input and output prices. Yield variability is mainly related to weather, and pests and diseases; while prices of the main commodities are set internationally based on global annual production, demand changes and stocks, and other market factors, all of them hardly affected by individual farmer decisions (Garrido et al., 2016).
Guaranteeing stability and a fair standard of living to farmers are objectives of the Common Agricultural Policy (CAP), already established by the EC Treaty. CAP measures to reach such objectives have evolved to meet social demands towards a more environmentally respectful agriculture and restraining CAP spending, as well as to respond to external aspects as World Trade Organization (WTO) negotiations. CAP has shifted from supporting product prices to supporting producers, mainly through direct payments. Market instruments remain now as safety nets, ensuring that intervention prices are only used under real crisis scenarios, thus exposing far-mers to significant variations of market prices.
For the eligible farmers, direct payments contribute to stability by ensuring a sta-ble source of income, while other CAP measures reinforce farm income stabilisation, like crop diversification and risk management tools. Crop diversification is a requi-rement for receiving the greening payment, which accounts to one third of the direct payment check. Besides enhancing environmental effects, crop diversification might reduce income fluctuation, compensating the possible worse performance of a crop with a better performance of another in the same year. The use of alternative mixed public-private risk management tools is helpful to buffer the negative effects of such fluctuations. Such products involve the co-responsibility of farmers, lower public expenditure, and when designed within certain limits, they are considered not to distort markets (Meuwissen et al., 2008). In other developed countries, like the U.S. and Canada, many insurance products and income stabilization tools are designed and offered to farmers, with significant public support. In Europe, well-developed agricultural insurance systems already exist, as it is the case of Spain (Bardají and Garrido, 2016). This alternative approach has been materialized after the last CAP reform supporting crop insurance, mutual funds and income stabilization tools (IST) through the European Agricultural Fund for Rural Development (EAFRD).
However, the actual success of such measures will not only depend on their abi-lity to stabilise farm income but also on the willingness of farmers to adopt them. Some of the measures do not entail an active participation of beneficiaries (uncon-ditional fraction of the direct payments), though others require a decision of farmers either by participating financially (insurance, saving accounts or mutual fund) or by modifying the farming strategy (diversification). Hence, it is relevant to ask whether farmers would be willing to adopt instruments that are available now and others up-coming in the next years.
Research about CAP’s recent and new risk management instruments has focused on the extent to which such tools can decrease income volatility (e.g. Enjolras et al., 2014) or income inequalities between farms (e.g. Finger and El Benni, 2014; Mary

Evaluation of risk management tools for stabilising… 5
et al., 2013) or in comparisons with already implemented tools. Also, research on risk management tools demand has looked at aspects as public incentives through subsidies or the presence of adverse selection (e.g. Donoghue, 2014; Garrido and Zil-berman, 2008a; Santeramo et al., 2016; Shaik et al., 2008). Farmers’ willingness to adopt such instruments, either by contracting them or by meeting cross-compliance to be beneficiaries, is relevant for policy-makers to design requirements and condi-tions of these instruments.
No evidence about the CAP 2014-2020 effects is yet available. This paper con-tributes to estimate such effects by analysing the role of alternative risk management tools and strategies to stabilize agricultural income in extensive arable farms in Spain and the potential willingness of farmers to adopt them. The analysis is illustrated with a representative arable farm in the region of Castilla y León (northern central Spain), the only Spanish region which has proposed to support Income Stabilisation Tool (IST) within its Rural Development Programmes (2014-2020), and a new tool for risk management proposed within the Rural Development policy. The aims of the paper are to (i) quantify farm income and income stability offered by alternative risk management strategies provided at the European, national and private level, (ii) es-timate the expected farmers’ willingness to adopt the available instruments, and (iii) evaluate the efficiency of public expenditure invested in subsidizing them.
The paper is organised as follows. Section 2 defines the risk management instru-ments evaluated in this work. Section 3 lays out the theoretical model and Section 4 describes its practical implementation. Section 5 presents the results that are discus-sed in Section 6. Lastly, Section 7 concludes the main findings.
2. Risk management instruments
Bielza et al. (2009) classified risk management tools in two groups, either con-cerning on-farm measures or risk sharing strategies. The first group involves on-farm resources changing the production strategy (diversification, input intensification, retention), the commercial strategy (vertical integration) or the use of farm benefits (stabilisation accounts). The second group involves third parties that assume part of the risk in return of a monetary reward (insurance or mutual funds).
Four risk management measures were considered within this work: CAP direct payments, crop diversification, crop insurance and an income stabilisation tool, de-signed as a mutual fund. Direct payments still play a great prominence in the global CAP budget. They contribute to ensuring the long term viability of farms by provi-ding a basic fixed income support, and therefore making them less vulnerable to fluc-tuations of income. Regulation (EU) No 1307/2013 sets out general guidelines for di-rect payments implementation, leaving a range of freedom to member states based on subsidiarity principle. Part of the direct payment is conditioned on the performance of farming practices enhancing the sustainable management of natural resources, the so-called, greening payment, being diversification one of the requisites. Diversifica-tion, through the introduction of more than a single crop in the farm, also contributes to farm income stability reducing yield and price fluctuation.

6 Catañeda-Vera, A. and Garrido, A.
Direct and decoupled payments scheme presumably incentivises farmers to orient farming decisions to markets. This enhances competitiveness, but in the current con-text of increasing market and price liberalization, it also exposes farmers to market risks and crises. A number of risk management instruments are available to comple-ment farmers’ coping capacity with large income losses.
Regulation (EU) No 1305/2013 on support for rural development by the European Agricultural Fund for Rural Development (EAFRD) considers in its article 36 the possibility of supporting the premium of crop, animal, and plant insurance, mutual funds for adverse climatic events, animal and plant diseases, pest infestations and environmental incidents and income stabilisation tools (IST). However, a number of EU countries already implement similar instruments supporting them through State aids, as it is the case of agricultural insurance in Spain. Using State aids comprises the advantages of being less restrictive in terms of loss coverage and subsidies, as they might be within the amber box in the WTO agriculture agreement.
Crop insurance is contracted by farmers to protect themselves against yield losses due to natural hazards such as hail, fire, crop damage caused by wild fauna, flood and excessive rainfall and other adversities impeding crop emergence or limiting crop growth (including drought). Multi-peril insurance for arable crops (including cereal, oilseed and protein crops) has been operating in Spain since 1982. It includes a num-ber of insurance modules that differ based on the coverage, on individual fields or the whole farm, rainfed or irrigated, in the way indemnities are calculated when a loss occurs, and on the maximum insurable yield guaranteed.
Crop insurance premiums are proportional to insured yields, vary depending on the contracted module and deductible, and are subsidized by the national and regional governments. Updated maximum insurable yield per municipality is published every year in the Spanish Official Gazette (BOE). For farmers that have contracted the insu-rance in previous years, maximum insurable yield is based on his/her claims history.
IST works as a mutual fund protecting against low incomes. Regulation (EU) No 1305/2013 states in its article 39 that support to IST is allowed to contribute to up to 65 % of the corresponding indemnity to farmers. Such allowance is only permitted when the IST compensates only a drop of income exceeding 30 % of the average annual income of the individual farmer in the preceding three-year period (or a three-year average based on the preceding five-year period excluding the highest and lowest entry and payments), to fit with WTO regulations for being considered a green box measure of support. Additionally, such compensation shall compensate no more than 70 % of the lost income in the year the producer becomes eligible to receive this assistance.
Article 39 in Regulation 1305/2013 specifies that income, for the purposes IST, shall refer to the sum of revenues the farmer receives from the market, including any form of public support, deducting input cost, therefore, to gross margin. Therefore, the IST was defined as follows. Each year, before the growing season, the farmer pays a premium to the mutual fund of the IST. After harvest selling, if income is lower than the 70 % of the average income received by the farmer in the preceding

Evaluation of risk management tools for stabilising… 7
five-year period, excluding the highest and lowest entry, the farmer is correspond-ingly indemnified.
3. Theoretical framework
Producers are expected to design their farming strategy based on the expected utility of different alternatives. Farm income and income stability are core variables driving the utility of a certain outcome.
Farm income (excluding fixed costs) results from deducing farming variable costs:
[1]
where is the expected farm income available for the farmer in the year t, xi is the proportion of the crop i in the rotation (takes the value 1 when monoculture) and Ci are the direct costs associated to crop i. Average income was calculated assuming that farm strategy, either monoculture or crop rotation, does not change in time.
is the expected farm revenue in the year t, and it was calculated as follows:
[2]
where and are the price and yield of crop i in year t, are the results of the protection tools in year t, including premiums and indemnities, and CAP is the direct payment received by the farmer. Three possibilities of CAP direct payments were considered depending on whether or not the farmer would be a beneficiary, and if so meeting or not meeting greening requirements.
Both xi and Ci are assumed to be constant per crop. On the contrary, crop prices and yields vary from year to year as a consequence of climate variability and extreme events, and consequently, varies as well. is calculated differently depending on the protection option (with = 0, when no protection tool is used). is calculated based on the protection tool, crop insurance or IST (Eq 3 and 4, respectively).
Contracting crop insurance implies paying a premium (PCI) every year before sowing. Assuming farmer has been contracting insurance for years, insured yields (Yins,i) should be close to average observed yields. Insured yield was set at the ave-rage yield of the farmer in the preceding five-year period, excluding the highest and lowest entries. For arable crops insurance, farmers have the option of increasing the insured yield at midseason with a complementary insurance payment if yield expec-tation exceeds that insured before sowing. In this work, for the sake of simplicity, this option was not modelled. Indemnities are received when actual yield falls below a certain proportion of the insured yield, a franchise (M):

8 Catañeda-Vera, A. and Garrido, A.
[3]
where Yins,i is the insured yield of crop i.Contracting the IST also implies paying a premium (PIST) every year before
sowing. Indemnities are received when actual income falls below a certain proportion of the average income, a franchise (M):
[4]
where is the average income in the last 5 years.Therefore, both crop insurance and IST have a cost to the farmer (premium) and
possible revenues (indemnities). IST and crop insurances premiums are paid inde-pendently from farm performance.
4. Empirical application
Two farm strategies scenarios were evaluated: a wheat monoculture (Triticum aestivum L.) and a crop rotation meeting CAP greening requirements including 40 % wheat, 40 % barley (Hordeum vulgare L.) and 20 % dry beans (Pisum sativum L.).
Data on mean yields and market prices in Valladolid province (Castilla y León) between 1993 and 2015 are publicly available at the regional government website (JCyL, 2014) (Figures 1 and 2). Wheat prices, following the same pattern of inter-national commodity prices, have experienced an increase and a high volatility from 2007 (FAO, 2011). Average costs were calculated per crop based on surveyed farms between 2010 and 2013 in Valladolid province by ECREA resulting in 267, 237 and 105 € ha–1 for wheat, barley and dry peas respectively (MAGRAMA, 2015).
Yield and prices were modelled with the software package @-Risk (Palisade Corporation, 2011) fitting data to the probability distribution functions with the lower value of the statistic chi-square. Asymmetric density functions non bounded on the right and truncated at zero in the left were selected, as used by many authors (Bielza et al., 2004).
Crop yields were modelled using 23 yearly observations (1993-2015). Wheat and dry peas were fitted to beta distributions and barley to a gamma. Several authors point at the significant decrease in yield variability when the aggregation scale of the data used in the analysis increases (Finger, 2012; Górski and Górska, 2003; Lobell et al., 2007; Marra and Schurle, 1994; Rudstrom et al., 2002). Marra and Schurle (1994) concluded that standard deviation of yields should be corrected on about 0.1 % for each 1 % of difference between the mean areas of the scales considered.

Evaluation of risk management tools for stabilising… 9
The average wheat area per farm in the study region is 58.9 ha(INE, 2014), and the agricultural rainfed area of the province, 495,000 ha (JCyL, 2014). Using Marra and Schurle (1994) approximation, a rough estimation for a conversion factor to trans-form province-level to farm-level risks results in 10 % increase in yield standard deviation from province to farm, that was applied to the crop yield distribution functions. Additionally, a probability of extreme event damage as hail or fire was considered and set at 4.6 % (Agroseguro, personal communication). Crop yields were found to be correlated at 0.94 for wheat-barley, 0.63 for wheat-peas and 0.65 for barley-peas. Such correlations were considered in the simulation model.
FIGURE 1
Wheat, barley and dry peas average yield (tonnes ha‒1) in Valladolid province between 1993 and 2015
Source: JCyL (2014).
Lognormal distributions were used for prices, as in Bielza et al. (2004) following Goodwin et al. (2000). With the aim to evaluate the effectiveness of each of the con-sidered risk management alternatives, and based on the sharply differentiated periods of price volatility, crop prices were modelled for two scenarios. The first scenario included data in the period 1993 to 2006 characterised by low and stable prices (Low and stable scenario). Data from 2007 to 2015, characterized by high and volatile pri-ces, was used in the second scenario (High and volatile scenario) (Figure 3).
The franchise for crop insurance and the IST was 30 %, therefore farmers are indemnified only when the drop of yields and income exceeds a 30 % of the ave-

10 Catañeda-Vera, A. and Garrido, A.
rage yield and income, respectively. Indemnities compensate for 70 % of the yield or income lost in the year the farmer becomes eligible to receive this assistance, for the crop insurance and the IST respectively. The average value of the basic CAP payments rights was set at 90.92 € ha-1 (value for 2019) for direct payment bene-ficiaries and an increase in 51.7 % when meeting greening requirements, therefore 137.93 € ha-1 (FEGA, 2016).
FIGURE 2
Wheat, barley and dry peas average price (€ tonne‒1) in Valladolid province between 1993 and 2015
Source: JCyL (2014).
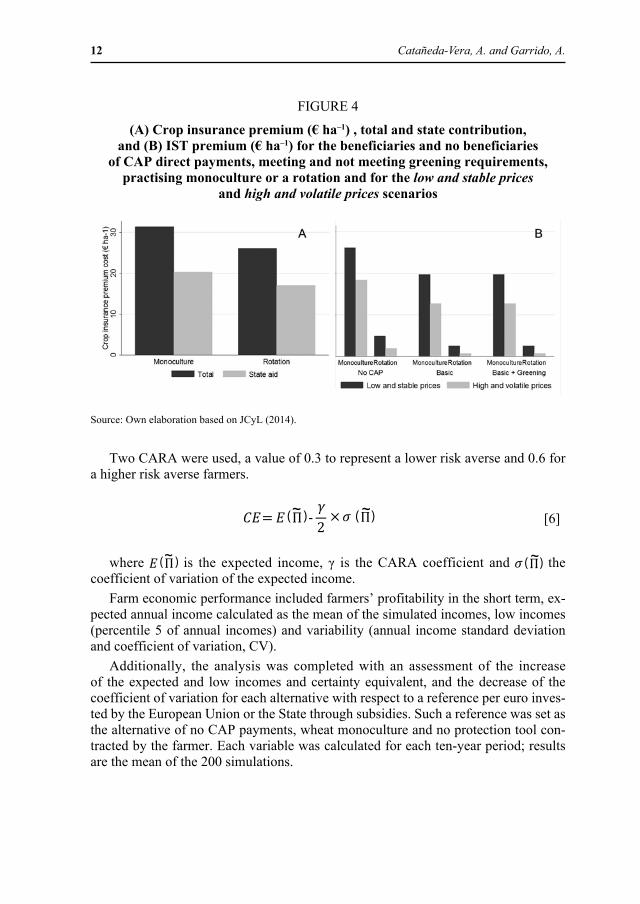
Crop insurance and IST premiums were calculated as the expected value of the indemnities using 2000 simulated yields and prices. Insurer’s loading and commis-sions were assumed to be 20 % of the premium. The same loading was charged to the IST mutual fund as a safety measure for assuring the fund capacity to overcome crisis. Crop insurance premium is independent from prices and, therefore, it did not change in the two scenarios, it was calculated at 31.4 € ha–1 for wheat monoculture and at 26.1 € ha–1 for crop rotation. A 65 % of the insurance premium is defrayed by the State. On the contrary, as IST indemnities depend on income, besides crop yields,

Evaluation of risk management tools for stabilising… 11
IST premium also depends on crop prices and CAP direct payments. IST premium is not calculated over the accumulated indemnities, but on the 35 %, as the remainder is defrayed by the European Commission. Calculated premiums are shown in Figure 4.
Each of the combined alternatives (direct payments, diversification and protection tools) was evaluated for the two prices scenarios, using 2000 yield and prices simula-tions were analysed in 200 ten-year periods.
FIGURE 3
Wheat, barley and peas price distributions in the low and stable prices scenario (L-S, representing the period 1993-2006) and the high and volatile prices
scenario (H-V, representing the period 2007-2015)
Source: Own elaboration based on JCyL (2014).
Farmers’ evaluation for alternative farming strategies and risk protection tools were assessed by means of farmer’s certainty equivalent. Farmers’ certainty equi-valents were calculated following Bielza et al. (2007), assuming to be directly pro-portional to expected income and inversely proportional to CV. Risk aversion was assumed to be constant independently from farmers’ profitability, therefore using Constant Risk Aversion Coefficients (CARA).
12 Catañeda-Vera, A. and Garrido, A.
FIGURE 4
(A) Crop insurance premium (€ ha–1) , total and state contribution, and (B) IST premium (€ ha–1) for the beneficiaries and no beneficiaries
of CAP direct payments, meeting and not meeting greening requirements, practising monoculture or a rotation and for the low and stable prices
and high and volatile prices scenarios
Source: Own elaboration based on JCyL (2014).
Two CARA were used, a value of 0.3 to represent a lower risk averse and 0.6 for a higher risk averse farmers.
[6]
where is the expected income, γ is the CARA coefficient and the coefficient of variation of the expected income.
Farm economic performance included farmers’ profitability in the short term, ex-pected annual income calculated as the mean of the simulated incomes, low incomes (percentile 5 of annual incomes) and variability (annual income standard deviation and coefficient of variation, CV).
Additionally, the analysis was completed with an assessment of the increase of the expected and low incomes and certainty equivalent, and the decrease of the coefficient of variation for each alternative with respect to a reference per euro inves-ted by the European Union or the State through subsidies. Such a reference was set as the alternative of no CAP payments, wheat monoculture and no protection tool con-tracted by the farmer. Each variable was calculated for each ten-year period; results are the mean of the 200 simulations.

Evaluation of risk management tools for stabilising… 13
5. Results
Results are presented as the main statistics of farm income, certainty equivalents and public cost efficiency. They refer to farmer’s profitability (expected annual in-come), low incomes (percentile 5 of annual incomes) and variability (annual income standard deviation and coefficient of variation), all this reported in Table 1. Farmer’s willingness to adopt these measures is evaluated based on the certainty equivalents for two levels of farmer risk aversion (Table 2). Lastly, public cost (PC, € ha–1) and the efficiency of public support for each alternative are shown in Table 3 in terms of expected and low incomes, coefficient of variation and certainty equivalent for high risk averse farmers (CE0.6).
Direct payments were the most effective measure in increasing farm expected and lower incomes. Farms receiving direct payments were significantly more profitable when meeting greening requirements (Table 1) as also receiving greening payment. The probability of having a negative income decreases for higher direct payments scenario, for crop rotation and when opting for a protection tool (either crop insu-rance or the IST) (Table 1).
Contracting protection tools (either crop insurance or the IST) was less effective in increasing farm expected and lower incomes than direct payments. This is due to the annual crop insurance and IST premium cost (Table 1). Regarding the protection tools, the IST was always more effective than crop insurance in terms of increasing farmer’s profitability (expected annual income) (Table 1).
Income variability was evaluated in absolute terms (standard deviation) or with respect to the mean income (CV). Direct payments were the most effective measure in decreasing annual income variability, followed by diversification. Results show that the decrease in income variability is caused particularly by a reduction of the left tail of income’s distribution, while differences in the expected incomes are much lower (Table 1). Regarding protection options, the IST was more effective than crop insu-rance in increasing farm lower incomes and decreasing income variability (Table 1).
Direct payments are expected to be the measure that most satisfies farmers. Re-garding protection tools, the IST is expected to be the preferred (Table 2).
Direct payments, crop insurance and IST involve public expenditure. Direct pay-ments were clearly the most expensive (Table 3). A more interesting analysis arises from evaluating public expenditure of the instruments not in absolute terms but rela-tive to the fulfilment of their objectives, thus increasing expected and low incomes, decreasing income variability and increasing farmer’s willingness to adopt certain strategies, as shown in Table 3. Higher public expenditure efficiency was found for subsidizing protection tools than for direct payments, especially for increasing low incomes and decreasing variability per € of public expenditure. Regarding protection tools, higher public expenditure efficiency was found for subsidized IST than for crop insurance but for the most risky case, that is, for no CAP beneficiaries, prac-tising monoculture in the High and Volatile prices scenario. Efficiency was always higher for farms diversifying (Table 3).

14 Catañeda-Vera, A. and Garrido, A.
TABLE 1
Expected income1, percentile 5 of incomes (p5) and income standard deviation (St dev, € ha-1) and coefficient of variation, (CV, –) for the beneficiaries and no beneficiaries of CAP direct payments, meeting and not meeting
greening requirements, practising monoculture or a rotation and using crop insurance, an income stabilization tool (IST) or no protection option for two
prices scenarios (low and stable and high and volatile)
Scenario LOW and STABLE
Scenario HIGH and VOLATILE
Direct payments Strategy Protection
option Exp3 p5 St dev CV Exp p5 St
dev CV
None
Monoculture
None 94 -110 134 2.22 231 -54 199 1.17
Crop insurance 102 -39 106 1.19 247 43 163 0.71
IST 127 39 75 0.58 265 123 130 0.50
Rotation
None 84 -56 102 1.54 202 0 155 0.81
Crop insurance 90 -18 86 1.03 215 51 136 0.65
IST 117 44 67 0.60 238 118 115 0.49
Basic
Monoculture
None 185 -19 134 1.96 322 37 199 0.65
Crop insurance 193 52 106 0.59 337 134 163 0.49
IST 213 115 83 0.40 353 199 138 0.39
Rotation
None 175 35 102 0.60 293 91 155 0.54
Crop insurance 181 73 86 0.48 306 142 136 0.45
IST 199 115 75 0.38 321 190 123 0.38
Basic + Greening
Monoculture2
None 232 28 134 0.62 369 84 199 0.56
Crop insurance 240 99 106 0.46 384 181 163 0.43
IST 255 151 87 0.35 395 235 142 0.36
Rotation
None 222 82 102 0.47 340 138 155 0.46
Crop insurance 228 120 86 0.38 353 189 136 0.39
IST 241 151 79 0.33 364 227 126 0.35
1 Income refers to gross margin, as it only includes variable costs.2 Only if farm area is lower than 30 ha.3 Exp: Expected income.

Evaluation of risk management tools for stabilising… 15
TABLE 2
Certainty equivalent (CE, € ha-1) for two coefficients of absolute risk aversion (CARA) for the beneficiaries and no beneficiaries of CAP direct payments, meeting and not meeting greening requirements, practising monoculture or a rotation and using crop insurance, an income stabilization tool (IST) or no protection option for two prices scenarios (low and stable and high
and volatile)
Scenario LOW and STABLE
Scenario HIGH and VOLATILE
Direct payments Strategy Protection option CE20.3 CE0.6 CE0.3 CE0.6
None
Monoculture
None 54 13 171 112
Crop insurance 70 38 198 149
IST 104 82 226 187
Rotation
None 54 23 156 109
Crop insurance 65 39 174 133
IST 97 77 203 169
Basic
Monoculture
None 145 104 262 202
Crop insurance 161 129 289 240
IST 188 163 311 270
Rotation
None 145 114 247 200
Crop insurance 156 130 265 224
IST 176 154 284 248
Basic + Greening
Monoculture1
None 192 151 309 249
Crop insurance 208 176 336 287
IST 229 203 353 310
Rotation
None 192 161 294 247
Crop insurance 203 177 312 271
IST 218 194 326 288
1 Only if farm area is lower than 30 ha.2 Certainty equivalent for a Coefficient of Relative Risk Aversion of 0.3 (CE0.3) and 0.6 (CE0.6).

16 Catañeda-Vera, A. and Garrido, A.T
AB
LE
3
Publ
ic e
xpen
ditu
re (P
C, €
ha-1
yr-1
) and
pub
lic e
xpen
ditu
re e
ffic
ienc
y (€
€-1) w
ith r
espe
ct to
the
expe
cted
inco
me,
inco
me
stab
ility
and
cer
tain
ty e
quiv
alen
t (C
E),
for
the
bene
ficia
ries
and
no
bene
ficia
ries
of C
AP
dire
ct p
aym
ents
, mee
ting
and
not m
eetin
g gr
eeni
ng r
equi
rem
ents
, pra
ctis
ing
mon
ocul
ture
or
a ro
tatio
n an
d us
ing
crop
insu
ranc
e, a
n in
com
e st
abili
zatio
n to
ol (I
ST) o
r no
pro
tect
ion
optio
n fo
r tw
o pr
ices
scen
ario
s (lo
w a
nd st
able
and
hig
h an
d vo
latil
e)
Publ
ic e
xpen
ditu
re e
ffic
ienc
y3 (€
€–1)
Scen
ario
LO
W a
nd S
TA
BL
ESc
enar
io H
IGH
and
VO
LA
TIL
E
Dir
ect p
aym
ents
Stra
tegy
Prot
ectio
n op
tion
PE2
Exp
ecte
dL
owC
VC
E0.
6PE
2E
xpec
ted
Low
CV
CE
0.6
Non
e
Mon
ocul
ture
Non
e (R
ef 1
)0
--
--
0-
--
-
Cro
p in
sura
nce
200.
43.
5-0
.050
1.2
200.
84.
8-0
.022
1.8
IST
331.
04.
5-0
.049
2.1
390.
94.
5-0
.017
1.9
Rot
atio
n
Non
e0
--
--
0-
--
-
Cro
p in
sura
nce
17-0
.25.
4-0
.070
1.5
17-1
.06.
2-0
.030
1.3
ISA
231.
06.
8-0
.072
2.8
260.
36.
6-0
.026
2.2
Bas
ic
Mon
ocul
ture
Non
e91
1.0
1.0
-0.0
031.
091
1.0
1.0
-0.0
061.
0
Cro
p in
sura
nce
111
0.9
1.5
-0.0
151.
011
11.
01.
7-0
.006
1.2
IST
117
1.0
1.9
-0.0
161.
312
41.
02.
0-0
.006
1.3
Rot
atio
n
Non
e91
0.9
1.6
-0.0
181.
191
0.7
1.6
-0.0
071.
0
Cro
p in
sura
nce
108
0.8
1.7
-0.0
161.
110
80.
71.
8-0
.007
1.0
IST
107
1.0
2.1
-0.0
171.
311
10.
82.
2-0
.007
1.2
Bas
ic +
Gre
enin
g
Mon
ocul
ture
1
Non
e13
81.
01.
0-0
.012
1.0
138
1.0
1.0
-0.0
041.
0
Cro
p in
sura
nce
158
0.9
1.3
-0.0
111.
015
81.
01.
5-0
.005
1.1
IST
161
1.0
1.6
-0.0
121.
216
81.
01.
7-0
.005
1.2
Rot
atio
n
Non
e13
80.
91.
4-0
.013
1.1
138
0.8
1.4
-0.0
051.
0
Cro
p in
sura
nce
155
0.9
1.5
-0.0
121.
115
50.
81.
6-0
.005
1.0
IST
151
1.0
1.7
-0.0
131.
215
50.
91.
8-0
.005
1.1
1 O
nly
if fa
rm a
rea
is lo
wer
than
30
ha.
2 PE
: Pub
lic e
xpen
ditu
re (i
nsur
ance
pre
miu
m +
CA
P di
rect
pay
men
ts) (
€ ha
-1 y
r-1).
3 EI
: Δ E
xpec
ted
inco
me/
PC, C
V: Δ
Coe
ffic
ient
of V
aria
tion/
PC, C
E 0.4:
Δ C
erta
inty
equ
ival
ent f
or a
Coe
ffic
ient
of R
elat
ive
Ris
k A
vers
ion
of 0
.4/P
C a
nd C
E 0.6:
Δ C
er-
tain
ty e
quiv
alen
t for
a C
oeff
icie
nt o
f Rel
ativ
e R
isk
Ave
rsio
n of
0.6
/PC
, all
with
resp
ect t
o (R
ef 1
) are
refe
rred
to a
ltern
ativ
e 1,
no
CA
P be
nefic
iary
, mon
ocul
ture
and
no
prot
ectio
n sy
stem
.

Evaluation of risk management tools for stabilising… 17
Public expenditure was efficient as well in potentially increasing farmer’s willingness to contract crop insurance and IST, especially when farmers were not CAP beneficiaries and for more risk-averse farmers (Table 3).
Farmer’s profitability and low income were higher in the high and volatile pri-ces scenario. For this scenario, the income standard deviation was higher but the coefficient of variation was lower than for the low and stable prices scenario. The efficiency of protection tools in decreasing income variability was higher in the low and stable prices scenario (between 12 and 85 %) than in the high and volatile prices scenario (between 39 and 70 %). Higher decreases were found for the riskier alterna-tives, that is, no CAP beneficiaries practicing monoculture (Figure 5).
FIGURE 5
Decrease in the income coefficient of variation (%) with respect to a reference (No CAP, monoculture and no protection tool) for the beneficiaries
and no beneficiaries of CAP direct payments, meeting and not meeting greening requirements, practising monoculture or a rotation and using crop
insurance, the Income Stabilisation Tool (IST) or no protection option for (A) the low and stable prices and (B) high and volatile prices scenarios
Source: Own elaboration based on simulation results.
6. Discussion
Direct payments were the most effective measure in terms of increasing farms expected and lower incomes. This is in agreement with conclusions drawn about the income effects of direct support in the post 2003 scheme, as the one performed by Agrosynergie (2011). Such evaluation was performed at regional scale for the EU-27 covering macroeconomics, based on regional data, and microeconomics, on indivi-dual farm data for seven types of farming, economic farm size, farm location and

18 Catañeda-Vera, A. and Garrido, A.
types of farm organization. Agrosynergie (2011) concludes that decoupled payments provide a positive and robust contribution to increasing and stabilizing income.
Farms receiving direct payments were significantly more profitable when meeting greening requirements. Therefore, direct payments also have a clear effect of lowe-ring farm risk, even when such measure is not directly intended to support farm risk management (as it increases farm expected income), shortening the left-tail of the income distribution; in the case of the CAP 2014-2020, also indirectly promoting the adoption of risk management measures, namely crop diversification, to meet gree-ning requirements.
Crop diversification is a requirement for being eligible to greening payments. It does not require any direct public support but affords a significant decrease in in-come variability. Morales et al. (2008) found farm diversification to be a clear substi-tute to insurance and futures and option markets, being diversified farmers those with a lesser need to contract such risk sharing tools. Similarly, Santeramo et al. (2016) found insurance demand to be negatively correlated with crop diversification, and concluded that it constitutes itself a form of insurance. Similar conclusions are drawn in this work, where farms diversifying had lower income variability, therefore ha-ving a lower need to contract protection tools. Aside of contributing to farm income stability reducing yield and price fluctuation, greening could be expected to decrease income as it might imply a higher marginal cost per crop included in the rotation as far as specialization decreases. However, in the particular case, greening resulted in a higher income due to the high prices of dry peas and the fact that fixed and not varia-ble costs were considered.
Greening could be seen as decreasing farmer’s utility as it is actually imposed by the CAP, and not voluntarily done by farmers. This could bring them to cast doubts on the foundation to calculate the Certainty Equivalent. Yet, Certainty Equivalent in this paper might be seen as providing meaningful results when considering a purely rational behaviour of farmers and the favourable economic results of the rotation strategy of this case study.
Contracting protection tools contributed significantly to decreasing income’s coefficient of variation. This result is in agreement with previous studies on the potential effects of income stabilization tools on income stability in the sense that it contributes to decreasing income variability (Finger and El Benni, 2014; Mary et al., 2013). Mary et al. (2013) evaluated the potential implementation of the IST introdu-ced by the CAP 2014-2020 using a farm household model calibrated to French cereal farms and found a high efficiency of the tool, being the decrease in income coeffi-cient of variation of more than 35 %. In this work, decreases in income coefficient of variation when using the IST were between 73 and 85 % in the low and stable prices scenario and between 57 and 70 % in the high and volatile prices scenario (Figure 5). The higher effectiveness in increasing farm income stability of the IST with respect to crop insurance is due to the direct protection offered by IST against low incomes. Instead, crop insurance only protects against yield losses.

Evaluation of risk management tools for stabilising… 19
Individual decisions on farm strategies as practicing crop rotation or contracting risk management tools are complementary to CAP direct payments for achieving the CAP objectives of stabilizing farmers’ income. This suggests that incentives to contracting protection tools as in the rural development regulation of the CAP reform 2014-2020 are a good compromise for both improving farm resilience to yield and price variability and restraining public expenditure. Likewise, sharing risk manage-ment responsibility with farmers, and conditioning aids to the performance of risk re-ducing measures (as diversification, crop insurance or an IST), even when supporting such measures (crop insurance premiums and IST indemnities), are essential to deve-lop responsibility and involvement of farmers and other stakeholders (Cordier, 2014).
Public support measures, and the corresponding expenditure, might behave as compensations or as incentives. In the first case, public measures as direct payments aim at compensating market failures or at protecting strategic activities with difficul-ties to survive due to high opportunity costs or to competitive disadvantages. In the second case, measures aim at incentivizing the adoption of certain practices, thereby driving agricultural activity towards the objective stated in a particular policy. Sub-sidies to protection tools (either for crop insurance premiums or to IST indemnities) and cross-compliance of direct payments are under this category. The success of CAP measures towards reducing farm income risk will be related to the level of adoption of such practices. It is then relevant to question whether farmers are willing to adopt protection tools or not, which is to say whether public expenditure actually incentivi-zes farmers to adopt the available risk management strategies. The certainty equiva-lent is an indicator of the expected willingness of the farmers to adopt the proposed tools, and therefore, the increase in certainty equivalent per public euro invested in subsidizing such tools might be interpreted as the efficiency of public expenditure in incentivizing such behaviour in farmers.
Cereal insurance in Spain has a relatively high penetration rate, reaching 63.9 % in 2015 (Machetti Bermejo, 2015). This supports the results suggesting that crop insurance always resulted in higher certainty equivalent than not contracting any pro-tection system, especially for more risk averse farmers. As it has not yet implemen-ted in this region, no observed data is available to contrast the results obtained for IST. However, results suggest that farmers might be expected to be more willing to contract IST than not contracting any protection tool and even than contracting crop insurance. Therefore, the implementation of IST schemes could derive in a decrease in insurance demand.
The robustness of these protection systems is highly dependent on the accuracy with which the insurer quantifies the actual yield and overall risk, and additionally the actual annual costs, in the case of the IST. However, records on individual actual yields and input costs are solely available to the farmer, resulting in an important source of information asymmetries (moral hazard and adverse selection). A number of methodologies for yield and costs estimation is being developed and implemented in order to avoid moral hazard in crop, revenue and income insurances. That is the case of indexes and crop models for yield assessment (Castañeda-Vera et al., 2015;

20 Catañeda-Vera, A. and Garrido, A.
Escribano Rodríguez et al., 2014) or scoring grids fixed by experts for costs estima-tion (Bardají and Garrido, 2016).
Contrary to the view of direct payments as behaving as risk preventive measures, some authors suggest a possible negative effect of farm vulnerability, becoming sometimes in risk-enhancing tools or even promoting moral hazard. El Benni et al. (2012) suggests that Swiss agricultural policy evolution from market-based support to direct payments has decreased farm income variability, behaving direct payments as insurance for farmers making them more willing to take risk from crop production. A similar result was found by Enjolras et al. (2014) for French farmers. This might question the efficiency of such structural policies regarding risk management.
A differential effect of CAP measures might be expected in different farm types and location. Conclusions of this work are therefore valid for the area and farming strategies considered, but might change for other regions with different climate (yield variability) and cultivated crops. A wider study performing a similar analysis at a national and regional scale, including common crops and farm strategies and using historical or simulated data for yields and prices, would be useful to evaluate the equilibrium of the efficiency of horizontal measures such as those considered within the CAP 2014-2020 in different European countries and regions.
7. Conclusions
Direct payments were the most effective measure in increasing farm expected and lower incomes and income stability, especially when meeting greening requirements. Crop diversification does not require any direct public support but provides itself a significant decrease in income variability.
The IST was found to be highly efficient in decreasing the income coefficient of variation especially in the scenario where prices were lower and more stable and for the riskier alternatives (no CAP beneficiary and practising monoculture); thus for no CAP beneficiaries practicing monoculture. The effectiveness in increasing certainty equivalent was higher for the IST than for crop insurance. Therefore, the implemen-tation of IST schemes could result in a decrease in insurance demand, as the instru-ments are substitutes.
Subsidized protection tools are a good compromise for both improving farm resi-lience to yield and price variability and to restrain public expenditure as they achieve high level of income stability to a much lower cost than subsidizing direct payments.
The relative efficiency between risk management instruments remained unchan-ged in both prices scenarios, suggesting the validity of the conclusions of this paper even under the great uncertainty of rapidly changing economic and climatic envi-ronment that characterized agricultural sector performance in the last decade. This makes recommendable to put risk management tools on the spotlight giving them a greater prominence in the future CAP design.

Evaluation of risk management tools for stabilising… 21
References
Agrosynergie. (2011). Evaluation of income effects of direct support. Brussels: Euro-pean. Commission.
Bardají, I. & Garrido, A. (2016). State of play of risk management tools implemented by MS during the period 2014-2020: National and European frameworks. Brus-sels: European Parliament.
Bielza, M., Conte, C.G., Gallego, F.J., Stroblmair, J., Catenaro, R. & Dittmann, C. (2009). Risk Management and Agricultural Insurance Schemes in Europe. Lu-xembourg: Joint Research Centre European Commission.
Bielza, M., Garrido, A. & Sumpsi, J.M. (2004). “Revenue Insurance as an Income Stabilization Policy: An Application to the Spanish Olive Oil Sector”. Cahiers d’Economie et Sociologie. Rurales, 70, 5-27.
Bielza, M., Garrido, A. & Sumpsi, J.M. (2007). “Finding optimal price risk mana-gement instruments: The case of the Spanish potato sector”. Agricultural Econo-mics, 36, 67-78. https://doi.org/10.1111/j.1574-0862.2007.00177.x.
Castañeda-Vera, A., Leffelaar, P.A., Álvaro-Fuentes, J., Cantero-Martí-nez, C. & Mínguez, M.I. (2015). “Selecting crop models for decision ma-king in wheat insurance”. European Journal of Agronomy, 68, 97-116. https://doi.org/10.1016/j.eja.2015.04.008.
Cordier, J. (2014). Comparative study of risk management tools supported by the 2014 Farm Bill and the CAP 2014-2020. Brussels: Agriculture and Rural Develo-pment. European Parliament. IP/B/AGRI/IC/2014-044.
Donoghue, E.J.O. (2014). The Effects of Premium Subsidies on Demand for Crop In-surance. Economic Research Report, Number 178405. United States Department of Agriculture, Economic Research Service.
El Benni, N., Finger, R. & Mann, S. (2012). “Price volatility and farm income stabili-zation. Modelling Outcomes and Assessing Market and Policy Based Responses”. Presented in: 123rd European Asociation of Agricultural Economics. Dublin, 1-16.
O’Donoghue, E. (2014). The Effects of Premium Subsidies on Demand for Crop Insurance. USDA-ERS Economic Research Report Number 169. Available at SSRN: http://dx.doi.org/10.2139/ssrn.2502908.
Escribano Rodríguez, J.A., Hernández Díaz-Ambrona, C.G. & Tarquis Alfonso, A.M. (2014). “Selección de índices de vegetación para la estimación de la produc-ción herbácea en dehesas”. Pastos, 44, 6-18.
FAO. (2011). The State of Food Insecurity in the World. How does international price volatility affect domestic economies and food security? Rome.
FEGA. (2016). Nota informativa sobre el establecimiento de los valores medios re-gionales definitivos y otros parámetros utilizados en el proceso de asignación de los derechos de pago básico. Madrid.
Finger, R. (2012). “Biases in Farm-Level Yield Risk Analysis due to Data Aggrega-tion”. German Journal of Agricultural Economics, 61, 30-43.

22 Catañeda-Vera, A. and Garrido, A.
Finger, R. & El Benni, N. (2014). “A Note on the Effects of the Income Stabilisation Tool on Income Inequality in Agriculture”. Journal of Agricultural Economics, 65, 739-745. https://doi.org/10.1111/1477-9552.12069.
Garrido, A., Brümmer, B., M’Barek, R., Meuwissen, M. & Morales-Opazo, C. (Eds.). (2016). Agricultural Markets Instability. Revisiting the Recent Food Cri-ses. Oxford: Earthscan Food and Agriculture series. Routledge.
Garrido, A. & Zilberman, D. (2008). “Revisiting the demand for agricultural insurance: The case of Spain”. Agricultural Finance Review, 68, 43-66. https://doi.org/10.1108/00214660880001218.
Goodwin, B.K., Roberts, M.C. & Coble, K.H. (2000). “Measurement of Price Risk in Revenue Insurance: Implications of Distributional Assumptions”. Journal of Agricultural and Resource Economics, 25, 195-214.
Górski, T. & Górska, K. (2003). “The effects of scale on crop yield variability”. Agri-cultural Sysems, 78, 425-434. https://doi.org/10.1016/S0308-521X(03)00036-2.
INE. (2014). Encuesta sobre la Estructura de las Explotaciones Agrícolas 2013. Ma-drid: Notas de prensa.
JCyL. (2014). Anuario de estadística agraria de Castilla y León. Anu. esta-dística. Available in: http://www.jcyl.es/web/jcyl/AgriculturaGanaderia/es/Plantilla100/1284228463984.
Lobell, D.B., Ortiz-Monasterio, J.I. & Falcon, W.P. (2007). “Yield uncertainty at the field scale evaluated with multi-year satellite data”. Agricultural Systems, 92, 76-90. https://doi.org/10.1016/j.agsy.2006.02.010.
Machetti Bermejo, I. (2015). “El sistema de seguros agrarios combinados en Es-paña”. Consorcio de Compensación de Seguros - Revista Digital. Available in: http://www.consorsegurosdigital.com/es/numero-02/portada-02/el-sistema-de-seguros-agrarios-combinados-en-espana.
MAGRAMA. (2015). Estudios de Costes y Rentas de las Explotaciones Agrarias (ECREA). Available in: http://www.magrama.gob.es/es/ministerio/servicios/analisisyprospectiva/ECREA_Informes-Agricolas.aspx.
Marra, M.C. & Schurle, B.W. (1994). “Kansas Wheat Yield Risk Measures and Ag-gregation: A Meta-Analysis Approach”. Journal of Agricultural Resource Econo-mics, 19, 69-77. Available at: http://www.jstor.org/stable/40986829.
Mary, S., Santini, F. & Boulanger, P. (2013). An Ex-Ante Assessment of CAP Income Stabilisation Payments using a Farm Household Model. Presented in: 87th Annual Conference of the Agricultural Economics Society. Warwick, United Kingdom, 1-27.
Meuwissen, M.P.M., Asseldonk, M.A.P.M. & van Huirne, R.B.M. (2008). Income stabilisation in European agriculture. Design and economic impact of risk mana-gement tools. Wageningen: Wageningen Academic Publishers.

Evaluation of risk management tools for stabilising… 23
Morales, C., Garrido, A. & Pálinkás, P. (2008). “Risks Perceptions and Risk Mana-gement Instruments in the European Union: Do farmers have a clear idea of what they need?” Presented in: 12th Congress of the European Association of Agricultu-ral Economists - EAAE. Ghent.
Palisade Corporation. (2011). @RISK: A Hands-On Tutorial.Rudstrom, M., Popp, M., Manning, P. & Gbur, E. (2002). “Data Aggregation Issues
for Crop Yield Risk Analysis”. Canadian Journal of Agricultural Economics, 50(2), 185-200. https://doi.org/10.1111/j.1744-7976.2002.tb00427.x.
Santeramo F.G., Goodwin B.K., Adinolfi F. & Capitanio F. (2016). “Farmer Partici-pation, Entry and Exit decisions in the Italian Crop Insurance Program”. Journal of Agricultural Economics, 67(3), 639-657. https://doi.org/10.1111/1477-9552.12155.
Shaik, S., Coble, K.H., Knight, T.O., Baquet, A.E. & Patrick, G.F. (2008). “Crop Revenue and Yield Insurance Demand: A Subjective Probability Approach”. Journal of Agricultural Applied Economics, 40(3), 757-766.