Evaluation of Recycled Plastic Products in Terms of ... · Evaluation of Recycled Plastic Products...
140
Research, Development and Technology MoDOT RDT 03-019 Evaluation of Recycled Plastic Products in Terms of Suitability for Stabilization of Earth Slopes November, 2003 RI 98-007C University of Missouri-Columbia
Transcript of Evaluation of Recycled Plastic Products in Terms of ... · Evaluation of Recycled Plastic Products...

Research, Development and Technology
MoDOT
RDT 03-019
Evaluation of Recycled Plastic Products in Terms of Suitability for Stabilization of Earth Slopes
November, 2003
RI 98-007C
University of Missouri-Columbia

TECHNICAL REPORT DOCUMENTATION PAGE
1. Report No. 2. Government Accession No. 3. Recipient's Catalog No. RI98-007C/RDT 03-019 4. Title and Subtitle 5. Report Date
November 2003 6. Performing Organization Code
Evaluation of Recycled Plastic Products in Terms of Suitability for Stabilization of Earth Slopes
7. Author(s) John J. Bowders, J. Erik Loehr and Cheng-Wei Chen 8. Performing Organization Report No. 9. Performing Organization Name and Address 10. Work Unit No.
RDT 03-019 11. Contract or Grant No.
University of Missouri-Columbia; Columbia, MO 65211-2200
12. Sponsoring Agency Name and Address 13. Type of Report and Period Covered
Final Report 14. Sponsoring Agency Code
Missouri Department of Transportation Research, Development and Technology Division
P. O. Box 270-Jefferson City, MO 65102
15. Supplementary Notes This report is based on work supported by the Federal Highway Administration under Cooperative Agreement No. DTFH61-98-X-00095 through the Recycled Materials Resource Center at the University of New Hampshire, Durham, New Hampshire. 16. Abstract Slender recycled plastic pins (RPPs) can be used to stabilize earthen slopes by driving the RPPs into the face of the slope to intercept the sliding surface and “pin” the slope. For RPP technology to become widely applied, a specification for accepting or rejecting particular products is required. In this work, engineering properties and field performance of four types of RPPs were evaluated and a draft specification was developed. Compressive strengths ranged from 1600 psi to 3000 psi and compressive moduli ranged from 80 ksi to 190 ksi at one percent strain. Flexural strengths ranged from 1300 psi to 3600 psi and flexural moduli varied from 90 ksi to 250 ksi at one percent strain. Arrhenius modeling showed creep failure ranged from 45 to 2000 years at field temperature and stress levels. Installation stresses did not alter the strengths of the RPPs. A draft specification for RPPs to be used to stabilize slopes includes “design” compressive (1500 psi) and flexural (1200 psi) strengths for RPPs tested at the field strain rate (0.00003 in/in/min); or establishing a compressive strength versus strain rate behavior and estimating the compressive strength at the field strain rate; or a minimum compressive strength of 3750 psi at a strain rate of 0.03 in/in/min. The “design” flexural strength is 1200 psi at two percent center strain, when tested in four-point flexure using a crosshead displacement rate of 0.02 in/min or 2000 psi if displaced at 1.9 in/minute. To ensure durability to environmental exposures, the RPPs must consist of more than 60 percent polymeric material or exposure testing must be performed. Finally, the RPP should not fail (break) under a cantilever bending load that generates an extreme fiber stress of at least 50 percent of the design compressive strength when subjected to the load for 100 days. Exposure testing and Arrhenius modeling are offered as alternate means to qualify the durability a material. 17. Key Words 18. Distribution Statement Geotechnical, Slope Stability, Reinforced Slopes, Maintenance, Repair, Recycled Plastic Pins, Stabilization, Material Properties, Specification
No restrictions. This document is available to the public through National Technical Information Center, Springfield, Virginia 22161
19. Security Classification (of this report) 20. Security Classification (of this page) 21. No. of Pages 22. Price Unclassified Unclassified 125
Form DOT F 1700.7 (06/98)

Bowders, Loehr and Chen RPP Suitability for Stabilizing Slopes
Final Report
RDT 03-019 Research Investigation 98-007C
Evaluation of Recycled Plastic Products in Terms of Suitability for Stabilization of Earth Slopes
PREPARED FOR:
MISSOURI DEPARTMENT OF TRANSPORTATION RESEARCH, DEVELOPMENT AND TECHNOLOGY
JEFFERSON CITY, MISSOURI
BY:
Dr. John J. Bowders, PE Professor of Civil Engineering
Dr. J. Erik Loehr, EIT
Assistant Professor of Civil Engineering
Mr. Cheng-Wei Chen Graduate Research Assistant
Department of Civil & Environmental Engineering
University of Missouri-Columbia
DATE SUBMITTED: November 2003
The opinions, findings, and conclusions expressed in this publication are those of the principal investigators and the Missouri Department of Transportation; Research, Development and Technology. They are not necessarily those of the U.S. Department of Transportation, Federal Highway Administration. This report does not constitute a standard or regulation

Bowders, Loehr and Chen RPP Suitability for Stabilizing Slopes
Acknowledgements The encouragement and support of Mr. Thomas Fennessey, technical liaison for this project, Missouri Department of Transportation, is always appreciated. This program would not have been possible without the kind cooperation of Bedford Technology, LLC (Ms. Rachel Aanenson), Epoch Composite Products (Mr. Randy Jolitz), and Resco Plastics (Ms. Sabine Zink). These manufacturers provided their products for testing and evaluation. Support for the field installations at the I435 sites in Kansas City was received from MoDOT District 4. Mr. Bill Billings was exceptionally supportive of this effort. The Judy Company, Mr. Pat Carr, president, contributed construction and installation services for the field sites. This report is based on work supported by the Federal Highway Administration under Cooperative Agreement No. DTFH61-98-X-00095 through the Recycled Materials Resource Center at the University of New Hampshire, Durham, New Hampshire.
iii

Bowders, Loehr and Chen RPP Suitability for Stabilizing Slopes
Executive Summary
An ongoing demonstration project has shown the feasibility of using slender
recycled plastic pins (RPPs) for in situ reinforcement of earthen slopes. The technique
uses RPPs driven into the face of the slope in a grid pattern to intercept the sliding
surface and “pin” the slope. The compressive, tensile, and flexural strength along with
creep behavior dictate the design. Constituent materials and manufacturing processes are
highly variable among the US manufacturers. In order for RPP technology to become
widely applied, it is imperative to have a suitable specification for accepting or rejecting
particular products. The specification must consider both the installation and performance
requirements of the pins. Test methods were established and the engineering properties
and driving performance of four different types of RPPs were evaluated.
Compressive strengths ranged from 1600 psi to 3000 psi (11 MPa to 21 MPa)
with extruded products about 20 percent lower than compression molded products.
Compressive moduli ranged from 80 ksi to 190 ksi (552 MPa to 1310 MPa) at one
percent strain and the fiberglass-reinforced products were about 60 percent stiffer than
unreinforced products. The flexural strengths ranged from 1300 psi to 3600 psi (9 MPa to
25 MPa), but there was significant variability. The flexural moduli varied from 90 ksi to
250 ksi (621 MPa to 1724 MPa) at one percent strain. Although the RPPs are creep
sensitive, Arrhenius modeling indicated that at field temperature and stress levels, creep
failure ranged from 45 to 2000 years. Installation stresses did not alter the strengths of the
RPPs.
A draft specification for RPPs includes requirements for: (A) minimum
compressive strength, (B) flexural strength, (C) durability to environmental exposures
iv

Bowders, Loehr and Chen RPP Suitability for Stabilizing Slopes
and (D) durability to creep bending loads. The minimum compressive strength tested at
field strain rates is 1500 psi and minimum flexural strength is 1200 psi for RPPs to be
used in stabilization of slopes. Ideally, these strengths should be determined using the
field strain rate (0.00003 in/in/min); however, this rate is too slow for production
facilities. Therefore, alternatives for qualifying an RPP material are provided. Two
alternatives for compressive strength include: Alternate A1 -establishing a compressive
strength versus strain rate behavior and estimating the compressive strength at the field
strain rate, or Alternate A2 - a compressive strength of 3750 psi (25.9 MPa) or better
when tested at the ASTM D6108 strain rate of 0.03 in/in/min (0.03 mm/mm/min). The
latter value represents the increase in strength realized by the 3-order of magnitude
increase in strain rate, i.e., above the field strain rate of 0.00003 in/in/min (0.00003
mm/mm/min), using a reasonable upper-bound for strain rate effects. The “design”
flexural strength is 1200 psi (8.3 MPa) at less than or equal to two percent center strain,
when tested in four point flexure using a crosshead displacement rate of 0.02 in/min (0.51
mm/min). The alternative for the flexural strength (Alternative B1) allows for the use of
ASTM D6109 crosshead deformation rate of 1.9 in/min (48.3 mm/min); however, the
required flexural strength is 2000 psi (13.8 MPa) at less than or equal to two percent
center strain. To ensure durability to environmental exposures, the RPPs must consist of
more than 60 percent polymeric material or exposure testing must be performed. Finally,
the RPP should not fail (break) under a cantilever bending load that generates an extreme
fiber stress of at least 50 percent of the design compressive strength when subjected to
the load for 100 days. Exposure testing and Arrhenius modeling are offered as alternate
means to qualify the durability a material.
v

Bowders, Loehr and Chen RPP Suitability for Stabilizing Slopes
Due to the potential for a wide variability in manufacture-supplied products,
additional materials should be obtained, evaluated and findings incorporated into the RPP
material property database in order to strengthen the specification.
vi

Bowders, Loehr and Chen RPP Suitability for Stabilizing Slopes
TABLE OF CONTENTS
ACKNOWLEDGEMENTS............................................................................................... iii
EXECUTIVE SUMMARY ............................................................................................... iv
TABLE OF CONTENTS…………………………………………………………………vii
LIST OF TABLES...............................................................................................................x
LIST OF ILLUSTRATIONS............................................................................................ xii
CHAPTER Page
1. INTRODUCTION ...................................................................................................1
1.1 Background..................................................................................................1
1.2 Objectives ....................................................................................................1
1.3 Scope of Work .............................................................................................2
2. LITERATURE REVIEW ........................................................................................4
2.1 Introduction..................................................................................................4
2.2 Slope Stability..............................................................................................4
2.3 Stabilizing Methods .....................................................................................4 2.4 Recycled Plastic Pins Method......................................................................5
2.5 Sources and Manufactured Processes of Recycled Plastic Pins ..................7
2.6 Engineering Properties of Recycled Plastic Lumber ...................................9
2.7 Summary ...................................................................................................14
3. MATERIALS AND METHODS...........................................................................16 3.1 Overview....................................................................................................16
3.2 Materials ....................................................................................................16
3.3 Laboratory Methods...................................................................................18
vii

Bowders, Loehr and Chen RPP Suitability for Stabilizing Slopes
3.3.1 Uniaxial Compression Test............................................................18
3.3.2 Four-Point Flexure Test .................................................................21
3.3.3 Flexural Creep Test and Compressive Creep Test.........................25
3.3.3.1 Flexural creep test ..............................................................25
3.3.3.2 Compressive Creep Test ....................................................29
3.4 Field Methods: Drivability Analyses .........................................................31
4. RESULTS AND DISCUSSION............................................................................38 4.1 Overview....................................................................................................38
4.2 Uniaxial Compression Tests ......................................................................38
4.2.1 Stress-Strain Curves.......................................................................38
4.2.2 Uniaxial Compression Strength .....................................................41
4.2.3 Modulus of Elasticity.....................................................................47
4.2.4 Strain Rate Effects .........................................................................50
4.3 Four-Point Flexure Tests............................................................................56
4.3.1 Flexural Stress- Center Strain Curves............................................56
4.2.2 Flexural Strengths ..........................................................................57
4.2.3 Flexural Modulus ...........................................................................59
4.4 Creep Behavior ..........................................................................................60
4.3.1 Flexural Creep Tests ......................................................................60
4.2.2 Compression Creep Tests ..............................................................68
4.5 Field Installation Behavior.........................................................................71
4.5.1 Introduction....................................................................................71
4.5.2 I70-Emma Site ...............................................................................72
viii

Bowders, Loehr and Chen RPP Suitability for Stabilizing Slopes
4.5.3 I435-Wornall Site and Holmes Site ...............................................74
4.5.4 US36-Stewartsville and US54-Fulton Site ....................................79
4.5.5 Installation Performance for all Demonstrated Sites .....................81
5. DRAFT SPECIFICATION FOR RPPs TO BE USED IN THE SLOPE STABILIZATION .................................................................................................84
5.1 The Need for A Specification ....................................................................84
5.2 Draft Specification .....................................................................................84
6. CONCLUSIONS AND RECOMMENDATIONS ................................................89 6.1 Conclusions................................................................................................89
6.2 Recommendations......................................................................................93 7. APPENDICES .......................................................................................................95
A Test Results for Uniaxial Compression Tests............................................94 B Test Results for Four-Point Flexure Tests ...............................................102
C Test Results for Flexural Creep and Compressive Creep Tests...............105 D RPP Penetration Rate Frequency Distribution for Field Installations ...114 E Draft Provisional Specification (AASHTO) for RPPs.............................118 8. REFERENCES ....................................................................................................124
ix

Bowders, Loehr and Chen RPP Suitability for Stabilizing Slopes
LIST OF TABLES Table Page
2.1 Cost Comparison for Slope Stabilization Methods..................................................7
2.2 Common Recycled Plastics for Recycled Plastic Lumber (Osman, 1999)..............8
2.3 ASTM Standard Test Methods for Plastic Lumber ...............................................11 2.4 Engineering Properties of Plastic Lumber Products (Breslin et al., 1998) ............13 2.5 Specific Gravity and Results of Compression Tests on Recycled Plastic Lumber
(Lampo and Nosker, 1997) ....................................................................................14 3.1 Details of RPPs Tested in this Project ...................................................................17 3.2 Temperatures and Loadings Detail for Flexural Creep Tests ................................27 3.3 Detail of Seven Slopes Using RPPs for Stabilization............................................33 4.1 Uniaxial Compression Strength from Uniaxial Compression Test on RPPs.........43 4.2 Secant Moduli from Uniaxial Compression Test on RPPs....................................47 4.3 Results of Four-Point Flexure Tests on RPPs........................................................58
4.4 Summary of Flexural Creep Tests on Recycled Plastic Specimens ......................62
4.5 Loading Conditions and Results of the Flexural Creep Tests on the RPPs ...........64
4.6 Summary Results of the Compressive Creep Tests on the RPPs...........................70
4.7 Penetration Performance of RPPs at I-70 Emma Site............................................73
4.8 Penetration Performance of RPPs at I-435 Wornall and Holmes Site...................74
4.9 Penetration Rates and Material Properties for RPPs Installed at I435-Wornall and I435-Holmes Sites..................................................................................................77
4.10 Penetration Rates of “Test Pins” and “Nearest Neighbors”...................................79
4.11 Driving Performance of RPPs at US36-Stewartsville and US54-Fulton Site........80 4.12 Results of Subdivided Groups for RPPs at Seven Slide Sites ...............................82
x

Bowders, Loehr and Chen RPP Suitability for Stabilizing Slopes
5.1 Draft Specification For RPPs to Be Used in Slope Stabilization Applications .....85 6.1 Draft Specification for RPPs to Be Used in Slope Stabilization Applications ......91
xi

Bowders, Loehr and Chen RPP Suitability for Stabilizing Slopes
LIST OF ILLUSTRATIONS Figure Page 1.1 Surficial slope failures in highway embankment.....................................................2 1.2 Three types of failures of reinforcing members in the field slopes .........................2 2.1 (a) Profile view of Recycled Plastic Pins (RPPs) stabilizing a potential sliding
surface. (b) Installing RPP in a slope at I70 Emma Slide3, Missouri (January 2003) ........................................................................................................................6
3.1 Setup for uniaxial compression tests......................................................................19 3.2 Typical stress-strain curve (a) and average strain rate calculation (b)...................20
3.3 Loading diagram of the four-point flexure test......................................................22
3.4 RPPs in the four-point flexure test.........................................................................22
3.5 Flexural stress versus center strain (a) and average deformation rate calculation (b) for flexural test on RPPs (Batch A5). Secant flexural modulus ( ) is shown for secant points at one and two percent center strain ...........................................23
bE
3.6 Setup for testing flexural creep of RPPs ................................................................26
3.7 Deflection versus time response of RPPs with five 10-Lb loads at even spacing in
56°C environment. Specimen failed after 210 days ..............................................27
3.8 Arrhenius plot of inverse reaction rate versus inverse temperature ......................29 3.9 Setup for compressive creep test of recycled plastic specimen .............................30
3.10 An idealized creep curve........................................................................................31
3.11 Initial equipment used for installation of RPPs at the I70 Emma slide 1 ..............34
3.12 Crawler mounted drilling rig used for installation of RPPs at the I70 Emma slide 1
and slide 2 ..............................................................................................................34
3.13 Ingersoll Rand ECM350, 100-psi air compressor and Daken Farm King hitter series, impact hammer used for installation of RPPs at the I70 Emma slide 3......35
3.14 Ingersoll Rand CM150, 100-psi air compressor used for installation of RPPs at
the I435 Wornall site..............................................................................................37
xii
Bowders, Loehr and Chen RPP Suitability for Stabilizing Slopes
4.1 Typical compressive stresses versus axial strain behavior for recycled plastic pins
(RPPs) (a) Stress-strain curve typical of RPPs exhibiting failure planes (All Mftg A) (b) Stress-strain curve typical of RPPs exhibiting bulging failure (Mftg B and C)............................................................................................................................39
4.2 Failure modes of RPPs during uniaxial compression tests: (a) Typical failure
planes shown by compression molded RPPs from Mftg A (b) Typical bulging failure has shown by extruded products from Mftg B and Mftg C........................40
4.3 Difference calculated from measured perimeter versus axial strain during
compression tests (Mftg A, B, and C)....................................................................42
4.4 Comparison of average compressive strengths with and without cross-sectional area corrections for materials from all manufacturers ...........................................45
4.5 Average compressive strength versus average unit weight for materials from all
manufacturers.........................................................................................................46
4.6 Comparison of average secant modulus at 1% axial strain ( ) for all manufacturers.........................................................................................................48
%1E
4.7 Comparison of average secant modulus at 5% axial strain ( ) of all
manufacturers.........................................................................................................49 %5E
4.8 Compressive strength versus strain rate for tests on RPPs (Mftg A – virgin
specimens)..............................................................................................................51 4.9 Compressive strength versus strain rate for materials from Mftg A (virgin
specimens versus disturbed specimens).................................................................52 4.10 Compressive strength versus strain rate for tests on RPPs (Mftg B and C) ..........53
4.11 Standard compressive strength ( stdσ ) for tests on RPPs (Batch A10) ..................54
4.12 Ratio of compressive strength to standard compressive strength versus strain rate
for RPPs. ................................................................................................................55 4.13 Typical flexural stresses versus center strain behavior for RPPs ..........................57
4.14 Comparison of average flexural strengths for all manufacturers...........................59
4.15 Comparison of average secant flexural modulus at one percent center strain ( )
and two percent strain ( ) of RPPs ...................................................................60 %1E
%2E
xiii

Bowders, Loehr and Chen RPP Suitability for Stabilizing Slopes
4.16 Deflection versus time response for RPP loaded with 50 lbs at the free end of a
simple cantilever (Figure 3.6) under various temperatures ...................................61
4.17 Typical Arrhenius Plot for flexural creep test on 2 in x 2 in x 24 in RPP loaded with a 50-lbs weight at the end of a cantilever under various temperatures..........63
4.18 Method for estimating time to failure resulting from flexural creep of RPP.........65 4.19 Maximum mobilized bending moments from instrumented RPPs at I70-Emma
site (Parra et al., 2003) ...........................................................................................66
4.20 Typical deflection under constant axial stress versus time of a recycled plastic specimen from batch B7 ........................................................................................69
4.21 Deflections versus time of the compressive creep tests on RPPs ..........................71
4.22 Penetration rate frequency distribution for RPPs and trial steel pipe
reinforcements in slope stabilization site, I435-Wornall .......................................76 4.23 Analysis of penetration rate “test pin” to the average driving rate for its “nearest
neighbors” ..............................................................................................................78
4.24 Penetration rate analysis by subdividing RPPs as four groups from top to bottom of slope...................................................................................................................81
4.25 Average penetration rate versus installation sequence of seven slopes.................83
xiv

Bowders, Loehr and Chen RPP Suitability for Stabilizing Slopes
CHAPTER 1: INTRODUCTION
1.1 Background
In situ reinforcement techniques show a great deal of promise for stabilization of
surficial slope failures. Reinforcing members made from plastic wastes offer an economic
and environmentally attractive alternative to traditional materials for stabilizing such
failures. In an on-going demonstration project, slopes at five different sites (all located in
the state of Missouri) have been stabilized using recycled plastic pins (RPPs) and, for
comparative purposes, steel pipe. All five sites have experienced surficial failures in
embankments or cut slopes before installing RPPs (Figure 1.1).
1.2 Objectives
The engineering properties of the reinforcing members are of paramount
importance because of the potential for structural failure of the pins due to the loads
imposed by the moving soil and due to the stresses imparted on the members during field
installation (Figure 1.2). Due to the variety of manufacturing processes and constituent
mixes used in the manufacture of recycled plastic products, the engineering properties of
commercially available members could vary substantially.
In order for the RPP technology to become widely applied, it is imperative to
have a suitable specification for accepting or rejecting particular products. The
specification must consider both the installation and performance requirements of the
pins, since there is currently little agreement on testing protocols and few tests directly
applicable to the slope stabilization application.
1

Bowders, Loehr and Chen RPP Suitability for Stabilizing Slopes
Figure 1.1 Surficial slope failures in highway embankment.
Installation Durability Bending and Creep Failure Shear Failure
Figure 1.2 Three types of failures of reinforcing members in the field slopes.
1.3 Scope of Work
In order to gain a proper perspective of the engineering properties of RPPs, an
extensive testing and analysis program is being undertaken. The program includes: (a)
determining the basic engineering and material properties of RPPs; (b) determining the
potential variability of these properties within one product and among various products
and manufacturers; and (c) determining how these properties change when the material is
2

Bowders, Loehr and Chen RPP Suitability for Stabilizing Slopes
subjected to various potentially detrimental environments. The scope of this report is
limited to points (a) and (b), in order to provide background data for developing a draft
specification for RPPs in slope applications. A draft specification is presented in the text
and in the format of a provisional specification for the American Association of State
Highway and Transportation Officials (AASHTO).
3

Bowders, Loehr and Chen RPP Suitability for Stabilizing Slopes
CHAPTER 2: LITERATURE REVIEW
2.1 Introduction
In this chapter, the general concepts and methods for slope stability are
introduced, as well as use of recycled plastic pins (RPPs) for slope stabilization. The
source and manufacturing process of the RPPs and existing methods to measure the
engineering properties are presented.
2.2 Slope Stability
Slope failure on public and private transportation routes is an all too common
occurrence. Based on previous research (TRB, 1996), total direct costs for maintenance
and repair of landslides involving major U.S. highways alone have been estimated to
exceed $100 million annually. Costs attributed to routine maintenance and repair of
“minor ” failure slopes are largely neglected. The slope types and geometric dimensions
of minor slopes failures vary, but most are characterized by relatively shallow sliding
surfaces that are less than 10 feet (3 m) deep (Figure 1.1). The costs for repair a minor
slope failure are quite low, but the cumulative costs for many minor slopes failures are
extremely large (TRB, 1996). If not properly maintained, these minor sliding failures
often progress into more serious problems and require more costly repairs.
2.3 Stabilizing Methods
There are various methods of slope stabilization available. Some methods include
the use of soil and rock fill, drilled shaft walls, and tieback walls. The most common
slope stabilization method is based on using soil and rock (or aggregates) fill to rebuild
the slope. This method is used to provide sufficient dead weight near the toe of the slope,
4

Bowders, Loehr and Chen RPP Suitability for Stabilizing Slopes
thus preventing driving force of the failure slope. This is a practical way to arrest further
movement of an unstable slope when resources of the soil and rock fill are available and
can be found locally. However, the repair cost becomes relative high to replace the failure
when using aggregates. Drilled shaft walls and tieback walls are not economical for
minor slopes failure application. The construction costs can be very high and the
installation process affects the road user.
Using small diameter in-situ reinforcement techniques is a relatively new
approach for stabilization of slopes. For example, soil nailing is one of these similar
techniques. It generally consists of steel bars, metal tubes, or other metal rods that can be
either driven or grouted in predrilled boreholes. The repair cost is still high for minor
slope failures. Since minor slope failures often have relatively shallow sliding surfaces,
the load imposed on in-situ reinforcement members is expected to be small. A major
advantage of this method is that the reinforcing member will control the design (Loehr et
al., 2000b). The uncertainties associated with the soil properties and field conditions can
be reduced and the reliability of the design can be improved. Small and mobile
equipment allows for easy access to remote sites and reduced mobilization costs for small
diameter stabilization techniques. In addition, installation costs for this application may
be significantly lower than costs for other stabilization methods.
2.4 Recycled Plastic Pins Method
A new technique for slope stabilization has been developed that uses recycled
plastic pins (RPPs), comparable to soil nailing. The RPPs are driven in a grid pattern on
the failure sliding surfaces. The schematic design concept for stabilization slope is
illustrated in Figure 2.1. The pins are typically 3.5 in. x 3.5 in. x 8 feet (90 mm x 90 mm
5

Bowders, Loehr and Chen RPP Suitability for Stabilizing Slopes
x 2.4 m) in length; however, the dimensions can be readily changed in the manufacturing
process. This method offers a cost-effective alternative to current slope repair methods.
Table 2.1 provides a cost comparison for using RPPs technique, rock armor, and soil
nailing. The costs were calculated on a unit area basis (the total cost was divided by the
total area of the slope face). Based on these estimated costs, the RPP stabilization method
is the least costly. As experience is gained and installation technology improves, the costs
for RPP slope stabilization are expected to decrease (Loehr et al., 2000a).
Roadway
Plastic Pins
Unstable Slope
Prior Sliding Surface
(a) (b)
Figure 2.1(a) Profile view of Recycled Plastic Pins (RPPs) stabilizing a potential sliding surface. (b) Installing RPP in a slope at I70-Emma slide 3, Missouri (January 2003).
The first full-scale demonstration in which RPPs were used to stabilize two slope
failures (Loehr et al., 2000b) indicated that the strengths of the RPPs control the design of
stabilization. Having the pin capacity control the design also reduces the necessity of
applying a highly accurate theory for predicting the loads imposed by the soil on
reinforcing members. The importance of accurately knowing soil properties is
diminished; however, the reliability of the design is improved. Therefore, knowing the
6

Bowders, Loehr and Chen RPP Suitability for Stabilizing Slopes
engineering properties of the RPPs becomes important and can help to fit the main
requirement of the slope stabilization design.
Table 2.1 Cost Comparison for Slope Stabilization Methods
Cost/ Unit area of Slope Face [1]
Stabilization Method ($/ ft2) ($/ m2)
Recycled Plastic Pins (RPPs) 3.9 42
Rock Armor[2] 5.4 58
Soil Nailing 19.0 200 [1]: Results from I70-Emma Slide1 and Slide2, reported on Loehr et al., 2000a [2]: Technique that uses a surface layer of large rocks to hold soil in place
2.5 Sources and Manufactured Processes of Recycled Plastic Pins
Recycled plastic pins (RPPs) are manufactured from industrial or post-consumer
waste consisting predominantly of polymeric materials (usually high or low density
polyethylene). Typically, recycled plastic lumber is composed of the following resins
(McLaren, 1995): High Density Polyethylene (HDPE) (55 percent to 70 percent), Low
Density Polyethylene (LDPE) (5 percent to 10 percent), Polystyrene (PS) (2 percent to 10
percent), Polypropylene (PP) (2 percent to 7 percent), Polyethylene-terephthalate (PET)
(1 percent to 5 percent), and varying amounts of additives (sawdust, fly ash, and other
waste materials) (0 percent to 5 percent). Table 2.2 shows the common resins, their major
advantages, typical and recycled uses, and recycling rate for 2001. In the United States,
post-consumer waste has increased at a faster rate than industrial waste. The post-
consumer plastic bottle recycling increased by 80 million pounds in 2001 to an all time
high of 1,591 million pounds (APC, 2002). The HDPE raw material comes from post-
consumer milk jugs and PET comes from post-consumer soda bottles. Assuming 50
percent of recycling rate for all waste plastics, the total production of the recycled plastic
7

Bowders, Loehr and Chen RPP Suitability for Stabilizing Slopes
lumber is estimated to approach 25 billion board feet (6254 m3) per year (McLaren,
1995). Therefore, the importance of the recycled plastic lumber industry in recycling of
plastics cannot be overemphasized.
Table 2.2 Common Recycled Plastics for Recycled Plastic Lumber (Osman, 1999)
Resin Type Major Advantages
Typical Original Uses
Typical Recycled Uses
Millions pounds Bottle Recycled[1]
(Recycled rate [2], %)
Polyethylene terephthalate
(PET)
High strength, excellent moisture
barrier, good clarity
Soft drink bottles, juice containers, food packaging
Bottles, paint brushes,
geotextiles, carpeting
834.3 (22.1%)
High Density Polyethylene
(HDPE)
High strength and melting point, good ductility
Milk containers, oil bottles, films
and pipes
Plastic lumber, motor oil
containers, bottles, drainage
pipes
750 (23.2%)
Low Density Polyethylene
(LDPE)
Excellent clarity, toughness and
flexibility, easy to process
Bottles, trash bags, cable
sheathing, sheets and films
Films, plastic bags, bottles
0.2 (0.5%)
Polypropylene (PP)
Low density, high melting point, and excellent chemical
resistance
Carpeting, netting, geotextiles,
heavy-duty bags
Flexible packing containers
5.7 (3.8%)
Polystyrene (PS)
Low cost, low density, good weathering resistance
Cups, water bottles, outdoor
furniture
Egg cartons, video tape cases
0.1 (1.1%)
[1]: Data from American Plastic Council survey results (APC, 2002) [2]: Percentages shown for PET and HDPE are based on virgin resin sales plus the recycled resin used in the manufacture of bottles.
Manufacturers also use different processes to produce their product (Bruce et al.,
1992). The two main processes commonly used are compression molding and extrusion
forming. In compression molding, the constituent waste streams are pulverized, blended
together, heated until partially melted, and then compression formed in molds. In this
process, the raw material is compressed into desired shapes and dimensions and is cured
8

Bowders, Loehr and Chen RPP Suitability for Stabilizing Slopes
with heat and pressure. Extrusion forming includes similar steps; however, the molten
composite material is forced through a die of the desired cross-section for the member
being produced in lieu of compression into a mold. An advantage of the extrusion process
is that it is relatively easy to manufacture members of any desired length while the
compression molding process requires different molds for each different member length.
It is also easy to make more products than compression molding process. Owing to the
endless variety of possible constituents and manufacturing processes, the resulting
recycled plastic products (often seen in park benches, picnic tables, and decks for homes
and marine setting) can have very different engineering properties, even among
apparently similar materials and sections.
2.6 Engineering Properties of Recycled Plastic Lumber
There are many manufacturers of recycled plastic lumber in the United States.
The number is currently more than 30, but is variable due to the nature of start-up
businesses. Each manufacturer uses proprietary blends of constituents, which can vary at
their source, and different manufacturing methods to products. Therefore, the engineering
properties also vary. In order for the RPP stabilization technology to gain wide spread
acceptance and application, both of which are tied to the costs of the technique, a
specification for the RPPs in terms of required minimum engineering properties must be
established.
In order to develop a specification for RPPs in slope stabilization applications, the
key variables must be identified and their behavior documented for the application. In the
slope stabilization application, key variables include strength and stiffness (axial and
bending), and resistance to installation stresses. Compressive and flexural strength and
9

Bowders, Loehr and Chen RPP Suitability for Stabilizing Slopes
stiffness can readily be measured by most manufacturers. Several ASTM standards
relative to plastic lumber along with comments on the testing procedures are given in
Table 2.3. Uniaxial compression and four-point flexure tests are common and easy
performed in material testing. ASTM D6108 (ASTM, 1997a) recommends using a
minimum or effective original cross-sectional area to calculate compressive stress. A
calculation of the effective cross-sectional area is listed in ASTM D6111 (ASTM,
1997c), which outlines a method of obtaining the specific gravity and bulk density of
plastic specimens by water displacement. With the density, length, and weight by the
following equation (ASTM, 1997c).
( )( )cmlength
bwacmarea ,*9976.0, 2 −+= (2.1)
where = overall weight of specimen, without wire or sinker, in air (mg), b =over weight
of specimen (and of cage and sinker) completely immersed and of the wire partially
immersed in liquid (mg), = overall weight of totally immersed sinker, cage, and
partially immersed wire (mg). The effective cross-sectional area can be calculated. Note,
the ASTM-recommended standard strain rate is 0.03 in/in/min (0.03 mm/mm/min) and
the testing time is approximately one minute to five minutes. In slope stabilization
applications, the RPPs resist sustained soil movement as bending loads over time; a
loading condition is likely to be very slow on the order of weeks or months. Therefore,
the ASTM-recommended strain rate might be too fast for this slope stabilization design.
a
w
10

Bowders, Loehr and Chen RPP Suitability for Stabilizing Slopes
Table 2.3 ASTM Standard Test Methods for Plastic Lumber
ASTM No. & Title Test Method Main Comments
D6108 Standard Test Method
for Compressive Properties of Plastic Lumber and Shapes
Uniaxial Compression
Test
• Specimens: length = 2 x minimum width. • Compressive stress = compressive load divided by
minimum or effective original cross-sectional area. • Choose 3 % strain as compressive strength if no clear
a yield point. • Strain rate = 0.03 ± 0.003 in/in/min (mm/mm/min) and
testing time ~ 1 to 5 min. • Secant Modulus @ 1% strain.
D6109 Standard Test Method
for Flexural Properties of
Unreinforced and Reinforced Plastic
Lumber
Four-point Flexure Test
• Specimens: support span (length) divided by minimum width = 16 (nominally).
• Calculated rate of crosshead motion by equation that list in the standard.
• Flexural strength = maximum stress at the moment of ruptured specimen.
• Secant Modulus of elasticity in flexure from equation provided.
D6112 Standard Test Methods for
Compressive and Flexural Creep and Creep-Ruptured of Plastic Lumber and
Shapes
Compressive Creep and Flexural Creep
• Uniaxial type of loading for compressive creep. • Plot successive creep modulus versus time at various
stresses for linear viscoelasticity materials. • Four-point flexure testing set-up for flexural creep. • Approximate time schedule for compressive or
flexural creep tests: 1, 6, 12, and 30 min; 1, 2, 5, 20, 100, 200, 500, 700, and 1000 hours.
• Able to predict the creep modulus and strength of material under long-term loads from testing data.
The testing procedures of the four-point flexure test are listed in ASTM D6109
(ASTM, 1997b). The length of specimens needs to follow the ratio of support span to
minimum width, equal to 16. The ASTM-recommended rate of crosshead motion,
R (in/min), as provided by equation 2.2.
dZLR
2185.0= (2.2)
11

Bowders, Loehr and Chen RPP Suitability for Stabilizing Slopes
where = support span (inch), = depth of the beam (inch), and L d Z = 0.01, rate of
straining of the outer fibers (in/in/min). The flexural strength is equal to the maximum
stress in the outer fibers at the moment of break (ruptured).
Although durable with respect to environmental degradation, polymeric materials
can exhibit higher creep rates than other structural materials such as timber, concrete, or
steel. In the slope stabilization application, the RPPs will be subjected to lateral (bending)
forces and their ability to resist deformation (either mechanical or creep) will strongly
influence the success of the RPPs for stabilizing slopes. Accordingly, determining the
creep behavior of the plastic pins is important for establishing this stabilization
technology. ASTM D6112 (ASTM, 1997d) outlines the testing procedures for
compressive and flexural creep tests. Data from these tests are necessary to predict the
creep modulus and strength of materials under long-term loads.
Table 2.4 shows the composition and engineering properties of plastic lumber
from various manufacturers. Manufacturers use materials including virgin plastics, post-
consumer waste plastics, and various plastics mixtures. Breslin et al. (1998) concluded
that the engineering properties of plastic lumber vary depending on the composition of
the polymers and additives used in lumber manufacturing. The unit weight ranged from
47 pcf to 60 pcf (7 KN/m3 to 9.5 KN/m3) for different manufacturers. The compressive
strength varied from 1700 psi to 3800 psi (11.7 MPa to 26.2 MPa). The use of a single
polymer (HDPE) and glass fiber additive resulted in significantly higher the modulus of
elasticity for plastic lumber (Breslin et al., 1998).
12

Bowders, Loehr and Chen RPP Suitability for Stabilizing Slopes
Table 2.4 Engineering Properties of Plastic Lumber Products (Breslin et al., 1998)
Product Composition Specific Gravity
Unit Weight[1] (lb/ft3)
Compressive Strength
(psi)
Modulus of Elasticity
(ksi)
Tensile Strength
(psi)
TRIMAX HDPE/Glass fibers 0.75 46.80 1740 450 1250
Lumber last Commingled recycled plastic 0.86 53.66 3755 140 1453
Earth care recycle maid Post-consumer milk jugs 0.79 49.30 3205 93 - 102.5 2550
Earth care products HDPE 0.909 56.72 - - [2] 173.4 - -
Supperwood Selma, Al
33% HDPE, 33% LDPE, 33% PP 0.82-0.87 51.2-54.3 3468 146.2 - -
Rutgers University 100% Curb tailings 0.944 58.9 3049 89.5 - -
60% Milk bottles, 15% Detergent bottles, 15%
Curb tailings, 10% LDPE
0.883 55.1 3921 114.8 - -
50% Densified PS 0.806 50.3 4120 164 - -
BTW Recycled
plastic lumber Post-consumer 0.88-1.01 54.9-63.0 1840-2801 162 - -
[1]: calculated by the present author [2]: data not available Conversion: 1MPa = 145 psi, 1ksi = 6.9 MPa
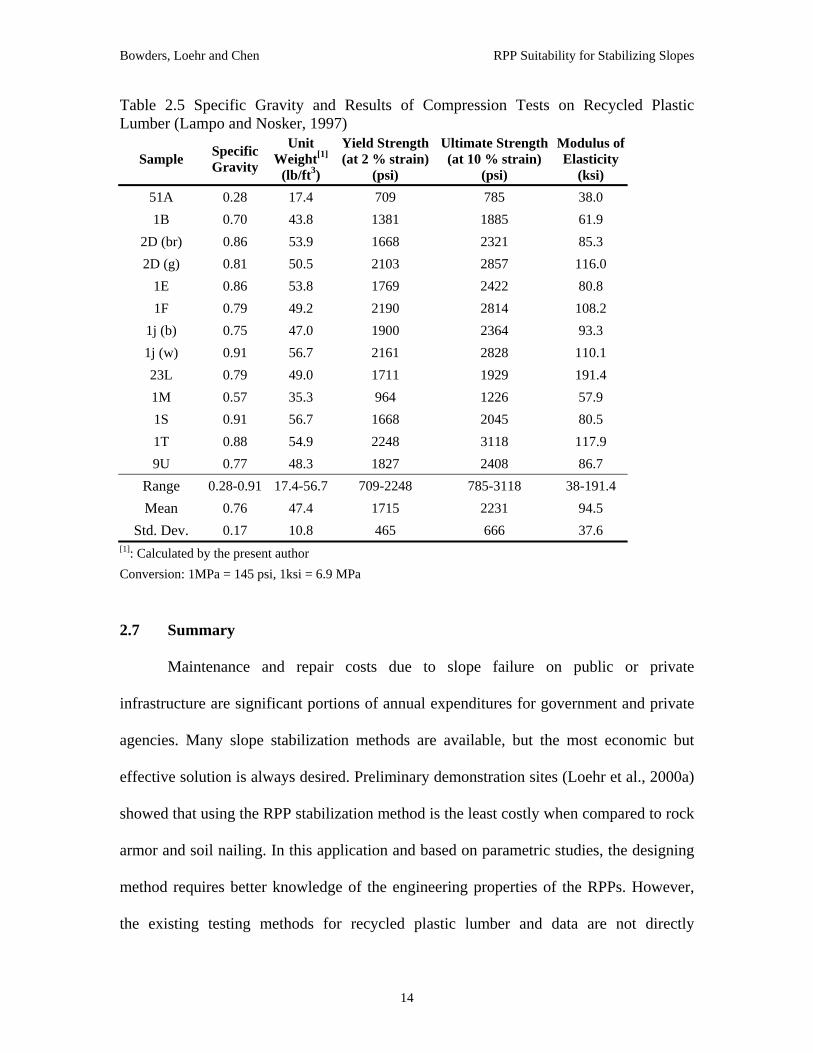
Lampo and Nosker (1997) performed the compression tests on recycled plastic
lumbers from multiple manufacturers. Table 2.5 contains the average for the specific
gravity and material properties from each manufactures. It shows the different materials
in terms of their material properties will perform differently among various
manufacturers. Overall, the moduli of elasticity ranged from 38 psi to 191 psi (400 MPa
to 1320 MPa). The significant variation in moduli proves that these materials cannot be
considered identical, and they cannot be assumed to perform similarly in many
applications (Lampo and Nosker, 1997).
13
Bowders, Loehr and Chen RPP Suitability for Stabilizing Slopes
Table 2.5 Specific Gravity and Results of Compression Tests on Recycled Plastic Lumber (Lampo and Nosker, 1997)
Sample Specific Gravity
Unit Weight[1]
(lb/ft3)
Yield Strength (at 2 % strain)
(psi)
Ultimate Strength (at 10 % strain)
(psi)
Modulus of Elasticity
(ksi) 51A 0.28 17.4 709 785 38.0 1B 0.70 43.8 1381 1885 61.9
2D (br) 0.86 53.9 1668 2321 85.3 2D (g) 0.81 50.5 2103 2857 116.0
1E 0.86 53.8 1769 2422 80.8 1F 0.79 49.2 2190 2814 108.2
1j (b) 0.75 47.0 1900 2364 93.3 1j (w) 0.91 56.7 2161 2828 110.1 23L 0.79 49.0 1711 1929 191.4 1M 0.57 35.3 964 1226 57.9 1S 0.91 56.7 1668 2045 80.5 1T 0.88 54.9 2248 3118 117.9 9U 0.77 48.3 1827 2408 86.7
Range 0.28-0.91 17.4-56.7 709-2248 785-3118 38-191.4 Mean 0.76 47.4 1715 2231 94.5
Std. Dev. 0.17 10.8 465 666 37.6 [1]: Calculated by the present author Conversion: 1MPa = 145 psi, 1ksi = 6.9 MPa
2.7 Summary
Maintenance and repair costs due to slope failure on public or private
infrastructure are significant portions of annual expenditures for government and private
agencies. Many slope stabilization methods are available, but the most economic but
effective solution is always desired. Preliminary demonstration sites (Loehr et al., 2000a)
showed that using the RPP stabilization method is the least costly when compared to rock
armor and soil nailing. In this application and based on parametric studies, the designing
method requires better knowledge of the engineering properties of the RPPs. However,
the existing testing methods for recycled plastic lumber and data are not directly
14

Bowders, Loehr and Chen RPP Suitability for Stabilizing Slopes
applicable for slope stabilization application. Modifications of the testing procedures are
necessary to obtain the engineering properties for slope at stabilization applications.
Installation performance tests directed toward RPPs slope stabilization are needed.
Results from extensive laboratory tests and field performance are helpful for developing a
specification for RPPs to be used in slope stabilization applications. The materials and
engineering properties are also needed for RPPs to be readily adopted as a slope
stabilization technique.
15

Bowders, Loehr and Chen RPP Suitability for Stabilizing Slopes
CHAPTER 3: MATERIALS AND METHODS
3.1 Overview
Extensive laboratory tests were performed to evaluate the engineering properties
of recycled plastic pins (RPPs) from three different manufacturers. Laboratory tests
included uniaxial compression, four-point flexure, compressive creep, and flexural creep
tests. Field tests included drivability analyses. The materials and methods used in the
testing program are described in this chapter.
3.2 Materials
Tests were performed on specimens from three manufacturers denoted A, B, and
C, as shown in Table 3.1. All of the members were nominally 3.5 in. x 3.5 in. (90 mm x
90 mm) in cross-section by 8 feet (2.4 m) in length. A detail of the RPPs composition and
manufacturing processes for each manufacturer were not provided. Measured unit
weights for all batches are not identical and ranged from 52 pcf to 68 pcf (8 kN/m3 to 11
kN/m3). One manufacturer (manufacturer A) provided pins manufactured in seven
different batches, denoted batches A1 through A6 and A10, over a period of three years.
Members in batches A1 through A4 were compression-molded products while members
from batches A5, A6 and A10 were extruded products. The constituent formula among
the first five batches (A1 to A5) was similar with approximately 60 percent low-density
polyethylene (LDPE) and 40 percent filler material (primarily sawdust). Batches A6 and
A10 were produced using a higher percentage of high-density polyethylene (HDPE). Two
additional manufacturers (manufacturers B and C) provided specimens of unreinforced
members composed of HDPE with negligible filler and additives. These specimens are
16

Bowders, Loehr and Chen RPP Suitability for Stabilizing Slopes
denoted as batches B7 and C9. Manufacturer B also provided specimens composed of
HDPE reinforced with cut-strand fiberglass reinforcement (batch B8). The specimens
from batches A1 through A6, A10, B7, B8 and C9 were manufactured at company
facilities and shipped to the University of Missouri-Geotechnical Laboratories for testing
or to the contractor for installation at the field test sites. They all are considered “virgin“
materials (undisturbed).
Table 3.1 Details of RPPs Tested in this Project
Specimen Batch
Principal Con-
stituent
Mftg. Process Source Depth
(in) Width (in)
Length[1] (in)
Unit weight (lb/ft3)
A 1 LDPE Compression Lab (virgin) 3.6 3.6 7.0 61.2
A 2 LDPE Compression Lab (virgin) 3.5 3.5 6.9 63.4
A 3 LDPE Compression Lab (virgin) 3.6 3.6 7.1 64.5
A 4 LDPE Compression Lab (virgin) 3.6 3.4 7.0 64.6
A 5 LDPE Extruded Lab (virgin) 3.4 3.4 7.1 58.9
A 6 HDPE Extruded Lab (virgin) 3.4 3.4 7.0 60.9
A10 HDPE Extruded Lab (virgin) 3.5 3.5 7.0 67.6
A11 HDPE Extruded Field (disturbed) 3.5 3.5 7.0 68.3
A12 HDPE Extruded Field (disturbed) 3.5 3.5 7.0 68.5
A13 HDPE Extruded Field (disturbed) 3.5 3.5 7.0 66.8
B 7 HDPE Extruded Lab (virgin) 3.4 3.4 6.9 52.9
B 8 HDPE + Fiber glass Extruded Lab
(virgin) 3.4 3.4 6.9 51.9
C 9 HDPE Extruded Lab (virgin) 3.5 3.5 7.0 67.9
[1]: for uniaxial compression tests. Conversion: 1 in = 2.54 cm, 1 lb/ft3 = 0.1572 kN/m3
17

Bowders, Loehr and Chen RPP Suitability for Stabilizing Slopes
Batches A11, A12 and A13 were taken from the portion of the RPPs that
remained above the ground surface after installation. They were all manufactured at the
same period as batch A10, thus have a similar constituent formula; however, these
specimens are considered “disturbed”. Batches A11 and A12 were installed in the I70-
Emma Slide3 in January 2003. Different installation equipment was used between the
two batches. Batch A13 was installed in the US54-Fulton site in January 2003.
3.3 Laboratory Methods
3.3.1 Uniaxial Compression Test
Uniaxial compression tests were performed on specimens cut from full size RPPs.
Their cross-section was square with side dimensions of 3.5 inches (90 mm) and a
nominal length of 7 inches (180 mm), twice the minimum width. The tests were
conducted using a stress controlled universal compression machine. The compression test
is shown in Figure 3.1. A steel plate was placed on top of the specimen to make sure the
compressive load was uniformly distributed over the whole cross-sectional area of the
specimen. A dial gage was placed beneath the steel plate to measure the displacement
during the test.
18

Bowders, Loehr and Chen RPP Suitability for Stabilizing Slopes
Figure 3.1 Setup for uniaxial compression tests.
The axial strain was computed by dividing the incremental displacement of the
loading head by the initial height of each specimen. A strain rate was determined by
dividing the incremental strain by the elapsed testing time. Secant moduli at one percent
strain and five percent strain were determined as shown in Figure 3.2. The secant moduli
were calculated using the slope of the straight line connecting zero percent strain to the
corresponding stresses at one percent and five percent strain, as shown in Figure 3.2a.
The average strain rate was determined by taking the average of all strain rates before
peak stress was reached, as illustrated in Figure 3.2b. An average strain rate of
approximately 0.006 in/in/min (mm/mm/min) was used through out this analysis.
19

Bowders, Loehr and Chen RPP Suitability for Stabilizing Slopes
0
500
1000
1500
2000
2500
3000
3500
0 5 10 15 20Axial Strain (% )
Uni
axia
l Com
pres
sion
Str
ess (
psi)
Using Ao
Peak Stress
E5%
E1%
(a)
0.000
0.002
0.004
0.006
0.008
0.010
0.012
0.014
0 5 10 15 20Axial Strain (% )
Stra
in R
ate
(in/in
/min
)
Avg. strain rate
(b)
Figure 3.2 Typical stress-strain curve (a) and average strain rate calculation (b) (Batch A3).
Two failure criteria were used to determine the compressive strength of the RPPs
in this project. The first one was based on using the original cross-sectional area ( ) of
the specimen to calculate the compressive stress and using five percent strain limit as the
baseline to choose the compressive strength. The second criterion was based on using a
0A
20

Bowders, Loehr and Chen RPP Suitability for Stabilizing Slopes
corrected cross-sectional area ( A ) based on measured perimeter of the specimen to
calculate the compressive stress and choosing the peak stress as compressive strength.
C
A tape measurement was used to measure the perimeter of the middle section of
specimens during the compression test (Figure 3.1). The corrected cross-sectional area
( ) was calculated by assuming the measured perimeter was that of a square section, so
that
CA
2
4,
=
PerimeterMeasuredAreaSectionalCrossCorrectedAC (3.1)
3.3.2 Four-Point Flexure Test
Four-point flexure tests were used to determine the flexural strength and stiffness
of the RPPs. Specimens were cut into testing length, approximately 6 feet (~2 m). The
support span to depth ratio used was 16:1 (ASTM, 1997b). A schematic drawing of the
setup is shown in Figure 3.3 and a photograph of the setup in the laboratory is shown in
Figure 3.4. The tests were conducted using a stress controlled universal testing machine
with a four-point bending attachment. The support span length ( ) ranged from 4 feet to
5 feet (1.2 m to 1.5 m) with load span (
L
3L ) of 16 inches to 20 inches (0.4 m to 0.5 m).
The rate of crosshead motion ranged from 1.2 in/min to 1.9 in/min (30 mm/min to 48
mm/min) was calculated by following the standard. Again, the ASTM-recommended
crosshead rate might be too fast for slope stabilization application. The overhanging
length was 6 inches (15 cm) on each end. The deflection at the middle point of the load
span and corresponding load applied to the specimen were recorded.
21

Bowders, Loehr and Chen RPP Suitability for Stabilizing Slopes
∆
P
Load Spana a
L
OverhangingLength
Figure 3.3 Loading diagram of the four-point flexure test.
Figure 3.4 RPPs in the four-point flexure test.
The typical response observed in the four-point flexure tests is shown in Figure
3.5. The flexural stress is plotted as a function of the extreme fiber strain at the center of
the specimen (“center” strain). These data points were derived from the applied loads and
measured deflections as follows.
22

Bowders, Loehr and Chen RPP Suitability for Stabilizing Slopes
0
200
400
600
800
1000
1200
1400
1600
1800
0.0 0.5 1.0 1.5 2.0 2.5 3.0 3.5 4.0 4.5Center Strain (%)
Flex
ural
Str
ess (
psi)
Batch A5
E2%
E1%
(a)
0.000
0.100
0.200
0.300
0.400
0.500
0.600
0.700
0.800
0.900
0.0 0.5 1.0 1.5 2.0 2.5 3.0 3.5 4.0 4.5Center Strain (%)
Def
orm
atio
n ra
te (i
n/m
in)
Batch A5
Avg. def. rate
(b)
Figure 3.5 Flexural stress versus center strain (a) and average deformation rate calculation (b) for flexural test on RPPs (Batch A5). Secant flexural modulus ( ) is shown for secant points at one and two percent center strain.
bE
23
Bowders, Loehr and Chen RPP Suitability for Stabilizing Slopes
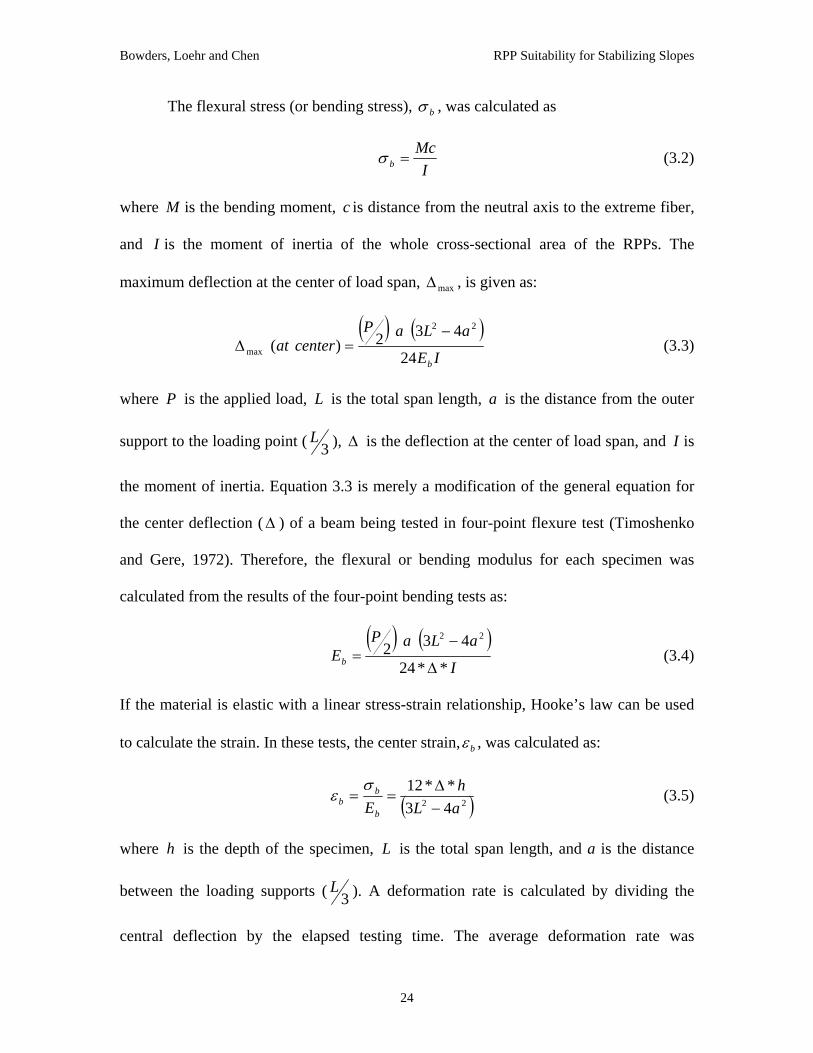
The flexural stress (or bending stress), bσ , was calculated as
IMc
b =σ (3.2)
where M is the bending moment, is distance from the neutral axis to the extreme fiber,
and
c
I is the moment of inertia of the whole cross-sectional area of the RPPs. The
maximum deflection at the center of load span, max∆ , is given as:
( ) ( )IE
aLaPcenterat
b24
432)(22
max
−=∆ (3.3)
where P is the applied load, is the total span length, is the distance from the outer
support to the loading point (
L a
3L ), ∆ is the deflection at the center of load span, and I is
the moment of inertia. Equation 3.3 is merely a modification of the general equation for
the center deflection ( ) of a beam being tested in four-point flexure test (Timoshenko
and Gere, 1972). Therefore, the flexural or bending modulus for each specimen was
calculated from the results of the four-point bending tests as:
∆
( ) ( )I
aLaPEb **24
43222
∆
−= (3.4)
If the material is elastic with a linear stress-strain relationship, Hooke’s law can be used
to calculate the strain. In these tests, the center strain, bε , was calculated as:
( )22 43**12aLh
Eb
bb −
∆==
σε (3.5)
where is the depth of the specimen, is the total span length, and a is the distance
between the loading supports (
h L
3L ). A deformation rate is calculated by dividing the
central deflection by the elapsed testing time. The average deformation rate was
24

Bowders, Loehr and Chen RPP Suitability for Stabilizing Slopes
computed by taking the average of all deformation rates before the flexural stress at
center strains of two percent, as illustrated in Figure 3.5b. A nominal deformation rate for
the four-point flexure tests was 0.2 in/min (5.1 mm/min).
Because the members tended to soften with increasing strain, secant values of the
flexural modulus were computed at center strains of one and two percent, as shown in
Figure 3.5a.
3.3.3 Flexural Creep Test and Compressive Creep Test
3.3.3.1 Flexural creep test
Flexural creep response testing was performed on scaled RPPs having nominal
dimensions of 2 in. x 2 in. x 24 in. (51 mm x 51 mm x 61 cm). A cantilever setup was
conceived to achieve the desired field loading. The creep frame that was designed and
built resembled a pommel horse; a schematic drawing is shown in Figure 3.6. Two steel
channels (C8 x 14) were welded together with the channels facing in. A gap of
approximately two inches was left between channels for a fastening position. The
channels were welded to a two-inch (51 mm) steel pipe stand that was threaded together
to accommodate moving the creep frame from place to place. The overall dimensions of
the frame are approximately 41-inch (104 cm) long by approximately 42-inch (107 cm)
tall. Fixing the specimens to the frame was achieved using several all thread bolts
approximately nine-inch (23 cm) long, 1 in. x 6 in. (25 mm x 152 mm) wood boards and
a 1 in. x 6 in. (25 mm x 152mm) steel plate with the same length as that of the creep
frame. The wooden boards and steel plate had holes drilled in them at the positions that
the all thread bolts would be used to clamp the specimens. A wood board was placed on
the creep frame and on top of the creep specimens to protect the specimens from melting
25

Bowders, Loehr and Chen RPP Suitability for Stabilizing Slopes
on the steel at high temperatures. The 1 in. x 6 in. (25 mm x 152 mm) steel plate was
place on top to provide rigidity to the clamping mechanism. The creep frame was
designed to hold eight specimens at various loads.
Nut50 lb
24 in.
Deflection
2 in. x 2 in. x 20 in. unsupported length
Point APoint BPoint C1 in.6 in.6 in.
RPP
Wood board
Channel
Steel plateNut
threaded rod
Figure 3.6 Setup for testing flexural creep of RPPs.
Table 3.2 shows the temperature and loading setup for the flexural creep tests. It
was determined that five temperatures would be needed to achieve continuity throughout
testing. Temperatures of 21°, 35°, 56°, 68°, and 80° Celsius (70°, 95°, 133°, 154°, and
176° Fahrenheit) were easily obtained in the elevated temperature controlled
environmental rooms. Humidity levels were not monitored. Eight specimens at each
temperature were tested for a total of thirty-six specimens with the exception that only
four specimens were tested at 35°C (95°F). Two specimens were equally loaded at the
same temperature to assure reproduction. Specimens were loaded with either single (21
lbs, 35 lbs or 50 lbs) or multiple point loads along their length (five 10-Lb loads
distributed evenly). The deflections at three points (points A, B, C as shown in Figure
26

Bowders, Loehr and Chen RPP Suitability for Stabilizing Slopes
3.6) along the cantilever were measured and recorded over time. Typical results are
shown in Figure 3.7, which shows the creep deflection versus time response.
Table 3.2 Temperatures and Loadings Detail for Flexural Creep Tests
Temperature (°C)
# Specimens Tested
Point Load (lbs)
Disturbed Load (lbs)
21 8 21, 35, 50 10 lbs @ 5 points
35 4 50 - - [1]
56 8 21, 35, 50 10 lbs @ 5 points
68 8 21, 35, 50 10 lbs @ 5 points
80 8 21, 35, 50 10 lbs @ 5 points [1]: data not available
-1.0
0.0
1.0
2.0
3.0
4.0
5.0
6.0
0 50 100 150 200 250Time (days)
Def
lect
ion
(inch
es)
Point APoint BPoint C
Figure 3.7 Deflection versus time response of RPPs with five 10-Lb loads at even spacing in 56°C environment. Specimen failed after 210 days.
By its very nature, creep is a long-term phenomenon. For example, the RPPs
being tested at 21°C (70°F) have been under load for more than five years but have not
27

Bowders, Loehr and Chen RPP Suitability for Stabilizing Slopes
failed. Failure was defined as breakage of the RPP. The tests at elevated temperatures
were established in order to accelerate the creep process. Results from the accelerated
testing were used along with the Arrhenius method (Koerner et al., 1990) to estimate the
long-term creep behavior for the RPPs in the field.
Arrhenius modeling provides a method to accelerate the creep rate of materials
and to predict performance at field temperatures. An example of an Arrhenius plot is
shown in Figure 3.8. The following steps explain the method:
Step 1: Results from flexural creep tests at several different temperatures are
presented in a plot of the natural logarithm of the inverse of the time required for the RPP
to break (failure) versus the inverse of the temperature at which the test was conducted
(Figure 3.8).
Step 2: The negative slope of the line on the Arrhenius plot is known as the
activation energy ( ) divided by the universal gas constant (actE KmolJR ο−= 314.8 ).
Knowing the value of negative slope (R
Eact− ), the reaction rate intercept on the
Arrhenius plot ( ln ) and the temperature of the actual site (T ), we can estimate the
time for the RPP to reach the breaking point under field conditions for a RPP stressed to
the same level as those used to develop the Arrhenius plot.
A site
Step 3: The reaction rate for the field condition, ( )siteRln , was calculated as:
−=
site
act
TRE
At
1ln1ln (3.6)
28

Bowders, Loehr and Chen RPP Suitability for Stabilizing Slopes
For this project, flexural creep tests at different temperatures were completed and the
parameters for the Arrhenius model were calculated. Estimations of the time for the RPPs
to deform to reach failure can now be performed.
-5.0
-4.0
-3.0
-2.0
-1.0
0.0
1.0
2.0
3.0
1/500 2/909 2/833 2/769 1/357 1/333 2/625 1/2941/Temperature (1/°K)
ln (R
eact
ion
Rat
e (1
/t))
REact−
1
lnAGoverning Equation:
−=
site
act
TRE
At
1ln1ln
siteT1
( )siteRln
Figure 3.8 Arrhenius plot of inverse reaction rate versus inverse temperature (Koerner, 1998).
3.3.3.2 Compressive Creep Test
The 3.5-inch squares by 7-inch height specimens were cut from the manufactured
RPPs for the compressive creep tests, as shown in Figure 3.9. A 0.42-inch (10.7 mm)
diameter hole was drilled at the center of specimen. The compressive load was applied
through a spring with an 800 lb/in (44.1 KN/m) spring constant. Two dial gages were
used; one measured the deformation of the spring for controlling the applied load. The
other measured the deflection of the specimen. All specimens were tested at room
temperature. (21°C (70°F)).
29

Bowders, Loehr and Chen RPP Suitability for Stabilizing Slopes
Figure 3.9 Setup for compressive creep test of recycled plastic specimen.
Measurements of deflection on both dial gages over time were recorded. This data
was necessary because creep is a time dependent phenomenon under sustained loads.
During compression creep testing, the dimensional changes that occurred during the time,
the specimen was under a constant static load were measured. Plotting deflection versus
time reveals the different stages of creep. An idealized creep curve is shown in Figure
3.10. Primary creep occurs upon loading after which the creep rate decreases rapidly
with time. Secondary creep occurs after primary creep and is distinguished by the
flattening of the deformation versus time curve (the steady-state value). Tertiary creep is
the final stage of creep, which is noted by a rapid increase in the deformation with time.
It is common to define failure as the deformation/time when the specimen transitions
from secondary to tertiary creep. In this work, failure was taken as the time to ultimate
rupture.
30

Bowders, Loehr and Chen RPP Suitability for Stabilizing Slopes
Primary Secondary Tertiary
Def
orm
atio
n
Time
Limit Deflection
Figure 3.10 An idealized creep curve.
3.4 Field Methods: Drivability Analyses
Installation characteristics for the different members were monitored at five slope
stabilization sites. During installation, the time required to drive the RPP to full depth, 8
feet (2.4 m), or until refusal, was recorded and a penetration rate (ft/min) was calculated
for each member. Refusal was defined when the penetration rate drop to three inches per
minute. The penetration rate was calculated by dividing the penetration length by the
corresponding time, excluding set up time.
Table 3.3 describes the seven slopes at five different sites with workdays, total
RPPs installed, and driving equipment. The first demonstrated site (man-made,
compacted fill) is an approximately 22-feet (6.8 m) high embankment with 2.5:1
(horizontal:vertical) side slopes that forms the eastbound entrance ramp to Interstate 70
near Emma Missouri (the I70-Emma site). This site was stabilized with RPPs in
November and December 1999. The site includes two separate stabilized areas (slide 1
and slide 2) and two control area (unstabilized), denoted slide 3 and slide 4, all of which
31

Bowders, Loehr and Chen RPP Suitability for Stabilizing Slopes
had experience repeated surficial slides over the past decade or more (Loehr et al.,
2000a). A total of 362 RPPs (includes trial installation) were installed in slide 1 and slide
2 during October and November 1999. The initial installation equipment used at the site
consisted of an Okada OKB 305 1250 ft-lb (1695 N-m) energy class hydraulic hammer
mounted on a Case 580 backhoe (Figure 3.11). This equipment was used for trial
installation and 45 RPPs were installed in I70-Emma slide 1. It proved unsuccessful as
the penetration rate was deemed unacceptable and installation was halted (Loehr et al.,
2000a, Sommers et al., 2000). Installation at slide 1 and slide 2 resumed on November
11, 1999 using a Davey-Kent DK 100B crawler mounted drilling rig supplied by the Judy
Company of Kansas City, Kansas (Figure 3.12). The crawler system caused much less
damage to the slope than the rubber-tired equipment. The crawler system did become
marginally stable when operating on the steepest parts of the embankment (>2H:1V) and
had to be tethered to the top of the slope in some locations.
Subsequently, the I70-Emma slide 3, which was one of the control areas, was
stabilized with RPPs and finished installation on January 7, 2003. A total 166 RPPs were
installed using Ingersoll Rand ECM350 system (Figure 2.1b and Figure 3.13). An
additional new installation equipment was the Daken Farm King hitter series II, Case
XT90 skid steer loader (impact-hammer equipment) that used for trials installation in this
site (Figure 3.13). Only two workdays were needed to finish the stabilization using RPPs
on January 7, 2003.
32

Bowders, Loehr and Chen RPP Suitability for Stabilizing Slopes
Table 3.3 Detail of Seven Slopes Using RPPs for Stabilization
Stabilized Slope Slope Inclination
Slope Height
(ft)
Work Days
# Pin Installed Installation Equipment
I70 Emma slide 1 2.5 (H): 1 (V) 22 1 45 [1] Okada OKB 305(1250 ft-lb) 1695 N-m energy class hydraulic hammer
2.5 (H): 1 (V) 22 2 154 Davey-Kent DK 100B crawler mounted drilling
I70 Emma slide 2 2.5 (H): 1 (V) 20 3 163 Davey-Kent DK 100B crawler mounted drilling
I70 Emma slide 3 2.5 (H): 1 (V) 20 2 166 Ingersoll Rand ECM350, IR 300 CFM, 100 psi air compressor
2.5 (H): 1 (V) 20 1 32 [1] Daken Farm King hitter series II, Case XT90 skid steer loader
I435 Wornall 2.2 (H): 1 (V) 31.5 2 33 Davey-Kent DK 100B crawler mounted drilling
2.2 (H): 1 (V) 31.5 10 583 Ingersoll Rand CM150, IR 350 CFM, 100 psi air compressor
I435 Holmes 2.2 (H): 1 (V) 15 5 262 Ingersoll Rand CM150, IR 350 CFM, 100 psi air compressor
US36 Stewartsville 2.2 (H): 1 (V) 27 5 360 Ingersoll Rand CM150, IR 350
CFM, 100 psi air compressor
US54 Fulton 3.2 (H): 1 (V) 43 4 377 Ingersoll Rand ECM350, IR 300 CFM, 100 psi air compressor
[1]: trial installation
33

Bowders, Loehr and Chen RPP Suitability for Stabilizing Slopes
Figure 3.11 Initial equipment used for installation of RPPs at the I70-Emma slide 1.
Figure 3.12 Crawler mounted drilling rig used for installation of RPPs at the I70-Emma slide 1 and slide 2.
34

Bowders, Loehr and Chen RPP Suitability for Stabilizing Slopes
Figure 3.13 Ingersoll Rand ECM350, 100-psi air compressor and Daken Farm King hitter series, impact hammer used for installation of RPPs at the I70 Emma slide 3.
The second slope stabilized with RPPs located at the intersection of Interstate 435
at Wornall Road in southern Kansas City, Missouri near the Missouri-Kansas border (the
I435-Wornall site). The compacted fill (man-made) embankment is an approximately
31.5-feet (9.6 m) high with side slope of 2.2:1 (horizontal:vertical). The Davey-Kent DK
100B crawler mounted drilling rig was used for trial installation and only 33 RPPs were
installation during the first two workdays. Observations showed that the equipment was
too heavy and could easily damage the slope faces during installation even if was tethered
to the top of slope in some locations. Therefore, an Ingersoll Rand CM150 air crawler
plus the air-track (air compressor) system supplied by the Judy Company was used for
the subsequent installation (Figure 3.14). This type of installation equipment is lighter
than the Davey-Kent DK 100B crawler rig and could easily operate on the slope
(>2H:1V). It also made driving the RPPs with correct alignment and placement fairly
35

Bowders, Loehr and Chen RPP Suitability for Stabilizing Slopes
easy and quick. A total of 583 RPPs were installed with the Ingersoll Rand CM150
system in ten workdays and the work was finished on December 7, 2001.
An additional stabilized slope located at the southeast side of intersection between
Interstate 435 and Holmes Road, Kansas City (the I435-Holmes site). The compacted fill
(man-made) is an approximately 15-feet (4.6 m) high embankment with 2.2:1
(horizontal:vertical) slope face. The same equipment, Ingersoll Rand CM150 air crawler
plus 100-psi air compressor, were used for five workdays to install a total of 254 steel
pipes. The 3.5-inch (90 mm) diameter steel pipes were used at this location to provide for
a wider range of reinforcing member properties.
A cut slope located at Route US36, near Stewartsville Missouri (the US36-
Stewartsville site) has been stabilized using RPPs since May 7, 2002. The slope is
approximately 27-feet (8.2 m) high with side slope of 2.2:1 (horizontal:vertical). A total
of 360 RPPs were installed using the same equipment as that used at the I435-Wornall
and Holmes sites.
The last stabilized site (cut slope) located at Route US54, near Fulton Missouri
(the US54-Fulton site). It is approximately 43-feet (13.1 m) high embankment with 3.2:1
(horizontal:vertical) slope face. The slope was stabilized using 377 RPPs and work was
finished on January 15, 2003 for four workdays. The same installation machine was used
for this site (Figure 2.1b). All seven slopes at five sites were instrumented for
performance monitoring.
36

Bowders, Loehr and Chen RPP Suitability for Stabilizing Slopes
Figure 3.14 Ingersoll Rand CM150, 100-psi air compressor used for installation of RPPs
at the I435-Wornall site.
37

Bowders, Loehr and Chen RPP Suitability for Stabilizing Slopes
CHAPTER 4: RESULTS AND DISCUSSION
4.1 Overview
The results of the laboratory tests and field drivability analyses are presented in
this chapter. Tests performed included uniaxial compression, four-point flexure, flexural
creep, and compressive creep. Arrhenius modeling was used to predict the time to reach
creep failure for RPPs installed in the field. Field tests included drivability performance
for seven stabilized slopes are also presented and discussed in this section.
4.2 Uniaxial Compression Tests
4.2.1 Stress-Strain Curves
Typical compressive stress-axial strain curves determined for the recycled plastic
pins (RPPs) are shown in Figure 4.1 for specimens from manufacturer A (Figure 4.1a)
and manufacturers B and C (Figure 4.1b). As shown in the figures, specimens provided
by manufacturer A exhibited a clear peak in the stress-strain response, whereas
specimens from manufacturers B and C produced no clear peak in the stress-strain curves
when the original cross-sectional area ( ) was used to compute the stress. The peak
stress occurred after exceeding five percent axial strain for compression materials from
manufacturer A. The compression-molded specimens show a small strain (about 10
percent strain) to reach total failure, and the extruded products show at least about 18
percent strain until the appearance of failure planes.
0A
38

Bowders, Loehr and Chen RPP Suitability for Stabilizing Slopes
0
500
1000
1500
2000
2500
3000
3500
4000
4500
0 5 10 15 20 25 30
Axial Strain (%)
Uni
axia
l Com
pres
sion
Str
ess (
psi)
Batch A4, Using AoBatch A10, Using AoBatch A4, Using AcBatch A10, Using Ac
Compression
Extruded
(a) Stress-strain curve typical of RPPs exhibiting failure planes (All Mftg A).
0
500
1000
1500
2000
2500
3000
3500
4000
4500
0 5 10 15 20 25 30Axial Strain (%)
Uni
axia
l Com
pres
sion
Str
ess (
psi)
Batch B7, Using AoBatch C9, Using AoBatch B7, Using AcBatch C9, Using Ac
All Extruded Products
(b) Stress-strain curve typical of RPPs exhibiting bulging failure (Mftg B and C).
Figure 4.1 Typical compressive stresses versus axial strain behavior for recycled plastic pins (RPPs).
39

Bowders, Loehr and Chen RPP Suitability for Stabilizing Slopes
The extruded products from manufacturers B and C exhibited no peak stress in
the stress-strain curve. The stress increased with increasing strain up to about 30 percent
strain when using the original cross-sectional area ( ) to calculate compressive stress.
Figure 4.2 shows typical deformed specimens after compression tests. These photographs
reveal that specimens from manufacturer A developed clearly defined failure planes,
while specimens from manufacturers B and C developed no clear failure planes, but
exhibited a bulging type of failure mode.
0A
(a) Typical failure planes shown by compression molded RPPs from Mftg A.
(b) Typical bulging failure has shown by e truded products from Mftg B and Mftg C.
Fi
x
gure 4.2 Failure modes of RPPs during uniaxial compression tests.
40

Bowders, Loehr and Chen RPP Suitability for Stabilizing Slopes
4.2.2 Uniaxial Compression Strength
Observations from the laboratory testing results suggest that a corrected cross-
sectional area should be used in the determination of the compressive strengths, but no
standard area correction has been established. If one assumes a constant volume and that
the cross-section remains uniform during compression, a corrected cross-sectional area
can be computed as:
( )ε−= 10AAe (4.1)
where is the corrected cross-section area calculated from Equation 4.1, s the
origin ss-sectional area, and
eA
al cro
0A i
ε is the axial strain. However, observations of the
specimens during testing indicate that the cross-sectional areas do not remain uniform
and the volume is not constant during deformation, thus invalidating the use of Equation
4.1 for area corrections. Since no consistent area correction has been agreed upon, the
compressive strengths reported subsequently were taken to be the compressive stress at
five percent axial strain for all specimens without area corrections. The five percent strain
limit serves to limit the magnitude of errors associated with the specimen area and
provides a consistent basis for comparison of strengths for different specimens. The five
percent strain limit also serves as a basis for limiting deformation in the field
applications.
The difference between the corrected cross sectional area ( calculated from
the measured perimeter during the compression test and the original area ( versus
axial strain during compression test for three different manufacturers is shown in Figure
4.3. In general, the cross-sectional area is a function of axial strain. The area increased
CA )
0A )
41

Bowders, Loehr and Chen RPP Suitability for Stabilizing Slopes
with ax ee manufacturers. The cross sectional
area fo
ces a more clearly defined peak in the stress-strain response for
specimens from manufacturers A, B, and C (Fig
ial strain for all RPP specimens from all thr
r batches A4 (compression molded) rapidly increases within 11 percent axial strain
while the cross sectional area for batches B7, B8, and C9 increased at a lower rate. The
cross sectional areas for batches A5, A6, and A10 (all extruded products from
manufacturer A) have intermediate increase within 15 percent axial strain. Application of
this correction produ
ure 4.1).
3.5
4.0
Diff
eren
ce B
twor
rect
ed A
rea
and
Initi
al
A) (
in
A6 A10
C9
A10, where A = 12.2 in2
Compression
0.0
0.5
1.0
1.5
2.0
2.5
3.0
0 5 10 15 20 25 30Axial Strain (%)
eee
n C
rea
(AC-A
02 )
A4 A5
B7 B8
A0 = 11.6 in2 except for
0
Extruded
Figure 4.3 Difference calculated from measured perimeter versus axial strain during
compression tests (Mftg A, B, and C).
The average and standard deviation of the compressive strengths determined for
each batch of specimens are given in Table 4.1. Overall, the measured compressive
strengths range from 1600 psi to 3000 psi (11 MPa to 21 MPa) based on original cross-
sectional area calculation at a nominal strain rate equal to 0.006 in/in/min (0.006
mm/mm/min).
42

Bowders, Loehr and Chen RPP Suitability for Stabilizing Slopes
Table 4.1 Uniaxial Compression Strength from Uniaxial Compression Test on RPPs
Uniaxial
Strength[1] (psi)
Uniaxial
Strength[2] (psi) Batch Tested Strain rate
Avg. Std. Dev. Avg. Std. Dev.
A2 7 0.005 2948 117 - - - -
A3 6 0.005 2824 88 - - - -
Compression Compression Specimen # Specimens Nominal
(in/in/min)
A1 10 NA 2784 128 - -[3] - -
A4 6 0.005 2621 295 2486 271
A5 6 0.007 1634 200 1578 189
A6 14 0.007 1602 105 1521 102
A10 15 0.006 2219 154 2152 136
A11 15 0.006 2301 139 2217 140
A12 8 0.007 2085 84 1931 199
A13 15 0.007 2380 330 2310 318
B 7 15 0.007 2080 69 2331 134
B 8 15 0.006 2500 191 2505 195
C 9 15 0.007 2315 209 2556 322 [1]: Use original cross-sectional area (A0) to calculate stresses [2]: Use corrected cross-sectional area (Ac) to calculate stresses [3]: Data not available Conversion: 1 MPa =145 psi
Specimens from batches A1 to A4 are compression-molded products with dates of
i (19
Pa) w
Pa), approximately 40 percent lower than specimens from batches A1 to
A4. Most of the reduction in strength among specimens in batches A1-A4 and batches
manufacture spanning two years. The average strength of these specimens is 2800 ps
M ith a standard deviation of about 150 psi (1 MPa). This shows a good consistency
of product over the two-year period. Specimens from batches A5 and A6 were
manufactured using the extrusion process with a slightly lower amount of “filler”
material (primarily sawdust). The average compressive strength of these specimens was
1600 psi (11 M
43

Bowders, Loehr and Chen RPP Suitability for Stabilizing Slopes
A5-A6 is attributed to the manufacturing process. However, specimens in batches A5 and
A6 represent the initial attempts by manufacture ded produ mens from
batc 0 to A e al ure sio verage
strength of these specimens is 2200 psi (15 M p ly rc than
specim from batc s A1 to A subse prod Batch 10 to A13) show
about a 30 percent increase in the average co ive s gth of batch and A6.
This demonstrates that the manufacturer can modify the process and the constituent
mixture to produce materials omparable streng o th pres molded
produ
specime used to r t the s for b es A 12 a 13 were
taken the po n of the RPPs that ed a the nd surface after
instal . Thus, e specim e cons “dist d” ( 3.1). Batch A10
specim were del ed directly to the labor and a nsid irgi aterials.
N e compressive strength between the
s irgin condition and those in the disturbed condition indicating that the
installation process does not have a deleterious effect on the compressive strength of the
RPPs.
A at extru
d using t
cts. Speci
n processhes A1 13 wer so manufact he extru . The a
Pa), a proximate 20 pe ent lower
ens he 4. The quent ucts ( es A
mpress tren the A5
with c ths t e com sion-
ct.
The ns epresen trength atch 11, A nd A
from rtio remain bove grou
lation thes ens ar idered urbe Table
ens iver atory re co ered “v n” m
ote, there is no discernable change in the averag
pecimens in the v
Batches A11 and A13 are disturbed specimens that were installed using an air-
compression hammer (Figure 3.13). Batch A12 specimens were installed using the
impact hammer (Figure 3.13). In one instance, Batch A12 has slightly lower strengths
(about 10 percent lower) than the virgin specimens from batch A10. The reasons may be
associated with the different installation equipment or different number of specimens
tested. The variation in strength between the three batches is not significant to indicate
44

Bowders, Loehr and Chen RPP Suitability for Stabilizing Slopes
that either driving method is more or less deleterious to the compressive strength of
RPPs.
The average compressive strength for manufacturer B and C ranged from 2000 psi
to 2500 psi (14 MPa to 17 MPa), approximately 10 percent to 30 percent lower than
specimens from batches A1 to A4. Batch B8 with the fiberglass-reinforced specimens
shows about 20 percent increase in compressive strength when compare to the
unreinforced specimens (Batch B7).
3500
0
500
1000
3000
Manufacturing Batch
Using AoUsing Ac
1500
2000
2500
A1 A2 A3 A4 A5 A6 A10 A11 A12 A13 B 7 B 8 C 9
Ave
rage
Com
pres
sive
Str
engt
h (p
si)
sectional area corrections for materials from all manufacturers.
0
area correction ( CA ) are shown as bar graph in Figure 4.4. In general, the strengths at 0A
Figure 4.4 Comparison of average compressive strengths with and without cross-
The average compressive strengths for materials from the three manufacturers
determined at five percent strain with no area correction ( and at the peak stress with
(5%) are higher th e with area correction ( . The difference is approximately five
A )
an thos CA )
45

Bowders, Loehr and Chen RPP Suitability for Stabilizing Slopes
percent. In two instances, batches B7 and C9, the strength with the area correction was
higher (by approximately 10 percent) than the specimens without area correction. The
close agreement between the strengths indicates that using the strength at five percent
strain without corrected cross-sectional area provides a reasonable value for the peak
strength.
3000
3500
y = 10.767x + 1664.1R2 = 0.0227
0
500
1000
1500
2000
2500
50 55 60 65 70Average Unit Weight (pcf)
Ave
rage
Com
pres
sive
Str
engt
h (p
si)
Using Ao
Using Ac
Figure 4.5 Average compressive strength versus average unit weight for materials from all manufacturers.
age unit
eight for materials from three manufacturers. The solid data points represent strengths
calcula
(
50
weights. The reasons could be associated with the principal constituents and the
Figure 4.5 shows a plot of the average compressive strength versus aver
w
ted based on original cross-sectional area ( 0A ), and open data points represent
strengths calculated from corrected cross-sectional area ). The average strengths
ranged from 1500 psi to 3000 psi (10 MPa to 21 MPa) within a unit weight range of
pcf to 70 pcf (8 kN/m3 to 11 kN/m3). There is little correlation between strengths and unit
CA
46

Bowders, Loehr and Chen RPP Suitability for Stabilizing Slopes
manufacturing processes. Therefore, the unit weights of the RPPs play a small role in
influence on the compressive strengths.
4.2.3 Modulus of Elasticity
Average values and standard deviations of the secant modulus of elasticity, E,
determined from the uniaxial compression tests at one percent strain and five percent
strain are shown in Table 4.2.
Table 4.2 Secant Moduli from Uniaxial Compression Test on RPPs
Secant Modulus,
E1% [1] (ksi)
Secant Modulus,
E5% [1] (ksi)
Secant Modulus,
E1% [2] (ksi)
Secant Modulus,
E5% [2] (ksi) Specimen Batch
# Specimens
Tested
Nominal Strain rate (in/in/min)
Avg. Std. Dev. Avg. Std.
Dev. Avg. Std. Dev. Avg. Std.
Dev. A1 10 NA 134 8 57 4 - -[3] - - - - - -
A2 7 0.005 184 9 55 3 - - - - - - - -
A3 6 0.005 164 29 57 3 - - - - - - - -
A4 6 0.005 186 20 52 4 185 20 49 4
A5 6 0.007 84 16 33 4 84 16 31 3
A6 14 0.007 93 8 32 2 92 8 30 2
A10 15 0.006 114 12 45 3 113 12 43 3
A12 8 0.007 108 11 40 4 107 11 38 4
A13 15 0.007 110 21 48 6 110 21 45 6
B 7 15 0.007 87 10 42 2 85 11 39 3
A11 15 0.006 119 11 47 3 119 11 45 3
B 8 15 0.006 138 27 49 4 136 26 47 4
C 9 15 0.007 87 12 46 4 86 12 45 4 [1]
: Use corrected cross-sectional area (Ac) to calculated stresses [3]: Data not available
: Use initial cross-sectional area (A0) to calculated stresses [2]
Conversion: 1 MPa = 145 psi, 1 ksi = 6.9 MPa
47

Bowders, Loehr and Chen RPP Suitability for Stabilizing Slopes
The moduli were calculated using original cross-sectional area and corrected
cross-sectional area. The moduli determined at one percent strain generally ranged from
80 ksi Pa) for both failure criteria. The moduli of the
percent lower than the compression-molded products.
B8 (fiber-reinforced
materials) was 138 ksi (951 MPa), approximately ent hig spec om
to 190 ksi (552 MPa to 1310 M
extruded products was generally on the order of one half that determined for the
compression-molded products. For example, batch B8 (fiberglass-reinforced specimens)
show the stiffness about 20
Average secant modulus at one percent axial strain of batch
60 perc her than imens fr
batch B7 (unreinforced materials).
A 2 A3 A5 A6 10 A A1 13 7 B C 9
anufac ring ch
Us Ao
ure 4 pa f aver seca mod s at ax stra Eanufacturers.
The average results and range fo
0
50
100
150
200
250
1 A A4 A 11 2 A B 8
M tu Bat
Ave
rage
Sec
ant M
odul
us a
t 1%
Str
ain
(ksi
) ing Using Ac
Fig .6 Com rison o age nt ulu 1% ial in ( ) for all m
r each batch are shown as bar graph in Figure 4.6
(E@1%ε) and Figure 4.7 (E@5%ε). The secant moduli at one percent axial strain show no
difference between original and corrected area. At five percent axial strain (Figure 4.7),
%1
48

Bowders, Loehr and Chen RPP Suitability for Stabilizing Slopes
the moduli calculated using the original cross-sectional area are about five percent greater
than those calculated using the corrected area. This behavior is similar to that for the
compressive strength and further indicates that the strength and modulus calculated using
the original area at five percent strain is a reasonable representation of the peak strength.
50
60
70
Ave
rage
Sec
ant M
odul
us a
t 5%
Str
ain
(ksi
)
Using Ac
0
10
20
30
40
A1 A2 A3 A4 A5 A6 A10 A11 A12 A13 B 7 B 8 C 9Manufacturing Batch
Using Ao
Figure 4.7 Comparison of average secant modulus at 5% axial strain ( ) of all manufacturers.
The average secant moduli at one percent strain for batches A10 – A13 ranged
from 110 ksi to 120 ksi (758 MPa to 827 MPa). For Batches A5 and A6 the average
secant moduli at one percent strain ranged from 80 ksi to 90 ksi (552 MPa to 621 MPa).
uit t from
manufacturer A. The secant moduli at one percent strain for batches B7 and C9 were
almost
%5E
The secant moduli at one percent strain for batches B7 and B8 were q e differen
identical and both are unreinforced material. The unreinforced material (Batch
B7) had a secant modulus of 90 ksi (621 MPa) while the reinforced material (Batch B8)
49

Bowders, Loehr and Chen RPP Suitability for Stabilizing Slopes
had a secant modulus of 140 ksi (965 MPa). Obviously, the reinforcing fibers
significantly stiffened the material.
The modulus values determined at five percent strain ranged from 30 ksi to 60 ksi
(207 MPa to 414 MPa), indicating that all of the products exhibited significant softening
(decreasing stiffness) with increasing strain. The secant moduli at five percent strain were
similar for batches A10 through A13, manufacturer B, and manufacturer C, and were in
the range of 40 ksi to 50 ksi (276 MPa to 345 MPa).
4.2.4 Strain Rate Effects
The properties of plastic materials are dependent on the rate of loading (Birley et
al, 1991). The behavior of the recycled plastic lumber (viscoelastic) is that the more
rapidly it is loaded, the stronger and stiffer the material behaves (McLaren, 1995). To
evaluate this effect, a series of tests were performed for a range in strain rates for
specimens provided by all three manufacturers. All results of the compressive strengths
were calculated using the original cross-sectional area ( ). The results of these tests
n” specimens from manufacturer A are plotted in Figure 4.8. It is of
interest to see that the trend line of batch A4 (compression molded) is almost parallel to
the trend line of batch A10 (extruded products). Batch A4 shows that the measured
compressive strength increased from 2100 psi to 2900 psi (14 MPa to 20 MPa) (a 30
percent change) as the strain rate was varied from 0.0006 in/in/min to 0.02 in/in/min
(0.0006 mm/mm/min to 0.02 mm/mm/min). This corresponds to a drop in compressive
strength of approximately 18 percent for each log cycle reduction in strain rate. Batch
A10 had a drop in compressive strength of approximately 22 percent for each log cycle
reduction in strain rate. Batches A5 and A6 had slightly smaller differences in strength
0A
from the “virgi
50

Bowders, Loehr and Chen RPP Suitability for Stabilizing Slopes
and moduli shows that they had the same strain rate effect. They all had a drop in
compressive strength of approximately 16 percent for each log cycle reduction in strain
rate. In
of approximately 20 minutes) was
chosen he remaining test specimens.
these tests, the specimen tested at the lowest strain rate (0.0006 in/in/min) reached
its peak stress in about two hours while the specimen tested at the highest strain rate
(0.021 in/in/min) reached failure in approximately 6 minutes. Because of the significance
of strain rate effects and practical issues involved with developing a specification, a strain
rate of approximately 0.006 in/in/min (testing time
as a baseline for comparing t
R = 0.3206 (A4)
R = 0.1457 (A5)
y = 122.53Ln(x) + 2168.62
R = 0.4436 (A10)
0
500
Strain Rate (in/in/min)
Com
pres
sive
Str
engt
h (p
si)
Batch A4 Batch A5 Batch A6 Batch A10
y = 219.7Ln(x) + 3771.42
y = 84.473Ln(x) + 2113.92
R = 0.2256 (A6)
y = 233.49Ln(x) + 3360.42
1000
1500
2000
2500
3000
3500
0.0001 0.0010 0.0100 0.1000
Log. (Batch A4) Log. (Batch A5) Log. (Batch A6) Log. (Batch A10)
ASTM rate
specimens). Figure 4.8 Compressive strength versus strain rate for tests on RPPs (Mftg A – virgin
Figure 4.9 shows that the compressive strength versus strain rate for batch A10
(virgin specimens) and for batches A11 to A13 (disturbed specimens). In general, the
differences in the slopes of each batch were small. Batches A11 and A13 were installed
using the same types of equipment and show that the measured compressive strength
51

Bowders, Loehr and Chen RPP Suitability for Stabilizing Slopes
increased from 1800 psi to 2500 psi (12 MPa to 17 MPa) (a 30 percent change) as the
strain rate was varied from 0.0003 in/in/in to 0.02 in/in/min (0.0003 mm/mm/min to 0.02
mm/mm/min). This corresponds to a drop in compressive strength of approximately 15
percent for each log cycle reduction in strain rate, which is lower than that for batch A10
that had a 22 percent decrease in strength for each log cycle reduction in strain rate. The
variation in stain rate effects between the three disturbed batches is not significant to
indicate again that either driving method is more or less deleterious to the RPP strength.
3500
y = 233.49Ln(x) + 3360.4R2 = 0.4436 (A10)
y = 170.29Ln(x) + 3088R2 = 0.3941 (A11)
y = 231.62Ln(x) + 3186.3R2 = 0.6737 (A12)
y = 166.34Ln(x) + 3195.6R2 = 0.1613 (A13)
0
500
1000
1500
2000
2500
3000
0.0001 0.0010 0.0100 0.1000Strain Rate (in/in/min)
Com
pres
sive
Str
engt
h (p
si)
Batch A10 Batch A11 Batch A12 Batch A13Log. (Batch A10) Log. (Batch A11) Log. (Batch A12) Log. (Batch A13)
ASTM rate
A10 = virgin pinsA11, A12, A13 = after driving (stick up)
Figure 4.9 Compressive strength versus strain rate for materials from Mftg A (virgin
Figure 4.10 shows the compressive strength versus strain rate batches from
manufacturer B and manufacturer C. Note that the slope of strain rate relationships are
almost identical, although these materials come from different manufacturers. In general,
these three batches show that the strength increased from 1800 psi to 2700 psi (12 MPa
specimens versus disturbed specimens).
52

Bowders, Loehr and Chen RPP Suitability for Stabilizing Slopes
to 19 MPa) (a 30 percent change) as the strain rate was varied from 0.0003 in/in/min to
0.02 in/in/min (0.0003 mm/mm/min to 0.02 mm/mm/min). This corresponds to a drop in
compressive strength of approximately 20 percent for each log cycle reduction in strain
rate. It can be concluded that the drop in compressive strength for RPPs from all three
manufacturers ranged from 15 percent to 25 percent for each log cycle reduction in strain
rate.
3500
y = 312.95Ln(x) + 3625.4R2 = 0.723 (B7)
y = 210.42Ln(x) + 3558.2R2 = 0.4586 (B8)
y = 247.05Ln(x) + 3467.7R2 = 0.2671 (C9)
0
500
1000
1500
2000
2500
3000
0.0001 0.0010 0.0100 0.1000Strain Rate (in/in/min)
Com
pres
sive
Str
engt
h (p
si)
Batch B7 Batch B8 Batch C9Log. (Batch B7) Log. (Batch B8) Log. (Batch C9)
ASTM rate
Figure 4.10 Compressive strength versus strain rate for tests on RPPs (Mftg B and C).
Standard compression strength ( stdσ ) was defined by the compressive strength at
0.03 in/in/min (ASTM, 1997a), based on the compressive strength versus strain rate plot
(Figure 4.11). For example, results of the compressive strengths versus strain rates from
batch A10 were plotted in Figure 4.11. The standard compression strength was taken
equal to 2540 psi at a strain rate equal to 0.03 in/in/min (0.03 mm/mm/min). Note that,
53

Bowders, Loehr and Chen RPP Suitability for Stabilizing Slopes
every batch has a different standard compressive strength as measured at a strain rate of
0.03 in/in/min (0.03 mm/mm/min).
y = 233.49Ln(x) + 3360.4
3000
σstd = 2540 psi
R2 = 0.4436
0
500
1000
1500
2000
2500
0.0001 0.0010 0.0100 0.1000Strain Rate (in/in/min)
Com
pres
sive
Str
engt
h (p
si)
Batch A10, using Ao ASTM rate
Figure 4.11 Standard compressive strength ( stdσ ) for tests on RPPs (Batch A10).
The ratio of the compressive strength (at a given strain rate) to the standard
compression strength ( stdσ )
ng stdσ
as a function of strain rate for the RPPs from all three
manufacturers is plottedin Figure 4.12. As shown in this figure, the compressive strength
ecreases with decreasi strain rate in terms of the standard compressive strength (d )
of percentage reduction. Batch A5 has the flatter slope and serves as “upper-bound”
reduction. Batch B7 has the steepest slope and serves as “lower-bound” reduction. The
average slope was computed by taking average value of all the data. Thus making it easy
to compare all possible strain rates that might occur in the field in terms of reductions of
the standard compression strength ( stdσ ). For example, the compressive strengths
decrease by approximately 30 percent (average slope) of standard strengths at one-day
54

Bowders, Loehr and Chen RPP Suitability for Stabilizing Slopes
testing rate, while the strengths reduce about 60 percent (average slope) of standard
strengths at one-week testing rate. From this strain rate relationship (Figure 4.12), we can
test specimens at any strain rate and find their corresponding compressive strengths at
field strain rate.
0
20
40
60
80
100
120
000Strain Rate (in/in/min)
Com
pres
sive
Str
engt
h/ σ
std (
%)
Batch A4 Batch A5 Batch A6 Batch A10
ASTM rate one month rate
one week rate one day rate
lower-bound (B7)
upper-bound (A5)
average (all)
0.000001 0.000010 0.000100 0.001000 0.010000 0.100
Batch B7 Batch B8 Batch C9
Figure 4.12 Ratio of compressive strength to standard compressive strength versus strain
recently been developed specifically for testing plastic lumber products as summarized in
Table 2.3. These standards dictate strain rates that are approximately 1.5 times greater
than the highest strain rate shown in Figure 4.8, Figure 4.9, and Figure 4.10. While the
value of standardized test procedures is acknowledged, current standardized tests were
developed with typical building applica s in mind. The loading rates specified in these
standards is therefore very high. In the slope stabilization application, the members are
rate for RPPs.
Strain rates have particular significance in developing a suitable specification for
recycled plastics in the slope stabilization application. Several ASTM standards have
tion
55
Bowders, Loehr and Chen RPP Suitability for Stabilizing Slopes
called upon to resist sustained bending loads over time, which may cycle from negligible
load to the limit loads of the members as load is transferred from the moving soil in
response to environmental conditions in the slope. In this application, the loading rate is
likely to be very slow, on the order of months (seasonal). The evaluation program
included tests performed at a range of loading rates to establish relationships between the
properties of interest (primarily strength and stiffness) and loading rate.
4.3 Four-Point Flexure Tests
4.3.1 Flexural Stress- Center Strain Curves
Typical results of flexural stress versus center strain are observed from batches
A4, A10, and B8. Specimens from batches A10 and B8 (extruded products) exhibited
more than two percent center strain. Specimens from batch A4 (compression-molded)
ruptured before two percent strain. Specimens from batch A10 showed a flatter curve
after passing two percent strain and ruptured before reaching three percent strain, while
specimens from batch B8 showed a increasing stress with increasing strain until reaching
rain, when the tests were stopped. three percent st
56

Bowders, Loehr and Chen RPP Suitability for Stabilizing Slopes
500
1000
3000
3500
2.5 3.0 3.5)
Batch A4Batch A10Batch B8
1500
2000
2500
4000
4500
Flex
ural
Str
ess (
psi)
00.0 0.5 1.0 1.5 2.0
Center Strain (%
Figure 4.13 Typical flexural stresses versus center strain behavior for RPPs.
4.3.2 Flexural Strengths
Results of the four-point flexure tests are summarized in Table 4.3. Since the
number of tests on batches A11 and A12 were limited, no standard deviation is reported.
Extruded members showed continually increasing stress with increasing deflection/strain
without experiencing rupture of the member, while the compression molded members
ruptured at approximately two percent strain. The flexural strength for comparison of the
different products was therefore taken to be the flexural stress at center strains of two
percent or the stress at rupture for members that failed at center strains of less than two
percent so that consistent strengths were established for all specimens. The measured
flexural strengths for specimens loaded to failure or two percent center strain ranged from
1300 psi to 3600 psi (9 MPa to 25 MPa) under a nominal deformation rate 0.2 in/min (5.1
mm/min). The key finding from these tests is that there is significant variability, a factor
of 2.8, in the flexural strength among the products tested.
57

Bowders, Loehr and Chen RPP Suitability for Stabilizing Slopes
Table 4.3 Results of Four-Point Flexure Tests on RPPs
Flexural Strength [1] (psi)
Secant Flexural Modulus, E1%
(ksi)
Secant Flexural Modulus, E2%
(ksi) Specimen Batch
# Specimens
Tested
Nom. Def. Rate
(in/min) Avg. Std.
Dev. Avg. Std. Dev. Avg. Std.
Dev. A1 13 - - [2] 1574 342 103 8 88 [3] - -
A4 3 0.17 2543 260 213 13 - - - -
A5 5 0.23 1542 188 98 14 73 2
A6 7 0.14 1360 118 95 12 68 6
A10 6 0.18 1596 137 123 22 76 10
A11 1 0.19 1679 - - 135 - - 81 - -
A12 1 0.19 1448 - - 115 - - 71 - -
B 7 6 0.17 1505 112 90 7 69 4
B 8 6 0.17 3589 358 243 24 179 13
C 9 7 0.16 1696 39 107 4 83 2 [1]: all results based on stress at 2% center strain or center strain at rupture of less than two percent [2]: data not available [3]: resultConversion: 1 MPa = 145 psi, 1 ksi = 6.9 MPa
of 2 specimens, others ruptured prior to reaching two percent center strain
A comparison the average flexural strength among all batches was plotted as a bar
graph in Figure 4.14. In this plot, there is a tendency for the extruded products to have
lower flexural strengths, except for batch B8 that contained reinforcing fibers. The
average flexural strengths for extruded products are about 1500 psi (10 MPa) and for
compression-molded products is about 2500 psi (17 MPa) (a 40 percent change);
however, we must temper this conclusion with the only three tests of the batch A4. The
only exception is batch B8 that has the flexural strength of approximately 3600 psi (25
MPa). The reinforced products of batch B8 showed a little increase in uniaxial
compression strength (Table 4.1), but a large increase in flexural strength relative to other
materials.
58

Bowders, Loehr and Chen RPP Suitability for Stabilizing Slopes
0
500
1000
1500
2000
250
3
3500
A1 A4 A5 A6 A10 A11 A12 B 7 B 8 C 9
Manufacturing Batch
4000
0
000A
vera
ge F
lexu
ral S
tren
gth
(psi
)
Figure 4.14 Comparison of ge ral strengths all m factu rs.
Average values of the secant flexural modulus for each batch of specimens are
shown in Table 4.3. In general, the flexural moduli varied from approximately 90 ksi to
250 ksi (621 MPa to1724 MPa) at one percent strain, similar to the values observed in the
uniaxial compression tests with the exception of batch B8.
Results from batches A4 and B8 have significantly higher flexural stiffness than
the other batches by a factor of two. This may potentially be a result of being
compression molded or reinforced as compared to being on extruded products. Breslin et
al. (1998) concluded that the use of glass and wood fiber additives significantly improves
the modulus of elasticity for plastic lumber. Batch A10 (virgin specimens), batches A11
and A12 (disturbed specimens) have similar flexural strength and flexural moduli.
Flexural moduli at two percent center strain were consistently lower than those
avera flexu for anu re
4.3.3 Flexural Modulus
59

Bowders, Loehr and Chen RPP Suitability for Stabilizing Slopes
determined at one percent center strain, because the RPPs tended to soften with
increasing strain. The clear difference is shown as a bar graph in Figure 4.15. Secant
flexural modulus at two percent was not available for batch A4, because the specimens
ruptured before two percent center strain.
0
50
100
150
200
250
300
A6 A10 A11 A12 B 7 B 8 C 9
Ave
rage
Sec
ant F
lexu
ral M
odul
us (k
si)
E at 1% strainE at 2% strain
A1 A4 A5
Manufacturing Batch
Figure 4.15 Comparison of average secant flexural modulus at one percent center strain
4.4 Creep Behavior
( %1E ) and two percent strain ( ) of RPPs. %2E
4.4.1 Flexural Creep Tests
Typical results of deflection versus time for specimens under a sustained load are
shown in Figure 4.16. The behavior shown is typical of the RPPs tested at the various
temperatures. The specimens were loaded with 50 lbs (23 kg) at the free end of a simple
cantilever (Figure 3.6). All specimens failed after the final data point, with the exception
of the specimens at 21°C (70°F), which have been under load for more than five years but
have not failed.
60

Bowders, Loehr and Chen RPP Suitability for Stabilizing Slopes
3.0
4.0
5.0
6.0
7.0
End
Def
lect
ion
(inch
es)
Ambient Temp. @ 21°C (70°F) Temp. @ 35°C (95°F) Temp. @ 56°C (133°F) Temp. @ 68°C (154°F) Temp. @ 80°C (176°F)
0.0
1.0
2.0
0.0001 0.001 0.01 0.1 1 10 100 1000 10000
Log Time (days)
Figure 4.16 Deflection versus time response for RPP loaded with 50 lbs at the free end of a simple cantilever (Figure 3.6) under various temperatures.
Table 4.4 shows the summary results of flexural creep tests under various loading
conditions and temperatures. Specimens at elevated temperatures of 56°C, 68° , and
°C °F) r four types of loading conditions. As the
temperature increased, the time to reach failure decreased for the same load condition.
Results show that the loading levels, along with temperature, affect the creep behavior of
the recycled plastic specimens. The higher load levels or those closer to the ultimate
strength of the material, the faster the creep rate and shorter time to reach failure.
C
80 (133°F, 154°F, and 176 failed unde
61

Bowders, Loehr and Chen RPP Suitability for Stabilizing Slopes
Table 4.4 Summary of Flexural Creep Tests on Recycled Plastic Specimens
# Specimens Tested
Temperature (°C)
# Specimens Tested
Average Time to Reach Failure (days) Comments[2]
10 lbs @ 5 points 21 2 1185[1] Not failed
56 2 194.5 Failed
68 2 3.5 Failed
80 2 0.8 Failed
21 lbs single load 21 2 1185[1] Not failed 56 2 574 Failed 68 2 17.5 Failed 80 2 8.5 Failed
35 lbs single load 21 2 1185[1] Not failed 56 2 71.5 Failed 68 2 0.6 Failed 80 2 0.75 Failed
50 lbs single load 21 2 1185[1] Not failed 35 4 200 Failed 56 2 3.1 Failed
80 2 0.75 Failed 68 2 0.4 Failed
[1]: the last day of testing, specimens have not ruptured : failure is defined as breakage of the specimens
An example of an Arrhenius plot for the RPPs is shown in Figure 4.17. The plot
includes data for tests at 35°C, 56°C, 68°C, and 80°C (95°F, 133°F, 154°F, and 176°F)
with a 50-lbs (23 kg) single load at the end of a simple cantilever. Results showed the
RPPs were all broken when the temperature was increased at 35°C, 56°C, 68°
[2]
C, and
80°C (95°F, 133°F, 154°F, and 176°F) with a 50-lbs (23 kg) single load condition, except
for the RPPs that were tested at 21°C (70°F), which have been under load for more than
five years. Therefore, the data point of the 21°C (70°F) didn’t show in the Arrhenius plot
(Figure 4.17).
62

Bowders, Loehr and Chen RPP Suitability for Stabilizing Slopes
y = -14793x + 43R2 = 0.8797
-5.0
-4.0
-2.0
-1.0
1/500 2 2/833 /769 1/357 33 2/625 4
1/Temperature (1/°K)
ln (R
ean
Rat
e (1
/t)) (
2.0
.263
-6.0
-3.0ctio
0.01/
da
1.0
y)
/909 2 1/3 1/29
Figure 4.17 Typical Arrhenius Plot for flexural creep test on 2 in. x 2 in. x 24 in. RPP loaded with a 50-lbs weight at the end of a simple canti u der vario tures.
Again, as the test temperature increased, the time to reach the failure point is
reduced. From the slope of the line in Arrhenius plot, we estimate the time for the RPP to
emperature condition (assume 21°C =
294°K)
lever n us tempera
creep to the failure point under field t =siteT
.
263.431147931ln +
−=
site
(From Eq 3.6)
Tt
Therefore, the time required for the RPP to creep to the failure point is approximately
1157 days (3.2 years). However, based on observations from the laboratory testing shows
that the RPPs don’t show any cracks on the specimens, and have steady creep rate. Thus
the Arrhenius modeling underestimates the time to reach failure. Plots for other loading
conditions are included in the appendix C.
63

Bowders, Loehr and Chen RPP Suitability for Stabilizing Slopes
Table 4.5 Loading Conditions and Results of the Flexural Creep Tests on the RPPs
Loading Condition
Moment of the Specimens, Mtest
[1]
(in-lb)
Tensile Stress in Creep [2], σTcreep
(psi)
Ratio of Tensile Stress in Creep to Tensile Strength[3] (σTcreep/σTRPP) (%)
Time to Reach Failure Due to
Flexural Creep at 21°C[4] (years)
50 lb Single Load 950 714 40 3.2
35 lb Single Load 665 500 28 290
21 lb Single Load 399 300 17 2317
Five 10 lb loads @ Equal Spacing 590 444 25 6515
[1]: moment arm = 19 inches [2]: use Eq 4.2 to calculate stress [3]: average tensile strength = 1800 psi (measured in laboratory) [4]: calculation shown in the appendix
as
predicted from the Arrhenius method for four different loading conditions are shown in
Table 4
The loading conditions, maximum moments, and time to reach failure
.5. For example, the moment of the specimen for 50-lbs single load:
lbininlbsM test −== 95019*50
The tensile stress in creep, σ : Tcreep
psiin
inlbsinI
yM testTcreep 714
33.11*950*
4 =−
==σ
From the result of average tensile strength (Loehr et al., 2000a), = 1800 psi, TRPPσ
Therefore, the ratio of tensile stress in creep to the average tensile strength,
1800TRPPσσ
In addition, the ratio of tensile stress due to the applied loads to the average
tensile strength (1800 psi) is shown in the table. Specimens were loaded to 40 percent, 28
percent, and 17 percent of the average tensile strength for the point loading condition.
%40396.0714≅==Tcreep
64

Bowders, Loehr and Chen RPP Suitability for Stabilizing Slopes
Specimens were loaded 25 percent of the average tensile strength and the time to reach
failure was determined to be approximately 6500 years due to the flexural creep for the
fiv ds ly g
specimens.
e 10-lbs loa distributed even . It is much lon er than that for single point loaded
100
1000
f
10000
(yea
rs)
Percentage of Max. Tensile Stress
Est
. Tim
e to
Fle
xure
-Cre
ep F
ailu
re, t
1
10
0 10 20 30 40 50 60
mating time to failure resulting from flexural creep of RPP.
The time to failure under flexural creep loading at field temperature (assumed
21°C) versus the load levels, i.e., the percentage of the tensile stress in creep to the
4.18.
fective creep
lifetime of an RPP in the field. The following steps illustrate the method:
(%)
Figure 4.18 Method for esti
average tensile strength that measured from laboratory results is plotted in Figure
The data in this plot provides the information needed to predict the ef
65

Bowders, Loehr and Chen RPP Suitability for Stabilizing Slopes
Steps to Estimate Creep Life in the Field (RPPs)
Step 1: Measure the strain on an instrument pin in the field and calculate the bending
moment ( bM ) for the pin.
Example: Figure 4.19 shows the maximum bending moments determined from the
strain gages on instrumented pin C (slide2) and pin G (slide 1) at the I70-Emma
site. As shown in the figure, the pin G showed a steady increase in bending
moment up to 350 lb-ft (475 N-m) before May 2001, assumed that it would keep
steady increased. The pin C showed a steady increasing bending moment up to of
150 lb-ft (203 N-m) after July 2002.
0
100
300
500
600
700
800
900
1000
Date (M/D/Y)
Max
imum
Ben
ding
Mom
ent (
lb-f
t)
IM-G (slide 1)
IM-C (slide 2)
July 2, 2002
Avg. = 350 lb-ft
400May 15, 2001
200
12/6/99 6/23/00 1/9/01 7/28/01 2/13/02 9/1/02
Emma site (Parra et al., 2003). Figure 4.19 Maximum mobilized bending moments from instrumented RPPs at I70-
66

Bowders, Loehr and Chen RPP Suitability for Stabilizing Slopes
S Use the calculated moment to compute the tensiltep 2: e stress ( ) in the extreme Tσ
fiber of the RPP as:
IyM b
T*
=σ (4.2)
where is the distance from the neutral axis to the extreme fiber, and y I is the
moment of inertia for a given section.
Example: for pin G at Emma site, bM = 350 lb-ft (475 N-m), y = 1.75 in, and I =
12.5 in4, thus Tσ = 588 psi (4 MPa). For pin C at Emma site, bM = 150 lb-ft (203
N-m), y = 1.75 in, and I = 12.5 in4, thus Tσ = 252 psi (1.7 MPa).
Step 3: Check the ratio of the calculated tensile stress in the field to the maximum tensile
stress for the pin and given section.
maxT
fieldTRatio σσ
= (4.3)
Example: the average tensile strength, maxt
σ = 1800 psi (12 MPa), and the ratio of
tensile stresses is 33 percent for pin G. The ratio of tensile stresses is 14 percent
for pin C.
Step 4: Figure 4.18 shows the time to failure ( ) versus percentage of maximum tensile
stress based on Arrhenius method. Locate the calculated percentage of maximum
tensile stress and find the corresponding time to failure.
e I70-Emma slide 1, the percentage of maximum tensile
is 33 percent and the resulting time to flexure-creep failure is found to be
approximately 45 years. For pin C at the I70-Emma slide 2, the percentage of
ft
Example: for pin G at th
67

Bowders, Loehr and Chen RPP Suitability for Stabilizing Slopes
maximum tensile is 14 percent and the resulting time to flexure-creep failure is
found to be more than 2000 years.
The above procedure can be used to estimate the design life of the RPPs in slope
stabilization application. If the estimated time to failure is too low, the engineer can
Option ing the number of pins, increasing the size
of the p in cr
changin
which u re. In the testing program various single point
loads were used to generate the creep deformation with breakage time. The data in Table
4.5 shows that for similar specimens, loaded with five 10 lb at equally spacing, the time
to reac
for sing
closer to distributed loading than to point loading. Thus, the proposed method could be
4.4.2 Compression Creep Tests
The typical plot of deflection versus time for compression creep tests is shown in
Figure 4.20. Primary creep was completed within one day after the load was applied for
all specimens. Secondary creep occurred after the primary creep and continued for about
a year. Results show that the specimens remained in the secondary creep stage and
modify the design to reduce the stress level of the pins in order to increase the design life.
s for reducing the stress include increas
ins, changing the constituent blend the RPPs to make less eep susceptible or
g the cross-section to increase their moment of inertia.
It is possible that the method shown above to predict flexure-creep failure is
conservative, since it is entirely based on laboratory tests and the Arrhenius method,
nderestimates the time to reach failu
h failure due to flexural creep at 21°C is about 6500 years, much longer than that
le point loaded specimens. However, the loading conditions in the field are much
conservative in predicting the lifetime of the RPPs in the field.
68

Bowders, Loehr and Chen RPP Suitability for Stabilizing Slopes
continu
which was calculated by dividing the spring loads by the original cross-sectional area.
ed to creep at a steady rate. This might be due to the low creep stresses applied,
0.00
0.02
0.10
0.12
Time (days)
1150
1170
1210
1250
1270
Loa
d in
Spr
ing
(lbs)
Deformation
0.06
0.08
0.14
0.16
0.18D
efle
ctio
n (in
ches
)
1230
1290
1310
1330
Load
Tie up nuts
Primary Creep
0.04
0 50 100 150 200 250 300 350 400
1190Secondary Creep
recycled plastic specimen from batch B7.
The creep stresses ranged from 100 psi to 120 psi (690 KPa to 827 KPa) for the
RPP specimens. The ratio of creep stress to the compressive strength, ranged from four
percent to six percent, a very low creep stress. Due to the low creep stress applied, no
specimens has ruptured. Summary results from the compressiv
Figure 4.20 Typical deflection under constant axial stress versus time of a
e creep tests are shown in
Table 4 m mputed by dividing the maximum deflection
to the i
.6. A aximum creep strain was co
nitial height of the specimen. The maximum creep strain for batch B7 and C9 was
about 0.4 percent, and for batch A3 and A6 was about 0.1 percent.
69

Bowders, Loehr and Chen RPP Suitability for Stabilizing Slopes
Table 4.6 Summary Results of the Compressive Creep Tests on the RPPs
Ratio of Creep Stress to Maximum Mftg # Specimens Creep Stress
(psi) Compressive strength[1] (%)
Creep Strain (%)
A3 2 105 3.7 0.1
A6 2 100 6.3 0.08
B7 1 110 5.3 0.38
C9 1 120 5.1 0.36 [1]: based on the average compressive strength from the uniaxial compression tests.
Figure 4.21 shows the deflections versus time of the compressive creep tests on
the RPPs. It is clear that the primary and secondary creep behavior among the four
batches varies. Specimens from batches B7 and C9 are a little more creep susceptible
than specimens from batches A3 (compression molded) and A6 (extruded). Specimens
from batches B7 and C9 are made from extruded processes with unreinforced material
and the one test was performed for batches B7
and C9
creep behavior is identical. However, only
. Specimens from batches A3 and A6 are from the same manufacturer, but
different manufactured process. The batch A6 shows the lowest creep rate in the first
stage. The maximum stress level of these springs was used; however, the creep stresses in
the RPPs are only five percent of compressive strength.
70

Bowders, Loehr and Chen RPP Suitability for Stabilizing Slopes
0.000
0.005
0.010
0.015
0.020
Time (days)
flo
ns)
Batch A3
0.030
0.025D
eec
tin
(ich
eBatch A6
Batch B7 Batch C9
0.0001 0.001 0.01 0.1 1 10 100 1000
Figure 4.21 Deflections versus time of the compressive creep tests on RPPs.
4.5 Field Installation Behavior
4.5.1 Introduction
In addition to being able to resist the loads imposed by the slope, it is critical that
RPPs have sufficient strength and stiffness to resist the stresses imposed during
installation. The technique employed for installation of R
PPs to date has been to utilize a
percussion hammer mounted on the mast of track mounted drilling rigs (Loehr et al.,
2000a). One such rig, used at the I70-Emma slide 1 and slide 2, is shown in Figure 3.12.
The primary advantage of using rigs similar to the one shown in Figure 3.14 is that the
mast of the rig maintains the alignment of the hammer and reinforcing member thereby
minimizing the lateral loads imposed on the unsupported length of the member during
driving.
71

Bowders, Loehr and Chen RPP Suitability for Stabilizing Slopes
It is logical to expect that the penetration rate of reinforcing members should
increase with increasing strength and stiffness of the RPPs, since stiffer members are
expected to dissipate less input energy thereby transferring more energy to penetrating
the reinforcement. To investigate this hypothesis and to provide accurate data on possible
installation rates, the installation records at each of the field sites were monitored and the
time to drive the pins their full depth (8 feet), or to refusal, was recorded. Shorter pins,
denoted as less than 8 feet (2.4 m), typically indicate difficult driving conditions. The 8-
feet (2.4 m) RPPs could not penetrate the full length and the stick up portion was cut off
at the ground after installation. A total of seven slides (Table 3.3) were stabilized using
the RPPs obtained from three manufacturers and an additional slide was stabilized with
ing member
roperties.
4.5.2 I70-Emma Site
Table 4.7 shows a summary of penetration performance for the I70-Emma site.
The soils at this site consist of mixed lean and fat clay with scattered cobbles and
construction rubble. RPPs were installed approximately perpendicular to the slope face at
the slide 1. Penetration rates were monitored for 90 of the 199 RPPs at the site. The
average penetration rate for all monitored RPPs was 4.6 ft/min (1.4 m/min). RPPs were
installed with a vertical orientation at the slide 2. Penetration rates were monitored for
150 of the 163 RPPs at the site. The average penetration rate for all monitored RPPs was
3.9 ft/min (1.2 m/min). The average penetration rate increased approximately 18 percent
for RPPs installed perpendicular to the slope. Limitations of the Davey-Kent drilling rig
necessitated the RPPs to be installed in a vertical alignment, and were driven with the rig
3.5-inch (90 mm) diameter steel pipe to provide for a wider range of reinforc
p
72

Bowders, Loehr and Chen RPP Suitability for Stabilizing Slopes
being b
p the RPP and drop-weight hammer aligned. This shows in the driving rate.
ber pile was used for trial installation with the
Ingerso
acked up the slope. While not critical, this feature did result in slightly lower
penetration rates for RPPs driven vertically as compared to RPPs driven perpendicular to
the face of the slope (Table 4.7).
Penetration rates were monitored for 173 of the 195 RPPs. All were installed at a
vertical orientation at the slide 3. The average penetration rate for all monitored RPPs
from batch A10 was 6.5 ft/min (2 m/min). Twenty-five of the 32 RPPs were monitored
and installed by the Daken Farm King hitter series (impact-hammer equipment- Figure
3.14). The average penetration rate was 4.2 ft/min (1.3 m/min), which decreased
approximately 35 percent compared to the percussion hammer from the Ingersoll Rand
CM350, track mounted drilling rig (Figure 3.13) used to drive the rest of the RPPs. A
reason for the difference is that the current impact machine requires additional labor (and
time) to kee
An 8-feet long, 3.5 diameter tim
ll Rand ECM350, track mounted drilling rig (Figure 3.13). Three timber piles that
are used for landscape purposes were driven in the top, middle, and bottom of the slope at
the slide 3. The average penetration rate was 6.9 ft/min (2.1 m/min), which is close to the
average driving rate of RPPs from batch A10 (6.5 ft/min) at the Slide 3.
If the subset of RPPs that were installed less than full length (refusal) is
considered separately, the average penetration rate was 4.1 ft/min (1.2 m/min) while the
rate for RPPs driven to their full length was 10.1 ft/min (3.1 m/min) at the slide 3. This
means that difficult driving conditions can reduce the rate by as much as 60 percent. The
same situation occurred for the slide 1 and slide 2.
73

Bowders, Loehr and Chen RPP Suitability for Stabilizing Slopes
Table 4.7 Penetration Performance of RPPs at I-70 Emma Site
Penetration Rate (ft/min)
(Working Period) Batch Stabilized Slope Specimen Installed
length # Pins
Monitored Min. Max. Avg. Std Dev.
Slide 1 A1 8 ft 79 0.7 10.2 5.0 2.2
ALL[1] 90 0.7 10.2 4.6 2.4
Slide 2 A1 8 ft 107 1.5 8.7 4.5 1.6
ALL 150 0.4 8.7 3.9 1.8
Slide 3 A10 8 ft 60 2.0 18.5 10.1 4.4
ALL 148 0.1 18.5 6.5 4.6
Timber Pile
[1]: average results for all monitored pins. : using drop-weight hammer driving machine.
(10/18/1999~11/12/1999) < 8 ft 11 0.7 2.7 1.6 0.7
(11/17/1999~11/22/1999) < 8 ft 43 0.4 7.0 2.4 1.4
(1/6/2003~1/7/2003) < 8 ft 88 0.1 17.0 4.1 2.8
A10[2] ALL 25 1.2 15.0 4.2 2.9
ALL 3 2.8 12.3 6.9 4.9
[2]
t the site. Of all
monito
red.
4.5.3 I435-Wornall Site and Holmes Site
A summary of penetration performance for the I435-Wornall site and Holmes site
is shown in Table 4.8. The soils at the I435-Wornall site consist of a 3 feet to 5 feet (1 m
to 1.5 m) thick surficial layer of soft, lean clay overlying stiffer compacted clay shale.
Penetration rates were monitored for 499 of the 616 RPPs installed a
red RPPs, 186 were driven their full length. The penetration rate for this subset of
RPPs was 6.6 ft/min (2 m/min). In addition, 313 of the monitored pins reached refusal
before the full 8 ft (2.4 m) length was embedded into the subsurface. In these cases, the
average penetration rate was 4.7 ft/min (1.4 m/min), which indicates that penetration
rates were reduced when stiffer soils were encounte
74

Bowders, Loehr and Chen RPP Suitability for Stabilizing Slopes
Table 4.8 Penetration Performance of RPPs at I-435 Wornall and Holmes Site
P
Batch le# M
enetration Rate (ft/min)
Stabilized Slope (Working Period)
Specimen Installed
ngth M Pins
onitored in. Max. Avg. Std Dev
5 Wornall 4 8 ft 51 1.0 13.4 4.4 .1 (10/18/2001~12/7/2001) A 3 1 2.4
A 4 1< 8 1 2
ALL 110 1 1.8
B <
LL[1] 84 1.0 3.7 5.2 5 8 ft 9 3.8 9.7 6.6 .4 ft 61 2.2 3.0 6.0 .0 2.2 3.0 6.3
7 8 ft 1 - - - - 6.0 - - B8 8
C9 < 4Steel 8 1
I435 Holmes < 8 ft 6 3.1 5.8 4.6 1.0
ft 1 - - - - 3.3 - - 8 ft 3 3.5 12.0 6.7 .6
Pipe ft 3 4.8 6.9 5.9 .0
A5
(12/14/2001~12/20/2001) S < 8 ft 216 0.4 13.2 5.0 2.1 teel Pipe
[1]: average results for all monitored pins.
I43 A < 2 2
for the penetration rates determined
for the
Figure 4.22 shows a frequency distribution
I435-Wornall site. As shown in Figure 4.22, the penetration rate varied from a low
of about 1.0 ft/min (0.3 m/min) to a high of about 13.7 ft/min (4.0 m/min) and the
average value was 5.4 ft/min (1.6 m/min) with a standard deviation of 2.4 ft/min (0.7
m/min). Considering all RPPs from batches A4 and A5, the average penetration time was
1.5 minutes for the 8-feet (2.4 m) long RPPs. The observed variability in the rate is
primarily attributed to variability in the in situ soil conditions across the site.
75

Bowders, Loehr and Chen RPP Suitability for Stabilizing Slopes
1
2
40
0.5 2.0 5.0 6.5 8.0 9.5 11.0 12.5 14.0
Avg. Penetration Rate (ft/min)
B7
C9
60
0
0
0
30
Freq
uenc
y of
Occ
urre
nce
(num
bers
)50
3.5
A4,A5
B8
Steel
Figur tion r qu istribu n for and l ste pe
t ati , I43 rnall
Of the 499 RPPs monitored at the I435-Wornall site, 384 were from batch A4
strength properties for these members are summarized in Table 4.9. The average
penetration rates for these two products are similar, 5.2 ft/min (1.6 m/min) of batch A4
and 6.3 ft/min (1.9 m/min) in spite of the significant differences in the strength and
stiffness of the members. Several “test” drives using RPPs from batches B7, B8, and C9,
ll site. The
penetration rates observed for these members are also shown in Figure 4.22 and
summarized in Table 4.8. Penetration rates for these members ranged from 3.3 ft/min to
6.7 ft/min (1.0 m/min to 2 m/min). Only a single member from each of batches B7 and
B8 was installed, so no conclusions are drawn about these materials. Three RPPs from
batch C9 were driven with an average penetration rate of 6.7 ft/min (2.0 m/min). The
e 4.22 Penetra ate fre
abiliz
ency d tio RPPs tria el pi
reinforcements in slope s on site 5-Wo .
(compression molded) and 110 were from batch A5 (extruded). The penetration rates and
and three specimens of steel pipe, were also performed at the I435-Worna
76

Bowders, Loehr and Chen RPP Suitability for Stabilizing Slopes
steel pipe, with a much greater stiffness than any of the RPPs, yielded a penetration rate
of 5.9 ft/min (1.8 m/min). All of these penetration rates fall well within the range
observed for the RPPs from batches A4 and A5, which suggest that penetration rates are
not significantly affected by the strength and stiffness of the pins.
Table 4.9 Penetration Rates and Material Properties for RPPs Installed at I435-Wornall and I435-Holmes Sites
Stabilized Slope
Specimen Batch
# Pins Monitored
Avg. Penet. Rate
(ft/min)
Avg. Compression Strength[1],
(psi)
Avg. Secant Modulus in
Compression[1], E1% (ksi)
Avg. Flexural Strength
(psi)
Avg. Secant
Modulus, E1% (ksi)
I435 Wornall A4 384 5.2 2621 186 2543 213 A5 110 6.3 1634 84 1542 98 B7 1 6.0 2080 87 1505 90 B8 1 3.3 2500 138 3589 243
107 Steel Pipe - - - - - - - -
I435 Holmes 6 4.6 84 1542 98
C9 3 6.7 2315 87 1696 3 5.0
[2]
A5 1634 Steel Pipe 216 5.0 - - - - - - - -
[1]: use original cross-sectional area (A0) to calculate stresses ot available [2]: data n
The slide at the I435-Holmes site, which has soil conditions similar to those at the
I435-Wornall site, was stabilized using 254 steel pipes (Table 4.9). Of that number,
penetration rates were recorded for 216 steel pipes. The average penetration rate for these
members was 5.0 ft/min (1.5 m/min) with a standard deviation of 2.1 ft/min (0.6 m/min).
Six RPPs from the batch A5 were also installed in this slope. The pins produced an
average penetration rate of 4.6 ft/min (1.4 m/min), only slightly lower than that observed
for the steel members, again suggesting that strength or stiffness plays a minor role in
determining the penetration rates.
In order to try to discount the variability of the subsurface conditions, the
penetration rates of the test pins were compared to the average rate for the “nearest
77

Bowders, Loehr and Chen RPP Suitability for Stabilizing Slopes
neighbors” of the test pins. The idea of taking average penetration rates of the nearest
neighbors that surround the test pins is illustrated in Figure 4.23. The penetration rates of
the “test” drives using RPPs from batches B7, B8, and C9, and three specimens of steel
pipe with their “nearest neighbors” were calculated and are shown in Table 4.10.
Test Pin
e
earest ig )
Pins us
d to calculate driving rate
ne hborsavg.
(n
Figure 4.23 Analysis of penetration “test o the ave driving or it“nearest neighbors”.
at ate an sis of Ps fro ch B7 sh that they penetrated the
slope pprox 7 nt fa than its nearest neighbor from h A4. Ps
f e installed approximately 12 percent slower than the nearest neighbors
for batch A4. This might indicate that RPP’s from batch B7 material can be more
efficiently driven into the slope. However, observations from the field show batch B7
was hardly penetrating after 5 feet (1.5 m) of installation and there was significant lateral
had slight lateral bending refusal. We must temper this conclusion with the observations
in the field and the fact that only one test pin from batch B7 and B8 were installed. More
RPPs from batches B7 and B8 must be installed in the field in order to confirm this
observation.
rate pin” t rage rate f s
Penetr ion r aly RP m bat ows
a imately 3 perce ster batc RP
rom batch B8 wer
bending of the pins prior to refusal occurring. Batch B8 was installed its full length and
78

Bowders, Loehr and Chen RPP Suitability for Stabilizing Slopes
Table 4.10 Penetration Rates of “Test Pins” and “Nearest Neighbors”
Monitored (ft/min)
#
Pins
Avg. Driving rate
Pins (ft/min)
Percent of
(%)
B7 1 6.0 6 4.4 37
# Pins Driving rate Surrounding
Monitored
of Surrounding Difference[1]
B8 1 3.3 6 3.8 -12
C9 3 6.7 12 7.1 -6
Steel Pipe 3 5.9 10 4.7 26 [1]: values based on average driving rate of surrounding pins
Three RPPs from batch C9 were installed at the top and middle of the slope face.
The average penetration rate was 6.7 ft/min m/min), which is approximately 6 percent
ge penetration rate of the nearest neighbors (batch A4). Thus, the
average
206 were monitored for penetration and the rates determined for those RPPs
are summarized in Table 4.11. The average penetration rate for all monitored pins was
5.2 ft/min (1.6 m/min) with a standard deviation of 3.2 ft/min (1.0 m/min). If the subset
(2
slower than the avera
penetration rate of RPPs from batch C9 is similar to its nearest neighbors (batch
A4).
Three steel pipes were all installed at the toe of the slope. The average penetration
rate was 5.9 ft/min (1.8 m/min). This rate was approximately 26 percent faster than the
average penetration rate of the nearest neighbors (batch A5).
4.5.4 US36-Stewartsville and US54-Fulton Site
The US36-Stewartsville test site is also composed of a soft surficial layer of lean
clay overly stiff, fat clay with some gravel. This site is approximately 27-feet (8.2 m)
height with 2.2:1 (Horizontal:Vertical) side slope. The slide area at this site was
stabilized using 306 RPPs from batch A6 and all were installed a vertical orientation. Of
that number,
79

Bowders, Loehr and Chen RPP Suitability for Stabilizing Slopes
of RPPs that were driven to refusal (less than full length) is considered separately, the
penetration rate averaged 4.4 ft/min (1.3 min) R to their
full depth was 8.3 ft/m m/min). This aga that ult driving
conditions can reduce the penetration rate by approximately 50 percent.
Table 4.11 Driving Performa of RPPs a S36-Stewar le and US54 ton Site
Stabilized Slope Specimen Installed # Pins Min. Max. Avg. Std Dev
m/ while the rate for
in illustrates
PPs driven
difficin (2.5
nce t U tsvil -Ful
Penetration Rate (ft/min)
(Working Period) Batch length Monitored
US36 Stewartsville A6 8 ft 40 2.7 16.0 8.3 4.1 (4/30/2
ALL[1] 206 1.7 16.9 5.2 3.2 002~5/7/2002) < 8 ft 166 1.7 16.9 4.4 2.3
US54 Fulton A10 8 ft 143 1.4 27.6 9.6 5.8 (1/10/2003~1/15/2003) < 8 ft 223 0.6 14.5 4.7 2.5
Timber
[1]: ave
ALL 366 0.6 27.6 6.6 4.8
Pile < 8 ft 3 3.6 9.6 6.4 3.0
rage results for all monitored pins.
The US54-Fulton site is approximately 43 feet (13.1 m) in height with 3.2: 1
(Horizontal:Vertical) side slope. This slope consists of a 2 feet to 7 feet thick surficial
soft to stiff lean gravelly clay overlying very stiff to hard fat clay with sand and gravel.
Penetration rates were monitored for 366 of the 400 RPPs installed at the site. The
average penetration rate for all RPPs was 6.6 ft/min (2.0 m/min) with a standard
deviation of 4.8 ft/min (1.5 m/min). Again, considering the subset of RPPs that were
driven to refusal (less than full length), the penetration rate averaged 4.7 ft/min (1.4
m/min) while the rate for RPPs driven to their full depth was 9.6 ft/min (2.9 m/min). This
shows that the penetration rates were reduced when stiff layer were encountered. Three
timber piles, similar to those used at the I70-Emma Slide 3, were installed in the top,
80

Bowders, Loehr and Chen RPP Suitability for Stabilizing Slopes
middle, and bottom of the slope at the US54-Fulton site. The average penetration rate was
6.4 ft/min (1.95 m/min), which is similar to the averaged driving rate of RPPs from batch
A10 (6.6 ft/min) at the same site.
It can be concluded that the difficult driving conditions can reduce the average
ull
ngth from these sev slopes The dri ng data confi there is
lit ee ch n str o s of
the RPPs installed, at least for the range of materials considered.
4.5.5 Installation erfo fo emonstrated Sites
for all sev es a e pin ne ra strib from
top of slope to the toe of slope were considered and analyzed. Figure 4.24 shows the
calculation of subdividing the RPPs as four groups from the top to the bottom of the
ope. The results of these analyses are shown in Table 4.12
penetration rate as much as a factor of two, when compared to the pins driven their f
le en . vi rms the observation that
tle correlation betw n the a ievable penetration rates a d the ength r stiffnes
P rmance r all D
The drivability en slop nd th s pe tration te di ution
sl
Group 2
Top of Slope
Group 1
Group 3
Group 4
Toe of Slope
Figure 4.24 Penetration rate analysis by subdividing RPPs as four groups from top to bottom of slope.
81

Bowders, Loehr and Chen RPP Suitability for Stabilizing Slopes
Table 4.12 shows that the average penetration rate decreases from top of slope to
the toe of slope, except the I435-Holmes site and the US54-Fulton site. The average
penetration rates were similar from top of slope to the toe of slope at I435-Holmes site.
This in
oils on the top of slope
usually e slide failure has
happen
Stabilized Slope Group 1(#[1]) Group 2 (#) Group 3 (#) Group 4 (#)
dicates that the soil conditions are similar from top of slope to the toe of slope.
The RPPs may encounter the layer of sand and gravel at the top of slope, and shows that
the smallest penetration rate occurred at the top of slope (Table 4.12) at the I435-Holmes
site. Observations from the field installation at the US54-Fulton site show that RPPs were
much easier driven on the top of slope than toe of slope. The s
push and compact the soils at the toe of slope, especially th
ed. It usually takes more time to drive RPPs at the toe of slope.
Table 4.12 Results of Subdivided Groups for RPPs at Seven Slide Sites
Average Penetration Rate (ft/min)
I70 Emma Slide1 6.4 (28) 5.0 (29) 4.7 (29) 3.4 (20)
I70 Emma Slide2 5.0 (37) 4.5 (40) 3.4 (41) 2.7 (32)
I70 Emma Slide3 10.6 (53) 6.1 (51) 4.3 (52) 3.6 (42)
I435 Wornall 6.2 (79) 5.7 (122) 5.5 (125) 4.7 (168)
I435 Holmes 4.8 (59) 4.1 (68) 5.5 (53) 6.0 (38)
US36 Stewartsville 6.8 (57) 4.2 (49) 4.7 (48) 4.6 (51)
US54 Fulton 4.8 (68) 6.2 (69) 10.1 (88) 5.6 (152) [1]: number of RPPs monitored
Figure 4.25 shows the average penetration rates for the seven stabilized slopes.
ne).
The average penetration rate (y-axis) increased with time. Note that, the I435-Wornall
site (batch A5), the I70-Emma slide3 and the US54-Fulton site (batch A10) have the
The slopes are listed in chronological order (from the first project to the most recent o
82

Bowders, Loehr and Chen RPP Suitability for Stabilizing Slopes
highest penetration rates (exceeding 6.0 ft/min (1.8 m/min)). These RPPs were installed
using the percussion hammer from the Ingersoll Rand CM150 (Figure 3.14) and Ingersoll
Rand CM350 (Figure 3.13), track mounted drilling rig. Furthermore, the strength and
stiffness of the RPPs decreased as installation progressed in the chronological order.
Therefore, it might indicate that with this type of equipment makes the pins installation
more efficiency. A possible explanation is that the installation crew has improved their
skill in installation rather than because of using different materials.
7.0
9.0
10.0
te (f
t/min
)
1.0
2.0
3.0
0
8.0
era
tion
R
I70 ESlide1
I435 W
A 4
I70 ma
Slide2 1
I435 al
A 5
I435
Steel
US36 wart
A 6
I70
Slide3
US54 ultonA 10
(date)/ 99 D 01Oc an/ 03r/ 02Oc
6.0a
5.
4.0
Pen
etra
ge Novt/ 99 ec/ 01 Ap JJan/ 03Dec/t/ 01
Av
0.0mma Em
A 1 A
ornall Worn Holmes Ste
Pipe
. Emma F
A 10
Figure 4.25 Average penetration rate versus installation sequence of seven slopes.
83

Bowders, Loehr and Chen RPP Suitability for Stabilizing Slopes
CHAPTER 5: DRAFT SPECIFICATION FOR RPPs TO BE USED IN THE
SLOPE STABILIZATION
5.1 The Need for a Specification
A material and engineering property specification for RPP’s used in the slope
stabilization application is necessary for several reasons. First, Departments of
Transportation (DOT’s) and other agencies rely on specifications to ensure proper
materials are used on their applications. Second, in slope stabilization applications,
minimum engineering properties of the RPPs are required to facilitate a satisfactory
design. Finally, there are numerous manufacturers of RPP materials and each use slightly
different constituents and manufacturing processes, leading to RPPs with a range of
engineering and material properties.
In this development program, we obtained RPP materials from multiple
manufacturers. The manufacturers provided several types of RPPs or at least their
product changed over time and multiple materials were obtained from different
manufacturing periods. In addition, field performance data and slope stability design
requirements were collected and assessed in order to establish a draft specification for the
RPPs to be used in slope stabilization.
5.2 Draft Specification
A draft specification (Table 5.1) for RPPs to be used in the stabilization of slopes
has been developed based upon the results of the laboratory testing, field-testing and
analysis of the field performance at seven demonstration sites. The draft is presented as a
provisional specification prepared in the format of the American Association of Highway
and Transportation Officials (AASHTO) in Appendix E. The draft specification is based
84

Bowders, Loehr and Chen RPP Suitability for Stabilizing Slopes
on t ain
measured at a strain rate of 0.00003 in/in/min) and design flexural strength (≥ 1200 psi at
less than or equal to two percent center strain easured at a crosshead motion rate of 0.02
in/in/min).
Table 5.1 Draft Specification For RPPs to Be Used in Slope Stabilization Applications
Property Minimum Requirements
A.
he design compressive strength (≥ 1500 psi at less than or equal to five percent str
m
cσ
c
cσ
fσ
f σ
≥ 1500 psi, axial strain ≤ five percent, strain rate = 0.00003 in/in/min, or
Alt A1. Develop expression for the strain rate effects and correct measured
Strain Rate (in/in/min) No. of Compression Tests
strength to the design strain rate, or
0.03 2
0.003 2
Uniaxial
Strength, σ (ASTM D6108)
0.0003 2
Compression
Alt A2. ≥ 3750 psi, axial strain ≤ five percent, strain rate = 0.03 in/in/min.
B. ≥ 1200 psi, center strain ≤ two percent, rate of crosshead motion = 0.02 in/min, or
Flexural σ
(ASTM D6109) f
C. Polymeric Constituent > 60% of mass of product, or Durability -
Exposure exposure.
extreme fiber stress n
Environmental Alt C1. Less than 10% reduction in compressive strength after 100 days
D. No bending failure during 100 days under a constant load that produces an ot less than 50% of the design compressive stress, or Durability -
Strength,Alt B1. ≥ 2000 psi, center strain ≤ two percent, rate of crosshead motion = 1.9 in/min.
Creep Alt D1. Testing and Arrhenius modeling showing that the RPPs do not fail y. during the desired design life for the facilit
As shown in Figure 4.12, the measured strengths of RPPs are greatly influenced
by the strain rate. We have assumed our field strain rate to be on the order of 0.00003
in/in/min (0.00003 mm/mm/min), which correlates with a compressive failure of a
standard 3.5-in. x 3.5-in. (90-mm x 90-mm) RPP under a continuous rate of deformation
for one week. The standard strain rate for the ASTM D6108 compression test is 0.03
85

Bowders, Loehr and Chen RPP Suitability for Stabilizing Slopes
in/in/min (0.03 mm/mm/min). As shown in Figure 4.12, the measured compressive
strengths of the RPP decreases as the strain rate used in the test decreases. The rate of
decrease in strength is a function of the material type. For the RPPs tested in this
program, the average decrease in strength was about 20 percent per log cycle decrease in
in
rat n/in/min (0.03 mm/mm/m e strength of 600 psi
(4.1 MPa) if tes at
dependence on a
fu testing strain ca
The “design” compressive (1500 psi) and flexural (1200 psi) strengths presented
in Table 5.1, represe the required m mechanical properties for RPPs to be used
in stabilization o T
are ed he
Id l R P en
practical perspective testing at this strain rate requires about one week per compression
s h es for
qualifying an RP s
strain ehav
2) a compressive strength of 3750 psi (25.9 MPa) or better when tested at the ASTM
D6108
the strain rate, i.e., an RPP with a compressive strength of 1000 psi (6.9 MPa) at a stra
e of 0.03 i in) will show a compressiv
ted a strain rate of 0.0003 in/in/min (0.0003 m/mm/min). Due to the
strain rate, it is imperative to make the required minimum strength
nction of the rate in the draft specifi tion.
nt minimu
f slopes. he values are used in design of the stabilized field slopes and
determin
eally, al P
at t field strain rate of 0.00003 in/in/min (0.00003 mm/mm/min).
specim s should be tested at the field strain rate; however, from a
pecimen whic is not practical for production facilities. Therefore, alternativ
P material include: (Alt A1) - establishing a compressive strength versu
rate b ior and estimating the compressive strength at the field strain rate, or (Alt
A
strain rate of 0.03 in/in/min (0.03 mm/mm/min). The latter value represents the
increase in strength realized by the 3-order of magnitude increase in strain rate, i.e.,
above the field strain rate of 0.00003 in/in/min (0.00003 mm/mm/min), using a
reasonable upper-bound for strain rate effects. Because Alt. A2 uses an upper-bound most
86

Bowders, Loehr and Chen RPP Suitability for Stabilizing Slopes
manufacturers will find that they can meet the specification more easily by establishing
strain rate effects for their specific products rather than using the default relation assumed
for Alt. A2.
The second part of the specification for mechanical properties is the required
minimum flexural strength of 1200 psi (8.3 MPa) at less than or equal to two percent
center strain, when tested in four-point flexure using a crosshead displacement rate of
0.02 in/min (0.51 mm/min) (results in a strain rate of 0.00003 in/in/min, the assumed
field rate). An alternate requirement is available (Alt B1) if the ASTM D6109 crosshead
deformation rate of 1.9 in/min (48.3 mm/min) is used. In Alt. B, the required flexural
strength is 2000 psi (13.8 MPa) at less than or equal to two percent center strain. Again,
the increase in required strength for the higher deformation rate is due to the effect that
loading rate has on the resulting strength of the RPP.
In addition to mechanical properties, durability criteria must be included in the
specification. Recycled plastic materials can have significant variability with respect to
constituents and manufacturing processes. The durability of the finished product will
influence its suitability for application to slope stabilizations. Two durability facets,
environmental degradation and creep, must be considered. The proposed durability
criteria are presented in the draft specification in Table 5.1. The polymeric content
should be greater than 60 percent of the mass to reduce the effect of environmental
exposures (Loehr et al., 2000a). The RPP should not fail (break) under a cantilever
bending load that generates an extreme fiber stress of at least 50 percent of the design
compressive strength when subjected to the load for 100 days. Exposure testing and
Arrhenius modeling are offered as alternate means to qualify a material.
87
Bowders, Loehr and Chen RPP Suitability for Stabilizing Slopes
It should be noted that in any slope stabilization design using RPPs, the designer
can vary the stabilization scheme through variation of the number, location, strength and
stiffness of the RPPs. The designer can also change the parameters by changing the factor
of safety desired for the stabilized slope. Thus, the designer has numerous options for
stabilization schemes and as such the required engineering properties of the RPPs could
vary considerably.
88

Bowders, Loehr and Chen RPP Suitability for Stabilizing Slopes
CHAPTER 6: CONCLUSIONS AND RECOMMENDATIONS
6.1 Conclusions
The use of recycled plastic pins (RPPs) to stabilize earthen slopes is a promising
technology. Seven successful demonstration projects have been completed. One obstacle
to widespread use of RPP technology remains the absence of a standard specification for
the engineering properties of the RPPs to be used in stabilization of slopes. This project
was undertaken to develop a database on the engineering properties of RPPs from various
manufacturers and to combine that knowledge with the field installation and performance
information available from the field demonstrations in order to develop a draft
specification for RPPs to be used to stabilize slopes.
The following results were realized during the course of work performed to
develop the specification:
• Compressive strengths of RPPs ranged from 1600 psi to 3000 psi (11 MPa to 21
MPa) with no cross-sectional area correction and tested at a nominal strain rate of
0.006 in/in/min (0.006 mm/mm/min).
The average compressive strengths of the extruded RPP products (2200
psi) are approximately 20 percent lower than the compressive strength of
the compression-molded products (2800 psi).
Manufacturers of extruded products can modify their processes and
constituent mixtures to produce materials with comparable strengths to the
compression molded products.
89

Bowders, Loehr and Chen RPP Suitability for Stabilizing Slopes
There is no discernable change in the average compressive strength
between specimens in the virgin condition (before installation) and those
in the disturbed condition (after installation) indicating that the installation
process does not have a deleterious effect on the compressive strength of
RPPs.
There was close agreement in the compressive strengths for both failure
criteria. This indicates that using the strength at five percent strain without
correcting the cross-sectional area provides a reasonable value for the peak
strength.
There was little correlation between the compressive strengths and unit
C
Pa). The compression moduli of the extruded products (90 ksi)
w
p
secant modulus of 90 ksi (621 MPa) while
• Strain ra ngth of the RPP products.
weights of the RPPs.
• ompression moduli determined at one percent strain ranged from 80 ksi to 190 ksi
(552 MPa to 1310 M
as generally on the order of one half that determined for the compression-molded
roducts (180 ksi).
The unreinforced material had a
the reinforced material had a secant modulus of 140 ksi (965 MPa).
Obviously, the reinforcing fibers significantly stiffened the material.
te has a significant impact on the measured stre
For each order of magnitude decrease in strain rate, the measured
compressive strength was found to decrease about 20 percent.
90

Bowders, Loehr and Chen RPP Suitability for Stabilizing Slopes
A relationship was developed to allow testing at any strain rate and
subsequent calculation of the compressive strength for any desired strain
rate.
strengths for specimens loaded to failure or two percent center strain • Flexural
ranged from 1300 psi to 3600 psi (9 MPa to 25 MPa) under a nominal deformation
rate 0
Extruded members showed continually increasing stress with increasing
members ruptured at approximately two percent
•
• ried from 90 ksi to 250 ksi (621 MPa to 1724 MPa) at one
perce
the excep
• Flexural
n
t 40 percent
has not reached failure after more than five years.
.2 in/min (5.1 mm/min).
There is significant variability, a factor of 2.8, in the flexural strength
among the products tested.
deflection/strain without experiencing rupture of the member. The
compression molded
strain.
The flexural capacity was limited to the maximum flexural strength or the capacity
achieved at 2 percent or less center strain.
Flexural moduli va
nt strain, similar to the values observed in the uniaxial compression tests with
tion of the fiberglass-reinforced material.
creep tests revealed RPPs to be creep sensitive.
Creep tests were highly dependent on the temperature and stress level i
the RPP.
The laboratory flexural creep test, at 21°C and a stress ratio a
91

Bowders, Loehr and Chen RPP Suitability for Stabilizing Slopes
Arrhenius modeling showed that under current field stress levels, the RPPs
would not reach creep failure for 45 years to 2000 years.
age RP• The aver P penetration rate during field installation ranged from 4.0 ft/min to
of the RPPs. Penetration rates are not significantly
6.6 ft/min (1.2 ft/min to 2.0 ft/min) for the seven stabilized slopes.
There is little correlation between the achievable penetration rates and the
strength or stiffness
affected by the strength and stiffness of the pins, at least for the range of
materials considered.
The average penetration rate increased with each successive installation
indicating that the installation crew improved their skill with each job and
the RPP material type was not the controlling factor.
92

Bowders, Loehr and Chen RPP Suitability for Stabilizing Slopes
• Based
stabilizat
Pr
A.
on the findings from this work, a draft specification for RPPs to be used in
ion of slopes is as follows:
Table 6.1 Draft Specification for RPPs to Be Used in Slope Stabilization Applications
operty Minimum Requirements
c
strength to the design strain rate, or
0.03 2
0)
σ
cσ
c
f
fσ (ASTM D6109) Alt B1. fσ
≥ 1500 psi, axial strain ≤ five percent, strain rate = 0.00003 in/in/min, or
Alt A1. Develop expression for the strain rate effects and correct measured
Strain Rate (in/in/min) No. of Compression Tests
.003 2
0.0003 2
Uniaxial Compression Strength,
(ASTM D6108
Alt A2. σ ≥ ≤ 3750 psi, axial strain five percent, strain rate = 0.03 in/in/min.
B. σ ≥ 1200 psi, center strain ≤ two percent, rate of crosshead motion = 0.02 in/min, or
Flexural Strength,
≥ 2000 psi, center strain ≤ two percent, rate of crosshead motion = 1.9 in/min. C. Polymeric Constituent > 60% of mass of product, or Durability -
Environmental Exposure
Alt C1. Less than 10% reduction in compressive strength after 100 days exposure.
D. No bending failure during 100 days under a constant load that produces an extreme fiber stress not less than 50% of the design compressive stress, or Durability -
Creep Alt D1. Testing and Arrhenius modeling showing that the RPPs do not fail during the desired design life for the facility.
6.2 Recommendations
The following recommendations are based on the findings and results of the work
reported herein:
! Database Development
Additional materials and tests results should be added to the materials properties
database in order to strengthen the conclusions used to establish the draft specification.
93

Bowders, Loehr and Chen RPP Suitability for Stabilizing Slopes
• Additional uniaxial compressive tests at different strain rates should be
performed to provide more information for a better trend line for strain rate
ditional RPPs from variou tested and installed in
the f in
perfo
ermine how th es strength,
lus, nd creep) cha en RPPs are subjected to various potentially
detrimental environment
! Specifica
eve ran
confi ,
modeling.
that w
se d in
the RPPs in the field under different conditions, i.e., seasonal. These data will
s identification of the appropriate stress levels to avoid
effects on compressive strength.
• Ad s manufacturers should be
ield order to provide a wide range of the material properties and field
rmance of RPPs.
• Det e engineering properti (compressive and flexural
modu a nge wh
s.
tion Development
• D lop ges of required flexural strength for RPPs in various stabilization
gurations by performing parametric analyses using slope stability
• Use reliability analyses to determine the lowest allowable strength for RPPs
ill keep specific slopes stable.
• U the results of field monitoring to assess the “working” loads mobilize
permit more rigorou
creep problems in the future.
94

Bowders, Loehr and Chen RPP Suitability for Stabilizing Slopes
Appendix A
r Uniaxial Compression Tests
Test Results fo
95

Bowders, Loehr and Chen RPP Suitability for Stabilizing Slopes
Table A.1. Summary Results of Uniaxial Co pression Tests for RPPs from Batches A1 to A4 At 5 % strain Corrected Cross-sectional area
Specimen Batch
Strain rate (in/in/min)
Test time (min)
Strength (psi)
Secant Modulus (E1%, ksi)
Secant
5%, ksi)
Strength (psi)
Strain at Peak (%)
Secant Modulus
(E1%, ksi)
Secant Modulus (E5%, ksi)
m
Modulus (E
A1 - - - - 2916 129.1 53.5 - - - - - - - - A1 - - - - 2819 144.6 54.6 - - - - - - - - A1 - - - - 2749 133.5 53.1 - - - - - - - - A1 - - - - 2701 140.6 53.3 - - - - - - - - A1 - - - - 2475 129.8 - - - - - - - - - - A1 - - - - 2831 118.7 57.2 - - - - - - - - A1 - - - - 2902 132.2 56.4 - - - - - - - - A1 - - - - 2877 - - - - - - - - A1 - - - - 2778 140.8 58.4 - - - - - - - - A1 - - - - - - A2 0.004 25 2891 186.0 50.1 - - - - - - - -
129.0 57.4
- - 2791 138.5 65.4 - - - -
A2 0.004 28 3005 193.6 59.1 - - - - - - - - A2 0.004 28 2711 186.0 55.6 - - - - - - - - A2 0.007 17 3054 178.4 53.9 - - - - - - - - A2 0.003 29 2960 166.9 53.5 - - - - - - - - A2 0.007 21 3013 190.3 55.5 - - - - - - - - A2 0.005 22 3005 190.0 54.9 - - - - - - - - A3 0.005 25 2802 176.5 58.0 - - - - - - - - A3 0.007 15 2685 160.0 53.4 - - - - - - - - A3 0.005 26 2786 172.0 61.7 - - - - - - - - A3 0.005 21 2837 107.7 53.2 - - - - - - - - A3 0.006 22 2926 186.0 55.6 - - - - - - - - A3 0.006 20 2910 183.2 59.2 - - - - - - - - A4 0.006 18 3012 174.0 54.1 2855 3.9 172.1 50.1 A4 0.003 40 2866 225.3 58.7 2713 3.6 224.0 55.1 A4 0.003 31 2762 167.4 55.4 2594 4.1 166.1 51.9 A4 0.005 21 2384 181.5 50.0 2272 3.6 180.3 47.0 A4 0.005 23 2384 188.1 49.1 2264 3.6 186.6 46.1 A4 0.006 17 2320 181.6 47.5 2216 3.6 180.5 44.7 A4 0.0008 125 2546 156.8 46.4 2396 3.9 167.0 46.1 A4 0.015 7 3120 182.7 52.0 2976 4.0 122.6 37.4 A4 0.019 4 2537 190.1 48.0 2428 3.3 189.5 45.1 A4 0.0005 172 1566 119.6 - - 1561 2.3 118.4 - -
96
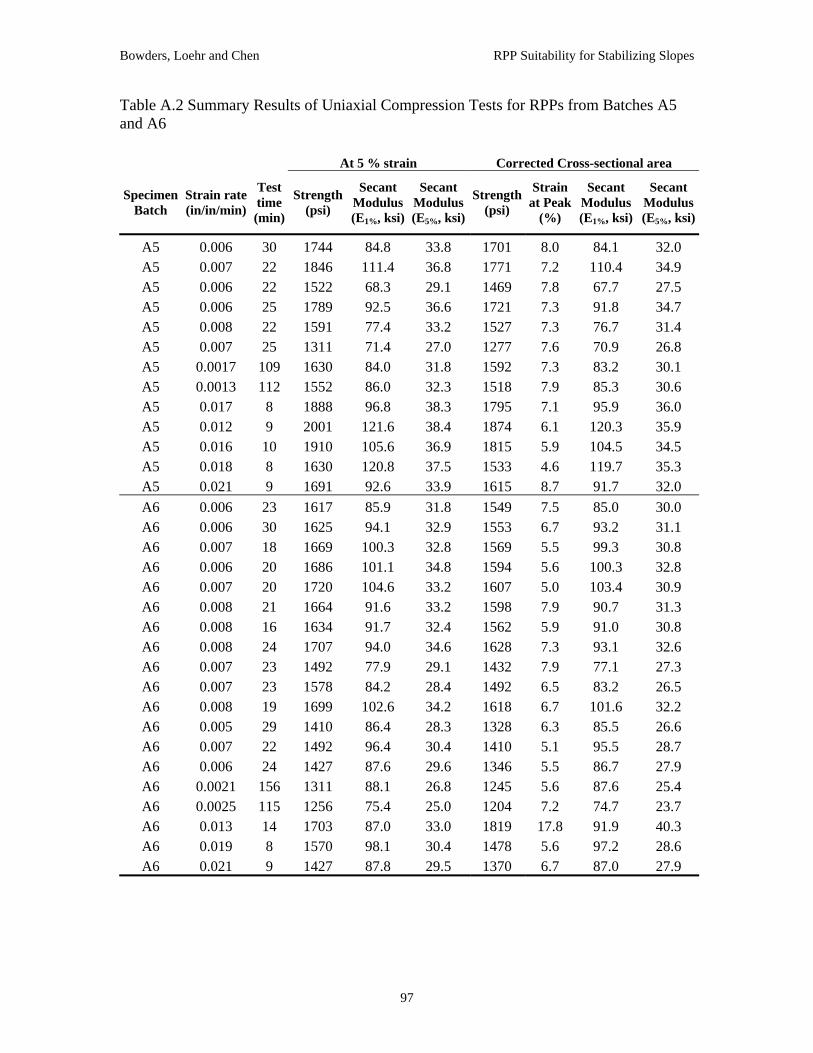
Bowders, Loehr and Chen RPP Suitability for Stabilizing Slopes
Table A.2 Summary Results of Uniaxial Compression Tests for RPPs from Batches A5 and A6
at(E )
)
At 5 % strain Corrected Cross-sectional area
Specimen Batch
Strain rate (in/in/min)
Test time (min)
Strength (psi)
Secant Modulus (E1%, ksi)
Secant Modulus (E5%, ksi)
Strength (psi)
Strain Peak (%)
Secant Modulus
1%, ksi
SecantModulus(E5%, ksi
A5 0 1 8.0 8 0 .006 30 1744 84.8 33.8 701 4.1 32.A5 0 1 7.2 1 9
0 1 7.8 6 5 0 1 7.3 9 7 0 33.2 1 7.3 7 4 0 1 7.6 7 8
0. 7 1592 7.3 83.2 1 0. 3 1518 7.9 85.3 6 0 1 7.1 9 0 0 1 6.1 1 9
1 5.9 1 5 1 4.6 1 3 1 8.7 9 0 1 7.5 8 0
.007 22 1846 111.4 36.8 771 10.4 34.A5 .006 22 1522 68.3 29.1 469 7.7 27.A5 .006 25 1789 92.5 36.6 721 1.8 34.A5 .008 22 1591 77.4 527 6.7 31.A5 .007 25 1311 71.4 27.0 277 0.9 26.A5 001 109 1630 84.0 31.8 30.A5 001 112 1552 86.0 32.3 30.A5 .017 8 1888 96.8 38.3 795 5.9 36.A5 .012 9 2001 121.6 38.4 874 20.3 35.A5 0.016 10 1910 105.6 36.9 815 04.5 34.A5 0.018 8 1630 120.8 37.5 533 19.7 35.A5 0.021 9 1691 92.6 33.9 615 1.7 32.A6 0.006 23 1617 85.9 31.8 549 5.0 30.A6 0.006 30 1625 94.1 32.9 1 6.7 9 1
1 5.5 99.3 8 1 5.6 1 8 1 5.0 1 9 1 7.9 9 3 1 5.9 9 8 1 7.3 9 6 1 7.9 7 3 1 6.5 8 5
1
553 3.2 31.A6 0.007 18 1669 100.3 32.8 569 30.A6 0.006 20 1686 101.1 34.8 594 00.3 32.A6 0.007 20 1720 104.6 33.2 607 03.4 30.A6 0.008 21 1664 91.6 33.2 598 0.7 31.A6 0.008 16 1634 91.7 32.4 562 1.0 30.A6 0.008 24 1707 94.0 34.6 628 3.1 32.A6 0.007 23 1492 77.9 29.1 432 7.1 27.A6 0.007 23 1578 84.2 28.4 492 3.2 26.A6 0.008 19 1699 102.6 34.2 1618 6.7 101.6 32.2A6 0.005 29 1410 86.4 28.3 1328 6.3 85.5 26.6A6 0.007 22 1492 96.4 30.4 1410 5.1 95.5 28.7A6 0.006 24 1427 87.6 29.6 1346 5.5 86.7 27.9A6 0.0021 156 1311 88.1 26.8 1245 5.6 87.6 25.4A6 0.0025 115 1256 75.4 25.0 1204 7.2 74.7 23.7A6 0.013 14 1703 87.0 33.0 1819 7.8 91.9 40.3A6 0.019 8 1570 98.1 30.4 1478 5.6 97.2 28.6A6 0.021 9 1427 87.8 29.5 1370 6.7 87.0 27.9
97

Bowders, Loehr and Chen RPP Suitability for Stabilizing Slopes
Table A.3 Summary Results of Uniaxial Compression Tests for RPPs from Batches A10and A11
At 5 % strain Corrected Cross-sectional area
train rate Test time Strengt Modulus
(Modulus (
Stre
Specimen Batch
S (in/in/min) (min)
h Secant Secant
(psi) E1%, ksi) E5%, ksi)
ngth Strain at Secant Secan
(psi) Peak Modulus (
t Modulus ((%) E1%, ksi) E5%, ksi)
A10 0.006 29 2393 106.7 5 70.0 2295 6.1 106.0 4 .4
A10 0.005 28 2291 129.3 46.2 2193 6.5 128.3 43.8 A10 0.006 33 2274 107.1 44.5 2233 7.1 106.5 42.6 A10 0.007 27 2278 105.2 45.5 2268 7.3 104.6 43.5 A10 0.008 26 2299 107.1 45.7 2250 7.0 106.4 43.5 A10 0.007 25 2066 125.7 42.2 1967 6.1 124.7 40.0 A10 0.007 24 2180 107.1 41.8 2086 6.8 106.2 39.4 A10 0.006 25 2001 97.2 40.4 1984 7.4 96.6 38.6 A10 0.007 25 1936 96.2 39.7 1910 7.3 95.6 38.0 A10 0.007 20 1997 105.7 41.5 1971 7.6 105.2 40.0 A10 0.007 24 2428 126.1 47.6 2316 6.1 125.2 45.2 A10 0.005 28 2254 124.5 45.3 2177 6.4 123.9 43.3 A10 0.006 26 2341 130.6 47.3 2256 5.9 130.0 45.3 A10 0.007 21 2191 113.0 45.0 2124 6.8 112.4 43.0 A10 0.0020 188 1776 92.6 42.1 1686 5.3 91.9 40.3 A10 0.0010 106 1567 99.9 - - 1528 2.9 99.4 - - A10 0.021 6 2438 119.0 49.0 2358 6.8 118.4 46.7 A10 0.021 7 2218 111.9 45.6 2138 8.8 111.2 43.4 A11 0.005 28 2156 127.3 45.3 2053 6.4 126.3 43.0 A11 0.006 27 2405 121.5 48.7 2323 6.4 120.8 46.5 A11 0.007 18 2409 123.3 49.3 2309 5.9 122.7 47.1 A11 0.007 22 2429 109.5 48.1 2338 5.8 108.9 46.0 A11 A11
0.005 0.007
26 20
2278 2025
136.4 109.0
47.5 39.1
2184 1955
5.5 6.1
135.7 108.2
45.4 37.1
A11 0.006 23 1989 103.3 40.4 1895 6.1 102.6 38.4 A11 0.006 23 2319 107.6 47.0 2281 6.4 107.0 45.0 A11 0.006 25 2429 128.6 49.3 2350 6.4 128.0 47.2 A11 0.007 23 2356 126.7 47.9 2259 6.1 125.8 45.6 A11 0.005 26 2364 125.2 49.1 2281 5.9 124.8 47.2 A11 0.006 23 2352 121.8 47.5 2278 6.2 121.2 45.6 A11 0.005 26 2401 131.4 48.9 2293 5.6 130.6 46.6 A11 0.007 20 2295 103.3 47.6 2215 6.1 103.0 45.7 A11 0.006 23 2311 116.7 46.8 2245 6.0 116.2 44.8 A11 0.0005 2 A11 0.0008 164 1985 119.1 39.0 1929 6.2 118.5 37.2 A11 0.019 7 2438 129.5 45.9 2320 5.6 128.5 43.4 A11 0.020 6 2417 130.5 45.0 2305 5.9 129.5 42.6
27 1846 95.7 35.8 1762 4.9 95.0 33.9
A10 0.005 32 2360 127.2 48.0 2256 6.0 126.4 45.8
98

Bowders, Loehr and Chen RPP Suitability for Stabilizing Slopes
Table A.4 Summary Results of Uniaxial Compression Tests for RPPs from Batch A12 and A13
Strain rate
A
rength
t in s al
Specimen (in/in/min) (min)
St
(E ) (E i)
St
5 % straSecant
Modulus
Secant
Modulus
Corr
ren
ected Cro s-section area
Batch
Test time (psi)
1%, ksi 5%, ks
gth S t
(E ) (E i)(psi)
train aPeak (%)
Secant Modulus
1%, ksi
Secant Modulus
5%, ks
A12 0.007 25 2078 98.1 41.8 1997 6.8 97.4 40.0 A12 0.008 22 2078 106.2 42.0 1993 6.2 105.5 40.0 A12 0.008 22 2058 105.2 40.6 1987 6.1 104.5 38.4 A12 0.006 28 2209 126.4 41.4 2098 5.8 125.3 39.1 A12 0.006 27 2217 125.0 44.5 2150 6.4 124.0 42.3 A12 0.006 26 2017 101.9 41.8 1873 5.5 101.0 38.8 A12 0.005 27 2005 107.6 38.7 1924 6.1 106.7 36.5 A12 0.007 23 2017 108.1 38.8 1937 6.1 107.2 36.7 A12 0.0014 107 1478 94.3 30.3 1457 4.1 94.0 28.8 A12 0.0022 97 1711 94.3 34.1 1634 5.3 93.9 32.5 A12 0.022 6 2144 102.9 39.8 2048 5.9 102.1 37.7 A12 0.021 6 2185 121.0 42.4 2076 5.7 120.3 40.3 A13 0.008 24 1680 64.5 35.3 1642 7.8 64.0 33.5 A13 0.007 22 1819 87.3 37.9 1760 7.3 86.7 36.0 A13 0.008 18 1854 103.0 3 33.6 5.7 1774 6.1 102.0 A13 0.007 19 2531 134.0 51.1 2409 5.5 133.1 48.5 A13 0.006 22 2613 98.5 54.6 2512 6.4 98.0 52.2 A13 0.008 18 2482 118.6 48.1 2393 6.7 117.7 45.5 A13 0.008 16 2552 129.1 50.6 2446 5.9 128.3 48.2 A13 0.005 26 2495 129.0 49.1 2402 6.1 128.1 46.6 A13 0.007 19 2478 111.9 48.9 2422 7.0 111.1 46.5 A13 0.006 22 2760 140.0 55.9 2665 6.1 139.3 53.4 A13 0.006 23 2597 132.6 52.2 2524 6.7 131.8 49.8 A13 0.007 19 2707 120.5 53.5 2623 6.7 119.5 50.7 A13 0.007 21 2380 95.7 47.5 2369 7.0 95.3 45.6 A13 0.006 25 2360 90.9 46.0 2352 7.3 90.5 44.1 A13 0.007 20 2393 98.0 46.2 2363 6.9 97.2 43.9 A13 0.0018 120 1960 113.4 38.2 1877 5.0 112.7 36.4 A13 0.0004 200 1846 90.6 37.4 1767 5.3 90.2 35.8 A13 0.018 6 2425 130.9 46.6 2307 5.6 130.0 44.3 A13 0.014 8 2552 125.0 53.1 2468 6.1 124.2 50.7
99

Bowders, Loehr and Chen RPP Suitability for Stabilizing Slopes
Table A.5 Summary Results of Uniaxial Compression Tests for RPPs from Batches B7 and B8 At 5 % strain Corrected Cross-sectional area
train rate Test
Strengt ( )
Secant
( )
StreSpecimen Batch
S (in/in/min) time
(min)
h Secant
(psi) ModulusE1%, ksi
Modulus E5%, ksi
ngth Strain at Secant Seca
(psi) Peak (%) Modulu(E1%, ksi
s )
nt s )
Modulu(E5%, ksi
B7 0.008 51 1956 6 3 6 39.1 8.5 2496 25.9 8.5 4.4
B7 0.007 37 2123 89.5 42.6 2298 16.3 88.8 40.7 B7 0.008 36 2112 65.0 40.0 2417 17.2 64.4 38.1 B7 0.005 48 2055 92.6 42.1 2245 17.8 91.9 40.3 B7 0.005 48 2055 92.6 42.1 2250 17.8 91.8 40.2 B7 0.007 44 2183 98.5 43.3 2404 18.6 97.7 41.4 B7 0.007 44 2139 91.0 43.3 2313 13.4 90.1 41.4 B7 0.007 39 1963 80.2 39.1 2165 14.6 79.5 37.3 B7 0.006 51 2117 92.0 41.2 2341 15.7 91.3 39.8 B7 0.006 44 2147 100.5 43.4 2335 13.4 99.7 41.5 B7 0.006 45 2033 82.7 41.6 2213 14.6 82.2 40.0 B7 0.008 35 2169 91.3 44.2 2362 15.7 90.7 42.4 B7 0.006 46 2055 92.4 41.3 2228 18.6 91.7 40.0 B7 0.006 41 2029 84.8 40.8 2207 18.0 84.1 39.1 B7 0.018 14 2350 110.6 46.3 2446 14.3 109.7 44.1 B7 0.021 12 2219 107.6 43.8 2319 12.3 106.8 42.1 B7 0.0020 105 1662 83.5 32.9 1599 4.9 83.0 31.6 B7 0.0021 58 1445 85.0 31.2 1507 4.3 84.5 30.2 B8 0.006 64 2236 87.4 45.1 2733 25.5 86.7 43.3 B8 0.006 52 2449 93.3 43.0 2897 25.4 92.5 41.1 B8 0.006 43 2451 124.8 50.3 2414 8.2 124.0 48.6 B8 0.005 52 2603 160.0 53.0 2489 4.7 158.1 50.5 B8 0.005 60 2603 155.0 53.5 2476 5.3 153.7 51.0 B8 0.005 43 2231 122.0 43.9 2241 11.0 121.2 42.5 B8 0.006 35 2497 153.0 48.3 2393 5.0 151.8 46.2 B8 0.005 41 2430 133.8 51.0 2328 5.3 132.8
B8 0.0023 87 2077 124.6 41.4 2005 3.3 123.8 39.7 B8 0.0003 237 1825 119.3 - - 1773 3.3 118.5 - - B8 0.019 12 2523 141.9 46.6 2376 5.0 140.1 43.7 B8 0.017 13 2751 149.1 55.4 2635 5.3 148.0 53.0
49.0 B8 B8
0.006 0.005
43 41
2633 2836
157.5 171.2
51.8 56.3
2600 2723
9.9 3.9
156.7170.0
50.3 53.6
B8 0.007 24 2853 181.0 51.4 2764 3.3 179.2 48.7 B8 0.005 44 2417 127.7 47.8 2412 9.9 127.0 46.4 B8 0.006 42 2514 136.0 50.7 2413 5.9 135.0 48.5 B8 0.007 37 2519 144.3 47.1 2407 4.8 143.0 44.8 B8 0.008 35 2231 116.0 45.5 2277 11.7 115.2 43.8
B7 0.006 60 2066 76.2 40.6 2691 27.1 67.6 32.7
Table A.6 Summary Results of Uniaxial Compression Tests for RPPs from Batch C9
100

Bowders, Loehr and Chen RPP Suitability for Stabilizing Slopes
At 5 % strain Corrected Cross-sectional area
train rate Strength Mecant
M Stre Modulus t
M(
Specimen Batch
S(in/in/min) (
Test time min)
Secant S
(psi) (odulus
E1%, ksi) (odulus
E5%, ksi)
ngth Strain at Secant Secan
(psi) Peak (%) (E1%, ksi) odulus
E5%, ksi)
38 70.8 50.2 70.0 48.1 C9 0.008 34 2705 81.1 56.3 3189 22.4 80.3 54.1
54.3 41.0 41.5 44.4
1 46.9 445.1 41.4 42.8 42.5 46.7
1 46.6 443.9 41.3
0 1 3 34.2 0 1 3 33.8
42.3 42.3
C9 0.009 28 2797 92.6 42.1 3212 24.3 91.0 C9 0.006 49 2178 71.4 42.9 2358 18.1 70.9 C9 0.008 45 2169 81.0 43.3 2354 15.7 80.4 C9 0.007 51 2350 92.9 46.5 2490 14.3 92.1 C9 0.007 54 2259 14.9 2429 13.5 113.9 4.8 C9 0.008 40 2290 83.8 47.2 2480 15.6 83.1 C9 0.005 52 2088 71.8 43.1 2287 15.0 71.3 C9 0.006 46 2164 90.3 44.7 2332 13.2 89.7 C9 0.007 43 2164 94.0 44.4 2377 16.1 93.3 C9 0.006 40 2350 86.5 48.9 2622 16.6 85.8 C9 0.005 49 2254 07.9 2395 13.2 107.0 4.6 C9 0.006 47 2246 84.5 46.0 2441 21.3 83.8 C9 0.006 51 2163 84.1 43.2 2315 13.1 83.5 C9 .0020 37 1707 75.8 5.6 1652 5.5 75.3 C9 .0024 57 1694 94.2 5.3 1629 4.2 93.8 C9 0.021 12 2147 91.4 44.1 2293 13.5 90.7 C9 0.022 11 2178 95.4 44.2 2308 14.0 94.7
C9 0.008 2547 3063 25.4
101

Bowders, Loehr and Chen RPP Suitability for Stabilizing Slopes
nd
st R s f r-P lex est
Appe ix B
Te esult or Fou oint F ure T s
102

Bowders, Loehr and Chen RPP Suitability for Stabilizing Slopes
Table B.1. Summary Results of Four-Point F re Tests for RPPs from Manufacturers A
Specimen Batch
Deformation rate (in/min)
Test time (min)
FlexuraStrength at 2%
Strain (psi)
Secant Flexural Modulus (E1%, ksi)
Secant Flexural Modulus (E2%, ksi)
A1 - - - - 2429 117.0 88.5
lexu
l
A1 - - - - 2195 110.8 88.0 A1 - - - - 1594 113.9 Failed A1 - - - - 1531 112.1 Failed A1 - - - - 1387 96.4 Failed A1 - - - - 1471 94.4 Failed A1 - - - - 1462 94.6 Failed A1 - - - - 1533 98.5 Failed A1 - - - - 1407 95.1 Failed A1 - - - - 1299 97.0 Failed A1 - - - - 99.0 Failed A1 - - - - 1368 100.2 Failed A1 - - Failed A4 0.16 12 2275 206.7 Failed
1461
- - 1321 105.8
A4 0.14 14 2561 228.3 Failed A4 0.20 21 2795 204.1 Failed A5 0.07 71 1362 99.7 70.2 A5 0.41 10 1848 72.6 Failed A5 0.26 18 1573 107.0 75.5 A5 0.17 52 1425 105.4 71.0 A5 0.25 36 1504 104.9 73.7 A6 0.13 62 1369 90.2 62.7 A6 0.14 56 1425 107.1 70.4 A6 0.17 44 1241 86.8 64.5 A6 0.12 72 1256 89.4 65.1 A6 0.10 57 1233 78.0 62.0 A6 0.18 38 1475 98.7 71.3 A6 0.17 37 1519 112.3 79.4
A10 0.16 36 1707 131.3 80.8 A10 0.19 33 1539 117.1 74.6 A10 0.20 33 1609 130.8 77.1 A10 0.19 34 1350 80.7 57.1 A10 0.17 33 1716 144.0 84.9 A10 0.19 33 1652 133.3 80.8
103

Bowders, Loehr and Chen RPP Suitability for Stabilizing Slopes
Table B.2 Summary Results of Four-Point Flexure Tests for RPPs from Manufacturers B and C
S Batch rate (in/min)
Test time (min) S
Strain (psi) Modulus (E1%, ksi) Modulus (E2%, ksi)
0
pecimen Deformation Flexural trength at 2% Secant Flexural Secant Flexural
B7 .16 31 1295 78.9 61.7 B7 0
0 0 35 0 0 0 0
.17 38 1530 87.6 66.5 B7 .17 36 1522 86.7 66.5 B7 .19 1438 94.5 72.8 B7 .15 40 1569 97.8 71.7 B7 .19 35 1647 96.0 72.8 B7 .18 38 1535 89.2 67.9 B8 .19 37 3449 233.0 175.0 B8 0
0 0 0
.18 35 3415 240.3 176.9 B8 .16 36 4296 291.0 204.5 B8 .18 34 3520 236.1 167.7 B8 .16 42 3560 228.2 177.0 B8 0.17 38 3295 227.7 170.0 C9 0.13 39 1686 105.9 81.4 C9 0.13 34 1761 100.6 84.8 C9 0.18 37 1678 106.9 81.9 C9 0.19 35 1741 113.7 85.8 C9 0.18 36 1670 107.7 81.1 C9 0.16 40 1654 106.1 81.4 C9 0.16 42 1685 106.3 83.3
104

Bowders, Loehr and Chen RPP Suitability for Stabilizing Slopes
dix C
Tes ults fo exural and Com ve Creep Te
Appen
t Res r Fl Creep pressi sts
105

Bowders, Loehr and Chen RPP Suitability for Stabilizing Slopes
Flexural Creep
0.0
1.0
2.0
3.0
4.0
5.0
6.0
0.0001 0.001 0.01 0.1 1 10 100 1000 10000
Log Time (days)
End
Def
lect
ion
(inch
es)
Temp. @ 68°C (154°F) Temp. @ 80°C (176°F) Ambient Temp. @ 21°C (70°F) Temp. @ 56°C (133°F)
Figure C.1 End deflection versus time response for RPPs loaded with 35-Lb single load under various temperatures.
0.0
0.5
1.0
1.5
2.0
2.5
3.0
3.5
4.0
4.5
5.0
0.0001 0.001 0.01 0.1 1 10 100 1000 10000
Log Time (days)
End
Def
lect
ion
(inch
es)
Ambient Temp. @ 21°C (70°F) Temp. @ 56°C (133°F)Temp. @ 68°C (154°F) Temp. @ 80°C (176°F)
Figure C.2 End deflection versus time response for RPPs loaded with 21-Lb single load under various temperatures.
106

Bowders, Loehr and Chen RPP Suitability for Stabilizing Slopes
Flexural Creep
0.0
1.0
2.0
3.0
4.0
5.0
6.0
0.0001 0.001 0.01 0.1 1 10 100 1000 10000
Log Time (days)
End
Def
lect
ion
(inch
es)
Ambient Temp. @ 21°C (70°F) Temp. @ 56°C (133°F)Temp. @ 68°C (154°F) Temp. @ 80°C (176°F)
Figure C.3 End deflection versus time response for RPPs loaded with five 10-Lb loads under various temperatures.
107

Bowders, Loehr and Chen RPP Suitability for Stabilizing Slopes
Flexural Creep: Arrhenius Modeling for Long-term Bending Behavior
Data for single 35-Lb weight - Time to reach failure (breaking)
Temp (°C)
1/temp (°C-1)
Temp (°K)
1/temp (°K-1)
Time (day)
Time (day)
Avg. Time (day)
1/avg. time (d-1)
ln(1/ avg. t) (d-1) Comment
21 0.0476 294 0.0034 697 697 697 0.0014 -6.547 Not failed (July, 2003)
56 0.0179 329 0.0030 35 108 71.5 0.0140 -4.270 Failed 68 0.0147 341 0.0029 0.375 0.81 0.59 1.6878 0.523 Failed 80 0.0125 353 0.0028 0.75 0.75 0.75 1.3333 0.288 Failed
y = -22330x + 64.384R2 = 0.7295
-5.0
-4.0
-3.0
-2.0
0.0
1.0
2.0
1/500 2/909 2/833 2/769 1/357 1/333 2/6251/Temperature (1/°K)
-1.0
ln (R
eact
ion
Rat
e (1
/t))
Based on average time to failure
Figure C.4 Arrhenius plot for flexural creep test on 2 in.x 2 in.x 24 in. RPPs loaded with a 35-Lb weight at the end of a simple cantilever under various temperatures. ln (1/t) = -22330(1/T) + 64.384
where t = time to reach failure (defined here as breaking).
T = temperature (°K) at which RPP will be in the field (Assumed = 21°C = 294°K).
∴t = 105702 days (290 years) (under the single 35-Lb cantilever load).
108

Bowders, Loehr and Chen RPP Suitability for Stabilizing Slopes
Flexural Creep: Arrhenius Modeling for Long-term Bending Behavior
Data for single 21-Lb weight - Time to reach failure (breaking)
Temp 1/temp Temp 1/temp Time Time Avg. 1/ avg. Ln(1/ avg. t) Comment
21 0.0476 294 0.0034 697 69 97 0.00143 -6.5468 Not failed 3)
(°C) (°C-1) (°K) (°K-1) (day) (day) Ti(da
7 6
me y)
time (d-1) (d-1)
(July, 20056 0.0179 29 30 74 74 74 74 6
41 29 48 9 .5 62 6 53 2 6 1 .5 65 1
3 0.00 5 5 5 0.001 -6.352 Not failed68 0.0147 3 0.00 4 48 0.020 -3.881 Failed80 0.0125 3 0.00 8 1 8 0.117 -2.140 Failed
y = -20418x + 55.801R2 = 0.9937
-7.0
-6.0
-5.0
-4.0
-3.0
-2.0
-1.0
0.0
1/500 2/909 2/833 2/769 1/357 1/333 2/6251/Temperature (1/°K)
ln (R
eact
ion
Rat
e (1
/t))
Based on average time to failure
Figure C.5 Arrhenius plot for flexural creep test on 2 in.x 2 in.x 24 in. RPPs loaded with
a 21-Lb weight at the end of a simple cantilever under various temperatures.
ln (1/t) = -20418(1/T) + 55.801
where t = time to reach failure (defined here as breaking).
T = temperature (°K) at which RPP will be in the field (Assumed = 21°C = 294°K).
∴t = 845750 days (2317 years) (under the single 21-Lb cantilever load).
109

Bowders, Loehr and Chen RPP Suitability for Stabilizing Slopes
Flexural Creep: Arrhenius Modeling for Long-term Bending Behavior
Data for 5 @ 10-Lb weights - Time to reach failure (breaking)
Temp (°C)
1(° (°K
eK y y
g
y
v(d- (
0 29 .00 7 7 7 .0 - N(
/temp C-1)
Temp )
1/t(°
mp -1)
Time )
Tim(da(da
e )
AvTim(da
. e )
1/ a g. time 1)
ln(1/ avg. t) d-1) Comment
21 .0476 4 0 34 69 69 69 0 0143 6.5468 ot failedJuly, 2003)
56 0 32 .00 9 0 .5 .0 -0 34 .00 5 .5 .2 - Failed 0 35 .00 5 .75 75 .3 Failed
.0179 9 0 30 18 20 194 0 0514 5.2704 Failed 68 .0147 1 0 29 2 3 0 8571 1.2528 80 .0125 3 0 28 0.7 0 0. 1 3333 0.2877
y = -27025x + 77.24R2 = 0.9473
-6.0
-5.0
-4.0
-3.0
-2.0
-1.0
0.0
1.0
1/500 2/909 2/833 2/769 1/357 1/333 2/6251/Temperature (1/°K)
ln (R
eact
ion
Rat
e (1
/t))
Based on average time to failure
Figure C.6 Arrhenius plot for flexural creep test on 2 in.x 2 in.x 24 in. RPPs loaded with five 10-Lb loads on a simple cantilever under various temperatures.
ln (1/t) = -27025(1/T) + 77.24
where t = time to reach failure (defined here as breaking).
T = temperature (°K) at which RPP will be in the field (Assumed = 21°C = 294°K).
∴t = 2.38 x10⁶ days (6515 years) (under five 10-Lb evenly distributed loads on
cantilever).
110

Bowders, Loehr and Chen RPP Suitability for Stabilizing Slopes
Compressive Creep
0.00
0.02
0.04
0.06
0.16
0 50 100 150 200 250 300 350 400Time (days)
Def
lect
ion
(inch
es)
1150
1170
1190
1210
0
0
129
1310
1330
Loa
d in
Spr
in
Tie up nuts
Sample #1
0.18
0.08
0.10
0.12
0.14
123
125
1270 bs)
0
g (l
DeflectionLoad
Figure C.7 Deflection versus time of the RPPs from batch A6 under constant axial stress (Sample #1).
0.02
0.04
0.10
0.12
0.14
0.16
0.18
0 50 100 150 200 250 300 350 400
Time (day)
Def
lect
ion
(inch
es)
1150
1170
1190
1210
1250
1270
1290
1310
1330
lbs)
DeformationLoad
Sample #2
0.06
0.08 1230
Loa
d in
Spr
ing
(
Tie up nuts
0.00
Figure C.8 Deflection versus time of the RPPs from batch A6 under constant axial stress (Sample #2).
111

Bowders, Loehr and Chen RPP Suitability for Stabilizing Slopes
Compressive Creep
0.00
0.02
0.04
0.06
0.08
0.10
0.12
0.14
0.16
0.18
0 50 100 150 200 250 300 350 400Time (day)
Def
lect
ion
(inch
es)
1150
1170
1190
1210
1230
1250
1270
1290
1310
1330
Loa
d in
Spr
ing
(lbs)
DeformationLoad
Tie up nuts
Sample #4
Figure C.9 Deflection versus time of the RPPs from batch C9 under constant axial stress (Sample #4).
0.00
0.02
0.04
0.06
0.08
0.10
0.12
0.14
0.16
0.18
0 50 100 150 200 250 300 350 400Time (day)
Def
lect
ion
(inch
es)
1150
1170
1190
1210
1230
1250
1270
1290
1310
1330
Loa
d in
Spr
ing
(lbs)Deformation
Load
Tie up nuts
Sample #5
Figure C.10 Deflection versus time of the RPPs from batch A3 under constant axial stress (Sample #5).
112

Bowders, Loehr and Chen RPP Suitability for Stabilizing Slopes
Compressive Creep
0.00
0.02
0.04
0.06
0.08
0.10
0.12
0.14
0.16
0.18
0 50 100 150 200 250 300 350 400Time (days)
Def
lect
ion
(inch
es)
1150
1170
1190
1210
1230
1250
1270
1290
1310
1330
Loa
d in
Spr
ing
(lbs)
DeformationLoad
Tie up nuts
Sample #6
Figure C.11 Deflection versus time of the RPPs from batch A3 under constant axial stress(Sample #6).
113

Bowders, Loehr and Chen RPP Suitability for Stabilizing Slopes
Appendix D
RPP Penetration Rate Frequency Distribution for Field Installations
114

Bowders, Loehr and Chen RPP Suitability for Stabilizing Slopes
0
1
2
3
4
5
6
7
8
9
10
0.5 2.0 3.5 5 8.0 9.5 11.0Avg. Penetration Rate (ft/min)
Freq
uenc
y of
Occ
urre
nce
(num
bers
)Batch A1
I70-Emma Slide 1
5.0 6.
Figure D.1 Penetration rate frequency distribution for RPPs installed at the I70-Emma slide 1.
0
2
4
6
8
10
12
14
16
18
20
0.5 2.0 3.5 5.0 6.5 8.0 9.5
Avg. Penetration Rate (ft/min)
Freq
uenc
y of
Occ
urre
nce
(num
bers
)
Batch A1
I70-Emma Slide 2
Figure D.2 Penetration rate frequency distribution for RPPs installed at the I70-Emma slide 2.
115

Bowders, Loehr and Chen RPP Suitability for Stabilizing Slopes
0
2
4
6
8
10
12
14
16
18
0.5 2.0 3.5 5.0 6.5 8.0 9.5 11.0 12.5 14.0 15.5 17.0Avg. Penetration Rate (ft/min)
Freq
uenc
y of
Occ
urre
nce
(num
bers
)Batch A10
I70-Emma Slide 3
Figure D.3 Penetration rate frequency distribution for RPPs installed at the I70-Emma slide 3.
0
5
10
15
20
25
30
35
0.5 2.0 3.5 5.0 6.5 8.0 9.5 11.0 12.5 14.0
Avg. Penetration Rate (ft/min)
Freq
uenc
y of
Occ
urre
nce
(num
bers
)
Steel pipeBatch A5
I435-Holmes Site
Figure D.4 Penetration rate frequency distribution for RPPs installed at the I435-Holmes site.
116

Bowders, Loehr and Chen RPP Suitability for Stabilizing Slopes
0
5
10
15
20
25
30
0.5 2.0 3.5 5.0 6.5 8.0 9.5 11.0 12.5 14.0 15.5 17.0Avg. Penetration Rate (ft/min)
Freq
uenc
y of
Occ
urre
nce
(num
bers
)Batch A6
US36-Stewartsville
Figure D.5 Penetration rate frequency distribution for RPPs installed at US36-Stewartsville site.
0
10
20
30
40
50
60
70
1.0 4.0 7.0 10.0 13.0 16.0 19.0 22.0 25.0 28.0Avg. Penetration Rate (ft/min)
Freq
uenc
y of
Occ
urre
nce
(num
bers
)
Batch A10
US54-Fulton
Figure D.6 Penetration rate frequency distribution for RPPs installed at US54-Fulton site.
117

Bowders, Loehr and Chen RPP Suitability for Stabilizing Slopes
Appendix E
Draft AASHTO Provisional Specification for Recycled Plastic Pins Used to Stabilize Slopes
118

Bowders, Loehr and Chen RPP Suitability for Stabilizing Slopes
Standard Specification for Recycled Plastic Pins Used to Stabilize Slopes AASHTO Designation: MP ##-## 1. SCOPE
1.1 This specification covers recycled plastic lumber produced from industrial by
products and r member units for stabilization
1.2 This specification provides minimum engineering properties for the recycled
plastic members to be considered for use in slope stabilization. Also provided are the testing protocols to be used to determine the engineering properties of candidate recycled plastic members. Alternative methods are provided for qualifying the recycled plastic members.
2. REFERENCED DOCUMENTS
2.1 ASTM Standards: o ASTM D6108 (1997a), “Standard Test Method for Compressive Properties of
Plastic Lumber and Shapes,” Section 8, Vol. 8.03. o ASTM D6109 (1997b), “Standard Test Method for Flexural Properties of
Unreinforced and Reinforced Plastic Lumber,” Section 8, Vol. 8.03. o ASTM D6111 (1997c), “Standard Test Methods for Bulk Density and Specific
Gravity of Plastic Lumber and Shapes by Displacement,” Section 8, Vol. 8.03. o ASTM D6112 (1997d), “ Standard Test Methods for Compressive and Flexural
Creep and Creep-Ruptured of Plastic Lumber and Shapes,” Section 8, Vol. 8.03. 2.2 Other Documents
o Loehr JE, Bowders JJ and Salim H (2000) “Slope Stabilization Using Recycled Plastic Pins – Constructability,” Final Report, RDT 00-007, Research Investigation 98-007, Missouri Department of Transportation, 74pp.
o Loehr JE, Bowders JJ (2003) "Slope Stabilization Using Recycled Plastic Pins: Phase II - Assessment in Varied Site Conditions" Final Report, RDT 03-016, Research Investigation 98-007B, Missouri Department of Transportation.
3. GENERAL DESCRIPTION
3.1 Slender recycled plastic pins (RPPs) can be used to stabilize earthen slopes by driving the RPPs into the face of the slope to intercept the sliding surface and “pin” the slope.
post-consumer waste materials, for use as slendeof earthen slopes.
119

Bowders, Loehr and Chen RPP Suitability for Stabilizing Slopes
3.2 Recycled plastic pins (RPPs) are manufactured from industrial by-products or post-consumer waste consisting predominantly of polymeric materials (usually
s are composed of the following: High Density rcent to 70 percent), Low Density Polyethylene
rcent to 10 percent), Polystyrene (PS) (2 percent to 10 percent), (PP) (2 percent to 7 percent), Polyethylene-terephthalate (PET) (1
.4 Two main processes are commonly used to produce recycled plastic pins:
3.4.1
ensions and is cured with heat and pressure.
.4.2 Extrusion forming includes steps similar to compression molding; however, the
aterial is forced through a die of the desired cross-section for
manufacture members of any
3.5 he
PROPERTIES
4. 1
4.2
n/min.
4 e equal to or greater than 1200 psi at less than or equal to two percent center strain measured at a crosshead motion rate of 0.02
5. S
5. 1 The measured strengths of RPPs are greatly influenced by the strain rate. The assumed field strain rate is on the order of 0.00003 in/in/min, which correlates
high or low density polyethylene). 3.3 Typically, recycled plastic pin
Polyethylene (HDPE) (55 pe(LDPE) (5 pePolypropylenepercent to 5 percent), and varying amounts of additives (sawdust, fly ash, and other by-products) (0 percent to 5 percent).
3compression molding and extrusion forming.
In compression molding, the constituent waste streams are pulverized, blended together, heated until partially melted, and then compression formed in molds. In this process, the raw material is compressed into desired shapes and dim
3molten composite mthe member being produced in lieu of compression into a mold. An advantage of the extrusion process is that it is relatively easy todesired length while the compression molding process requires different molds for each different member length.
Recycled plastic pins acceptable for slope stabilization applications must meet tstrength, flexure and durability criteria outlined in Section 4.
4. REQUIRED
Recycled plastic pins specified for slope stabilization application must meet the criteria specified in Table 1. The parameters must be determined in accordance with the testing protocols listed and described in Section 5.
The design compressive strength must be equal to or greater than 1500 psi at less than or equal to five percent strain measured at a strain rate of 0.00003 in/i
.3 The design flexural strength must b
in/in/min.
TEST METHOD
120

Bowders, Loehr and Chen RPP Suitability for Stabilizing Slopes
with a compressive failure of a standard 3.5-in. x 3.5-in. RPP under a continuous rate of deformation for one week. Measured compressive strength of the RPP decreases as the strain rate used in the test decreases. The rate of decrease in strength is a function of the material type. For the RPPs tested in one program, the
Property Minimum Requirements
average decrease in strength was about 20 percent per log cycle decrease in the strain rate, i.e., an RPP with a compressive strength of 1000 psi at a strain rate of 0.03 in/in/min will show a compressive strength of 600 psi if tested at a strain rate of 0.0003 in/in/min. Due to the dependence on strain rate, it is imperative to make the required minimum strengths a function of the testing strain rate.
Table 1 – Minimum Properties for Recycled Plastic Pins Utilized in Slope Stabilization Applications.
A. cσ ≥ 1500 psi, axial strain ≤ five percent, strain rate = 0.00003 in/in/min, or
Alt A1. Develop expression for the strain rate effects and correct measured strength to the design strain rate, or
Strain Rate (in/in/min) No. of Compression Tests
0.03 2
0.003 2
0.0003 2
Compression th, c
Uniaxial
Streng σ D6108) (ASTM
Alt A2. cσ
σ
≥ 3750 psi, axial strain ≤ five percent, strain rate = 0.03 in/in/min.
B. fσ ≥ 1200 psi, center strain ≤ two percent, rate of croural
sshead motion = 0.02 in/min, or
FlexStrength, f
ASTM D6109) Alt B1. fσ ≥ 2000 psi, center strain ≤ two percent, rate of crosshead motion = 1.9 in/min.
(
C. Polymeric Constituent > 60% of mass of product, or Durability - nmental osure
Alt C1. Less than 10% reduction in compressive strengtEnviroExp
h after 100 days exposure.
D. No bending failure during 100 days under a constant load that produces an extreme fiber stress not less than 50% of the design compressive stress, or Durability -
eep Alt D1. Testing and Arrhenius modeling showing that the RPPs do not fail Crduring the desired design life for the facility.
The “design” compressive (1500 psi) and flexural (1200 psi) strengths (measured at field stra
5. 2 in rates, presented in Table 5.1, represent the required minimum
s for RPPs to be used in stabilization of slopes. The values f the stabilized field slopes and are determined at the field
mechanical propertieare used in design ostrain rate of 0.00003 in/in/min. Ideally, all RPP specimens should be tested at the field strain rate; however, from a practical perspective testing at this strain rate
121

Bowders, Loehr and Chen RPP Suitability for Stabilizing Slopes
requires about one week per compression specimen which is not practical for production facilities.
Alternatives for qualifying an RPP material include:
(Alt A1) - Establish a compressive strength versus strain rate behavior and estimate the compressive strength at the field strain rate, or
(Alt A2) - A compressive strength of 3750 psi (25.9 MPa) or better when t
5.3 5.3.1
5.3.2 ested at
the ASTM D6108 strain rate of 0.03 in/in/min (0.03 mm/mm/min). The latter value represents the increase in strength realized by the 3-order of magnitude
strain rate effects. 5.3.2.1 Because Alt. A2 uses an upper-bound most manufacturers will find that they can
meet the ecspecific products rather than using the default relation assumed for Alt. A2.
5.4 seco mechanical properties is the required
m flex ral str ss nt center in, when sted in four-po exure using a crosshe displacem t rate of
in (results in a strain rate of 0.00003 in/in/min). 5.4.1 (Alt B1) - If the ASTM D6109 crosshead deformation rate of 1.9 in/m is used,
the required flexural strength is at least 2000 psi at less than or equal to two percent ra deformation rate is due to the effect that loading rate has on the resulting strength
RP 5. 5 In addition to mec
ecycled plastic materials can have significant variability with respect to constituents and manufacturing processes. The durability of the
plication to slope t , must
sidere 5. re
be great ntal exposures.
5.5.3
increase in strain rate, i.e., above the field strain rate of 0.00003 in/in/min, using a reasonable upper-bound for
sp ification more easily by establishing strain rate effects for their
The minimustra
nd part of the specification foru ength of 1200 psi at le than or equal to two perce
te int fl ad en0.02 in/m
in
center st in. Again, the increase in required strength for the higher
of the
durability
P.
hanical properties, the candidate RPPs must meet several criteria. R
finishedstabilizabe con
product will influence its suitability for apions. Two durability facets, environmental degradation and creep
d.
5.1 dd To a ss environmental degradation, the polymeric content of the RPPs sher than 60 percent of the mass to reduce the effect of environme
ould
5.5.2 To address the issue of creep, the RPP should not fail (break) under a cantilever
bending load that generates an extreme fiber stress of 75 percent of the ultimate tensile strength when subjected to the load for 100 days.
Exposure testing and Arrhenius modeling are offered as alternate means to qualify a material’s durability properties.
122

Bowders, Loehr and Chen RPP Suitability for Stabilizing Slopes
5.6 in any slope stabilization design using RPPs, the designer
can vary the stabilization scheme through variation of the number, location, also change the parameters
by changing the factor of safety desired for the stabilized slope. Thus, the
6.1
It should be noted that
strength and stiffness of the RPPs. The designer can
designer has numerous options for stabilization schemes and as such the required engineering properties of the RPPs could vary considerably.
6 KEYWORDS
Slope Stabilization, Embankments, Highways, Cuts, Excavations, Recycled Plastic Lumber, Plastic By-Products, Post-Consumer Waste, Compressive Strength,Flexural Strength, Durability, Creep.
123

Bowders, Loehr and Chen RPP Suitability for Stabilizing Slopes
REFERENCES
1. Am
R
. ASTM D6108 (1997a), “Standard Test Method for Compressive Properties of Plastic
pes,” Section 8, Vol. 8.03.
U
4. ASTM D6111 (1997c), “Standard Test Methods for Bulk Density and Specific
Gravity of Plastic Lumber and Shapes by Displacement,” Section 8, Vol. 8.03.
5. ASTM D6112 (1997d), “ Standard Test Methods for Compressive and Flexural Creep
and Creep-Ruptured of Plastic Lumber and Shapes,” Section 8, Vol. 8.03.
6. Birley A.W., B. Haworth, and J. Batchelor (1991), “Physics of Plastics,” Oxford
University Press, New York.
7. Breslin, V.T., U. Senturk, and C.C. Berndt (1998), “Long-term Engineering
Properties of Recycled Plastic Lumber Used in Pier construction,” Resources
Conservation and Recycling, Vol. 23, pp. 243-258.
8. Bruce, A.H., G.R. Brenniman, and W.H. Hallenbeck (1992), Mixed Plastics
Recycling Technology, Noyes Data Corporation, Park Ridge.
9. Koerner, R.M., Y.H. Halse, and A.E. Lord (1990), “Long-term Durability and aging
of geomembranes,” Waste Containment Systems: Construction, Regulation, and
Performance, Geotechnical Special Publication, No. 26, pp. 106-137.
10. Koerner, R.M. (1998), Designing with Geosynthetics, 4th Ed, Prentice Hall, New
Jersey.
11. Lampo, R.G. and T.J. Nosker (1997), Development and Testing of Plastic Lumber
Materials for Construction Applications, Report TR 97/95, US Army Construction
Engineering Research Laboratories, Champaign, Illinois.
12. Loehr, J.E., J.J. Bowders, and H. Salim (2000a), Slope Stabilization Using Recycled
Plastic Pins- Constructability. Report RDT 00-007, RI 98-007, Missouri Dept of
Transportation, Jefferson City, Missouri.
erican Plastics Council (2002), “2001 National Post-consumer Plastics Recycling
eport,” R. W. Beck, Inc. Washington, D.C.
2
Lumber and Sha
3. ASTM D6109 (1997b), “Standard Test Method for Flexural Properties of
nreinforced and Reinforced Plastic Lumber,” Section 8, Vol. 8.03.
124

Bowders, Loehr and Chen RPP Suitability for Stabilizing Slopes
13. Loehr J.E., J.J. Bowders, L. Sommers, J.W. Owen, and W. Liew (2000b),
“Stabilization of Slopes Using Recycled Plastic Pins,” Transportation Research
Record: Journal of the Transportation Research Board, No. 1714, Paper No. 00-
14. M Lumber and Shapes, Design and
uster, editors,
16. O sing
with Recycled Plastic Reinforcement,” Presented at
18. S
eedings of the Mid-continent
19. T erials,” VanNostrand,
1435, pp. 1-8.
cLaren, M.G. (1995), “Recycled Plastic
Specifications. Proceeding of the 13th Structures Congress, Vol. 1, ASCE, pp. 819-
833.
15. National Research Council Special Report (1996), “Landslides: Investigation and
Mitigation,” Report No. 247, A.K. Turner and R.L. Sch
Transportation Research Board, pp. 673.
sman, H.E., D.J. Elwell, G. Glath, and M. Hiris (1999), “Noise Barriers U
Recycled-Plastic Lumber,” Transportation Research Record: Journal of the
Transportation Research Board, No. 1670, Paper No. 99-2100, pp. 49-58.
17. Parra, J.R., J.E. Loehr, D.J. Hagemeyer, and J.J. Bowders (2003) “Field Performance
of Embankments Stabilized
82nd Annual Meeting of the Transportation Research Board, Washington, D.C.
ommers L., J.E. Loehr, and J.J. Bowders (2000), “Construction Method for Slope
Stabilization Using Recycled Plastic Pins,” Proc
Transportation Symposium, May 15-16, Iowa State University, pp. 254-258.
imoshenko S.P., and J.M. Gere (1972), “Mechanics of Mat
New York.
125