
Evaluation of Photometric Data Files for Use in...
15
1 2010-01-0292 Evaluation of Photometric Data Files for Use in Headlamp Light Distribution William T.C. Neale, David Hessel, James Marr Kineticorp, LLC ABSTRACT Computer simulation of nighttime lighting in urban environments can be complex due to the myriad of light sources present (e.g., street lamps, building lights, signage, and vehicle headlamps). In these areas, vehicle headlamps can make a significant contribution to the lighting environment 1,2 . This contribution may need to be incorporated into a lighting simulation to accurately calculate overall light levels and to represent how the light affects the experience and quality of the environment. Within a lighting simulation, photometric files, such as the photometric standard light data file format, are often used to simulate light sources such as street lamps and exterior building lights in nighttime environments. This paper examines the validity of using these same photometric file types for the simulation of vehicle headlamps by comparing the light distribution from actual vehicle headlamps to photometric files of these same headlamps. Light values are calculated in a simulated environment and numerically compared to light measurements taken in situ of actual headlamps. A discussion of how light distribution of a photometric file differs from light distributed by an actual headlamp assembly is included to articulate the primary differences. INTRODUCTION Lighting simulation for nighttime environments has increased commensurate with advances in rendering technology and the widespread inclusion of rendering engines and light models in publicly available computer modeling and animation programs. Specifically, nighttime lighting simulation benefits from two main advancements: global illumination 3 and photometric light files. Global Illumination addresses the problem of how light behaves after it exits a light source and interacts with surfaces 4,5 . By accounting for the affect of light interacting with surfaces that vary in texture, color, translucency and reflectivity, the overall impact of light in an environment becomes much more realistic than previous lighting models that did not account for propagation and bouncing of light off of surfaces. In addition to global illumination, the standardization of photometric light data also advanced light simulation since this step introduced digital data files that are specific to a particular light source, defining the lights intensity and distribution pattern. When combined, global illumination and photometric light files enable light simulation and rendering programs to generate photorealistic images that visually represent the light conditions in an environment with physically accurate light values. These results can be evaluated visually and numerically to determine the appropriateness of design decisions and compliance with light standards. Because the light simulation and rendering applications seek to evaluate accurate lighting conditions, it is relevant to include other light sources, such as vehicle headlamps, that impact both the quality and experience of the lighting environment as well as light sources that contribute to overall light levels 1 . This is especially true in urban environments where there are higher densities of vehicles on the streets in closer proximity to pedestrians and buildings. Currently, light simulation programs utilize standardized photometric files for interior lighting, and exterior lighting where street lights and area lights provide much of the lighting for parking lots, security lighting, roadways, highways, illuminated signs and recreation areas. Because light simulation programs rely on photometric data files to accurately simulate these light sources, employing photometric data files to simulate vehicle headlamps is a logical step, and is the focus of this paper. To evaluate the validity of photometric files to simulate headlamp light distribution in a simulation environment, real headlamps are analyzed against the photometric files created for each headlamp. This is done numerically by
Transcript of Evaluation of Photometric Data Files for Use in...

1
2010-01-0292
Evaluation of Photometric Data Files for Use in
Headlamp Light Distribution
William T.C. Neale, David Hessel, James Marr
Kineticorp, LLC
ABSTRACT
Computer simulation of nighttime lighting in urban environments can be complex due to the myriad of light
sources present (e.g., street lamps, building lights, signage, and vehicle headlamps). In these areas, vehicle
headlamps can make a significant contribution to the lighting environment1,2
. This contribution may need to be
incorporated into a lighting simulation to accurately calculate overall light levels and to represent how the light
affects the experience and quality of the environment. Within a lighting simulation, photometric files, such as
the photometric standard light data file format, are often used to simulate light sources such as street lamps and
exterior building lights in nighttime environments. This paper examines the validity of using these same
photometric file types for the simulation of vehicle headlamps by comparing the light distribution from actual
vehicle headlamps to photometric files of these same headlamps. Light values are calculated in a simulated
environment and numerically compared to light measurements taken in situ of actual headlamps. A discussion
of how light distribution of a photometric file differs from light distributed by an actual headlamp assembly is
included to articulate the primary differences.
INTRODUCTION
Lighting simulation for nighttime environments has increased commensurate with advances in rendering
technology and the widespread inclusion of rendering engines and light models in publicly available computer
modeling and animation programs. Specifically, nighttime lighting simulation benefits from two main
advancements: global illumination3 and photometric light files. Global Illumination addresses the problem of
how light behaves after it exits a light source and interacts with surfaces4,5
. By accounting for the affect of light
interacting with surfaces that vary in texture, color, translucency and reflectivity, the overall impact of light in
an environment becomes much more realistic than previous lighting models that did not account for propagation
and bouncing of light off of surfaces. In addition to global illumination, the standardization of photometric light
data also advanced light simulation since this step introduced digital data files that are specific to a particular
light source, defining the lights intensity and distribution pattern. When combined, global illumination and
photometric light files enable light simulation and rendering programs to generate photorealistic images that
visually represent the light conditions in an environment with physically accurate light values. These results
can be evaluated visually and numerically to determine the appropriateness of design decisions and compliance
with light standards. Because the light simulation and rendering applications seek to evaluate accurate lighting
conditions, it is relevant to include other light sources, such as vehicle headlamps, that impact both the quality
and experience of the lighting environment as well as light sources that contribute to overall light levels1. This
is especially true in urban environments where there are higher densities of vehicles on the streets in closer
proximity to pedestrians and buildings. Currently, light simulation programs utilize standardized photometric
files for interior lighting, and exterior lighting where street lights and area lights provide much of the lighting
for parking lots, security lighting, roadways, highways, illuminated signs and recreation areas. Because light
simulation programs rely on photometric data files to accurately simulate these light sources, employing
photometric data files to simulate vehicle headlamps is a logical step, and is the focus of this paper. To evaluate
the validity of photometric files to simulate headlamp light distribution in a simulation environment, real
headlamps are analyzed against the photometric files created for each headlamp. This is done numerically by

2
comparing luminance values of headlamps measured in situ to the photometrically generated light values in the
light simulation program.
TESTING SETUP
This paper evaluates the validity of photometric files in simulating headlamp light distribution. To accomplish
this, several different headlamp types were considered. The headlamps were sent to a light laboratory to have
photometric files created. A test was set up to compare real-world luminance values from the headlamps to the
light values obtained in the simulation program. To test the headlamps in a real world environment, a site with a
typical paved roadway surface was chosen that contained no ambient lighting. In order to accommodate several
basic headlamp design types, three different vehicles were used, each representing a different class of vehicle.
Below is a photograph and matrix of the make and model of the vehicles used in this study and the lamp designs
of each vehicle.
Vehicle Make Model Year Class Lamp Type
Toyota Landcruiser 1994 SUV Lens Optics
Cooper Mini 2005 Passenger Projector Optics
Nissan Pickup Truck 2006 Pick-up Reflector Optics
Figure 1
In addition to representing three different classes of vehicles, each vehicle has a different optic system. The lens
optics, projector, and reflector optics headlamp designs (shown from left to right) account for the majority of
vehicle headlamps used on the roads. This combination of class and optic system provides a broad range of
headlamp samples suitable for this study. To measure the actual distribution from each of these vehicle
headlamp types, a total of 10 calibrated grayscale cards were used, spaced at intervals from the front of each
vehicle and were staggered side to side such that no calibration card cast a shadow on another. The light
reflecting off of each of these cards was measured in cd/m2 using a Minolta LS-110 luminance meter. The
purpose of staggering and spacing the cards was to get the light value over a distance since the shape of the
beam pattern and intensity of light for the headlamps changes as the beam spreads further from the headlamp

3
assembly. In order to evaluate the degree to which the photometric file is capable of representing the beam
pattern and light attenuation, the light values needed to be measured at different distances. Each vehicle was
parked at the same station line relative to the calibration cards and the light intensity of the headlamp
distribution projected on to each card was measured using the luminance meter. A diagram of the layout for the
site testing, vehicle placement and calibration card placement is shown below. The entire testing site was
surveyed, including the location and orientation of each of the calibrated reflectivity cards, the station line, and
the light location, so a computer generated model of the site could be built in which to test the photometric files.
Figure 2
The reflectivity of each of the calibrated cards was also measured, so that when the photometric files were used
in a computer simulation, the cards reflecting light in the simulated environment would mirror those surfaces in
the real world test. The calibration cards in the real world test were measured to be 18% reflective. Below is a
matrix showing the results of each vehicles headlamp light distribution measured in situ.
Figure 3
NUMERICAL COMPARISON OF ACTUAL HEADLAMP DISTRIBUTION TO PHOTOMETRIC
DATA
Photometric files for each of the three headlamps were obtained from Light Laboratory Inc, in Anaheim,
California. These photometric files were simulated in Autodesk’s 3DS Max Design 2009 Exposure Technology
light simulation tool. This light simulation package is widely used in light simulation environments and the
accuracy of the light simulation model has been widely published and validated.6 To replicate the real world
testing site, computer models of the calibration cards were also created, and set to reflect 18% of the light to
match the reflectance of the calibrated cards used in the real world study. Since the photometric files use real
world units, the calibration cards created in the simulated environment were scaled to real world units and
spaced according to their locations surveyed in the real world study. Below is a rendering of the 3D
environment and 3D cards used to measure the simulated light distribution.

4
Figure 4
The position of the headlamp assembly and calibration cards in the real world test were replicated in the
computer environment, and the photometric data files for the headlamps were placed in the correct location in
the light environment for simulating. The photometric light files were aimed according to the survey of the
actual headlamp assembly in the real world study, and projected onto the calibration cards. The light values as
calculated in the simulation were recorded at the same locations on each calibration card and compared to the
values obtained in situ. Graphs were made for each headlamp assembly comparing the light measurements
taken in situ and those calculated in the simulated environment. Below are the graphs that result from this
comparison.

5
Figure 5
For each vehicle, a graph shows the luminance values for the measured luminance in blue, and the photometric
simulated luminance values in red. To make an even comparison, the photometric files were scaled such that the
light value at the first calibrated card matched the light value of the actual measured headlamp. Comparisons for
the light values at each of the cards, both in the field and in the computer environment, are then plotted as
shown in the graphs.
One difference between the field measured light values and the photometric light values as shown in Figure 5, is
that the actual field measurement surface would have some reflectance associated with its material properties.
The reflectance of the surface on which the field measurements were taken was measured at 6%. The computer
model surface was adjusted to reflect 6% of the light from the photometric files and an analysis was performed
to determine how much additional light would contribute to the overall photometric light values. The graph in
Figure 6 shows the additional, though negligible, contribution from light reflecting off the surface. This
contribution averages about 3% additional luminance. Appendix A lists all the values, with and without the 6%
reflective surface, for each card number and for each vehicle.
Figure 6
In general, the luminance values calculated by the photometric files have a much sharper luminance value
decrease than the measured values done in the field. This sharper falloff of the photometric files is true for all
three headlamp types, and their falloff is similar as well. This suggests a function in the way photometric light
files are simulated, whereby the light intensity of the light in the simulated environment exemplifies an inverse
square falloff as in the equation:
2
1
xI =
While an inverse square falloff would be true for a single point source light, because of the headlamp’s optic
system, light is collected and distributed in a manner that no longer resembles a point source, but rather multiple
light sources. As a result, the falloff relationship is much less than inverse square. Because the photometric files
are generated directly from the headlamps themselves, the optics of the headlamps were analyzed to determine
the source of this difference. The following section explains the nature of photometric files and why this pattern
is created.

6
PHOTOMETRIC DATA FILES:
To see why there is such a difference in the light values calculated by the photometric files and those measured
by actual headlamps in the field, it is relevant to examine how photometric files are created and assigned as
lights in a simulation program. Standardized in the mid 1980s by IESNA, photometric data files allow for a
broad use of published data, interchangeable between manufactures, designers, computer artists, and engineers7.
Photometric light files represent the light intensity value for measured light sources and use real world units and
values to enable their application in light simulation software. Photometric data files contain information in
candela values that describe how light from a light source or light assembly is distributed and, because
photometric data are recorded in real world units, they can be used to predict light values in a computer
generated environment. Photometric data is used in light simulation programs to provide physically accurate
representation of the propagation of light energy in an environment from lamps, luminaries, and other light
assemblies or light sources. The light intensity distribution (or LID) of a light source or lamp assembly is
measured using photometry equipment such as spectrometers or goniometers that are designed to measure light
intensity at specific angles on photocells. The data collected on the cells represents the light intensity at a given
angle and is presented in a digital format of values in standardized ASCII format defined by standards created
by IESNA. Figure 7 ,below, is an example of the ASCII data set of a photometric file from a headlamp of a
1994 Toyota Land Cruiser.
Figure 7
The first string of data describes the light type and specifications for how measurements were taken. Below this
list is a matrix of numbers on two axes that represent the intensity values of the light at different angles. One
axis is horizontal, the other is vertical, and the combined data set creates a matrix of light intensity distribution
that characterizes light measured in essentially all directions. Each number represents an actual measured
candela value for that horizontal and vertical angle. The larger the number, the higher the light intensity file.
Thus the photometric file, when viewed as a set of numbers, actually manifests the shape of the beam visually.
The regions of the file with higher candela value also have larger numbers, and areas with lower candela value
have smaller numbers, giving a visual impression of the shape of the light intensity through the matrix of
numbers. As in the image above, then, the hot spot of the light is near the center of the file where the numbers
are largest and, therefore, brightest, and stretches horizontally, slowly dissipating light energy towards the
corners. Photometric files also come in other formats such as LTLI or CIBSE, each file named so because of the
region the standard was created. In North America the IES digital data file format is the standard file format for
light intensity measurements, and can be used to simulate light distribution and intensity in many publicly
available computer modeling and animation programs that model light behavior. This is particularly useful in
7
nighttime computer environments where the computer light models can visually represent how light behaves
according to the intensity and light distribution as defined by the IES digital file format. Its wide availability,
measurements in real world units, and standard formatting make the IES file both practical and accurate for
users analyzing or visualizing nighttime light conditions. However, as will be discussed, because of the way
light values are measured for headlamps, and how this data is converted to a photometric file, a 3D visualization
program that simulates light using the photometric file for a headlamp will not get accurate light values. Figure
8 schematically demonstrates how light intensity data is collected on a photocell that is situated a set distance
from a light source mounted on a typical goniometer.
Figure 8
A photocell records the light intensity from the light source in candela, and the angle relative to the lamp. To get
light values from different angles of the lamp, the lamp is rotated slightly in both horizontal and vertical axis,
and another recording is taken on the photocell that reflects the light intensity emitted from the light positioned
at this new angle. The result is a web of photometric data representing the light intensity for multiple angles of
light emitting from the light source. However, because of the way headlamp optics work, and because of the
way that simulation programs interpret and utilize photometric file formats, the simulated light only partially
represents the headlamp properly.
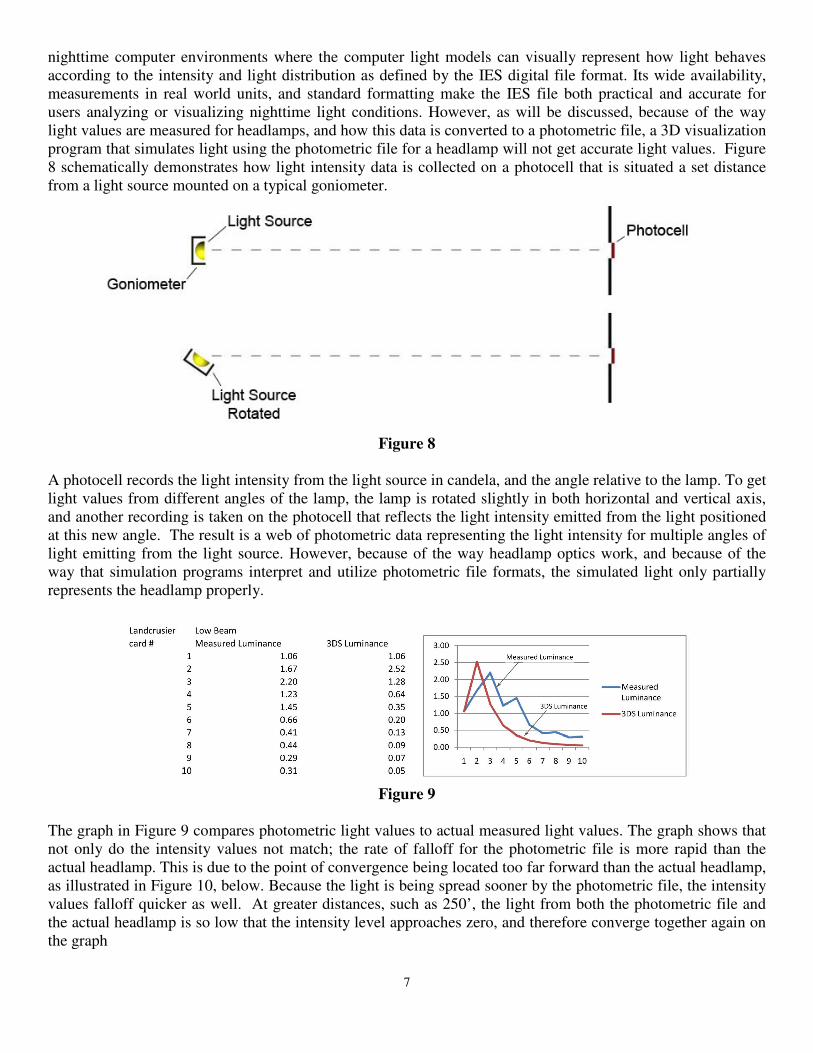
Figure 9
The graph in Figure 9 compares photometric light values to actual measured light values. The graph shows that
not only do the intensity values not match; the rate of falloff for the photometric file is more rapid than the
actual headlamp. This is due to the point of convergence being located too far forward than the actual headlamp,
as illustrated in Figure 10, below. Because the light is being spread sooner by the photometric file, the intensity
values falloff quicker as well. At greater distances, such as 250’, the light from both the photometric file and
the actual headlamp is so low that the intensity level approaches zero, and therefore converge together again on
the graph

8
Figure 10 illustrates how headlamp optics collect and distribute light that cannot be properly represented in
photometric files, showing the convergence of two different light rays. One of the light rays, shown in blue,
converges to where the light source is actually located, the other beam shown in red, converges where light
being emitted from the headlamp would converge because of the optics. In short, rays from the actual light
source do not converge to the same location as the light that is actually emitted from the headlamp because of
the manner in which parabolic reflectors in the lamp collect and distribute light. The parabolic shape of the
headlamp collects light and distributes light in this manner, such that the location of the actual light bulb is
different than the location of the convergence of the light rays that are distributed out from the headlamp. In
fact, the parabolic reflectors have many surfaces of different size and angle that create multiple convergence
points for the light rays that are emitted from the headlamp. This complex shape of the reflector creates the
necessary beam pattern that one sees on the roadway and provides sufficient light power to the headlamps to
illuminate objects ahead of the vehicle, while reducing the amount of glare that may be discomforting or
distracting to oncoming traffic8. But because the photometric data matrix assumes that all the light is being
emitted from the same point, it cannot account for the difference in convergence of the light rays it measures.
The photometric file assumes a single convergence of light, and hence will produce erroneous spreading of light
intensity. This difference in light spread is shown in figure 10, below, notated as a change in θ.
Figure 10
To further understand why converging light to a single point, as in a photometric file, creates erroneous light
distributions for a headlamp, the illustration above shows that the angle of light being distributed by the
photometric convergence point has a much wider spread than the actual convergence point. This means that
there would be a greater diffusion of light in a shorter distance than the light emitted by the actual headlamp. In
other words, light would always register a higher intensity value closer to the headlamp and a sharper fall off
than what a real headlamp would register, particularly for a headlamp. This is an important distinction, since it
is the focusing of light in the distance by a headlamp that creates the hotspot critical for illumination of objects
at night.9 In an actual headlamp, the reflector optics would have multiple points of convergence as represented
in Figure 11below. In short, an actual headlamp projects light as if there are multiple light sources at work.

9
Figure 11
The effect seen in Figure 11 above is caused by reflector optics that collect light and distribute it in such a way
that the resulting beam pattern can be described as if created by multiple light sources.
Photometric files are assigned to only one light in a simulation program, hence the single convergence problem.
As a single light source, the physical properties defined by the light simulation application create intensity
values that misrepresent the actual headlamp. Light simulation programs create photometric lights with
physically-based intensity values and a falloff described with the following inverse equation:
2
1
xI =
This means that as the light is distributed to an area, its falloff reduces inversely proportional to the distance the
surface is away from the light. Photometric files are assigned to a single light, and always attenuate at an
inverse-square falloff rate. Photometric simulations rely on real world units in a scene, forcing the light source
in the computer model to project light values as defined in the photometric file from a single point, at an inverse
square falloff. This equation, while appropriate to define the behavior of light in a simulation program, becomes
problematic when used to define light sources with single convergence points. The photometric simulated light
will always start off too intense and falloff too quickly relative to an actual headlamp. The intensity value of a
light at the position of the light source rather than at the position of convergence and, therefore, a higher
intensity light than an actual headlamp, can be described in the following equation:
2
21
22
)( DD
IL
+=
Where I2 is the intensity value at 1 meter from the point of convergence, D1 is the distance from the light
source’s location, and D2 is the distance between the light source location and the point of convergence. Due to
the increased falloff of the photometric file, the difference between the photometric light and the actual
headlamp can be determined by subtracting the light intensity of the photometric file from the actual headlamp.

10
COMPARISON OF ACTUAL HEADLAMP BEAM SHAPE TO PHOTOMETRY BEAM SHAPE
In addition to the difference in intensity levels of the actual headlamp versus the photometric file, there is a
difference in the shape or beam pattern between the actual headlamp’s hotspot and the hotspot created by the
photometric file. The source of the error still lies in the fact that the parabolic reflectors distribute light in a
manner that cannot be captured and represented in a photometric file. To illustrate how the beam pattern
changes in an actual headlamp, Figure 12, below, shows, from a top view, how light is focused in front of the
lens to form a hotspot.
Figure 12
Light is collected on the left and right sides of the parabolic reflector since this allows for the most efficient
concentration of light in the reflector. Where the beam from both sides of the reflector comes together is where
the majority of light is concentrated to form the hotspot. This occurs at some distance out from the front of the
light, but, most importantly, it occurs from the crossing of two light beams, i.e. one light beam coming from
each side of the lamp. Because this hotspot is generated from two focused light beams as the distance from the
headlamp increases, the shape of the hotspot will also change. This pattern cannot be represented in a
photometric file, since the photometric file assigns the beam formation to one light beam rather than two.
To demonstrate the phenomenon, a sealed beam, lens optics, headlamp is used, and portions of the light have
been masked off to show how different parts of the headlamp area can contribute a different portion and shape
to the total beam pattern. Different quadrants are masked to record the contribution from any one of the
quadrants making the beam pattern. Figure 13, below, is a photo showing how the sealed beam headlamp is
masked to separate the hotspot contribution from each side of the headlamp.
Figure 13
On the left shows the actual headlamp, with outlines of the quadrants that make up the total beam pattern.
Quadrants 2 and 3 are specifically the focused hotspot, while 1 and 4 act more to diffuse light over a wider area
for more general illumination. The image on the right shows the masks themselves, slightly separated for

11
clarity, that were used to mask each corresponding quadrant on the headlamp. With the quadrants masked,
photos were taken in an unlit room to capture the contribution from each quadrant. This is shown below in
Figure 14
Figure 14
Quadrants 2 and 3 contribute an almost equal amount of light intensity and beam pattern to the hotspot, yet this
comes from each side of the headlamp. Because this beam pattern is formed from two sides of the headlamp,
the hotspot shape changes over distance since the beam pattern would criss-cross at some distance out from the
headlamp. This crossing of the two hotspots is shown in Figure 15, where the actual change in position of each
headlamp hotspot from quadrants 2 and 3 were recorded and measured.
Figure 15
As a comparison, the hotspot from the photometric file does not change its shape in the same manner as the
actual headlamp. This is illustrated in the images and analysis in Figure 16 below.
Photometric Beam Spread Actual Headlamp Spread
Figure 16
In Figure 16, the headlamp distribution on the left demonstrates the beam spread from a photometric file.
Because of the single light object that the photometric file is assigned to, the light pattern is emitted such that

12
the beam pattern is accurate at the location marked A&B on both the photometric and actual light spread.
Because this shape is created from a single light source, however, and not the reflection from optics in the
actual light source, the light beam pattern does not change accurately as shown in the beam pattern on the right,
where the actual beam pattern would converge at some distance out from the light. This convergence is not
represented in a photometric file.
CONCLUSION
In this study, lens optics, projector and reflector optics headlamps were evaluated, though other headlamp types,
such as HID, and Mini-projector are somewhat different and could also be evaluated. Regardless of the lamp
type, however, the general criteria for headlamps is similar in a way that make headlamps unique in how light is
collected and distributed. The behavior and pattern of light distribution from an actual headlamp are
fundamentally different than the behavior of light emitted by a photometric file of a headlamp in a simulation
program. This is because headlamps contain sophisticated optics that result in a headlamp assembly projecting
light more like several light sources rather than one. The design of this optics system in headlamps renders a
photometric data file of the headlamp inadequate in representing light intensity and distribution in a simulation
environment. While photometric light files are accurate for some types of light sources and luminaries, the
photometric file does not represent the complex reflector and lens assemblies of the headlamp that collect and
distribute headlamp light such that the projection of the light changes over distance. Headlamps are not static
lights like a street lamps or building, since the vehicles move within the environment. Also, the stringent design
requirements for headlamps to both illuminate objects ahead for better visibility while reducing glare for
oncoming traffic9 result in extremely complex optics. The beam formation of a headlamp may not occur until
30’-50’ from the headlamp itself and this beam pattern is a central light contributing component of the
headlamp for far field distances. The reflectors and lenses of headlamps direct the light from the light source to
achieve a hotspot in the distance by focusing light from both horizontal sides of the headlamp. Because these
two beams are crossing in the distance, it is not possible for a photometric file to record the direction the light is
crossing, and how this crossing affects the hotspot close or farther away from the headlamp. While photometric
files are inadequate in capturing the complex light collection and distribution of a headlamp, it is still possible
to simulate headlamp illumination by creating a light source in the 3D visualization program that accounts for
the multiple convergence of each individual headlamp design. The concept behind using multiple light sources
is that a headlamp beam pattern can be separated into multiple light emitting areas that each contributes some
part to the whole of the beam pattern. Figure 12 shows the analysis of a sealed beam headlamp visually
demonstrating how the optics of the headlamp collect the light into individual quadrants that emit light through
quadrants to form a complete pattern. While sealed beam headlamps are still widely used in the trucking
industry for replacement parts, their use in the passenger car industry has been replaced by the lamp types that
have been evaluated in the paper. As Figure 12 shows, the flutes in the sealed beam are shaped differently to
create a different part of the beam pattern. When these individual flute patterns are masked off, their individual
contribution to the overall beam pattern can be analyzed, and a simulated light that only accounts for this
quadrant’s light pattern can be created as shown in Figure 8.
Because the headlamp can be divided into discrete quadrants, it can also be analyzed in discrete parts. One way
to capture how the optics of the headlamp create discrete light patterns that contribute to the whole beam
pattern, is to individually photograph each light section, as shown in figure 13. With photographs that map the
individual light patterns, these maps can be assigned to light sources in a light simulation and visualization
program. The light sources will project light through the projection maps and as a cluster, will collectively
create the entire beam pattern that is the same as the actual headlamp. Figure 17 is an image that represents the
concept of a multiple light cluster.

13
Figure 17
In the image above, digital map projections that capture the light created by each individual part of the
headlamp optics are assigned to individual light sources. Each light then projects light through the map to
complete the full beam pattern. For more in depth discussion of the light cluster method see the SAE
publication “Simulating Headlamp Illumination Using Photometric Light Clusters,” Society of Automotive
Engineers, Paper Number 2009-01-0110”.

14
Appendix A
Landcrusier Low Beam
Card # 3DS Luminance 3DS Luminance GI Difference average
1 1.06 1.09 3.00%
2 2.52 2.60 3.10%
3 1.28 1.32 2.80%
4 0.64 0.66 2.60%
5 0.35 0.36 2.90%
6 0.20 0.21 2.70%
7 0.13 0.13 2.50%
8 0.09 0.09 2.40%
9 0.07 0.07 2.00%
10 0.05 0.05 2.10% 2.61%
Mini Cooper Low Beam
Card # 3DS Luminance 3DS Luminance GI average
1 4.30 4.44 3.20%
2 2.24 2.31 3.10%
3 1.66 1.71 3.00%
4 0.69 0.71 2.80%
5 0.32 0.33 2.60%
6 0.16 0.16 2.90%
7 0.09 0.09 2.60%
8 0.07 0.07 2.40%
9 0.05 0.05 2.20%
10 0.03 0.03 2.30% 2.71%
Nissan Low Beam
Card # 3DS Luminance 3DS Luminance GI average
1 0.39 0.40 3.20%
2 0.39 0.40 2.90%
3 0.04 0.04 2.90%
4 0.01 0.01 2.70%
5 0.04 0.04 2.60%
6 0.00 0.00 2.80%
7 0.02 0.02 2.50%
8 0.01 0.01 2.30%
9 0.00 0.00 2.10%
10 0.00 0.00 2.10% 2.61%

15
1 A Bacelar, “The Contribution of Vehicle Lights in Urban and Peripheral Urban Environments”, LightingRes. Technology Vol 36,1
(2004) pp. 69-78
2 Narisada, K., Schrbuder D., “Light Pollution Handbook”, Springer Norwell, MA,2004, page 49-50.
3 J. Kajiya, “The Rendering Equation” ACM 0-89791-162 Volume 20, Number 4, 1996
4 Larson, Gary, Shakespeare, Rob, “Rendering with Radiance” Morgan Kaufman, San Francisco, California, 1997 p. 6
5 Gallardo, Arnold, “3D Lighting History, Concepts, and Techniques”.Charles River Medi Inc, Rockland Massachusetts, Page 112
6 Reinhart, C., "Experimental Validation of Autodesk 3DS Max, Design 2009 and Daysim 3.0". National Research Council Canada,
Harvard University GSD, 2009
7 IES Publication LM-63-1986, “IES Recommended Standard File Format for Electronic Transfer of Photometric Data and Related
Information, Subcommitee on Photometry of the IESNA Computer Committee,September 12th
, 2002
8 Sanders, Mark S., and McCormick, Ernest J., “Human Factors in Engineering and Design”. 7
th Edition, McGrall Hill New York,
New York, 1993
9 Olson, Paul L., and Farber, Eugene, “Forensic Aspects of Driver Perception and Response”. 2
nd Edition, Boston, MA: Lawyers &
Judges Company, Incorporated, 2003


![Median Photometric Stereo as Applied to the Segonko ...miyazaki/publication/paper/Miyazaki-IJCV2010PS.pdfTherefore, we use so-called “four-light photometric stereo [10,56,4,9].”](https://static.fdocuments.net/doc/165x107/5e7838fc764b185a9535da92/median-photometric-stereo-as-applied-to-the-segonko-miyazakipublicationpapermiyazaki-.jpg)


