evaluation of objective beef juiciness measurement techniques and ...
118
EVALUATION OF OBJECTIVE BEEF JUICINESS MEASUREMENT TECHNIQUES AND THEIR RELATIONSHIPS TO SUBJECTIVE TASTE PANEL JUICINESS RATINGS by Loni D. Woolley, B.S. A Thesis In Animal Science Submitted to the Graduate Faculty of Texas Tech University in Partial Fulfillment of the Requirements for the Degree of MASTER OF SCIENCE Approved Mark F. Miller Chair of Committee J Chance Brooks Ryan Rathmann Mark Sheridan Dean of the Graduate School December, 2014
Transcript of evaluation of objective beef juiciness measurement techniques and ...

EVALUATION OF OBJECTIVE BEEF JUICINESS MEASUREMENT TECHNIQUES
AND THEIR RELATIONSHIPS TO SUBJECTIVE TASTE PANEL JUICINESS
RATINGS
by
Loni D. Woolley, B.S.
A Thesis
In
Animal Science
Submitted to the Graduate Faculty
of Texas Tech University in
Partial Fulfillment of
the Requirements for
the Degree of
MASTER OF SCIENCE
Approved
Mark F. Miller
Chair of Committee
J Chance Brooks
Ryan Rathmann
Mark Sheridan
Dean of the Graduate School
December, 2014

Copyright 2014, Loni Woolley

Texas Tech University, Loni Woolley, December 2014
ii
ACKNOWLEDGMENTS
I would like to personally thank my major advisor, Dr. Mark Miller, for giving me
the opportunity to pursue my master’s degree and start my education path towards
becoming a meat scientist. I appreciate the many opportunities you have given me to
grow throughout my career. I would also like to thank my other committee members, Dr.
Chance Brooks and Dr. Ryan Rathmann, for your support throughout my degree. Your
expertise and leadership is something I will strive towards in the future.
Dr. Travis O’Quinn has made a huge impact in my life and played a major role in
the success of this project from start to finish. I cannot thank you enough for all that you
have done for me and taught me throughout the past two years. Your passion and desire
to succeed is admirable. You are one of the smartest people I know, and I consider myself
lucky to have been able to have worked closely with you. I look forward to continue
growing our working relationship in future endeavors.
Dr. Jerrad Legako played an integral part in making this project possible. Thank
you for all of your help and expertise. You are always pushing me to do more outside of
my comfort zone, which makes me a better researcher.
A huge thank you goes out to the graduate students and undergraduate assistants
that helped during the many hours of work during this project. I would like to personally
thank Jennifer Martin, Drew Cashman, Devin Gredell, Maria Bueso, Keelyn Hanlon,
Olivia Ron, Ana Gomez, Katie Duysen, Sydney Knobel, Kari Spivey, Taelar Childers,
Christy Woerner, Deshea Hanagan, Mallory Jones, Kassandra Ognoskie, Aaron Faulkner,
Gretchen Lochte, Allison Sheats, Bailey Joe Pennington, Irvin Garza, Susana Andre,
Gustavo Lira and anyone I may have missed for their unselfish service. I would also like
to thank Shandon Rankin and the meat lab for helping during the enhancement portion of
the project.
I would like to thank the Houston Livestock Show and Rodeo for sponsoring part
of my assistantship during my degree. I have been attending the Houston Livestock show
since I was a little girl and am blessed to have them support my education.

Texas Tech University, Loni Woolley, December 2014
iii
This project may not have been possible without the funding from the National
Cattlemen’s Beef Association. Thank you for your financial support of this project and
your interest in research in the beef industry.
Last but not least, I would like to thank Kody and my family for their support.
Kody, I am so thankful that you have been so supportive while I was working long hours
or gone on a research or judging trip. To my family, you have continued to support
whatever endeavors I have pursued whether you think they are a good idea or not. I thank
you for instilling hard work, dedication and a selfless attitude in me while growing up. It
came in handy. I love you.

Texas Tech University, Loni Woolley, December 2014
iii
TABLE OF CONTENTS
ACKNOWLEDGMENTS .................................................................................... ii
ABSTRACT .......................................................................................................... iv
LIST OF TABLES ............................................................................................... vi
LIST OF FIGURES ........................................................................................... viii
I. INTRODUCTION ..............................................................................................1
II. REVIEW OF LITERATURE ..........................................................................4 Importance of beef juiciness ........................................................................4 Juiciness defined ..........................................................................................4
Physiological events of beef juiciness evaluation ........................................5
Sensory evaluation of beef juiciness ............................................................6
Muscle ultrastructure related to beef juiciness .............................................7 Factors affecting beef juiciness ....................................................................8
Objective measures of beef juiciness and tenderness ................................13 Relationships between objective tenderness and juiciness measurement
methods and sensory panel ratings ............................................................15 Relationships among palatability traits ......................................................17 Prediction equations for sensory panel ratings ..........................................17
Implications................................................................................................18 References ..................................................................................................19
III. CONSUMER AND TRAINED PANEL EVALUATION OF BEEF
STRIP STEAKS OF VARYING MARBLING AND ENHANCEMENT
LEVELS COOKED TO THREE DEGREES OF DONENESS ......................28 Abstract ......................................................................................................28
Introduction ................................................................................................29 Materials and methods ...............................................................................31 Results and discussion ...............................................................................36
References ..................................................................................................44
IV. ASSESSMENT OF OBJECTIVE MEASURES OF BEEF STEAK
JUICINESS FOR PREDICTION OF SUBJECTIVE TASTE PANEL
JUICINESS RATINGS .......................................................................................61 Abstract ......................................................................................................61 Introduction ................................................................................................62 Materials and methods ...............................................................................64
Results and discussion ...............................................................................71 References ..................................................................................................85

Texas Tech University, Loni Woolley, December 2014
iv
ABSTRACT
The objectives of this study were to develop an objective juiciness measurement
technique that could be used simultaneously with current objective tenderness evaluation
procedures and evaluate juiciness differences in varying treatments of beef strip loins. To
accomplish this, treatments were selected to maximize variation in juiciness and
included: USDA Prime, upper 2/3 Choice (Top Choice), lower 1/3 Choice (Low Choice),
Select, and Standard as well as two enhanced USDA Select treatments [injected to 112%
(Select High Enhanced) and 107% (Select Low Enhanced) of raw weight with a water,
salt, and alkaline phosphate solution]. After aging (21 d), strip loins were cut into 2.5-cm
thick steaks and frozen (-20°C) prior to subsequent analyses. Steaks for sensory and
cooked analyses were cooked to three degrees of doneness (DOD) [rare (60°C), medium
(71°C), and well-done (77°C)] to create additional juiciness variation. Several objective
measures of juiciness were evaluated on both raw and cooked samples. Instrumental
techniques evaluated on raw samples included: marbling, pH, L*, a*, and b* values,
percent fat, moisture, and protein, drip loss, expressible moisture, water holding capacity,
Carver press compression values, water activity, and water binding ability or protein
swelling. Cooked techniques evaluated included: cook loss, drip loss, expressible
moisture, Carver press compression values, pressed juice percentage (PJP), and fat
percentage in expressed PJP fluid (FE). The PJP method was a compression-based
juiciness evaluation method developed to allow for juiciness testing from the steak
portion remaining after slice shear force (SSF) sample removal. For subjective juiciness
ratings, steaks were evaluated by a 7-member trained sensory panel for initial juiciness
(TI) and sustained juiciness (TS). Moreover, consumers (n = 252) evaluated samples of

Texas Tech University, Loni Woolley, December 2014
v
their preferred DOD from each treatment for juiciness (CJ) and juiciness acceptability.
Correlation analyses were used to identify and quantify relationships among instrumental
measurements and CJ, TI, and TS. Of the objective measures evaluated, aside from cook
loss, the strongest correlation (P < 0.05) with sensory ratings occurred between PJP and
CJ (r = 0.45), TI (r = 0.69) and TS (r = 0.67). Also, FE was positively correlated (P <
0.05) with CJ (r = 0.39), TI (r = 0.34) and TS (r = 0.37). Cook loss had the highest
correlation (P < 0.05) with CJ (r = -0.51), TI (r = -0.75) and TS (r = -0.73). However,
cook loss was measured on the steaks evaluated by sensory panelists, whereas PJP and
FE were measured on a steak cooked at a different time and used only for cooked
objective measurements. Regression analysis indicated TI was explained (P < 0.05) by
the equation: TI = -11.46 + 2.91 × PJP (R2 = 0.48). The equation TS = -18.10 + 2.94 ×
PJP explained 45% of the variation in TS (P < 0.05) and CJ was predicted by the
equation CJ = 31.21 + 1.50 × PJP (R2 = 0.20).

Texas Tech University, Loni Woolley, December 2014
vi
LIST OF TABLES
3.1 Least squares means for beef grading measures of carcasses of
varying fat level and quality treatments .........................................48
3.2 Demographic characteristics of consumers (n = 252) who
participated in consumer sensory panels........................................49
3.3 Fresh beef steak purchasing motivators of consumers (n = 252)
who participated in consumer sensory panel .................................50
3.4 Least squares means for consumer ratings of the palatability traits
of grilled beef strip loin steaks of varying quality
treatments .......................................................................................51
3.5 Percentage of beef strip steaks of varying quality treatment rated as
acceptable for juiciness, tenderness, flavor, and overall
liking by consumers (n = 252) .......................................................52
3.6 Percentage of beef strip steaks of varying quality treatments rated
at different perceived quality levels by consumer panelists
(n = 252) .........................................................................................53
3.7 Least squares means for consumer ratings of grilled beef strip loin
steaks cooked to three degrees of doneness ...................................54
3.8 Percentage of grilled beef strip loin steaks cooked to three degrees
of doneness rated as acceptable for juiciness, tenderness,
flavor, and overall liking by consumers (n = 252) .........................55
3.9 Percentage of grilled beef strip loin steaks cooked to three degrees
of doneness rated at different perceived quality levels by
consumer panelists (n = 252) .........................................................56
3.10 Interaction (Initial Juiciness; P = 0.0017, Sustained Juiciness; P =
0.0324) between degree of doneness and quality treatment
of least squares means for trained sensory ratings of the
palatability traits of grilled beef strip loin steaks of varying
quality treatments ...........................................................................57
3.11 Least squares means for trained sensory panel ratings of the
palatability traits of grilled beef strip loin steaks of varying
quality treatments ...........................................................................58
3.12 Least squares means for trained sensory panel ratings of grilled
beef strip loin steaks cooked to three degrees of doneness ............59
3.13 Pearson correlation coefficients for sensory scores for beef strip
steaks varying in fat and quality treatment ....................................60

Texas Tech University, Loni Woolley, December 2014
vii
4.1 Interaction (P = 0.0406) between degree of doneness and quality
treatment of least squares means for Slice Shear Force of
grilled beef strip loin steaks ...........................................................90
4.2 Least squares means for color, proximate and pH analysis of raw
beef strip loin steaks of varying quality treatments .......................91
4.3 Least squares means for objective juiciness analyses of raw beef
strip loin steaks of varying quality treatments ...............................92
4.4 Least squares means for objective analyses of cooked beef strip
loin steaks of varying quality treatments .......................................93
4.5 Least squares means for objective analyses of grilled beef strip loin
steaks cooked to three degrees of doneness ...................................94
4.6 Interaction (P = 0.0453) between degree of doneness and quality
treatment of least squares means for Carver Press total
circumference of grilled beef strip loin steaks ...............................95
4.7 Pearson correlation coefficients for cooked objective
measurements, raw objective measurements, proximate and
color data for beef strip steaks varying in fat and quality
treatment. ................................................................................. 96-97
4.8 Simple linear regression equations for predicting consumer sensory
panel juiciness scores for beef strip steaks varying in fat
and quality treatment......................................................................98
4.9 Simple linear regression equations for predicting trained sensory
panel initial juiciness scores for beef strip steaks varying in
fat and quality treatment ................................................................99
4.10 Simple linear regression equations for predicting trained sensory
panel sustained juiciness scores for beef strip steaks
varying in fat and quality treatment .............................................100

Texas Tech University, Loni Woolley, December 2014
viii
LIST OF FIGURES
4.1 Location of Pressed Juice Percentage (PJP) slice removal and PJP
sample removal ............................................................................101
4.2 Regression equation for predicting consumer sensory juiciness
scores for beef strip steaks by pressed juice percentage ..............102
4.3 Regression equation for predicting trained sensory panel initial
juiciness scores for beef strip steaks by pressed juice
percentage ....................................................................................103
4.4 Regression equation for predicting trained sensory panel sustained
juiciness scores for beef strip steaks by pressed juice
percentage. ...................................................................................104
4.5 Regression equation for predicting consumer sensory tenderness
scores for beef strip steaks by Slice Shear Force .........................105
4.6 Regression equation for predicting trained sensory panel initial
tenderness scores for beef strip steaks by Slice Shear Force .......106
4.7 Regression equation for predicting trained sensory panel sustained
tenderness scores for beef strip steaks by Slice Shear Force .......107
4.8 Probability of a sample being rated as acceptable for juiciness by
consumers based on pressed juice percentage .............................108

Texas Tech University, Loni Woolley, December 2014
1
CHAPTER I
INTRODUCTION
Overall beef palatability and eating satisfaction can be attributed to three factors:
tenderness, juiciness, and flavor. Of these three factors, tenderness has been identified as
the most important (Savell et al., 1987; Miller et al., 1995a; Savell et al., 1999). Beef
tenderness was identified as one of the most important quality challenges facing the beef
industry by the first three Beef Quality Audits conducted in 1991, 1995, and 2000 (Smith
et al., 1992; Boleman et al., 1998; McKenna et al., 2002). As a result, much industry
research over the past 20 years has focused on tenderness improvement. Results of the
most recent Beef Tenderness survey showed that over 94% of beef from the rib and loin
in foodservice and at the retail level were classified as tender or very tender (Guelker,
2013). With such a large portion of the retail beef supply classified as tender, the
importance of juiciness and flavor to the consumer eating experience is magnified.
Numerous recent studies have evaluated the contribution and importance of flavor to beef
palatability (Brooks et al., 2012; Miller and Kerth, 2012; O'Quinn et al., 2012b).
However, studies evaluating the contribution of juiciness to beef palatability are limited.
If meat is consistently tender and without off-flavors, juiciness becomes the most
important determinant of beef palatability (Winger and Hagyard, 1994).
Several previous studies determined enhancement of beef as a means to increase
beef juiciness and overall eating experience. Beef steak enhancement resulted in a
significant increase in consumer tenderness, juiciness, flavor, overall like, and overall
acceptability (Brooks et al., 2010). Pietrasik and Janz (2009) and Robbins et al. (2003)

Texas Tech University, Loni Woolley, December 2014
2
also reported a significantly more tender, juicy, salty, and increased overall eating
experience for enhanced beef samples when compared to non-injected samples. In
today’s market, with increased beef prices and shorter cattle supplies, enhancement offers
a significant opportunity to improve the marketability and palatability of lower quality
beef.
Subjective taste panel juiciness scores have been shown to be correlated with
overall palatability scores (r = 0.73 to 0.89), indicating increased overall palatability
scores with increased juiciness ratings (Thompson, 2004; O'Quinn et al., 2012a; Emerson
et al., 2013). However, consumers often generalize and consequently misevaluate sensory
traits due to a favorable evaluation of another trait, termed the halo effect (Roeber et al.,
2000). Thus, consumers are more likely to rate juiciness as desirable if tenderness or
overall liking traits were also desirable. Without a reliable objective measure of juiciness,
this interaction of traits is difficult to quantify and study.
Two methods for instrumental tenderness determination are commonly used in the
beef industry; Warner-Bratzler shear force and slice shear force (SSF) determination. Of
the two methods, SSF utilizes a warm sample for tenderness determination. Moreover,
this method uses a single, 1-cm thick slice from the lateral portion of a steak for testing.
Because of this, the remaining steak portions are available for use in other procedures,
including instrumental juiciness determination.
Juiciness is defined as the amount of moisture squeezed out of a piece of meat by
a few gentle chews (Ritchey and Hostetler, 1964). Compression-based methods have
been shown to be highly correlated with sensory-panel juiciness scores of commercial

Texas Tech University, Loni Woolley, December 2014
3
frankfurters (r = 0.92) (Lee and Patel, 1984) and beef rib and loin cuts (r = 0.92) (Tannor
et al., 1943). This study was conducted to develop a similar compression-based
methodology to quantify the amount of moisture lost from a steak sample during
compression as an indicator of juiciness by utilizing the warm steak sample left after SSF
tenderness testing, allowing for both an objective tenderness and juiciness score to be
determined from a single steak sample.

Texas Tech University, Loni Woolley, December 2014
4
CHAPTER II
REVIEW OF LITERATURE
Importance of beef juiciness
Overall beef palatability and eating satisfaction can be attributed to three factors:
tenderness, juiciness, and flavor. Of these three factors, tenderness has been identified as
the most important (Savell et al., 1987; Miller et al., 1995a; Savell et al., 1999). Beef
tenderness was identified as one of the most important quality challenges facing the beef
industry by the first three Beef Quality Audits conducted in 1991, 1995, and 2000 (Smith
et al., 1992; Boleman et al., 1998; McKenna et al., 2002). As a result, much industry
research over the past 20 years has focused on tenderness improvement. Results of the
most recent Beef Tenderness survey showed that over 94% of beef from the rib and loin
in foodservice and at the retail level were classified as tender or very tender (Guelker,
2013). With such a large portion of the retail beef supply classified as tender, the
importance of juiciness and flavor to the consumer eating experience is magnified.
Numerous recent studies have evaluated the contribution and importance of flavor to beef
palatability (Brooks et al., 2012; Miller and Kerth, 2012; O'Quinn et al., 2012b).
However, studies evaluating the contribution of juiciness to beef palatability are limited.
Juiciness defined
Juiciness is defined as the amount of moisture squeezed out of a piece of meat by
a few gentle chews (Ritchey and Hostetler, 1964). Sensory juiciness can be broken down

Texas Tech University, Loni Woolley, December 2014
5
into two parts: initial wetness and sustained juiciness. Initial juiciness is the wetness
during the first few chews produced by a rapid release of meat juices, and sustained
juiciness is caused by fat in the sample that causes a slow release of saliva after continued
mastication (Bratzler, 1971). The principle sources of beef juiciness reside in the water
and intramuscular lipids. When heated and masticated, the broth then promotes saliva
production. Therefore, juiciness has been attributed to the flow of juices from the actual
meat and the moisture produced by saliva in the mouth during mastication (Gullett et al.,
1984; Winger and Hagyard, 1994). Consequently, there is evident difficulty in adequately
evaluating beef juiciness because variation in the physiological factors of the panelists
often can affect the overall juiciness assessment (Winger and Hagyard, 1994).
Physiological events of beef juiciness evaluation
Since beef juiciness is a combination of what a panelist might perceive is juicy
and the application of force to produce the juice, it becomes a complex artwork when
trying to test the sensory experience. Christensen (1984) reviewed the perceptual and
physical perspectives during the sensory experience regarding texture and juiciness
testing. The review finds attempts to objectively measure juiciness on raw or cooked
meat without imitating the mastication process difficult and of little success (Winger and
Hagyard, 1994). One model worth noting is a three-dimensional model of juiciness
involving time of chewing in the mouth, the degree of food structure or size and the
degree of lubrication (Winger and Hagyard, 1994). Before food can be swallowed, the
degree of food structure must be below a certain level and the food must be lubricated

Texas Tech University, Loni Woolley, December 2014
6
above a certain level (Winger and Hagyard, 1994). The model finds juicy steak to be
lubricated quickly, but the time before swallowing is slightly increased due to difficulty
in reduction of degree of structure (Winger and Hagyard, 1994).
Sensory evaluation of beef juiciness
The relationship between subjective and objective measures of beef juiciness has
been poorly understood for years (Winger and Hagyard, 1994). Therefore, sensory testing
has been the predominant determinant of beef juiciness. Typically, consumers expect
meat that is highly marbled and tender to also be juicy. This could potentially be the
reason beef juiciness is the least studied of the palatability traits important to consumers.
Subjective taste panel juiciness scores have been shown to be correlated with
overall palatability scores (r = 0.73 to 0.89), indicating increased overall palatability
scores with increased juiciness ratings (Thompson, 2004; O'Quinn et al., 2012a; Emerson
et al., 2013). However, consumers often generalize and consequently misevaluate sensory
traits due to a favorable evaluation of another trait, termed the halo effect (Roeber et al.,
2000). Carpenter (1962) suggested that the lubricating properties of fat can create a
sensation of tenderness. This lubrication theory allows a perceived tenderness advantage
when meat samples continuously release fat and maintain juiciness during chewing.
Therefore, as intramuscular fat is solubilized into juice, marbling can indirectly have a
positive contribution to tenderness (Emerson et al., 2013). Thus, consumers are more
likely to rate juiciness as desirable if tenderness or overall liking traits were also
desirable. Understanding beef juiciness is of great importance, as it can dictate the

Texas Tech University, Loni Woolley, December 2014
7
perception of tenderness, which has previously been identified as the most important
palatability trait to consumers (Savell et al., 1987; Miller et al., 1995a; Savell et al., 1999;
Killinger et al., 2004). Without a reliable objective measure of beef juiciness, this
interaction of traits is difficult to quantify and study. The ability of consumers to evaluate
varying levels of juiciness in beef steaks is needed to establish an objective method to
measure the value of juiciness in beef steaks.
Muscle ultrastructure related to beef juiciness
Muscle is comprised of approximately 75% water, and the amount of water is
inversely related to amount of fat in the muscle (Juarez et al., 2012). The majority of the
water is entrapped inside the cell, more specifically inside myofibrils, between
myofibrils, and between myofibrils and the sarcolemma; however, some water is located
in the extracellular space (Offer and Cousins, 1992; Juarez et al., 2012). Only a small
percentage of water is bound to muscle proteins, as most is held within the structure of
the myofibrils (Offer and Knight, 1988; Juarez et al., 2012). Changes in the spatial
relationship within the muscle due to uptake of water through swelling of the myofibrillar
network can increase water holding capacity (Offer and Knight, 1988; Juarez et al.,
2012).

Texas Tech University, Loni Woolley, December 2014
8
Factors affecting beef juiciness
Previous work has shown the factors that have the greatest effect on beef juiciness
include: ultimate pH, fat content, enhancement level, cooking method, and degree of
doneness (Montgomery and Leheska, 2008).
Endpoint temperature or degree of doneness plays an important role in consumer
beef eating experience (Cox et al., 1997). With higher degrees of doneness, there is more
opportunity for cook loss and a reduction in juiciness. Honikel (1998) described cook loss
as a means of measuring WHC of meat. Cooking loss depends on raw meat quality,
endpoint temperature and cooking method (Aaslyng et al., 2003). During heating, water
is lost as temperature increases. Denaturation of meat proteins causes structural changes
to cell membranes of muscle fibers, along with shrinkage of muscle fibers and connective
tissue (Honikel, 1998). Cooking losses due to increased internal temperature are known
to be inversely related to juiciness (Ackerman et al., 1981; Gundavarapu et al., 1998;
Aaslyng et al., 2003). Beef cooked to higher DOD has previously been associated with
reduced palatability scores by sensory panelists (Cross et al., 1976; Luchak et al., 1998;
Lorenzen et al., 1999; Shackelford et al., 2001). Thus, efforts to improve beef steak
juiciness can be diminished if not prepared correctly in the home or restaurant.
Additionally, as DOD increases from rare to well-done, the fat content of the
sample plays a larger role in juiciness perception. At rare, low fat samples (i.e. Standard)
might have a similar eating experience to steaks with a higher fat content due to the
additional moisture content in the sample. However, when a low fat sample is cooked to
well-done, the moisture is cooked out, and it has little fat to allow any perceived

Texas Tech University, Loni Woolley, December 2014
9
juiciness. When cooked to higher degrees of doneness, the importance of USDA quality
grade to juiciness is magnified (Emerson et al. 2013).
Not only is juiciness affected by increased internal endpoint temperature, but
tenderness has also been shown to decrease as DOD increases (Cover et al., 1962; Cross
et al., 1976; Wheeler et al., 1999). Moreover, 64% of consumers cook beef from medium
to very well-done (Branson et al., 1986). Consumers wanting a more tender, juicier eating
experience should cook retail beef cuts to a lower internal temperature to prevent
excessive toughening and moisture loss.
The poultry and pork industries have used enhancement as a means to improve
overall quality and reduce variation in eating experience for several years. Reports have
shown injected products exhibited noteworthy improvements in cook loss and mechanical
shear force as well as juiciness, flavor, and tenderness measured by taste panels (Vote et
al., 2000; Robbins et al., 2003; Pietrasik and Shand, 2005; Stetzer et al., 2008; Pietrasik
and Janz, 2009).
Although fat has an indirect influence on sensory juiciness, water remaining in the
cooked product is the main contributor to the sensation of beef juiciness (Aberle et al.,
2001). Relative fat-free moisture content of meat is fairly uniform (Aberle et al., 2001)
thus in order to increase juiciness, additional moisture must come from an outside source,
such as intramuscular fat content or enhancement.
Water, salt, and phosphates are non-meat ingredients that can be used to improve
juiciness, tenderness, flavor, color, shelf-life, and water-holding capacity. Wicklund et al.
(2005) and Grobbel et al. (2008) found enhanced samples to be significantly greater in

Texas Tech University, Loni Woolley, December 2014
10
pH than non-enhanced samples. Alkaline phosphates are used in enhancement solutions
to increase water holding capacity and reduce cook yield (Pietrasik and Janz, 2009).
Phosphates increase the number of negative charges on meat proteins and consequently
increase the ability to bind water. Increased water content is responsible for the
subsequent increase in steak tenderness and juiciness (Vote et al., 2000; Wicklund et al.,
2005).
Alkaline phosphates can have an even greater positive effect when used in
combination with sodium chloride (Pietrasik and Janz, 2009). Salt has been used as a
flavor enhancer in meat for centuries, however it has more recently also been used to
increase water holding capacity and decrease cook loss in processed meat products.
Sodium chloride increases water holding capacity. Through swelling of proteins in the
muscle, sodium chloride thus increases the ability to bind water.
Shelf-life and color can be impacted by enhancement either negatively or
positively. The increase in pH caused by alkaline phosphate enhancement can affect color
of lean tissue. Enhanced samples have previously been shown to have lower L*
(indicating enhancement caused some “darkening”), a* and b* values than non-enhanced
beef (Wicklund et al., 2005; Stetzer et al., 2008; Pietrasik and Janz, 2009). Baublits et al.
(2006) also reported lower L* and b* values in enhanced samples when instrumental
color was measured over an 8 day period.
Steak enhancement has resulted in a significant increase in consumer tenderness,
juiciness, flavor, overall like, and overall acceptability (Brooks et al., 2010).
Additionally, consumers have rated enhanced steaks as more flavorful when compared to

Texas Tech University, Loni Woolley, December 2014
11
non-enhanced steaks (Vote et al., 2000; Robbins et al., 2003). Pietrasik and Janz (2009)
and Robbins et al. (2003) also reported a significantly more tender, juicy, salty, and
increased overall acceptable eating experience for enhanced beef samples when
compared to non-injected samples. Also, enhanced steaks have been rated higher than
non-enhanced control steaks for tenderness, juiciness, and flavor by consumers when
enhanced with a CaCl2 enhancement solution (Miller et al., 1995b).
Studies have demonstrated trained sensory panelists rate enhanced steaks higher
in juiciness than non-enhanced steaks (Kerth et al., 1995; Wicklund et al., 2005; Baublits
et al., 2006; Grobbel et al., 2008; Stetzer et al., 2008). Furthermore, panelists have
previously rated enhanced beef samples more tender (Wicklund et al., 2005; Baublits et
al., 2006; Stetzer et al., 2008), flavorful (Stetzer et al., 2008), and saltier than non-
enhanced samples (Baublits et al., 2006). Also, non-enhanced controls have been shown
to have a more intense beef flavor, but were tougher than enhanced steaks (Lawrence et
al., 2003).
Marbling in beef is used in the USDA quality grading system and is a commonly
used factor to visually assess palatability expectations by consumers. Marbling is a
contributing factor to beef juiciness. When heated, melted intramuscular fat becomes
translocated along bands of perimysial connective tissue (Aberle et al., 2001). It has been
discussed that, during cooking, distribution of lipid throughout the muscle fiber forms a
uniform shield that blocks some moisture loss, thus indirectly contributing to the
juiciness of the steak (Aberle et al., 2001).

Texas Tech University, Loni Woolley, December 2014
12
It is obvious fat plays a role in perceived or sustained juiciness of beef by
contributing to flavor and stimulating the flow of saliva (Gaddis et al., 1950; Winger and
Hagyard, 1994). However, in bland flavored meats, juiciness has been considered as the
most important attribute in determining overall acceptability (Gullett et al., 1984; Winger
and Hagyard, 1994).
As marbling increases, palatability traits rated by consumers, such as flavor,
juiciness and tenderness also increase (Smith et al., 1985; Parrish et al., 1991; Lorenzen
et al., 1999; O'Quinn et al., 2012a). More specifically, juiciness scores for beef
longissimus dorsi steaks increased as marbling increased (Breidenstein et al., 1968).
Similarly, top loin steaks with a Moderate degree of marbling were juicier and more
flavorful than Modest, Small, and Slight steaks (Smith and Crouse, 1984; Lorenzen et al.,
2003). Additionally, it has been reported that steaks of higher marbling scores and similar
tenderness values tended to be juicier, more flavorful, and more desirable in overall
acceptability than low marbled steaks when fed to consumers (Killinger et al., 2004,
Corbin et al., 2015). Numerous previous studies have reported greater overall
acceptability in high marbled steaks when evaluated by consumers (Savell et al., 1987;
Savell and Cross, 1989; Neely et al., 1998).
Regarding the effect of intramuscular fat content on trained panel juiciness,
Emerson et al. (2013) reported increased sensory panel juiciness ratings with increased
marbling level from Select to Prime; however in that study Select and Standard received
similar ratings for juiciness. Also, it was reported that Low Choice strip steaks rate higher
for initial juiciness, initial tenderness, and sustained tenderness than Select steaks (Miller

Texas Tech University, Loni Woolley, December 2014
13
et al., 1997). Emerson et al. (2013) found a strong positive correlation between
instrument marbling score and trained panel ratings for juiciness (r = 0.67).
Objective measures of beef juiciness and tenderness
It is intuitively apparent that variability in WHC is related to observed differences
in beef juiciness; however, many studies have produced varied results when the two
factors were measured simultaneously (Honikel, 1998; Pearce et al., 2011). Water
holding capacity is the ability to retain natural moisture in the muscle when subjected to
external forces such as compression or centrifugation. Many methods used to measure
WHC involve gravity, centrifugation, and external force.
Honikel (1998) described drip loss and cook loss to be two measurements of
WHC of meat. Lateral shrinkage of myofibrils postmortem can result in expulsion of
water into the extracellular space, further termed drip loss (Juarez et al., 2012). Drip loss
is an important measurement to ensure appealing retail display of meat cuts. Age, sex,
diet, pre-slaughter stress, slaughter methods, storage time, temperature, and meat
properties such as pH, intramuscular fat, and moisture contents can influence drip loss in
raw beef (Mitsumoto et al., 1995). More pork than beef, research has been done in the
area of purge and drip loss, but any loss of liquid post-mortem can affect the physical
properties of the meat. Many previous authors have measured drip loss using EZ-Driploss
tubes (Aaslyng et al., 2003; Montgomery et al., 2004; Correa et al., 2007). Other studies
have measured drip loss by gravity (Honikel, 1998; Van Oeckel et al., 1999), using a
filter paper method (Kauffman et al., 1986; Van Oeckel et al., 1999) or after time in the

Texas Tech University, Loni Woolley, December 2014
14
retail case (Kauffman et al., 1986; Mitsumoto et al., 1995). Also, drip loss has most
commonly been measured 24 to 48 h postmortem. Previous work has shown a poor
relationship between beef drip loss and sensory juiciness (Perry et al., 2001). It would be
predicted that drip loss would be negatively correlated to juiciness, but, in a study on
pork LM, drip loss using the EZ-driploss tubes were slightly positively correlated to
juiciness (Aaslyng et al., 2003).
Centrifugation can also be used to measure WHC by measuring the liquid
squeezed out of a protein system with centrifugal force (Jauregui et al., 1981). Shults et
al. (1972) used a method to measure meat shrinkage and found salt and phosphates
decreased shrinkage. Hermansson and Åkesson (1975) used a similar technique and
found no differences in expressible moisture in raw samples.
An additional centrifugation method has been used to measure water binding
ability or protein swelling. Phosphates can affect protein swelling through increased pH
(Shults et al., 1972). Moreover, NaCl inclusion can affect protein swelling due to an
initial increase in swelling due to Na+ replacement of Ca
++ on the meat proteins (Shults et
al., 1972).
Warner-Bratzler shear force (WBSF) and slice shear force (SSF) are the two
methods for instrumental tenderness determination generally used in the beef industry
(Derington et al., 2011). The SSF method of tenderness analysis, which is a faster
alternative to WBSF, was developed by Shackelford et al. (1999). SSF could be used as a
rapid method to guarantee tenderness in the industry using a cooked steak (Derington et
al., 2011); however, has not been implemented due to cost. Currently, there is not an

Texas Tech University, Loni Woolley, December 2014
15
industry standard to quantify beef steak juiciness similar to WBSF and SSF for
tenderness. Of the two methods, SSF utilizes a warm sample for tenderness
determination. Moreover, this method uses a single, 1-cm thick slice from the lateral
portion of a steak for testing. Because of this, the remaining steak portions are available
for use in other procedures, including instrumental juiciness determination.
Relationships between objective tenderness and juiciness measurement methods and
sensory panel ratings
The majority of previous studies have been conducted using WBSF as a means to
forecast sensory panel tenderness scores. However, WBSF and SSF have been shown to
be closely related. Derington et al. (2011) and Shackelford et al. (1999) reported strong
relationships (r = 0.64, 0.80, respectively), between lateral SSF and average WBSF.
Additionally, Caine et al. (2003) reported trained sensory panel evaluations of beef rib
steak initial tenderness and overall tenderness was negatively correlated with WBSF (r =
-0.61 and -0.60). Consumer tenderness of top loin steaks evaluated “in-home,” was
weakly correlated with WBSF (r = 0.26) (Lorenzen et al., 2003). However, a higher
correlation (r = 0.63) between consumer tenderness and WBSF has been documented
(Platter et al., 2003). Additionally, SSF has a strong correlation (r = 0.72) with consumer
tenderness ratings (Shackelford et al., 2001). Furthermore, trained sensory panel ratings
were more strongly correlated with SSF (r = 0.82) than with WBSF (r = 0.77)
(Shackelford et al., 1999).
As noted, most previous research has focused on measuring WHC using a
refrigerated sample (Wierbicki and Deatherage, 1958; Boakye and Mittal, 1993;

Texas Tech University, Loni Woolley, December 2014
16
Montgomery et al., 2004). Since sensory panelists evaluate juiciness of samples after
cooking, it is more reasonable to objectively test samples similarly (Van Oeckel et al.,
1999). Cooking causes a number of chemical and physical alterations which can change
perception of juiciness. A rapid filter paper press method that destroys the microstructure
of the heated sample, similar to mastication, should be most ideal for predicting true
juiciness (Trout, 1988). Objective measures of juiciness using sensory panelists can be
costly, laborious and invasive. Past juiciness research has focused on the WHC of meat,
and many have reported filter paper press methods to be most successful for estimation.
Different types of press methods using the Carver hydraulic press apparatus, or similar,
have been widely adapted from previous studies dating back to the 1930’s (Childs and
Baldelli, 1934). Compression-based methods have been used on a variety of meat
products and have been highly correlated (r = 0.92 to 0.98) with sensory-panel juiciness
scores of commercial frankfurters, beef rib and loin cuts, and microwave cooked shrimp
(Tannor et al., 1943; Lee and Patel, 1984; Gundavarapu et al., 1998). Ackerman et al.
(1981) found a high correlation (r = 0.95) between untrained panelists juiciness scores of
experimental frankfurters and pressed juice percentage, but a lower correlation (r = 0.61)
for commercial frankfurters. Lee and Patel (1984) were some of the first authors to use a
more technically advanced, Instron-based press method to produce high correlation
coefficients for sensory juiciness scores of cooked frankfurters. In beef products, Gaddis
et al. (1950) found no significant correlation between press fluid percentage and quantity
of sensory juice of beef rib steaks. Additionally, Gullett et al. (1984) found an
insignificant relationship between press fluid and initial juiciness of beef longissimus

Texas Tech University, Loni Woolley, December 2014
17
dorsi roasts, but significant relationships in semitendinosus muscle (r = 0.35, 0.48) in two
separate beef studies. Zhang et al. (1993) produced a table of press methods used by
others, but all varied in meat type, mass of sample, force, compression time, and filter
paper used.
Relationships among palatability traits
Tenderness and juiciness are associated to a very high degree. It is often noted
that the more tender the meat, the more readily juices are emitted and the juicier the meat
is perceived (Bratzler, 1971). Emerson et al. (2013) and Killinger et al. (2004) reported
tenderness (r = 0.90, 0.78) and juiciness (r = 0.84, 0.76) were very closely correlated with
overall sensory experience, respectively. Likewise, Shackelford et al. (2001) found
tenderness and juiciness to be strongly correlated (r = 0.79).
Prediction equations for sensory panel ratings
Currently the beef industry does not have an objective measure of steak juiciness
that is reliable for predicting consumer juiciness scores. Compression-based methods
have been practiced, but few have measured juiciness of beef LM using a cooked sample
and none have been correlated to or were used to develop prediction equations for
consumer juiciness.
Gundavarapu et al. (1998) reported press juice percentage of cooked shrimp
explained 95% of consumer juiciness scores, and cook loss only explained 56% of
consumer juiciness scores.

Texas Tech University, Loni Woolley, December 2014
18
Prediction equations using WBSF have been shown to account for 37% and 36%
of the variation of trained sensory scores in initial tenderness and overall tenderness
(Caine et al., 2003). Accounting for more variation in trained panel overall tenderness
ratings, Shackelford et al. (1995) reported an R2 of 0.73 for WBSF of LM steaks. SSF,
however, has been shown to explain 85% of variation in untrained laboratory consumer
panel tenderness ratings (Wheeler et al., 2004).
Untrained or less-trained panelists have been shown to detect changes in texture
traits such as tenderness more similarly to trained panelists, whereas sensory traits such
as juiciness and flavor are more difficult for untrained panelists discern (Chambers et al.,
1981).
Implications
In today’s market with increased beef prices, the need for delivering a favorable eating
experience to consumers is higher than ever. Consumers who choose to purchase beef
over more inexpensive proteins, expect a tender, juicy, flavorful eating experience and
the beef must deliver on these expectations. Recently, USDA AMS published tenderness
standards for “Certified Tender” and “Certified Very Tender” marketing claims based on
WBSF and SSF values (ASTM, 2011.). Additionally, U.S. beef retailers, including
Safeway, are requiring tenderness certification. To date, no such method for testing
juiciness has been available.

Texas Tech University, Loni Woolley, December 2014
19
References
Aaslyng, M. D., C. Bejerholm, P. Ertbjerg, H. C. Bertram, and H. J. Andersen. 2003.
Cooking loss and juiciness of pork in relation to raw meat quality and cooking
procedure. Food Qual. Prefer. 14: 277-288.
Aberle, E. D., J. C. Forrest, D. E. Gerrard, and E. W. Mills. 2001. Principles of Meat
Science. 4th ed. Kendall/Hunt Publishing Company, Dubuque, IA.
Ackerman, S. A., C. E. Cohen, C. Swift, and R. Benedict. 1981. Evaluation of the press
method for “frankfurter” juiciness estimation. Fleischwirtsch 61: 1169-1170.
ASTM. 2011. ASTM F 2925-11. Standard specification for tenderness marketing claims
associated with meat cuts derived from beef.
http://enterprise.astm.org/filtrexx40.cgi?+REDLINE_PAGES/F2925.htm
Accessed May 20, 2014
Baublits, R. T., F. W. Pohlman, A. H. Brown Jr, E. J. Yancey, and Z. B. Johnson. 2006.
Impact of muscle type and sodium chloride concentration on the quality, sensory,
and instrumental color characteristics of solution enhanced whole-muscle beef.
Meat Sci. 72: 704-712.
Boakye, K., and G. S. Mittal. 1993. Changes in pH and water holding properties of
Longissimus dorsi muscle during beef ageing. Meat Sci. 34: 335-349.
Boleman, S. L., S. J. Boleman, W. W. Morgan, D. S. Hale, D. B. Griffin, J. W. Savell, R.
P. Ames, M. T. Smith, J. D. Tatum, T. G. Field, G. C. Smith, B. A. Gardner, J. B.
Morgan, S. L. Northcutt, H. G. Dolezal, D. R. Gill, and F. K. Ray. 1998. National
Beef Quality Audit-1995: survey of producer-related defects and carcass quality
and quantity attributes. J. Anim. Sci. 76: 96-103.
Branson, R. E., H. R. Cross, J. W. Savell, G. C. Smith, and R. A. Edwards. 1986.
Marketing implications from the national consumer beef study. West. J. Agric.
Econ 11: 82-91.
Bratzler, L. J. 1971. Palatability factors and evaluations The Science of Meat and Meat
Products. W. H. Freeman and Company, San Francisco, Calif.
Breidenstein, B. B., C. C. Cooper, R. G. Cassens, G. Evans, and R. W. Bray. 1968.
Influence of marbling and maturity on the palatability of beef muscle. I. chemical
and organoleptic considerations. J. Anim. Sci. 27: 1532-1541.

Texas Tech University, Loni Woolley, December 2014
20
Brooks, J. C., J. F. Legako, T. T. N. Dinh, and M. F. Miller. 2012. Prediction of beef
flavor by precursor and volatile compounds – project summary. National
Cattlemen's Beef Association, Centennial, CO.
Brooks, J. C., J. M. Mehaffey, J. A. Collins, H. R. Rogers, J. Legako, B. J. Johnson, T.
Lawrence, D. M. Allen, M. N. Streeter, W. T. Nichols, J. P. Hutcheson, D. A.
Yates, and M. F. Miller. 2010. Moisture enhancement and blade tenderization
effects on the shear force and palatability of strip loin steaks from beef cattle fed
zilpaterol hydrochloride. J. Anim. Sci. 88: 1809-1816.
Caine, W. R., J. L. Aalhus, D. R. Best, M. E. R. Dugan, and L. E. Jeremiah. 2003.
Relationship of texture profile analysis and Warner-Bratzler shear force with
sensory characteristics of beef rib steaks. Meat Sci. 64: 333-339.
Carpenter, Z. L. 1962. The histolological and physical characteristics of pork muscle and
their relationship to quality, University of Wisconsin, Madison.
Chambers, E., J. A. Bowers, and A. D. Dayton. 1981. Statistical designs and panel
training/experience for sensory analysis. J. Food Sci. 46: 1902-1906.
Childs, A. M., and M. Baldelli. 1934. Press fluid from heated beef muscle. J. Agr. Res
48: 1127.
Christensen, C. M. 1984. Food Texture Perception. In: E. M. M. C.O. Chichester and B.
S. Schweigert (eds.) Adv. Food Res. No. Volume 29. p 159-199. Academic Press.
Corbin, C. H., T. G. O'Quinn, A. J. Garmyn, J. F. Legako, M. R. Hunt, T. T. N. Dinh, R.
J. Rathmann, J. C. Brooks, and M. F. Miller. 2015. Sensory evaluation of tender
beef strip loin steaks of varying marbling levels and quality treatments. Meat Sci.
100: 24-31.
Correa, J. A., S. Méthot, and L. Faucitano. 2007. A modified meat juice container (EZ-
driploss) procedure for a more reliable assessment of drip loss and related quality
changes in pork meat. J. Mus. Foods 18: 67-77.
Cover, S., R. L. Hostetler, and S. J. Ritchey. 1962. Tenderness of beef. IV relations of
shear force and fiber extensibility to juiciness and six components of tenderness.
J. Food Sci. 27: 527-536.
Cox, R. J., J. M. Thompson, C. M. Cunial, S. Winter, and A. J. Gordon. 1997. The effect
of degree of doneness of beef steaks on consumer acceptability of meals in
restaurants. Meat Sci. 45: 75-85.

Texas Tech University, Loni Woolley, December 2014
21
Cross, H. R., M. S. Stanfield, and E. J. Koch. 1976. Beef palatability as affected by
cooking rate and final Internal temperature. J. Anim. Sci. 43: 114-121.
Derington, A. J., J. C. Brooks, A. J. Garmyn, L. D. Thompson, D. B. Wester, and M. F.
Miller. 2011. Relationships of slice shear force and Warner-Bratzler shear force
of beef strip loin steaks as related to the tenderness gradient of the strip loin. Meat
Sci. 88: 203-208.
Emerson, M. R., D. R. Woerner, K. E. Belk, and J. D. Tatum. 2013. Effectiveness of
USDA instrument-based marbling measurements for categorizing beef carcasses
according to differences in longissimus muscle sensory attributes. J. Anim. Sci.
91: 1024-1034.
Gaddis, A. M., O. G. Hankins, and R. L. Hiner. 1950. Relationships between the amount
and composition of press fluid, palatability, and other factors of meat. Food Tech.
4: 498-503.
Grobbel, J. P., M. E. Dikeman, M. C. Hunt, and G. A. Milliken. 2008. Effects of different
packaging atmospheres and injection-enhancement on beef tenderness, sensory
attributes, desmin degradation, and display color. J. Anim. Sci. 86: 2697-2710.
Guelker, M. R., A. N. Haneklaus, J. C. Brooks, C. C. Carr, R. J. Delmore, D. B. Griffin,
D. S. Hale, K. B. Harris, G. G. Mafi, D. D. Johnson, C. L. Lorenzen, R. J.
Maddock, J. N. Martin, R. K. Miller, C. R. Raines, D. L. VanOverbeke, L. L.
Vedral, B. E. Wasser, and J. W. Savell. 2013. National Beef Tenderness Survey–
2010: Warner-Bratzler shear force values and sensory panel ratings for beef
steaks from United States retail and food service establishments. J. Anim. Sci. 91:
1005-1014.
Gullett, E. A., D. L. Rowe, and R. J. Hines. 1984. Sensorial assessment of the eating
quality of meat. Canadian Institute of Food Science and Technology Journal 17:
229-236.
Gundavarapu, S., Y. C. Hung, and A. E. Reynolds. 1998. Consumer acceptance and
quality of microwave-cooked shrimp. J. Food Qual. 21: 71-84.
Hermansson, A. M., and C. Åkesson. 1975. Functional properties of added proteins
correlated with properties of meat systems. Effect of concentration and
temperature on water‐binding properties of model meat systems. J. Food Sci. 40:
595-602.
Honikel, K. O. 1998. Reference methods for the assessment of physical characteristics of
meat. Meat Sci. 49: 447-457.

Texas Tech University, Loni Woolley, December 2014
22
Jauregui, C. A., J. M. Regenstein, and R. C. Baker. 1981. A simple centrifugal method
for measuring expressible moisture, a water-binding property of muscle foods. J.
Food Sci. 46: 1271-1271.
Juarez, M., N. Aldai, O. Lopez-Campos, M. E. R. Dugan, B. Uttaro, and J. L. Aalhus.
2012. Beef texture and juiciness. Handbook of meat and meat processing: 177-
206.
Kauffman, R. G., G. Eikelenboom, P. G. van der Wal, G. Merkus, and M. Zaar. 1986.
The use of filter paper to estimate drip loss of porcine musculature. Meat Sci. 18:
191-200.
Kerth, C. R., M. F. Miller, and C. B. Ramsey. 1995. Improvement of beef tenderness and
quality traits with calcium chloride injection in beef loins 48 hours postmortem. J.
Anim. Sci. 73: 750-756.
Killinger, K. M., C. R. Calkins, W. J. Umberger, D. M. Feuz, and K. M. Eskridge. 2004.
Consumer sensory acceptance and value for beef steaks of similar tenderness, but
differing in marbling level. J. Anim. Sci. 82: 3294-3301.
Lawrence, T. E., M. E. Dikeman, M. C. Hunt, C. L. Kastner, and D. E. Johnson. 2003.
Staged injection marination with calcium lactate, phosphate and salt may improve
beef water-binding ability and palatability traits. Meat Sci. 65: 967-972.
Lee, C. M., and K. M. Patel. 1984. Analysis of juiciness of commercial frankfurters. J.
Texture Stud. 15: 67-73.
Lorenzen, C. L., R. K. Miller, J. F. Taylor, T. R. Neely, J. D. Tatum, J. W. Wise, M. J.
Buyck, J. O. Reagan, and J. W. Savell. 2003. Beef customer satisfaction: Trained
sensory panel ratings and Warner-Bratzler shear force values. J. Anim. Sci. 81:
143-149.
Lorenzen, C. L., T. R. Neely, R. K. Miller, J. D. Tatum, J. W. Wise, J. F. Taylor, M. J.
Buyck, J. O. Reagan, and J. W. Savell. 1999. Beef customer satisfaction: cooking
method and degree of doneness effects on the top loin steak. J. Anim. Sci. 77:
637-644.
Luchak, G. L., R. K. Miller, K. E. Belk, D. S. Hale, S. A. Michaelsen, D. D. Johnson, R.
L. West, F. W. Leak, H. R. Cross, and J. W. Savell. 1998. Determination of
sensory, chemical and cooking characteristics of retail beef cuts differing in
intramuscular and external fat. Meat Sci. 50: 55-72.

Texas Tech University, Loni Woolley, December 2014
23
McKenna, D. R., D. L. Roebert, P. K. Bates, T. B. Schmidt, D. S. Hale, D. B. Griffin, J.
W. Savell, J. C. Brooks, J. B. Morgan, T. H. Montgomery, K. E. Belk, and G. C.
Smith. 2002. National Beef Quality Audit-2000: survey of targeted cattle and
carcass characteristics related to quality, quantity, and value of fed steers and
heifers. J. Anim. Sci. 80: 1212-1222.
Miller, M. F., L. C. Hoover, K. D. Cook, A. L. Guerra, K. L. Huffman, K. S. Tinney, C.
B. Ramsey, H. C. Brittin, and L. M. Huffman. 1995a. Consumer acceptability of
beef steak tenderness in the home and restaurant. J. Food Sci. 60: 963-965.
Miller, M. F., K. L. Huffman, S. Y. Gilbert, L. L. Hamman, and C. B. Ramsey. 1995b.
Retail consumer acceptance of beef tenderized with calcium chloride. J. Anim.
Sci. 73: 2308-2314.
Miller, M. F., C. R. Kerth, J. W. Wise, J. L. Lansdell, J. E. Stowell, and C. B. Ramsey.
1997. Slaughter plant location, USDA quality grade, external fat thickness, and
aging time effects on sensory characteristics of beef loin strip steak. J. Anim. Sci.
75: 662-667.
Miller, R. K., and C. Kerth. 2012. Identification of compounds responsible for positive
beef flavor - project summary. National Cattlemen's Beef Association,
Centennial, CO.
Mitsumoto, M., R. N. Arnold, D. M. Schaefer, and R. G. Cassens. 1995. Dietary vitamin
E supplementation shifted weight loss from drip to cooking loss in fresh beef
longissimus during display. J. Anim. Sci. 73: 2289-2294.
Montgomery, J. L., M. B. King, J. G. Gentry, A. R. Barham, B. L. Barham, G. G. Hilton,
J. R. Blanton, R. L. Horst, M. L. Galyean, and K. J. Morrow. 2004. Supplemental
vitamin D3 concentration and biological type of steers. II. Tenderness, quality, and
residues of beef. J. Anim. Sci. 82: 2092-2104.
Montgomery, T. H., and J. M. Leheska. 2008. Effects of various management practices
on beef-eating quality.
Neely, T. R., C. L. Lorenzen, R. K. Miller, J. D. Tatum, J. W. Wise, J. F. Taylor, M. J.
Buyck, J. O. Reagan, and J. W. Savell. 1998. Beef customer satisfaction: role of
cut, USDA quality grade, and city on in-home consumer ratings. J. Anim. Sci. 76:
1027-1033.
O'Quinn, T. G., J. C. Brooks, R. J. Polkinghorne, A. J. Garmyn, B. J. Johnson, J. D.
Starkey, R. J. Rathmann, and M. F. Miller. 2012a. Consumer assessment of beef
strip loin steaks of varying fat levels. J. Anim. Sci. 90: 626-634.

Texas Tech University, Loni Woolley, December 2014
24
O'Quinn, T. G., J. D. Tatum, D. R. Woerner, K. E. Belk, S. L. Archibeque, and T. E.
Engle. 2012b. Identifying consumer preferences for specific beef flavor
characteristics - project summary.
Offer, G., and T. Cousins. 1992. The mechanism of drip production: Formation of two
compartments of extracellular space in muscle Post mortem. J. Sci. Food Agric.
58: 107-116.
Offer, G., and P. Knight. 1988. The structural basis of water-holding in meat Part 2: Drip
losses. Developments in meat science. Elsevier Science Publications, London.
Parrish, F. C., J. A. Boles, R. E. Rust, and D. G. Olson. 1991. Dry and wet aging effects
on palatability attributes of beef loin and rib steaks from three quality grades. J.
Food Sci. 56: 601-603.
Pearce, K. L., K. Rosenvold, H. J. Andersen, and D. L. Hopkins. 2011. Water distribution
and mobility in meat during the conversion of muscle to meat and ageing and the
impacts on fresh meat quality attributes — A review. Meat Sci. 89: 111-124.
Perry, D., J. M. Thompson, I. H. Hwang, A. Butchers, and A. F. Egan. 2001. Relationship
between objective measurements and taste panel assessment of beef quality. Aust.
J. Exp. Agric. 41: 981-989.
Pietrasik, Z., and J. Janz. 2009. Influence of freezing and thawing on the hydration
characteristics, quality, and consumer acceptance of whole muscle beef injected
with solutions of salt and phosphate. Meat Sci. 81: 523-532.
Pietrasik, Z., and P. J. Shand. 2005. Effects of mechanical treatments and moisture
enhancement on the processing characteristics and tenderness of beef
semimembranosus roasts. Meat Sci. 71: 498-505.
Platter, W. J., J. D. Tatum, K. E. Belk, P. L. Chapman, J. A. Scanga, and G. C. Smith.
2003. Relationships of consumer sensory ratings, marbling score, and shear force
value to consumer acceptance of beef strip loin steaks. J. Anim. Sci. 81: 2741-
2750.
Ritchey, S. J., and R. L. Hostetler. 1964. Relationships of free and bound water to
subjective scores for juiciness and softness and to changes in weight and
dimensions of steaks from two beef muscles during cooking. J. Food Sci. 29: 413-
419.
Robbins, K., J. Jensen, K. J. Ryan, C. Homco-Ryan, F. K. McKeith, and M. S. Brewer.
2003. Consumer attitudes towards beef and acceptability of enhanced beef. Meat
Sci. 65: 721-729.

Texas Tech University, Loni Woolley, December 2014
25
Roeber, D. L., R. C. Cannell, K. E. Belk, R. K. Miller, J. D. Tatum, and G. C. Smith.
2000. Implant strategies during feeding: impact on carcass grades and consumer
acceptability. J. Anim. Sci. 78: 1867-1874.
Savell, J. W. 2011. 2010/2011 National beef tenderness survey - executive summary.
National Cattlemen's Beef Association, Centennial, CO.
Savell, J. W., R. E. Branson, H. R. Cross, D. M. Stiffler, J. W. Wise, D. B. Griffin, and
G. C. Smith. 1987. National consumer retail beef study: palatability evaluations of
beef loin steaks that differed in marbling. J. Food Sci. 52: 517-519.
Savell, J. W., and H. R. Cross. 1989. The role of fat in the palatability of beef, pork, and
lamb Designing Foods: Animal Product Options in the Marketplace. National
Academy Press, Washington, D.C.
Savell, J. W., C. L. Lorenzen, T. R. Neely, R. K. Miller, J. D. Tatum, J. W. Wise, J. F.
Taylor, M. J. Buyck, and J. O. Reagan. 1999. Beef customer satisfaction: cooking
method and degree of doneness effects on the top sirloin steak. J. Anim. Sci. 77:
645-652.
Shackelford, S., T. Wheeler, and M. Koohmaraie. 1999. Evaluation of slice shear force as
an objective method of assessing beef longissimus tenderness. J. Anim. Sci. 77:
2693-2699.
Shackelford, S. D., T. L. Wheeler, and M. Koohmaraie. 1995. Relationship between shear
force and trained sensory panel tenderness ratings of 10 major muscles from Bos
indicus and Bos taurus cattle. J. Anim. Sci. 73: 3333-3340.
Shackelford, S. D., T. L. Wheeler, M. K. Meade, J. O. Reagan, B. L. Byrnes, and M.
Koohmaraie. 2001. Consumer impressions of Tender Select beef. J. Anim. Sci.
79: 2605-2614.
Shults, G. W., D. R. Russell, and E. Wierbicki. 1972. Effect of condensed phosphates on
pH, swelling and water-holding capacity of beef. J. Food Sci. 37: 860-864.
Smith, G. C., Z. L. Carpenter, H. R. Cross, C. E. Murphey, H. C. Abraham, J. W. Savell,
G. W. Davis, B. W. Berry, and F. C. Parrish Jr. 1985. Relationship of USDA
marbling groups to palatability of cooked beef. J. Food Qual. 7: 289-308.
Smith, G. C., J. W. Savell, R. P. Clayton, T. G. Field, D. B. Griffin, D. S. Hale, M. F.
Miller, T. H. Montgomery, J. B. Morgan, and J. D. Tatum. 1992. Improving the
consistency and competitiveness of beef. The Final Report of the National Beef
Quality Audit—1991. National Cattlemen’s Association, Englewood, CO: 1-237.

Texas Tech University, Loni Woolley, December 2014
26
Smith, S. B., and J. D. Crouse. 1984. Relative contributions of acetate, lactate and
glucose to lipogenesis in bovine intramuscular and subcutaneous adipose tissue.
The Journal of Nutrition 114: 792-800.
Stetzer, A. J., K. Cadwallader, T. K. Singh, F. K. McKeith, and M. S. Brewer. 2008.
Effect of enhancement and ageing on flavor and volatile compounds in various
beef muscles. Meat Sci. 79: 13-19.
Tannor, B., N. G. Clark, and O. G. Hankins. 1943. Mechanical determination of the
juiciness of meat. J. Agr. Research 66: 403-412.
Thompson, J. M. 2004. The effects of marbling on flavour and juiciness scores of cooked
beef, after adjusting to a constant tenderness. Aust. J. Exp. Agric. 44: 645-652.
Trout, G. R. 1988. Techniques for measuring water-binding capacity in muscle foods—A
review of methodology. Meat Sci. 23: 235-252.
Van Oeckel, M. J., N. Warnants, and C. V. Boucqué. 1999. Comparison of different
methods for measuring water holding capacity and juiciness of pork versus on-
line screening methods. Meat Sci. 51: 313-320.
Vote, D. J., W. J. Platter, J. D. Tatum, G. R. Schmidt, K. E. Belk, G. C. Smith, and N. C.
Speer. 2000. Injection of beef strip loins with solutions containing sodium
tripolyphosphate, sodium lactate, and sodium chloride to enhance palatability. J.
Anim. Sci. 78: 952-957.
Wheeler, T. L., S. D. Shackelford, and M. Koohmaraie. 1999. Tenderness classification
of beef: III. Effect of the interaction between end point temperature and
tenderness on Warner-Bratzler shear force of beef longissimus. J. Anim. Sci. 77:
400-407.
Wheeler, T. L., S. D. Shackelford, and M. Koohmaraie. 2004. The accuracy and
repeatability of untrained laboratory consumer panelists in detecting differences
in beef longissimus tenderness. J. Anim. Sci. 82: 557-562.
Wicklund, S. E., C. Homco-Ryan, K. J. Ryan, F. K. Mckeith, B. J. Mcfarlane, and M. S.
Brewer. 2005. Aging and enhancement effects on quality characteristics of beef
strip steaks. J. Food Sci. 70: S242-S248.
Wierbicki, E., and F. E. Deatherage. 1958. Water content of meats, determination of
water-holding capacity of fresh meats. J. Agric. Food Chem. 6: 387-392.

Texas Tech University, Loni Woolley, December 2014
27
Winger, R. J., and C. J. Hagyard. 1994. Juiciness — its importance and some contributing
factors. In: A. M. Pearson and T. R. Dutson (eds.) Quality Attributes and their
Measurement in Meat, Poultry and Fish Products. Advances in Meat Research
No. 9. p 94-124. Springer US.
Zhang, M., G. S. Mittal, and S. Barbut. 1993. Optimum conditions for determining water
holding capacity of beef by the press method. J. Mus. Foods 4: 255-268.

Texas Tech University, Loni Woolley, December 2014
28
CHAPTER III
CONSUMER AND TRAINED PANEL EVALUATION OF BEEF
STRIP STEAKS OF VARYING MARBLING AND ENHANCEMENT
LEVELS COOKED TO THREE DEGREES OF DONENESS
Abstract
The purpose of this study was compare the palatability traits, specifically
juiciness, of enhanced USDA Select beef strip steaks to other USDA quality grades
across three degrees of doneness (DOD). Sixty strip loins were selected to equally
represent seven treatments, including USDA Prime, upper 2/3 Choice (Top Choice),
lower 1/3 Choice (Low Choice), Select, and Standard. An additional 24 USDA Select
strip loins were selected for enhancement with a water, salt, and alkaline phosphate
solution at two injection levels: High Enhanced (HE: 112% of raw weight) and Low
Enhanced (LE: 107% of raw weight). Following the 21 d aging period, strip loins were
fabricated into 2.5 cm thick steaks and cooked on a belt grill to three DOD; rare (60°C),
medium (71°C), or well-done (77°C). Consumers (n = 252) were screened for DOD
preference and randomly served one sample from each treatment prepared at their
preferred DOD. Each sample was evaluated for palatability traits on a 10-cm, verbally-
anchored line-scale, and acceptability and eating quality were characterized. Samples
were evaluated by a trained panel for palatability traits and off-flavors using a 10 cm,
verbally anchored line scale. For consumers, Select HE samples rated highest (P < 0.05)
for tenderness, flavor identity, flavor liking and overall liking compared to all treatments.

Texas Tech University, Loni Woolley, December 2014
29
Select LE samples rated higher (P < 0.05) than Prime samples for flavor identity and
flavor liking. Juiciness scores were greater (P < 0.05) for Select HE, Select LE and Prime
compared to other treatments. The percentage of samples rated as premium quality was
greatest (P < 0.05) for Select HE. For trained panelists, a treatment by DOD interaction
was found for initial and sustained juiciness (P < 0.05). Select HE, Select LE and Prime
samples were rated higher (P < 0.05) than other treatments for initial and sustained
juiciness for medium and well-done DOD. Select HE samples rated higher (P < 0.05) for
initial juiciness than Low Choice, Select, and Standard samples cooked to rare. Select HE
samples rated highest (P < 0.05) for initial and sustained tenderness across all DOD.
Trained panelists rated Select HE and Select LE the lowest (P < 0.05) for beef flavor ID
and beef flavor intensity, but higher (P < 0.05) than other treatments for salty off-flavor.
Enhanced USDA Select strip steaks rated higher for both tenderness and juiciness than
steaks from higher quality grades, indicating enhancement effectively improves
palatability and adds value to USDA Select strip loins.
Key words: beef, degree of doneness, enhancement, injection, palatability, USDA quality
grade
Introduction
Typically, consumers expect meat that is highly marbled and tender to also be
juicy. This could potentially be the reason beef juiciness is the least studied of the
palatability traits important to consumers. Juiciness can be broken down into two parts:
initial wetness during the first few chews produced by a rapid release of meat juices; and

Texas Tech University, Loni Woolley, December 2014
30
sustained juiciness after a few chews while fat in the sample causes a slow release of
saliva (Bratzler, 1971). The initial wetness of the meat can be positively altered with
addition of a solution through injection, whereas perceived juiciness relies on amount of
intramuscular fat within the steak. With increasing beef prices and quality demands, the
need for maximizing the palatability of lower quality beef by using enhancement is
greater than ever before.
Injection of beef steaks has led to improved eating experiences from consumer
and trained panelists (Robbins et al., 2003; Wicklund et al., 2005; Baublits et al., 2006;
Stetzer et al., 2008; Pietrasik and Janz, 2009; Brooks et al., 2010). More specifically,
studies have demonstrated sensory panelists rated enhanced steaks higher in juiciness
than non-enhanced steaks (Kerth et al., 1995; Robbins et al., 2003; Wicklund et al., 2005;
Baublits et al., 2006; Grobbel et al., 2008; Stetzer et al., 2008; Pietrasik and Janz, 2009;
Brooks et al., 2010).
Another main factor influencing beef steak juiciness is final cooked temperature.
Cooking loss due to increased internal temperature is known to be inversely related to
juiciness (Ackerman et al., 1981; Gundavarapu et al., 1998; Aaslyng et al., 2003). Thus,
efforts to improve beef steak juiciness can be diminished if prepared to elevated
temperatures.
The purpose of this study was to compare the palatability traits, specifically
juiciness, of enhanced USDA Select beef strip steaks to other USDA quality grades
across three DOD.

Texas Tech University, Loni Woolley, December 2014
31
Materials and methods
Experimental Treatments and Sample Preparation
Beef strip loins (IMPS #180; USDA 2010) were selected to equally represent
seven quality treatments for use in this study. Treatments were selected to create variation
in juiciness and included five USDA quality grades [Prime, upper 2/3 Choice (Top
Choice), lower 1/3 Choice (Low Choice), Select, and Standard], as well as 2 enhanced
USDA Select treatments [Select High Enhanced (HE): 112% of initial product weight
and Select Low Enhanced (LE): 107% of raw product weight].
Strip loins (n = 12 / treatment) were selected by Texas Tech University (TTU)
personnel at a commercial beef processing plant in Nebraska, vacuum-packaged and
transported, under refrigeration (2°C), to the TTU Gordon W. Davis Meat Science
Laboratory. Since instrument grading is used widespread in the U.S. beef industry, data
files containing camera measurements of marbling score, ribeye area, fat thickness, and
calculated yield grade for each side of the selected carcass were retrieved from the plant
(Computer Vision System, Research Management Systems, Inc., Fort Collins, CO).
Subprimals not intended for enhancement were aged 21 d postmortem under vacuum at 2
- 4°C in the absence of light.
At day 7 of the aging period, USDA Select strip loins (n = 12 / level) were
enhanced with a water, salt (Morton Coarse Kosher Salt, Morton, Inc., Chicago, IL), and
sodium tripolyphosphate (Brifisol 916, ICL Food Specialties, Simi Valley, CA) solution
to 112% and 107% of raw weight. Each solution was formulated to contain 0.3% salt and
0.45% sodium tripolyphosphate on a finished weight basis. Pump solutions were mixed

Texas Tech University, Loni Woolley, December 2014
32
with a commercial mixer (Model RS-02, Admix, Manchester, NH) until all solutes were
dissolved and chilled (2 - 4°C) for 24 h prior to pumping. Pump solution (HE: pH = 7.52;
LE: pH = 7.23) was injected into strip loins using a multi-needle (Schroder Model IMAX
350, Wolf-Tec Inc., Kingston, NY) injector system. Strip loins were weighed before and
after enhancement to determine solution uptake. Injected loins were allowed to rest for 30
min at 2 - 4°C before recording final weights. Injected strip loins were vacuum-packaged
and stored at 2 - 4°C in the absence of light for the remainder of the 21-d aging period.
After completion of the 21-d aging period, all strip loins were fabricated into 2.5-
cm thick steaks. The most anterior “wedge” steak was cut by hand and saved with the
next most anterior steak for other analyses (data not reported). The remaining strip loin
was fabricated into nine 2.5-cm thick steaks from anterior to posterior, with each set of
three consecutively cut steaks assigned to one of 3 DOD (rare, medium, or well-done).
Each location was equally represented for each DOD within each treatment. One steak
from each strip loin from each DOD section was randomly assigned to consumer panel,
trained panel, and cooked objective analyses. All steaks were individually identified,
vacuum-packaged, and frozen (-20°C).
Cooked Sample Preparation
Before cooking, steaks were thawed at 2 - 4ºC for 24 h and were trimmed to
remove external fat. Thawed weight and raw initial temperature (Digital Meat
Thermometer Model SH66A, Cooper Instruments, Middlefield, CT) were recorded. The
steaks were cooked on a belt grill (model TBG- 60 Magigrill, Magi-Kitch'n Inc.,
Quakertown, PA) to achieve a final internal temperature of 60°C (rare), 71°C (medium),

Texas Tech University, Loni Woolley, December 2014
33
or 77°C (well). Steak weights and peak internal temperatures were recorded following
cooking for calculation of cook loss and endpoint temperature. After cooking, steaks
were allowed to rest at room temperature (23°C) for 3 min before cutting.
Consumer Panel Evaluation
The TTU Institutional Review Board approved procedures for use of human
subjects for sensory panel evaluations. Consumer panels were conducted at the TTU
Animal and Food Science Building in a large banquet room under florescent lighting.
Panelists (n = 252) were recruited from communities in and around Lubbock, Texas and
paid to participate in the study. Consumers were screened for DOD preference and served
one sample from each treatment prepared at their preferred DOD. Panel sessions were
conducted with 28 consumers seated in individual sensory booths, and lasted about one h.
Three panels each night were conducted on three separate nights, where each night
represented one of the three DOD.
Panelists were provided with a ballot, plastic fork, toothpick, napkin, expectorant
cup, cup of water, and palate cleansers (unsalted crackers and apple juice) to use between
samples. Each ballot packet contained an information sheet, demographic questionnaire,
beef steak purchasing behavior sheet and seven sample ballots. Before the start of each
panel, panelists were given verbal instructions about the ballot and use of the palate
cleansers.
Steaks for consumer evaluation were prepared as previously described in the
section titled “cooked sample preparation”. Four steaks were placed on the belt grill
every five min approximately 2.5 cm away from each other. Following the rest period, 14

Texas Tech University, Loni Woolley, December 2014
34
1-cm3 pieces were cut from each steak and two pieces were served immediately to each
of seven predetermined consumers. No consumer was sitting next to another consumer
sampling the same steak. Consumers were served seven samples from each quality
treatment (USDA Prime to Standard), a HE Select and LE Select in a predetermined,
random order. Attributes for each sample were ranked on a paper ballot with 10-cm
continuous-line scales for juiciness, tenderness, flavor identity, flavor liking and overall
liking. The zero anchors were labelled as not juicy, not tender, extremely unbeef-like,
dislike flavor extremely, and dislike overall extremely; the 10-cm anchors were labelled
as very juicy, very tender, extremely beef-like, like flavor extremely, and like overall
extremely. Also, each consumer rated each sample as either acceptable or unacceptable
for each palatability trait. Furthermore, consumers were asked to designate each sample
as unsatisfactory, everyday quality, better-than-everyday quality, or premium quality.
Trained Sensory Evaluation
Steaks for trained sensory evaluation were prepared as previously described in the
section titled “cooked sample preparation”. Steaks were cut into 1-cm3 pieces, placed in a
ceramic bowl, and held in a warming oven at 70°C for a maximum of 20 min before
being served. Thirty-six (12 / DOD) panels consisting of a 7 to 10-member trained panel
were conducted. Each panelist received two pieces from each treatment in a random
order.
Samples were evaluated by a trained descriptive panel (AMSA, 1995). During
testing, panelists were seated in individual booths within a clean sensory panel room.
Samples were served under red incandescent light to mask color variation among

Texas Tech University, Loni Woolley, December 2014
35
samples. Panelists were provided with a ballot, plastic fork, toothpick, napkin,
expectorant cup, cup of water, and palate cleansers (unsalted crackers and apple juice) to
use between samples. Attributes for each sample were ranked on a paper ballot with 10-
cm continuous-line scales for quantified initial juiciness, sustained juiciness, initial
tenderness, sustained tenderness, beef flavor ID, beef flavor intensity, and off-flavor. The
zero anchors were labelled as not juicy, not tender, extremely unbeef-like, extremely
bland beef-like flavor, and extremely bland off-flavor; the 10-cm anchors were labelled
as very juicy, very tender, extremely beef-like, extremely intense beef flavor, and
extremely intense off-flavor.
Statistical Analyses
Statistical analyses were conducted using the procedures of SAS (Version 9.3;
SAS Inst. Inc., Cary, NC). Treatment comparisons were tested for significance using
PROC GLIMMIX with α = 0.05. Sensory data was analyzed with a split-plot
arrangement of factors, with DOD as the main plot factor and quality treatment as the
sub-plot factor. Acceptability data for each palatability trait was analyzed with a model
that included a binomial error distribution. For all analyses, the Kenward-Roger
approximation was used for estimating denominator degrees of freedom and the PDIFF
option was used to separate treatment means when the F-test on the main effect or effect
interaction was significant (P < 0.05).
Consumer demographic information was summarized using PROC FREQ. PROC
CORR was used for calculating and determining significance (P < 0.05) of all correlation
coefficients.

Texas Tech University, Loni Woolley, December 2014
36
Results and discussion
Consumer Demographics and Motivators When Purchasing Beef
Table 3.2 contains demographic results obtained from 242 consumers in Lubbock,
Texas. Sensory analysis was performed by majority Caucasian/White (85.94%), male
(53.82%) and female (46.18%) consumers. The majority of consumers (> 50%) had an
annual household income of $50,000 or more (62.4%), had some college/technical school
education (32.26%) or was a college graduate (35.08%), and ate beef 1 to 3 times a week
(50.79%). Beef was the meat product predominantly (70.86%) preferred for flavor among
consumers, and tenderness (46.22%) and flavor (44.62%) were the most important
palatability traits reported when eating beef. Previous research has also reported
tenderness to be of most importance when eating beef (Killinger et al., 2004). However,
previous studies have shown after evaluation of steaks (in home), overall palatability
ratings were more affected by flavor than tenderness (Huffman et al., 1996).
When asked to rate a list of motivators important when purchasing fresh beef
steaks, consumers identified “steak color”, “price”, “size, weight, and thickness”, and
“USDA grade” as most (P < 0.05) important (Table 3.3). The “familiarity with cut”,
“marbling level”, and “eating satisfaction claims (ex. Guaranteed Tender)” ranked next in
importance and were considered more important (P < 0.05) than “nutrient content”,
“country of origin”, and other production-related motivators included on the list. The
“brand of product”, which was similar (P > 0.05) to “natural and organic claims,” was
least important (P < 0.05) to consumers when purchasing fresh beef steaks.

Texas Tech University, Loni Woolley, December 2014
37
Results reported in Table 3.3 are similar to those of Reicks et al. (2011) and
O'Quinn (2012), who found that consumers rank factors related to taste as the most
important motivators for purchasing fresh beef steaks. In agreement with our results,
previous research also reported nutritional content was of moderate importance and that
various animal production traits, including natural and organic claims, were least
important to consumers when making beef purchase decisions (Reicks et al., 2011;
O'Quinn, 2012). In the present study, visual characteristics of the fresh product and price
ranked among the top four factors considered when purchasing beef, which is in
agreement with Robbins et al. (2003) where consumers ranked cut, color, amount of
visible fat, price, and amount of liquid in the package as the most important
considerations when purchasing beef.
It is notable that, in the current study and O'Quinn (2012), consumers rated beef
quality attributes (color, marbling level, eating satisfaction claims, and visual appearance)
as more important purchasing motivators than nutrient content, product brand, and animal
production claims. The results underscore the premium placed on eating quality and
visual appearance by beef consumers. Additionally, the results indicate that consumer
purchasing decisions are more directly driven by inherent properties of the meat in the
retail package as opposed to claims and information that would be provided on labels or
at the point of sale.
Consumer Panel Ratings of Beef Juiciness
In the current study, an effort was made to create maximum variation in steak
juiciness. To accomplish this, steaks were selected to span the breadth of USDA quality

Texas Tech University, Loni Woolley, December 2014
38
grades (Prime – Standard) as well as included steaks enhanced with a salt, water, and
phosphate solution. Grading results are located in Table 3.1. Additionally, steaks were
prepared to three DOD (rare, medium, and well-done). All of these factors combined
allowed juiciness variation to occur based on fat content, moisture content, and cooking
loss. No treatment by DOD interaction was observed for all consumer ratings evaluated
(P > 0.05). Least squares means for consumer ratings are presented in Table 3.4. Select
HE samples rated greatest (P < 0.05) for tenderness, flavor identity, flavor liking and
overall liking compared to all treatments. Select HE, Select LE and Prime samples had
greater (P < 0.05) juiciness scores than all other treatments. Select HE and Select LE
samples rated greater (P < 0.05) than Prime samples for flavor identity and flavor liking.
Non-enhanced Select and Standard samples were rated the lowest (P < 0.05) among
treatments for all palatability traits.
The percentage of consumers who rated juiciness, tenderness, flavor, and overall
liking as acceptable was greater (P < 0.05) for Select HE, Select LE, and Prime compared
to other treatments (Table 3.5). Select LE and Top Choice had a similar (P > 0.05)
percentage of samples rated as acceptable for juiciness, with both treatments having a
greater percentage (P < 0.05) rated acceptable than Low Choice. Non-enhanced Select
and Standard had the lowest (P < 0.05) percentage of samples rated as acceptable for all
palatability traits. The percentage of samples rated as premium quality was greatest (P <
0.05) for Select HE (Table 3.6). Non-enhanced Select and Standard samples were
characterized as unsatisfactory more than all other treatments (P < 0.05).

Texas Tech University, Loni Woolley, December 2014
39
Similar results to the current study have been reported by previous authors
evaluating beef enhancement. In agreement with our results, steak enhancement has
resulted in a significant increase in consumer tenderness, juiciness, flavor, overall like,
and overall acceptability (Brooks et al., 2010). Additionally, consumers have rated
enhanced steaks as more flavorful when compared to non-enhanced steaks (Vote et al.,
2000; Robbins et al., 2003). Pietrasik and Janz (2009) and Robbins et al. (2003) also
reported a significantly more tender, juicy, salty, and increased overall acceptable eating
experience for enhanced beef samples when compared to non-injected samples. Also,
steaks have been rated higher than control steaks for tenderness, juiciness, and flavor by
consumers when enhanced with a CaCl2 enhancement solution (Miller et al., 1995).
Our results are in agreement with previous work that has shown as marbling
increases, palatability traits rated by consumers, such as flavor, juiciness and tenderness
also increase (Smith et al., 1985; Lorenzen et al., 1999; O'Quinn et al., 2012; Corbin et al.
2015). Additionally, it has been reported that steaks of higher marbling scores and similar
tenderness values tended to be juicier, more flavorful and more desirable in overall
acceptability than low marbled steaks when fed to consumers (Killinger et al., 2004).
Similar to the current results, numerous previous studies have reported greater overall
acceptability in high marbled steaks when evaluated by consumers (Savell et al., 1987;
Savell and Cross, 1989; Neely et al., 1998; O’Quinn, 2012; Corbin et al., 2015).
As DOD increased from rare to well-done, juiciness ratings decreased (P < 0.05)
(Table 3.7). Moreover, no differences (P > 0.05) were found for tenderness, flavor liking,
and overall liking due to DOD. A lower (P > 0.05) percentage of well-done samples were

Texas Tech University, Loni Woolley, December 2014
40
rated as acceptable for juiciness than rare and medium samples, however, no differences
(P > 0.05) were found in the percentage of acceptable samples for tenderness and overall
liking due to DOD (Table 3.8). No differences (P > 0.05) were found among DOD
treatments for the percentage of samples classified at each quality level (Table 3.9).
Results reported in Table 3.7 are similar to studies that have reported as DOD
increases from rare to well-done, juiciness ratings decrease (Cross et al., 1976; Luchak et
al., 1998; Shackelford et al., 2001). No difference in flavor liking, overall liking and
perceived quality level among DOD was expected in the present study, as panelists were
only fed steaks of their preferred DOD.
The results of the current study are in agreement with several previous studies that
determined enhancement of beef as a means to increase overall eating experience. In the
current study, USDA Select strip steaks enhanced as described produced a similar eating
experience to USDA Prime samples. In today’s market, with increased beef prices and
shorter cattle supplies, enhancement offers a significant opportunity to improve the
marketability and palatability of lower quality beef.
Trained Panel Sensory Evaluation
For trained sensory panels, initial and sustained juiciness were measured
independently. A treatment by DOD interaction was found for initial and sustained
juiciness (P < 0.05) (Table 3.10). Results followed the same trend for both initial and
sustained juiciness, with Select HE, Select LE and Prime samples rated greater (P < 0.05)
than all other treatments when cooked to medium and well-done. However, when steaks
were cooked to rare, Select LE and Prime were similar (P > 0.05) to Top Choice steaks

Texas Tech University, Loni Woolley, December 2014
41
for both juiciness ratings. Moreover, Standard samples rated lower (P < 0.05) than all
treatments other than non-enhanced Select for both initial and sustained juiciness when
cooked to well-done; however were similar (P > 0.05) to Low Choice when cooked to
rare. Results indicated that as DOD increased from rare to well-done, the fat content of
the sample played a larger role in juiciness perception. At rare, low fat samples
(Standard) were scored similar to steaks with a higher fat content due to the additional
moisture content in the sample that was lost through the longer cook times of well-done
and medium samples. When cooked to higher degrees of doneness, the importance of
USDA quality grade to juiciness is magnified, with differences between Prime and
Standard increasing by more than 330% and 175% for initial and sustained juiciness
scores, respectively, as DOD increased from rare to well-done.
Select HE samples rated greatest (P < 0.05) for initial and sustained tenderness
across all DOD (Table 3.11). Prime steaks received the greatest (P < 0.05) scores for beef
flavor intensity. Moreover, Prime and Top Choice samples rated greatest (P < 0.05) for
beef flavor ID, with the two enhanced treatments (Select HE and Select LE) receiving the
lowest (P < 0.05) ratings for the same trait. Select HE and Select LE steaks rated greater
(P < 0.05) than all other treatments for salty off-flavor.
These results are consistent with studies that have demonstrated sensory panelists
rate enhanced steaks higher in juiciness than non-enhanced steaks (Kerth et al., 1995;
Wicklund et al., 2005; Baublits et al., 2006; Grobbel et al., 2008; Stetzer et al., 2008).
Furthermore, panelists have previously rated enhanced beef samples more tender
(Baublits et al., 2006; Stetzer et al., 2008), flavorful (Stetzer et al., 2008), and saltier than

Texas Tech University, Loni Woolley, December 2014
42
non-enhanced samples (Baublits et al., 2006). Also, non-enhanced controls have been
shown to have a more intense beef flavor, but were tougher than enhanced steaks
(Lawrence et al., 2003).
Regarding the effect of intramuscular fat content on juiciness, our results are
similar to O’Quinn et al. (2012), Emerson et al. (2013), and Corbin et al. (2015) who
reported increased sensory panel juiciness ratings with increased marbling level from
Select to Prime; however in that study Select and Standard received similar ratings for
juiciness. It has been reported that Low Choice strip steaks rate higher for initial juiciness
than Select steaks (Miller et al., 1997), though no difference was found between the two
quality grades in the current study. However, similar to Miller et al. (1997), initial and
sustained tenderness scores were higher for Low Choice when compared to Select steaks
in the present study.
Results from trained panel evaluation of steaks differing by DOD are presented in
Table 3.12. Rare samples scored greatest (P < 0.05) for initial and sustained tenderness.
However, no difference (P > 0.05) was found for initial or sustained tenderness between
medium and well-done samples. No difference (P > 0.05) for beef flavor ID and beef
flavor intensity were found across all three DOD. Similar to the current results, beef
cooked to increased DOD has previously been associated with reduced palatability scores
by trained panelists (Cross et al., 1976; Luchak et al., 1998).
Relationships among Sensory Traits
Tenderness and juiciness are associated to a very high degree. It is often noted
that the more tender the meat, the more readily juices are emitted and the juicier the meat

Texas Tech University, Loni Woolley, December 2014
43
is perceived. Correlation coefficients used to identify and quantify relationships among
sensory traits are presented in Table 3.13. The strongest correlation (P < 0.05) with
consumer overall like rating occurred with consumer tenderness scores (r = 0.89).
Consumer juiciness was also positively correlated (P < 0.05) with consumer overall like
(r = 0.81). Additionally, a positive correlation (P < 0.05) occurred between consumer
tenderness and consumer juiciness (r = 0.80). Consumer juiciness was positively
associated (P < 0.05) with trained panel initial juiciness and sustained juiciness scores; r
= 0.62, 0.63, respectively. Also, a positive correlation (P < 0.05) occurred between
trained initial and sustained tenderness as well as trained initial juiciness and sustained
juiciness. The highest correlation (P < 0.05) occurred between initial juiciness and
sustained juiciness (r = 0.98). Emerson et al. (2013) and Killinger et al. (2004) also
reported tenderness (r = 0.90, 0.78) and juiciness (r = 0.84, 0.76) were very closely
correlated with overall sensory experience, respectively. Likewise, Shackelford et al.
(2001) found tenderness and juiciness to be strongly correlated (r = 0.79).
Lorenzen et al. (2003) reported trained sensory panel evaluations were not highly
correlated (r < 0.20) to consumer panel evaluations for top loin steaks. In the current
study, consumers scores for were closely associated (P < 0.05) to trained panel scores for
juiciness (r = 0.62) and tenderness (r = 0.44).

Texas Tech University, Loni Woolley, December 2014
44
References
Aaslyng, M. D., C. Bejerholm, P. Ertbjerg, H. C. Bertram, and H. J. Andersen. 2003.
Cooking loss and juiciness of pork in relation to raw meat quality and cooking
procedure. Food Qual. Prefer. 14: 277-288.
Ackerman, S. A., C. E. Cohen, C. Swift, and R. Benedict. 1981. Evaluation of the press
method for “frankfurter” juiciness estimation. Fleischwirtsch 61: 1169-1170.
AMSA. 1995. Research guidlines for cookery, sensory evaluation, and instrumental
tenderness measurements of fresh meat. National Live Stock and Meat Board,
Chicago, IL.
Baublits, R. T., F. W. Pohlman, A. H. Brown Jr, E. J. Yancey, and Z. B. Johnson. 2006.
Impact of muscle type and sodium chloride concentration on the quality, sensory,
and instrumental color characteristics of solution enhanced whole-muscle beef.
Meat Sci. 72: 704-712.
Bratzler, L. J. 1971. Palatability factors and evaluations The Science of Meat and Meat
Products. W. H. Freeman and Company, San Francisco, Calif.
Brooks, J. C., J. M. Mehaffey, J. A. Collins, H. R. Rogers, J. Legako, B. J. Johnson, T.
Lawrence, D. M. Allen, M. N. Streeter, W. T. Nichols, J. P. Hutcheson, D. A.
Yates, and M. F. Miller. 2010. Moisture enhancement and blade tenderization
effects on the shear force and palatability of strip loin steaks from beef cattle fed
zilpaterol hydrochloride. J. Anim. Sci. 88: 1809-1816.
Corbin, C. H., T. G. O'Quinn, A. J. Garmyn, J. F. Legako, M. R. Hunt, T. T. N. Dinh, R.
J. Rathmann, J. C. Brooks, and M. F. Miller. 2015. Sensory evaluation of tender
beef strip loin steaks of varying marbling levels and quality treatments. Meat Sci.
100: 24-31.
Cross, H. R., M. S. Stanfield, and E. J. Koch. 1976. Beef palatability as affected by
cooking rate and final Internal temperature. J. Anim. Sci. 43: 114-121.
Emerson, M. R., D. R. Woerner, K. E. Belk, and J. D. Tatum. 2013. Effectiveness of
USDA instrument-based marbling measurements for categorizing beef carcasses
according to differences in longissimus muscle sensory attributes. J. Anim. Sci.
91: 1024-1034.
Grobbel, J. P., M. E. Dikeman, M. C. Hunt, and G. A. Milliken. 2008. Effects of different
packaging atmospheres and injection-enhancement on beef tenderness, sensory
attributes, desmin degradation, and display color. J. Anim. Sci. 86: 2697-2710.

Texas Tech University, Loni Woolley, December 2014
45
Gundavarapu, S., Y. C. Hung, and A. E. Reynolds. 1998. Consumer acceptance and
quality of microwave-cooked shrimp. J. Food Qual. 21: 71-84.
Huffman, K. L., M. F. Miller, L. C. Hoover, C. K. Wu, H. C. Brittin, and C. B. Ramsey.
1996. Effect of beef tenderness on consumer satisfaction with steaks consumed in
the home and restaurant. J. Anim. Sci. 74: 91-97.
Kerth, C. R., M. F. Miller, and C. B. Ramsey. 1995. Improvement of beef tenderness and
quality traits with calcium chloride injection in beef loins 48 hours postmortem. J.
Anim. Sci. 73: 750-756.
Killinger, K. M., C. R. Calkins, W. J. Umberger, D. M. Feuz, and K. M. Eskridge. 2004.
Consumer sensory acceptance and value for beef steaks of similar tenderness, but
differing in marbling level. J. Anim. Sci. 82: 3294-3301.
Lawrence, T. E., M. E. Dikeman, M. C. Hunt, C. L. Kastner, and D. E. Johnson. 2003.
Staged injection marination with calcium lactate, phosphate and salt may improve
beef water-binding ability and palatability traits. Meat Sci. 65: 967-972.
Lorenzen, C. L., R. K. Miller, J. F. Taylor, T. R. Neely, J. D. Tatum, J. W. Wise, M. J.
Buyck, J. O. Reagan, and J. W. Savell. 2003. Beef customer satisfaction: Trained
sensory panel ratings and Warner-Bratzler shear force values. J. Anim. Sci. 81:
143-149.
Lorenzen, C. L., T. R. Neely, R. K. Miller, J. D. Tatum, J. W. Wise, J. F. Taylor, M. J.
Buyck, J. O. Reagan, and J. W. Savell. 1999. Beef customer satisfaction: cooking
method and degree of doneness effects on the top loin steak. J. Anim. Sci. 77:
637-644.
Luchak, G. L., R. K. Miller, K. E. Belk, D. S. Hale, S. A. Michaelsen, D. D. Johnson, R.
L. West, F. W. Leak, H. R. Cross, and J. W. Savell. 1998. Determination of
sensory, chemical and cooking characteristics of retail beef cuts differing in
intramuscular and external fat. Meat Sci. 50: 55-72.
Miller, M. F., K. L. Huffman, S. Y. Gilbert, L. L. Hamman, and C. B. Ramsey. 1995.
Retail consumer acceptance of beef tenderized with calcium chloride. J. Anim.
Sci. 73: 2308-2314.
Miller, M. F., C. R. Kerth, J. W. Wise, J. L. Lansdell, J. E. Stowell, and C. B. Ramsey.
1997. Slaughter plant location, USDA quality grade, external fat thickness, and
aging time effects on sensory characteristics of beef loin strip steak. J. Anim. Sci.
75: 662-667.

Texas Tech University, Loni Woolley, December 2014
46
Neely, T. R., C. L. Lorenzen, R. K. Miller, J. D. Tatum, J. W. Wise, J. F. Taylor, M. J.
Buyck, J. O. Reagan, and J. W. Savell. 1998. Beef customer satisfaction: role of
cut, USDA quality grade, and city on in-home consumer ratings. J. Anim. Sci. 76:
1027-1033.
O'Quinn, T. G. 2012. Identifying preferences for specific beef flavor characteristics.
Ph.D. Dissertation, Colorado State University, Fort Collins, CO.
O'Quinn, T. G., J. C. Brooks, R. J. Polkinghorne, A. J. Garmyn, B. J. Johnson, J. D.
Starkey, R. J. Rathmann, and M. F. Miller. 2012. Consumer assessment of beef
strip loin steaks of varying fat levels. J. Anim. Sci. 90: 626-634.
Pietrasik, Z., and J. Janz. 2009. Influence of freezing and thawing on the hydration
characteristics, quality, and consumer acceptance of whole muscle beef injected
with solutions of salt and phosphate. Meat Sci. 81: 523-532.
Reicks, A. L., J. C. Brooks, A. J. Garmyn, L. D. Thompson, C. L. Lyford, and M. F.
Miller. 2011. Demographics and beef preferences affect consumer motivation for
purchasing fresh beef steaks and roasts. Meat Sci. 87: 403-411.
Robbins, K., J. Jensen, K. J. Ryan, C. Homco-Ryan, F. K. McKeith, and M. S. Brewer.
2003. Consumer attitudes towards beef and acceptability of enhanced beef. Meat
Sci. 65: 721-729.
Savell, J. W., R. E. Branson, H. R. Cross, D. M. Stiffler, J. W. Wise, D. B. Griffin, and
G. C. Smith. 1987. National consumer retail beef study: palatability evaluations of
beef loin steaks that differed in marbling. J. Food Sci. 52: 517-519.
Savell, J. W., and H. R. Cross. 1989. The role of fat in the palatability of beef, pork, and
lamb Designing Foods: Animal Product Options in the Marketplace. National
Academy Press, Washington, D.C.
Shackelford, S. D., T. L. Wheeler, M. K. Meade, J. O. Reagan, B. L. Byrnes, and M.
Koohmaraie. 2001. Consumer impressions of Tender Select beef. J. Anim. Sci.
79: 2605-2614.
Smith, G. C., Z. L. Carpenter, H. R. Cross, C. E. Murphey, H. C. Abraham, J. W. Savell,
G. W. Davis, B. W. Berry, and F. C. Parrish Jr. 1985. Relationship of USDA
marbling groups to palatability of cooked beef. J. Food Qual. 7: 289-308.
Stetzer, A. J., K. Cadwallader, T. K. Singh, F. K. McKeith, and M. S. Brewer. 2008.
Effect of enhancement and ageing on flavor and volatile compounds in various
beef muscles. Meat Sci. 79: 13-19.

Texas Tech University, Loni Woolley, December 2014
47
Vote, D. J., W. J. Platter, J. D. Tatum, G. R. Schmidt, K. E. Belk, G. C. Smith, and N. C.
Speer. 2000. Injection of beef strip loins with solutions containing sodium
tripolyphosphate, sodium lactate, and sodium chloride to enhance palatability. J.
Anim. Sci. 78: 952-957.
Wicklund, S. E., C. Homco-Ryan, K. J. Ryan, F. K. Mckeith, B. J. Mcfarlane, and M. S.
Brewer. 2005. Aging and enhancement effects on quality characteristics of beef
strip steaks. J. Food Sci. 70: S242-S248.

Texas Tech University, Loni Woolley, December 2014
48
Table 3.1. Least squares means for beef grading measures of carcasses of varying fat level and quality treatments.
TTU Personnel Camera
Quality
Treatment
Marbling
Score1 Preliminary
Fat
Thickness,
in
Adjusted
Fat
Thickness,
in
Ribeye
Area, in2
Hot
Carcass
Weight, lbs
Kidney,
Pelvic,
Heart Fat,
%
Yield
Grade
Marbling
Score1 Preliminary
Fat
Thickness,
in
Ribeye
Area, in2
Yield
Grade
Prime 785.83a 0.61a 0.64a 12.44b 822.25a 2.08abc 3.65a 751.17a 0.51a 11.08c 4.32a
Top Choice 603.33b 0.46b 0.49b 13.10b 811.33ab 2.13abc 3.05b 657.50b 0.44ab 12.46b 3.60b
Low Choice 461.67c 0.38bc 0.41bc 13.12b 725.00c 1.83cd 2.47c 450.83c 0.36bc 12.67b 2.91c
Select 355.00d 0.28cd 0.32cd 13.26b 785.83abc 1.96bcd 2.46c 369.17d 0.24cd 12.55b 2.81c
Standard 257.50e 0.18d 0.21d 14.47a 754.92abc 1.58d 1.64d 253.33e 0.22d 14.06a 2.12d
Select HE2 340.83d 0.31cd 0.35bcd 12.91b 729.00c 2.38ab 2.52bc 372.50d 0.33bcd 12.49b 2.94c
Select LE2 357.50d 0.35bc 0.39bc 12.78b 743.00bc 2.46a 2.71bc 376.67d 0.33bcd 12.38b 2.66cd
SEM3 9.04 0.05 0.05 0.37 25.95 0.18 0.19 10.24 0.05 0.43 0.21
P - value < 0.0001 < 0.0001 < 0.0001 0.0112 0.0425 0.0128 < 0.0001 < 0.0001 0.0002 0.0009 < 0.0001 1200: Traces, 300: Slight, 400: Small, 500: Modest, 600: Moderate, 700: Slightly abundant 2HE = High Enhanced (112% of raw weight), LE = Low Enhanced (107% of raw weight) with a salt, alkaline phosphate and water solution. 3SE (largest) of the least squares means. abcdeLeast squares means in the same column without a common superscript differ (P < 0.05).
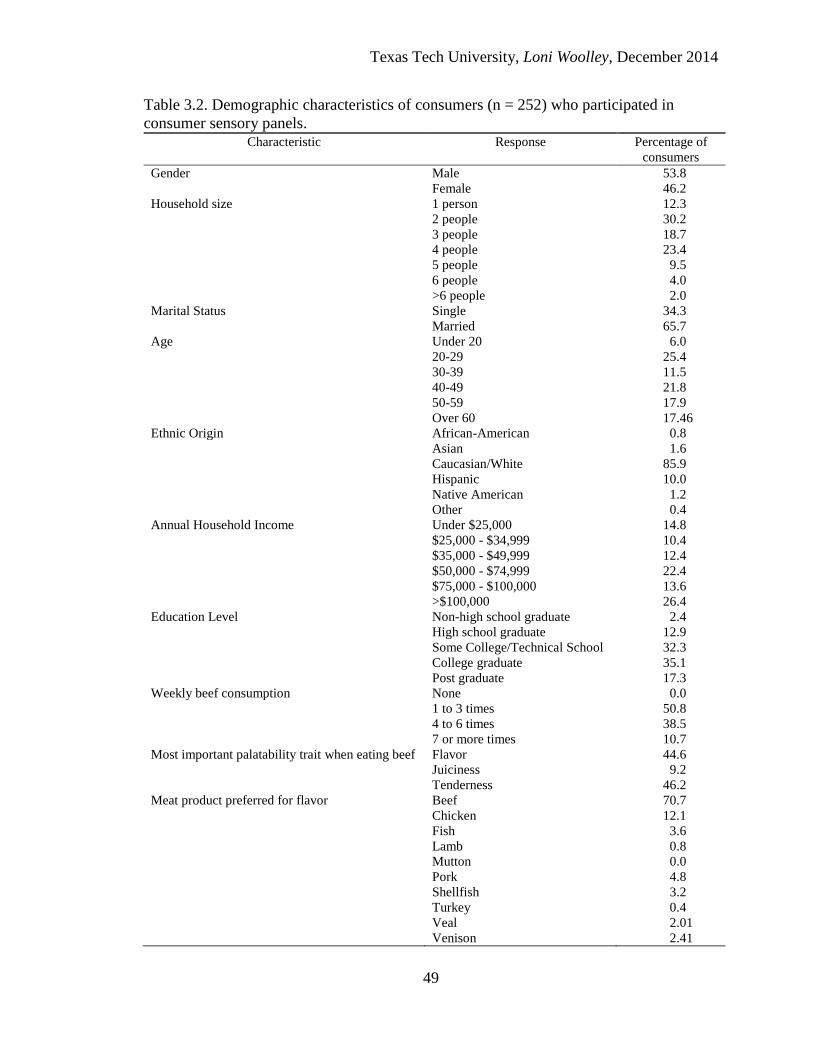
Texas Tech University, Loni Woolley, December 2014
49
Table 3.2. Demographic characteristics of consumers (n = 252) who participated in
consumer sensory panels. Characteristic Response Percentage of
consumers
Gender Male 53.8
Female 46.2
Household size 1 person 12.3
2 people 30.2
3 people 18.7
4 people 23.4
5 people 9.5
6 people 4.0
>6 people 2.0
Marital Status Single 34.3
Married 65.7
Age Under 20 6.0
20-29 25.4
30-39 11.5
40-49 21.8
50-59 17.9
Over 60 17.46
Ethnic Origin African-American 0.8
Asian 1.6
Caucasian/White 85.9
Hispanic 10.0
Native American 1.2
Other 0.4
Annual Household Income Under $25,000 14.8
$25,000 - $34,999 10.4
$35,000 - $49,999 12.4
$50,000 - $74,999 22.4
$75,000 - $100,000 13.6
>$100,000 26.4
Education Level Non-high school graduate 2.4
High school graduate 12.9
Some College/Technical School 32.3
College graduate 35.1
Post graduate 17.3
Weekly beef consumption None 0.0
1 to 3 times 50.8
4 to 6 times 38.5
7 or more times 10.7
Most important palatability trait when eating beef Flavor 44.6
Juiciness 9.2
Tenderness 46.2
Meat product preferred for flavor Beef 70.7
Chicken 12.1
Fish 3.6
Lamb 0.8
Mutton 0.0
Pork 4.8
Shellfish 3.2
Turkey 0.4
Veal 2.01
Venison 2.41

Texas Tech University, Loni Woolley, December 2014
50
Table 3.3. Fresh beef steak purchasing motivators of consumers (n = 252) who
participated in consumer sensory panels.
Trait Importance1
Steak Color 74.80a
Price 72.80a
Size, weight, and thickness 72.76a
USDA Grade 72.49a
Familiarity with cut 65.41b
Marbling level 62.98b
Eating satisfaction claims (ex: Guaranteed Tender) 61.78b
Nutrient content 56.54c
Country of Origin 55.76cd
Growth promotant use in the animal 52.66cde
Antibiotic use in the animal 51.57de
Animal welfare 49.50ef
Packaging type 46.73f
Natural or Organic claims 45.78fg
Brand of product 41.73g
SEM2
1.60
P - value < 0.0001 1Purchasing motivators: 0 = extremely unimportant, 100 = extremely important 2SE (largest) of the least squares means. abcdefgLeast squares means in the same column without a common superscript differ (P < 0.05).

Texas Tech University, Loni Woolley, December 2014
51
Table 3.4. Least squares means for consumer ratings1 of the palatability traits of grilled
beef strip loin steaks of varying quality treatments.
Quality
Treatment
Juiciness Tenderness Flavor Identity Flavor Liking Overall
Liking
Prime 75.86a 74.23
b 70.66
c 66.97
c 67.75
b
Top Choice 66.96b 65.67
c 69.20
cd 63.27
cd 63.16
c
Low Choice 61.06c 60.39
d 66.40
d 59.51
d 58.75
c
Select 52.23d 46.55
e 60.19
e 51.41
e 47.06
d
Standard 50.29d 49.03
e 61.34
e 51.89
e 48.71
d
Select HE2
76.89a 81.89
a 78.85
a 76.00
a 77.64
a
Select LE2
72.80a 72.17
b 75.42
b 71.76
b 70.37
b
SEM3
1.67 1.95 1.26 1.63 1.74
P - value < 0.0001 < 0.0001 < 0.0001 < 0.0001 < 0.0001 1Sensory scores: 0 = extremely dry/tough/unbeef-like, dislike extremely; 100 = extremely juicy/tender/beef-like, like
extremely. 2HE = High Enhanced (112% of raw weight), LE = Low Enhanced (107% of raw weight) with a salt, alkaline
phosphate and water solution. 3SE (largest) of the least squares means. abcdeLeast squares means in the same column without a common superscript differ (P < 0.05).

Texas Tech University, Loni Woolley, December 2014
52
Table 3.5. Percentage of beef strip steaks of varying quality treatment rated as acceptable
for juiciness, tenderness, flavor, and overall liking by consumers (n = 252).
Quality Treatment Juiciness Tenderness Flavor Overall Liking
Prime 95.71a 95.53
b 84.73
bc 89.98
bc
Top Choice 88.72b 87.96
c 83.61
c 84.39
cd
Low Choice 81.59c 79.90
d 79.71
c 80.49
d
Select 70.58d 60.25
e 64.78
d 60.82
e
Standard 65.06d 63.13
e 62.94
d 61.66
e
Select HE1
94.96a 98.87
a 95.18
a 95.47
a
Select LE1
92.38ab
92.69bc
90.20b 91.10
ab
SEM2
3.31 3.91 3.35 3.40
P - value < 0.0001 < 0.0001 < 0.0001 < 0.0001 1HE = High Enhanced (112% of raw weight), LE = Low Enhanced (107% of raw weight) with a salt, alkaline
phosphate and water solution. 2SE (largest) of the least squares means. abcdeLeast squares means in the same column without a common superscript differ (P < 0.05).

Texas Tech University, Loni Woolley, December 2014
53
Table 3.6. Percentage of beef strip steaks of varying quality treatments rated at different
perceived quality levels by consumer panelists (n = 252).
Quality
Treatment
Unsatisfactory Everyday
Quality
Better than
Everyday Quality
Premium Quality
Prime 5.31cd
33.27c
41.58a
17.43bc
Top Choice 7.77bc
44.80b
30.96bc
14.64c
Low Choice 12.39b
52.00ab
26.83c
7.11d
Select 25.11a
56.37a
15.39d
2.15e
Standard 26.73a
55.58a
14.96d
1.87e
Select HE1
2.23d
21.92d
41.15a
33.68a
Select LE1
5.42cd
32.78c
37.24ab
23.37b
SEM2
3.40 3.22 3.17 3.18
P - value < 0.0001 < 0.0001 < 0.0001 < 0.0001 1HE = High Enhanced (112% of raw weight), LE = Low Enhanced (107% of raw weight) with a salt, alkaline
phosphate and water solution. 2SE (largest) of the least squares means. abcdeLeast squares means in the same column without a common superscript differ (P < 0.05).

Texas Tech University, Loni Woolley, December 2014
54
Table 3.7. Least squares means for consumer ratings1 of grilled beef strip loin steaks
cooked to three degrees of doneness.
Degree of Doneness Juiciness Tenderness Flavor ID Flavor
Liking
Overall
Liking
Rare (60°C) 70.45a 63.41 68.27
b 62.12 61.65
Medium (71°C) 66.12b 65.85 70.67
a 65.18 63.97
Well-Done (77°C) 58.91c 63.57 67.66
b 61.62 60.14
SEM2
1.38 1.45 0.87 1.28 1.33
P - value < 0.0001 0.3249 0.0197 0.0834 0.0983 1Sensory scores: 0 = extremely dry/tough/unbeef-like, dislike extremely; 100 = extremely juicy/tender/beef-like, like
extremely. 2SE (largest) of the least squares means. abcLeast squares means in the same column without a common superscript differ (P < 0.05).

Texas Tech University, Loni Woolley, December 2014
55
Table 3.8. Percentage of grilled beef strip loin steaks cooked to three degrees of doneness
rated as acceptable for juiciness, tenderness, flavor, and overall liking by consumers (n =
252).
Degree of Doneness Juiciness Tenderness Flavor Overall Liking
Rare (60°C) 93.01a 88.38 82.50
ab 83.10
Medium (71°C) 88.73a 90.68 86.90
a 86.79
Well-Done (77°C) 76.30b 86.61 78.51
b 81.62
SEM1
2.49 2.41 2.26 2.26
P - value < 0.0001 0.3582 0.0280 0.2032 1SE (largest) of the least squares means. abLeast squares means in the same column without a common superscript differ (P < 0.05).

Texas Tech University, Loni Woolley, December 2014
56
Table 3.9. Percentage of grilled beef strip loin steaks cooked to three degrees of doneness
rated at different perceived quality levels by consumer panelists (n = 252).
Degree of
Doneness
Unsatisfactory Everyday
Quality
Better than Everyday
Quality
Premium
Quality
Rare (60°C) 9.02 44.69 28.50 8.12
Medium (71°C) 8.65 38.64 28.10 12.35
Well-Done (77°C) 9.88 41.97 28.65 9.35
SEM1
1.76 2.19 2.13 1.92
P - value 0.8385 0.1565 0.9823 0.2125 1SE (largest) of the least squares means.

Texas Tech University, Loni Woolley, December 2014
57
Table 3.10. Interaction (Initial Juiciness; P = 0.0017, Sustained Juiciness; P = 0.0324)
between degree of doneness and quality treatment of least squares means for trained
sensory ratings1 of the palatability traits of grilled beef strip loin steaks of varying quality
treatments.
Degree of Doneness/
Quality Treatment
Initial Juiciness Sustained Juiciness
Rare (60°C)
Prime 73.78ab
70.32a
Top Choice 68.86abc
64.04ab
Low Choice 62.01c 55.11
c
Select 62.02c 54.44
c
Standard 66.63bc
59.26bc
Select HE2 75.34
a 71.78
a
Select LE2 74.30
ab 70.13
a
SEM3 3.35 3.45
P - value 0.0008 < 0.0001
Medium (71°C)
Prime 64.14a 60.69
a
Top Choice 50.25b 42.89
b
Low Choice 45.24bc
36.97bc
Select 38.19c 30.14
c
Standard 37.87c 29.71
c
Select HE2 66.56
a 60.87
a
Select LE2 62.52
a 55.53
a
SEM3 3.35 3.45
P - value < 0.0001 < 0.0001
Well-Done (77°C)
Prime 54.28a 49.46
a
Top Choice 42.50b 36.86
b
Low Choice 35.21bc
28.33c
Select 30.64cd
24.52cd
Standard 23.46d 18.95
d
Select HE2 56.18
a 50.64
a
Select LE2 53.30
a 47.46
a
SEM3 3.35 3.45
P - value < 0.0001 < 0.0001 1Sensory scores: 0 = extremely dry, 100 = extremely juicy. 2HE = High Enhanced (112% of raw weight), LE = Low Enhanced (107% of raw weight) with a salt, alkaline
phosphate and water solution. 3SE (largest) of the least squares means. abcdLeast squares means in the same section without a common superscript differ (P < 0.05).

Texas Tech University, Loni Woolley, December 2014
58
Table 3.11. Least squares means for trained sensory panel ratings1 of the palatability
traits of grilled beef strip loin steaks of varying quality treatments.
Quality
Treatment
Initial
Tenderness
Sustained
Tenderness
Beef
Flavor ID
Beef Flavor
Intensity
Salty
Flavors
Non-Salty
Off
Flavors
Prime 68.03b
61.76b
71.52a
62.33a
0.65c
0.78b
Top Choice 54.99c
46.86c
69.65a
58.25b
0.00c
0.18b
Low Choice 52.78c
44.90c
66.63b
52.76cd
0.52c
1.19b
Select 41.63d
33.36d
64.96b
53.92c
0.25c
2.62a
Standard 40.76d
32.25d
64.84b
51.64cd
0.39c
0.99b
Select HE2
76.25a
72.25a
59.04c
47.75e
18.75b
0.28b
Select LE2
67.03b
60.68b
60.68c
50.69de
23.01a
1.37ab
SEM3
1.94 1.97 0.97 1.21 1.24 0.48
P - value < 0.0001 < 0.0001 < 0.0001 < 0.0001 < 0.0001 0.0089 1Sensory scores: 0 = extremely tough/unbeef-like/bland; 100 = extremely tender/beef-like/intense. 2HE = High Enhanced (112% of raw weight), LE = Low Enhanced (107% of raw weight) with a salt, alkaline
phosphate and water solution. 3SE (largest) of the least squares means. abcdeLeast squares means in the same column without a common superscript differ (P < 0.05).

Texas Tech University, Loni Woolley, December 2014
59
Table 3.12. Least squares means for trained sensory panel ratings1 of grilled beef strip
loin steaks cooked to three degrees of doneness.
Degree of
Doneness
Initial
Tenderness
Sustained
Tenderness
Beef
Flavor
ID
Beef Flavor
Intensity
Salty
Flavors
Non-Salty
Off Flavors
Rare (60°C) 62.52a
55.74a
67.18 55.73 6.95 1.13
Medium (71°C) 56.42b
48.75b
65.09 53.06 6.52 0.76
Well-Done (77°C) 53.11b
46.39b
63.73 52.92 5.21 1.27
SEM2
1.47 1.52 1.04 1.16 0.96 0.31
P - value 0.0002 0.0005 0.0818 0.1697 0.4209 0.4988 1Sensory scores: 0 = extremely tough/unbeef-like/bland; 100 = extremely tender/beef-like/intense. 2SE (largest) of the least squares means. abLeast squares means in the same column without a common superscript differ (P < 0.05).

Texas Tech University, Loni Woolley, December 2014
60
Table 3.13. Pearson correlation coefficients for sensory scores for beef strip steaks
varying in fat and quality treatment.
*Correlation coefficient differs from 0 (P < 0.01).
Measurement Consumer
Juiciness
Consumer
Overall Like
Trained Initial
Juiciness
Trained
Sustained
Juiciness
Consumer Panel Rating
Juiciness
0.81* 0.62* 0.63*
Overall Like 0.81* 0.42* 0.43*
Tenderness 0.80* 0.89* 0.44* 0.46*
Trained Panel Rating
Initial Juiciness 0.62* 0.42* 0.98*
Sustained Juiciness 0.63* 0.43* 0.98*
Initial Tenderness 0.76* 0.77*
Sustained Tenderness 0.73* 0.75*

Texas Tech University, Loni Woolley, December 2014
61
CHAPTER IV
ASSESSMENT OF OBJECTIVE MEASURES OF BEEF STEAK
JUICINESS FOR PREDICTION OF SUBJECTIVE TASTE PANEL
JUICINESS RATINGS
Abstract
The objectives of this study were to evaluate raw and cooked beef objective
measurement techniques for juiciness that may be used simultaneously with current
industry objective measurements of beef tenderness, to evaluate the efficacy of objective
juiciness measurements for prediction of subjective taste panel juiciness ratings for beef
strip loin steaks, and to develop prediction equations for beef juiciness utilizing objective
measures. Treatments were selected to maximize variation in juiciness and included: five
different quality grades as well as two enhanced USDA Select treatments all cooked to
three degrees of doneness (DOD). Many objective measures of juiciness were evaluated
on raw and cooked samples. Pressed juice percentage (PJP), a compression-based
juiciness evaluation method, was developed for this study to allow for juiciness testing
from the steak portion remaining after slice shear force (SSF) sample removal. For
subjective juiciness ratings, steaks were evaluated by a seven member trained sensory
panel, and 252 consumers evaluated samples of their preferred DOD from each treatment.
PJP was highest (P < 0.05) in enhanced samples and tended to increase in non-enhanced
samples with increased quality grade. Additionally, PJP decreased (P < 0.05) as DOD
increased from rare to well-done. Cook loss and PJP showed the strongest association (P
< 0.05) with subjective juiciness ratings of all objective juiciness measurements. SSF was

Texas Tech University, Loni Woolley, December 2014
62
more associated with consumer tenderness ratings (r = -0.50) than PJP was with
consumer juiciness ratings (r = 0.45). However, PJP was more closely associated with
trained initial and sustained juiciness (r = 0.69; 0.67) than SSF was with trained initial
and sustained tenderness (r = -0.60; -0.61). In the present study, PJP accounted for 20%
of the variation in consumer juiciness (P < 0.05), 48% of the variation in trained initial
juiciness (P < 0.05), and 45% of the variation in trained sustained juiciness (P < 0.05).
Whereas, SSF accounted for 39% and 40% of the variation in initial tenderness and
sustained tenderness scores and 26% of the variation in consumer tenderness scores (P <
0.05). Results of this study indicate PJP was a better predictor of trained panel juiciness
ratings than SSF was of tenderness ratings and a similar predictor of consumer ratings.
Results from the present study indicate PJP as a potential industry standard for objective
measurement of beef juiciness, similar to SSF for tenderness.
Key words: beef, compression, degree of doneness, juiciness, slice shear force, water
holding capacity
Introduction
Tenderness has been identified as the most important beef palatability factor
(Savell et al., 1987; Miller et al., 1995; Savell et al., 1999). Results of the most recent
Beef Tenderness survey showed that over 94% of beef from the rib and loin in
foodservice and at the retail level were classified as tender or very tender (Guelker,
2013). With such a large portion of the retail beef supply classified as tender, the
importance of juiciness and flavor to the consumer eating experience is magnified.

Texas Tech University, Loni Woolley, December 2014
63
Numerous recent studies have evaluated the contribution and importance of flavor to beef
palatability (Brooks et al., 2012; Miller and Kerth, 2012; O'Quinn, 2012). However,
studies evaluating the contribution of juiciness to beef palatability are limited.
Slice shear force uses a single, 1-cm thick slice from the lateral portion of a steak
for testing. Because of this, the remaining steak portions are available for use in other
procedures, including instrumental juiciness determination. Compression-based methods
have been shown to be highly correlated with sensory-panel juiciness scores of
commercial frankfurters (r = 0.92) (Lee and Patel, 1984) and beef rib and loin cuts (r =
0.92) (Tannor et al., 1943). The present study was conducted to develop a similar
compression-based methodology to quantify the amount of juice lost from a steak sample
during compression as an indicator of juiciness by utilizing the warm steak sample
reaming after SSF tenderness testing, allowing for both an objective tenderness and
juiciness score.
Although many factors can affect the outcome of the taste of a steak, objective
measurements of palatability traits may help segregate beef in order to provide a greater
likelihood of a positive eating experience. The objectives of this study were to evaluate
raw and cooked beef objective measurement techniques for juiciness that may be used
simultaneously with current industry objective measurements of beef tenderness, to
evaluate the efficacy of objective juiciness measurements for prediction of subjective
taste panel juiciness ratings for beef strip loin steaks, and to develop prediction equations
for beef juiciness utilizing objective measures.

Texas Tech University, Loni Woolley, December 2014
64
Materials and methods
Experimental Treatments and Sample Preparation
Beef strip loins (IMPS #180; NAMP 2010) were selected to equally represent
seven quality treatments for use in this study. Treatments were selected to create variation
in juiciness and included five USDA quality grades [Prime, upper 2/3 Choice (Top
Choice), lower 1/3 Choice (Low Choice), Select, and Standard], as well as two enhanced
USDA Select treatments [Select High Enhanced (HE): 112% of initial product weight
and Select Low Enhanced (LE): 107% of raw product weight].
Strip loin selection and handling prior to the completion of aging period is stated
in Chapter 3. After completion of the 21-d aging period, all strip loins were fabricated
into 2.5-cm thick steaks. Prior to slicing, the most anterior “wedge” steak was cut by
hand and used for color, proximate, water activity, and pH analysis. Wedge steaks were
placed on a table with the fresh cut surface exposed and allowed to bloom for 20 min.
After 20 min, L*, a*, and b* were measured on each steak using a handheld
spectrophotometer (Model 45/0-L Hunter MiniScan XE Plus, Hunter Associates
Laboratory, Reston, VA). Three readings were taken from different areas of the steak.
The L*, a*, b* color values were recorded as the average of the three readings.
The next most anterior steak was cut transversely into three uniformly-sized
pieces and assigned to one of three analyses: raw drip loss, raw expressible moisture, or
raw Carver press water holding capacity (WHC) testing. An equal number of steak pieces
from each of the three locations were assigned to each test within each treatment.

Texas Tech University, Loni Woolley, December 2014
65
The remaining strip loin was fabricated into nine 2.5-cm thick steaks from
anterior to posterior, with each set of three consecutively cut steaks assigned to one of
three DOD (rare, medium, or well-done). Each location was equally represented for each
DOD within each treatment. One steak from each strip loin from each DOD section was
randomly assigned to consumer panel, trained panel, and cooked objective analyses. All
steaks were individually identified, vacuum-packaged and frozen (-20°C).
Raw Objective Measures of Juiciness
Proximate, pH, and Water Activity Analysis
Steaks for proximate, pH, and water activity analysis were thawed for 24 h at 2 -
4°C. Proximate analysis and pH were tested using the wedge steak from each strip loin.
Prior to proximate analysis, a 1.27-cm diam. core was taken from each steak, vacuum-
packaged and stored (2 - 4°C) for water activity analysis. The remaining steak portions
were ground through a 4-mm plate for proximate analysis. Proximate analysis of raw
steaks was conducted by an AOAC official method (Anderson, 2007) using a near
infrared spectrophotometer (FoodScan, FOSS NIRsystems, Inc., Laurel, MD). Chemical
percentages of fat, moisture and protein were determined for each strip loin.
For pH, a 10-g ground sample was placed into 90 ml of distilled water and
homogenized. A filter paper (Qualitative P8 Fisherbrand Filter Paper, Fisher Scientific,
Pittsburgh, PA) cone was placed into the homogenate and pH measurements were taken
of the filtrate solution. The electrode (Model 13-620-285, Fisher Scientific, Pittsburgh,
PA) was rinsed between each pH measurement using distilled water.

Texas Tech University, Loni Woolley, December 2014
66
Water activity was measured using a single 1.27-cm diam. core at room
temperature utilizing a Thermoconstanter Aw Sprint Novasina TH 500 (Axair Ltd.,
Pfäffikon, Switzerland).
Moisture Analysis
Ground sample was submerged in liquid nitrogen, and then homogenized into a
fine powder using a commercial food processor (Oster 14-Speed Blender, Boca Raton,
FL). Homogenized samples were individually identified, placed in Whirl-Pak bags
(Nasco, Ft. Atkinson, WI), and stored at -80°C until analysis. Moisture was determined
using the oven-drying, moisture removal process described in the AOAC (AOAC Official
Method 950.46, 1995).
Carver Press - Water Holding Capacity
Carver press WHC testing was preformed similar to methods described by
Wierbicki and Deatherage (1958). Steak portions representing each strip loin were
thawed for 24 h at 2 - 4°C and used to determine Carver press WHC. After mincing, 0.5 g
of meat sample was placed between 2 sheets of desiccated filter paper (VWR Filter Paper
415, 12.5cm, VWR International, Radnor, PA) placed between 2 plexiglass plates and
pressed using a Carver Laboratory press (Fisher Scientific, Pittsburgh, PA) at 500 psi for
1 min. The filter papers were removed from the press, allowed to dry for approximately 5
min and separated. The inner (meat) ring and the outer (water) ring were traced and the
filter papers were placed in a desiccator (Nalgene Polypropylene Dessicator with
Stopcock, Fisher Scientific, Pittsburgh, PA) to dry overnight. After drying, the filter
papers were digitally scanned and the areas (in2) and circumferences (in) of both the meat

Texas Tech University, Loni Woolley, December 2014
67
and water ring were measured (Adobe Photoshop CS5, Adobe, San Jose, CA). Each
sample was run in triplicate and averaged.
Drip Loss
Drip loss samples representing each strip loin were thawed for 24 h at 2 - 4°C.
Two 1.27-cm diam. cores were taken from each sample and placed into an EZ-DripLoss
container (Correa et al., 2007), weighed and stored at 2 - 4°C. Samples were reweighed at
24 h and 48 h. Drip loss was calculated as the percentage of sample initial weight lost at
each time interval. Samples were ran in duplicate and averaged.
Expressible Moisture and Water Holding Capacity
Expressible moisture and WHC were based on a centrifugation method described
by Pietrasik and Janz (2009). Samples for expressible moisture were thawed for 24 h at 2
- 4°C before analyses. Single piece subsamples (5.0 ± 0.05 g) were placed on top of 25 g
of 4-mm glass beads (KIMAX Solid Borosilicate Glass Beads, Kimble Chase, Radnor,
PA) and placed in the bottom of a 50-ml centrifuge tube (VWR Centrifuge Tubes with
Flat Caps, VWR International, Radnor, PA). The tubes were then centrifuged (Sorvall ST
16R Centrifuge, Thermo Scientific) at 900 × g for 10 min at 4°C. Following
centrifugation, the sample was removed and reweighed. Expressible moisture (%) and
WHC were calculated as described by Pietrasik and Janz (2009).
Water Binding Ability
Water binding ability or protein swelling was determined by a centrifugation
method (Shults et al., 1972; Pietrasik and Janz, 2009). Before analyses, thawed meat
samples were ground in a meat grinder (Open Country Electric Food grinder, Two

Texas Tech University, Loni Woolley, December 2014
68
Rivers, WI). A 50-g sample of ground tissue was mixed with 150 ml of distilled water
and blended on high for 45 s. A 35-g sample of the meat slurry was placed in a 50-ml
centrifuge tube (VWR Centrifuge Tubes with Flat Caps, VWR International, Radnor, PA)
and centrifuged (Sorvall ST 16R Centrifuge, Thermo Scientific) at 900 × g for 15 min at
4°C. After centrifugation, the supernatant was measured volumetrically using a graduated
cylinder. Protein swelling (%) was determined by the following formula: % Swelling =
300 – (11.43 x supernatant vol) (Pietrasik and Janz, 2009).
Cooked Objective Measures of Juiciness
Cooked Sample Preparation
Before cooking, steaks were thawed at 2 - 4ºC for 24 h and were trimmed to
remove external fat. Thawed weight and raw initial temperature (Digital Meat
Thermometer Model SH66A, Cooper Instruments, Middlefield, CT) were recorded. The
steaks were cooked on a belt grill (model TBG- 60 Magigrill, Magi-Kitch'n Inc.,
Quakertown, PA) to achieve a final internal temperature of 60°C (rare), 71°C (medium),
or 77°C (well). Steak weights and peak internal temperatures were recorded following
cooking for calculation of cook loss and endpoint temperature. After cooking, steaks
were allowed to rest at room temperature (23°C) for three min before cutting.
Slice Shear Force
Tenderness was evaluated by SSF as described by Shackelford et al. (1999). In
brief, three min after cooking, a 1 – 2 cm slice was removed across the width of the steak
from the lateral end to square off the steak and expose the muscle fibers. Using a cutting
guide, a 5-cm long x 1-cm thick section was obtained from the lateral end by cutting at a

Texas Tech University, Loni Woolley, December 2014
69
45° angle parallel to the muscle fiber orientation. The sample was center sheared
perpendicular to the muscle fiber using a United Force Analyzer (Model #SSTM-500
with tension attachment, United Calibration Corp., Huntington Beach, CA) with a cross
head speed of 500 mm/min with a load cell of 50 kg.
Pressed Juice Percentage
Immediately following tenderness testing, an additional 1-cm thick, steak-width
slice was removed immediately medial to the 5-cm SSF sample (Fig. 4.1). Three 1-cm
samples, parallel to the muscle fiber orientation, were removed from the 1-cm thick slice
(Fig. 4.1). Each of the three samples were weighed on 2 sheets of filter paper (VWR
Filter Paper 415, 12.5 cm, VWR International, Radnor, PA) previously stored in a
desiccator and compressed (Model 5542, Instron, Canton, MA) for 30 s at 8-kg pressure.
After compression, the sample was removed from the filter paper and the filter paper was
re-weighed. The percentage moisture lost during compression was quantified as pressed
juice percentage (PJP). Filter papers were dried overnight in a 100°C oven (Isotemp
Oven, Fisher Scientific, Pittsburgh, PA) and weighed again. The fat percentage in the
expressed fluid was determined by the percentage dry matter remaining in the filter paper
following drying as described by Lee and Patel (1984). The compression-based method
allowed for both an objective tenderness (SSF) and juiciness measurement (PJP) to be
determined from a single steak.
Cooked Carver Press Analysis
Samples from the same steak used for SSF and PJP were used for cooked Carver
press analysis. Samples were pressed as previously described for raw samples.

Texas Tech University, Loni Woolley, December 2014
70
Additionally, initial and final weights of filter paper were recorded and the % weight lost
during compression was quantified as Carver press PJP.
Cooked Drip Loss Analysis
Samples from the same steak used for SSF and PJP were used for cooked drip
loss analysis. Two 1.27-cm diam. cores were taken from each sample and placed into an
EZ-DripLoss container (Correa et al., 2007), weighed, and stored at 23°C. Samples were
reweighed at 24 h and 48 h. Drip loss % was calculated as previously described for raw
samples.
Cooked Expressible Moisture Analysis
Samples from the same steak used for SSF and PJP were used for cooked
expressible moisture determination. Expressible moisture was based on the centrifugation
method of Pietrasik and Janz (2009) as previously described for raw samples. However,
warm samples were removed from cooked steaks and were centrifuged within 10 min of
cutting.
Consumer and Trained Panel Evaluation
Consumer and trained panel evaluation methods are reported in Chapter 3.
Statistical Analyses
Statistical analyses were conducted using the procedures of SAS (Version 9.3;
SAS Inst. Inc., Cary, NC). Treatment comparisons were tested for significance using
PROC GLIMMIX with α = 0.05. All carcass data, proximate composition data, color
data, and raw juiciness measurements were analyzed with a model that included the fixed
effect of quality treatment. For all cooked measurements, a 3 (DOD) x 7 (quality

Texas Tech University, Loni Woolley, December 2014
71
treatment) factorial design was used as the model. For all analyses, the Kenward-Roger
approximation was used for estimating denominator degrees of freedom and the PDIFF
option was used to separate treatment means when the F-test on the main effect or effect
interaction was significant (P < 0.05).
PROC CORR was used for calculating and determining significance (P < 0.05) of
all correlation coefficients. Prediction equations for sensory traits were determined using
regression analysis (PROC REG). For multivariate regression, variables were selected for
inclusion in the model and remained in the model when significant (P < 0.05) using the
stepwise selection option.
Results and discussion
Slice Shear Force
A treatment × DOD interaction was found for SSF (P < 0.05) (Table 1). When
cooked to rare, Prime, Top Choice, Select and Standard samples were similar (P > 0.05)
for SSF. However when steaks were cooked to well-done, SSF values tended to decrease
(P < 0.05) with increased fat levels of non-enhanced samples. Enhanced treatments were
more tender (P < 0.05) than Top Choice, Select, and Standard samples across all three
DOD. Tenderness has been shown to decrease as DOD increases (Cover et al., 1962;
Cross et al., 1976; Wheeler et al., 1999). Moreover, 64% of consumers cook beef from
medium to very well-done (Branson et al., 1986). In our study, tenderness was more
similar between quality treatments when cooked to rare and medium. However, when

Texas Tech University, Loni Woolley, December 2014
72
cooked to well-done, intramuscular fat played a larger role in SSF tenderness, further
indicating the importance of USDA quality grade at elevated DOD.
Objective Measurements of Juiciness
Currently, there is not an industry standard to quantify beef steak juiciness similar
to WBSF and SSF for tenderness. The SSF method of tenderness analysis, which is a
faster alternative to WBSF, was developed by Shackelford et al. (1999). SSF could be
used as a rapid method to guarantee tenderness in the industry using a cooked steak
(Derington et al., 2011); however, has not been implemented due to cost. In this study,
SSF was used to estimate tenderness, because the method uses a warm, 1-cm thick slice
leaving the remaining steak to be used for additional objective measurements, such as the
developed PJP juiciness method.
Subjective measures of juiciness using sensory panelists can be costly, laborious
and invasive. Past juiciness research has focused on the WHC of meat, and many have
reported filter paper press methods to be most successful for estimation. Different types
of press methods using the Carver hydraulic press apparatus or similar, have been widely
adapted from previous studies dating back to the 1930’s (Childs and Baldelli, 1934).
Compression-based methods have been used on a variety of meat products and have been
highly correlated (r = 0.92 to 0.98) with sensory-panel juiciness scores of commercial
frankfurters, beef rib and loin cuts, and microwave cooked shrimp (Tannor et al., 1943;
Lee and Patel, 1984; Gundavarapu et al., 1998). Ackerman et al. (1981) found a high
correlation (r = 0.95) between untrained panelists juiciness scores of experimental
frankfurters and pressed juice percentage, but a lower correlation (r = 0.61) for

Texas Tech University, Loni Woolley, December 2014
73
commercial frankfurters. Lee and Patel (1984) were some of the first authors to use a
more technically advanced, Instron-based press method to produce high correlation
coefficients for sensory juiciness scores of cooked frankfurters. In beef products, Gaddis
et al. (1950) found no significant correlation between press fluid percentage and quantity
of sensory juice of beef rib steaks. Zhang et al. (1993) produced a table of press methods
used by others, but all varied in meat type, mass of sample, force, compression time, and
filter paper used.
Most previous research has focused on measuring WHC using a refrigerated
sample (Wierbicki and Deatherage, 1958; Boakye and Mittal, 1993; Montgomery et al.,
2004). Since sensory panelists evaluate samples after cooking, it is more reasonable to
objectively test samples similarly (Van Oeckel et al., 1999). Cooking causes a number of
chemical and physical alterations which can change perception of juiciness. A rapid filter
paper press method that destroys the microstructure of the heated sample, similar to
mastication, should be most ideal for predicting true juiciness (Trout, 1988). Therefore,
the PJP objective juiciness measurement was developed as a rapid test using a hot steak
sample from the remaining SSF steak section.
Previous work has shown the factors that have the greatest effect on beef juiciness
include: ultimate pH, fat content, enhancement level, cooking method, and DOD
(Montgomery and Leheska, 2008). Many of the objective juiciness quantification
methods used in the current study focused on one or more of these factors. Least squares
means for percentages of lipid, moisture, and protein determined using raw samples from
each of the seven treatments are compared in Table 4.2. Due to treatment differences in

Texas Tech University, Loni Woolley, December 2014
74
USDA quality grade, lipid percentages differed (P < 0.05) widely among treatments,
ranging from 1.82% in Standard to 11.26% in Prime. However, no differences (P > 0.05)
in lipid percentage were observed among Select, Select HE, and Select LE samples.
Mean lipid percentages observed in the current study for Standard, Select, Low Choice,
Top Choice, and Prime were similar to those previously reported for LM samples (Savell
et al., 1986; Dow et al., 2011; O'Quinn et al., 2012; Emerson et al., 2013).
Moisture percentage ranged from 73.77% (Select HE) to 65.84% (Prime). Select
HE (73.77%) and Standard (73.54%) contained the most (P < 0.05) moisture. Non-
enhanced treatments decreased (P < 0.05) in moisture with increasing lipid percentage.
Protein percentage varied the least among quality treatments, ranging from 23.77% (Low
Choice) to 21.85% (Prime). Low Choice, Select, and Standard protein percentages were
greater (P < 0.05) than all other treatments. O’Quinn et al. (2012) found similar
differences in moisture and protein percentages among LM steaks across a comparable
fat range.
The two enhanced treatments (Select HE and Select LE) had a greater (P < 0.05)
pH value than all other treatments (Table 4.2). This was expected due to the alkaline
phosphates and elevated pH of the enhancement solutions. Wicklund et al. (2005) and
Grobbel et al. (2008) similarly found enhanced samples to be significantly greater in pH
than non-enhanced samples. Alkaline phosphates are used in enhancement solutions to
increase bound water by increasing pH. This increased water content is responsible for
the subsequent increase in steak tenderness and juiciness (Vote et al., 2000; Wicklund et

Texas Tech University, Loni Woolley, December 2014
75
al., 2005). Aside from the enhanced treatments, little variation was observed for pH
among quality treatments.
Color can also be affected by the increase in pH caused by alkaline phosphate
enhancement. In the present study, enhanced samples had generally lower (P < 0.05) a*
(redness) and b* (yellowness) color values than non-enhanced samples (Table 2).
Enhanced samples have previously been shown to have lower L* (indicating
enhancement caused some “darkening”), a* and b* values than non-enhanced beef
(Wicklund et al., 2005; Baublits et al., 2006; Stetzer et al., 2008; Pietrasik and Janz,
2009). Baublits et al. (2006) also found lower L* and b* values in enhanced samples;
however, instrumental color was measured over an 8-day period. In the current study, no
decrease in L* values were observed between the two enhanced treatments and Select
samples with similar marbling scores.
It is intuitively apparent that WHC is related to juiciness; however, many studies
have produced varied results when the two factors were measured simultaneously
(Honikel, 1998; Pearce et al., 2011). Many objective measurements evaluated in the
present study represented measures of WHC or the ability to retain natural moisture in the
muscle. The methods used involved gravity, centrifugation, and external force.
Least squares means for raw objective measurements of beef juiciness are
presented in Table 4.3. Measurements from raw Carver press methods produced the most
significant differences among treatments, however, magnitudinal differences were often
low (Table 4.3). Free water (%) and bound water (%) were inversely related; with Select
HE having a greater (P < 0.05) percent bound water than Top Choice, Select and

Texas Tech University, Loni Woolley, December 2014
76
Standard. Additionally, Select HE and Select LE samples were greater (P < 0.05) than
Top Choice, Low Choice and Standard for water binding ability or protein swelling.
Moreover, Standard steaks recorded the greatest (P < 0.05) pecent of drip loss at both 24
h and 48 h, however, drip loss for all treatments was minimal (< 0.6 %). No differences
(P > 0.05) were found among treatments for expressible moisture, WHC, and Aw.
Table 4.4 presents least squares means for objective measures of cooked beef strip
loins of varying quality treatments. Differences among treatments were found for PJP,
with Select HE having the greatest (P < 0.05) value and Prime a greater (P < 0.05) %
than Standard. Moreover, PJP tended to increase in non-enhanced samples with increased
quality grade. FE also increased (P < 0.05) with increased fat percentage. Similar to
Carver press methodology, areas and circumferences of the moisture ring of the PJP filter
papers were measured and compared. Select HE was greatest (P < 0.05) for PJP area,
cooked Carver total area, and cooked EM. Cook loss was greatest (P < 0.05) for Select
and Standard samples, and decreased with increased marbling levels. Few treatment
differences were observed for cooked DL.
Table 4.5 presents least squares means for objective measures of juiciness of strip
loins cooked to three DOD. As DOD increased from rare to well-done, PJP, PJP area, FE,
cooked EM and cooked Carver press total area decreased (P < 0.05) and cook loss
increased (P < 0.05) (Table 4.5). A greater (P < 0.05) percentage of DL at 24 h and 48 h
and a greater (P < 0.05) Carver press PJP was observed for rare samples than medium or
well-done samples. An interaction (P < 0.05) occurred between DOD and quality
treatment for Carver press total circumference of grilled beef strip loin steaks (Table 4.6).

Texas Tech University, Loni Woolley, December 2014
77
When cooked to a well-done, the enhanced treatments had a greater (P < 0.05)
circumference than Prime, Select, and Standard samples. However, no differences (P >
0.05) were found in Carver press total circumference when cooked to rare.
Honikel (1998) described drip loss and cook loss to be two measurements of
WHC of meat. Drip loss is an important measurement to ensure appealing retail display
of meat cuts. Age, sex, diet, pre-slaughter stress, slaughter methods, storage time,
temperature, and meat properties such as pH, intramuscular fat, and moisture contents
can influence drip loss in raw beef (Mitsumoto et al., 1995). More pork than beef,
research has been done in the area of purge and drip loss, but any loss of liquid post-
mortem can affect the physical property of the meat. In the present study, drip loss was
measured using an EZ-Driploss tube similar to previous studies (Aaslyng et al., 2003;
Montgomery et al., 2004; Correa et al., 2007). Other studies have measured drip loss by
gravity (Honikel, 1998; Van Oeckel et al., 1999), filter paper methods (Kauffman et al.,
1986; Van Oeckel et al., 1999) or after time in the retail case (Kauffman et al., 1986;
Mitsumoto et al., 1995). Also, drip loss has most commonly been measured 24 to 48 h
postmortem, whereas in the present study, drip loss was measured after aging. Similar to
the present study, previous work has shown a poor relationship between beef drip loss
and sensory juiciness (Perry et al., 2001). It would be predicted that drip loss would be
negatively correlated to juiciness, but, in a study on pork LM, drip loss using the EZ-
driploss tubes were slightly positively correlated to juiciness (Aaslyng et al., 2003). The
results of the current study showed few differences among treatments for raw and cooked

Texas Tech University, Loni Woolley, December 2014
78
drip loss. Nonetheless, when conducted on cooked samples, drip loss was greater (P <
0.05) for rare samples than medium or well-done steaks.
Centrifugation can also be used to measure WHC by measuring the liquid
squeezed out of a protein system with centrifugal force (Jauregui et al., 1981). Shults et
al. (1972) used a method similar to the expressible moisture procedure used in our study
to measure meat shrinkage and found salt and phosphates decreased shrinkage. However,
this is opposite from the results of the present study in which Select HE had the most
expressible moisture, potentially due to the added water in the samples following
enhancement. Hermansson and Åkesson (1975) used a similar technique, and consistent
with the current study, found no differences in expressible moisture in raw samples.
An additional centrifugation method was used in the current study to measure
water binding ability or protein swelling. Phosphates can affect protein swelling through
increased pH (Shults et al., 1972). Moreover, NaCl inclusion can also affect protein
swelling due to an initial increase in swelling due to Na+ replacement of Ca
++ on the meat
proteins (Shults et al., 1972). These findings support those of the current study that
showed enhanced treatments resulted in more protein swelling. However, Shults et al.
(1972) only measured water binding ability or protein swelling on a heated sample,
whereas, in the present study, it was only measured in raw samples.
Honikel (1998) described cook loss as a means of measuring WHC of meat.
During heating, water is lost as temperature increases. Denaturation of meat proteins
causes structural changes to cell membranes of muscle fibers, along with shrinkage of
muscle fibers and connective tissue (Honikel, 1998). Cooking loss depends on raw meat

Texas Tech University, Loni Woolley, December 2014
79
quality, endpoint temperature and cooking method (Aaslyng et al., 2003). In the current
study, cook loss and filter paper press methods accounted for the most differences among
treatments, whereas raw WHC measurements accounted for the least.
Relationships between Objective Juiciness Measurement Methods and Sensory Panel
Ratings
Correlation coefficients among instrumental juiciness measurements and sensory
panel juiciness ratings are presented in Table 4.7. Of objective measures evaluated, the
strongest correlations (P < 0.05) with consumer juiciness (CJ) occurred with cook loss
and PJP; r = -0.51, 0.45, respectively. Additionally, FE, cooked expressible moisture, PJP
area, SSF, cooked 24 and 48 h drip-loss, steak end-point temperature, and multiple
cooked Carver press variables were associated (P < 0.05) with CJ scores, though to a
lesser degree. Of the raw measurements evaluated, several were associated (P < 0.05)
with CJ, with marbling score (r = 0.33), fat percent (r = 0.37), and protein percent (r = -
0.55) having the strongest correlations. Overall, raw measurements had weaker
associations with CJ than the cooked methods evaluated.
Similar to CJ, the strongest correlations (P < 0.05) with TI occurred with cook
loss and PJP; r = -0.75, 0.69, respectively (Table 4.7). Also, FE and cooked expressible
moisture were positively correlated (P < 0.05) with TI (r = 0.34, 0.64). Percent fat,
marbling score, cooked Carver press total area and circumference were positively
correlated (P < 0.05) with TI as well (Table 4.7). Emerson et al. (2013) found a stronger
positive correlation between instrument marbling score and trained panel ratings for
juiciness (r = 0.67), however in that study juiciness was evaluated as a single trait as

Texas Tech University, Loni Woolley, December 2014
80
opposed to segregated into initial and sustained juiciness. Similar to the current study,
Van Oeckel et al. (1999) found low, non-significant correlations for raw measures of
WHC and trained sensory juiciness of pork.
As with CJ and TI, cook loss and PJP had the strongest correlations (P < 0.05)
with TS; r = -0.73, 0.67, respectively. Many of the measurements that were significantly
correlated with CJ and TI were also associated (P < 0.05) with TS including FE, cooked
expressible moisture, marbling, fat percent, moisture percent, and several cooked Carver
press variables. However, similar to CJ and TI, these associations were weaker than PJP
and cook loss.
In the current study, cook loss and PJP showed the strongest association with all
subjective juiciness ratings (CJ, TI, and TS). However, it is worth noting that cook loss
was measured directly on the steaks consumed by the sensory panelists, whereas PJP was
measured on a steak cooked at a separate time. Steaks were assigned to DOD treatments
by anatomical location within each strip loin to reduce variation. Inevitably, variations in
cooking conditions and final end-point temperatures of steaks occur between objective
and subjective samples cooked at separate times. Had PJP or other cooked measures of
juiciness been measured on the same steaks consumed by sensory panelists, correlation
coefficients would have likely been much higher.
SSF was correlated (P < 0.05) with consumer tenderness (CT), trained panel
initial tenderness (IT), and trained panel sustained tenderness (ST); r = -0.50, -0.60, -0.61,
respectively. The majority of previous studies have been conducted using WBSF as a
means to forecast sensory panel scores. However, WBSF and SSF have been shown to be

Texas Tech University, Loni Woolley, December 2014
81
closely related. Derington et al. (2011) and Shackelford et al. (1999) reported strong
relationships (r = 0.64, 0.80, respectively), between lateral SSF and average WBSF.
Additionally, Caine et al. (2003) reported trained sensory panel evaluations of beef rib
steak initial tenderness and overall tenderness was negatively correlated with WBSF (r =
-0.61 and -0.60). Consumer tenderness of top loin steaks evaluated “in-home,” was
weakly correlated with WBSF (r = 0.26) (Lorenzen et al., 2003). However, a higher
correlation (r = 0.63) between consumer tenderness and WBSF has been documented
(Platter et al., 2003). Additionally, SSF has a strong correlation (r = 0.72) with consumer
tenderness ratings (Shackelford et al., 2001). Furthermore, trained sensory panel ratings
have been shown to be more strongly correlated with SSF (r = 0.82) than with WBSF (r =
0.77) (Shackelford et al., 1999).
In the current study, SSF was more closely associated with consumer tenderness
ratings than PJP was with consumer juiciness ratings. However, PJP was more closely
associated with both trained panel measurements of juiciness than SSF was with trained
sensory panel scores for tenderness. Overall, both instrumental methods were moderately
correlated with both consumer and trained panel measurements.
Prediction Equations for Sensory Panel Ratings
Currently the beef industry does not have an objective measure of steak juiciness
that is reliable for predicting consumer juiciness scores. Compression-based methods
have been practiced, but few have measured juiciness of beef LM using a cooked sample
and none have been correlated to or were used to develop prediction equations for
consumer juiciness.

Texas Tech University, Loni Woolley, December 2014
82
Table 4.8 presents simple linear regression analyses for predicting CJ based on
objective juiciness measures. Of all variables evaluated, protein percent, cook loss, and
PJP explained the most variation in CJ; 30%, 25%, and 20% respectively. Regression
analysis indicated CJ was predicted (P < 0.05) by the equation CJ = 31.21 + 1.50 × PJP
(R2 = 0.20) (Fig. 4.2). Gundavarapu et al. (1998) reported press juice percentage of
cooked shrimp explained 95% of consumer juiciness scores, and cook loss only explained
56% of consumer juiciness scores. In the current study, cook loss explained a greater
amount of variation in CJ than PJP. However, as previously discussed, cook loss values
were calculated from steaks consumed during sensory taste panels, not on steaks used for
instrumental measurements. The objective of the current study was to develop a method
of juiciness measurement which could be used indirectly for juiciness estimation, such as
SSF with tenderness. Because of this, cook loss, as measured, was not considered a viable
predictor.
Cook loss, steak final end-point temperature, PJP, and cooked expressible
moisture each explained (P < 0.05) more than 40% of the variation in TI, however only
cook loss explained more variation than PJP (Table 4.9). Regression analysis indicated TI
was predicted (P < 0.05) by the equation: TI = -11.46 + 2.91 × PJP (R2 = 0.48) (Fig. 4.3).
Regression analysis for TS is located in Table 4.10. The equation TS = -18.10 + 2.94 ×
PJP explained 45% of the variation in TS (P < 0.05) (Fig. 4.4). Additional research is
needed to validate these models and determine the viability of PJP as a means to sort
steaks into various juiciness categories.

Texas Tech University, Loni Woolley, December 2014
83
A quadratic relationship was found between SSF and CT, IT, and ST values. The
equations explained 26%, 39%, and 40% of the variation in CT, IT, and ST, respectively
(P < 0.05) (Fig. 4.5, 4.6, and 4.7). Similar to the present study, prediction equations using
WBSF have been shown to account for 37 % and 36% of the variation of trained sensory
scores in initial tenderness and overall tenderness (Caine et al., 2003). Accounting for
more variation in trained panel overall tenderness ratings, Shackelford et al. (1995)
reported an R2 of 0.73 for WBSF of LM steaks. SSF, however, has previously been
shown to explain 85% of variation in untrained laboratory consumer panel tenderness
ratings (Wheeler et al., 2004), which is a much larger percentage than found in the
current study.
Since tenderness and juiciness both play a role in overall beef palatability,
objective measures of both traits could be combined to produce a prediction equation for
CO. The equation CO = 70.79 – 1.69 × SSF + 0.44 × PJP explained only 24% of the
variation in CO scores (P < 0.05). This low percentage indicates the difficulty in
predicting subjective perceptions by objective methods. Several other factors that are
important to the beef eating experience, including flavor, are not accounted for by SSF or
PJP. In the present study, more than 75% of the variation in CO scores was unaccounted
for by objective measures of tenderness and juiciness.
The logistic regression equation of P = (e-1.55+0.1433x
) / (1 + e-1.55+0.1433x
), (R2 =
0.05) allowed for predicting the probability of a sample being rated as acceptable for
juiciness by consumers based on PJP (P < 0.05 (Fig. 4.8). Although accuracy of this

Texas Tech University, Loni Woolley, December 2014
84
model is likely limited, it is a starting point in the effort towards segregating beef based
on PJP. More research is needed to determine how well this model could perform.
In the current study, SSF accounted for 39% and 40% of the variation in initial
tenderness and sustained tenderness scores, respectively. The developed PJP method was
more successful accounting for variation in trained panel initial juiciness and sustained
juiciness scores (R2 = 0.48, 0.45, respectively). Additionally, PJP accounted for a similar
percentage (20%) of variation in consumer juiciness scores as SSF to CT (26%). It has
been shown that untrained or less-trained panelists can detect changes in texture traits
such as tenderness more similarly to trained panelists, whereas sensory traits such as
juiciness and flavor are more difficult for untrained panelists to discern (Chambers et al.,
1981). This could explain why PJP explained a greater percentage of the variation in
trained panel values as compared to consumer ratings. Results of this study indicate PJP
was a better predictor of trained panel juiciness ratings than SSF was of tenderness
ratings and a similar predictor of consumer ratings. These results indicate PJP as a
potential industry standard for objective measurement of beef juiciness, similar to SSF
for tenderness.

Texas Tech University, Loni Woolley, December 2014
85
References
Aaslyng, M. D., C. Bejerholm, P. Ertbjerg, H. C. Bertram, and H. J. Andersen. 2003.
Cooking loss and juiciness of pork in relation to raw meat quality and cooking
procedure. Food Qual. Prefer. 14: 277-288.
Ackerman, S. A., C. E. Cohen, C. Swift, and R. Benedict. 1981. Evaluation of the press
method for “frankfurter” juiciness estimation. Fleischwirtsch 61: 1169-1170.
AMSA. 1995. Research guidlines for cookery, sensory evaluation, and instrumental
tenderness measurements of fresh meat. National Live Stock and Meat Board,
Chicago, IL.
Anderson, S. 2007. Determination of fat, moisture, and protein in meat and meat products
by using the FOSS FoodScan Near-Infrared Spectrophotometer with FOSS
Artificial Neural Network Calibration Model and Associated Database:
Collaborative study. J. AOAC Int. 90: 1073-1083.
Baublits, R. T., F. W. Pohlman, A. H. Brown Jr, E. J. Yancey, and Z. B. Johnson. 2006.
Impact of muscle type and sodium chloride concentration on the quality, sensory,
and instrumental color characteristics of solution enhanced whole-muscle beef.
Meat Sci. 72: 704-712.
Boakye, K., and G. S. Mittal. 1993. Changes in pH and water holding properties of
Longissimus dorsi muscle during beef ageing. Meat Sci. 34: 335-349.
Branson, R. E., H. R. Cross, J. W. Savell, G. C. Smith, and R. A. Edwards. 1986.
Marketing implications from the national consumer beef study. West. J. Agric.
Econ 11: 82-91.
Brooks, J. C., J. F. Legako, T. T. N. Dinh, and M. F. Miller. 2012. Prediction of beef
flavor by precursor and volatile compounds – project summary. National
Cattlemen's Beef Association, Centennial, CO.
Caine, W. R., J. L. Aalhus, D. R. Best, M. E. R. Dugan, and L. E. Jeremiah. 2003.
Relationship of texture profile analysis and Warner-Bratzler shear force with
sensory characteristics of beef rib steaks. Meat Sci. 64: 333-339.
Chambers, E., J. A. Bowers, and A. D. Dayton. 1981. Statistical designs and panel
training/experience for sensory analysis. J. Food Sci. 46: 1902-1906.
Childs, A. M., and M. Baldelli. 1934. Press fluid from heated beef muscle. J. Agr. Res
48: 1127.

Texas Tech University, Loni Woolley, December 2014
86
Correa, J. A., S. MÉThot, and L. Faucitano. 2007. A modified meat juice container (EZ-
driploss) procedure for a more reliable assessment of drip loss and related quality
changes in pork meat. J. Mus. Foods 18: 67-77.
Cover, S., R. L. Hostetler, and S. J. Ritchey. 1962. Tenderness of beef. IV relations of
shear force and fiber extensibility to juiciness and six components of tenderness.
J. Food Sci. 27: 527-536.
Cross, H. R., M. S. Stanfield, and E. J. Koch. 1976. Beef palatability as affected by
cooking rate and final Internal temperature. J. Anim. Sci. 43: 114-121.
Derington, A. J., J. C. Brooks, A. J. Garmyn, L. D. Thompson, D. B. Wester, and M. F.
Miller. 2011. Relationships of slice shear force and Warner-Bratzler shear force
of beef strip loin steaks as related to the tenderness gradient of the strip loin. Meat
Sci. 88: 203-208.
Dow, D. L., B. R. Wiegand, M. R. Ellersieck, and C. L. Lorenzen. 2011. Prediction of fat
percentage within marbling score on beef longissimus muscle using 3 different fat
determination methods. J. Anim. Sci. 89: 1173-1179.
Emerson, M. R., D. R. Woerner, K. E. Belk, and J. D. Tatum. 2013. Effectiveness of
USDA instrument-based marbling measurements for categorizing beef carcasses
according to differences in longissimus muscle sensory attributes. J. Anim. Sci.
91: 1024-1034.
Gaddis, A. M., O. G. Hankins, and R. L. Hiner. 1950. Relationships between the amount
and composition of press fluid, palatability, and other factors of meat. Food Tech.
4: 498-503.
Grobbel, J. P., M. E. Dikeman, M. C. Hunt, and G. A. Milliken. 2008. Effects of different
packaging atmospheres and injection-enhancement on beef tenderness, sensory
attributes, desmin degradation, and display color. J. Anim. Sci. 86: 2697-2710.
Guelker, M. R., A. N. Haneklaus, J. C. Brooks, C. C. Carr, R. J. Delmore, D. B. Griffin,
D. S. Hale, K. B. Harris, G. G. Mafi, D. D. Johnson, C. L. Lorenzen, R. J.
Maddock, J. N. Martin, R. K. Miller, C. R. Raines, D. L. VanOverbeke, L. L.
Vedral, B. E. Wasser, and J. W. Savell. 2013. National Beef Tenderness Survey–
2010: Warner-Bratzler shear force values and sensory panel ratings for beef
steaks from United States retail and food service establishments. J. Anim. Sci. 91:
1005-1014.
Gundavarapu, S., Y. C. Hung, and A. E. Reynolds. 1998. Consumer acceptance and
quality of microwave-cooked shrimp. J. Food Qual. 21: 71-84.

Texas Tech University, Loni Woolley, December 2014
87
Hermansson, A. M., and C. Åkesson. 1975. Functional properties of added proteins
correlated with properties of meat systems. Effect of concentration and
temperature on water‐binding properties of model meat systems. J. Food Sci. 40:
595-602.
Honikel, K. O. 1998. Reference methods for the assessment of physical characteristics of
meat. Meat Sci. 49: 447-457.
Jauregui, C. A., J. M. Regenstein, and R. C. Baker. 1981. A simple centrifugal method
for measuring expressible moisture, a water-binding property of muscle foods. J.
Food Sci. 46: 1271-1271.
Kauffman, R. G., G. Eikelenboom, P. G. van der Wal, G. Merkus, and M. Zaar. 1986.
The use of filter paper to estimate drip loss of porcine musculature. Meat Sci. 18:
191-200.
Lee, C. M., and K. M. Patel. 1984. Analysis of juiciness of commercial frankfurters. J.
Texture Stud. 15: 67-73.
Lorenzen, C. L., R. K. Miller, J. F. Taylor, T. R. Neely, J. D. Tatum, J. W. Wise, M. J.
Buyck, J. O. Reagan, and J. W. Savell. 2003. Beef customer satisfaction: Trained
sensory panel ratings and Warner-Bratzler shear force values. J. Anim. Sci. 81:
143-149.
Miller, M. F., L. C. Hoover, K. D. Cook, A. L. Guerra, K. L. Huffman, K. S. Tinney, C.
B. Ramsey, H. C. Brittin, and L. M. Huffman. 1995. Consumer acceptability of
beef steak tenderness in the home and restaurant. J. Food Sci. 60: 963-965.
Miller, R. K., and C. Kerth. 2012. Identification of compounds responsible for positive
beef flavor - project summary. National Cattlemen's Beef Association,
Centennial, CO.
Mitsumoto, M., R. N. Arnold, D. M. Schaefer, and R. G. Cassens. 1995. Dietary vitamin
E supplementation shifted weight loss from drip to cooking loss in fresh beef
longissimus during display. J. Anim. Sci. 73: 2289-2294.
Montgomery, J. L., M. B. King, J. G. Gentry, A. R. Barham, B. L. Barham, G. G. Hilton,
J. R. Blanton, R. L. Horst, M. L. Galyean, and K. J. Morrow. 2004. Supplemental
vitamin D3 concentration and biological type of steers. II. Tenderness, quality,
and residues of beef. J. Anim. Sci. 82: 2092-2104.
Montgomery, T. H., and J. M. Leheska. Effects of various management practices on beef-
eating quality.

Texas Tech University, Loni Woolley, December 2014
88
O'Quinn, T. G., J. C. Brooks, R. J. Polkinghorne, A. J. Garmyn, B. J. Johnson, J. D.
Starkey, R. J. Rathmann, and M. F. Miller. 2012. Consumer assessment of beef
strip loin steaks of varying fat levels. J. Anim. Sci. 90: 626-634.
Pearce, K. L., K. Rosenvold, H. J. Andersen, and D. L. Hopkins. 2011. Water distribution
and mobility in meat during the conversion of muscle to meat and ageing and the
impacts on fresh meat quality attributes — A review. Meat Sci. 89: 111-124.
Perry, D., J. M. Thompson, I. H. Hwang, A. Butchers, and A. F. Egan. 2001. Relationship
between objective measurements and taste panel assessment of beef quality. Aust.
J. Exp. Agric. 41: 981-989.
Pietrasik, Z., and J. Janz. 2009. Influence of freezing and thawing on the hydration
characteristics, quality, and consumer acceptance of whole muscle beef injected
with solutions of salt and phosphate. Meat Sci. 81: 523-532.
Platter, W. J., J. D. Tatum, K. E. Belk, P. L. Chapman, J. A. Scanga, and G. C. Smith.
2003. Relationships of consumer sensory ratings, marbling score, and shear force
value to consumer acceptance of beef strip loin steaks. J. Anim. Sci. 81: 2741-
2750.
Savell, J. W. 2011. 2010/2011 National beef tenderness survey - executive summary.
National Cattlemen's Beef Association, Centennial, CO.
Savell, J. W., R. E. Branson, H. R. Cross, D. M. Stiffler, J. W. Wise, D. B. Griffin, and
G. C. Smith. 1987. National consumer retail beef study: palatability evaluations of
beef loin steaks that differed in marbling. J. Food Sci. 52: 517-519.
Savell, J. W., H. R. Cross, and G. C. Smith. 1986. Percentage ether extractable fat and
moisture content of beef longissimus muscle as related to USDA marbling score.
J. Food Sci. 51: 838-839.
Savell, J. W., C. L. Lorenzen, T. R. Neely, R. K. Miller, J. D. Tatum, J. W. Wise, J. F.
Taylor, M. J. Buyck, and J. O. Reagan. 1999. Beef customer satisfaction: cooking
method and degree of doneness effects on the top sirloin steak. J. Anim. Sci. 77:
645-652.
Shackelford, S., T. Wheeler, and M. Koohmaraie. 1999. Evaluation of slice shear force as
an objective method of assessing beef longissimus tenderness. J. Anim. Sci. 77:
2693-2699.
Shackelford, S. D., T. L. Wheeler, and M. Koohmaraie. 1995. Relationship between shear
force and trained sensory panel tenderness ratings of 10 major muscles from Bos
indicus and Bos taurus cattle. J. Anim. Sci. 73: 3333-3340.

Texas Tech University, Loni Woolley, December 2014
89
Shackelford, S. D., T. L. Wheeler, M. K. Meade, J. O. Reagan, B. L. Byrnes, and M.
Koohmaraie. 2001. Consumer impressions of Tender Select beef. J. Anim. Sci.
79: 2605-2614.
Shults, G. W., D. R. Russell, and E. Wierbicki. 1972. Effect of condensed phosphates on
pH, swelling and water-holding capacity of beef. J. Food Sci. 37: 860-864.
Stetzer, A. J., E. Tucker, F. K. McKeith, and M. S. Brewer. 2008. Quality changes in beef
complexus, serratus ventralis, vastus lateralis, vastus medialis, and longissimus
dorsi muscles enhanced prior to aging. J. Food Sci. 73: S6-S10.
Tannor, B., N. G. Clark, and O. G. Hankins. 1943. Mechanical determination of the
juiciness of meat. J. Agr. Research 66: 403-412.
Trout, G. R. 1988. Techniques for measuring water-binding capacity in muscle foods—A
review of methodology. Meat Sci. 23: 235-252.
Van Oeckel, M. J., N. Warnants, and C. V. Boucqué. 1999. Comparison of different
methods for measuring water holding capacity and juiciness of pork versus on-
line screening methods. Meat Sci. 51: 313-320.
Vote, D. J., W. J. Platter, J. D. Tatum, G. R. Schmidt, K. E. Belk, G. C. Smith, and N. C.
Speer. 2000. Injection of beef strip loins with solutions containing sodium
tripolyphosphate, sodium lactate, and sodium chloride to enhance palatability. J.
Anim. Sci. 78: 952-957.
Wheeler, T. L., S. D. Shackelford, and M. Koohmaraie. 1999. Tenderness classification
of beef: III. Effect of the interaction between end point temperature and
tenderness on Warner-Bratzler shear force of beef longissimus. J. Anim. Sci. 77:
400-407.
Wheeler, T. L., S. D. Shackelford, and M. Koohmaraie. 2004. The accuracy and
repeatability of untrained laboratory consumer panelists in detecting differences
in beef longissimus tenderness. J. Anim. Sci. 82: 557-562.
Wicklund, S. E., C. Homco-Ryan, K. J. Ryan, F. K. Mckeith, B. J. Mcfarlane, and M. S.
Brewer. 2005. Aging and enhancement effects on quality characteristics of beef
strip steaks. J. Food Sci. 70: S242-S248.
Wierbicki, E., and F. E. Deatherage. 1958. Water content of meats, determination of
water-holding capacity of fresh meats. J. Agric. Food Chem. 6: 387-392.
Zhang, M., G. S. Mittal, and S. Barbut. 1993. Optimum conditions for determining water
holding capacity of beef by the press method. J. Mus. Foods 4: 255-268.

Texas Tech University, Loni Woolley, December 2014
90
Table 4.1. Interaction (P = 0.0406) between degree of doneness and quality treatment of
least squares means for Slice Shear Force of grilled beef strip loin steaks.
1SE (largest) of the least squares means. abcdeLeast squares means in the same section without a common superscript differ (P < 0.05).
Degree of Doneness/
Quality Treatment
Slice Shear Force,
kg
Rare (60°C)
Prime 11.67abc
Top Choice 12.76a
Low Choice 10.12bc
Select 12.45ab
Standard 12.42ab
Select HE 9.16c
Select LE 9.39c
SEM1 0.91
P - value 0.0095
Medium (71°C)
Prime 9.51cd
Top Choice 11.10abc
Low Choice 10.57bcd
Select 13.44a
Standard 13.06ab
Select HE 8.10d
Select LE 8.38d
SEM1 0.91
P - value < 0.0001
Well-Done (77°C)
Prime 10.22cd
Top Choice 12.60bc
Low Choice 11.55cd
Select 14.96ab
Standard 17.04a
Select HE 7.31e
Select LE 9.04de
SEM1 0.91
P - value < 0.0001

Texas Tech University, Loni Woolley, December 2014
91
Table 4.2. Least squares means for color, proximate and pH analysis of raw beef strip loin steaks of varying quality treatments.
%
Quality Treatment L* a* b* Fat Moisture Protein pH
Prime 44.10a
28.80ab
22.12ab
11.26a 65.84
e 21.85
c 5.76
c
Top Choice 42.59ab
28.87ab
21.92ab
7.54b 68.35
d 22.81
b 5.76
c
Low Choice 40.90bc
29.46a
22.67a
4.79c 70.45
c 23.77
a 5.76
bc
Select 37.17de
28.26bc
20.74c
3.17d 71.73
b 23.54
a 5.83
b
Standard 38.13de
28.34abc
21.05bc
1.82e 73.54
a 23.50
a 5.83
b
Select HE1 39.18
cd 27.11
d 19.11
d 2.97
d 73.77
a 21.86
c 6.00
a
Select LE1 35.58
e 27.42
cd 19.36
d 3.49
d 72.26
b 22.35
bc 6.02
a
SEM2 0.98 0.40 0.42 0.35 0.34 0.18 0.02
P - value < 0.0001 0.001 < 0.0001 < 0.0001 < 0.0001 < 0.0001 < 0.0001 1HE = High Enhanced (112% of raw weight), LE = Low Enhanced (107% of raw weight) with a salt, alkaline phosphate and water solution. 2SE (largest) of the least squares means. abcdeLeast squares means in the same column without a common superscript differ (P < 0.05).

Texas Tech University, Loni Woolley, December 2014
92
Table 4.3. Least squares means for objective juiciness analyses of raw beef strip loin steaks of varying quality treatments.
1Carver press areas and circumferences of moisture and meat rings measured on filter paper after compression of sample between filter paper at a pressure of 500 psi for
60 seconds. 2Determined by methods described by Wierbicki and Deatherage (1958).
3Determined by methods described by Pietrasik and Janz (2009). 4Percentage of raw sample weight lost when stored at 2 to 4°C. 5Determined by methods described by Pietrasik and Janz (2009). 6HE = High Enhanced (112% of raw weight), LE = Low Enhanced (107% of raw weight) with a salt, alkaline phosphate and water solution.
7SE (largest) of the least squares means. abcdeLeast squares means in the same column without a common superscript differ (P < 0.05).
Quality
Treatment
Total
Area1, in2
Meat Ring
Area1, in2
Total
Circumference1, in
Meat Ring
Circumference1, in
Free
Water2, %
Bound
Water2, %
Protein
Swelling3, %
24 h Drip
Loss4, %
48 h Drip
Loss4, %
Expressible
Moisture5, %
WHC5,
%
Water
Activity
Prime 2.21c 1.54bc 6.02abc 5.02b 11.57bcd 88.43abc 41.40ab 0.03b 0.06b 11.61 82.37 0.97
Top Choice 2.36abc 1.52bc 6.15a 4.91bc 13.97a 86.03d 32.59b 0.02b 0.04b 12.42 81.83 0.97
Low Choice 2.31abc 1.58b 6.05abc 4.96bc 11.57bcd 88.43abc 31.64b 0.01b 0.04b 12.37 82.48 0.97
Select 2.18c 1.41c 5.86c 4.73c 12.45ab 87.55cd 37.83ab 0.06b 0.01b 13.38 81.37 0.98
Standard 2.24bc 1.51bc 5.91bc 4.85bc 12.23abc 87.77bcd 31.40b 0.33a 0.55a 14.17 80.74 0.97
Select HE6 2.39ab 1.77a 6.11ab 5.36a 9.55d 90.45a 43.78a 0.00b 0.00b 12.54 83.01 0.97
Select LE6 2.44a 1.77a 6.18a 5.30a 10.18cd 89.82ab 45.68a 0.00b 0.00b 13.55 81.27 0.97
SEM7 0.06 0.06 0.08 0.10 0.73 0.72 3.92 0.06 0.10 0.81 1.22 0.00
P - value 0.0349 < 0.0001 0.0499 < 0.0001 0.0013 0.0013 0.0388 0.0006 0.0015 0.3365 0.8191 0.3115

Texas Tech University, Loni Woolley, December 2014
93
Table 4.4. Least squares means for objective analyses of cooked beef strip loin steaks of varying quality treatments.
1Pressed Juice Percentage (PJP): Percentage moisture lost during compression of sample between filter paper at 8 kg pressure for 30 seconds.
2Areas and circumferences of moisture ring measured on filter paper following PJP compression.
3Determined by methods described by Lee and Patel (1984).
4Determined by methods described by Pietrasik and Janz (2009).
5Percentage of cooked sample weight lost when stored at 23°C.
6Percentage moisture lost during compression of sample between filter paper at a pressure of 500 psi for 60 seconds.
7Carver press areas and circumferences of moisture and meat rings measured on filter paper after compression of sample between filter paper at a pressure of 500 psi for 60 seconds.
8HE = High Enhanced (112% of raw weight), LE = Low Enhanced (107% of raw weight) with a salt, alkaline phosphate and water solution.
9SE (largest) of the least squares means.
abcdLeast squares means in the same column without a common superscript differ (P < 0.05).
Quality
Treatment
PJP1, % PJP Area
2,
in2
PJP Circ.2,
in
PJP Fat3, % Cook Loss,
%
Expressible
Moisture4,
%
24 h Drip
Loss5, %
48 h Drip
Loss5, %
Carver
Press PJP6,
%
Carver Press
Total Area7,
in2
Carver
Press Meat
Ring
Area7, in
2
Carver
Press
Meat
Ring Circ.
7, in
Prime 22.66b
5.41cd
9.70
2.51a
15.74c
20.12bc
0.76
0.92ab
41.80a
2.07cd
0.72 3.37
Top Choice 22.08bc
5.31d
10.31
1.35b
16.38bc
19.81bc
0.79
0.97ab
40.13abc
2.10c
0.72 3.37
Low Choice 22.16bc
5.72bc
9.82 0.57c
17.00b
19.33c
0.39
0.53b
37.82cd
2.09c
0.74 3.43
Select 21.87bc
5.85b
9.94 0.39c
18.71a
20.31bc
0.62
0.92ab
38.76bcd
2.06cd
0.71 3.35
Standard 21.43c
5.73bc
9.85 0.12d
19.67a
19.21c
0.65
0.60b
37.29d
2.02d
0.74 3.40
Select HE8 25.66
a 7.13
a 10.96 0.44
c 16.44
bc 22.18
a 0.95
1.39
a 40.83
ab 2.29
a 0.76 3.45
Select LE8 22.28
bc 5.76
bc 9.84 0.46
c 15.95
c 20.76
b 0.80
1.14
a 39.18
abcd 2.17
b 0.76 3.46
SEM9 0.37 0.14 0.32 0.10 0.35 0.42 0.18 0.19 1.01 0.02 0.01 0.03
P - value < 0.0001 < 0.0001 0.0788 < 0.0001 < 0.0001 < 0.0001 0.4636 0.0234 0.0199 < 0.0001 0.0748 0.2076

Texas Tech University, Loni Woolley, December 2014
94
Table 4.5. Least squares means for objective analyses of grilled beef strip loin steaks cooked to three degrees of doneness.
Degree of
Doneness
PJP1, % PJP Area2,
in2
PJP Circ.2,
in
PJP Fat3,
%
Cook
Loss, %
Expressible
Moisture4,
%
24 h Drip
Loss5, %
48 h Drip
Loss5, %
Carver
Press PJP6,
%
Carver
Press Total
Area7, in2
Carver
Press Meat
Ring Area7, in2
Carver
Press Meat
Ring Circ.7, in
Rare (60°C) 27.21a 6.51a 10.81a 1.20a 11.53c 25.00a 1.42a 1.74a 42.72a 2.22a 0.77a 3.47a
Medium
(71°C)
22.42b 5.88b 9.91b 0.78b 16.99b 19.48b 0.44b 0.59b 37.05b 2.13b 0.75a 3.45a
Well-Done
(77°C)
18.15c 5.14c 9.45b 0.53c 22.86a 16.25c 0.26b 0.44b 38.44b 1.99c 0.69b 3.29b
SEM8 0.24 0.09 0.21 0.06 0.23 0.27 0.12 0.12 0.66 0.01 0.01 0.02
P - value < 0.0001 < 0.0001 < 0.0001 < 0.0001 < 0.0001 < 0.0001 < 0.0001 < 0.0001 < 0.0001 < 0.0001 < 0.0001 < 0.0001 1Pressed Juice Percentage (PJP): Percentage moisture lost during compression of sample between filter paper at 8 kg pressure for 30 seconds. 2Areas and circumferences of moisture ring measured on filter paper following PJP compression. 3Determined by methods described by Lee and Patel (1984).
4Determined by methods described by Pietrasik and Janz (2009). 5Percentage of cooked sample weight lost when stored at 23°C. 6Percentage moisture lost during compression of sample between filter paper at a pressure of 500 psi for 60 seconds. 7Carver press areas and circumferences of moisture and meat rings measured on filter paper after compression of sample between filter paper at a pressure of 500 psi for 60 seconds. 8HE = High Enhanced (112% of raw weight), LE = Low Enhanced (107% of raw weight) with a salt, alkaline phosphate and water solution. 9SE (largest) of the least squares means. abcLeast squares means in the same column without a common superscript differ (P < 0.05).

Texas Tech University, Loni Woolley, December 2014
95
Table 4.6. Interaction (P = 0.0453) between degree of doneness and quality treatment of
least squares means for Carver Press total circumference1 of grilled beef strip loin steaks.
Degree of Doneness/
Quality Treatment
Carver Press Total
Circumference1, in
Rare (60°C)
Prime 6.02
Top Choice 6.01
Low Choice 5.92
Select 5.82
Standard 5.85
Select HE 5.93
Select LE 5.88
SEM2 0.07
P - value 0.2552
Medium (71°C)
Prime 5.88 ab
Top Choice 5.80 ab
Low Choice 5.73 bc
Select 5.77 ab
Standard 5.58c
Select HE 5.95a
Select LE 5.92ab
SEM2 0.07
P - value 0.0021
Well-Done (77°C)
Prime 5.46cd
Top Choice 5.55bc
Low Choice 5.56bc
Select 5.46cd
Standard 5.35d
Select HE 5.80a
Select LE 5.73ab
SEM2 0.07
P - value < 0.0001 1Carver press circumference of moisture ring measured on filter paper after compression of sample between filter paper
at a pressure of 500 psi for 60 seconds. 2SE (largest) of the least squares means. abcdLeast squares means in the same section without a common superscript differ (P < 0.05).

Texas Tech University, Loni Woolley, December 2014
96
Table 4.7. Pearson correlation coefficients for cooked objective measurements, raw objective measurements, proximate
and color data for beef strip steaks varying in fat and quality treatment.
1Sensory scores: 0 = extremely dry, dislike extremely; 100 = extremely juicy, like extremely. 2 Pressed Juice Percentage (PJP): Percentage moisture lost during compression of sample between filter paper at 8 kg
pressure for 30 seconds. 3Areas and circumferences of moisture ring measured on filter paper of PJP method. 4Determined by methods described by Lee and Patel (1984).
5Determined by methods described by Pietrasik and Janz (2009). 6Percentage of sample weight lost following storage time. 7Carver PJP: Percentage moisture lost during compression of sample between filter paper at a pressure of 500 psi for 60
seconds. 8Carver press areas and circumferences of moisture and meat rings measured on filter paper after compression of
sample between filter paper at a pressure of 500 psi for 60 seconds. 9Determined by methods described by Wierbicki and Deatherage (1958).
Measurement Consumer
Juiciness1
Consumer
Overall Like1
Trained Initial
Juiciness1
Trained
Sustained
Juiciness1
Cooked Objective Measurements
PJP2, % 0.45** 0.25** 0.69** 0.67**
PJP Area3, in2 0.24** 0.19** 0.39** 0.38**
PJP Circumference3, in 0.06 0.06 0.22** 0.22**
PJP Fat4, % 0.39** 0.24** 0.34** 0.37**
Expressible Moisture5, % 0.41** 0.19** 0.64** 0.62**
Slice Shear Force, kg -0.38** -0.48** -0.39** -0.38**
24 h Drip Loss6, % 0.23** 0.07 0.29** 0.31**
48 h Drip Loss6, % 0.27** 0.10 0.35** 0.36**
Carver PJP7, % 0.24** 0.11 0.28** 0.27**
Total Area8, in2 0.41** 0.26** 0.51** 0.49**
Total Circumference8, in 0.38** 0.22** 0.46** 0.44**
Meat Film Area8, in2 0.14* 0.02 0.21** 0.23**
Meat Film Circumference8, in 0.11 -0.02 0.20** 0.21**
Consumer Endpoint Temperature, °C -0.39** -0.08 - -
Consumer Cook Loss, % -0.51** -0.23** - -
Trained Endpoint Temperature, °C - - -0.66** -0.65**
Trained Cook Loss, % - - -0.75** -0.73**
Raw Objective Measurements
TTU Personnel Marbling Score 0.33** 0.21** 0.21** 0.24**
Camera Marbling Score 0.37** 0.26** 0.23** 0.25**
Total Area8, in2 0.12* 0.22** 0.09 0.08
Total Circumference8, in 0.20** 0.27** 0.11 0.11
Meat Film Area8, in2 0.21** 0.34** 0.23** 0.23**
Meat Film Circumference8, in 0.28** 0.38** 0.27** 0.27**
Free Water9, % -0.11 -0.19** -0.19** -0.20**
Bound Water9, % 0.11 0.19** 0.19** 0.20**
Expressible Moisture5, % -0.14* -0.15* -0.17** -0.19**
Water Holding Capacity5, % 0.09 0.12 0.15* 0.16*
Protein Swelling10, % 0.15* 0.13* 0.23** 0.24**
24 h Drip Loss6, % -0.19** -0.22** -0.21** -0.21**
48 h Drip Loss6, % -0.14* -0.17** -0.18** -0.19**
Water Activity -0.14* -0.16** -0.15* -0.18**
Proximate Composition
Fat, % 0.37** 0.24** 0.23** 0.26**
Moisture, % -0.23** -0.12 -0.15* -0.17**
Protein, % -0.55** -0.51** -0.41** -0.44**
pH 0.20** 0.23** 0.23** 0.25**
Color
L* 0.17** 0.17** 0.08 0.09
a* -0.15* -0.19** -0.18** -0.18**
b* -0.15* -0.21** -0.19** -0.19**

Texas Tech University, Loni Woolley, December 2014
97
Table 4.7 Continued
10Determined by methods described by Pietrasik and Janz (2009).
*Correlation coefficient differs from 0 (P < 0.05).
**Correlation coefficient differs from 0 (P < 0.01).

Texas Tech University, Loni Woolley, December 2014
98
Table 4.8. Simple linear regression equations for predicting consumer sensory panel juiciness scores for beef strip
steaks varying in fat and quality treatment.
1 Pressed Juice Percentage (PJP): Percentage moisture lost during compression of sample between filter paper at 8 kg
pressure for 30 seconds. 2Areas and circumferences of moisture ring measured on filter paper of PJP method. 3Determined by methods described by Lee and Patel (1984).
4Determined by methods described by Pietrasik and Janz (2009). 5Percentage of sample weight lost following storage time. 6Carver PJP: Percentage moisture lost during compression of sample between filter paper at a pressure of 500 psi for 60
seconds. 7Carver press areas and circumferences of moisture and meat rings measured on filter paper after compression of
sample between filter paper at a pressure of 500 psi for 60 seconds. 8Determined by methods described by Wierbicki and Deatherage (1958). 9Determined by methods described by Pietrasik and Janz (2009).
Measurement Intercept Regression coefficient Adjusted R2 P - value
Cooked Objective Measurements
PJP1, % 31.21 1.50 0.20 < 0.0001
PJP Area2, in2 46.53 3.19 0.05 0.0001
PJP Circumference2, in 60.76 0.44 0.00 0.3505
PJP Fat3, % 60.41 169.41 0.14 < 0.0001
Expressible Moisture4, % 37.51 1.37 0.16 < 0.0001
Slice Shear Force, kg 81.67 -1.48 0.14 < 0.0001
24 h Drip Loss5, % 63.21 2.75 0.05 0.0003
48 h Drip Loss5, % 62.28 3.11 0.07 < 0.0001
Carver PJP6, % 43.83 0.54 0.05 0.0001
Total Area7, in2 -4.32 32.87 0.16 < 0.0001
Total Circumference7, in -47.03 19.48 0.14 < 0.0001
Meat Film Area7, in2 47.48 24.00 0.02 0.0259
Meat Film Circumference7, in 40.99 7.10 0.01 0.0955
Endpoint Temperature, °C 114.99 -0.70 0.15 < 0.0001
Cook Loss, % 86.93 -145.00 0.25 < 0.0001
Raw Objective Measurements
TTU Personnel Marbling Score 52.33 0.03 0.10 < 0.0001
Camera Marbling Score 49.91 0.03 0.14 < 0.0001
Total Area7, in2 46.08 8.28 0.01 0.0491
Total Circumference7, in 3.56 10.20 0.04 0.0012
Meat Film Area7, in2 43.54 13.64 0.04 0.0009
Meat Film Circumference7, in 10.15 10.96 0.08 < 0.0001
Free Water8, % 72.29 -61.23 0.01 0.0714
Bound Water8, % 11.06 61.23 0.01 0.0714
Expressible Moisture4, % 74.15 -72.60 0.01 0.0326
Water Holding Capacity4, % 35.86 35.36 0.00 0.1620
Protein Swelling9, % 59.20 0.16 0.02 0.0172
24 h Drip Loss5, % 66.02 -1328.16 0.03 0.0024
48 h Drip Loss5, % 65.71 -555.90 0.02 0.0246
Water Activity 398.59 -342.58 0.01 0.0313
Proximate Composition
Fat, % 56.80 1.67 0.13 < 0.0001
Moisture, % 150.33 -1.20 0.05 0.0002
Protein, % 26.14 -8.55 0.30 < 0.0001
pH -66.29 22.47 0.04 0.0016
Color
L* 41.20 0.60 0.03 0.0057
a* 106.81 -1.47 0.02 0.0158
b* 89.46 -1.16 0.02 0.0211

Texas Tech University, Loni Woolley, December 2014
99
Table 4.9. Simple linear regression equations for predicting trained sensory panel initial juiciness scores for beef strip
steaks varying in fat and quality treatment.
1 Pressed Juice Percentage (PJP): Percentage moisture lost during compression of sample between filter paper at 8 kg
pressure for 30 seconds. 2Areas and circumferences of moisture ring measured on filter paper of PJP method. 3Determined by methods described by Lee and Patel (1984).
4Determined by methods described by Pietrasik and Janz (2009). 5Percentage of sample weight lost following storage time. 6Carver PJP: Percentage moisture lost during compression of sample between filter paper at a pressure of 500 psi for 60
seconds. 7Carver press areas and circumferences of moisture and meat rings measured on filter paper after compression of
sample between filter paper at a pressure of 500 psi for 60 seconds. 8Determined by methods described by Wierbicki and Deatherage (1958). 9Determined by methods described by Pietrasik and Janz (2009).
Measurement Intercept Regression
coefficient
Adjusted R2 P - value
Cooked Objective Measurements
PJP1, % -11.46 2.91 0.48 < 0.0001
PJP Area2, in2 16.25 6.51 0.15 < 0.0001
PJP Circumference2, in 34.28 1.99 0.04 0.0006
PJP Fat3, % 49.22 182.78 0.11 < 0.0001
Expressible Moisture4, % 0.32 2.67 0.41 < 0.0001
Slice Shear Force, kg 75.61 -1.90 0.15 < 0.0001
24 h Drip Loss5, % 51.23 4.44 0.08 < 0.0001
48 h Drip Loss5, % 49.81 4.93 0.12 < 0.0001
Carver PJP6, % 23.16 0.79 0.08 < 0.0001
Total Area7, in2 -53.59 51.05 0.25 < 0.0001
Total Circumference7, in -114.36 29.29 0.21 < 0.0001
Meat Film Area7, in2 21.01 45.30 0.04 0.0007
Meat Film Circumference7, in -2.84 16.80 0.04 0.0014
Endpoint Temperature, °C 151.93 -1.41 0.44 0.0001
Cook Loss, % 98.17 -303.18 0.55 < 0.0001
Raw Objective Measurements
TTU Personnel Marbling Score 44.27 0.02 0.04 0.0009
Camera Marbling Score 42.87 0.02 0.05 0.0003
Total Area7, in2 36.82 7.61 0.00 0.1490
Total Circumference7, in 10.90 7.19 0.01 0.0704
Meat Film Area7, in2 24.10 19.08 0.05 0.0002
Meat Film Circumference7, in -10.75 12.97 0.07 < 0.0001
Free Water8, % 69.31 -128.34 0.03 0.0023
Bound Water8, % -59.03 128.34 0.03 0.0023
Expressible Moisture4, % 69.13 -116.93 0.03 0.0061
Water Holding Capacity4, % -7.04 74.68 0.02 0.0187
Protein Swelling9, % 43.15 0.30 0.05 0.0003
24 h Drip Loss5, % 55.52 -1779.90 0.04 0.0011
48 h Drip Loss5, % 55.27 -901.23 0.03 0.0034
Water Activity 528.24 -486.87 0.02 0.0141
Proximate Composition
Fat, % 47.74 1.32 0.05 0.0002
Moisture, % 122.23 -0.96 0.02 0.0176
Protein, % 234.66 -7.90 0.16 < 0.0001
pH -138.52 32.97 0.05 0.0002
Color
L* 41.35 0.33 0.00 0.2310
a* 114.83 -2.13 0.03 0.0049
b* 94.72 -1.92 0.03 0.0021

Texas Tech University, Loni Woolley, December 2014
100
Table 4.10. Simple linear regression equations for predicting trained sensory panel sustained juiciness scores for beef
strip steaks varying in fat and quality treatment.
1 Pressed Juice Percentage (PJP): Percentage moisture lost during compression of sample between filter paper at 8 kg
pressure for 30 seconds. 2Areas and circumferences of moisture ring measured on filter paper of PJP method. 3Determined by methods described by Lee and Patel (1984).
4Determined by methods described by Pietrasik and Janz (2009). 5Percentage of sample weight lost following storage time. 6Carver PJP: Percentage moisture lost during compression of sample between filter paper at a pressure of 500 psi for 60
seconds. 7Carver press areas and circumferences of moisture and meat rings measured on filter paper after compression of
sample between filter paper at a pressure of 500 psi for 60 seconds. 8Determined by methods described by Wierbicki and Deatherage (1958). 9Determined by methods described by Pietrasik and Janz (2009).
Measurement Intercept Regression coefficient Adjusted R2 P - value
Cooked Objective Measurements
PJP1, % -18.10 2.94 0.45 < 0.0001
PJP Area2, in2 9.54 6.64 0.14 < 0.0001
PJP Circumference2, in 26.63 2.16 0.05 0.0003
PJP Fat3, % 42.52 209.22 0.13 < 0.0001
Expressible Moisture4, % -6.59 2.71 0.39 < 0.0001
Slice Shear Force, kg 70.16 -1.94 0.14 < 0.0001
24 h Drip Loss5, % 45.00 4.83 0.09 < 0.0001
48 h Drip Loss5, % 43.48 5.32 0.12 < 0.0001
Carver PJP6, % 17.14 0.79 0.07 < 0.0001
Total Area7, in2 -59.84 51.19 0.23 < 0.0001
Total Circumference7, in -120.18 29.26 0.19 < 0.0001
Meat Film Area7, in2 11.53 50.08 0.05 0.0003
Meat Film Circumference7, in -15.05 18.64 0.04 0.0007
Endpoint Temperature, °C 147.60 -1.43 0.42 < 0.0001
Cook Loss, % 93.21 -310.17 0.53 < 0.0001
Raw Objective Measurements
TTU Personnel Marbling Score 36.27 0.03 0.05 0.0001
Camera Marbling Score 34.92 0.03 0.06 < 0.0001
Total Area7, in2 32.03 7.10 0.00 0.1962
Total Circumference7, in 3.66 7.41 0.01 0.0738
Meat Film Area7, in2 16.76 19.95 0.05 0.0002
Meat Film Circumference7, in -19.43 13.51 0.07 < 0.0001
Free Water8, % 64.62 -139.26 0.04 0.0015
Bound Water8, % -74.64 139.26 0.04 0.0015
Expressible Moisture4, % 64.77 -129.77 0.03 0.0034
Water Holding Capacity4, % -18.73 81.61 0.02 0.0134
Protein Swelling9, % 36.01 0.33 0.05 0.0001
24 h Drip Loss5, % 49.64 -1910.75 0.04 0.0007
48 h Drip Loss5, % 49.39 -981.15 0.03 0.0022
Water Activity 619.70 -586.96 0.03 0.0044
Proximate Composition
Fat, % 40.57 1.56 0.07 < 0.0001
Moisture, % 129.49 -1.14 0.03 0.0064
Protein, % 253.29 -8.98 0.19 < 0.0001
pH -163.49 36.22 0.06 < 0.0001
Color
L* 32.34 0.41 0.00 0.1557
a* 111.39 -2.22 0.03 0.0049
b* 90.20 -1.99 0.03 0.0022

Texas Tech University, Loni Woolley, December 2014
101
Figure 4.1. Location of Pressed Juice Percentage (PJP) slice removal and PJP sample
removal [image modified from Derington et al., (2011)].
Slice Shear Sample
PJP Sample
PJP
Sample 1
PJP
Sample 2
PJP
Sample 3
PJP Slice with fiber orientation

Texas Tech University, Loni Woolley, December 2014
102
Figure 4.2. Regression equation for predicting consumer sensory juiciness scores for beef
strip steaks by pressed juice percentage.
y = 1.50x + 31.21
R2 = 0.20
10
20
30
40
50
60
70
80
90
100
10.00 15.00 20.00 25.00 30.00 35.00
Co
nsu
mer
Ju
icin
ess
Sco
re
Pressed Juice Percentage, %

Texas Tech University, Loni Woolley, December 2014
103
Figure 4.3. Regression equation for predicting trained sensory panel initial juiciness
scores for beef strip steaks by pressed juice percentage.
y = 2.91x - 11.46
R² = 0.48
0
10
20
30
40
50
60
70
80
90
100
10.00 15.00 20.00 25.00 30.00 35.00
Tra
ined
Pa
nel
In
itia
l J
uic
ines
s S
core
Pressed Juice Percentage, %

Texas Tech University, Loni Woolley, December 2014
104
Figure 4.4. Regression equation for predicting trained sensory panel sustained juiciness
scores for beef strip steaks by pressed juice percentage.
y = 2.94x - 18.10
R² = 0.45
0
10
20
30
40
50
60
70
80
90
100
10.00 15.00 20.00 25.00 30.00 35.00
Tra
ined
Pa
nel
Su
sta
ined
Ju
icin
ess
Sco
re
Pressed Juice Percentage, %

Texas Tech University, Loni Woolley, December 2014
105
Figure 4.5. Regression equation for predicting consumer sensory tenderness scores for
beef strip steaks by Slice Shear Force.
y = 0.065x2 - 4.09x + 100.96
R² = 0.26
0
10
20
30
40
50
60
70
80
90
100
3.00 8.00 13.00 18.00 23.00 28.00
Co
nsu
mer
Ten
der
nes
s S
core
Slice Shear Force, kg

Texas Tech University, Loni Woolley, December 2014
106
Figure 4.6. Regression equation for predicting trained sensory panel initial tenderness
scores for beef strip steaks by Slice Shear Force.
0
10
20
30
40
50
60
70
80
90
100
3.00 8.00 13.00 18.00 23.00 28.00
Tra
ined
Pa
nel
In
itia
l T
end
ern
ess
Sco
re
Slice Shear Force, kg
y = 0.11x2 - 5.91x + 108.57
R² = 0.39

Texas Tech University, Loni Woolley, December 2014
107
Figure 4.7. Regression equation for predicting trained sensory panel sustained tenderness
scores for beef strip steaks by Slice Shear Force.
y = 0.12x2 - 6.46x + 106.27
R² = 0.40
0
10
20
30
40
50
60
70
80
90
100
3.00 8.00 13.00 18.00 23.00 28.00
Tra
ined
Pa
nel
Su
sta
ined
Ten
der
nes
s S
core
Slice Shear Force, kg

Texas Tech University, Loni Woolley, December 2014
108
Figure 4.8. Probability of a sample being rated as acceptable for juiciness by consumers
based on pressed juice percentage.
40%
50%
60%
70%
80%
90%
100%
8 13 18 23 28 33 38
Pro
ba
bil
ity
Pressed Juice Percentage
P = (e-1.55+0.1433x
) / (1 + e-1.55+0.1433x
)
R2 = 0.05
Slope = 0.14, SE = 0.33
Intercept = -1.55, SE = 0.02
P < 0.0001