Evaluation of Low Impact Development on a Watershed Basis: Two Case Studies … · 2020-06-22 ·...
46
Evaluation of Low Impact Development on a Watershed Basis: Two Case Studies in the Philadelphia Region. Jeffrey Featherstone Richard Fromuth Richard Nalbandian Temple University Center for Sustainable Communities 580 Meetinghouse Road Ambler, PA 19002 http://www.temple.edu/ambler/csc/index.html Detention Site Infiltration Site Riparian Buffer Restoration
Transcript of Evaluation of Low Impact Development on a Watershed Basis: Two Case Studies … · 2020-06-22 ·...

Evaluation of Low Impact Development on a Watershed Basis: Two Case Studies in the Philadelphia Region.
Jeffrey FeatherstoneRichard FromuthRichard Nalbandian
Temple UniversityCenter for Sustainable Communities580 Meetinghouse RoadAmbler, PA 19002
http://www.temple.edu/ambler/csc/index.html
Detention Site
Infiltration Site
Riparian Buffer Restoration

Evaluation of Low Impact Development on a Watershed Basis
Approach:
•Problem Identification
•Data Collection
•Field inspection of storm water facilitiesand obstructions.
•Hydrologic Modeling using HEC-HMS
•Hydraulic Modeling using HEC-RAS
•Evaluation of improvements
•Applications
Pennypack Watershed (55 mi2)
Sandy Run Watershed (13 mi2)

•Problem Identification

Summary of 303 (d) List Impairments In the Pennypack Watershed
Reference: Table 2.12 and Figure 2.10of the Comprehensive Characterization Report for the Pennypack Creek Watershed –Philadelphia Water Department, 2009
Water Quality ImpairmentSection 303 (d) – Clean Water Act
Four Designated Use Categories Aquatic Life Water Supply Fish Consumption Recreation

Erosion and Sedimentation

Precipitation Data Provided by the City of Philadelphia Water Department
0
0.5
1
1.5
2
2.5
3
3.5
4
4.5
5
1/1
1/5
1/6
1/7
1/8
1/13
1/14
1/19 2/2
2/20
2/21
2/22
2/26
2/27 3/1
3/2
3/10
3/22
3/23
3/24
3/25 4/1
4/2
4/4
4/12
4/15
4/16
4/19
4/25
4/27
5/12
5/15
5/22 6/3
6/4
6/11
6/13
6/27
6/28 7/5
7/6
7/23
9/11
9/15
10/9
10/1
0
10/1
1
10/2
4
10/2
5
10/2
6
10/2
7
11/6
11/1
2
11/1
3
11/1
5
11/1
8
11/1
9
11/2
2
11/2
6
Inches
Jan-Nov 2007 Precipitation Events in Central Pennypack Watershed
Many existing detention facilities do not retain significant runoff from small events.These events account for a large portion of annual runoff volume.

Flood Damage – Major Events
•Increased Impervious Cover
•Increased Peak Flows
•Increased Runoff Volumes
•Extensive Floodplain Development
•More Frequent Extreme Events

•Data Collection

Digital Ortho-photo & High-Resolution Elevation Data
• Aerial mapping was done in non-growing season• 1” = 660’ negative scale using Airborne GPS technology flight

102 Feet Contour Data and Ortho-photo

Physical Characteristics of the Pennypack Watershed
Elevation Existing Land Use

Physical Characteristics of the Pennypack WatershedSoil Erodibility RatingHydrologic Soil Group

•Field Inspection

Inventory of Obstructions, Existing Detention Structures, and Potential BMP’s

15
Obstruction Inventory

Inventory of Existing Detention Structures and Potential BMP’s

Hydrologic Modeling

• Pennypack TIN(Triangulated Irregular Network)
Subbasin DelineationBased on Topography

Runoff Curve Numberswere generated from 2005 land use and NRCSsoils data.
Less than 7070-7575-8080-85Greater than 85
Based on 2005 Land Use Data from the DVRPC and on NRCS Soils Data
Curve Numbers are a function of Soil Group and land use and determine the relativerunoff volume for a given storm event.
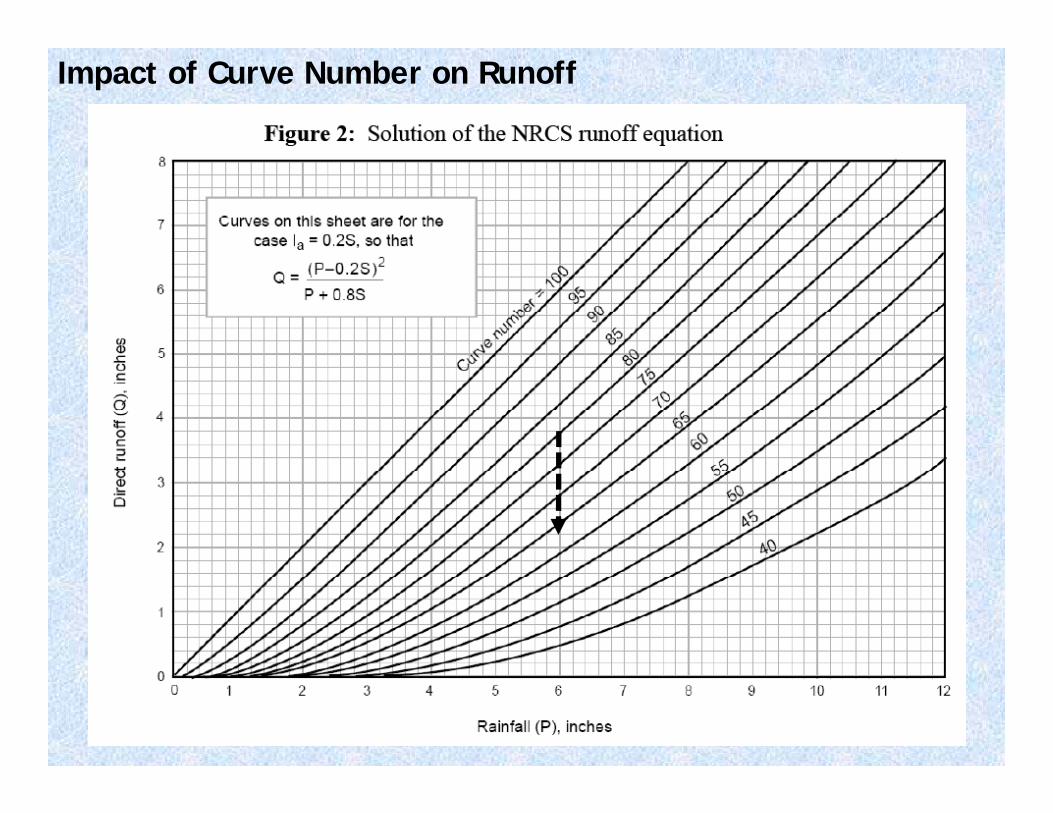
Impact of Curve Number on Runoff

% Impervious Cover
Estimated for each landuse type and assumed anddetermined for each modelsubbasin
Less than 15%
15% - 25%
25%-50%
Greater than 50%

Design Storm Rainfall
Design rainfall was based on the upper limit of the 90% confidenceinterval from NOAA Atlas 14 for the 24 hour Type II storm.
Storm Frequency Total Precipitation (in)
1-Yr 2.982-Yr 3.605-Yr 4.5510-Yr 5.3525-Yr 6.5050-Yr 7.50100-Yr 8.60500-Yr 11.61

23
0
500
1000
1500
2000
2500
5/17
/02
12:0
0
5/18
/02
0:00
5/18
/02
12:0
0
5/19
/02
0:00
Disc
harg
e, c
fs
May 2002 (1.8 inch, 33 hr)
Model Testing and Calibration
y = 1.1344xR² = 0.8395
0
1000
2000
3000
4000
5000
6000
7000
0 1000 2000 3000 4000 5000
Mod
el P
eak
(CFS
)
Monitor Peak (CFS)
Scatter Plot of Observed vs. Predicted Peak Flows
y = 1.0662x - 1.5242R² = 0.9674
0.010.020.030.040.050.060.070.080.090.0
100.0
0.0 20.0 40.0 60.0 80.0 100.0
Mod
el V
olum
e (M
Gx1
0)
Monitor Volume (MGx10)
Scatter Plot of Observed vs. Predicted Event Volume

Hydraulic Modeling

Develop Model Stream Geometry and Input X-Section Data

26
Input Obstruction Geometry and Channel Characteristics

27
100 150 200 250 300 350258
260
262
264
266
268
270
272
Station (ft)
Ele
vatio
n (ft
)
Legend
WS floodway
WS 500 yr
WS 100 yr
WS 50 yr
WS 10 yr
Ground
Ineff
Bank Sta
Encroachment
.03 .1 .01
Perform Hydaulic Modeling for Design Storms Based on Hydrologic Model Output

Evaluation of Improvements

Detention Site Inventory

Site P-AB06: Holy Redeemer Village – Abington TownshipRecommendation- Raise berm 1 ft. Lower floor 2 ft. Modify outlet and piping.
Estimated cost = $108,000 Additional Volume = 1.80 Acre-Ft

Infiltration Site Inventory

Site P-AB04: Penn State Abington CampusRecommendation- Install infiltration trenches for roof and parking drainage. 1” infiltration
Estimated cost = $109,000 Volume = 0.57 Acre-Ft

Riparian Buffer Restoration Based on Survey by Heritage ConservancyLocation: Meadow Brook in Abington Township
Restoration for one side of stream. Width = 75 ft.

Detention SitesAdditional 300 Acre-Ft
Infiltration SitesAdditional 56 Acre-Ft
Riparian Buffer Restoration AreasAdditional 27 Acre-Ft
Potential ImprovementsPennypack Watershed
Estimated Cost of ImprovemenetsDetention Sites – $ 21.4 millionInfiltration Sites – $11.1 millionRiparian Buffer Restoration – $1.5 million
Note: 1 inch of storage is 53.3 acre-Ft per square mile,or approximately 3,000 acre-Ft for the Pennypack watershed.

Potential ImprovementsTributary to Blair Mill Run – Warminster Township
Detention Site
Infiltration Site
Riparian Buffer Restoration

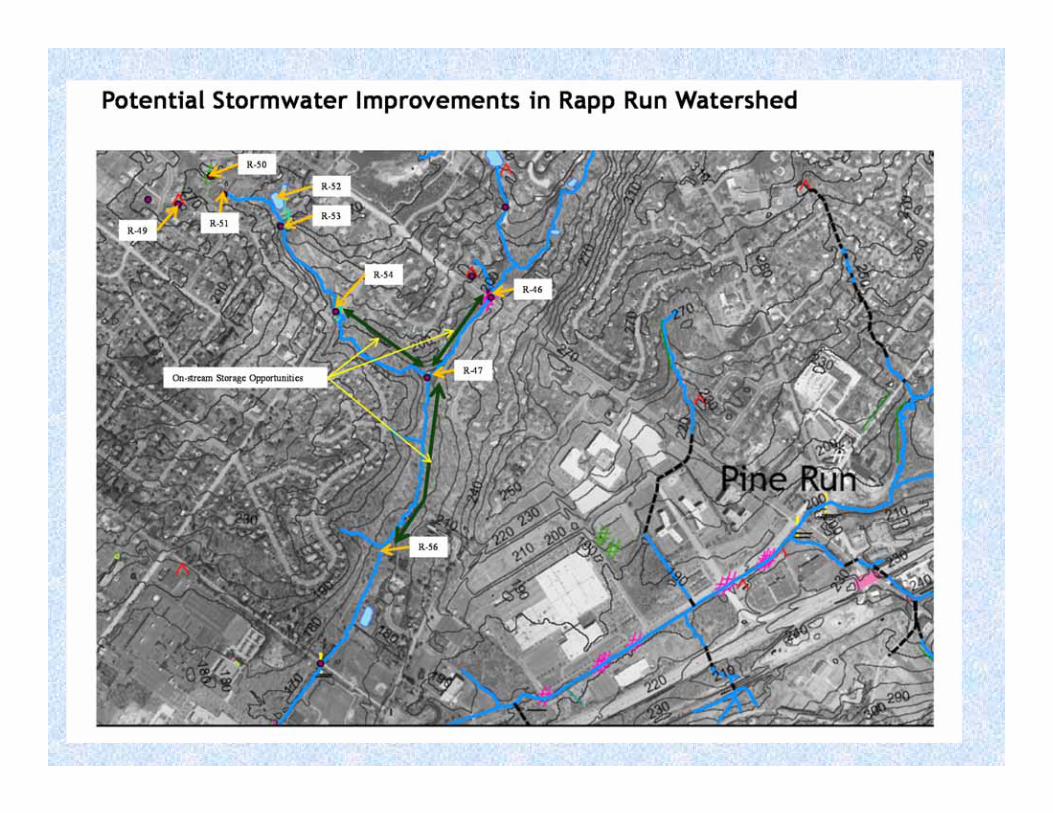
Potential Stormwater Improvements in Pine Run Watershed

Recommendations and Cost Estimates

Applications

Sample Model Application: 2 Yr Flood Depths Prior to Improvements

Sample Model Application: 2 Yr Flood Depths After Improvements

Sample Model Application: Impact of improvements on flood depths

Sample Model Application: Bridges Most Frequently Flooded
> 1-Yr Storm
> 2-Yr Storm
> 5-Yr Storm
> 10-Yr Storm
Overtopped By:

Overtopped by 1-Yr Storm
Overtopped by 2-Yr Storm
Frequent flooding and disruption of transportation in some areas

Sample Model Application: Capture of Additional 1 inch of Runoff
Location: Pennypack Creek at Rhawn Street
Total Precipitation for 1-Yr Storm = 2.98 inches
Initial abstraction is increased by one additional inch over and above existing.
Impervious cover is disconnected vialocalized retention, infiltration, and storage. 0
5000
10000
15000
20000
25000
1‐yr 2‐yr 5‐yr 10‐yr 25‐yr 50‐yr 100‐yr
Peak Discharge
(CFS)
Storm Frequency
Peak Discharge at Rhawn Street Gage (CFS)
Existing Condition1 inch Capture “Green Infrastructure”
0500
10001500200025003000350040004500
0:00 12:00 0:00 12:00 0:00 12:00
Flow
(CFS)
1‐Yr Storm Hydrograph at Rhawn Street Gage
Existing condition
1 inch Capture
02000400060008000
1000012000140001600018000
1‐yr 2‐yr 5‐yr 10‐yr 25‐yr 50‐yr 100‐yr
Run
off V
olum
e (A
cre-
Ft)
Storm Frequency
Runoff Volume at Rhawn Street Gage (CFS)
Existing Condition
1 inch Capture “Green Infrastructure”

Center for Sustainable CommunitiesTemple University 580 Meetinghouse Rd, Ambler, PA 19002http://www.temple.edu/ambler/csc/Jeffrey Featherstone, Director(267) 468-8311
E-mails: [email protected]@[email protected]
CONTACT