
EVALUATION OF LIFE-CYCLE ASSESSMENT TOOLSisse.utk.edu/ccp/pubs/pdfs/LCAToolsEval.pdf · EVALUATION...
60
EVALUATION OF LIFE-CYCLE ASSESSMENT TOOLS FINAL REPORT Prepared by: Dean M. Menke Gary A. Davis The University of Tennessee Center for Clean Products and Clean Technologies and Bruce W. Vigon Battelle Strategic Environmental Management August 30, 1996 Printed on Recycled Paper
Transcript of EVALUATION OF LIFE-CYCLE ASSESSMENT TOOLSisse.utk.edu/ccp/pubs/pdfs/LCAToolsEval.pdf · EVALUATION...
EVALUATION OF LIFE-CYCLE ASSESSMENT TOOLS
FINAL REPORT
Prepared by:
Dean M. MenkeGary A. Davis
The University of TennesseeCenter for Clean Products and Clean Technologies
and
Bruce W. VigonBattelle
Strategic Environmental Management
August 30, 1996
Printed on Recycled Paper

Table of Contents
Page
1. Introduction . . . . . . . . . . . . . . . . . . . . . . . . . . . . . . . . . . . . . . . . . . . . . . . . . . . . . . . . . . . . . . . . 1
2. Initial Evaluation . . . . . . . . . . . . . . . . . . . . . . . . . . . . . . . . . . . . . . . . . . . . . . . . . . . . . . . . . . . . . 1 2.1 Comprehensive List of LCA Software Tools . . . . . . . . . . . . . . . . . . . . . . . . . . . . . . . . . . . . . 2 2.2 Initial Review of Demonstration Software and Literature . . . . . . . . . . . . . . . . . . . . . . . . . . . . 2 2.3 Selection for In-Depth Evaluations . . . . . . . . . . . . . . . . . . . . . . . . . . . . . . . . . . . . . . . . . . . . 4
3. In-Depth Evaluation . . . . . . . . . . . . . . . . . . . . . . . . . . . . . . . . . . . . . . . . . . . . . . . . . . . . . . . . . . 5 3.1 Criteria for In-Depth Analysis of Tools . . . . . . . . . . . . . . . . . . . . . . . . . . . . . . . . . . . . . . . . . 5 3.1.1 Computer Requirements and Interface . . . . . . . . . . . . . . . . . . . . . . . . . . . . . . . . . . . . 6 3.1.2 System Definition . . . . . . . . . . . . . . . . . . . . . . . . . . . . . . . . . . . . . . . . . . . . . . . . . . . . 6 3.1.3 Data and Data Management . . . . . . . . . . . . . . . . . . . . . . . . . . . . . . . . . . . . . . . . . . . . 7 3.1.4 Flexibility . . . . . . . . . . . . . . . . . . . . . . . . . . . . . . . . . . . . . . . . . . . . . . . . . . . . . . . . . . 8 3.1.5 Calculations and Comparisons . . . . . . . . . . . . . . . . . . . . . . . . . . . . . . . . . . . . . . . . . . 8 3.1.6 Outputs and Exports . . . . . . . . . . . . . . . . . . . . . . . . . . . . . . . . . . . . . . . . . . . . . . . . . 9 3.2 Generic Life-Cycle Systems . . . . . . . . . . . . . . . . . . . . . . . . . . . . . . . . . . . . . . . . . . . . . . . . . 9 3.3 Survey of Software Users . . . . . . . . . . . . . . . . . . . . . . . . . . . . . . . . . . . . . . . . . . . . . . . . . . 11 3.4 Summary of Results . . . . . . . . . . . . . . . . . . . . . . . . . . . . . . . . . . . . . . . . . . . . . . . . . . . . . . 12 3.4.1 KCL-ECO . . . . . . . . . . . . . . . . . . . . . . . . . . . . . . . . . . . . . . . . . . . . . . . . . . . . . . . 14 3.4.2 LCAiT . . . . . . . . . . . . . . . . . . . . . . . . . . . . . . . . . . . . . . . . . . . . . . . . . . . . . . . . . . . 14 3.4.3 PEMS . . . . . . . . . . . . . . . . . . . . . . . . . . . . . . . . . . . . . . . . . . . . . . . . . . . . . . . . . . . 15 3.4.4 SimaPro . . . . . . . . . . . . . . . . . . . . . . . . . . . . . . . . . . . . . . . . . . . . . . . . . . . . . . . . . . 16 3.345 TEAMTM . . . . . . . . . . . . . . . . . . . . . . . . . . . . . . . . . . . . . . . . . . . . . . . . . . . . . . . . 16
Appendix A - Results of Interim EvaluationAppendix B - Survey of Software UsersAppendix C - In-Depth Evaluation of Full LCA Software ToolsAppendix D - Default Printouts
i
List of Tables
Table 1 - Comprehensive Life of Life-Cycle Assessment Tools . . . . . . . . . . . . . . . . . . . . . . . . . . . . . 3Table 2 - Basic Selection Criteria and Corresponding Software Tools . . . . . . . . . . . . . . . . . . . . . . . . 4Table 3 - Survey Responses for Each LCA Software Tool . . . . . . . . . . . . . . . . . . . . . . . . . . . . . . . 11Table 4 - Comparison of Unique Software Features . . . . . . . . . . . . . . . . . . . . . . . . . . . . . . . . . . . . 12
List of Figures
Figure 1 - Initial Review Categories . . . . . . . . . . . . . . . . . . . . . . . . . . . . . . . . . . . . . . . . . . . . . . . . . 4Figure 2 - Criteria for In-Depth Evaluation . . . . . . . . . . . . . . . . . . . . . . . . . . . . . . . . . . . . . . . . . . . . 6Figure 3 - Straight-Line Manufacturing and Use System . . . . . . . . . . . . . . . . . . . . . . . . . . . . . . . . . 10Figure 4 - Manufacturing, Use, and Closed-Loop Recycling System . . . . . . . . . . . . . . . . . . . . . . . . 10Figure 5 - Manufacturing, Use, and Open-Loop Recycling System . . . . . . . . . . . . . . . . . . . . . . . . . 10Figure 6 - Manufacturing with Co-Production and Use . . . . . . . . . . . . . . . . . . . . . . . . . . . . . . . . . . 11
ii
1 Fava, James, et. al. (ed), A Conceptual Framework for Life-Cycle Impact Assessment, Society ofEnvironmental Toxicology and Chemistry (1992), Pensacola, FL.
1
EVALUATION OF LIFE-CYCLE ASSESSMENT TOOLS
1. INTRODUCTION
Life-cycle assessment (LCA) is a process to evaluate the resource consumption and environmentalburdens associated with a product, process, package, or activity. The LCA process encompasses theidentification and quantification of energy and material usage, as well as environmental releases acrossall stages of the life cycle; the assessment of the impact of these energy and material uses and releasesto the environment; and the evaluation and implementation of opportunities to effect environmentalimprovement.1
In recent years, LCA has gained general acceptance as a tool with a range of uses, such asenvironmental labeling, product environmental improvement, eco-design, and policy evaluation. As theacceptance of LCA has increased, so has the development of software tools and databases forperforming LCA. Many of these software tools and databases are available for licensing or purchase. Targeted users of these materials are expert LCA practitioners and/or general users.
The Canadian government is facilitating the availability of accurate, up-to-date data for the inventorycomponent of LCA by compiling the Canadian Raw Materials Database (CRMD). The life-cycle dataconcerning six primary materials will be made available to producers and other users for the use in LCAand other pollution prevention activities. Of critical importance in the use of the CRMD is theavailability of software tools which can accept the data and process it in a manner that is consistent withthe users’ intended purpose and goals.
This project, conducted by the University of Tennessee Center for Clean Products and CleanTechnologies, is an objective evaluation of the available LCA software tools for potential use with theCRMD. The evaluation consisted of two phases: an initial screening of available software tools, andsubsequent appraisal of five software tools selected for an in-depth assessment based on the results ofthe initial evaluation.
2. INITIAL EVALUATION
The initial evaluation accomplished the following four tasks, the results of which are discussed below.
1. Established a comprehensive list of software tools (and vendors) currently available forLCA;
2. Reviewed demonstration copies of software tools which were available through vendorcontacts;
2
3. Reviewed literature concerning the available software tools from the vendors and third-party sources;
4. Identified five (5) LCA software tools to evaluate in full according to criteria developedin cooperation with Environment Canada.
2.1 Comprehensive List of LCA Software Tools
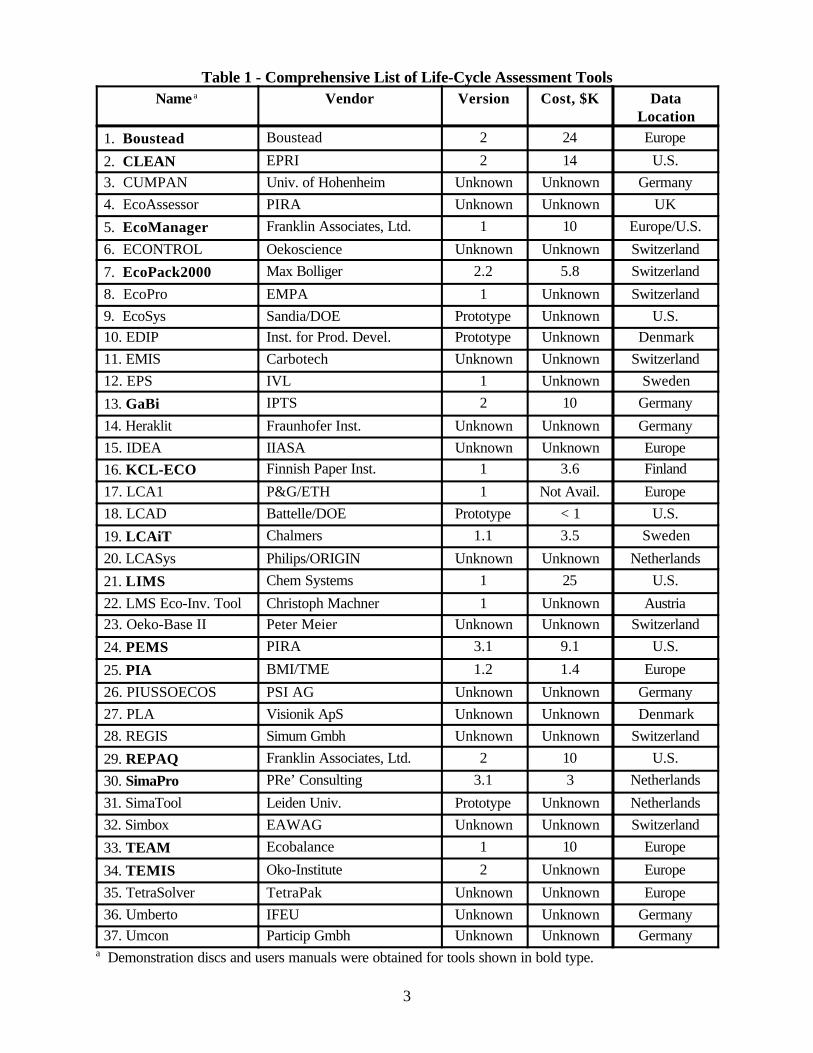
From the U.S. and Europe, 37 software tools (and vendors) were identified; the comprehensive list ispresented in Table 1. To establish this list, a variety of information sources were utilized. Publishedliterature from the Society for the Promotion of LCA Development (SPOLD) and Atlantic Consulting,“The LCA Sourcebook” and “LCA-Software Buyers’ Guide” respectively, were used to identifycommonly-known LCA software tools. The World Wide Web was also used to gather up-to-dateinformation on other established software tools, while subscribers to various Internet list servers weresolicited for information on newly developed or developing tools.
The 37 LCA software tools listed in Table 1 are in various forms of development and use. Foursoftware tools are not yet fully developed (EcoSys, EDIP, LCAD, and SimaTool) and are denoted“Prototype” in the third column of Table 1. Some software tools are only available in a language otherthan English or French; CUMPAN, REGIS, and Umcon are examples of these software tools. Stillother software tools were developed exclusively for private industry clients and are not commerciallyavailable (e.g., LCA1).
2.2 Initial Review of Demonstration Software and Literature
Demonstration discs and users manuals for 14 software tools were obtained from vendors andevaluated in the initial review. These 14 tools are identified in bold type in the first column of Table 1. Included in the review was additional literature either supplied by the vendor or third-party sources.
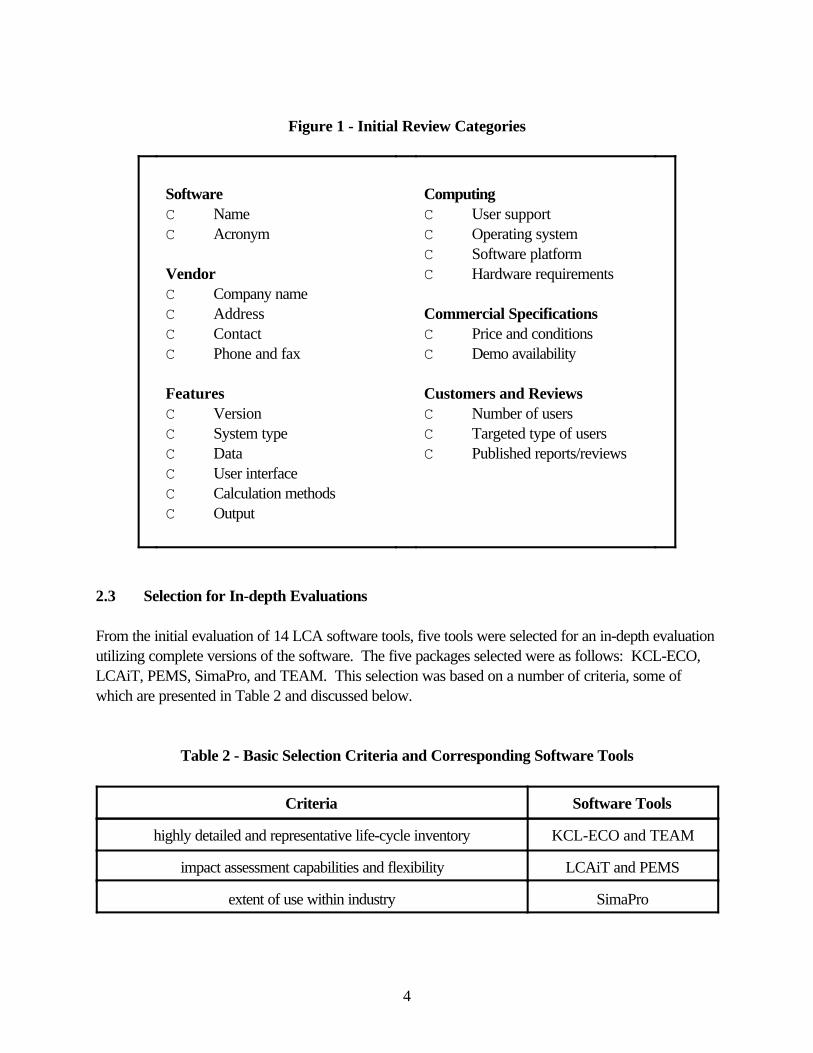
Each of the 14 software packages was evaluated using a common review format. Within this format,six general categories of information are presented. These categories of information, identified in Figure1, were selected to present general information which could be used to assess the capabilities of eachsoftware tool and to select the tool(s) which meet user-defined goals and functions. The Featurescategory contains the primary evaluation results for each demonstration software tool; the other fivecategories offer support documentation including contact information and computer requirements. Appendix A represents the results of the initial evaluation of the 14 demonstration software tools.
3
Table 1 - Comprehensive List of Life-Cycle Assessment ToolsName a Vendor Version Cost, $K Data
Location1. Boustead Boustead 2 24 Europe
2. CLEAN EPRI 2 14 U.S.3. CUMPAN Univ. of Hohenheim Unknown Unknown Germany4. EcoAssessor PIRA Unknown Unknown UK
5. EcoManager Franklin Associates, Ltd. 1 10 Europe/U.S.
6. ECONTROL Oekoscience Unknown Unknown Switzerland
7. EcoPack2000 Max Bolliger 2.2 5.8 Switzerland
8. EcoPro EMPA 1 Unknown Switzerland9. EcoSys Sandia/DOE Prototype Unknown U.S.10. EDIP Inst. for Prod. Devel. Prototype Unknown Denmark11. EMIS Carbotech Unknown Unknown Switzerland12. EPS IVL 1 Unknown Sweden
13. GaBi IPTS 2 10 Germany
14. Heraklit Fraunhofer Inst. Unknown Unknown Germany15. IDEA IIASA Unknown Unknown Europe16. KCL-ECO Finnish Paper Inst. 1 3.6 Finland
17. LCA1 P&G/ETH 1 Not Avail. Europe18. LCAD Battelle/DOE Prototype < 1 U.S.
19. LCAiT Chalmers 1.1 3.5 Sweden
20. LCASys Philips/ORIGIN Unknown Unknown Netherlands
21. LIMS Chem Systems 1 25 U.S.
22. LMS Eco-Inv. Tool Christoph Machner 1 Unknown Austria23. Oeko-Base II Peter Meier Unknown Unknown Switzerland
24. PEMS PIRA 3.1 9.1 U.S.
25. PIA BMI/TME 1.2 1.4 Europe
26. PIUSSOECOS PSI AG Unknown Unknown Germany27. PLA Visionik ApS Unknown Unknown Denmark28. REGIS Simum Gmbh Unknown Unknown Switzerland
29. REPAQ Franklin Associates, Ltd. 2 10 U.S.
30. SimaPro PRe’ Consulting 3.1 3 Netherlands
31. SimaTool Leiden Univ. Prototype Unknown Netherlands32. Simbox EAWAG Unknown Unknown Switzerland
33. TEAM Ecobalance 1 10 Europe
34. TEMIS Oko-Institute 2 Unknown Europe
35. TetraSolver TetraPak Unknown Unknown Europe36. Umberto IFEU Unknown Unknown Germany37. Umcon Particip Gmbh Unknown Unknown Germany
a Demonstration discs and users manuals were obtained for tools shown in bold type.
4
Figure 1 - Initial Review Categories
SoftwareC NameC Acronym
VendorC Company nameC AddressC ContactC Phone and fax
FeaturesC VersionC System typeC DataC User interfaceC Calculation methodsC Output
ComputingC User supportC Operating systemC Software platformC Hardware requirements
Commercial SpecificationsC Price and conditionsC Demo availability
Customers and ReviewsC Number of usersC Targeted type of usersC Published reports/reviews
2.3 Selection for In-depth Evaluations
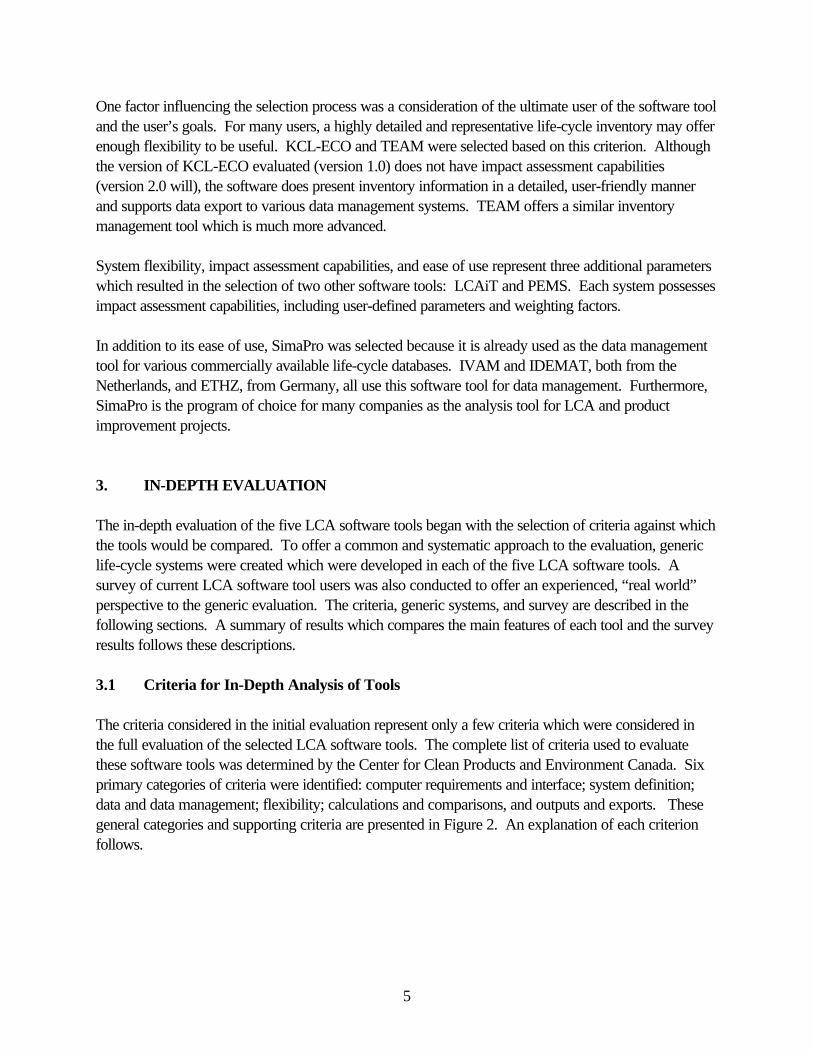
From the initial evaluation of 14 LCA software tools, five tools were selected for an in-depth evaluationutilizing complete versions of the software. The five packages selected were as follows: KCL-ECO,LCAiT, PEMS, SimaPro, and TEAM. This selection was based on a number of criteria, some ofwhich are presented in Table 2 and discussed below.
Table 2 - Basic Selection Criteria and Corresponding Software Tools
Criteria Software Tools
highly detailed and representative life-cycle inventory KCL-ECO and TEAM
impact assessment capabilities and flexibility LCAiT and PEMS
extent of use within industry SimaPro
5
One factor influencing the selection process was a consideration of the ultimate user of the software tooland the user’s goals. For many users, a highly detailed and representative life-cycle inventory may offerenough flexibility to be useful. KCL-ECO and TEAM were selected based on this criterion. Althoughthe version of KCL-ECO evaluated (version 1.0) does not have impact assessment capabilities(version 2.0 will), the software does present inventory information in a detailed, user-friendly mannerand supports data export to various data management systems. TEAM offers a similar inventorymanagement tool which is much more advanced.
System flexibility, impact assessment capabilities, and ease of use represent three additional parameterswhich resulted in the selection of two other software tools: LCAiT and PEMS. Each system possessesimpact assessment capabilities, including user-defined parameters and weighting factors.
In addition to its ease of use, SimaPro was selected because it is already used as the data managementtool for various commercially available life-cycle databases. IVAM and IDEMAT, both from theNetherlands, and ETHZ, from Germany, all use this software tool for data management. Furthermore,SimaPro is the program of choice for many companies as the analysis tool for LCA and productimprovement projects.
3. IN-DEPTH EVALUATION
The in-depth evaluation of the five LCA software tools began with the selection of criteria against whichthe tools would be compared. To offer a common and systematic approach to the evaluation, genericlife-cycle systems were created which were developed in each of the five LCA software tools. Asurvey of current LCA software tool users was also conducted to offer an experienced, “real world”perspective to the generic evaluation. The criteria, generic systems, and survey are described in thefollowing sections. A summary of results which compares the main features of each tool and the surveyresults follows these descriptions.
3.1 Criteria for In-Depth Analysis of Tools
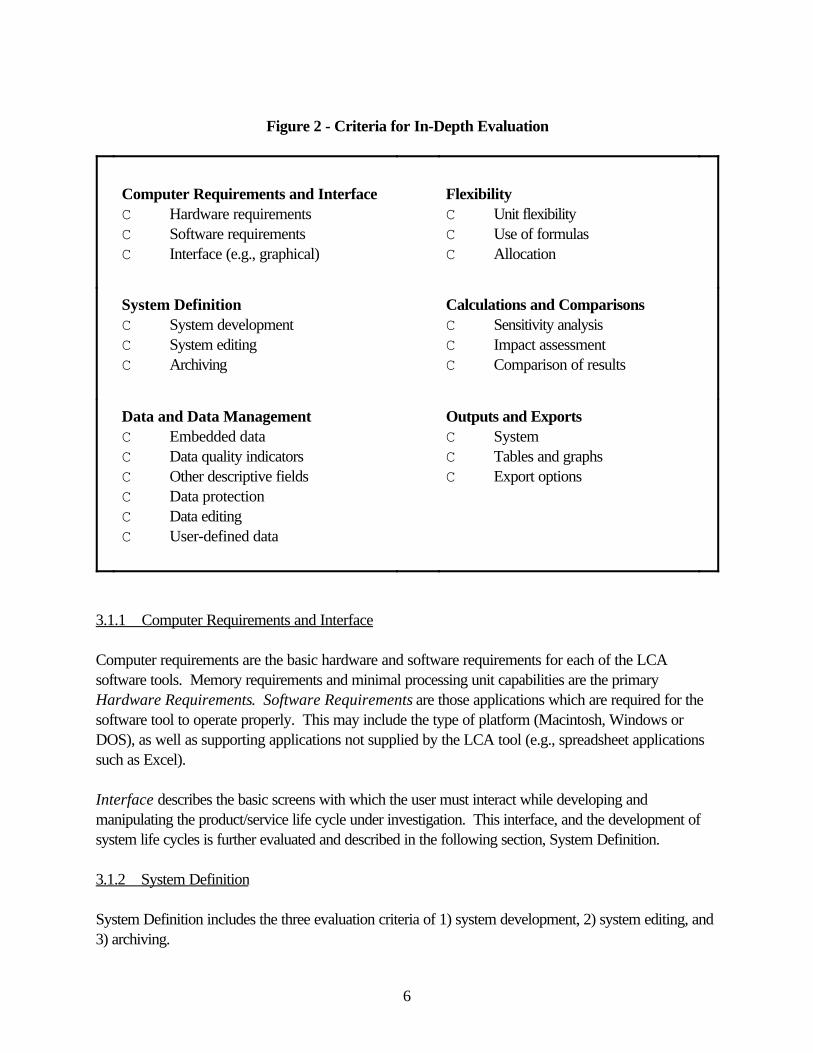
The criteria considered in the initial evaluation represent only a few criteria which were considered inthe full evaluation of the selected LCA software tools. The complete list of criteria used to evaluatethese software tools was determined by the Center for Clean Products and Environment Canada. Sixprimary categories of criteria were identified: computer requirements and interface; system definition;data and data management; flexibility; calculations and comparisons, and outputs and exports. Thesegeneral categories and supporting criteria are presented in Figure 2. An explanation of each criterionfollows.
6
Figure 2 - Criteria for In-Depth Evaluation
Computer Requirements and InterfaceC Hardware requirements C Software requirementsC Interface (e.g., graphical)
FlexibilityC Unit flexibilityC Use of formulasC Allocation
System DefinitionC System developmentC System editingC Archiving
Calculations and ComparisonsC Sensitivity analysisC Impact assessmentC Comparison of results
Data and Data ManagementC Embedded dataC Data quality indicatorsC Other descriptive fieldsC Data protectionC Data editingC User-defined data
Outputs and ExportsC SystemC Tables and graphsC Export options
3.1.1 Computer Requirements and Interface
Computer requirements are the basic hardware and software requirements for each of the LCAsoftware tools. Memory requirements and minimal processing unit capabilities are the primaryHardware Requirements. Software Requirements are those applications which are required for thesoftware tool to operate properly. This may include the type of platform (Macintosh, Windows orDOS), as well as supporting applications not supplied by the LCA tool (e.g., spreadsheet applicationssuch as Excel).
Interface describes the basic screens with which the user must interact while developing andmanipulating the product/service life cycle under investigation. This interface, and the development ofsystem life cycles is further evaluated and described in the following section, System Definition.
3.1.2 System Definition
System Definition includes the three evaluation criteria of 1) system development, 2) system editing, and3) archiving.
7
System Development describes how the user can specify steps within a manufacturing process orstages within the product/service life cycle to define the system under investigation. This includes howflows of materials, emissions, and other burdens are specified within each step/stage, and howtransportation and energy requirements are incorporated into the system. The different ways in whicheach software tool defines functional flows/functional units are also included under this heading.
System Editing is a brief explanation of system editing capabilities and limitations as the user developsa new or changes an existing life-cycle system. Adding or deleting steps/stages, changing flows, andmanipulating the developed system within the software interface are considered in this section. Dataediting is addressed separately in the general category Data and Data Management.
Archiving as an evaluation criterion assesses the capabilities of each LCA software tool to reusepreviously defined systems (or sections of systems) in new life-cycle evaluations. As a library of life-cycle systems is developed, the user may find it necessary and convenient to reuse all or some of thesaved information. For example, a common energy matrix or waste disposal scenario may be used formany different life-cycle systems.
3.1.3 Data and Data Management
There are a number of issues surrounding life-cycle data, databases, and data management capabilitieswhich must be addressed when assessing the capabilities of each software tool. Under the criterion ofData and Data Management there were six areas of interest: embedded data; data quality indicators;other descriptive fields; data protection; data editing; and user-defined data.
Embedded Data describes the types of data available within databases accompanying each softwaretool. A brief assessment of data quality is also included under this heading. For a full description ofdata quality, see the results from the initial evaluation presented in Appendix A.
The various ways in which a user can specify data quality indicators is included under Data QualityIndicators. Text fields which allow the user to specify the source of data, dates of data collection,geographic regions, etc., are features addressed within this criterion. The quality of embedded data isnot assessed under this heading. Other descriptive text fields, such as system title, process notes, etc.,are included under the Other Descriptive Fields. User-defined descriptive fields, such as these, arefeatures which strengthen the life-cycle assessment process, as well as simplify the interpretation of theassessment results.
Data Protection and Data Editing document the various ways in which the information contained inthe database (whether embedded or user-defined) is presented to the user, shielded and/or protectedfrom other users, and available for editing. Data protection considers both embedded data protectionand user-defined data protection. The protection of embedded data can include completeinaccessibility to the data, view only, or copying/editing capabilities. The
8
protection of embedded data can include the use of user names and passwords, levels of securityclearance, etc. User-defined data protection can include, for example, features which offer data accessand editing capabilities to only the user who created the data set, as well as various levels of accesssimilar to those described for embedded data protection.
User-Defined Data describes the process by which the user can define data for inclusion in softwaredatabases. Data import capabilities are included within this heading.
3.1.4 Flexibility
Three separate criteria were identified under the general heading of system Flexibility: unit flexibility;use of formulas; and allocation. Unit Flexibility describes whether the tool supports user-defined unitsor whether the user must convert all entries to consistent software-defined units. The Use of Formulasoffers another degree of flexibility. To determine/specify material flows, energy requirements andenvironmental releases based on user-defined variables can permit the user to develop a more dynamicsystem. Allocation of burdens among co-products and/or open-loop flows is an issue of interest for allLCA practitioners. There are various ways by which burdens are allocated to a product or service(e.g., by weight, by economic value, etc.). The way(s) in which each tool allocates burdens wasevaluated and discussed in this sub-category.
3.1.5 Calculations and Comparisons
Uncertainty analysis, impact assessment, and comparison of results represent three data manipulationcapabilities which may or may not be a function of each LCA software tool. Calculations andComparisons, as an evaluation criterion, assesses each tool for these manipulation capabilities.
With each bit of information and data entry within an LCA, there exists a degree of uncertainty. Thecapability of an LCA software tool to manage this uncertainty may be a characteristic of importance tothe user. Therefore, the various methods to perform uncertainty analysis, such as sensitivity analysis,within each software tool was assessed, and presented under Uncertainty Analysis.
Impact assessment, as defined in “Life-Cycle Impact Assessment - A Conceptual Framework, KeyIssues, and Summary of Existing Methods” (EPA, July 1995), includes the classification,characterization, and valuation of life-cycle inventory results. The flexibility to incorporate user-definedparameters for these and other assessment methods is of primary interest to many LCA practitionersand the users of LCA software tools. Each tool was evaluated for these capabilities, the results ofwhich are summarized under Impact Assessment.
Comparison of Results summarizes the ability of each tool to compare the results (inventory or impactassessment) of two or more systems. For example, a comparison may be of two identical systems withdifferent recycle rates or raw material inputs; a comparison may also be of two completely different andcompeting products/technologies to accomplish the same function.
9
3.1.6 Outputs and Exports
Outputs and Exports, the final assessment category, evaluates the various ways in which the life-cyclesystem and the calculated results can be viewed, printed, exported, and otherwise manipulated.
The flow diagram or sequence of steps/stages evaluated in the LCA represents the system. Printingand export functions of this system are presented under Systems.
Tables and Graphs summarizes the ways each software tool presents database information and theresults of the inventory analysis, impact assessment, and other calculations. Editing capabilities anduser-defined formats for tables and graphics are also included under this heading.
The ability to utilize the information created in the LCA software tool in other computer applications forreport purposes, presentations, further manipulations, etc. is yet another capability of each software toolevaluated. Export Capabilities such as data export, inventory export, and impact assessment exportwere among the factors included in this criterion summary.
3.2 Generic Life-Cycle Systems
The five LCA software tools selected for an in-depth evaluation were assessed under each of theabove criteria. To accomplish this in-depth evaluation, four simple, fictitious life-cycle systems weredeveloped in, and analyzed with each of the software tools. These systems, pictorially presented inFigures 3 through 6, represent the following scenarios:
1. straight-line manufacturing and use;2. manufacturing, use, and closed-loop recycle;3. manufacturing, use, and open-loop recycle; and 4. manufacturing with co-production and use.
The actual numbers calculated for each scenario were not compared between LCA software tools. The purpose of these scenarios was to allow the evaluators to become familiar with each tool, and toaddress each of the criteria in a systematic and consistent fashion.
10
Figure 3 - Straight-Line Manufacturing and Use System
Figure 4 - Manufacturing, Use, and Closed-Loop Recycling System
Figure 5 - Manufacturing, Use, and Open-Loop Recycling System
11
Figure 6 - Manufacturing with Co-Production and Use
3.3 Survey of Software Users
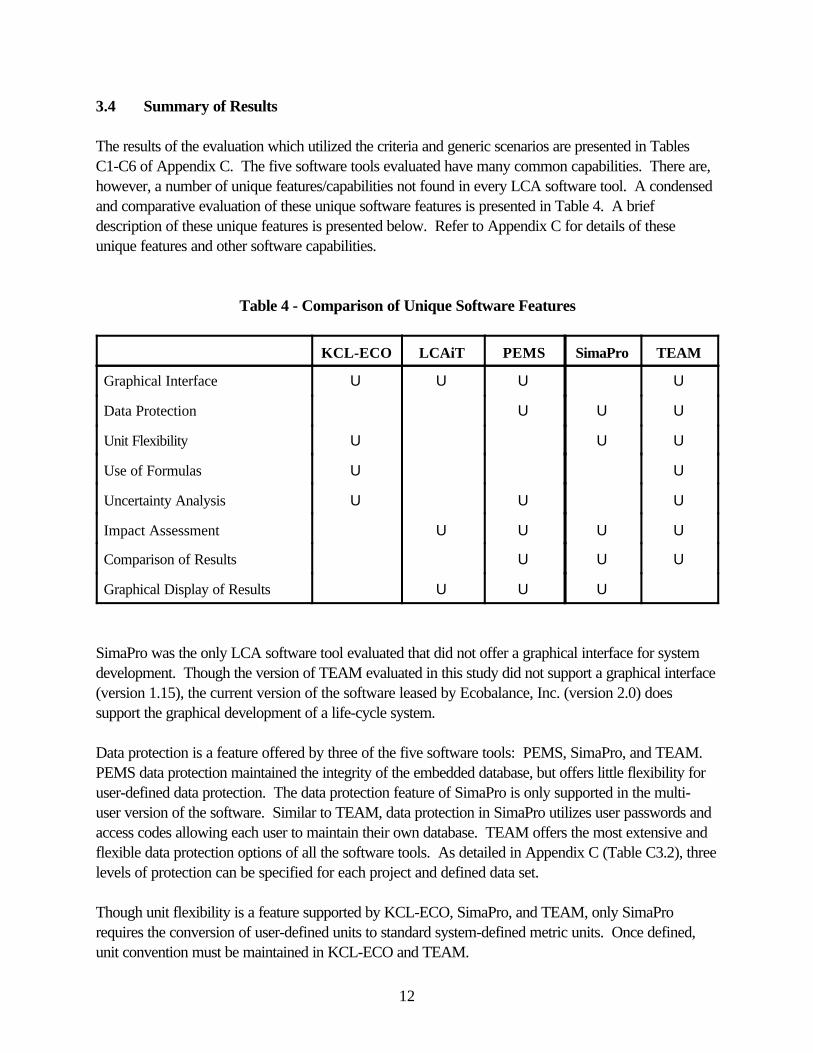
To give additional depth to the evaluation, a survey of current LCA software tool users was alsoconducted. Though the evaluation utilizing the criteria and scenarios described above was detailed, thissurvey of current LCA tool users offers a real-world perspective. The survey (see Appendix B) wasused to assess the current applications of each software tool, the individuals using each tool, and theimpressions formed by these users of the tool’s features and capabilities. The Center for CleanProducts distributed the survey to software users, either directly to contacts supplied by softwarevendors, or through software vendors when client confidentiality was an issue. Table 3 summarizessurvey distribution numbers and percent responses. Unfortunately, the number of completed surveysreceived from software users was not adequate to offer definitive and comparable results across LCAtools. Therefore, a separate summary of survey results will not be presented. Survey responses thatwere received are included in Appendix B.
Table 3 - Survey Responses for Each LCA Software Tool
Software Number Distributed Number Received Percent Response
KCL-ECO 2 0 0
LCAiT 1 1 100%
PEMS unknown (1) 8 -
SimaPro unknown (1) 1 -
TEAM 5 1 20%(1) Survey was distributed through software vendors (i.e., PIRA and PRe respectively).
12
3.4 Summary of Results
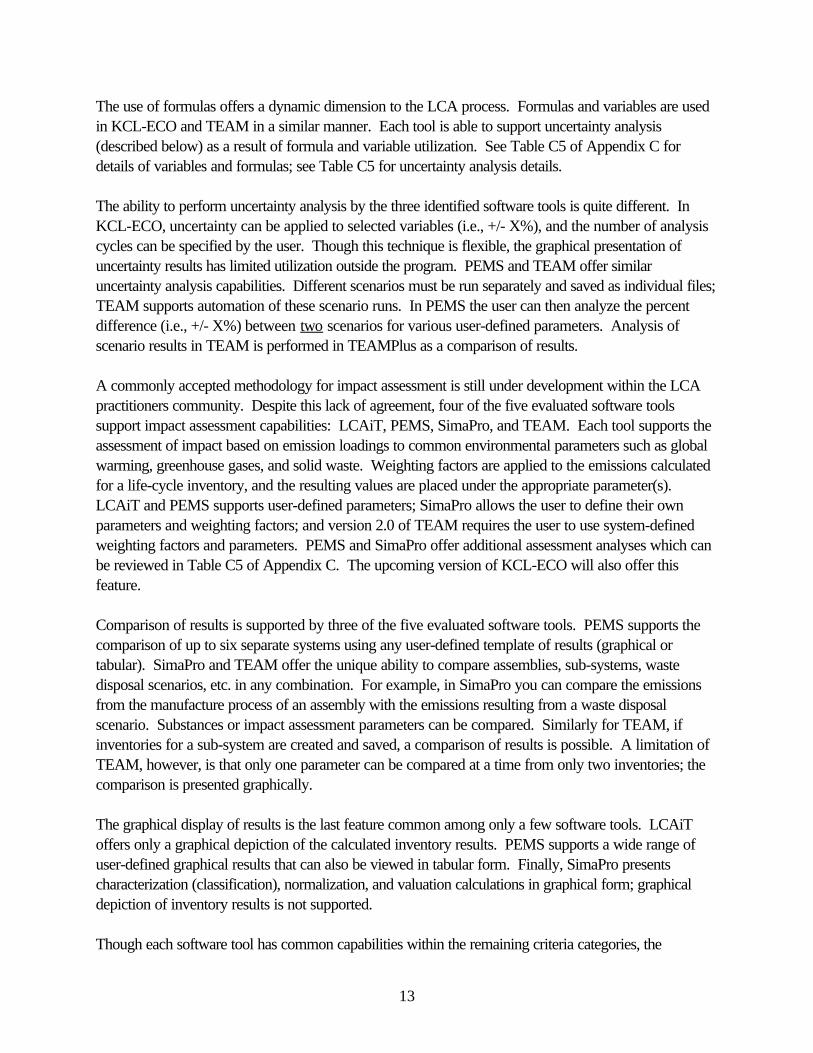
The results of the evaluation which utilized the criteria and generic scenarios are presented in TablesC1-C6 of Appendix C. The five software tools evaluated have many common capabilities. There are,however, a number of unique features/capabilities not found in every LCA software tool. A condensedand comparative evaluation of these unique software features is presented in Table 4. A briefdescription of these unique features is presented below. Refer to Appendix C for details of theseunique features and other software capabilities.
Table 4 - Comparison of Unique Software Features
KCL-ECO LCAiT PEMS SimaPro TEAM
Graphical Interface U U U U
Data Protection U U U
Unit Flexibility U U U
Use of Formulas U U
Uncertainty Analysis U U U
Impact Assessment U U U U
Comparison of Results U U U
Graphical Display of Results U U U
SimaPro was the only LCA software tool evaluated that did not offer a graphical interface for systemdevelopment. Though the version of TEAM evaluated in this study did not support a graphical interface(version 1.15), the current version of the software leased by Ecobalance, Inc. (version 2.0) doessupport the graphical development of a life-cycle system.
Data protection is a feature offered by three of the five software tools: PEMS, SimaPro, and TEAM. PEMS data protection maintained the integrity of the embedded database, but offers little flexibility foruser-defined data protection. The data protection feature of SimaPro is only supported in the multi-user version of the software. Similar to TEAM, data protection in SimaPro utilizes user passwords andaccess codes allowing each user to maintain their own database. TEAM offers the most extensive andflexible data protection options of all the software tools. As detailed in Appendix C (Table C3.2), threelevels of protection can be specified for each project and defined data set.
Though unit flexibility is a feature supported by KCL-ECO, SimaPro, and TEAM, only SimaProrequires the conversion of user-defined units to standard system-defined metric units. Once defined,unit convention must be maintained in KCL-ECO and TEAM.
13
The use of formulas offers a dynamic dimension to the LCA process. Formulas and variables are usedin KCL-ECO and TEAM in a similar manner. Each tool is able to support uncertainty analysis(described below) as a result of formula and variable utilization. See Table C5 of Appendix C fordetails of variables and formulas; see Table C5 for uncertainty analysis details.
The ability to perform uncertainty analysis by the three identified software tools is quite different. InKCL-ECO, uncertainty can be applied to selected variables (i.e., +/- X%), and the number of analysiscycles can be specified by the user. Though this technique is flexible, the graphical presentation ofuncertainty results has limited utilization outside the program. PEMS and TEAM offer similaruncertainty analysis capabilities. Different scenarios must be run separately and saved as individual files;TEAM supports automation of these scenario runs. In PEMS the user can then analyze the percentdifference (i.e., +/- X%) between two scenarios for various user-defined parameters. Analysis ofscenario results in TEAM is performed in TEAMPlus as a comparison of results.
A commonly accepted methodology for impact assessment is still under development within the LCApractitioners community. Despite this lack of agreement, four of the five evaluated software toolssupport impact assessment capabilities: LCAiT, PEMS, SimaPro, and TEAM. Each tool supports theassessment of impact based on emission loadings to common environmental parameters such as globalwarming, greenhouse gases, and solid waste. Weighting factors are applied to the emissions calculatedfor a life-cycle inventory, and the resulting values are placed under the appropriate parameter(s). LCAiT and PEMS supports user-defined parameters; SimaPro allows the user to define their ownparameters and weighting factors; and version 2.0 of TEAM requires the user to use system-definedweighting factors and parameters. PEMS and SimaPro offer additional assessment analyses which canbe reviewed in Table C5 of Appendix C. The upcoming version of KCL-ECO will also offer thisfeature.
Comparison of results is supported by three of the five evaluated software tools. PEMS supports thecomparison of up to six separate systems using any user-defined template of results (graphical ortabular). SimaPro and TEAM offer the unique ability to compare assemblies, sub-systems, wastedisposal scenarios, etc. in any combination. For example, in SimaPro you can compare the emissionsfrom the manufacture process of an assembly with the emissions resulting from a waste disposalscenario. Substances or impact assessment parameters can be compared. Similarly for TEAM, ifinventories for a sub-system are created and saved, a comparison of results is possible. A limitation ofTEAM, however, is that only one parameter can be compared at a time from only two inventories; thecomparison is presented graphically.
The graphical display of results is the last feature common among only a few software tools. LCAiToffers only a graphical depiction of the calculated inventory results. PEMS supports a wide range ofuser-defined graphical results that can also be viewed in tabular form. Finally, SimaPro presentscharacterization (classification), normalization, and valuation calculations in graphical form; graphicaldepiction of inventory results is not supported.
Though each software tool has common capabilities within the remaining criteria categories, the
14
flexibility and functionality of these capabilities vary significantly from tool to tool. While completing theevaluation, overall impressions of each software tool’s capabilities, limitations, and ease of use wereformulated by the evaluators. These impressions of the evaluators are presented below. The readershould refer to Appendix C for further details.
3.4.1 KCL-ECO
The graphical interface of KCL-ECO makes system development easy. Editing of the system, data,and variables list from anywhere within the program offers the freedom to develop the system as it isconceived by the user. The reuse of archived systems and sub-systems is one of the easiest among theevaluated tools. System variables (inputs and outputs) can be specified by the user. Units areassociated with each variable and can also be defined by the user. Once defined, this unit conventionmust be maintained throughout the LCA project. Allocation among co-products is not a function of thetool. All allocation must be performed before the system is developed and the flows specified. The useof variables and equations allows for user-defined flows and parameters, and offers another degree offlexibility when defining the system. Sensitivity analysis within the program is one of the most versatileamong the tools evaluated. Customization of result tables is supported in a limited way; graphicaldisplays are not an option given by the software. Survey responses from KCL-ECO users were notreceived.
Unique features offered by KCL-ECO include the following:C Access to the variables list at any point within the program allows the user to define new
variables from anywhere within the program as the system is being developed.C The descriptive field accompanying each process block can be invoked on the graphical
interface and is included in the table of results.C The output of one process block does not have to have the same name as the input to another
process block when the flow is connected between blocks.
Limitations of the software tool include the inability to compare results and perform impact assessment,and the lack of support for exporting results. However, version 2 of KCL-ECO, expected out laterthis year, will possess impact assessment capabilities, as well as allocation methods.
3.4.2 LCAiT
System development within LCAiT is not as simple as that experienced with other software toolsevaluated. Including emissions, wastes, and resources in process block details is difficult toconceptualize; though resources are typically thought of as inputs, they are outputs in LCAiT andcannot be used in further system units/steps. Connections between blocks do not have/require materialflows assigned to them. Data editing and user-defined data capabilities, however, are simple andstraightforward. The use of descriptive text fields is extensive. Unit flexibility of the tool is typical ofmost software; data must be entered in system-defined units. Allocation is not supported by thesoftware tool; the user must allocate all burdens before entering data into the
15
system. The lack of sensitivity analyses and comparison of results limits the tool’s application as amanagement tool. Impact assessment capabilities, however, are good. Only graphic results aresupported within the user interface; export capabilities in tabular form are supported. A description ofthe different colors used in the graphic display of results is not offered.
Unique features of LCAiT include the following:C The ease of user-defined data entry using software-supplied templates; andC The ability to import an entire life-cycle system into a process block of a new system, allowing
highly detailed and complex systems to be simplified.
A limitation of the software tool is that only four material flows can be assigned to each side of aprocess block, limiting the complexity of the system developed.
3.4.3 PEMS
The graphical interface of PEMS makes system development intuitively very easy. The inputs andoutputs are compiled and a mass balance for each process block is calculated and reported to the useron each Properties card. Material flows and transportation are represented by arrows between blocks. Ample descriptive fields allow the user to offer narrative information for all process blocks and thesystem as a whole. Data developed by the user, however, are difficult to input into the databaseformat, and archiving systems for reuse is tedious. Unit flexibility and allocation capabilities of the toolare typical of most software; data must be entered in system-defined units, and the allocation is byweight. The manual offers a very detailed explanation of other allocation methods but the tool does notsupport these methods. Finally, the manipulation and presentation of data is well supported by thesystem. Sensitivity analysis, impact assessment, and comparison of results are easy to understand andcustomize. Tables and graphs can be easily customized, and export to other applications is wellsupported.
Unique features of PEMS include the following:C User is informed (warned) if a flow represents less than one percent of total;C Multiple transportation options can be defined for a single flow allowing urban, rural, and motor
way combinations to be selected. The inclusion of a ‘utility’ factor allows the user to representreturn trips as well.
C PIRA offers membership to the PEMS User’s Club; as members PEMS users have theopportunity to discuss and participate in the further development of LCA and LCA standards,as well as the development of future PEMS versions.
A limitation of PEMS experienced during the evaluation was the lack of a run-time version of Excel;software failure occurs when using an Excel application above Version 5. This dependence on Excelhas been eliminated in the version of PEMS expected out later this year (1996).
16
3.4.4 SimaPro
SimaPro has features that support its extensive use as a product development and LCA managementtool. Though a graphical interface for system development is not offered, SimaPro is very easy to useand flexible. Access to, and unrestricted editing of the five database files is the characteristic whichoffers most of this flexibility and ease. Aside from data protection, all data and data managementoptions are excellent and easy to operate. Embedded data are extensive and well documented;adequate descriptive fields are offered for each database entry; and user-defined data are easily inputthrough templates offered by the software program. Various impact assessment options for system andblock impact (e.g., easily accessible indicator values, characterization/normalization/valuationcalculations, and ‘thermometer’ scales) are available at all times while in the program. Resultspresented in a graphical format are supported, but tables are not.
Unique features of SimaPro include the following:C The ability to link database entries;C Access to numeric and visual indications of impact for each stage, assembly, process, and
material in a life cycle system; andC A multiple-users version of SimaPro is available (at a reduced cost for educational purposes)
which offers unique features such as data protection and networking.
Limitations of SimaPro include the lack of graphical interface, sensitivity analysis and possibly the DOSinterface.
3.4.5 TEAM
TEAM is the most powerful and flexible of the tools evaluated in this in-depth study. Because of this,however, the features and capabilities were the most difficult to fully understand and utilize. Selectingand defining inputs and outputs within the lowest process/unit level is quite simple using the tool bar;flows may be defined by values or variables and equations. Unit flexibility is similar to KCL-ECO;units are associated with each variable (i.e., termed an “Article” in TEAM) and can be defined by theuser. Once defined, this unit convention must be maintained throughout the LCA project. The use offormulas to specify allocation methods for each process unit is a unique feature of TEAM. At eachprocess level, Check and Compile options allow the user to ensure system consistency and integrityeven before the system is fully defined. Calculating the LCA inventory from anywhere within the system(called “propagation”) is yet another flexible feature of TEAM. Tabular results are typical of othersoftware tools evaluated, with customization and export capabilities supported. Graphicalrepresentation of results is not supported.
Unique features of TEAM include the following:C The ability to propagate inventory calculations from anywhere within the system;C The ability to define allocation rules within the lowest process/unit level for any flow; and
C The various data protection and data access levels allow easy maintenance of data integrity.

17
Limitations of TEAM include the lack of support for user-defined weighting factors for impactassessment and the limited (only one parameter between two inventories) comparison of resultscapabilities. A separate and inaccessible database may be viewed by many as another limitation ofTEAM. A new version of TEAM is expected out later this year which will support user-definedweighting factors, as well as a database linked directly to the LCA tool.
Appendix A
Results of Interim Evaluation
A-1
SOFTWARE: The Boustead Model
VENDOR:Company:Address: 2 Black Cottages, Worthing Road, West Grinstead, Horsham, West Sussex,
Great Britain RH13 7BD(1)
Contact: Dr. Ian BousteadPhone: 44-403-864-561Fax: 44-403-865-284.
(1) The U.S. sales representative is Consoli Consulting, Inc., 619 N. Heilbron Drive, Medea,PA 19063.
FEATURES:Version: 2.0
System Type: LCI with extended integral database.
Data: Includes extensive data modules for energy carriers, fuels production andtransportation. Individual process, segment, and complete product data are included forcommon process operation segments and commodity materials manufacturing sub-systems. Unit processes are coded by number and ample space is available in the database for user-specified data. Data are input via the construction of a data table for each process. For anygiven numbered process that produces a defined unit of product, the user places in the tablenames and amounts of any input raw materials, energy requirement (generated outside theprocess), intermediate inputs, i.e. those not drawn from the earth, and any air, water, and solidwaste emissions. The associated code number of the tabulated items is also entered to allowthe program to link any particular table with any other table in order to create the process flowsheet. The core database, i.e., the accumulation of the items supplied with the program, aregrouped into categories because the user must input the codes when generating a new datatable. Although the most frequently used ones can be memorized, the user will need to refer tothe listings for less frequently specified items. The database contains information on over 2,000unit operations. Unit operations data represent a mixture of U.K., general European, and U.S.conditions. The standard list of emissions in the core database contains up to about 2 dozenitems for each process. The user may add additional items as needed.
The data for the fuel producing industries are especially well represented by country. Data setsare included for average conditions in 23 countries. Furthermore, the electric generation datafor the U.S. and Canada are disaggregated into 9 and 5 regional electrical grids, allowing a finerlevel of analysis.
Data are generally in SI units, but there is no reason why alternative units cannot be selected bythe user provided they are consistent. However, there is a preferred set of data units. Most of
A-2
the data are believed to be secondary except for some specific data on local systems collectedby the author. No explicit data quality indicators are used.
User Interface: The current version of the Boustead model and its supporting documentationis in English. The user actually interacts with the model through the initiation of a sub-programeither from a system menu or directly from the DOS prompt. File manipulation and printing areall controlled in this manner. One group of sub-programs writes data to files in ASCII formatfor later post-processing. One convenient feature of the program is the printing of a proformaquestionnaire for the data collection process. Creation of models containing only linearsequences of unit operations is quite straightforward. Use of pre-defined segments, as forexample the cradle-to-get data from the American Plastics Council, or models involvingrecycling loops are more complicated.
LCI Calculation Method(s): The “program” actually consist of a collection of routines whichperform discrete functions. The user selects from a listing of these programs the desiredfunction and executes the program. Input is sought and output collected to allow progressionthrough the construction of the data, checking of units consistency, assembly into an LCI,printing of intermediate worksheets, and the formatting and printing of reports. Categories ofsub-programs include:
C Setting Defaults (file size and printing configurations)C Amending the Database (amends data in input tables and elsewhere; inserts or deletes
data in specified tables, blocks or data sets)C Preparing Primary Data (converts unit quantities and prints data acquisition
questionnaires)C Calculating Data (computes the specified aggregated inputs or outputs for the core
components, i.e. those contained in the core database and the top components, i.e., theuser input materials and processes)
C Reading Data to the Screen (presents information on the monitor for a code number)C Printing Worksheets (prints intermediate calculation data)C Printing Reports (prints composite and data subsets in report format)C Writing Data in ASCII format (outputs data to a floppy drive file)C Transferring Data (moves data from/to a floppy drive and a hard drive)C Initial Installation (creates files and converts version 1 to version 2 structure)
The topmost analysis unit is the product. The checking of the data sets for errors is facilitatedthrough the code structure and a search program which allows any operation code contained inan input table to be flagged for examination as a possible mis-entered data point.
LCIA Calculation Method(s): Not applicable
Output: The flexible report generation capability allows the reader to create any number oftabular representations of the data. The format of these tables are fixed by the program.
A-3
Export to a word processor via the ASCII file writing capability, however, does allowadditional tailoring. The basic report contains columns of data for each environmental mediumfor each input/output. Headers and a footer as well as page numbers are printed in the reportgenerator. No graphical capability exists within the program.
COMPUTING:
User Support: Available in the U.S. through Consoli Consulting (sales primarily) and Dr.Derek Augood (private consulting through an agreement with Dr. Boustead); customization andadditional user support available through the author.
Operating System: DOS 5.0 or higher
Hardware Requirements: 386-SX processor, 2 MB RAM, and 35 MB disk spaceminimum; 486-DX or higher performance processor preferred; requires up to 100 MB of diskspace depending on complexity of model.
COMMERCIAL SPECIFICATIONS:
Price and Conditions: $24,000 initial lease; renewal negotiable
Demo Availability: No
CUSTOMERS AND REVIEWS:
Number of Users: Unknown at present
Targeted Type of Users: Expert users in general, although model is generally straightforwardto operate; typically the model has been supported by a trained user within the leasingorganization.
Published Reports: Numerous application reports in Europe and the USA
A-4
SOFTWARE: Comprehensive Least Emissions Analysis (CLEAN)
VENDOR:Company: Science Applications International Corporation (SAIC)(1)
Address: 4920 El Camino, Los Altos, CA 94022Contact: Dwight AgarPhone: 415-960-5918Fax: 415-960-5965
(1) The development of CLEAN was sponsored by Electric Power Research Institute (EPRI)in conjunction with several utilities.
FEATURES:Version: 2.0
System Type: LCI of energy emissions from fuel production, electric generation, and end-use(note: downstream emissions, such as equipment maintenance and disposal, are not yetincluded in the database or calculations). A costing module is also part of the program.
Data: Includes 150 end-use technologies in over 20 different activity groups; for example,150,000 ft2 facility with T-12 lamps and magnetic ballasts represents a technology in anoffice lighting activity. Residential, commercial, and industrial technology-activity groups arecovered. Six default supply-side emissions data sets covering various geographic regions of theU.S. are included which represent marginal emissions data for year 2000. Also included is asupply-side emissions data set for New England Electric Systems for 1993. Units of emissionscan be specified: either gr., kg., lb., or tons. (lb. is default.) Users are able and encouraged tomodel end-use technologies and activities, as well as customize the database to meet individualneeds (e.g., provide utility-specific electric generation emission curves). Data can be viewedand edited in the program’s user interface, or imported/exported from structured ASCII files. The references for system supplied data can be checked by accessing the Reference optionfound under the Edit menu in the Main Window.
User Interface: software and manual are in English. The software is also equipped with acomplete on-line help screen. The user is prompted through a series of menus to defineactivities, technologies, and supply-side emissions data. No graphical interface is offered.
LCI Calculation Method(s): Based on user selected supply-side emissions data, end-useactivity, and end-use technology, the program calculates the emissions of electrical technologiesbased on pre-defined hourly electric demand and marginal emission factors (one times theother). Calculations take into account varying emission factors of the generation plant, varyingelectrical demands of end-use technologies, efficiency of end-use technologies, andtransmission/distribution losses. For non-electric technologies, CLEAN calculates the yearlyemissions as a function of yearly energy use, the efficiency and the emissions factors associated
A-5
with the selected technology and fuel. Calculations determine the weight of emissions for 19substances (equivalent C02, N0x, S02, TSP, PM10, CFC-11, HCFC-22, HCF-123, IFC-134A, ROG, CO, water use, solid waste, waste water, CFC-12, hazardous waste, CH4 andN20.
LCIA Calculation Method(s): Not applicable
LC Cost Calculation Method(s): The software will calculate the marginal cost to the utilityfor generating the required electricity and the net present value of the technology based on user-defined parameters (OEM, capital, installation, inflation rate, expected life, etc.)
Output: Both text (files) and graphic output support are provided. Input data and calculatedresults can be copied to a file in ASCII form. Graphical depiction of results includes bargraphs, off- and on-site emissions, load curves and supply curves. Report options include eightdifferent formats, all of which have export capabilities and user specified options.
COMPUTING:
User Support: On-line help available through program. SAIC offers on-site training andsupport over the phone.
Operating System: DOS, MS Windows 3.1, Microsoft Access
Hardware Requirements: 386-SX, 16 MHz, 4 MB RAM and 5 MB free hard disk space
COMMERCIAL SPECIFICATIONS:
Price and Conditions: $14,000 for industry and private firms; some arrangements foracademic and research facilities can be made. Availability of software is by contract only.
Demo Availability: Yes, manual and disk.
CUSTOMERS AND REVIEWS:
Number of Users: Over 250 software copies have been ordered by industry.
Targeted Type of Users: Non-expert user
Published Reports: Unknown
A-6
SOFTWARE: EcoManager
VENDOR:Company: Franklin Associates, Ltd.Address: 4121 83rd Street, Suite 108, Prairie Village, KS 66208Contact: Bruce KuskoPhone: 913-649-2225Fax: 913-649-6494
FEATURES:Version: 1 (January 1994)
System Type: LCI using generic data.
Data: System provides generic data, the use of which will apply to average or typicalprocess/product situations. Four databases are available: materials, energy, waste, andtransport. Within the demo manual there was no indication of the extent or contents of thesedatabases or data quality indicators. Weight in pounds (lbs.) is the unit in which all non-energydata must be entered and evaluated. Use of other units must be manually converted to lb. Energy units must be MBTU and be relative to the reference quantity of the process. Three ofthe databases can be updated (materials, waste, and energy); transportation cannot. Data inputprocedures were not clarified in the materials (demo) provided.
User Interface: EcoManager is in English, both manual and software. All processes must bepredefined by the user prior to creating a new inventory. The user is prompted through simplemenu screens to enter the material, transport, and energy flows from each process step. Thedata management spreadsheet for each process is also accessible to edit and add data asdesired. No graphical representation of the created system is supported.
LCI Calculation Method(s): The model uses backward-chaining processing, or processes inwhich the environmental burdens are linked to the amount of output required. Thus, afunctional unit must be specified; the life cycle inventory will be normalized/calculated againstthe weight of this functional unit. The model works backwards through the system, thus the firstprocess evaluated is the last within the system (prior to waste disposal). For each process, areference quantity which was the basis for the inventory data must be defined by the user. Links between processes are not dynamic.
A maximum of four material outputs can be entered for each process. Five closed loop inputmaterials can be entered into a single process. Only one co-product can be specified perprocess, thus multiple co-products must be grouped. The allocation method used is by weight;other allocation methods require manual calculations to weight. Up to twenty stages usingtransportation can be defined. Distance traveled and a utility factor are the two dataparameters the user can define. Waste management options include default transport data.

A-7
Data are maintained and manipulated by an Excel spreadsheet. Energy outputs for the systemare limited to one electrical and one heat. No clear definition of recycle loops was offered.
LCIA Calculation Method(s): Not applicable
Output: The model supports only tabular output of calculations. Each defined process isidentified as a column heading, below which are three columns which contain "notes,""references," and "calculated values." Notes allow the user to track materials and energythrough the system; reference columns contain data about the inputs and outputs ofmaterial/energy relative to the reference quantity for that process; and the calculations columnpresents the inputs and outputs based on the functional unit defined for the system. Data andcalculations are managed in a Excel spreadsheet, therefore export of results is supported.
COMPUTER:
User Support: Not explicitly stated.
Operating System: DOS 3.1 or higher, Windows 3, and Excel 4
Hardware: 386 or 486 with at least 4 MB RAM
COMMERCIAL SPECIFICATIONS:
Price and Conditions: $10,000
Demo Availability: Yes; demo manual is extremely limited in its explanations ofdemonstration of system capabilities.
CUSTOMERS AND REVIEWS:
Number of Customers: 6 industrial users
Targeted Type of User: Intended user is the non-expert. With the lack of a graphicalinterface (all entries are prompted via dialogue) and complexity of data input, this intended useris not practical.
Published Reports: Unknown
A-8
SOFTWARE: ECOPACK2000
VENDOR:Company: Private consultantAddress: Esslenstrasse 26, CH-8280, Kreuzlingen, SwitzerlandContact: Max BolligerPhone: UnknownFax: Unknown
FEATURES:Version: 2.2
System Type: LCA oriented towards packaging systems with equivalency and scarcity basedimpact characterization methods.
Data: Includes two sets of data modules for energy carriers, materials production andtransportation. One set of data are derived from the Swiss BUWAL (Swiss Office for theProtection of the Environment, Forests, and Scenery) study of 1992. (Note: This study is beingupdated and expanded and new data are expected in 1996.) Some data are included forprocess operations associated with packaging materials (film production, blow molding,injection molding, and lacquer application) and commodity materials manufacturing for typicalpackaging items, e.g., aluminum, glass, various commodity thermoplastics (HD-PE, LD-PE,PA, PET, PP, PS, HIPS, PVC), various papers and paper boards, and tin-plate. A seconddata set represents an average of European data primarily from the Boustead database. TheEuro-average data are less complete. Data are in SI units. All of the data are believed to besecondary except for some European average data on electrical energy systems and polymerresin production collected by Ian Boustead and the APME. Very limited capability for userinput data fields are provided in the model. No explicit data quality indicators are used.
User Interface: The current version of EcoPack2000 is in English. The user manual has alsobeen translated to English, however, the detailed documentation of the methods and databasework up are in German.
LCI Calculation Method(s): The topmost analysis unit is the product description. Once theuser identifies the system(s) of interest and selects the database to be used, the actual definitionof the profile is performed by inputting the mass of the various units used for the material inputs,e.g., 10 grams of aluminum with 100 percent recycled content and 50 grams of glass with 74.8percent recycled content. In addition to specifying the materials (which in principleincorporates the rolled up energy and emissions to produce the designated amounts of thematerial, and presumably inclusive of the inherent energy), the user specifies additionalprocessing and transport operations. Some of the choices are not obvious from the on-screeninformation or the limited available help file. The user manual is very sketchy on how to add themiscellaneous operations, although some of the possible choices can be discerned with some
A-9
thought. For example, the burdens from a car equipped with a catalytic converter are includedby inputting the number of km traveled. Similarly, the other transportation segments are addedvia specification of the tonne-km used, necessitating some off-line effort to estimate thesequantities.
Loops (e.g., recycling) are solved via a mathematical process not described in any detail in thedocumentation. The user can insert various recycling rates for selected materials asappropriate. Energy credits are applied for post-consumer recovery of energy fromincineration facilities. The inherent energy of the material is multiplied by the fraction of wasteincinerated and the fraction of incineration facilities in Switzerland (neither of which is useraccessible for modification) to derive the credit. The reduction in virgin material requirementsfor a recycled product is credited based on the fraction recycled. Co-product allocation ismade on a basis not described anywhere in the documentation but presumed to be identical tothat used in the BUWAL study, which is based on the relative mass of products produced. Thelack of user capability to define the nature of the system and the linking of operations makes theLCI portion of this model very limited in respect to supporting applications to systems otherthan packaging.
LCIA Calculation Method(s): The impact assessment method partially follows SETACguidelines for that portion that is based on equivalency conversions. There is no attempt todefine the full range of classification factors that may be applicable to a given product or servicesystem. Both the “critical volumes” approach, which relies on the computation of adimensionless ratio of the inventory output divided by a regulatory standard, and the Eco-PointsMethod, which assigns environmental load points based on the relationship of a particularinventory parameter to a target, have been discussed in the LCA literature and considered inthe SETAC LCIA framework development. However, the limited capability to computecritical volumes for the range of impacts now considered relevant to LCA and the specificconstraint of the Eco-Points Method to Swiss or German conditions, particularly asimplemented in this program, make it very limited for application elsewhere. (Note: A moreflexible software package for implementing this method, from the standpoint of allowing greateruser input of the system decryption, is available as the EcoPro model. However, the morefundamental problem of defining the appropriate algorithm for the calculation of the number ofeco-points per functional unit of emission remains.)
Output: Both text and graphics output support are provided. The basic program menu screenis used to compile the results according to the comparison of alternatives desired. Up to fivesystems can be defined and the results presented at one time. The text output consists of a setof tables whose content consists of total system energy usage and aggregated critical volumes toair, water, landfill as well as the computed total eco-points. Actual inventory load values arenot available. Numerical values for the output are provided as point estimates; no uncertaintyinformation is given and any sensitivity analysis is done manually. Simple bar-chart graphics areavailable from the print menu. Printer support is minimal. Import or export of data or resultsfiles is not supported.
A-10
COMPUTING:
User Support: Not available in U.S.; customization and user support available through theauthor.
Operating System: DOS 3.2 or higher
Hardware Requirements: 286 processor, 640 K RAM, and 1 MB disk space, minimum.
COMMERCIAL SPECIFICATIONS:
Price and Conditions: Approximately $5800
Demo Availability: Yes
CUSTOMERS AND REVIEWS:
Number of Users: More than 9
Targeted Type of Users: Non-expert users; the model generally very straightforward tooperate.
Published Reports: SETAC LCANews, Vol 5, No. 2, March 1995.
A-11
SOFTWARE: GaBi
VENDOR:Company: Institut für Kunststoffprüfung und Kunststoffkunde
and, PE (address and phone/fax listed below)Address: Product Engineering GmbH, Kelterstrasse 93, D-73265 Dettingen/Teck,
GermanyContact: unknownPhone: +49 7021 942 660Fax: +49 7021 942 661
FEATURES:Version: 2.0
System Type: LCI and Impact Assessment model
Data: The database includes 800 different energy and material flows. Each flow belongs to aflow group which allows the user to develop a hierarchical system. For example: PP granulesbelow to the flow group raw materials; an aluminum fender belongs to the flow group parts;and CO2 belongs to the flow group emissions to air. Ten generic process types which contain400 specific industrial processes are also included in the database. The 10 process typesinclude 1) industrial processes, 2) transportation, 3) mining, 4) power plants, 5) transformationprocesses, 6) servicing, 7) cleaning, 8) repairing, 9) wear, and 10)processes of reducedconsumption. Flows are contained within these process types. Multi-functional dialogue boxesallow user to input and edit data and comments as desired (not clearly demonstrated). Besidescommon process data from around the world, the database consists of special data from IKPresearch and cooperation with industrial companies from different sectors in Germany. Noindication of data quality was specified.
User Interface: Demonstration disc (non-interactive) is in English. A full version of thesoftware is only available in German; an English version is expected out in mid-/late-1996. Theuser develops the product system for analysis through a graphical Plan window. Data editingand entry from this window is supported. Software offers on-line help, as well as image andtext editing.
LCI Calculation Method(s): The modular design of the model distinguishes between sixworking areas: inventory (i.e., flows), scenarios, methods, balances, valuations, and generaltools. Only the inventory area of the software, used to create the system under evaluation, wasdemonstrated (non-interactively). A system is developed using the graphic Plan window of theprogram. Sub-processes in a system can be developed on separate plans, saved, and latercombined in the system plan. The software layers these connected plans and allows easy foreasy transfer between layers.
A-12
Plans are developed by simply dragging and dropping industry types from the tool boxdisplayed on the Plan window. Flows between industry types are created by dragging a linebetween them. Database parameters can be viewed for any industrial type from the Planwindow. The use of text and image editors, though not demonstrated, allow the user to changeplans and specify process data. The method of calculation was not demonstrated or explainedwithin the demonstration material.
LCIA Calculation Method(s): The valuation area of the software allows the user to definethe criteria of valuation. Monetary, technical, and ecological assessments are possible. Weighting keys for the valuation criteria allow the user to realize individual preferences. Thenon-interactive demonstration, however, did not allow this feature to be demonstrated ortested. Literature describing the software states, 'the standard LCIA method is subdivided intofive steps: selection of the critical ecological fields; classification; determination of the impactassignments; standardization; and evaluation.' Ecological fields can be classified using indexesstored in the database (e.g., resource consumption, ozone depletion, release of toxic effectivesubstances, acidification, etc.).
Output: Several balance sheets are available within the software, including energy, mass, andvaluated balances. Export of balance sheets to MS Excel applications is possible. From thenon-interactive demonstration, it was apparent that calculation summary sheets can becustomized. Graphical display of results was not explicitly discussed in the demo.
COMPUTING:
User Support: Unknown
Operating System: DOS, MS Windows
Hardware Requirements: Unknown
COMMERCIAL SPECIFICATIONS:
Price and Conditions: Approximately $10,000 (14,000 DM)
Demo Availability: Only non-interactive demonstration disc with no manual
CUSTOMERS AND REVIEWS:
Number of Users: Unknown
Targeted Type of Users: Experienced LCA practitioner; graphical interface and variousanalysis areas may lend themselves to a more novice user.

A-13
Published Reports: Unknown
A-14
SOFTWARE: KCL-ECO
VENDOR:Company: Oy Keskuslaboratorio - Centrallaboratorium Ab (The Finnish Pulp and Paper
Research Institute) Address: Tekniikantie 2, P.O. Box 70, FIN-02150 Espoo, Otaniemi, FinlandContact: Tiina PajulaPhone: 358-9-43-711Fax: 358-9-464-305
FEATURES:Version: 1.0 for Windows
System Type: LCI
Data: KCL-ECO does not include data modules other than fictional ones used indemonstration flowsheets. KCL-ECODATA is a separate product containing modules basedon Finnish and general European data related to the pulp and paper industry and its relatedservices. There are free text fields available for documentation of information sources. However, one of the unusual features of this program is that the relationships among the inputsand outputs of a unit operation are determined by a set of linear equations together with thefunctional unit definition. Therefore, unlike the situation where input and output data qualitybecome the sole basis for establishing the uncertainties, the uncertainty in an equation may bespecified as a range. This range later can be incorporated into a formal sensitivity analysis.Based on a review of the data contained in the sample library, individual data set documentationappears to be minimal. Other than the range estimates other data quality attributes are notused.
To facilitate construction of complex systems, the process and conveyance modules from otherlibraries and other flow sheets may be cut and pasted into a scenario that is being developed. Upon clicking the “add from library” button, the user enters a dialog box to choose whichmodules are to be selected. After identifying the module(s), pushing the “use” button pastesthem onto the flowsheet where the appropriate flow connections may be made.
User Interface: The KCL-ECO program takes advantage of the Windows graphical userinterface. The placement on and positioning of modules within the work surface can be donevia the usual “drag and drop” functions. Flow connections and other operations are controlledby selecting the item from the toolbar or from the pull down menus. Double clicking on amodule box or flow connection opens a dialog box for definition/selection of input variables,output variables, and specification of linking equations. The screen presentation actuallyconsists of two panes, one showing the flow diagram and one showing the results. As thecalculations are performed, the results screen is updated so that it is possible to haveintermediate results available before the entire system is defined.
A-15
LCI Calculation Method(s): The KCL-ECO program uses either a sequential or a sparselinear matrix equation solver (method not specified) to solve the set of derived equationsdescribing the system. It is unclear how the LCI calculation treats over-determined systems(where the number of equations exceeds the number of variables) or how iteration to solverecycling loops is accomplished. As far as can be ascertained there is no need for a userspecified tolerance to terminate calculations in iteratively solved equation sets, although morethan one computational strategy is available. The default appears to be the sequential method. All of the details of the calculations at each stage are preserved in both the calculations and thereports. One could, for example, solve for just a subset of processes. The level ofdisaggregation is dependent entirely on how the user defined the equations. If the relationshipswere specified in highly aggregated terms, then the calculation would be on this basis. The onlyrequirement is to have the requisite number of equations. The user determines their form andcan have more than one way to specify a given system (which does not result in differentanswers).
The method for co-product allocation is not discussed in the user manual. In KCL-ECOversion 1.0, the user is expected to perform co-product allocation when defining the equationsof appropriate modules. The program does not track inherent energy separately from otherenergy flows. In fact, energy is only shown in the LCI summary in energy units when it isderived from electricity; other energy carriers are shown as the material quantities.
An unusual and highly desirable feature of KCL-ECO is the inclusion of an uncertaintypropagation method in the basic computational engine. The user may select either a quickmethod in which the variables contributing the most to the flows are automatically selected or anexact method where the user can specify the variables, their statistical distribution (normal oruniform), and the uncertainty range. The Monte Carlo method is employed with a userspecified number of cycles (2000 is the default).
LCIA Calculation Method(s): Not applicable
Output: The output from KCL-ECO is very detailed and arranged in a very logical manner. The report lists, by module, all of the inputs, outputs and governing equations along with thespecified amounts. Any notes entered in the text filed are printed at the top of each section. These details are followed by a summary results section for the system as a whole followed bya listing of all of the variable names, units, quantities and group designation, e.g. emissions to air. Finally, if a sensitivity analysis is performed a distribution along with descriptive statistics isprovided. The flow diagram can also be printed. The report can be saved as a text file for laterworkup via a text processor. There is no apparent capability for graphical presentation ofresults.
COMPUTING:
A-16
User Support: Because this model has been developed by an industry technical institute, it isunclear whether independent user support is available apart from the institute staff. The usermanual is clearly written and the on-line help capability better than average. Most users shouldhave minimal need for continuing off-line support.
Operating System: Windows 3.1 or later; DOS 5.0 or higher, Filemaker Pro needed to rundatabase
Hardware Requirements: 486-SX Processor or better; 3 MB hard disk space; SVGAdisplay.
COMMERCIAL SPECIFICATIONS:
Price and Conditions: KCL-ECO program $3,600; KCL-ECODATA $2,400; $24 percustom module (1995 prices)
Demo Availability: Yes
CUSTOMERS AND REVIEWS:
Number of Users: As of August 1996: 50 within the Finnish forest industry; 20 externalclients.
Targeted Type of Users: Research and environmental management staff within companies;independent research institutes; LCA practitioners.
Published Reports: None known
A-17
SOFTWARE: LCA Inventory Tool (LCAiT)
VENDOR:Company: Chalmers IndustriteknikAddress: Chalmers Teknikpark, S-412 88 Göteborg, SwedenContact: Lisa PersonPhone: 46-31-772-4237Fax: 46-31-82-7421
FEATURES:Version: 2.0
System Type: LCI with integral database and limited capability to apply valuation indexfactors to the raw inventory data.
Data: The program provides a limited database for energy carriers and production and fortransportation modes. Complete cradle-to-gate life-cycles for a limited number of chemicals,plastics, pulp and paper products are also included. Additional data are available and theauthor’s organization can create additional data sets. Data developed for one life-cyclescenario can be saved and imported into another analysis. Imported data can consist of a singleprocess or transport card or an entire life-cycle. This latter situation may be useful if animprovement assessment consists of only limited substitution of new materials or processescompared to the baseline. The data documentation in the two supplied databases is containedin a notes box associated with each process and transport mode. The data provided are welldocumented as to the source and consist of a mix of primary information obtained during theLCA studies of the authors and secondary data from the general European data sets shared bymost practitioners, e.g., the energy portion of the Boustead/PWMI plastics data and theBUWAL data. No North American data are presently resident in either data set.
There are no attempts to provide any quality assessment of the data. Data are in SI units andthe program is sensitive to the mixing of units among processes.
User Interface: The program uses some of the graphical interface capabilities in Windows tofacilitate setting up the flow diagram and defining the governing relationships. However, thereare some limitations and not all of the features are implemented as intuitively as some of theother Windows-based LCA programs.
LCI Calculation Method(s): The program solves a set of linear equations based on the flowconnections defined for each of the process and transport cards selected and on the definitionof a special card that defines the reference flow (usually the functional unit.) For cards withmultiple flows the user must specify the percentage of the total flow allocated to each flow. Ifthis is not done correctly so that the totals balance, the program will not calculate the life-cycle. Also, not more than 16 material inflows can be specified for each process card. Although this
A-18
will not be a limitation in most cases, it is a potential problem for complicated processes. Theprogram also has some limitations in dealing with the splitting of flows once they have beenaggregated. For example, a series of materials comprising a package that are co-mingled at theconsumer stage cannot easily be separated back into their individual entities for wastemanagement and recycling. The program does maintain the separate calculation of the inherentand process energy components if the user has set up the description in this manner.
LCIA Calculation Method(s): Essentially not applicable although there is a capability toassign multipliers to selected emissions in order to create a relative weighting scale. So forexample a factor of 10 could be assigned to methane to indicate its global warming potential perunit emission mass is 10 times that of carbon dioxide. Another way this could be used is toexpress relative importance of various emissions/categories relative to one another. Thus, iftoxic chemicals were determined to be very important, all of the emissions could be factored by100 to elevate their significant relative to more conventional material emissions.
Output: A variety of copying and printing options is available. The Windows copy capabilityallows cutting and pasting of the flow diagram into a text processor as a meta-file. Theinventory summary graph may also be copied to a text processor. Export to other programs isalso available via the “Export” command. Exportable information includes the entire active lifecycle to a text file, a cross tabulated matrix showing the emissions and energies in the rows andthe process and transport cards across the columns, or the inventory profile listing the energiesand emissions into a tab-delimited file readable by LOTUS and Excel.
COMPUTING:
User Support: User support is available from the authors who also can assist with dataacquisition. The user’s manual is also reasonably clear and easy to follow with simple examplesto illustrate key features.
Operating System: DOS, Windows 3.1 or better, database runs on an internal platform notexportable
Hardware Requirements: 486 processor with 2 MB RAM and 2.5 MB hard drive spaceminimum.
COMMERCIAL SPECIFICATIONS:
Price and Conditions: $3,500 approximate 1995 price
Demo Availability: Yes
A-19
CUSTOMERS AND REVIEWS:
Number of Users: Exact number unknown but is one of the more popular programs inEurope.
Targeted Type of Users: Program is straightforward enough to be used by non-expert usersbut a moderate level of understanding of materials and energy flow modeling would be helpfulto understand some of the underlying assumptions and avoid the limitations.
Published Reports: SETAC LCA news, Vol. 3, No. 5 and Vol. 5, No. 4; also mentioned inseveral theses and other academic studies in Sweden. Used as part of a large eco-designproject in Scandinavia.
A-20
SOFTWARE: Life Cycle Interactive Modeling System (LIMS)
VENDOR:Company: Chem Systems, Inc.Address: 303 South Broadway, Tarrytown, NY 10591-5487Contact: Don F. BariPhone: 914-631-2828Fax: 914-631-8851
FEATURES:Version: Not specified
System Type: LCI for simple and multi component systems, assessment and economics.
Data: Presently contains over 1,000 modules (i.e., emission data files) representing rawmaterial extraction, manufacturing, utility generation, transport, recycling, and waste disposal. Geographic coverage is primarily North America, with some European and Japanese data. Both SI and English units are available. The user has the option to input independent data oruse the default modules. No explicit data quality indicators are used.
User Interface: Software and manual are in English
LCI Calculation Method(s): An assessment begins by the user defining a product or processof primary interests. LIMS then "automatically" creates the up-stream ("cradle") process andmaterial pathways, and the down-stream ("grave") pathways (as interpreted from the non -interactive demonstration disc).
Modules are used to represent a step or series of steps in the product network. As eachmodule is selected to create a system, the user is required to input factors which define how theinputs and energy/environmental burdens associated with the module should be allocatedamong the outputs of the module. Though flexibility was stated as a feature of LIMS within thisallocation process, the various methods and how they apply were not clearly identified. Afterthe modules have been completed, the “linking and solution” algorithm of the model links allmodules through their inputs and outputs. This algorithm solves the overall network to providethe net resource and environmental burdens associated with the product network.
LCIA Calculation Method(s): LIMS translates the inventory data into assessment categoriesaccording to their environmental burden classification (e.g., global warming, ozone depletion,etc.). Where relative factors are available, each species in a category is converted to acommon category basis. Assessment categories include, but are not limited to, acid rainprecursors, global warming, bioaccumulation, VOC, etc. The default factors in the model canbe replaced with user-defined values.
A-21
Economic Calculation Method(s): The demonstration software and literature did not clearlypresent the method by which LIMS translates environmental burdens to economic indicators.
Outputs: Graphic and database presentation of results is possible. The model can be used todetermine the contribution of any module to the net burden. For the assessment of competingproducts, or of alternative process or recycling options, LIMS provides a “bullet” comparison,or weighted burden categories (" " !), to represent the impact assessment results. Up tofour unique LCI cases can be compared (viewed) at one time. The user can also print tables orgraphs in a Lotus format. Data and results export was not explicitly stated.
COMPUTING:
User Support: On a consultant basis for an annual fee.
Operating System: DOS, Windows 3.1+, and Lotus 5.0+
Hardware Requirements: IBM compatible 486/66, 8 MB RAM, and 12 MB of free harddisk capacity.
COMMERCIAL SPECIFICATIONS:
Price and Conditions: $25,000 which includes 200 default database modules. Additionalmodules are $2,000 each.
Demo Availability: Yes, non-interactive, no users’ manual provided.
CUSTOMERS AND REVIEWS:
Number of Users: Unknown
Targeted Type of User: Experienced LCA practitioner or novice with consulting assistancefrom Chem Systems, Inc.
Published Reports: Unknown
A-22
SOFTWARE: Pira Environmental Management System (PEMS)
VENDOR:Company: Pira InternationalAddress: Randalls Road, Leatherhead, Surrey, KT 22 RU, United KingdomContact: Carolynn PonsfordPhone: 44 0 1372 802000Fax: 44 0 1372 802238
FEATURES:Version: 3.1
System Type: LCI covering materials, transportation, energy, and waste management as wellas LC impact assessment capabilities (problem or medium oriented).
Data: Full range of standard LCI analysis studies calculating Western European averages, andEuropean site-specific data. Database is fully annotated with explanations of data sources andassumptions made to arrive at presented information. Included in the package are inventoriesfor 109 materials, 49 energy sources, 16 transportation options, and 37 waste managementoptions. Data included in PEMS Model cannot be changed/edited. User specified data entryis an option.
User Interface: Database and full/demo manual are in English. System management(development of flow schemes) is accomplished pictorially and in tabular form.
LCI Calculation Method(s): All data are calculated back to a functional unit (e.g., X poundsof detergent or so many gross of nails). The working template is a pictorial working sheet ontowhich processes are added by process blocks. With each process block comes burdeninformation (not including closed loop materials/energy inputs or outputs) which is added to anunderlying Excel spreadsheet which performs the calculations. Any number of energy andmaterial inputs/outputs can be added to the template. Connections created between any seriesof blocks represent either energy or material flows; with each material flow the user isprompted to specify (if desired) transportation burdens. Distribution blocks can also be addedto the system spreadsheet which allow the combination or splitting of multiple material streams. The allocation of emissions between co-products can be accomplished/determined through avariety of factors; avoided emissions system, allocation by weight, allocation by energy content,allocation by chemistry and allocation by economics are each explained within the manual. Distribution blocks offer the user the capability to choose between these options. A variety ofoptions is also described and available for recycled and re-used material/energy streams. Amass balance for each process block is automatically performed.
A-23
LCIA Calculation Method(s): Two impact assessment calculation methods are availablewithin the PEMS software: problem-oriented and media-oriented, critical- volume assessmentmethods. Problem-oriented impact assessment is accomplished through three steps. First, theinventory data are aggregated according to the relative contributions made to ten environmentalconcerns. Relative impacts to each environmental concern use factors obtained from a singledocumented source. Normalization represents the second step and relates the processemissions to world annual effect scores. Valuation represents the final assessment step and isused to calculate a single number for a product system. PEMS leaves the determination ofweighting factors to the user in this valuation step.
Media-oriented, critical-volumes assessment calculations are also possible with this software. In this method, inventory data are aggregated into air, water or soil/land emissions. Onceaggregated, regulatory standards are used to calculate the volumes of air and water that wouldbe necessary to dilute the emissions to such an extent regulatory standards are met. Limitvalues are German/Swiss.
Output: Both tabular text and graphics outputs are possible. Summary reports presentinventory data by combining similar columns (i.e., Entered Data, Linked Materials, LinkedEnergy, Transport, and Waste Management or other user defined categories). Standardtemplates (up to 25) can be used or edited for graphical output.
COMPUTING:
User Support: Telephone hotline and PEMS Users Club.
Operating System: MS-DOS version 3.1 or higher, Windows 3.1 or higher, and Excelversion 4 or 5.
Hardware Requirements: IBM 386 or higher, minimum of 4 MB of RAM if running Excel 4,or 6 MB of RAM if running Excel 5.
COMMERCIAL SPECIFICATIONS:
Price and Conditions: $9150 (£6000) for industry; $4600 (£3000) for research andeducational establishments; $3800 (£2500) individual licence.
Demo Availability: Yes
CUSTOMERS AND REVIEWS:
Number of Users: Unknown
Targeted Type of User: Graphic interface allows novice users to perform LCI analysis, yet

A-24
the system supports a complex system which could be developed by an experienced LCApractitioner.
Published Reports: Unknown
A-25
SOFTWARE: Product Improvement Analysis (PIA)
VENDOR:Company: Instituut voor Toegepaste Milieu Economie (TME)Distributor: PRé ConsultantsAddress: Grote Marktstraat 24, 2511 BJ ‘s-Gravenhage, The NetherlandsContact: Myriam van Niekirk (TME)Phone: 31-70-346-4422 (TME); 31-33-461-1046 (PRe')Fax: 31-70-362-3469 (TME); 31-33-465-2853 (PRe')
FEATURES:Version: 1.2
System Type: LCI with the added ability to input “soft” inventory items such as thermal waste(heat), other residues (e.g., radiation), nuisances, resource scarcity, life time, and spaceoccupancy. These latter fields could be used to track a limited “impact” issue list.
Data: There is an embedded data set with information of two types - Dutch data collected bythe authors of the software or other Dutch consulting/research organizations and the BUWALSwiss/European data set. Most of the data appear to be secondary, except for those obtainedby the authors during their LCI studies. The data sources are generally well documented. Dataand process documentation fields are provided for each data item and process.
User Interface: The user creates the system specification by identifying processes andoperations and linking them. The linking is done by connecting the product of one process withthe raw materials or ingredients of the next. Additional types of processes, each with uniquecharacteristics, are provided for transportation operations, energy processes, and wastemanagement. The system flow diagram can be displayed in pictorial form on the screen via the“tree” function and several options are available to control the complexity of what is shown. The normal mode displays all linked operations and provides full detail in the results matrix. The choices are “half-consolidated,” “consolidated,” and “stripped.” A half-consolidatedprocess is one where all of the upstream entries have been collapsed into the process and theoutputs represent the “rolled-up” sums of the process and its preceding steps in both the treeview and the results matrix. Half-consolidated processes can be toggled to normal status if theadditional detail is desired. A consolidated process is similar except that the consolidation ispermanent. Finally, the stripped process loses all of its links with the other processes. Thismode is used primarily to export a process whose linked details are sensitive or to ensure that asubsequent user does not gain access to these details.
LCI Calculation Method(s): Once satisfied that the material balance for a process has beenspecified to an acceptable level (the program tracks this in the process summary sheet), theprocess may be saved as part of the database. The material balance calculations include acategory of output termed “by-products.” Unlike “co-products,” by-products are not used in
A-26
another process nor do they carry shares of the allocated burdens. The user then defines thelinkages among the system elements, either selecting from the process/transport/energy library(via a screen menu) or creating new application-specific items. When a link is established, theprogram performs a set of spreadsheet functions to allow the continuing expansion of thesystem until all links have been defined. The preferred means of creating the system definition istop down, i.e. A6B6C6D6E; limited capability is available for bottom up or randomconstruction and problems with the calculations can occur if these modes are used without greatcare.
LCIA Calculation Method(s): Not applicable
Output: The output menu allows the presentation of results (including the tree view) selectedby the user to the screen, to a printer, or to an ASCII file. The emissions matrix can also beexported via the creation of a DIF file to a spreadsheet. The content of the output is created byselecting the processes to be displayed and the individual data fields in a process. The tableformat is fixed. Various combinations of the processes and data fields can be specified andsaved during a session as a “set” through a marking procedure that defines a grouping ofprocesses and their associated data fields. These sets are not permanent. Once the user leavesthe output menu, the defined sets are erased. The PIA program contains no graphical outputcapability. Additional presentation of graphical information and or the product tree will need tobe done by post-processing the ASCII or DIF file.
COMPUTING:
User Support: Available from PRé; no North American vendors or technical representativesare known.
Operating System: DOS, version 3.3 or higher; network compatible with Novell version 2.0or higher, Windows
Hardware Requirements: 286 processor, 640 K RAM, and 1 MB hard drive spaceminimum; 486 processor preferred.
COMMERCIAL SPECIFICATIONS:
Price and Conditions: $1,400 (1994)
Demo Availability: Yes
CUSTOMERS AND REVIEWS:
Number of Users: Unknown
A-27
Targeted Type of Users: The PIA program is simple enough that non-expert users can runit, although some of the data creation, display, and maintenance functions would be betterserved by an expert in an organization.
Published Reports: SETAC LCA News, Vol. 3, No. 5 and Vol. 5, No. 2.; also listed in the“LCA Sourcebook.”

A-28
SOFTWARE: Resource and Environmental Profile Analysis Query (REPAQ)
VENDOR:Company: Franklin Associates, Ltd. (FAL)Address: 4121 W. 83rd St., Suite 108, Prairie Village, KS 66208Contact: Bruce KuskoPhone: 913-649-2225Fax: 913-649-6494
FEATURES:Version: 1.0
System Type: LCI
Data: Selected data on packaging materials and configurations from the FAL LCI databasehave been inserted in the model. The data represent average U.S. conditions and include all thenecessary modules from cradle-to-grave aggregated into the packaging system. The usercannot access the database directly and has no ability to extract materials or processesindividually. The process data are a combination of primary and secondary data sources. Theenergy production, transportation, and raw materials extraction processes are exclusivelysecondary data while the intermediate materials and final packaging assembly processescombine some literature data with average process descriptions derived from FAL’sapplication of LCI methodology to various packaging systems over a period of years. Theembedded database size is not precisely known but at a minimum encompasses hundreds ofindividual processes for most common packaging materials.
User Interface: The user screens consist of a combination of menu bars and pop-up menusfrom which various functions may be accessed. The information fields required for definition ofa complete packaging system are:
C Package Name - allows both a specific name and selected characteristics to beattached to the name, e.g., bleach, 1 gal, 10%, indicating both the size and recycledcontent,
C Description - allows a more complete specification of the system, including individualcomponents and materials,
C Basis - can be any meaningful quantity of the packaging system but usually is thefunctional unit,
C Component Name - the description identifying the separate components of thepackage, e.g., PP cap,
C Materials/Fabrication Method - the specification, provided in a pop-up menu of thecategory of material and the associated process, e.g., PL: HDPE blow-molded, wherePL stands for plastic, MT for metal, and so on.
C Weights - the exact amount of the component in pounds per basis unit; REPAQ does
A-29
not perform this analysis automatically as do some other software packages. The usermust calculate the specified amounts and pounds must be used, and
C Recycle % - this field is used to insert specific information for either the post-consumerrecovery rate or the recycled content (but generally not both); some error may beintroduced by the assumption used to implement this feature for paper based systemsand to a lesser extent plastic-based systems.
Additional user-specified materials and operations cannot be entered in REPAQ as leased;FAL can provide additional or custom data augmentation.
LCI Calculation Method(s): The basic computational process used by REPAQ starts withthe development of modules for each of the relevant operations that make up the packagesystem. A materials balance is constructed for some arbitrary but convenient unit of productoutput, say 1000 lbs, and all inputs and other outputs are scaled accordingly. Energyrequirements for each module are determined in terms of either fuels entering directly into theoperation or indirectly via energy in the form of steam or electricity. A set of flow sheetsdescribing the interconnection of all of the cradle-to-grave processes is prepared for eachmaterial. Then, given the user-specified basis, the calculated amounts of each material, andworking backwards from the final package, the proportionate energy and emissions arecomputed for the system. Credits are given for recycling in proportion to the displacement ofvirgin materials and for post-consumer energy recovery in proportion to the heating values ofthe materials and typical combustion efficiencies/heat recoveries in municipal incinerators.
As is typical with FAL LCI’s they apply a consistent set of assumptions to their calculationseven though some of these may differ from typical international practice. Some of thepotentially more consequential ones include:
Energy of Material Resource: The fuel equivalent of input raw material s traditionally used asfuels in the U.S. is recorded as energy consumption to the system. Furthermore, FAL does notcompute fuel equivalent values for raw materials not used as fuels. In the case of packaging thispredominantly affects wood used for corrugated, paperboard, and paper.
Co-Product Allocation: FAL considers two categories of output co-products: 1) situationswhere the items to be allocated consist of the product of interest and one or more co-productsindependent economic viability, 2) situations where the primary product is the reason that theprocess exists and where the co-products are given away or have marginal value. Little or noco-product allocation is done in the latter case. Examples of this situation are mine tailings orpower plant ash used for road building and animal manures used for farm field application assoil supplements.
Insignificant System Components: Contributions from capital equipment, space conditioning,support personnel requirements, e.g. R&D, sales, and administrative activities, andmiscellaneous materials and additives (in total <1 percent of net inputs) are excluded.
A-30
LCIA Calculation Method(s): Not applicable
Output: Both tabular and graphical output are available. About a dozen different reportcontent items can be chosen depending on the application. These may be compared for up to 5different layouts (systems) at once:
C Atmospheric Emissions by Component/Layout - shows both the individual componentand total system values for that component or layout which generates the maximum ofthat pollutant; FAL’s methodology does not allow the reader access to any individualsteps in the life-cycle; emission parameters are limited to a few of the more commonones available from the literature or from regulatory monitoring programs,
C Atmospheric Emissions by Pollutant - lists each atmospheric pollutant by eachcomponent or layout,
C Energy Profile - reports in millions of BTU the fuels consumed for each component orlayout without credit for energy recovery in post-consumer waste-to-energy systems,
C Energy Usage by Category - shows the net energy (with recovery credit) for eachcomponent/layout but broken out by material resource (feed stock energy contained inthe material, e.g. natural gas energy in polyethylene, and process and transportationenergy contributions,
C Energy Usage by Category/Graph - presents a bar chart of the data from the previousreport,
C Solid Waste Generation - summarizes the amounts of solid waste by weight and volumebroken out by categories of process waste, fuel-related waste, and post-consumerwaste for each component and layout,
C Solid Waste Generation - Weight or Volume/Graph - presents the weight or volumedata for solid waste in bar graph format,
C Summary of Energy Usage and Solid Waste - presents two data sets in one table, C Waterborne Emissions by Component/Layout - similar to atmospheric emissions table,
andC Waterborne Emissions by Pollutant - similar to corresponding atmospheric emissions
table.
Reports may be output to any of three devices - the screen, a printer, or an ASCII file. Fromthe ASCII file additional post-processing may be done.
COMPUTING:
User Support: Available through FAL; limited training and consulting provided with lease.
Operating System: Paradox database, runtime version. DOS
A-31
Hardware Requirements: 386/486 processor with 4 MB RAM recommended; 3 to 5 MBhard drive space required depending on need for separate installation of runtime version ofParadox.
COMMERCIAL SPECIFICATIONS:
Price and Conditions: $10,000 for first year lease; negotiable for subsequent years.
Demo Availability: Demo discs and manual
CUSTOMERS AND REVIEWS:
Number of Users: Unknown
Targeted Type of Users: Non-expert users in the packaging engineering or designdepartments of industrial companies.
Published Reports: SETAC News, Vol. 2, No. 4; Vol 3, No. 5; Vol. 3, No. 6, and Vol. 5,No. 2.; also used as part of the SETAC LCA short course in 1994.
A-32
SOFTWARE: SimaPro
VENDOR:Company: PRé ConsultantsAddress: Bergstraat 6, 3811 NH Amersfoort, The NetherlandsContact: Mark GoedekoopPhone: 31-33-461-1046Fax: 31-33-465-2853
FEATURES:Version: 3.1S
System Type: Full LCA with multiple methods for impact assessment
Data: The SimaPro database is one of the more comprehensive ones. Compared with thosesupplied in other LCA software packages, the database on processes for production ofcommodity materials is more comprehensive and includes a greater variety of processesassociated with non-packaging related materials. All of the embedded data are fully referencedas to their source and there are limited qualitative descriptions of data sets that are consideredto be old or weak. No other formal data quality assessment procedures are used. All of thedata (with a very few minor exceptions) are for European or more specifically Dutchconditions. The data are primarily secondary in nature, especially those for general Europeanconditions, but there is a significant amount of data from specific LCA studies conducted by theauthors.
User Interface: The developers of SimaPro have done a remarkable job of emulating agraphical user interface in a DOS-based product. The features of the interface include pull-down menus, mouse support, and point and click activation of many of the features. Althoughthe screen displays are not as smooth or polished as those in a true graphical user interfaceenvironment, most users will not find the difference to be overwhelming. All of the on-screeninformation as well as the user manual are in English.
LCI Calculation (Method(s): The user sets up a system by describing the sequence ofoperations involved in making, using, and disposing/recycling via a set of dialog sheets selectedvia the menu. The extensive substance and process library means it is likely that typical userswill be able to construct many life-cycles without extensive input of new data. The data arekept disaggregated by parameters during the inventory calculations and not aggregated until theimpact assessment.
LCIA Calculation Method(s): The impact assessment component of SimaPro consists of aset of buttons designated as “characterization,” “normalization,” and “valuation” to correspondto the current SETAC nomenclature for LCIA. The program accumulates the inventory datainto 11 classes of impact issues ranging from global ones, such as ozone depletion, to local
A-33
ones, such as heavy metals. The characterization method is not discussed in detail in the limitedon-line help capability, but based on discussions with Dutch LCA practitioners, probablyconsists of equivalency factors for each of the inventory compounds/materials. Some of theequivalency conversions used are not universally agreed upon; however, there is nointernational standard to provide a basis for judgement either. The normalization method isbased on the Dutch Eco-indicators approach in which a defined target for environmental qualityhas been defined and agreed to by various groups in The Netherlands. Relevancy of theregional or local indicators to conditions outside of the Netherlands is debatable. The indicatorsare used to compare the particular system under study to the target. The further removed fromthe target the overall environmental performance and the greater the contribution from thestudied system, the higher the normalization value for a given environmental issue. A valuationcapability to compare across impact categories thereby deriving a single value from the LCA isalso included, however, the method of determination of the weights is not discussed in the on-line help. Because the user manual available is somewhat old, any comments about this portionof the LCIA should be deferred.
Output: SimaPro provides both textual and graphical output. The user can toggle between thetwo modes to decide how best to view the data. In the text mode output is presented for eachof the steps from inventory to valuation. In the graphical mode two views are possible. Oneshows the results of the calculations as a bar chart according to the data or impact categories. The other view, which shows the flow diagram, contains a feature which is unique to SimaPro. In this mode the program inserts a small bar on the right of each process or transport box toillustrate the contribution of that part to the overall system or some subset. Depending on whichoutput item is selected, this is either the inventory loading, the raw impact equivalencies, or theaggregated impact information.
COMPUTING:
User Support: User support is available through PRé Consultancy. The user manual availableat present is an older one and may not be representative of current offerings. It covers mosttopics in a non-detailed fashion but the content and the writing could be better. Unfortunatelythe on-line help is limited so that users will likely turn to the manual more than otherwise mightbe the case.
Operating System: DOS 5.0 or higher
Hardware Requirements: 386 or better microprocessor; RAM and hard disc requirementsunknown at this time.
COMMERCIAL SPECIFICATIONS:
Price and Conditions: $3,000 (approximate price for single user analyst version)
A-34
Demo Availability: Yes
CUSTOMERS AND REVIEWS:
Number of Users: Exact number is unknown but believed to be at least a hundred at present.
Targeted Type of Users: Two versions are available: an “analyst” version directed at expertusers and LCA practitioners and a less detailed and sophisticated “designer” version developedfor use by product designers and engineers
Published Reports: SETAC LCANews, Vol. 1, No. 5; Vol. 2, Nos. 3 and 4; Vol. 3, No. 5;Vol 5, No. 2: also listed in the “LCA Sourcebook.”
A-35
SOFTWARE: TEAM™
VENDOR:Company: Ecobalance, Inc. (Member of the Ecobilan Group of Companies)Address: 15204 Omega Drive, Suite 220, Rockville, MD 20850Contact: Remi CoulonPhone: (301) 548-1750Fax: (301) 548-1760
FEATURES:Version: 1.15 (Windows 3.1, 3.11, and 95) and 2.0 (Windows 95 and NT)
System Type: LCI and costing module
Data: Model contains ten categories within which are contained 216 individual data files forproduct and material production, energy generation and transportation. The ten categories areas follows: 1) pulp and paper; 2) petrochemicals and plastics; 3) inorganic chemicals; 4) steel;5) aluminum; 6) other metals; 7) glass; 8) energy conversion; 9) transportation; and 10) wastemanagement. Within the full program the source of data is indicated; data quality indicators(i.e., geographical representation technology used and date of data) are available. Further dataquality indicators are not discussed. User defined input data fields, as well as database editing,are fully supported by the system. Units are defined by the user and can be in any system (e.g.,metric).
User Interface: Manual and software are in English. Process systems are developed througha series of menus which prompt the user to specify unit operations and links. No graphicaldevelopment of a system is supported in TEAM™ 1.15 (supported in TEAM™ 2.0 only)
LCI Calculation Method(s): Two levels are used in TEAM™, the database level and thecalculation level. Within the database level, information representing unit operations (processes,transport etc.) are stored in independent Modules. In the calculations level the system isdeveloped into which flow the Modules data. Within the system, nodes represent processsteps. Nodes can be linked and grouped to represent subsystems, and subsystems can belinked to create the total system. Closed loop and recycling inputs/outputs can be definedwithin a node by the user. Formulas from the package or created by the user can calculatevarious inputs and outputs within the system. This use of formulas and variables allows thedevelopment of a dynamic system which facilitates sensitivity analyst. There is no limit to thenumber of nodes and linkages possible within TEAM™.
Outputs: The output of the inventory is displayed in tabular form thru an “Ecoview.” Articles,defined by the user, represent parameters of interest for output from the system. Templates,also defined by the user, represent the format by which the articles are presented in theEcoview. Thus, the Ecoview is completely defined by the user. No graphical output is
A-36
explicitly stated. Inventory results from a system can be exported and saved as the input forsubsequent systems.
COMPUTING:
User Support: On line help; consultant available.
Operating System: IBM-PC compatible, Windows 3.11, Windows for Workgroups 3.11,or Windows 95 (TEAM™ 1.15); Windows 95 or Windows NT (TEAM™ 2.0)
Hardware: 486/33 MHz processor, 8 MB RAM and 10 MB free on hard disk
COMMERCIAL SPECIFICATIONS:
Price and Conditions: $10,000
Demo Availability: Unknown
CUSTOMERS AND REVIEWS:
Number of Users: 30 licensees worldwide
Targeted Type of User: Expert LCA practitioner; Ecobalance typically serves as consultantto establish LCA.
Published Reports:"Some Requirements of an Interactive Software Tool for Life Cycle Analysis," Journal ofCleaner Production, Volume 1 Number 3-4, September-December 1993.SETAC LCANews, Volume 4 Number 4, July 1994.Environmental Software Report, July/August 1995.

A-37
SOFTWARE: Total Emission Model for Integrated Systems (TEMIS)
VENDOR:Company: Oko-InstitutAddress: Binzengrun 34a, 79114 Freiburg, GermanyContact: Uwe FritschePhone: 49-761-473130Fax: 49-761-475437
FEATURES:Version: 2.0
System Type: LCI with some equivalency based impact characterization conversions, e.g.,greenhouse gases; also provides for monetary pricing of external costs of air pollutants andgreenhouse gases based on either damage costs (user specific) or control costs (default); canhandle non-quantitative impact assessment of eco-impacts, solid wastes, and land use via avaluation procedure based on the “relative significance” of each resource.
Data: includes extensive data modules for energy carriers, production and transportation. Some data are included for process operations and commodity materials manufacturing. Dataare in SI units, selectively adjustable by the user. Most of the data are believed to besecondary except for some German specific data on local energy systems collected by theauthors. Documentation data fields are provided in the model and the source of data isdocumented. No explicit data quality indicators are used.
User Interface: The current version of TEMIS is in English. The user manual has also beentranslated to English, however, the detailed documentation of the methods and database workup are in German.
LCI Calculation Method(s): The topmost analysis unit is the scenario. A scenario is createdby linking of one or more segments and/or processes. The linking is based on the functional unitrepresentation and the specified inputs and outputs. A segment is defined as an aggregation ofunit processes. Loops are solved via a mathematical recursion process comparing theincremental change in a subsequent solution to a user-selectable delta.
LCIA Calculation Method(s): The impact assessment method partially follows SETACguidelines for that portion that is based on equivalency conversions. There is no attempt todefine the full range of classification factors that may be applicable to a given product or servicesystem, although the user could group or perform some of these operations with the outputinformation. The external cost calculation routine represents one type of valuation procedurethat has been identified in the LCA literature and implicitly in the SETAC guidelines but is notexplicitly incorporated in either.
A-38
Output: Both text and graphics output support are provided. The scenarios menu is used tocompile the results according to the comparison of alternatives desired. Up to 20 scenarios canbe loaded at one time. The text output consists of a set of tables whose content is determinedvia the user selected choices from a menu. The choices include total system and local/globalsplits of energy usage and emissions. Emission groups can be further selected from severalchoices: total air emissions, detailed air emissions, land use and solids, greenhouse gases, user-defined emissions, and user-defined residuals. Emissions are presented by individualparameter, e.g. SO2. Resources are shown as primary energy, primary materials, andsecondary materials. Qualitative impact factors are output in a table with minus and plus signsto indicate the relative intensity. Numerical values are provided as point estimates; nouncertainty information is given and sensitivity analysis is done manually. Simple bar-chartgraphics are available from the scenarios menu.
A documentation feature allows creation of an ASCII text file to describe scenarios and tooutput data to a text processor. Tables are stored in tab-delimited format for import intospreadsheets or graphics packages. Import-export from/to dBase files is also supportedthrough field name and characteristic matching.
COMPUTING:
User Support: Not available in U.S.; customization and user support available through theOko-Institute.
Operating System: DOS 3.0 or higher
Hardware Requirements: 286 processor, 2 MB RAM, and 2 MB disk space, and DOSminimum; 486-DX or higher performance processor preferred; supports up to 16 MB ofextended RAM.
COMMERCIAL SPECIFICATIONS:
Price and Conditions: Unknown at this time
Demo Availability: Yes
CUSTOMERS AND REVIEWS:
Number of Users: Unknown at present
Targeted Type of Users: Expert users in general although model is generally straightforwardto operate.
Published Reports: Numerous application reports including in the USA --

A-39
Hohmyer, O. and Ottinger, R, “External environmental costs of electric power - analysis andinternalization,” Berlin, 1991.Ottinger, R. et al., “Environmental costs of electricity,” report for the NYSERDA, OceanaPubl., 1990.