Legal Informatics December 13, 2011 Gulfport, Florida Wilhelmina Randtke [email protected] .

Evaluation of Lead Service LineLining and Coating Technologies
Stephen J. Randtke, Craig D. Adams, Edward F. Peltier, Rachael F. Lane, Zachary A. Breault, Ray E. Carter, Jr.,
J. Alan Roberson, and Jonathan D. Cuppett
EPA Research Forum and STAR-Grant Progress Review Meeting
April 10-11, 2013Arlington, Virginia
Project PersonnelWater Research Foundation Jonathan Cuppett (Project Manager) Michelle Suazo (Project Coordinator) Traci Case
Project Advisory Committee (PAC) Clay Commons (Rhode Island) France Lemieux (Health Canada) Mike Schock (EPA) Greg Welter (O’Brien and Gere)
Project Personnel (Cont’d)University of Kansas Steve Randtke, PI Ted Peltier, Co-PI Ray Carter, Research Associate Rachael Lane, Graduate Research Assistant Zach Breault, Graduate Research Assistant
Utah State University Craig Adams, Co-PI
American Water Works Association Alan Roberson, Co-Investigator
OverviewProject ObjectivesRegulatory ConsiderationsResearch Project Tasks & StatusLining & Coating TechnologiesUtility ExperiencesFill-and-Dump Experiments Expt. 1: Epoxy-Coated Pipe Specimens
Organic Leachates and Byproducts
Research ObjectivesComprehensively evaluate lead service line
(LSL) lining & coating technologies as alternatives to full or partial LSL replacement, and for protecting and repairing lead and copper service lines
Provide water utilities, consultants, state regulators, consumers, and others with information to make informed decisions regarding lining and coating of lead and copper service lines
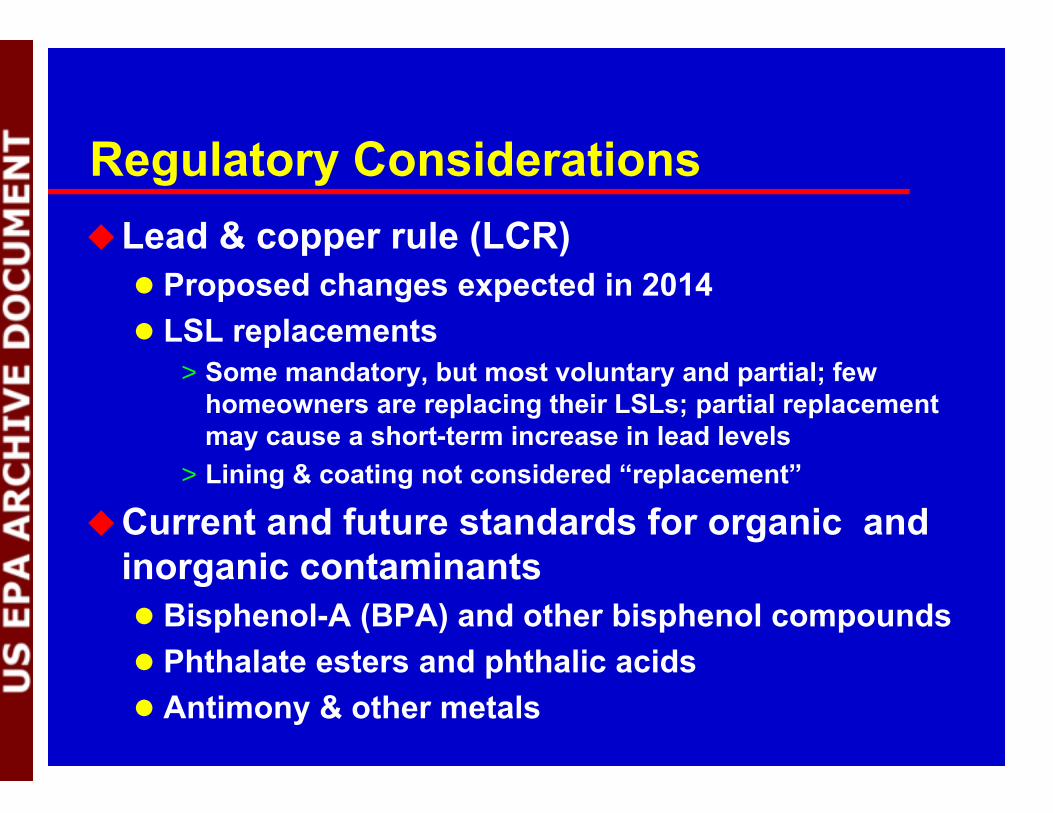
Regulatory ConsiderationsLead & copper rule (LCR) Proposed changes expected in 2014 LSL replacements
> Some mandatory, but most voluntary and partial; few homeowners are replacing their LSLs; partial replacement may cause a short-term increase in lead levels
> Lining & coating not considered “replacement”
Current and future standards for organic and inorganic contaminants Bisphenol-A (BPA) and other bisphenol compounds Phthalate esters and phthalic acids Antimony & other metals
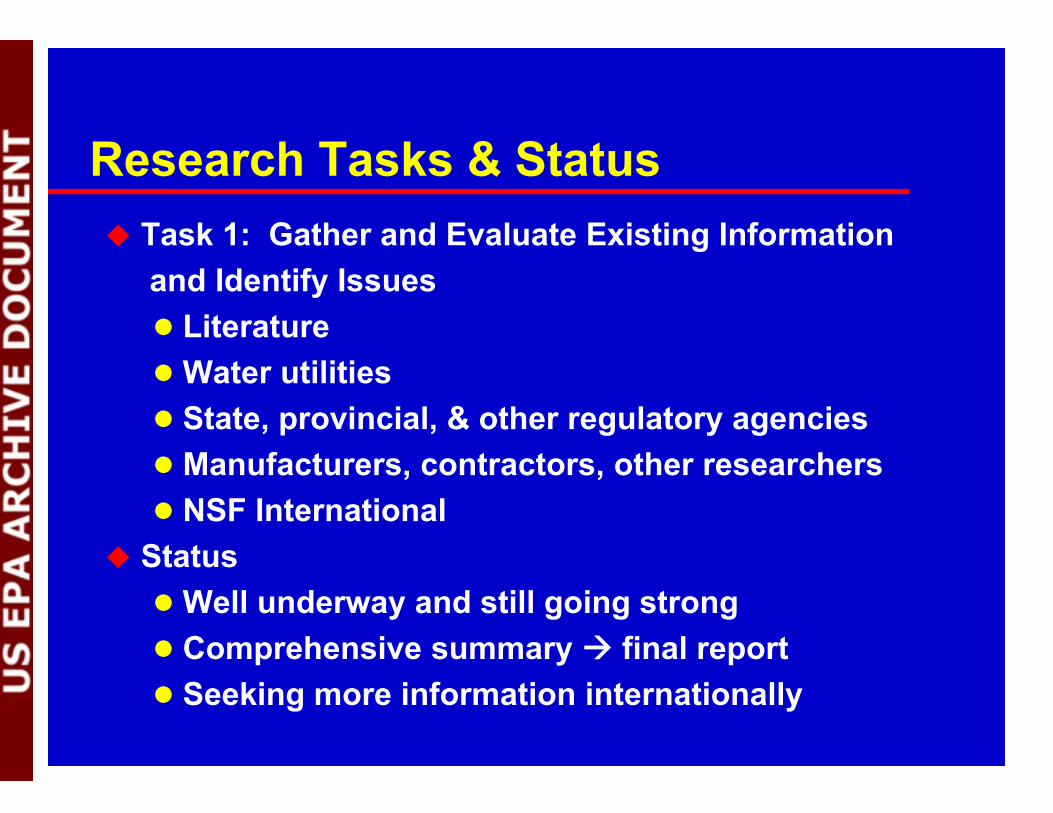
Research Tasks & Status Task 1: Gather and Evaluate Existing Information
and Identify Issues LiteratureWater utilities State, provincial, & other regulatory agencies Manufacturers, contractors, other researchers NSF International
StatusWell underway and still going strong Comprehensive summary final report Seeking more information internationally
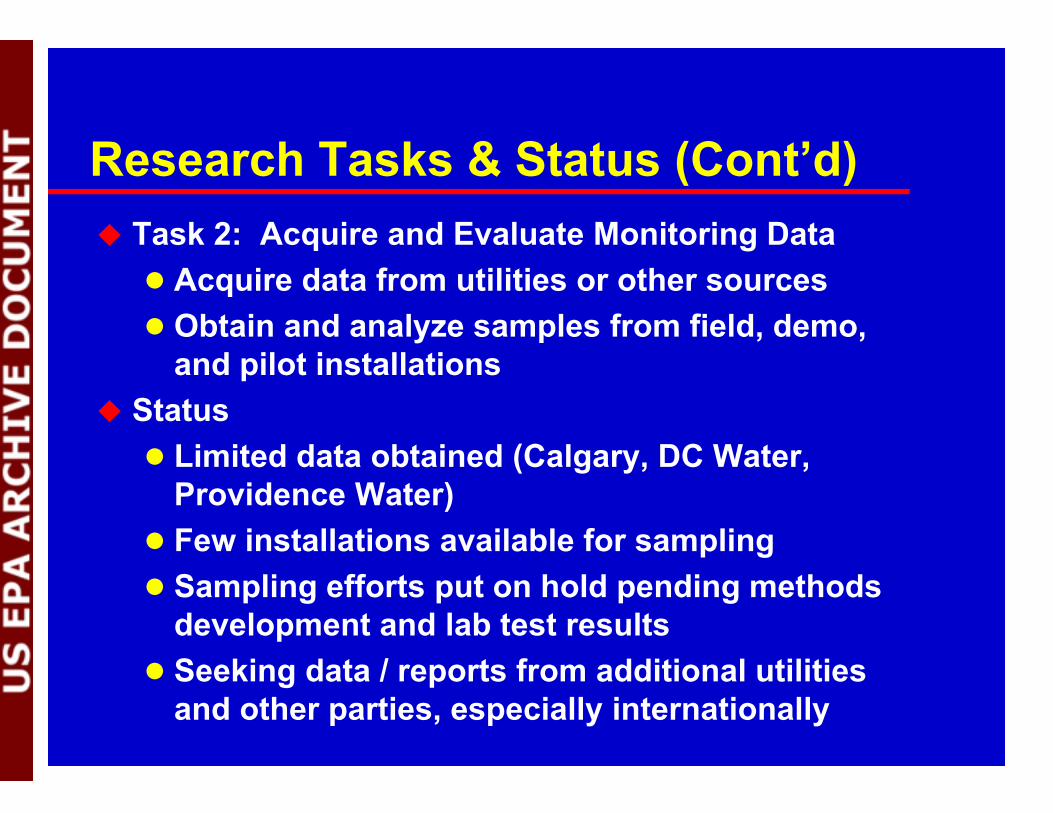
Research Tasks & Status (Cont’d) Task 2: Acquire and Evaluate Monitoring Data Acquire data from utilities or other sources Obtain and analyze samples from field, demo,
and pilot installations Status Limited data obtained (Calgary, DC Water,
Providence Water) Few installations available for sampling Sampling efforts put on hold pending methods
development and lab test results Seeking data / reports from additional utilities
and other parties, especially internationally
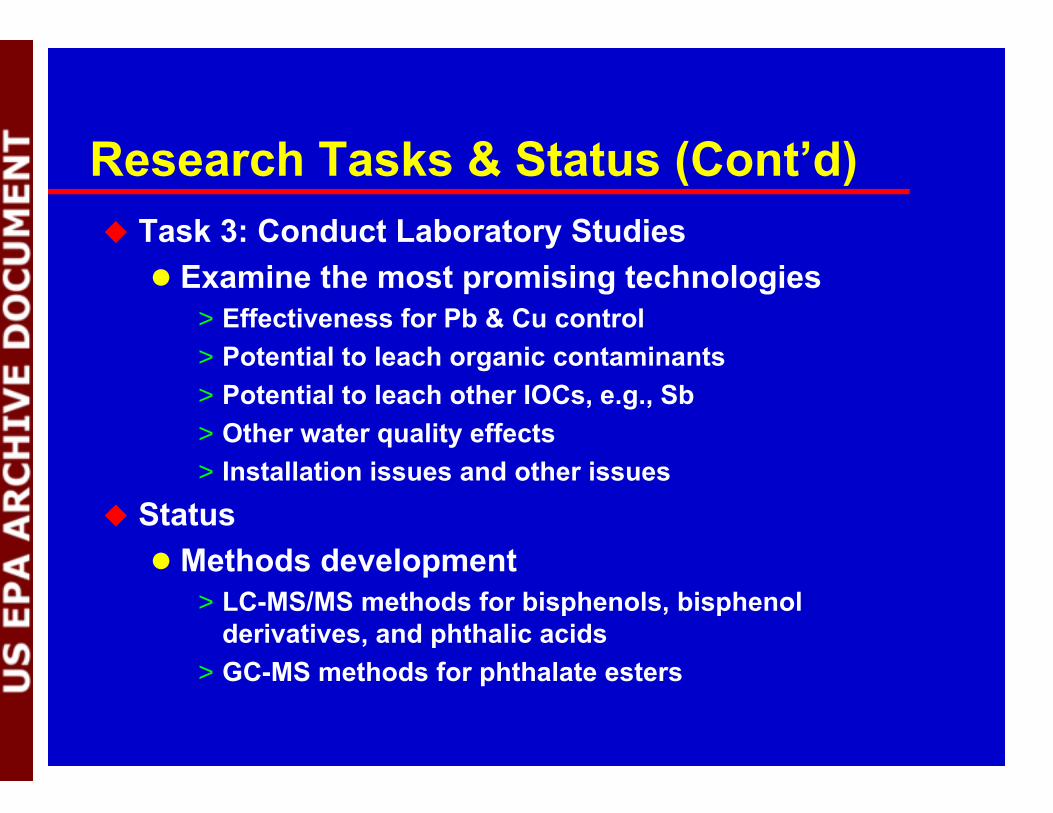
Research Tasks & Status (Cont’d) Task 3: Conduct Laboratory Studies Examine the most promising technologies
> Effectiveness for Pb & Cu control> Potential to leach organic contaminants> Potential to leach other IOCs, e.g., Sb> Other water quality effects> Installation issues and other issues
Status Methods development
> LC-MS/MS methods for bisphenols, bisphenol derivatives, and phthalic acids
> GC-MS methods for phthalate esters
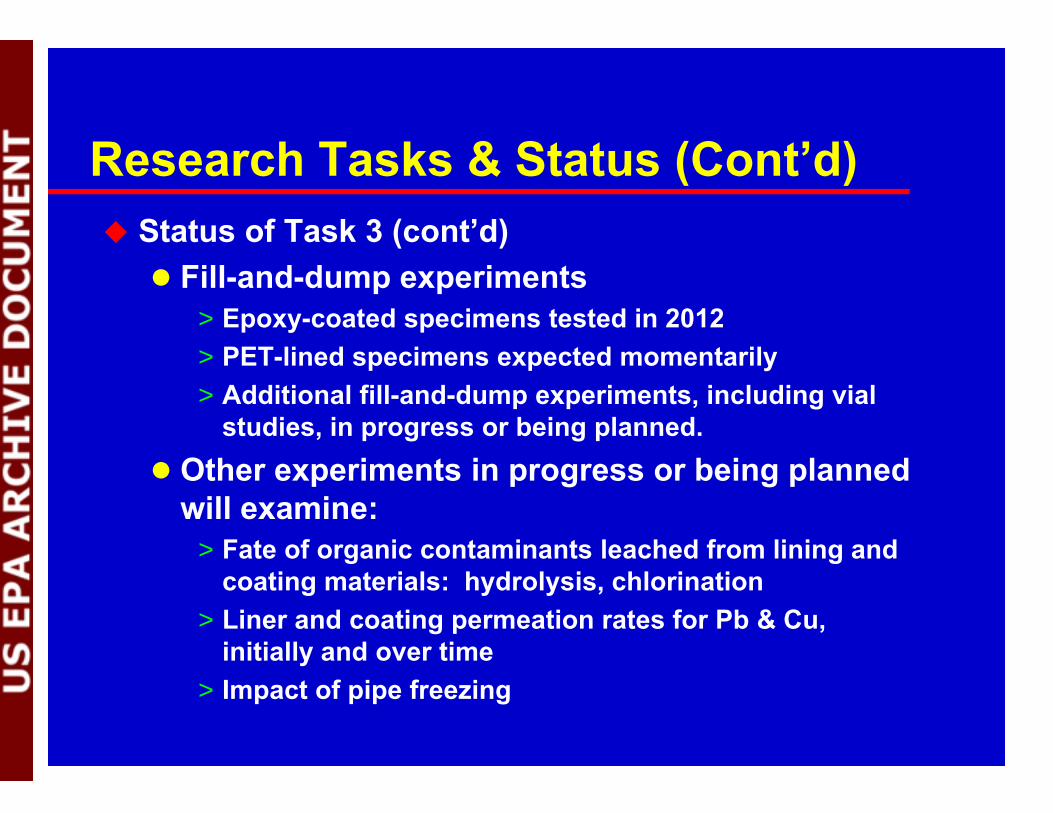
Research Tasks & Status (Cont’d) Status of Task 3 (cont’d) Fill-and-dump experiments
> Epoxy-coated specimens tested in 2012> PET-lined specimens expected momentarily> Additional fill-and-dump experiments, including vial
studies, in progress or being planned. Other experiments in progress or being planned
will examine:> Fate of organic contaminants leached from lining and
coating materials: hydrolysis, chlorination> Liner and coating permeation rates for Pb & Cu,
initially and over time> Impact of pipe freezing
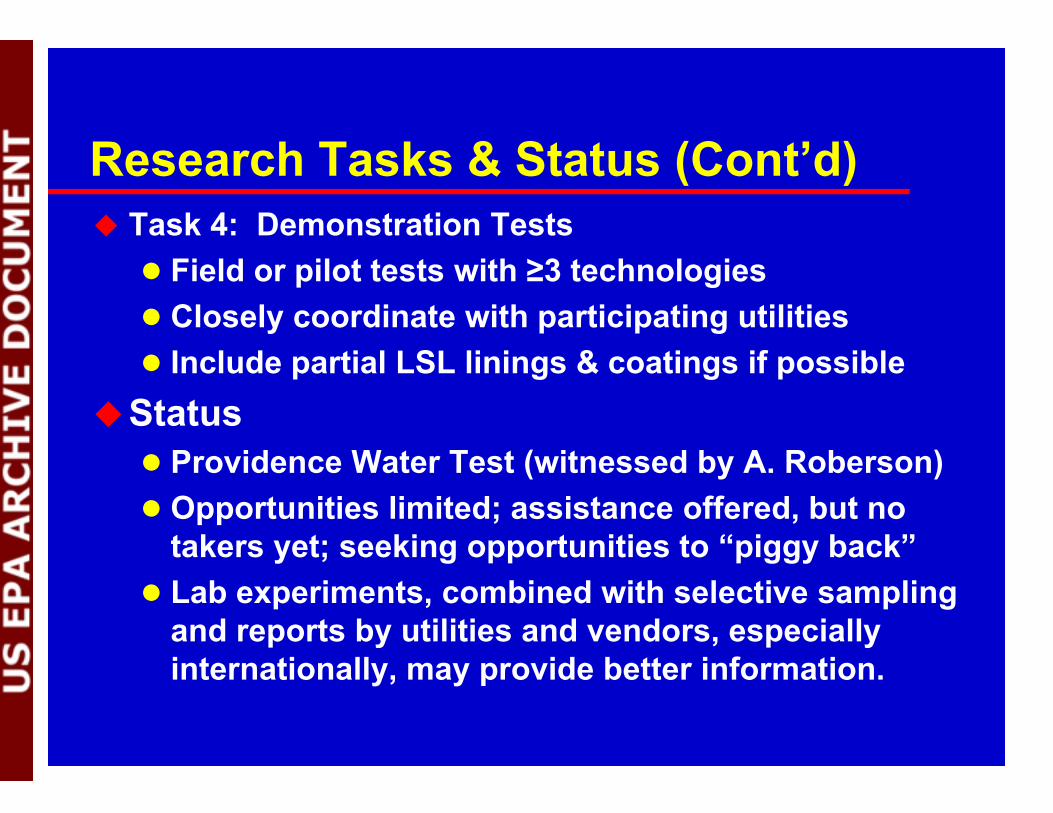
Research Tasks & Status (Cont’d) Task 4: Demonstration Tests Field or pilot tests with ≥3 technologies Closely coordinate with participating utilities Include partial LSL linings & coatings if possible
Status Providence Water Test (witnessed by A. Roberson) Opportunities limited; assistance offered, but no
takers yet; seeking opportunities to “piggy back” Lab experiments, combined with selective sampling
and reports by utilities and vendors, especially internationally, may provide better information.
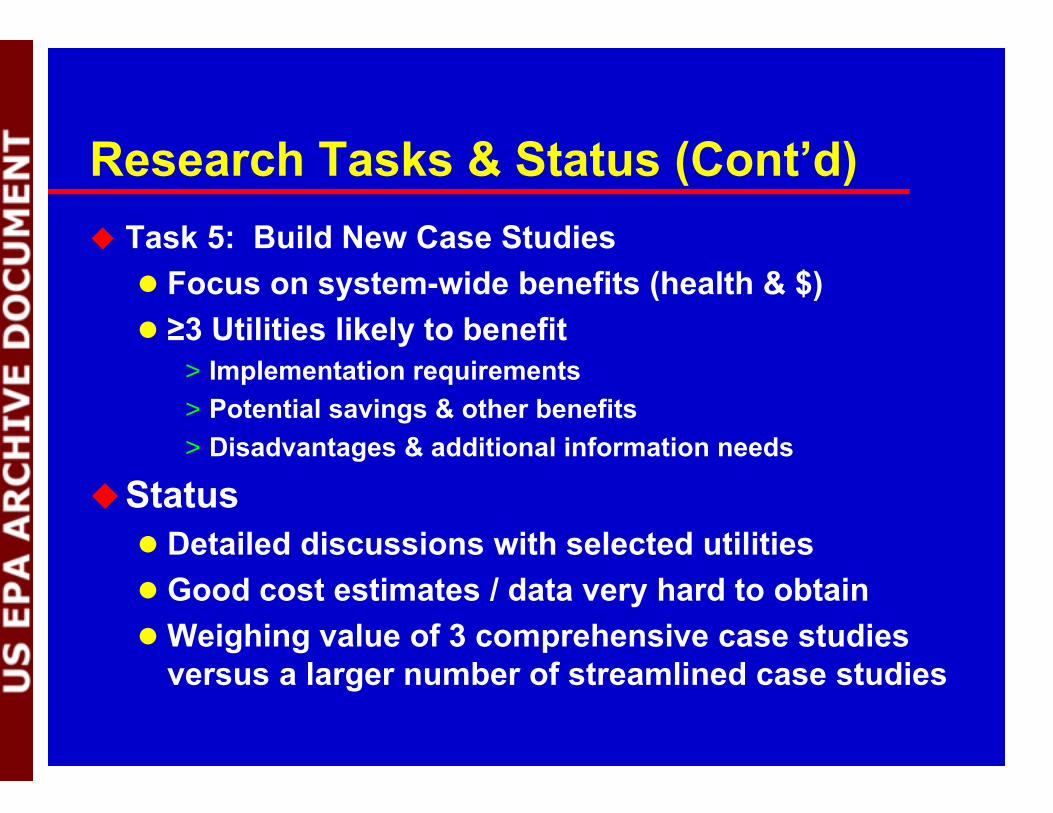
Research Tasks & Status (Cont’d) Task 5: Build New Case Studies Focus on system-wide benefits (health & $) ≥3 Utilities likely to benefit
> Implementation requirements> Potential savings & other benefits> Disadvantages & additional information needs
Status Detailed discussions with selected utilities Good cost estimates / data very hard to obtainWeighing value of 3 comprehensive case studies
versus a larger number of streamlined case studies
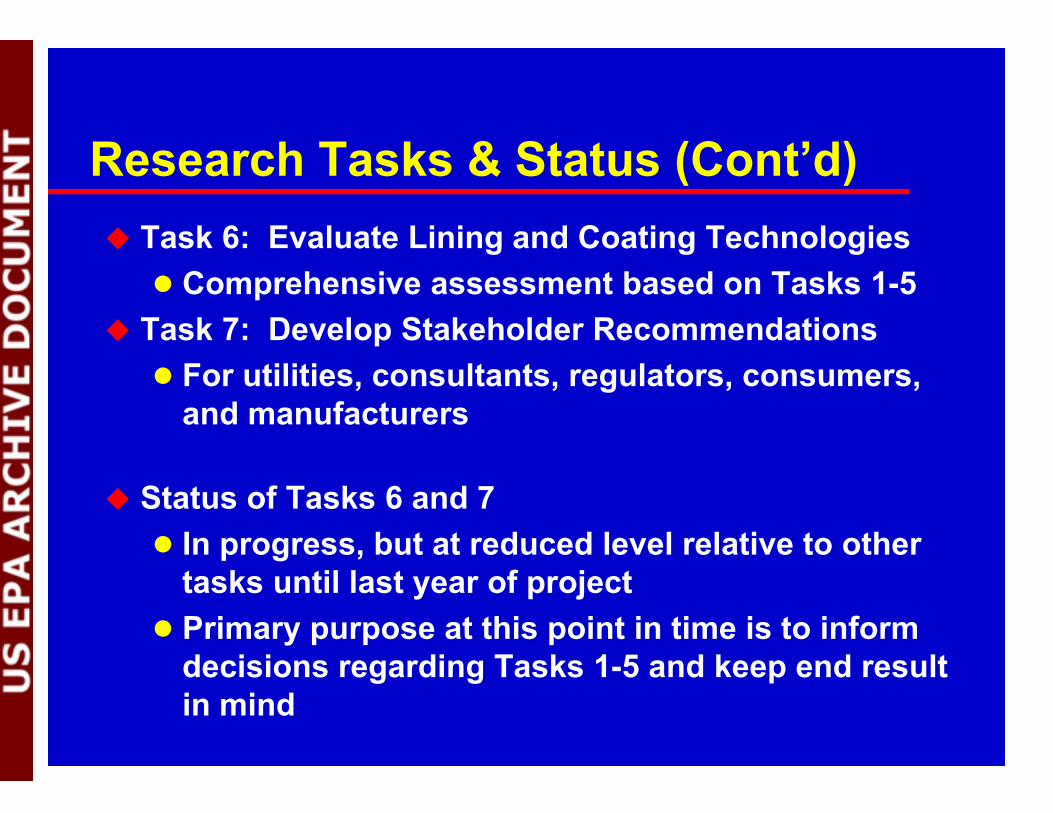
Research Tasks & Status (Cont’d) Task 6: Evaluate Lining and Coating Technologies Comprehensive assessment based on Tasks 1-5
Task 7: Develop Stakeholder Recommendations For utilities, consultants, regulators, consumers,
and manufacturers
Status of Tasks 6 and 7 In progress, but at reduced level relative to other
tasks until last year of project Primary purpose at this point in time is to inform
decisions regarding Tasks 1-5 and keep end result in mind
Lining & Coating Technologies
Types Epoxy Coatings
> e.g., Nu Flow, Ace Duraflo, etc. Close-Fit Liners
> Polyethylene terephthalate (PET) liners (Wavin / Neofit)> HDPE (Subline; Polyline)
Loose-Fit Liners (e.g., HDPE, PEX) Polyurethane and Polyurea Coatings
> e.g., 3M Scotchkote 2400 Other (Kirmeyer et al., 2000)
> e.g., Calcite coating, Paltem (PE/epoxy)
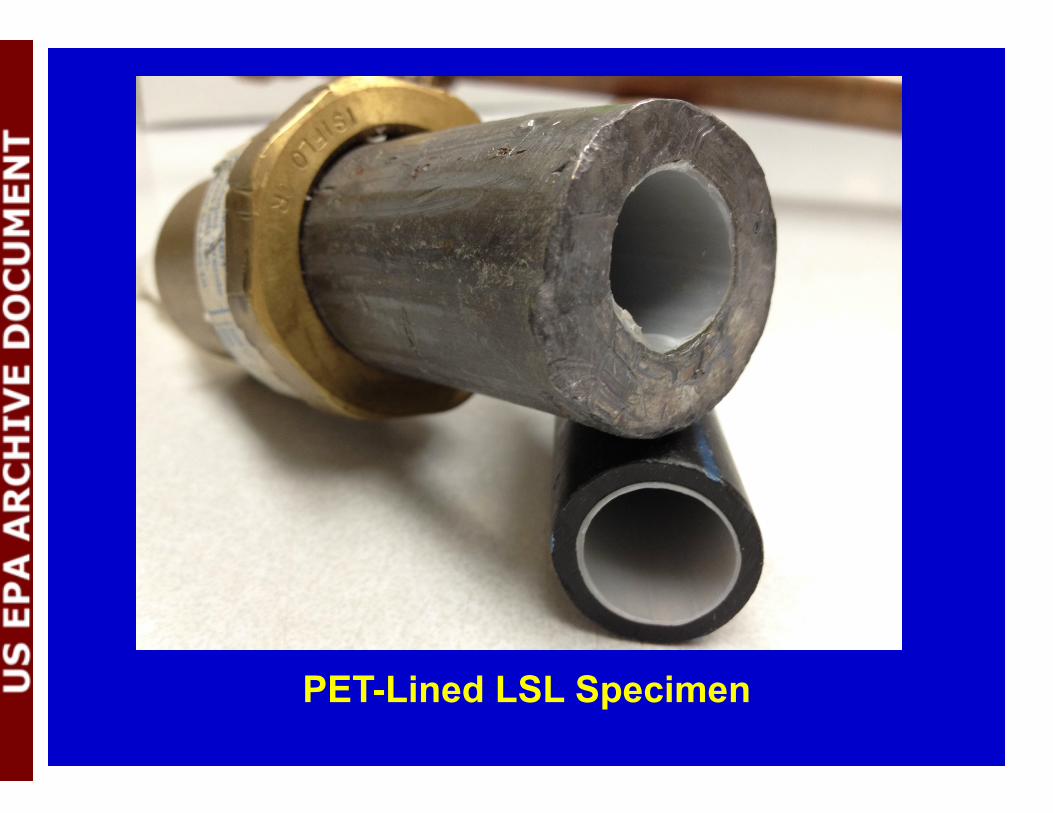
PET-Lined LSL Specimen
Lining & Coating Technologies (Cont’d)General Considerations Access (typically via pits or interior of home) Surface preparation requirements
> e.g., scraping, sandblasting, drying Interior obstructions or sharp bends Cost – and difficulty of obtaining accurate cost
estimates and installation failure rates Service lifeWarranties
> vs service life for a given lining or coating> vs service life for Cu (or HDPE) service lines
Contaminant leaching
Lining & Coating Technologies (Cont’d)General Consideration (cont’d) Degree of flow restriction Tendency to foster biofilm growth
Coating Considerations Curing time Pooling Holidays
Lining Considerations Liner stiffness and bending radius vs bends
encountered Resistance to damage during installation
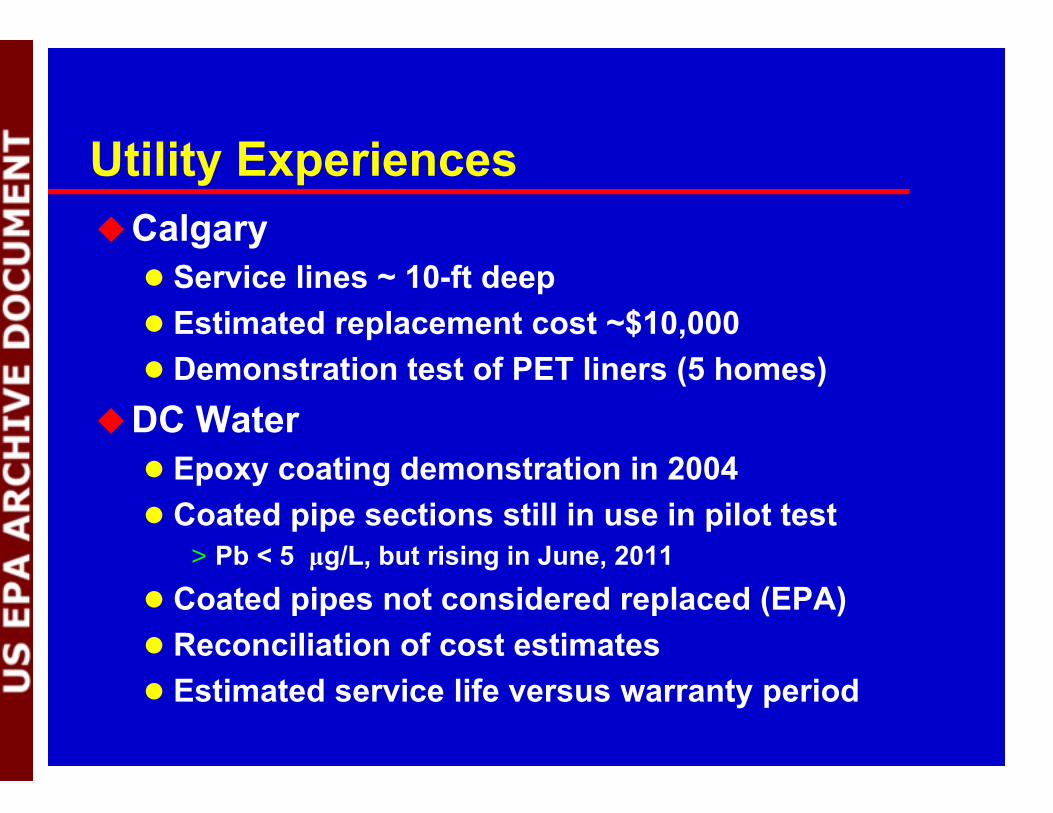
Utility ExperiencesCalgary Service lines ~ 10-ft deep Estimated replacement cost ~$10,000 Demonstration test of PET liners (5 homes)
DC Water Epoxy coating demonstration in 2004 Coated pipe sections still in use in pilot test
> Pb < 5 μg/L, but rising in June, 2011 Coated pipes not considered replaced (EPA) Reconciliation of cost estimates Estimated service life versus warranty period
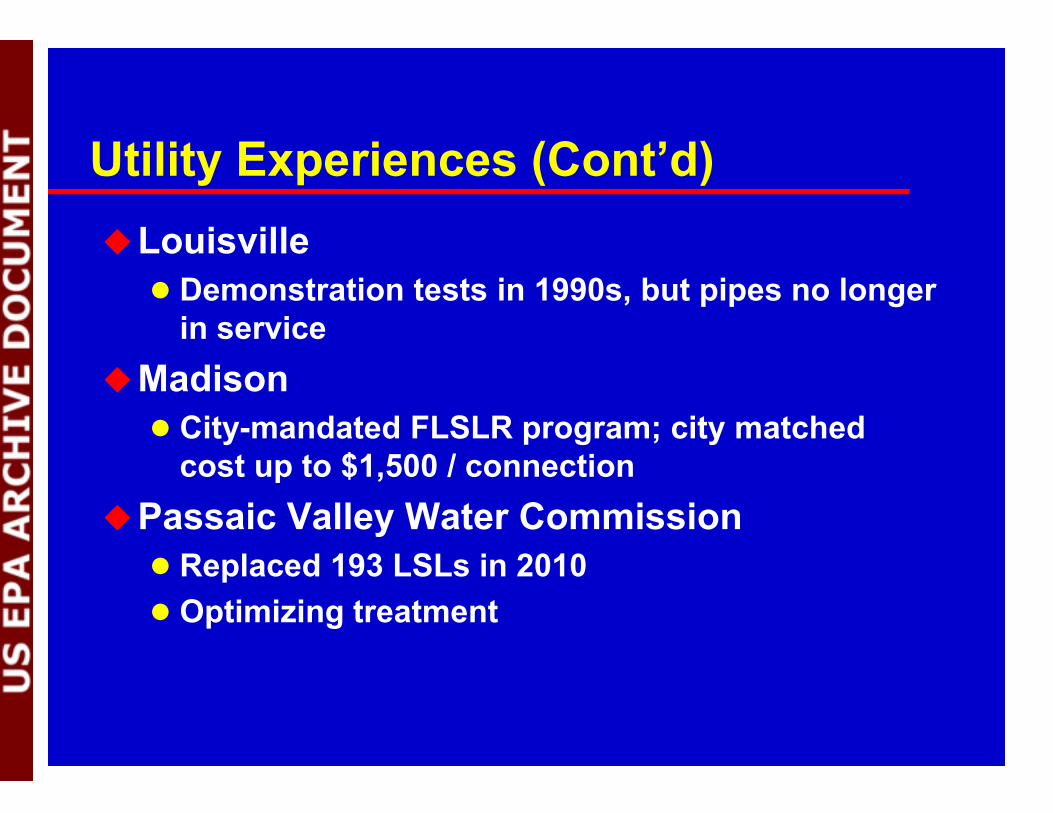
Utility Experiences (Cont’d)Louisville Demonstration tests in 1990s, but pipes no longer
in serviceMadison City-mandated FLSLR program; city matched
cost up to $1,500 / connectionPassaic Valley Water Commission Replaced 193 LSLs in 2010 Optimizing treatment
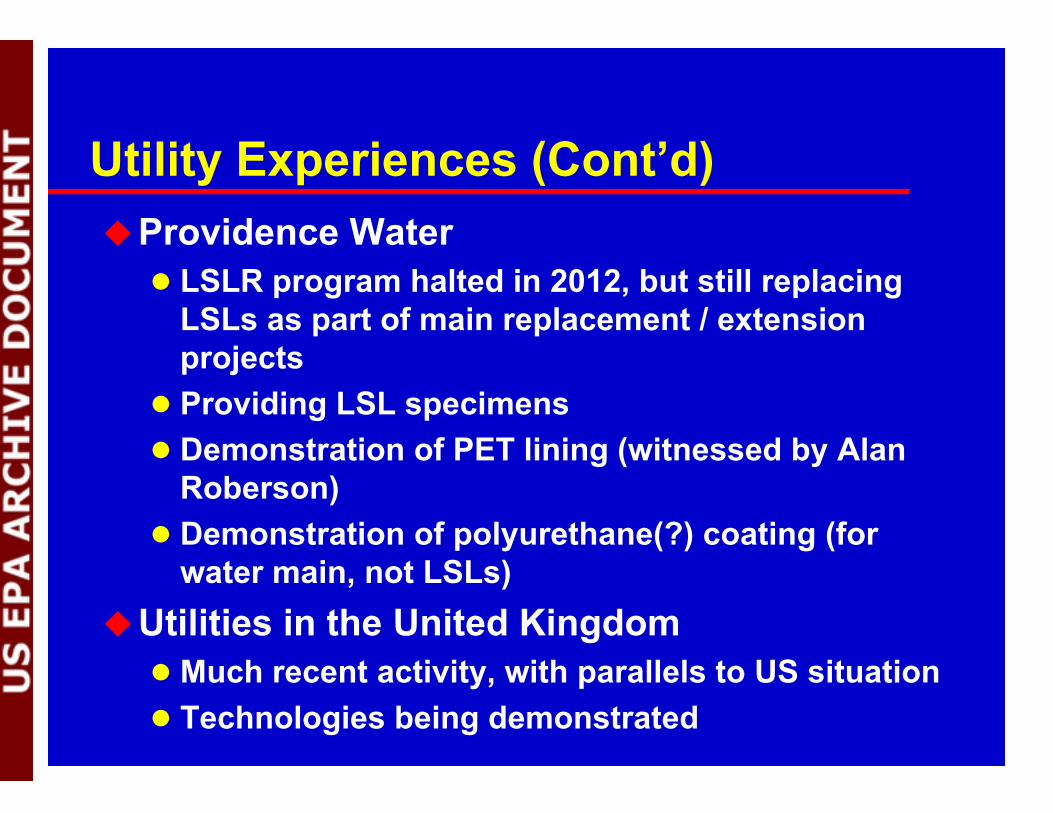
Utility Experiences (Cont’d)Providence Water LSLR program halted in 2012, but still replacing
LSLs as part of main replacement / extension projects
Providing LSL specimens Demonstration of PET lining (witnessed by Alan
Roberson) Demonstration of polyurethane(?) coating (for
water main, not LSLs)Utilities in the United Kingdom Much recent activity, with parallels to US situation Technologies being demonstrated
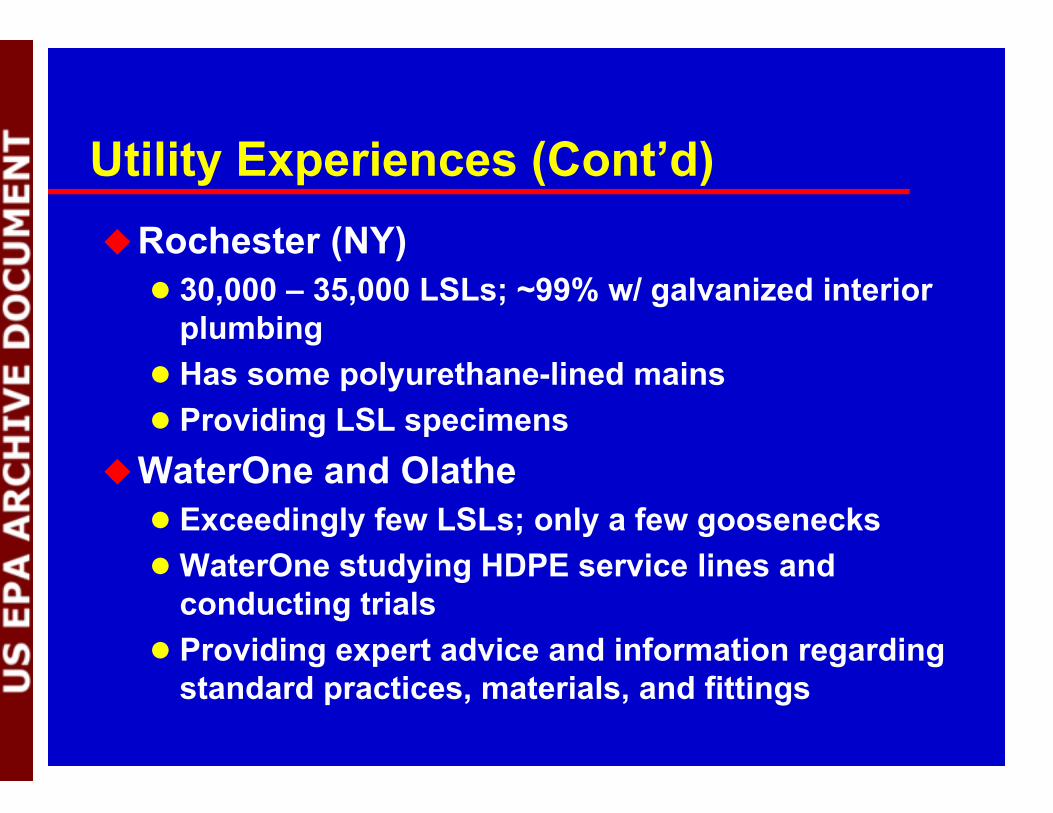
Utility Experiences (Cont’d)Rochester (NY) 30,000 – 35,000 LSLs; ~99% w/ galvanized interior
plumbing Has some polyurethane-lined mains Providing LSL specimens
WaterOne and Olathe Exceedingly few LSLs; only a few goosenecksWaterOne studying HDPE service lines and
conducting trials Providing expert advice and information regarding
standard practices, materials, and fittings
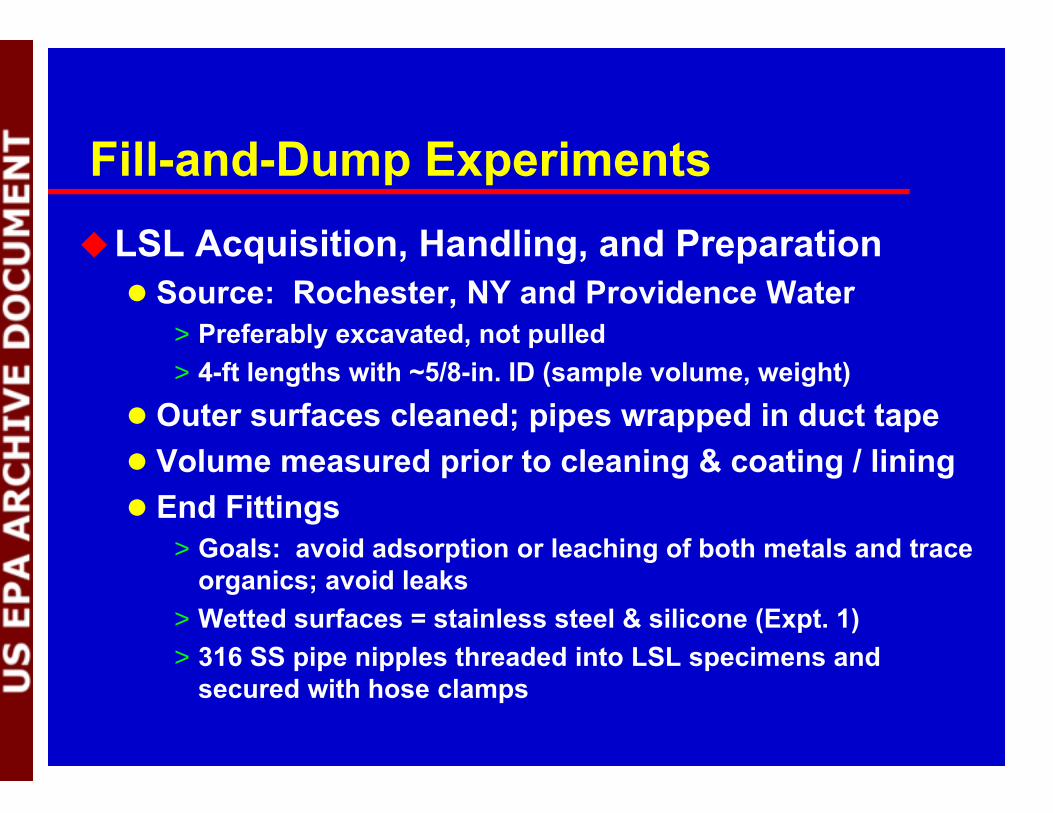
Fill-and-Dump ExperimentsLSL Acquisition, Handling, and Preparation Source: Rochester, NY and Providence Water
> Preferably excavated, not pulled> 4-ft lengths with ~5/8-in. ID (sample volume, weight)
Outer surfaces cleaned; pipes wrapped in duct tape Volume measured prior to cleaning & coating / lining End Fittings
> Goals: avoid adsorption or leaching of both metals and trace organics; avoid leaks
> Wetted surfaces = stainless steel & silicone (Expt. 1)> 316 SS pipe nipples threaded into LSL specimens and
secured with hose clamps
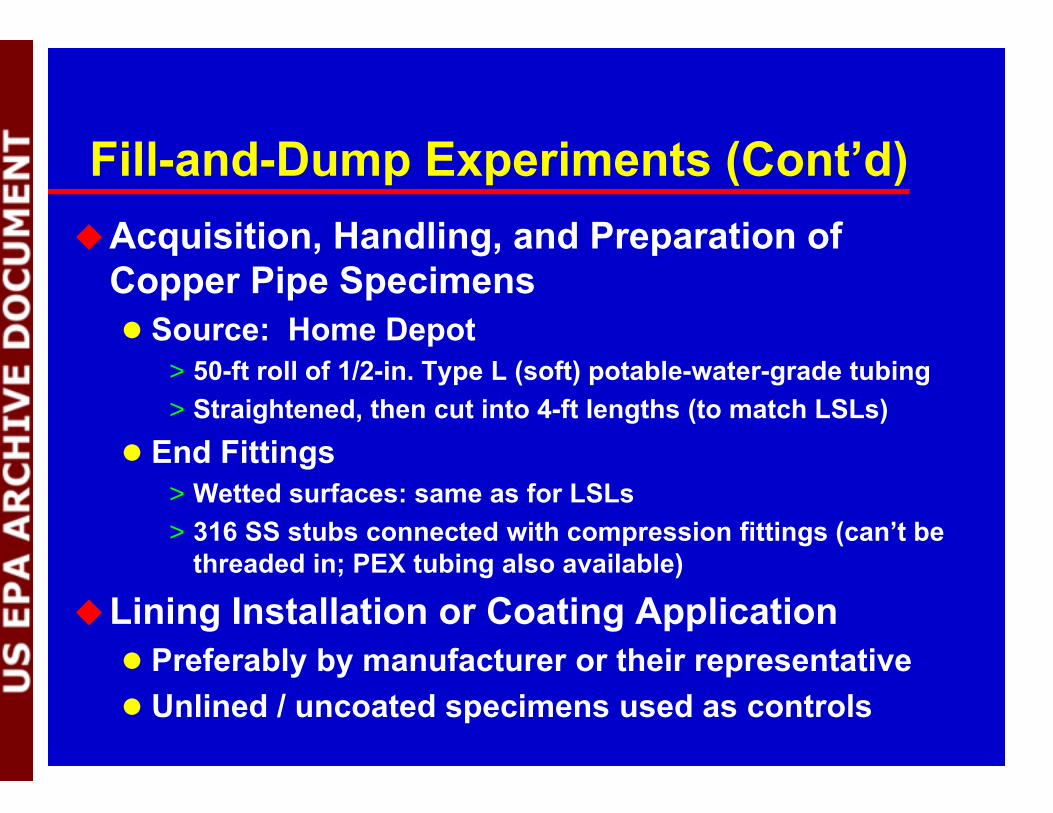
Fill-and-Dump Experiments (Cont’d)Acquisition, Handling, and Preparation of
Copper Pipe Specimens Source: Home Depot
> 50-ft roll of 1/2-in. Type L (soft) potable-water-grade tubing> Straightened, then cut into 4-ft lengths (to match LSLs)
End Fittings> Wetted surfaces: same as for LSLs> 316 SS stubs connected with compression fittings (can’t be
threaded in; PEX tubing also available)
Lining Installation or Coating Application Preferably by manufacturer or their representative Unlined / uncoated specimens used as controls
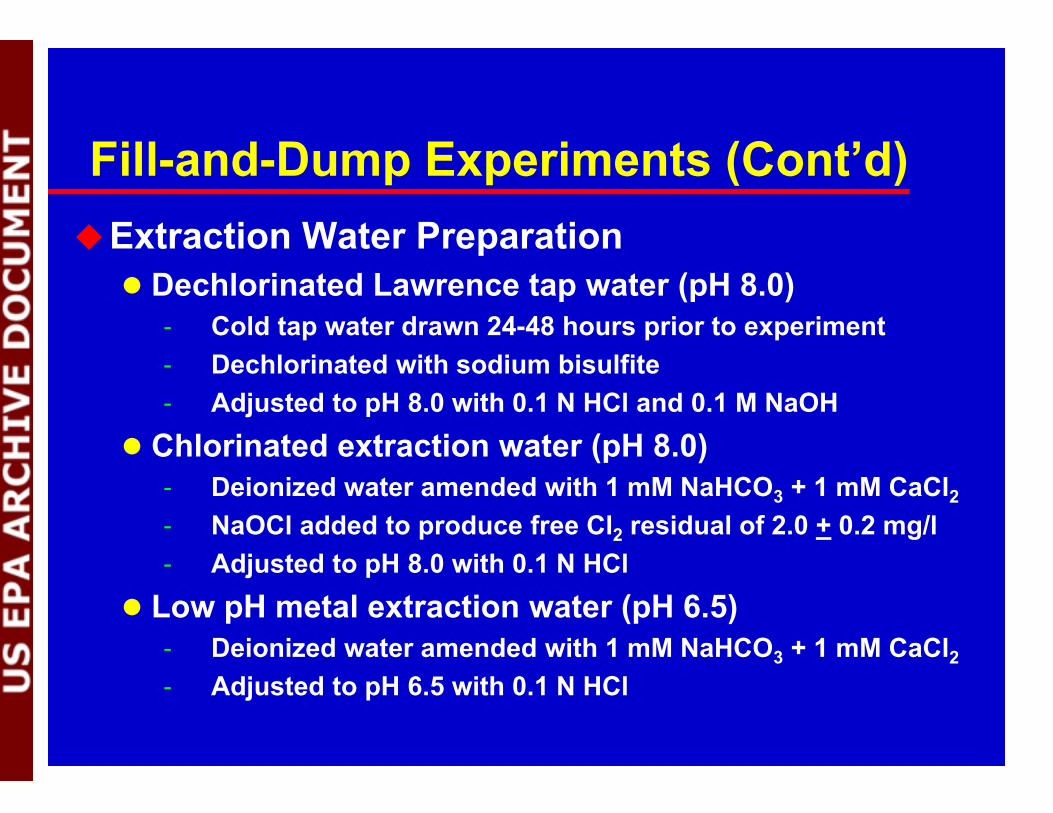
Fill-and-Dump Experiments (Cont’d)Extraction Water Preparation Dechlorinated Lawrence tap water (pH 8.0)
- Cold tap water drawn 24-48 hours prior to experiment- Dechlorinated with sodium bisulfite- Adjusted to pH 8.0 with 0.1 N HCl and 0.1 M NaOH
Chlorinated extraction water (pH 8.0)- Deionized water amended with 1 mM NaHCO3 + 1 mM CaCl2
- NaOCl added to produce free Cl2 residual of 2.0 + 0.2 mg/l- Adjusted to pH 8.0 with 0.1 N HCl
Low pH metal extraction water (pH 6.5)- Deionized water amended with 1 mM NaHCO3 + 1 mM CaCl2- Adjusted to pH 6.5 with 0.1 N HCl
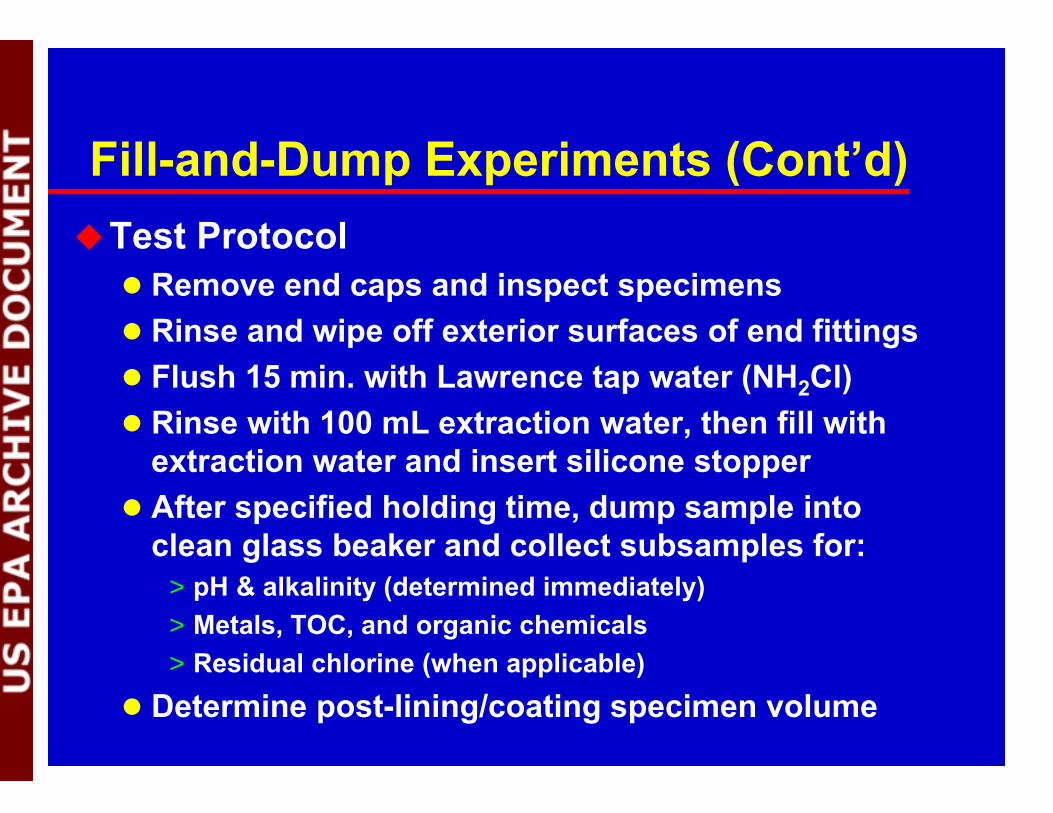
Fill-and-Dump Experiments (Cont’d)Test Protocol Remove end caps and inspect specimens Rinse and wipe off exterior surfaces of end fittings Flush 15 min. with Lawrence tap water (NH2Cl) Rinse with 100 mL extraction water, then fill with
extraction water and insert silicone stopper After specified holding time, dump sample into
clean glass beaker and collect subsamples for:> pH & alkalinity (determined immediately)> Metals, TOC, and organic chemicals> Residual chlorine (when applicable)
Determine post-lining/coating specimen volume
Fill-and-Dump Experiment No. 1: Epoxy-Coated Pb & Cu Pipes
Overview LSLs (Rochester) and CSLs – 8 each (+ controls) Coated by Nu Flow Technologies
> Witnessed by Zach Breault> Returned by overnight carrier
Specimens flushed and filled with extraction water on 9/14/12
Selected results presented below Follow-up experiments pending
Fill-and-Dump Experiment No. 1: Epoxy-Coated Pb & Cu Pipes
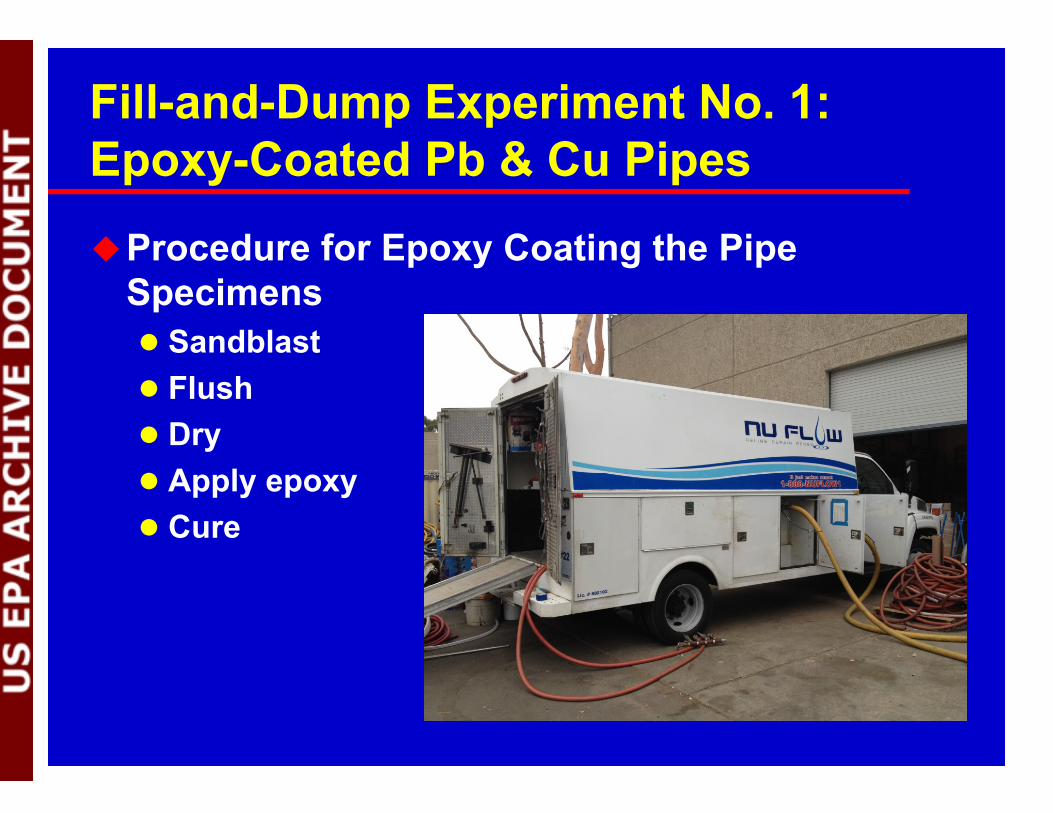
Procedure for Epoxy Coating the Pipe Specimens Sandblast Flush Dry Apply epoxy Cure
Fill-and-Dump Experiment No. 1: Epoxy-Coated Pb & Cu PipesLead Results Uncoated controls: Pb >1,000 g/L Extraction waters prior to extraction: Pb <MDL Chlorinated and low-pH waters: <MDL in 8 of 10
samples; maximum = 1.2 g/L Pb > 5 g/L in one tap-water sample, but <MDL
when later re-extracted with low pH waterCopper Results Dechlorinated tap: Cu = 5.7 g/L Uncoated copper-pipe controls: 390 – 830 g/L Extraction waters: 8 of 30 ≥ 10 g/L, 0 > 20 g/L
Objectives of Organics Studies Determine “likely” leachates, develop methods, and
determine primary leachates Evaluate leachate stability and reactivity as a function of
pH, hydrolysis, free chlorine, monochloramine, and partitioning properties.
For reactive compounds: 1) model reaction kinetics, 2) determine hydrolysis and/or oxidation byproducts, 3) determine sorption characteristics
Examine relevance of leaching, reaction rates, and toxicity of degradates (e.g., estimate concentrations for consumers under varied scenarios)
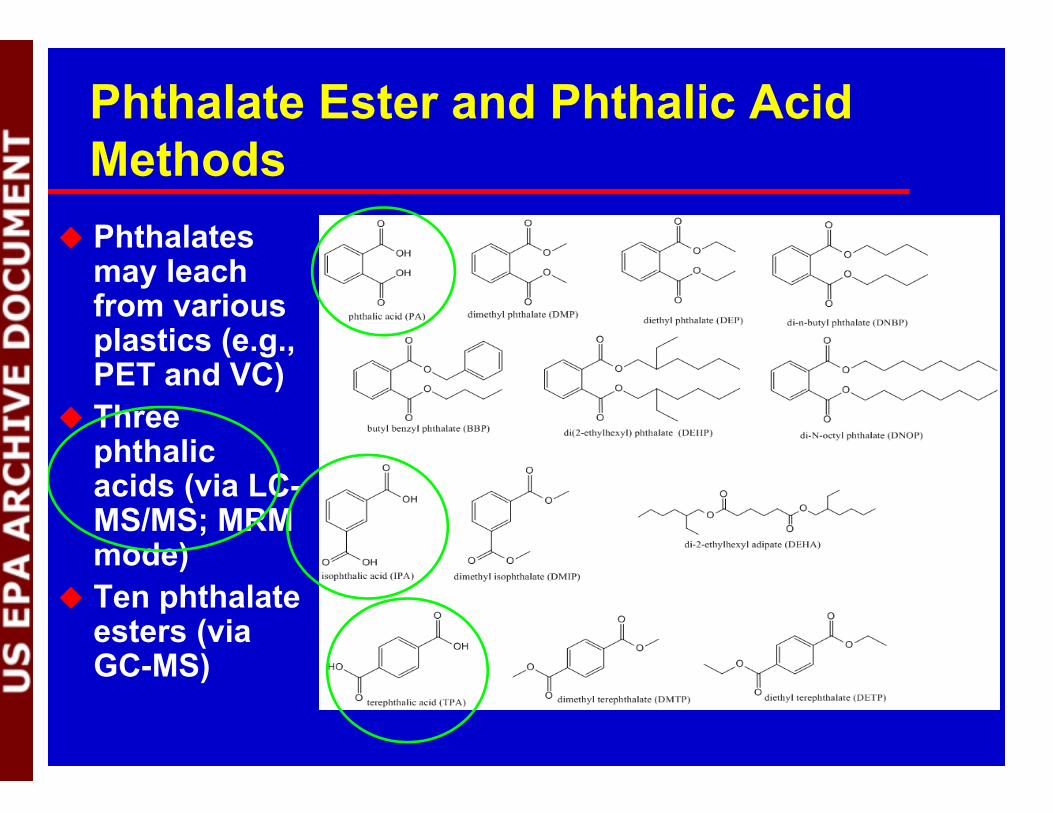
Phthalate Ester and Phthalic Acid Methods
Phthalates may leach from various plastics (e.g., PET and VC)
Three phthalic acids (via LC-MS/MS; MRM mode)
Ten phthalate esters (via GC-MS)
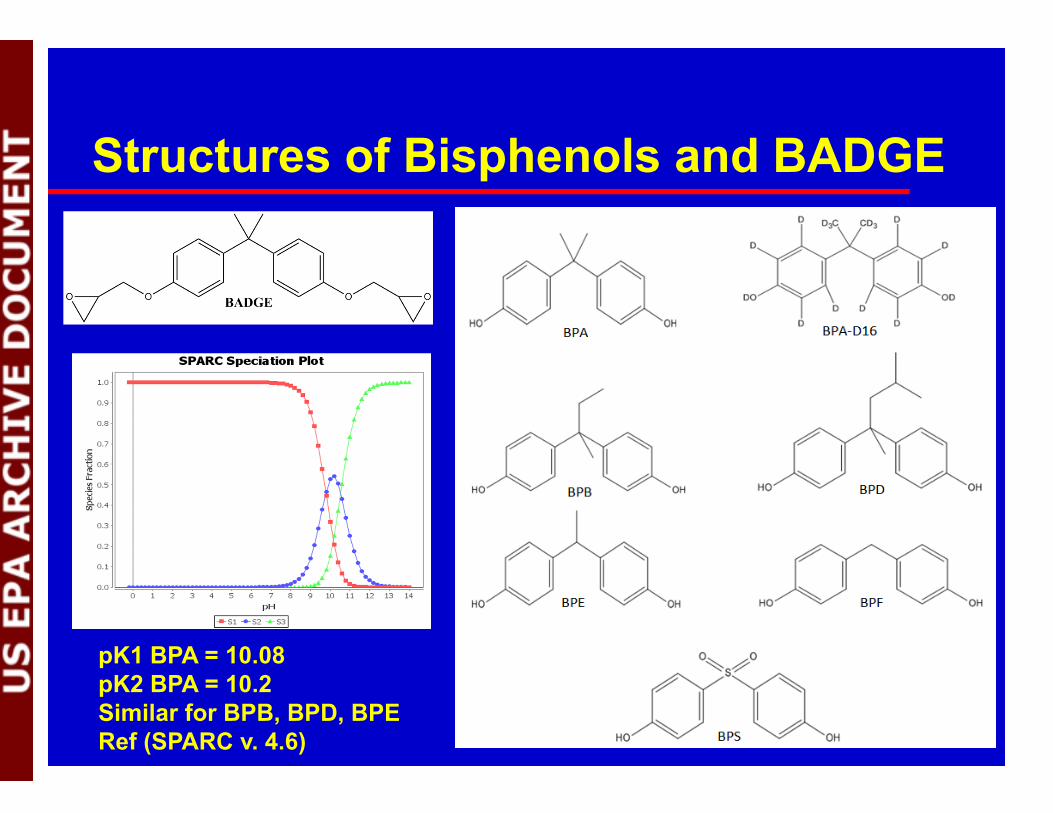
Structures of Bisphenols and BADGE
pK1 BPA = 10.08 pK2 BPA = 10.2 Similar for BPB, BPD, BPE Ref (SPARC v. 4.6)
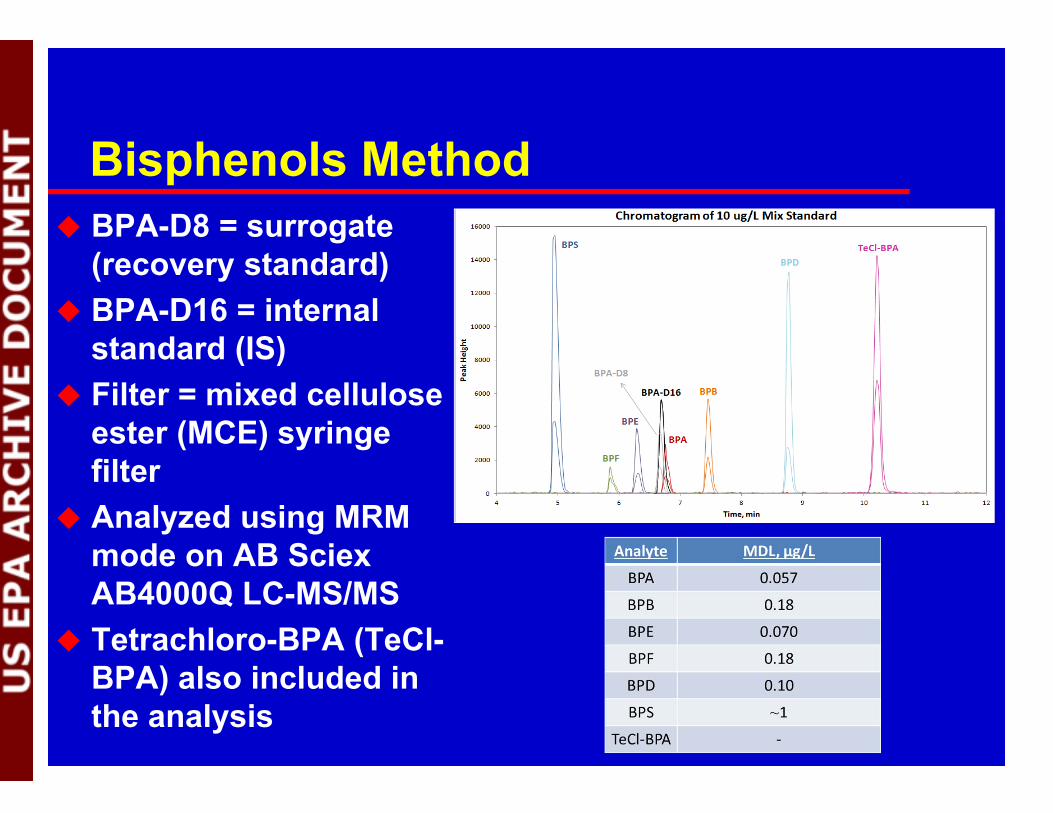
Bisphenols Method BPA-D8 = surrogate
(recovery standard) BPA-D16 = internal
standard (IS) Filter = mixed cellulose
ester (MCE) syringe filter
Analyzed using MRM mode on AB Sciex AB4000Q LC-MS/MS
Tetrachloro-BPA (TeCl-BPA) also included in the analysis
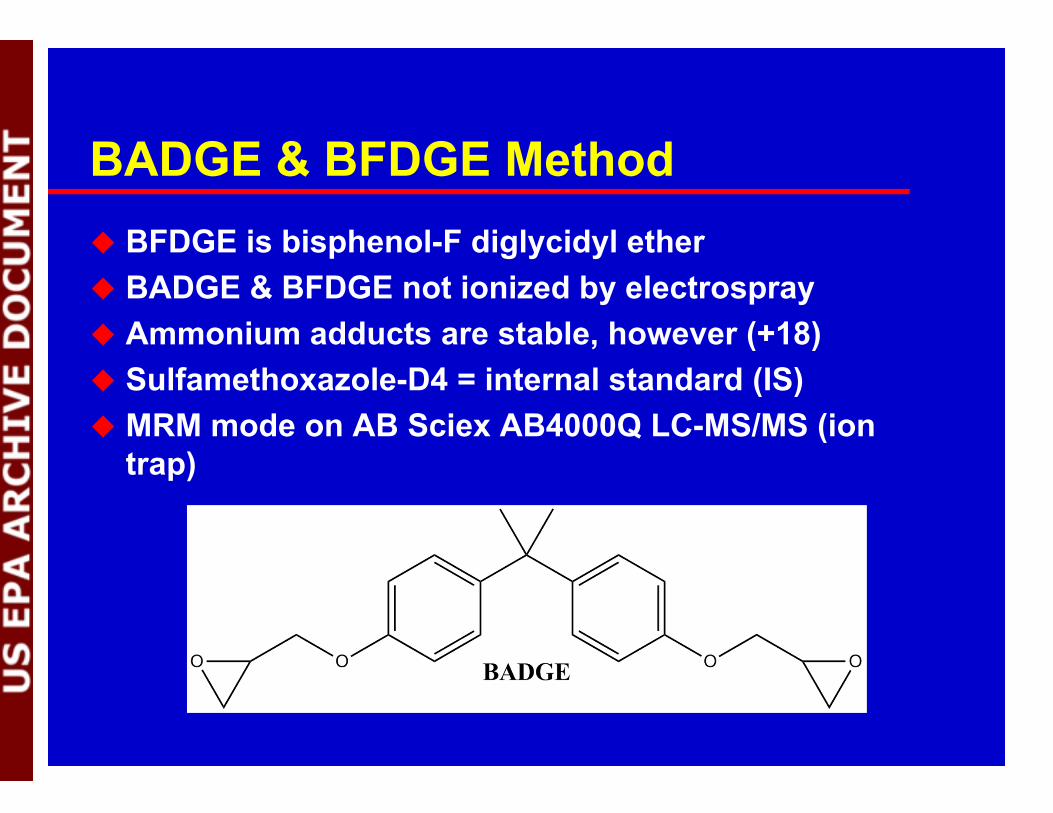
BADGE & BFDGE Method BFDGE is bisphenol-F diglycidyl ether BADGE & BFDGE not ionized by electrospray Ammonium adducts are stable, however (+18) Sulfamethoxazole-D4 = internal standard (IS) MRM mode on AB Sciex AB4000Q LC-MS/MS (ion
trap)
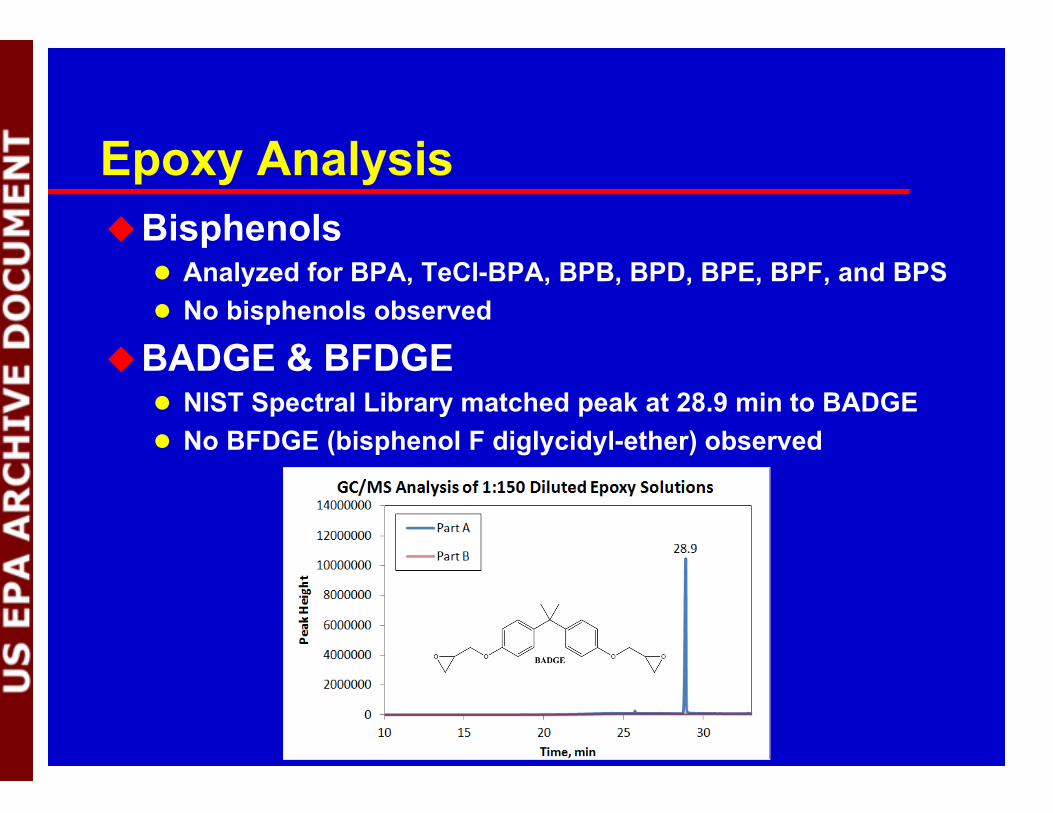
Epoxy AnalysisBisphenols
Analyzed for BPA, TeCl-BPA, BPB, BPD, BPE, BPF, and BPS No bisphenols observed
BADGE & BFDGE NIST Spectral Library matched peak at 28.9 min to BADGE No BFDGE (bisphenol F diglycidyl-ether) observed
Fill-and-Dump Experiment No. 1: Epoxy-Coated Pb & Cu PipesOrganic compounds BPA detected (< 2 µg/L) in 5 of 36 samples Other bisphenols non-detectable, except for
traces of bisphenol-S (<5 µg/L) in 4 samples; BADGE (bisphenol-A diglycidyl ether) detected
(but well below 0.5 mg/L) in 9 of 36 samples with extraction times up to 24 hours
BADGE not detected in samples with longer extraction times (4-10 days)
“BPA-Like” compounds detected in many samples (all <0.1 mg/L, assuming a response equivalent to that for BPA)
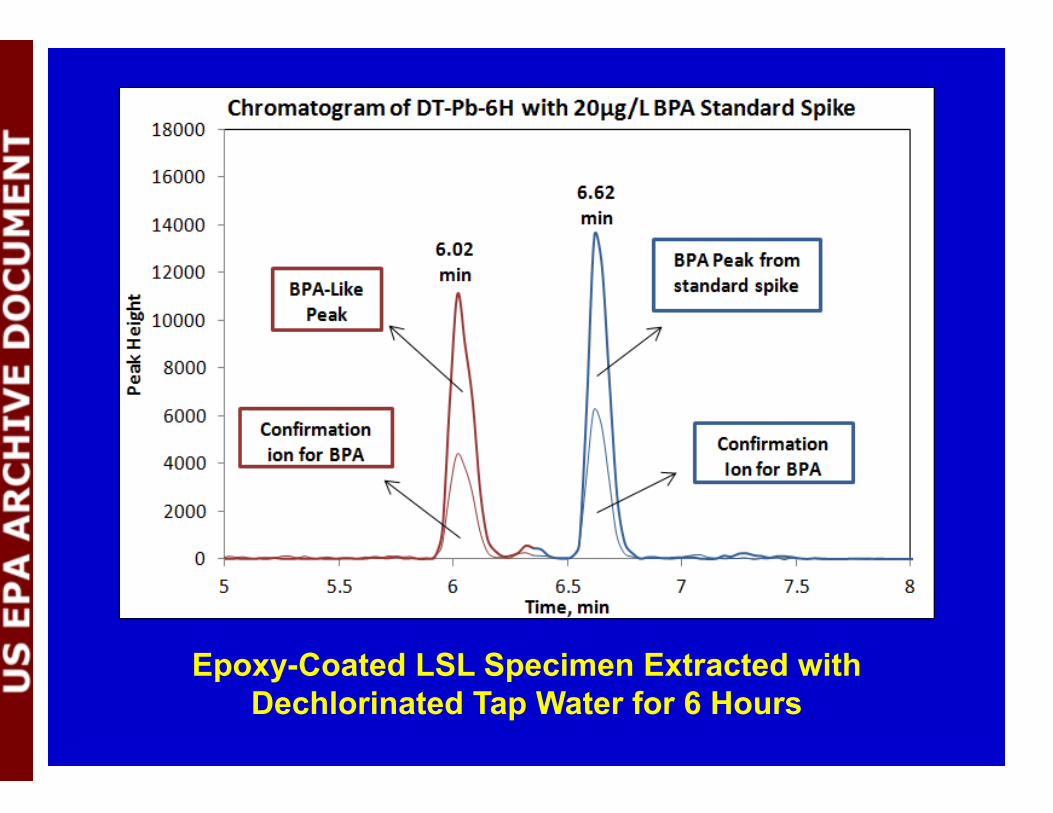
Epoxy-Coated LSL Specimen Extracted with Dechlorinated Tap Water for 6 Hours
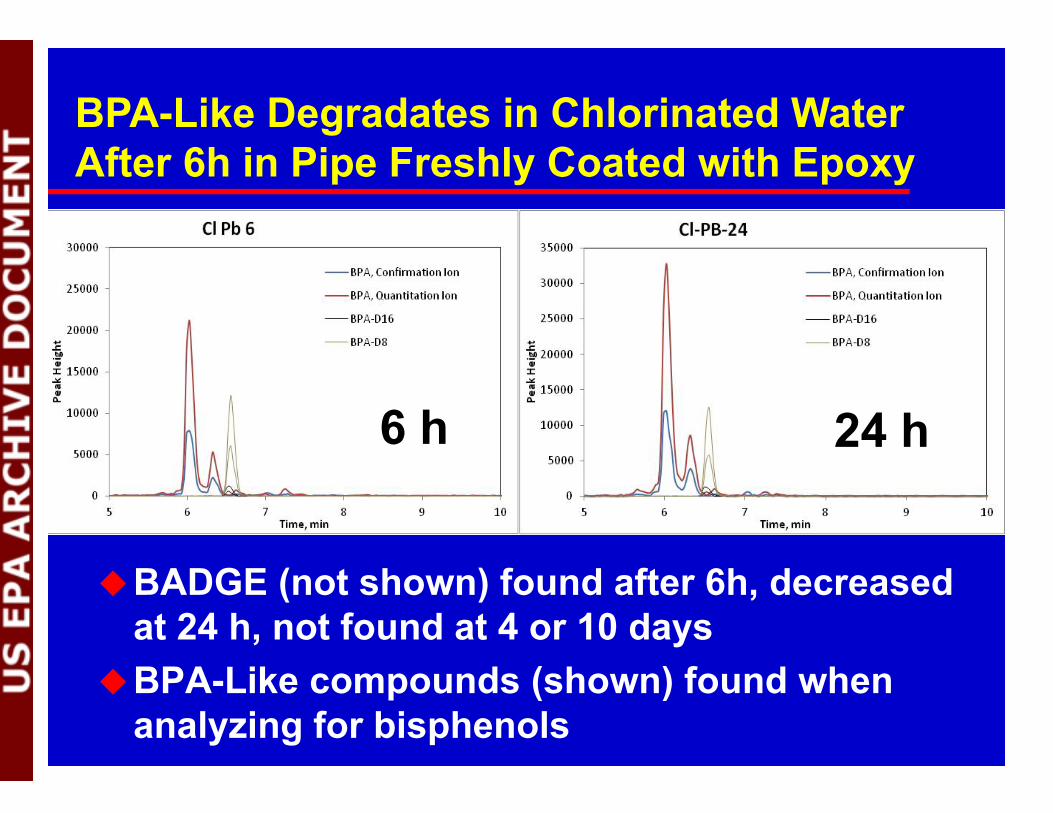
BADGE (not shown) found after 6h, decreased at 24 h, not found at 4 or 10 days
BPA-Like compounds (shown) found when analyzing for bisphenols
BPA-Like Degradates in Chlorinated WaterAfter 6h in Pipe Freshly Coated with Epoxy
6 h 24 h
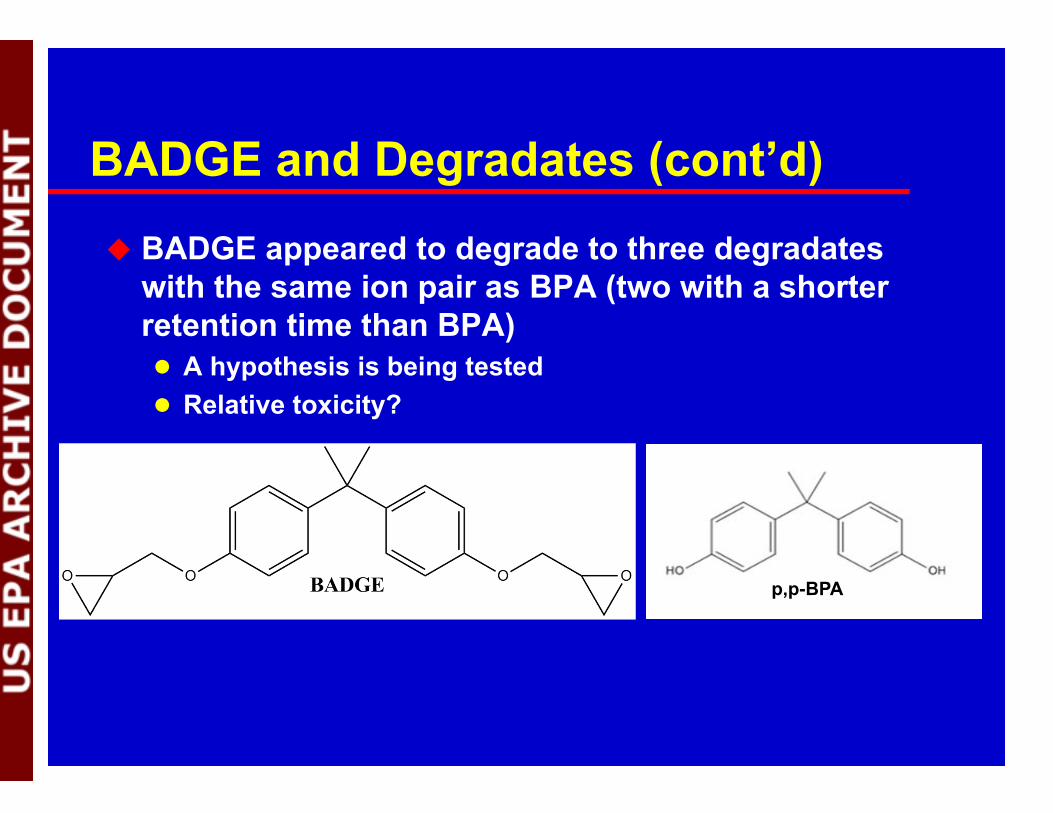
BADGE and Degradates (cont’d)
BADGE appeared to degrade to three degradates with the same ion pair as BPA (two with a shorter retention time than BPA) A hypothesis is being tested Relative toxicity?
p,p-BPA
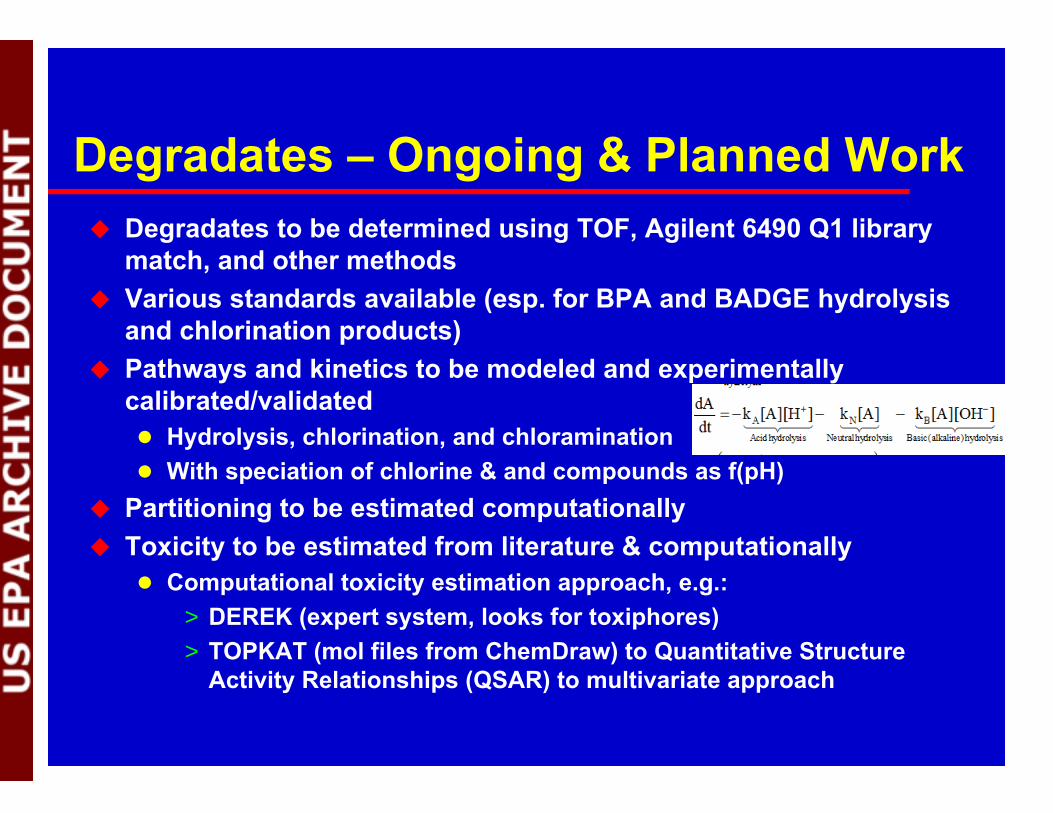
Degradates – Ongoing & Planned Work Degradates to be determined using TOF, Agilent 6490 Q1 library
match, and other methods Various standards available (esp. for BPA and BADGE hydrolysis
and chlorination products) Pathways and kinetics to be modeled and experimentally
calibrated/validated Hydrolysis, chlorination, and chloramination With speciation of chlorine & and compounds as f(pH)
Partitioning to be estimated computationally Toxicity to be estimated from literature & computationally
Computational toxicity estimation approach, e.g.:> DEREK (expert system, looks for toxiphores)> TOPKAT (mol files from ChemDraw) to Quantitative Structure
Activity Relationships (QSAR) to multivariate approach
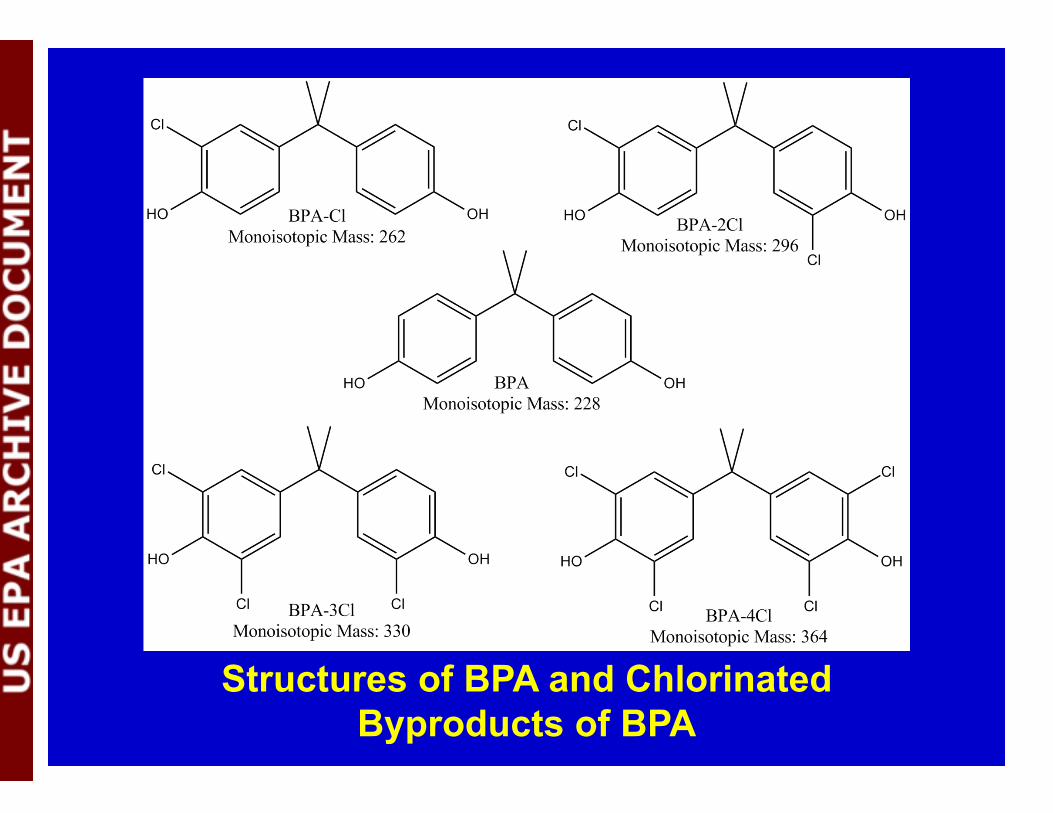
Structures of BPA and ChlorinatedByproducts of BPA
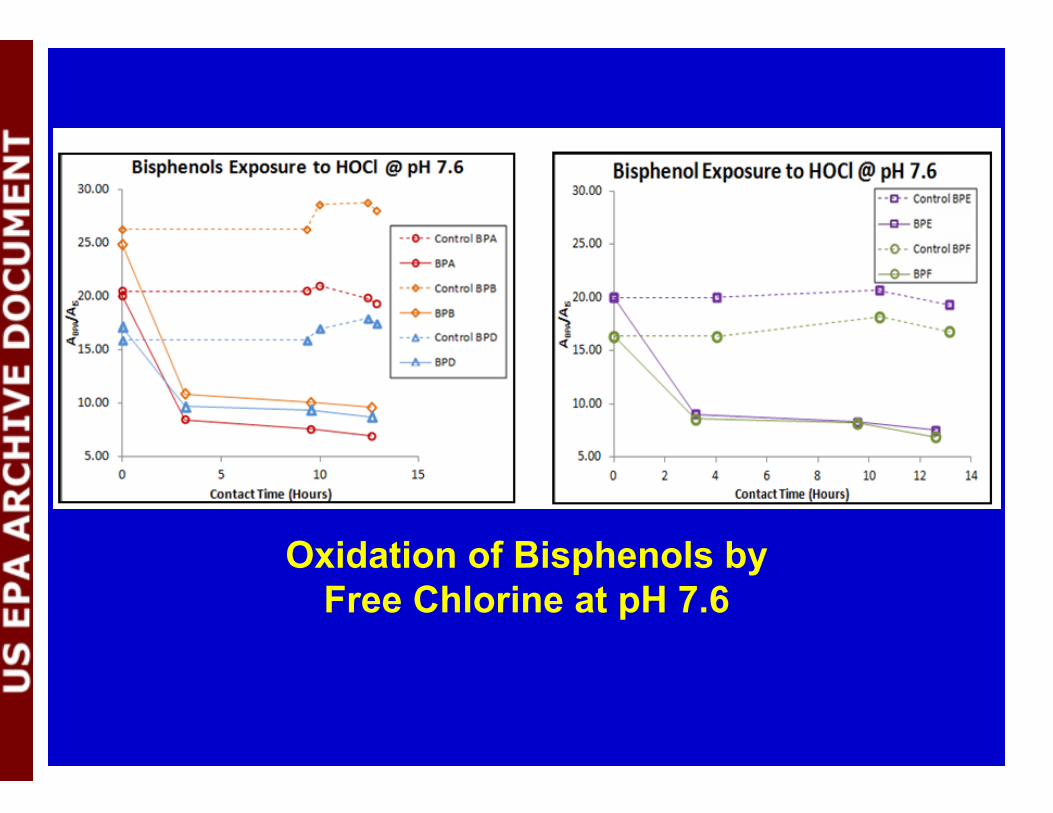
Oxidation of Bisphenols byFree Chlorine at pH 7.6
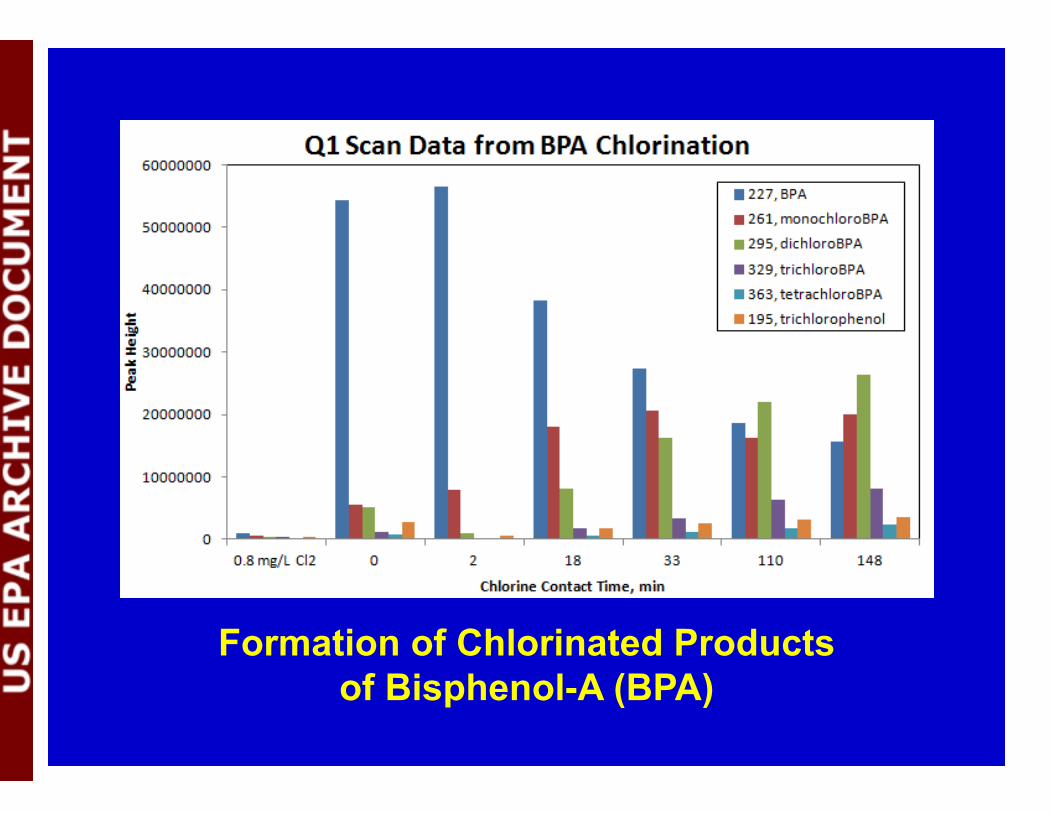
Formation of Chlorinated Productsof Bisphenol-A (BPA)
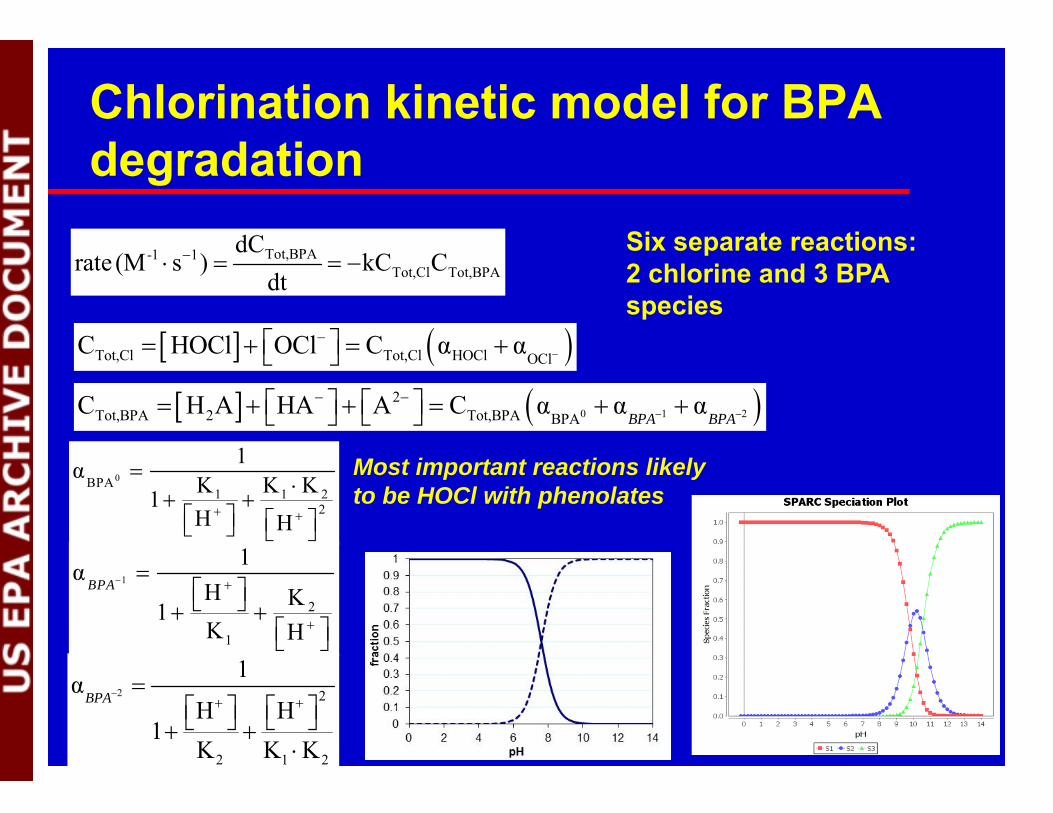
Chlorination kinetic model for BPA degradation
Tot,BPA-1 1Tot,Cl Tot,BPA
dCrate (M s ) kC C
dt
Tot,Cl Tot,Cl HOCl OClC HOCl OCl C α α
0BPA1 1 2
2
1α K K K1H H
1
2
1
1αH K1K H
BPA
2 2
2 1 2
1αH H
1K K K
BPA
0 1 22
Tot,BPA 2 Tot,BPA BPAC H A HA A C α α α
BPA BPA
Six separate reactions:2 chlorine and 3 BPA species
Most important reactions likely to be HOCl with phenolates
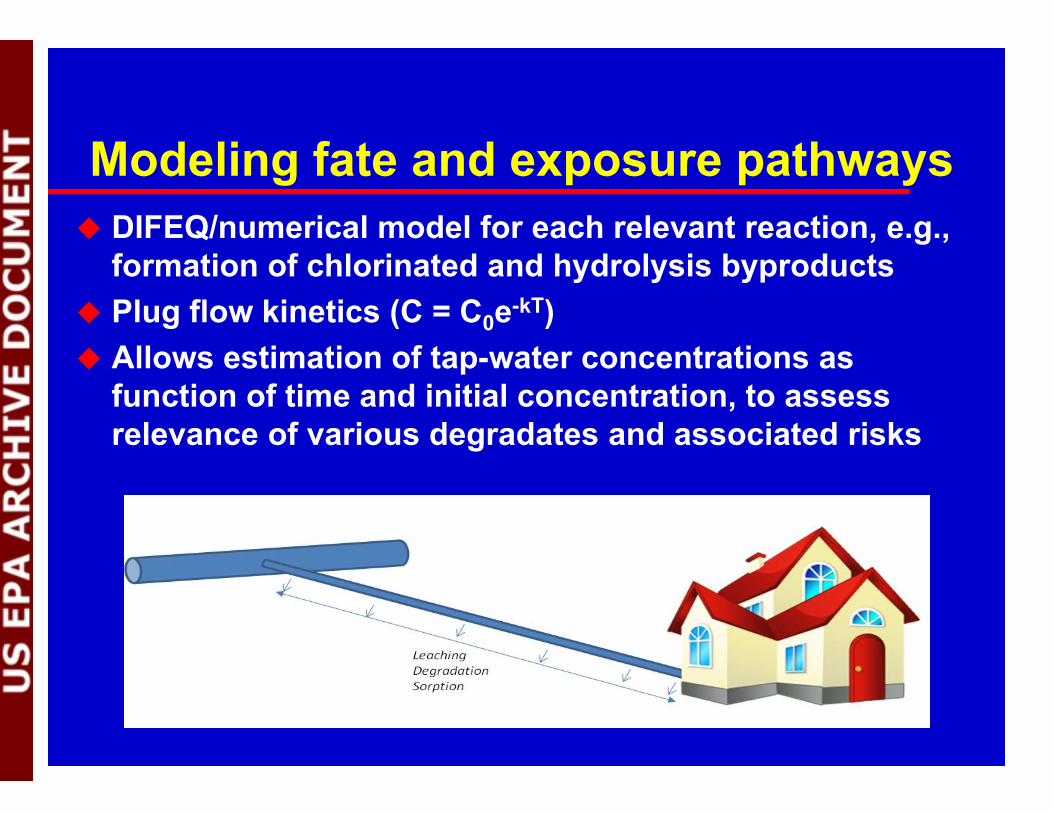
Modeling fate and exposure pathways DIFEQ/numerical model for each relevant reaction, e.g.,
formation of chlorinated and hydrolysis byproducts Plug flow kinetics (C = C0e-kT) Allows estimation of tap-water concentrations as
function of time and initial concentration, to assess relevance of various degradates and associated risks
Acknowledgements This research project is sponsored by a grant from the
U.S. EPA (STAR Grant 834865) to the Water Research Foundation (Project 4351). The contents of this presentation are solely the responsibility of the grantee and do not necessarily represent the official views of the USEPA or the Water Research Foundation. Further, USEPA and the Water Research Foundation do not endorse the purchase of any commercial products or services mentioned herein.
Supplemental support for this research was provided by a Grant-In-Aid of Research from Sigma Xi, The Scientific Research Society, to Rachael F. Lane.

That’s all folks!!
Questions?