Evaluation of Jointed Plain Concrete Pavement (JPCP) … · Evaluation of Jointed Plain Concrete...
191
Evaluation of Jointed Plain Concrete Pavement (JPCP) with FRP Dowels By Hui Li Thesis submitted to the College of Engineering and Mineral Resources at West Virginia University in partial fulfillment of the requirements for the degree of Master of Science in Civil Engineering P.V. Vijay, Ph.D., Chair Hota GangaRao, Ph.D., Co-chair Udaya Halabe, Ph.D. Department of Civil and Environmental Engineering Morgantown, West Virginia 2004 Keyword: FRP dowel, dowel, JPCP, pavement joint, Load transfer efficiency, LTE, relative deflection, joint rehabilitation Copyright 2004 Hui Li
Transcript of Evaluation of Jointed Plain Concrete Pavement (JPCP) … · Evaluation of Jointed Plain Concrete...

Evaluation of Jointed Plain Concrete Pavement (JPCP) with FRP Dowels
By
Hui Li
Thesis submitted to the College of Engineering and Mineral Resources
at West Virginia University in partial fulfillment of the requirements
for the degree of
Master of Science in
Civil Engineering
P.V. Vijay, Ph.D., Chair Hota GangaRao, Ph.D., Co-chair
Udaya Halabe, Ph.D.
Department of Civil and Environmental Engineering
Morgantown, West Virginia 2004
Keyword: FRP dowel, dowel, JPCP, pavement joint, Load transfer efficiency, LTE, relative deflection, joint rehabilitation
Copyright 2004 Hui Li

ABSTRACT
Evaluation of Jointed Plain Concrete Pavement (JPCP) with FRP Dowels
Hui Li
Objectives of this study are to evaluate FRP dowel bars as load transferring
devices in JPCP under HS-25 static and fatigue loads and compare their response with
JPCP consisting of steel dowels. Along with laboratory and field evaluations of JPCP
with FRP and steel dowels, analytical modeling of dowel response has been carried out in
terms of maximum bending deflection, relative deflection and bearing stress of dowels. In
addition, field rehabilitation of JPCP was carried out in this research using FRP dowels to
evaluate its long term performance.
Laboratory tests conducted in this study include static and fatigue load application
corresponding to HS-25 load and 1.5 times HS-25 load on concrete slabs (11” and 12”
depth) with 1.5” and 1.0” steel and FRP dowels at different spacings (12”, 6”).
FRP dowel bars were field installed in corridor-H pavement project on Rt.219,
Elkins WV. Both 1.5” and 1.0” diameter FRP dowels were installed in the field with 6”,
8”, 9” and 12” spacings. Load calibrated field tests were conducted on these pavements
using WVDOT truck in 2002 and 2003. FRP dowel bars with 1.5” diameter were also
utilized for pavement rehabilitation near junction of Rt. 857 and Rt. 119, University
Avenue, Morgantown, WV. Field data collected through automatic data acquisition
system included strain and joint deflections, which were used for assessing joint load
transfer efficiency, joint relative deflection, and pavement performance.
Theoretical calculations are provided through different examples for JPCP with
FRP and steel dowels by varying dowel diameter, spacing, dowel material properties,
joint width, and base material properties.
This research shows that Jointed Plain Concrete Pavement with FRP dowels
provide very good Load Transfer Efficiency (LTE) up to and beyond 90%, which
exceeds AASHTO criteria of 70% or APCA criteria of 60% (equivalent to another
measure Joint Effectiveness of 75%). JPCP with FRP dowels also provided sufficient
LTE after 5 million cycles of fatigue tests under HS-25 loading conducted in the Major
Unit Laboratory, WVU.

iii
To my wife, Xiaojuan Liu (Jenny),
To my daughter, Julianna Li,
And to my parents, Wentan Li and Lianjing Zheng

iv
ACKNOWLEDGEMENTS
I would like to express my gratitude and appreciation to Dr. P.V. Vijay, for his numerous
contributions in helping me develop and complete the whole research with this thesis. I sincerely
appreciate his kindness and help provided whenever needed. Special thanks are extended to Dr.
Hota GangaRao, my academic and research co-advisor, who provided constructive comments
and valuable insight into all areas of this thesis. Also I would like to thank Dr. Udaya Halabe
for providing important advice and suggestions in this research. I also want to thank FHWA and
WVDOT for sponsoring and funding this project.
I would like to thank my friend, Mr. Woraphot Prachasaree for his continuous help
during this research. I also appreciate the assistance provided by my friends Mr. Jose Basto,
Miss Ranee Rajappa, Mr. Vijay Tripathi, Mr. Raghuram Aditham and Mr. Krit
Laosiriphong. I enjoyed the opportunity to work with all of them. The time spent with them will
be remembered.
Finally, I would like to thank my wife, Xiaojuan, for her love, patience and support
during my entire research work.

v
TABLE OF CONTENTS
Chapter 1 INTRODUCTION-------------------------------------------------------------------------1
1.1 General Remarks---------------------------------------------------------------------------------1
1.2 Objectives-----------------------------------------------------------------------------------------3
1.3 Scope---------------------------------------------------------------------------------------------- 3
Chapter 2 LITERATURE REVIEW----------------------------------------------------------------6
2.1 Introduction---------------------------------------------------------------------------------------6
2.2 Literature Review--------------------------------------------------------------------------------7
Chapter 3 MATERIALS , EQUPMENT AND LAB TESTING PROCEDURES ----------10
3.1 Introduction------------------------------------------------------------------------------------- 10
3.2 Material Properties-----------------------------------------------------------------------------10
3.2.1 GFRP Dowels----------------------------------------------------------------------- 10
3.2.2 Steel Dowels-------------------------------------------------------------------------13
3.2.3 Concrete------------------------------------------------------------------------------13
3.2.4 Base-----------------------------------------------------------------------------------13
3.3 Formwork--------------------------------------------------------------------------------------- 14
3.4 Test Setup--------------------------------------------------------------------------------------- 15
3.4.1 Specimen Fabrication---------------------------------------------------------------15
3.4.1.1 Material Preparations----------------------------------------------------15
3.4.1.2 Pavement Slab Casting--------------------------------------------------15
3.4.1.3 Test Specimens-----------------------------------------------------------19
3.4.2 Test Setup and Instrumentation---------------------------------------------------21
3.4.2.1 Static Testing-------------------------------------------------------------23
vi
3.4.2.2 Fatigue Testing-----------------------------------------------------------24
Chapter 4 EXPERIMENTAL RESULTS AND DISCUSSION------------------------------25
4.1 Introduction-------------------------------------------------------------------------------------25
4.2 Joint crack patterns observed in laboratory tests-------------------------------------------26
4.3 Preliminary Tests-------------------------------------------------------------------------------29
4.4 Joint Deflections and Joint Load Transfer Efficiency (LTE)-------------------------------29
4.4.1 Joint Relative Deflection-----------------------------------------------------------30
4.4.1.1 Joint Relative Deflection of Group #1--------------------------------30
4.4.1.1.1 Slab #1---------------------------------------------------------30
4.4.1.1.2 Slab #2---------------------------------------------------------32
4.4.1.1.3 Slab #3---------------------------------------------------------34
4.4.1.2 Joint Relative Deflection of Group #2--------------------------------36
4.4.1.2.1 Slab #4---------------------------------------------------------36
4.4.1.2.2 Slab #5---------------------------------------------------------39
4.4.1.3 Analysis of Relative Deflection--------------------------------------- 40
4.4.1.3.1 Analysis for Specimen Group #1 as
per Table 4.1 (6” spacing) ---------------------------40
4.4.1.3.2 Analysis for Specimen Group #2 (12” spacing) -------42
4.4.2 Joint Load Transfer Efficiency (LTE) -----------------------------------43
4.4.2.1 Load Transfer Efficiency of Group #1-----------------------44
4.4.2.1.1 Slab #1-------------------------------------------44
4.4.2.1.2 Slab#2--------------------------------------------47
4.4.2.1.3 Slab #3 ------------------------------------------48
vii
4.4.2.2 Joint Load Transfer Efficiency of Group #2------------------49
4.4.2.2.1 Slab #4-------------------------------------------49
4.4.2.2.2 Slab #5-------------------------------------------52
4.4.2.3 Analysis and Discussion for Joint Load Transfer
Efficiency--------------------------------------------------------53
4.4.2.3.1 Analysis and Discussion for
Slab Group #1 (6” spacing)-------------------53
4.4.2.3.2 Analysis and Discussion for
Slab Group #2 (12” spacing) -----------------55
4.4.3 Special Investigations on Pavement Pumping Problem------------------ 56
4.4.4 Strains on Dowels-----------------------------------------------------------61
Chapter 5 FIELD APPLICATIONS AND TEST RESULTS---------------------------------63
5.1 Introduction------------------------------------------------------------------------------------- 63
5.2 FRP Dowels Used for New Highway Pavement Construction--------------------------- 63
5.2.1 Field Locations and Installations------------------------------------------------- 64
5.2.1.1 Field Locations-----------------------------------------------------------64
5.2.1.2 Field Installation---------------------------------------------------------66
5.2.2 Field Tests--------------------------------------------------------------------------- 69
5.2.2.1 Field Test Before Opening Highway To Traffic In July 2002----------69
5.2.2.1.1 Test Set Up--------------------------------------------------71
5.2.2.1.2 Test Results And Analysis--------------------------------72
5.2.2.1.2.1 Strain Data From Field Static Tests--------------72
5.2.2.1.2.2 Strain Data From Dynamic Tests- - - - - - - - - - - - - 7 7
viii
5.2.2.1.2.3 Analysis of Test Result---------------------------79
5.2.2.1.2.4 Deflection Data------------------------------------80
5.2.2.2 Field Test After Highway Opened To Traffic, June 2003-------------80
5.2.2.2.1 Test Result from Field Test-------------------------------84
5.2.2.2.2 Analysis of Test Results-----------------------------------87
5.3 FRP Dowels Used for Highway Pavement Rehabilitation---------------------------------90
5.3.1 Field Location and installation----------------------------------------------------91
5.3.1.1 Field Location------------------------------------------------------------91
5.3.1.2 Field Installation---------------------------------------------------------91
5.3.2 Field Tests---------------------------------------------------------------------------94
5.3.2.1 Test Setup----------------------------------------------------------------94
5.3.2.2 Results And Analysis---------------------------------------------------94
5.3.2.2.1 FRP Dowel Group------------------------------------------- 95
5.3.2.2.2 Steel Dowel Group------------------------------------------ 96
5.4 Conclusion--------------------------------------------------------------------------------------97
Chapter 6 ANALYTICAL EVALUATION-----------------------------------------------------100
6.1 Introduction------------------------------------------------------------------------------------100
6.2 Analytical Model----------------------------------------------------------------------------- 100
6.2.1 Load Transfer Across a Joint---------------------------------------------------- 104
6.2.2 Dowel Bending Moment and Shear---------------------------------------------107
6.2.3 Dowel Bar Deflection and Bearing Stress--------------------------------------107
6.2.4 Bearing Stress Between Dowel/Concrete Interface---------------------------109
6.2.5 Pavement Joint Efficiency--------------------------------------------------------109

ix
6.3 Theoretical Calculation Samples for FRP and Steel Dowel Group - ----------------------111
6.3.1 Theoretical Calculation for Dowel Group with 1.5- inch
Diameter Dowels ---------------------------------------------------------------111
6.3.1.1 Example 6.1-------------------------------------------------------------111
6.3.1.2 Example 6.2-------------------------------------------------------------117
6.3.2 Theoretical Calculation for Dowel Group with 1.0-inch
Diameter Dowels---------------------------------------------------------------120
6.3.2.1 Example 6.3------------------------------------------------------ ------120
6.3.2.2 Example 6.4-------------------------------------------------------------124
6.4 Discussions on 1.5” and 1.0” diameter dowels-------------------------------------------127
6.4.1 Comparisons for 1.5” Diameter Dowel Bars----------------------------------127
6.4.2 Comparisons for 1.0” Diameter Dowel Bars----------------------------------132
6.5 Comparison of Experimental vs. Theoretical Data--------------------------------------138
6.6 Analytical Investigation with Respect to FRP Dowel- Concrete Bearing Stress----------139
Chapter 7 CONCLUSIONS-----------------------------------------------------------------------141
7.1 Introduction-----------------------------------------------------------------------------------141
7.2 Conclusions for Laboratory Tests---------------------------------------------------------141
7.2.1 Joint Relative Deflection--------------------------------------------------------142
7.2.2 Joint Load Transfer Efficiency (LTE)------------------------------------------144
7.2.3 Investigation of Pavement Pumping Problem----------------------------------145
7.2.4 Strains on Dowels -----------------------------------------------------------------146
7.3 Conclusions for Field Applications and Test Results------------------------------------146

x
7.3.1 Conclusions for FRP Dowels Used for New Highway
Pavement construction---------------------------------------------------------146
7.3.2 Conclusions for FRP Dowels Used for Highway Pavement
Rehabilitation--------------------------------------------------------------------148
7.4 Conclusions for Analytical Evaluation---------------------------------------------------- 149
7.4.1 Conclusions for 1.5” Diame ter Dowel with 12” C/C Spacing------------------149
7.4.2 Conclusions for 1.0” Diameter Dowel with 6” C/C Spacing-------------------152
7.5 General Conclusions from This Research-------------------------------------------------154
7.6 Recommendations----------------------------------------------------------------------------156
REFERENCE----------------------------------------------------------------------------------------------157
APPENDIX A
Test of Timber Tie With FRP Dowels-------------------------------------------------------------------160
APPENDIX B
Analytical Evaluation of Effect of FRP Dowel Shear Modulus on Pavement
Relative Deflection-----------------------------------------------------------------------------------------168
APPENDIX C
Fiber Burnout Tests for Determining Fiber Weight Fraction and Fiber Volume Fraction
for FRP Dowels--------------------------------------------------------------------------------------------171

xi
List of Tables
Table 3.1 Modulus of elasticity test results of FRP rod---------------------------------------------12
Table 3.2 Shear test results of FRP rod specimens – single---------------------------------------- 12
Table 3.3 Dowel details in specimens------------------------------------------------------------------21
Table 3.4 Details of static testing-----------------------------------------------------------------------23
Table 3.5 Details of fatigue testing---------------------------------------------------------------------24
Table 4.1 Parameters of dowel groups-----------------------------------------------------------------26
Table 4.2 Cracks in the tested slabs--------------------------------------------------------------------28
Table 4.3 Static load applied for specimen #1--------------------------------------------------------30
Table 4.4 Load applied for fatigue tests on slab #1-------------------------------------------------- 31
Table 4.5 Load applied for fatigue tests on specimen #2--------------------------------------------33
Table 4.6 Load applied for fatigue tests on slab #3-------------------------------------------------- 35
Table 4.7 Load applied for fatigue tests on specimen #4--------------------------------------------37
Table 4.8 Load applied for fatigue tests on Slab #5--------------------------------------------------39
Table 4.9 Load applied for fatigue tests on Specimen #5-------------------------------------------40
Table 4.10 Relative deflection of group one from static tests----------------------------------------40
Table 4.11 Relative deflection of group one from fatigue tests---------------------------------------41
Table 4.12 Relative deflection of group two from static tests----------------------------------------42
Table 4.13 Relative deflection of group two from fatigue tests--------------------------------------42
Table 4.14 Load transfer efficiency of group one from static tests----------------------------------53
Table 4.15 Load transfer efficiency of group #1 during fatigue tests--------------------------------54

xii
Table 4.16 Load transfer efficiency of group two from static tests under corresponding
HS25 Load------------------------------------------------------------------------------------55
Table 4.17 Load transfer efficiency of group two from fatigue tests--------------------------------55
Table 4.18 Evaluation of pumping issue under 10 kips loading--------------------------------------60
Table 4.19 Evaluation of pumping issue under 3 kips loading---------------------------------------60
Table 5.1 Parameters of the Field Test at location 2 , July 2002-----------------------------------70
Table 5.2 Joint details used for analysis --------------------------------------------------------------73
Table 5.3 Summary of FRP dowel strain during loading and unloading----------------------------79
Table 5.4 Parameters of the field test, June 2003---------------------------------------------------81
Table 5.5 Pavement joint for deflection analysis ---------------------------------------------------84
Table 5.6 Summary of joint deflection under maximum loading force------------------------------87
Table 5.7 Comparing joint 2 and joint 3 -------------------------------------------------------------89
Table 6.1 Calculation summaries for 1.5” diameter dowel (k=400pci, fc’=4500 psi) -------------127
Table 6.2 Peak bearing stress and average bearing stress in
dowel (1.5” diameter @ 12” c/c) downward area--------------------------------------128
Table 6.3 Peak bearing stress and average bearing stress within 1”
dowel (1.5” diameter @ 12” c/c) length from joint face-------------------------------128
Table 6.4 Calculation summaries for 1.0” diameter dowel (k=400pci, fc’=4500 psi) -------------133
Table 6.5 Peak bearing stress and average bearing stress in
dowel (1.0” diameter @ 6 ” c/c) downward area---------------------------------------134
Table 6.6 Peak bearing stress and average bearing stress within
1” dowel (1.0” diameter @ 6” c/c) length from joint face-----------------------------134
Table 6.7 Comparison of Experiments vs. Theory for Slab Relative

xiii
Deflection in Static Testing Under HS25 Loading------------------------------------138
Table A.1 Strains during loading and unloading on Case- I- A------------------------------------162
Table A.2 Strains during loading and unloading on Case- I- B------------------------------------163
Table A.3 Strains during loading and unloading on Case- II- A-----------------------------------164
Table A.4 Deflections of timber tie on Case- I- A---------------------------------------------------164
Table A.5 Deflections of timber tie on Case- I- B---------------------------------------------------165
Table B.1 Relative deflection with low dowel shear modulus (Gd= 0.4×10⁶ psi) ------------------169
Table B.2 Relative deflection with high dowel shear modulus (Gd= 7.5×10⁶ psi) -----------------169
Table C.1 FWF and FVF for FRP dowel with 1.0” diameter-------------------------------------171
Table C.2 FWF and FVF for FRP dowel with 1.5” diameter-------------------------------------171

xiv
List of Figures
Figure 1.1 Exposed failures with rusted dowel bars (WS DOT Pavement Guide)--------------------2
Figure 2.1 Typical pavements problems: Faulting and Pumping (American Highway
Technology, 2003------------------------------------------------------------------------------6
Figure 3.1 FRP dowels (1.5” and 1.0” diameter) -----------------------------------------------------11
Figure 3.2 Steel dowels (1.5” and 1.0” diameter)-----------------------------------------------------13
Figure 3.3 Wood formwork------------------------------------------------------------------------------14
Figure 3.4 Dimensions of formwork (inches)---------------------------------------------------------14
Figure 3.5 Trimmed dowel bar--------------------------------------------------------------------------15
Figure 3.6 Instrumented dowels and steel plate positioned in the wood formwork-------------------16
Figure 3.7 Placing concrete into formwork------------------------------------------------------------17
Figure 3.8 Dowel being covered by concrete----------------------------------------------------------17
Figure 3.9 Casting concrete cylinders------------------------------------------------------------------ 18
Figure 3.10 Surface finished specimens-----------------------------------------------------------------18
Figure 3.11 Concrete slabs for preliminary tests-------------------------------------------------------19
Figure 3.12 Concrete slabs containing two dowels----------------------------------------------------20
Figure 3.13 Concrete slabs containing only one dowel-----------------------------------------------20
Figure 3.14 Experimental set up-------------------------------------------------------------------------22
Figure 3.15 LVDTs positioned on both sides of the joint--------------------------------------------23
Figure 4.1 Typical crack observed in Slabs #1, #4 and #5 (Table 4.1)-----------------------------27
Figure 4.2 Crack observed in Slabs #2 (Table 4.1)---------------------------------------------------27
Figure 4.3 Typical crack observed in Slabs #3 (Table 4.1)------------------------------------------28

xv
Figure 4.4 Joint Relative Deflection for slab #1 under static test------------------------------------30
Figure 4.5 Relative deflections under HS25 loading for slab #1 at joint
width of 0.25” (static and 1 Million cycles)-----------------------------------------------31
Figure 4.6 Relative deflections for slab #1 under fatigue tests (joint width increased
from 0.25” to 0.4” from 2 to 5 Million cycles)-------------------------------------------32
Figure 4.7 Joint relative deflection for slab #2 under static test--------------------------------------33
Figure 4.8 Relative deflections for specimen #2 (0 to 2 million cycles)------------------------------34
Figure 4.9 Joint relative deflection for specimen #3 under static test--------------------------------35
Figure 4.10 Relative deflections for specimen #3 (0 to 1.25 millio n cycles)------------------------- 36
Figure 4.11 Joint relative deflection for specimen #4 under static test--------------------------------37
Figure 4.12 Pavement deflections under fatigue test for slab #4 (0 to 5 million
cycles, FRP dowel @12” c/c)--------------------------------------------------------------38
Figure 4.13 Relative deflections under fatigue test for specimen #4 (0 to 5 M)----------------------38
Figure 4.14 Joint relative deflection for specimen #5 under static test------------------------------ 39
Figure 4.15 Relative deflections under fatigue test for specimen #5 (0 to 5 M)----------------------40
Figure 4.16 Joint load transfer efficiency for slab #1-------------------------------------------------44
Figure 4.17 LTE corresponding to HS25-loading for slab #1 (1.0”diameter
@ 6 ” c/c), ( Static and 1 Million Cycles)-------------------------------------------------45
Figure 4.18 LTE for slab #1 under fatigue tests (>1 Million cycles & joint width
increased from 0.25” to 0.4”) -------------------------------------------------------------45
Figure 4.19 Dowel- concrete interface condition in slab #1 after 5 million load cycles---------------46
Figure 4.20 Joint load transfer efficiency for slab # 2------------------------------------------------47
Figure 4.21 LTE under fatigue tests (HS25 loading) for slab #2 (0 to 1 million cycles)--------------47

xvi
Figure 4.22 LTE under fatigue test for slab #2 (1 to 2 million)--------------------------------------48
Figure 4.23 Joint load transfer efficiency for slab # 3-------------------------------------------------48
Figure 4.24 LTE under fatigue test for slab #3 (0 to 1.25 million) -----------------------------------49
Figure 4.25 Joint load transfer efficiency for slab # 4-------------------------------------------------50
Figure 4.26 LTE under fatigue test for slab #4 (0 to 5 million) ---------------------------------------51
Figure 4.27 Dowel- concrete interface condition in slab #4 after 5 million load cycles----------------52
Figure 4.28 Joint load transfer efficiency (LTE) for slab #5-----------------------------------------52
Figure 4.29 LTE under fatigue test for slab #5 (0 to 5 Million) ------------------------------------- 53
Figure 4.30 Case one - 2 ft. base material removal under loaded side of slabs-----------------------57
Figure 4.31 Relative deflection for pumping tests (Case one - 2 ft. base removal) --------------------57
Figure 4.32 Load transfer efficiency for pumping tests (Case one - 2 ft. base removal) ---------------58
Figure 4.33 Case two - 1 ft. base material removal under both sides of slabs------------------------58
Figure 4.34 Relative deflection for pumping tests under 3 kips loading (Case
Two - 1 ft. base removal under both slabs)-----------------------------------------------59
Figure 4.35 Load transfer efficiency for pumping tests under 3 kips loading (Case
Two - 1 ft. Base removal under both slabs)----------------------------------------------59
Figure 4.36 Strain gage reading in slab #1 (1.0” diameter @ 6” c/c) from static test to
1 million cycles under HS25 loading) ---------------------------------------------------62
Figure 4.37 Strain gage reading in slab #4 (1.5” diameter @ 12” c/c) from static
test underHS25 loading- -------------------------------------------------------------------62
Figure 5.1 Dowel installation at location 1 of corridor H, Rt. 250, Elkins, WV--------------------64
Figure 5.2 FRP dowel positions at location 1 of corridor H, Rt. 250, Elkins,
WV (Note: Only dowels with shading are instrumented)- ------------------------------64

xvii
Figure 5.3 FRP dowel bars at location 2 of corridor H, Rt. 219, Elkins, WV---------------------65
Figure 5.4 FRP dowel positions at location No.2 of corridor H, Rt. 219, Elkins, WV------------65
Figure 5.5 FRP dowel bars bonded with strain gages at loaded and unloaded side---------------66
Figure 5.6 Embeddable concrete strain gage with dowels -----------------------------------------67
Figure 5.7 FRP dowels in dowel basket------------------------------------------------------------- 67
Figure 5.8 Paving operation in progress-------------------------------------------------------------68
Figure 5.9 FRP dowel bars being covered by concrete--------------------------------------------68
Figure 5.10 Dial gages for measuring pavement deflection under truck loading---------------------71
Figure 5.11 Data acquisition system used for field test---------------------------------------------72
Figure 5.12 Dowel A1 (1.5” dia., 9” spacing) , refer to Figure 5.4---------------------------------73
Figure 5.13 Stains in dowel during loading and unloading cases for gage
A1 - LT ( 1.5” dia., 9” spacing) ------------------------------------------------------------74
Figure 5.14 Dowel A2 (1.5” dia., 12” spacing) , refer to Figure 5.4--------------------------------74
Figure 5.15 Strains in dowel during Loading and unloading cases for gage A2-LT
(1.5” dia., 12”spacing) , refer to Figure 5.4---------------------------------------------75
Figure 5.16 Dowel C5 (1.0” dia. 6” spacing) , refer to Figure 5.4----------------------------------75
Figure 5.17 Strains in dowel during loading case for gage C5- U1 (1.0” dia., 6”
spacing) , refer to Figure 5.4--------------------------------------------------------------76
Figure 5.18 Dowel C6 (1.0” dia. 8” spacing) , refer to Figure 5.4----------------------------------76
Figure 5.19 Strains on dowel during loading case for gage C6-U1 (1.0” dia., 8”
spacing) , refer to Figure 5.4--------------------------------------------------------------77
Figure 5.20 Strain from gage A1 - LT (1.5” FRP dowel @ 9” spacing) from dynamic tests---------78
Figure 5.21 Strain from gage A2 - LT (1.5” FRP dowel @ 12” spacing) from dynamic tests--------78

xviii
Figure 5.22 DOT truck used for field test------------------------------------------------------------82
Figure 5.23 WVDOT truck positioned near a joint for test----------------------------------------82
Figure 5.24 Two LVDTs measuring pavement deflections across a joint --------------------------83
Figure 5.25 Measuring distance from tire to LVDTs (when loading is away from selected
dowel) ---------------------------------------------------------------------------------------83
Figure 5.26 Deflection on pavement joint No. 3 (with 1.5” dia. & 12” spacing FRP dowels)
under loading------------------------------------------------------------------------------84
Figure 5.27 Deflection on pavement joint No.2 (with 1.5” dia. & 9” spacing FRP dowels)
under unloading--------------------------------------------------------------------------85
Figure 5.28 Deflection on pavement joint No.2 (with 1.5” dia. & 9” spacing FRP dowels)
under loading-----------------------------------------------------------------------------85
Figure 5.29 Deflection on pavement joint No.5 (with 1.0” dia. & 8” spacing FRP dowels)
under loading-----------------------------------------------------------------------------86
Figure 5.30 Deflection on pavement joint No.6 (with 1.0” dia. & 6” spacing FRP dowels)
under loading-----------------------------------------------------------------------------86
Figure 5.31 Comparison of LTE from field test (average value was used for joint No.2)---------88
Figure 5.32 Comparison of Relative Deflection from field test (average value was used for
joint 2 )------------------------------------------------------------------------------------89
Figure 5.33 Locations of FRP and steel doweled pavement joints-------------------------------91
Figure 5.34 Drilling holes for inserting dowels ---------------------------------------------------- 92
Figure 5.35 FRP dowels in position------------------------------------------------------------------92
Figure 5.36 Steel dowels in position-----------------------------------------------------------------93
Figure 5.37 Concrete placement and vibration-----------------------------------------------------93

xix
Figure 5.38 Data acquisition recording strain readings --------------------------------------------94
Figure 5.39 Strain from FRP dowels in rehabilitated pavement ----------------------------------95
Figure 5.40 Strain from steel dowel in rehabilitated pavement -----------------------------------96
Figure 6.1 Semi- infinite beam on an elastic foundation----------------------------------------102
Figure 6.2 Slope and deflection of dowel at joint face-----------------------------------------102
Figure 6.3 Load transfer distribution proposed by Friberg (1938)----------------------------105
Figure 6.4 Load transfer distribution proposed by Tabatabaie et al. (1979)-------------------106
Figure 6.5 Most critical dowel at the edge of a slab--------------------------------------------106
Figure 6.6 Relative deflection between concrete slabs (Porter and Guinn, 2002)--------------108
Figure 6.7 Expansion joint model used for theoretical calculation------------------------------111
Figure 6.8 Steps for calculating critical dowel load, joint relative deflection
and bearing stress in JPCP------------------------------------------------------------113
Figure 6.9 Generalized effective dowels for load distribution---------------------------------114
Figure 6.10 Most critical load distribution on effective dowels ---------------------------------115
Figure 6.11 Pavement contraction joint model--------------------------------------------------117
Figure 6.12 Expansion joint model used for theoretical calculation-----------------------------120
Figure 6.13 Most critical load distribution on effective dowels ---------------------------------122
Figure 6.14 Dowel deflected shape (1.5” diameter)---------------------------------------------129
Figure 6.15 Dowel deflected shape----------------------------------------------------------------135
Figure A.1 Lab test of timber tie with FRP dowel bar as the load transfer device--------------160
Figure A.2 Four timber test cases-----------------------------------------------------------------161
Figure A.3 Rosette strain gages-------------------------------------------------------------------162
Figure A.4 Plot for longitudinal strain Gages (Case- I- A & Case- I- B)-------------------------163
xx
Figure A.5 Load vs. deflection of timber tie for CASE- I- A------------------------------------166
Figure A.6 Load- Deflection (arm with regular gage) for CASE- I- B----------------------------166
Figure B.1 Components of Relative Deflection for Dowel Types A (1.0" diameter)
and B (1.5" diameter), with k=400pci, fc'=4500psi, Joint width=0.25" and
Gd=0.4×10⁶psi--------------------------------------------------------------------------170
Figure B.2 Components of Relative Deflection for Dowel Types A (1.0" diameter)
and B (1.5" diameter), with k=400pci, fc'=4500psi, Joint width=0.25" and
Gd=0.75×10⁶psi-------------------------------------------------------------------------170

1
Chapter 1
INTRODUCTION
1.1 General Remarks
US highways and roads made of Joint Plain Concrete Pavement (JPCP) use load
transfer devices called dowels across joints of a series of contiguous concrete slabs. Joints
allow the movement and deformation of pavement to occur under mechanical loading and
thermal variations. Joints may either be parallel to traffic (longitudinal joint) or
perpendicular to traffic (transverse joints). Typical problems of jointed concrete
pavement without an effective load transfer device include faulting, pumping or corner
breaks.
Pavement joints supported with dowels have a longer service life than joints
without dowels (AASHTO, 1993). Over time, traffic traveling over the joint may crush
the concrete surrounding the dowel bar and cause voids due to excessive bearing stresses
between the dowel and surrounding concrete. Concrete crushing may take place due to
stress concentration where the dowel contacts concrete at the joint face directly above
and below the dowel. Looseness of dowel support can decrease the load transfer
efficiency (LTE) across the joint and accelerate pavement damage (Friberg, 1940).
Corrosion of the dowel bar can potentially bind or lock the joint. When locking of
the joint occurs, no thermal expansion is allowed and new cracks parallel to the joint are
formed directly behind the dowel bars in the concrete. As temperature decreases,
contraction of the concrete widens the new cracks leading to reduction of load transfer.
Once there is no load transferred across the joint, load is then transferred to the subgrade
and differential settlement occurs in the adjacent slabs. Differential settlement of the

2
adjacent slabs creates uneven surface and discontinuity at the joints, making vehicle
travel uncomfortable and leading to slab repair or replacement.
Currently, steel dowels typically epoxy-coated with a diameter of 1.0 inch or 1.5
inch and length of 18 inches are widely used in JPCP. However, this coating is usually
nicked or scraped before installation, leading to dowel corrosion and deterioration (Figure
1.1). FRP dowel bars, which are resistant to corrosive environments can be used as
effective load transfer mechanism in JPCP. Currently polymer matrix composites such as
fiber reinforced plastics (FRP) are being used in a broad range of structural applications
within the aerospace, automotive, marine and construction industries, due to their
superior strength to weight ratio and high corrosion resistance (Vijay and GangaRao,
1999).
Figure 1.1 Exposed failures with rusted dowel bars (WS DOT Pavement Guide)
In this research, response of concrete pavement with FRP dowels is investigated
through laboratory experiments and field implementation.

3
1.2 Objectives
The main objectives of this study are to evaluate:
1. To evaluate FRP dowel bars with 1.5” and 1.0” diameter spaced at different
intervals as load transferring devices in JPCP under HS25 static and fatigue
loads and compare their response (relative deflection and load transfer
efficiency) with JPCP consisting of steel dowels under laboratory and field
conditions.
2. To evaluate the performance (strain and deflection) of JPCP rehabilitated with
FRP and steel dowels.
3. To model FRP and steel dowel response and that of the pavement in terms of
dowel maximum bending deflection, relative deflection and bearing stress.
1.3 Scope
1. Details of laboratory tests conducted at WVU structural laboratory are as
follows:
i. Two jointed concrete slabs with 1.5” diameter FRP dowels and 12”
slab depth were tested under static loads during preliminary static load
investigation.
ii. Five jointed concrete slabs with 1.5” and 1.0” steel and FRP dowels
having different spacings (12”, 6”) were tested under static and fatigue
loads corresponding to HS25 load and 1.5 times HS25 load. Slab depth
was 11” for all the five slabs, similar to field installation depth.

4
iii. Pavement performance (load transfer efficiency, relative deflection
and dowel strain) with FRP and steel dowels was evaluated with
respect to:
a. Dowel diameter
b. Dowel spacing
by using identical slab thickness, fc’, joint depth and width.
2. FRP dowel bars were field installed in new highway JPCP construction on
Rt.219, Elkins WV. Both 1.5” and 1.0” diameter FRP dowels were installed in
the field and dowel spacings used were 6”, 8”, 9” and 12”. Two field tests
were conducted and results were analyzed and discussed.
3. FRP dowel bars with 1.5” diameter were installed for pavement rehabilitation
near the intersection of Rt. 857 and Rt. 119, University Avenue, Morgantown,
WV. Dowel strains due to regular traffic were analyzed and discussed.
4. Analysis and discussions corresponding to theoretical calculations are
provided for four different examples of pavements with FRP and steel dowels
in terms of dowel diameter, spacing, dowel material properties, joint width,
and base material properties.
This report is organized into 7 chapters. Chapter 1 describes objectives and scope of this
research. Chapter 2 deals with the literature review. Chapter 3 describes materials and
laboratory test setup used in this research. Chapter 4 discusses experimental results from
laboratory tests. Chapter 5 presents field installation, field load test results and
discussions. Theoretical evaluations are presented in Chapter 6. Finally, Chapter 7

5
provides summary and conclusions of this research including suggestions for future
research. Appendix A describes a preliminary test on timber ties consisting of a FRP
dowel as load transfer device. Appendix B is an analytical evaluation of effects of FRP
dowel shear modulus on pavement relative deflection. Appendix C describes the details
of burnout tests for determining Fiber Weight Fraction (FWF) and Fiber Volume Fraction
(FVF) of FRP dowels with 1.0” and 1.5” diameter.

6
Chapter 2
LITERATURE REVIEW
2.1 Introduction
In Jointed Plain Concrete Pavements, inadequate load transfer across the joint will
cause substantially higher stresses and deflections due to joint loading than those due to
interior loading. A dowel bar transfers part of an applied wheel load from the loaded slab
across the joint to the adjacent unloaded slab. Load transfer through dowel bars
significantly reduces stresses and deflections due to joint loading, leading to minimized
faulting and pumping (Fig. 2.1). Faulting is the difference in elevation across the joint of
the two slabs, while pumping is defined as the expulsion of subgrade material through
joints and along the edges of the pavement (Ambroz, 2003).
Figure 2.1 Typical pavements problems: Faulting and Pumping (American Highway
Technology, 2003)

7
2.2 Literature Reviews
Currently, FRP dowels have not been widely used in concrete pavements for
highway. However, a number of projects in the United States and Canada that have used
these composite materials for highway pavement, on an experimental basis.
In 1983, the Ohio Department of Transportation (ODOT) installed several FRP
dowel bars to evaluate long-term performance in sections of Interstate 77 in Guernsey
County and Ohio State Route 7 in Belmont County. In 1998, the Market Development
Alliance (MDA) of the composites industry organized the extraction and testing of
samples of these dowel bars. GFRP Dowel Bars were found to be virtually unaffected by
approximately 15 years of field service and exposure in pavement service.
In 1997, FRP dowel bars were installed in a high performance pavement project
on US 65 bypass near Des Moines, IA. Length of the pavement sections with FRP dowels
was 440 ft. and 417 ft. with 20 ft. joint spacing (skewed) and dowel bars on 12 inch and 8
inch spacing, respectively. Indications are that the FRP Dowels have been performing
well. Additional alternative Dowel Bar projects utilizing FRP Dowels have been installed
in Illinois, Iowa, Kansas, Minnesota, Ohio, Wisconsin and Manitoba.
Brown and Bartholomew (1993) found that FRP dowels made of vinyl ester resins
compared well with steel dowels in the scaled model tests. Experimental load transfer
percentages were in agreement with theoretical values, and fell within the 35% to 40%
range predicted for standard joints under typical subgrade conditions. They recommend
approximately 20 to 30 percent increase in dowel diameter to maintain deflections,
concrete bearing stresses, and load transfer percentages at comparable levels with joints
containing steel dowels.

8
Ahmed et al. (2001) from University of Manitoba, Canada, have conducted
researches for Glass Fiber-Reinforced Polymer (GFRP) dowels. In their experimental
program, round GFRP dowel bar having a 38-mm (1.5”) diameter and the second is a
concrete-filled GFRP pipe having a 60-mm (2.36”) outside diameter were evaluated
under laboratory and a field implementation. The field test section was constructed on a
regional highway in the city of Winnipeg.
They concluded that GFRP dowels subjected to FWD tests in the field showed
that LTEs of GFRP dowels are comparable to those produced by steel dowels, provided
the diameter of the GFRP dowel is 20-30% larger than the steel dowel. The larger
diameter results in a reduction in bearing stresses that in turn reduces the potential for
faulting.
Tests conducted by Eddie et al. (2001) showed that the joint effectiveness of
GFRP dowels to be in the range of 86% to 100% effectiveness using a weak subgrade
and 90% to 97% using a stiff subgrade. ACPA criteria for successful joint load transfer is
75%.
Porter (2002) and other researchers in Iowa State University studied use of GFPR
dowels for JPCP with contraction. They concluded that:
• The 1.5- inch diameter GFRP dowels spaced at 12- inch centers were
inadequate in transferring load for the anticipated design life of the
pavement.
• The 1.5- inch diameter GFRP dowels spaced at 6- inch centers were
effective in transferring load over the anticipated design life of the
pavement.
9
Literature review indicates contradictory conclusions on the LTE of 1.5” FRP
dowels. Suggestions are also provided by researcher to increase dowel bar diameter from
1.5” to 1.75”. Some researchers have noted increased relative deflection with an
increased diameter. Hence, it was decided to utilize 1.5” and 1.0” dowel diameter in this
research with 69.47% and 72% fiber weight fraction, respectively. Chapter 3 describes
materials and laboratory test setup used in this research.
10
Chapter 3
MATERIALS, EQUPMENT AND LAB TESTING PROCEDURES
3.1 Introduction
Mechanical properties of dowel bars affect the behavior and performance of JPCP
provided with FRP and steel dowels. This chapter discusses mechanical properties of
FRP and steel dowels, and test setup in the Major Unit Laboratory of West Virginia
University. Seven full-scale jointed plain concrete pavements (Two with a dimension of
12”x12”x120” and five with 12”x11”x120”) were cast with simulated contraction or saw
cut joint. The specimens were subjected to both static load and fatigue load with a
frequency of about 4.0 hertz.
3.2 Material Properties
Class K concrete (3750 psi and 4500 psi), two different diameters (1.5” and 1.0”)
of Glass Fiber Reinforced Polymer (GFRP) dowel and epoxy coated steel dowels were
used for casting the concrete pavements in the structural laboratory. Relevant material
properties are provided in this section.
Two slabs used for preliminary testing consisted of fc’ of 3750 psi, and for rest of
the five slabs, fc’ was found to be 4500 psi through cylinder tests.
3.2.1 GFRP Dowels
GFRP dowels were provided by RJD Industries, Inc. GFRP dowels are pultruded
with continuous E glass filaments and polyester resin. Typically, filaments are drawn
through a resin bath, sized by an appropriate die, to form the dowel bar. A UV inhibitor is
added to the resin to resist effects of sunlight. Dowels with 1.5” and 1.0” diameter were
used in this project. Other researchers have commented on using 1.75” diameter FRP

11
dowel bars instead of 1.5” diameter. However, researchers (Porter, 2002) have noted that
increased bar diameter will result in larger relative deflection. Hence, it was decided to
utilize lower diameter bars in this research.
Figure 3.1 FRP dowels (1.5” and 1.0” diameter)
Figure 3.1 shows two types of GFRP dowels used in this research. Tables 3.1 and
3.2 show properties of FRP bars listed by the manufacturer.

12
Table 3.1 MODULUS OF ELASTICITY TEST RESULTS OF FRP ROD
SPECIMENS – ASTM D3916 (RJD Industries, Inc.)
Type Nominal
Dia. (in.)
Actual
Dia. (in.)
Area
Sq. (in.)
Ultimate
Load (lbs.)
Tensile
Stress (psi)
Elongation
%
MOE
Msi
1.0000 0.9713 0.7394 66539 89986 0.094 6.0 A
1.0000 0.9700 0.7390 65204 88235 0.091 6.0
Average 1.0000 0.9707 0.7392 65872 89111 0.093 6.0
1.5000 1.4932 1.7512 134440 76772 0.219 5.2 B
1.5000 1.4933 1.7514 137000 78226 0.179 5.0
Average 1.5000 1.4933 1.7513 135720 77499 0.199 5.1
Table 3.2 SHEAR TEST RESULTS OF FRP ROD SPECIMENS – SINGLE
SHEAR FIXTURE (RJD Industries, Inc.)
Type Nominal Dia.
(in.)
Actual
Dia. (in.)
Area
Sq. (in.)
Ultimate
Load (lbs.)
Shear
Stress (psi)
1.0000 0.9703 0.7390 28600 38700
1.0000 0.9700 0.7380 30300 41060 A
1.0000 0.9702 0.7390 27200 36810
Average 1.0000 0.9702 0.7387 28700 38857
1.5000 1.4923 1.7490 33982 19429 B
1.5000 1.4935 1.7519 31782 18142
Average 1.5000 1.4929 1.7505 32882 18786
13
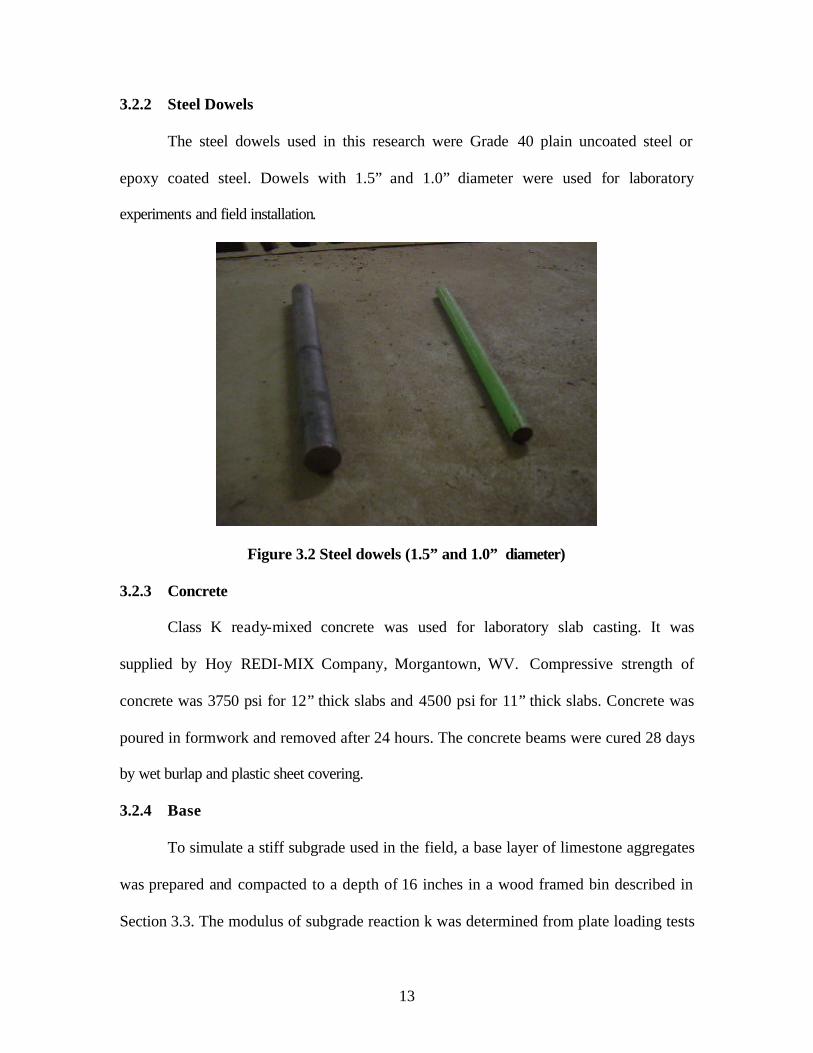
3.2.2 Steel Dowels
The steel dowels used in this research were Grade 40 plain uncoated steel or
epoxy coated steel. Dowels with 1.5” and 1.0” diameter were used for laboratory
experiments and field installation.
Figure 3.2 Steel dowels (1.5” and 1.0” diameter)
3.2.3 Concrete
Class K ready-mixed concrete was used for laboratory slab casting. It was
supplied by Hoy REDI-MIX Company, Morgantown, WV. Compressive strength of
concrete was 3750 psi for 12” thick slabs and 4500 psi for 11” thick slabs. Concrete was
poured in formwork and removed after 24 hours. The concrete beams were cured 28 days
by wet burlap and plastic sheet covering.
3.2.4 Base
To simulate a stiff subgrade used in the field, a base layer of limestone aggregates
was prepared and compacted to a depth of 16 inches in a wood framed bin described in
Section 3.3. The modulus of subgrade reaction k was determined from plate loading tests
14
in the laboratory. Based on the measured values, an average of 400 pci was used for all
our tests employing aggregate base. The value was also applied to the theoretical
calculations.
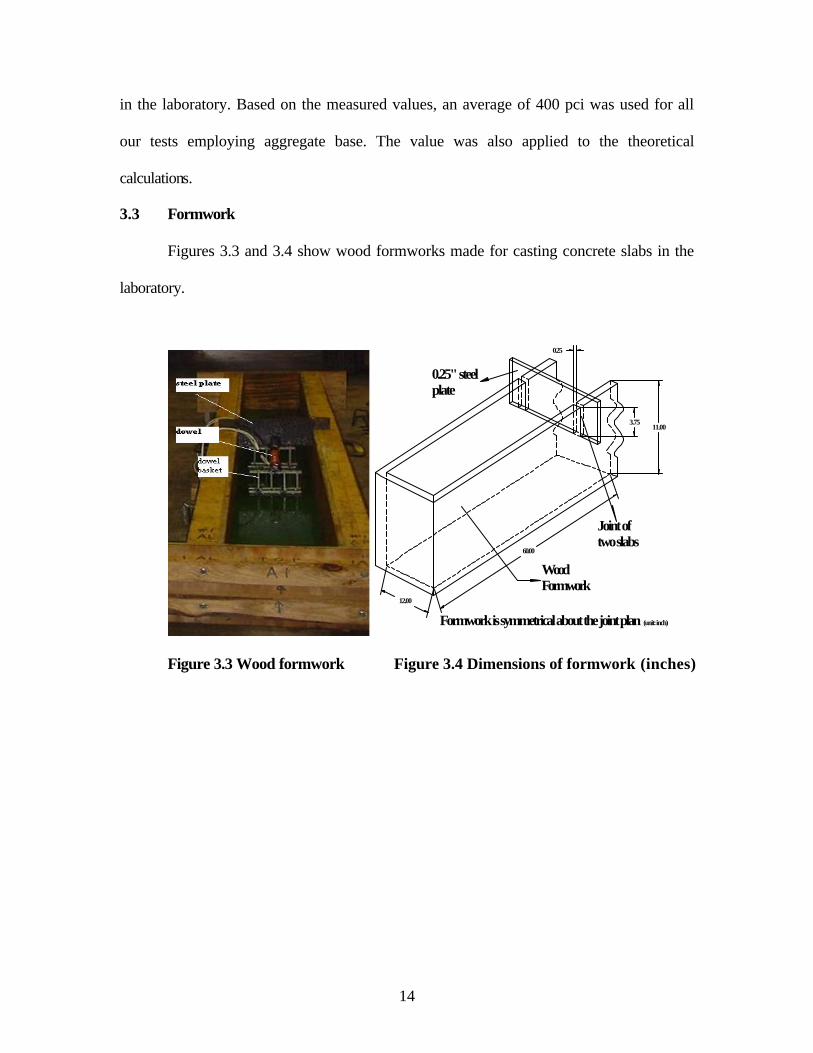
3.3 Formwork
Figures 3.3 and 3.4 show wood formworks made for casting concrete slabs in the
laboratory.
Wood Formwork
0.25" steel plate
Joint of two slabs
Formwork is symmetrical about the joint plan (unit: inch)
60.00
12.00
0.25
11.003.75
Figure 3.3 Wood formwork Figure 3.4 Dimensions of formwork (inches)

15
3.4 Test Setup
3.4.1 Specimen Fabrication
Seven different slabs were cast with FRP and steel dowels using different spacing
and diameters.
3.4.1.1 Material Preparations
FRP and Steel dowels were prepared with slots at locations where strain gages
were going to be placed.
Figure 3.5 Trimmed dowel bar
Uniaxial strain gages were bonded to dowels at slot position shown in Fig. 3.5.
Strain gages were protected by using M-Coat-J (Polysulfide) from Vishay Measurements
Group.
3.4.1.2 Pavement Slab Casting
The inside walls of wood formworks were oiled so that concrete pavement slabs
could be easily demolded. Strain gage instrumented dowels were then placed in dowel

16
baskets to properly center them in the joint. Steel plate with ¼” thickness was placed in
the middle to simulate a contraction or saw-cut joint in the concrete pavement (Figures
3.3 and 3.4).
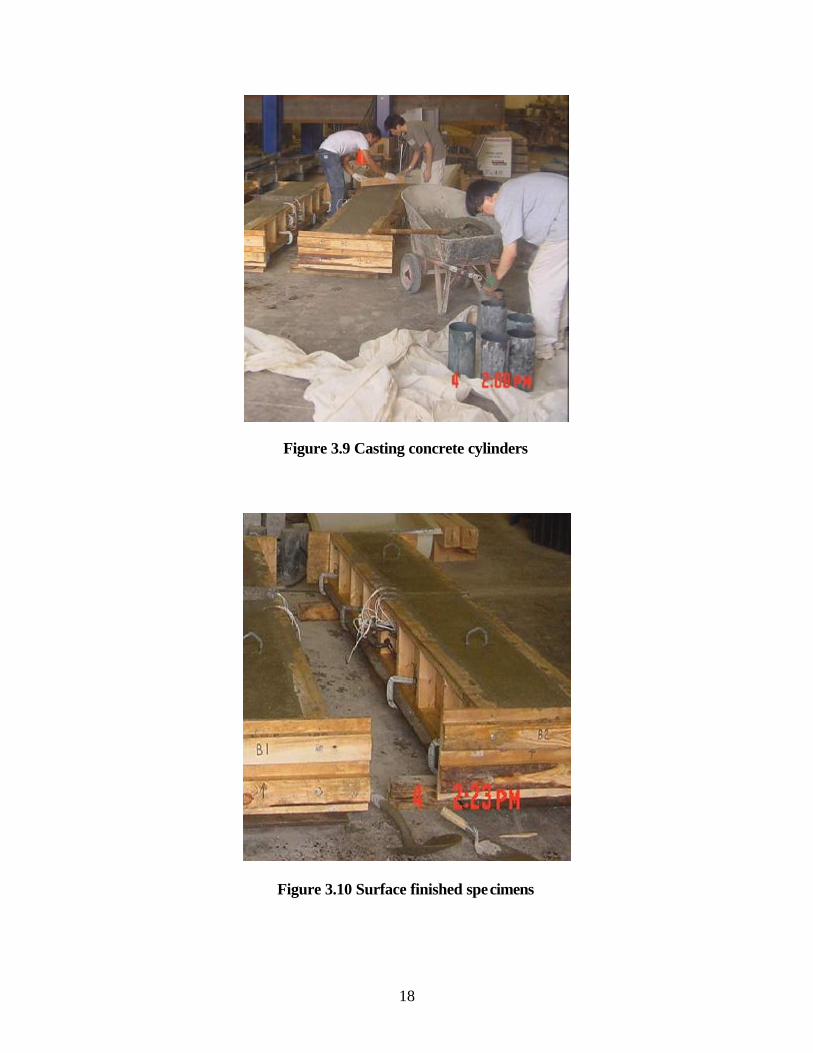
Class K concrete conforming to the WVDOT-DOH specification was used for
casting (Fig. 3.9). Concrete cylinders were simultaneously cast to obtain concrete
compressive strength. Twenty-four hours after casting the beams and cylinders, curing
was carried out using wet burlaps.
Figure 3.6 Instrumented dowels and steel plate positioned in the wood formwork

17
Figure 3.7 Placing concrete into formwork
Figure 3.8 Dowel being covered by concrete
18
Figure 3.9 Casting concrete cylinders
Figure 3.10 Surface finished specimens

19
3.4.1.3 Test Specimens
Two specimens with a dimension of 12”x12”x120” (Fig. 3.11) were cast for
preliminary tests. Only FRP dowels were used as load transfer devices in these two
specimens.
specimen is symmetrical about the joint plan (unit: inch)
12.00
FRP or steel dowel in the mid of joint
Joint of two slabs
60.00
3.75
0.25
12.00
6.0
Figure 3.11 Concrete slabs for preliminary tests
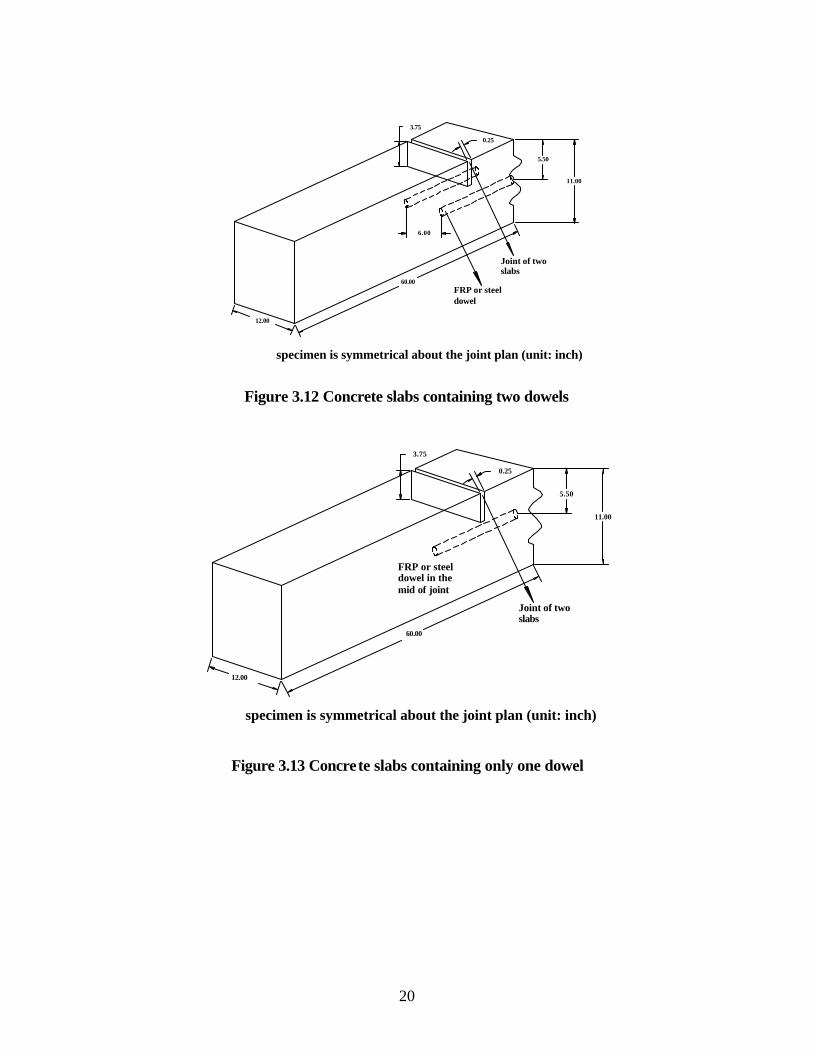
Five different concrete slabs were cast with FRP and steel dowels with different
spacings and diameters (Table 3.3). Two Embeddable Strain Gages were positioned
vertically on both sides of a dowel across the joint to measure concrete strain at loaded
side and unloaded side. Details of concrete specimens are provided in Figures 3.12 and
3.13 and Table 3.3.
20
specimen is symmetrical about the joint plan (unit: inch)
Joint of two slabs
6.00
FRP or steel dowel
3.75
11.00
5.50
0.25
60.00
12.00
Figure 3.12 Concrete slabs containing two dowels
FRP or steel dowel in the mid of joint
5.50
0.25
specimen is symmetrical about the joint plan (unit: inch)
12.00
60.00
Joint of two slabs
3.75
11.00
Figure 3.13 Concrete slabs containing only one dowel

21
Table 3.3 Dowel details in specimens
Specimen
#
Slab
Depth
(in.)
Dowel
Material
Dowel
Diameter
(in.)
Spacing
(in.)
Center to
center
Number of
dowel in
each
specimen
PG-1 FRP 1.5 Preliminary
Group PG-2 12”
FRP 1.5 12 1
1 Steel 1.0
2 FRP 1.0 Group 1
3
11
FRP 1.5
6 2
4 Steel 1.5 Group 2
5 11
FRP 1.5 12 1
3.4.2 Test Setup and Instrumentation
Jointed concrete slabs were placed on an aggregates base inside a wooden box to
simulate field conditions. The base was 16” high and 18” wide and 120” in length. The
modulus of subgrade reaction k was obtained from tests on this base through load
application on a standard steel plate (ASTM, 1986).
Pavement load was applied on one side of the joint (Figures 3.14 and 3.15) using
a 55 kip MTS hydraulic actuator through a controller. A 1/4- inch thick steel plate of
dimension (10”x16”) was connected to the actuator to simulate the load from a dual tire
wheel load. Additional neoprene pad was used between steel plate and concrete surface to
prevent any local damage during test. Two calibrated Linear Variable Differential

22
Transformers (LVDT) were used to measure joint deflections at loaded and unloaded side
of joint. Strain gages, LVDTs and load cell from the actuator were connected to a data
acquisition system to automatically record data during the tests.
Figure 3.14 Experimental set up

23
Figure 3.15 LVDTs positioned on both sides of the joint
3.4.2.1 Static Testing
Load was applied at different increments to simulate a HS 25 wheel load and/or
higher load. Deflections and strains were recorded automatically by data acquisition
system. Details of the load applied on different concrete slabs are shown in Table 3.5.
Table 3.4 Details of static testing
Specimen # Load Range
Slab #1 0-12.5 kips
Slab #2 0-12.5 kips
Slab #3 0-12.5 kips
Slab #4 0-11 kips
Slab #5 0-11 kips
24
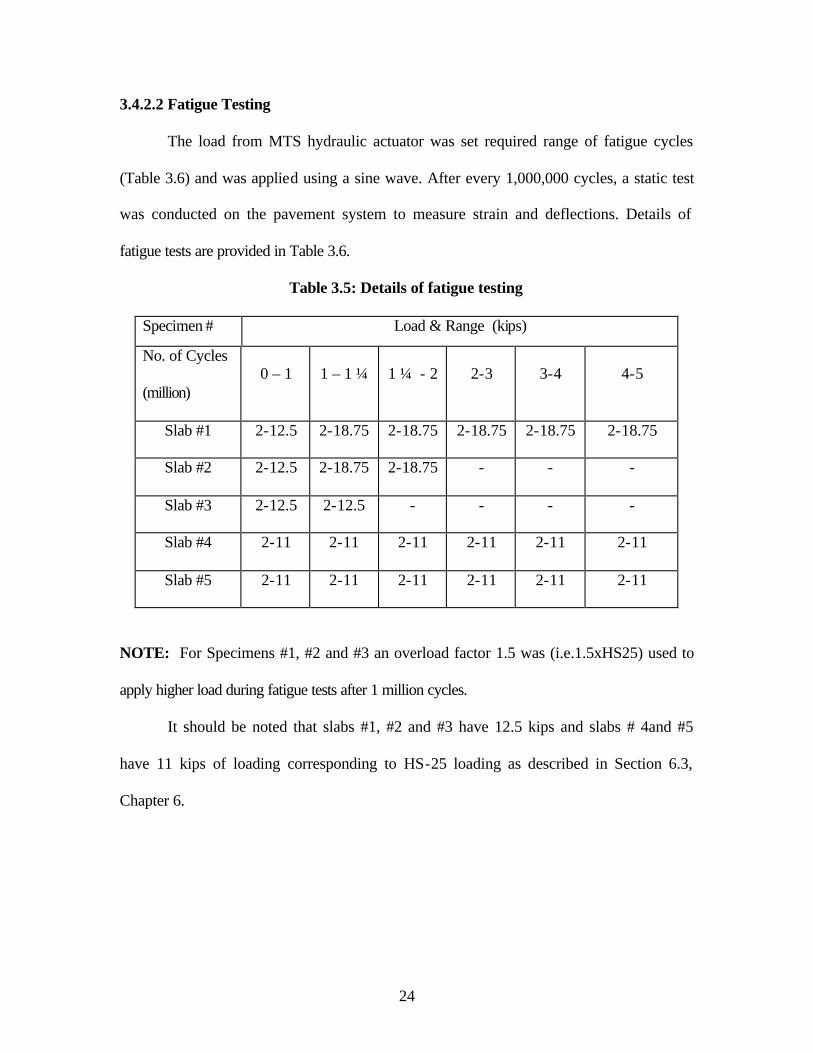
3.4.2.2 Fatigue Testing
The load from MTS hydraulic actuator was set required range of fatigue cycles
(Table 3.6) and was applied using a sine wave. After every 1,000,000 cycles, a static test
was conducted on the pavement system to measure strain and deflections. Details of
fatigue tests are provided in Table 3.6.
Table 3.5: Details of fatigue testing
Specimen # Load & Range (kips)
No. of Cycles
(million) 0 – 1 1 – 1 ¼ 1 ¼ - 2 2-3 3-4 4-5
Slab #1 2-12.5 2-18.75 2-18.75 2-18.75 2-18.75 2-18.75
Slab #2 2-12.5 2-18.75 2-18.75 - - -
Slab #3 2-12.5 2-12.5 - - - -
Slab #4 2-11 2-11 2-11 2-11 2-11 2-11
Slab #5 2-11 2-11 2-11 2-11 2-11 2-11
NOTE: For Specimens #1, #2 and #3 an overload factor 1.5 was (i.e.1.5xHS25) used to
apply higher load during fatigue tests after 1 million cycles.
It should be noted that slabs #1, #2 and #3 have 12.5 kips and slabs # 4and #5
have 11 kips of loading corresponding to HS-25 loading as described in Section 6.3,
Chapter 6.
25
Chapter 4
EXPERIMENTAL RESULTS AND DISCUSSION
4.1 Introduction
Experimental setup used in the Major Unit Laboratory was previously discussed in
Chapter 3. This chapter discusses the experimental results of five jointed concrete slabs with
FRP or steel dowels. Parameters evaluated in these tests under static and fatigue loads include:
• Load Transfer Efficiency (LTE)
• Relative Deflection (RD) between loaded and unloaded pavement
• Strain on dowels
Prior to discussing the above three parameters, joint crack patterns observed in our tests
are presented. Joint crack patterns have significant effect on Load Transfer Efficiency (LTE),
Relative Deflection and dowel strains.
Parameters of two preliminary tests conducted on two pavement slabs with FRP dowels
and actual main tests were listed in Table 4.1. Slabs with 6” spacing were placed in Group #1
whereas slabs with 12” spacing were placed in Group #2.

26
Table 4.1 Parameters of Dowel Groups
Group Slab
Center
To
Center
Spacing
(in.)
Number
of Dowel
In Slab
Concrete
Strength
(psi)
Dowel
Material
Dowel
Diameter
(in.)
PG-1 Preliminary
Group PG-2 12 1 3500 FRP 1.5
SLAB 1 FRP 1.0
SLAB 2 STEEL 1.0 GROUP
1 SLAB 3
6 2 4500
FRP 1.5
SLAB 4 FRP 1.5 GROUP
2 SLAB 5 12 1 4500
STEEL 1.5
4.2 Joint crack patterns observed in laboratory tests
Cracks in jointed plain concrete pavement specimens occurred at two locations. One was
right at the joint; the other was directly under the loading zone close to dowel edge. Figures 4.1
to 4.3 show three types of crack patterns observed in our tests (also refer to Table 4.2).
• Type I-crack occurred only in the joint (Figure 4.1)
• Type II-cracks occurred at joint and loading zone close to dowel edge. (Figure
4.2)
• Type III-crack occurred away from the joint at the dowel edge in the loading zone
(Figure 4.3)

27
Figure 4.1 Typical crack observed in Slabs #1, #4 and #5 (Table 4.1)
Figure 4.2 Crack observed in Slabs #2 (Table 4.1)

28
Figure 4.3 Typical crack observed in Slabs #3 (Table 4.1)
Table 4.2 Cracks in the tested slabs
Group # Specimen Dowel
Material
Concrete
Strength
(psi)
Dowel
Diameter/Spacing
(In.)
Number
of Dowel
in
Specimen
Crack
Pattern
PG-1 Preliminary
Group PG-2 FRP 3500 1.5 @ 12 c/c 1 I
SLAB 1 FRP 1.0 @ 6 c/c I
SLAB 2 STEEL 1.0 @ 6 c/c II GROUP
1 SLAB 3 FRP
4500
1.5 @ 6 c/c
2
III
SLAB 4 FRP I GROUP
2 SLAB 5 STEEL 4500 1.5 @ 12 c/c 1
I
From Table 4.2, specimens PG-1, PG-2, slabs 1, 4 and 5 have crack formation right at the
joint. In these cases, dowels provide maximum load transfer across the joints. This is the scenario
expected to occur in the field.

29
In slab #3, crack occurred at the loaded zone only, which means that the joint would not
have cracked and the crack occurred at loading plate edge away from the joint will act as a joint
for concrete to expand or contract under thermal variations. But the dowel will not transfer the
load or only a very small portion of applied load will be transferred across this crack. In slab #2,
cracks occurred at both joint and load zone locations.
The reason that cracks occurred away from mid-joint and under loading zone could
possibly be attributed to the uneven base surface under loaded side of slab. Because the slabs
were not cast directly on the aggregates as field construction method, when load was applied, the
uneven surface including possible gradients can cause enough stress concentration at dowel edge,
leading to concrete cracking prior to load transfer.
4.3 Preliminary Tests
Preliminary static tests on two slabs consisting of one 1.5” diameter FRP dowel at 12” c/c
were conducted. Load Transfer Efficiencies (LTEs) obtained from these static tests were both
greater than 90%, i.e., much higher than 60% of LTE as recommended by ACPA,
1991(corresponding to 75% of Joint Effectiveness, E)
4.4 Joint Deflections and Joint Load Transfer Efficiency (LTE)
Deflections of dowel-connected slabs were measured by using LVDTs positioned at both
loaded and unloaded side of joints. Load Transfer Efficiency (LTE) and Relative Deflections
(RD) were then calculated from measured deflections.

30
4.4.1 Joint Relative Deflection
4.4.1.1 Joint Relative Deflection of Group #1
4.4.1.1.1 Slab #1
Slab #1 consists of two 1.0” diameter FRP dowels with spacing of 6” (refer to Figs. 3.6
and 3.12, also refer to Table 4.2). Static tests were conducted according to Table 4.3. Relative
Deflection vs. applied load is shown in Figure 4.4.
Table 4.3 Static Load Applied for Specimen #1
Specimen # Load Range
1 0-12.5 kips
(Note: 12.5 kips was applied corresponding to HS25 load)
0.00
2.00
4.00
6.00
8.00
10.00
12.00
14.00
0.00000 0.00050 0.00100 0.00150 0.00200 0.00250
Relative Defelction (in.)
Loa
d (k
ips)
Figure 4.4 Joint Relative Deflection for slab #1 under static test
POINT CORRESPONDING
TO HS25 LOADING

31
After static testing, fatigue tests were conducted up to 5 million cycles (Table 4.4).
Figures 4.4 to 4.6 show the Relative Deflections obtained from tests. It should be noted that
18.75 kips (1.5×HS25 loading) was applied to the joint after 1 million cycles.
Table 4.4 Load Applied for Fatigue Tests on Slab #1
Slab Wave Shape Frequency (Hz) 0 – 1 Million Cycles 1 – 5 Million Cycles
#1 Sine 4.0 2-12.5 kips 2-18.75 kips
(Note: 12.5 kips was applied corresponding to HS25 load and 18.75 kips corresponds to 1.5
times HS25 load)
0.00000
0.00050
0.00100
0.00150
0.00200
0.00250
0.00300
0.00350
Rel
ativ
e D
efle
ctio
n (i
n.)
12.5 kips 0.00227 0.00330
static 1 M
Figure 4.5 Relative Deflections under HS25 loading for slab #1 at joint width of 0.25”
(Static and 1 Million Cycles)

32
0.00000
0.01000
0.02000
0.03000
0.04000
0.05000
0.06000
0.07000
0.08000
0.09000
Rel
ativ
e D
efle
ctio
n (in
.)
12.5 kips 0.01282 0.0479 0.0803
18.75 kips 0.01447 0.0516 0.0841
2 M 4M 5 M
Figure 4.6 Relative Deflections for slab #1 under fatigue tests (joint width increased from
0.25” to 0.4” from 2 to 5 million cycles)
Note: In Figure 4.6, 12.5 kips was corresponding to HS25 loading and was applied up to
1 million cycles; 18.75 kips was corresponding to 1.5 times HS25 loading was applied for
fatigue tests after 1 million cycles and up to 5 million cycles. Also, joint width increased from
0.25” to 0.4” during bin and slab repositioning. Thus, the relative deflections after 1 million
cycles due to increased joint width are much greater than those from static and 1 million cycle
tests (0.01282 in. at 2 million cycles vs. 0.0033 in at 1 million cycles.).
4.4.1.1.2 Slab #2
Slab #2 consisted of two one- inch diameter STEEL dowels with 6” spacing. Static test
was conducted on this slab with a load range 0-12.5 kips and crack formation was noticed at
dowel edge under lading plate.
Load vs. relative deflection are shown in Figure 4.7.

33
0.00
2.00
4.00
6.00
8.00
10.00
12.00
14.00
0.00000 0.00050 0.00100 0.00150 0.00200 0.00250 0.00300
Relative Deflection (in.)
Loa
d (k
ips)
Figure 4.7 Joint Relative Deflection for slab #2 under static test
After static testing, fatigue tests were conducted according to Table 4.5. Because cracks
occurred at locations away from joint, fatigue cycles up to 2 million were applied. Figure 4.8
shows Relative Deflections under fatigue tests.
Table 4.5 Load Applied for Fatigue Tests on Specimen #2
Slab Frequency (Hz) 0 – 1 Million Cycles >1 – 2 Million Cycles
#2 4.0 2-12.5 kips 2-18.75 kips
(Note: 12.5 kips was applied corresponding to HS25 load, 18.75 kips was corresponding to 1.5
times HS25 load)
POINT CORRESPONDING
TO HS25 LOADING

34
0.0000
0.0005
0.0010
0.0015
0.0020
0.0025
0.0030
0.0035
0.0040
0.0045
Rel
ativ
e D
efle
ctio
n (in
.)
12.5 kips 0.0026 0.0018 0.0040
18.75 kips 0.0040
static 1 M 2 M
Figure 4.8 Relative Deflections for Specimen #2 (0 to 2 million cycles)
It should be noted that when cracks occur away from middle joints, only a small portion
of load will be transferred across the joint.
4.4.1.1.3 Slab #3
Slab #3 consisted of two 1.5” diameter FRP dowels with spacing of 6”. Static deflections
were measured for a load range of 0-12.5 kips and the detail are shown in Figure 4.9. Crack
locations were away from the middle joint and hence fatigue tests were conducted up to only one
and a quarter million cycles (refer to Table 4.6).

35
0.00
2.00
4.00
6.00
8.00
10.00
12.00
14.00
0.0 0.0 0.0 0.0 0.0 0.0 0.0 0.0 0.0 0.0
Relative Deflection (in.)
Loa
d (k
ips)
Figure 4.9 Joint Relative Deflection for specimen #3 under static test
Figure 4.10 shows the Relative Deflections under fatigue tests.
Table 4.6 Load Applied for Fatigue Tests on Slab #3
Slab # Frequency (Hz) 0 – 1.25 Million Cycles
3 4.0 2-12.5 kips
POINT CORRESPONDING
TO HS25 LOADING

36
0.00000
0.00050
0.00100
0.00150
0.00200
0.00250
0.00300
0.00350
0.00400
0.00450
Rel
ativ
e D
efle
ctio
n (i
n.)
12.5 kips 0.00400 0.00160
static 1 and 1/4 M
Figure 4.10 Relative Deflections for Specimen #3 (0 to 1.25 million cycles)
Deviations observed in relative deflection values from slab #3 are due to crack formation
under loading plate at dowel edge.
4.4.1.2 Joint Relative Deflection of Group #2
4.4.1.2.1 Slab #4
Slab #4 consisted of one 1.5” diameter FRP dowel representing 12” spacing in actual
pavement. Static test was conducted in the range of 0-11 kips.
Load vs. relative deflection are shown in Figure 4.11.

37
0.0
2.0
4.0
6.0
8.0
10.0
12.0
0.0 0.0 0.0 0.0 0.0 0.0 0.0 0.0
Relative Deflection (in.)
Loa
d (k
ips)
Figure 4.11 Joint Relative Deflection for specimen #4 under static test
After static test, fatigue tests were conducted as per Table 4.7 up to 5 million cycles.
Figures 4.12 and 4.13 show pavement deflections and Relative Deflections under fatigue testing.
Table 4.7 Load Applied for Fatigue Tests on Specimen #4
Slab # Frequency (Hz) 0 – 5 Million Cycles
4 4.0 2-11.0 kips
POINT CORRESPONDING
TO HS25 LOADING

38
0.0
50.0
100.0
150.0
200.0
250.0
300.0
Def
lect
ion
(x0
.001
in.)
Loaded Side 280.0 52.0 52.0 51.0 37.0 39.0
Unloaded Side 251.0 29.0 27.0 22.5 18.0 22.0
static 1 M 2 M 3 M 4 M 5 M
Figure 4.12 Pavement deflections under fatigue test for Slab #4 (0 to 5 million cycles, FRP
dowel @12” c/c)
0.000
0.005
0.010
0.015
0.020
0.025
0.030
0.035
Rel
ativ
e D
efle
ctio
n
11.0 kips 0.029 0.0248 0.019 0.017
static 2 M 4 M 5 M
Figure 4.13 Relative Deflections under fatigue test for Specimen #4 (0 to 5 M)
Slab #4 was the first slab tested in laboratory. Base materials were compacted before
starting the test, but during laboratory fatigue cycles base materials under both side of slabs were
getting more compact and the deflections reduced (Figure 4.12). Similar trends were observed

39
under increased fatigues cycles in Figure 4.13. Modulus of subgrade reaction, k, was found to
have increased from 400 pci to 800 pci after 5 million fatigue cycles.
4.4.1.2.2 Slab #5
Slab #5 consisted of one 1.5” diameter STEEL dowel representing 12” spacing in the
pavement. Static test was conducted in the range of 0-11.0 kips. Fatigue tests were conducted as
per Table 4.8. Figure 4.14 shows the Load vs. relative deflection.
Table 4.8 Load Applied for Fatigue Tests on Slab #5
Slab # Frequency (Hz) 0 – 5 Million Cycles
5 4.0 2-11.0 kips
0
0.002
0.004
0.006
0.008
0.01
0.012
0.0 2.0 4.0 6.0 8.0 10.0 12.0
Load (kips)
Rel
ativ
e D
efle
ctio
n (i
n.)
Figure 4.14 Joint Relative Deflection for specimen #5 under static test
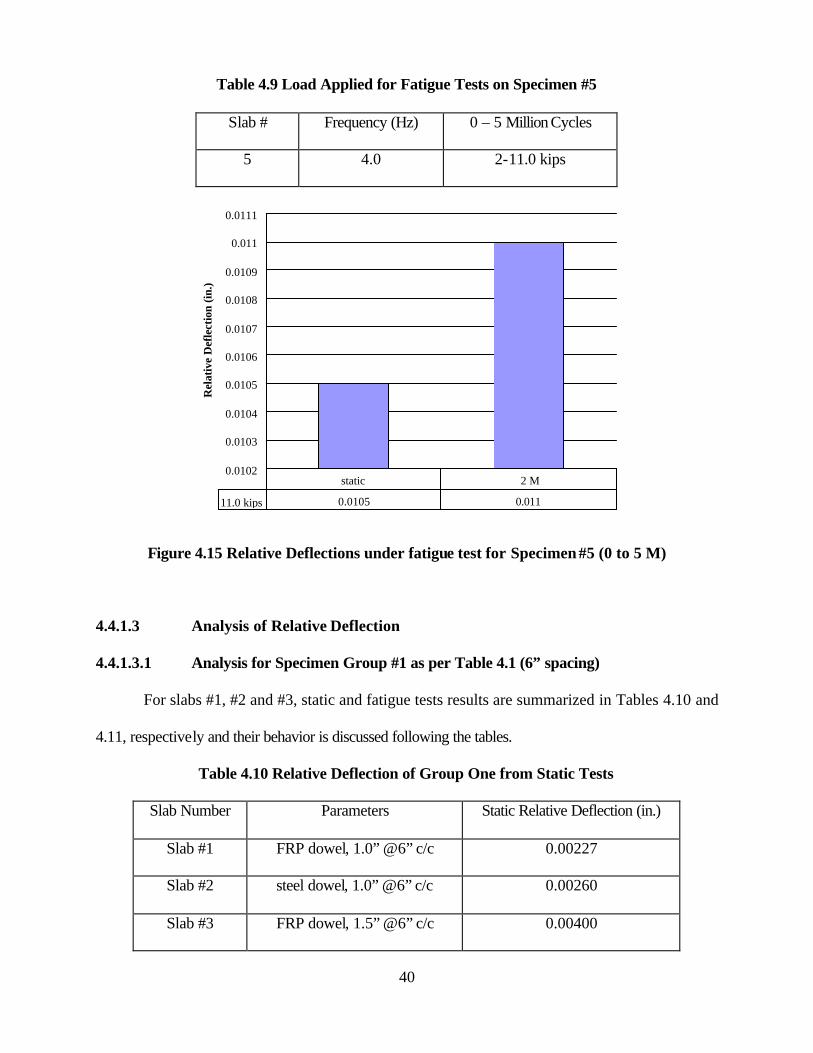
After static testing, fatigue tests were conducted up to 5 million cycles. Figure 4.15
shows Relative Deflections for slab #5 under fatigue tests.
POINT CORRESPONDING
TO HS25 LOADING
40
Table 4.9 Load Applied for Fatigue Tests on Specimen #5
Slab # Frequency (Hz) 0 – 5 Million Cycles
5 4.0 2-11.0 kips
0.0102
0.0103
0.0104
0.0105
0.0106
0.0107
0.0108
0.0109
0.011
0.0111R
elat
ive
Def
lect
ion
(in.)
11.0 kips 0.0105 0.011
static 2 M
Figure 4.15 Relative Deflections under fatigue test for Specimen #5 (0 to 5 M)
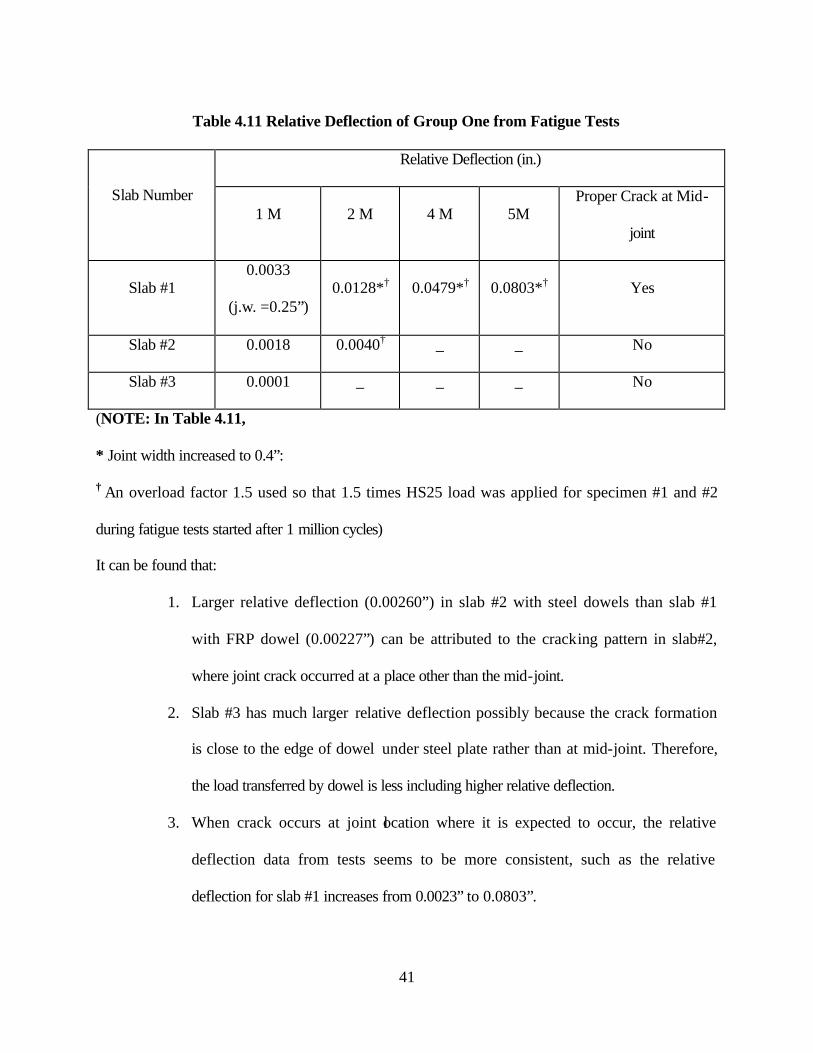
4.4.1.3 Analysis of Relative Deflection
4.4.1.3.1 Analysis for Specimen Group #1 as per Table 4.1 (6” spacing)
For slabs #1, #2 and #3, static and fatigue tests results are summarized in Tables 4.10 and
4.11, respectively and their behavior is discussed following the tables.
Table 4.10 Relative Deflection of Group One from Static Tests
Slab Number Parameters Static Relative Deflection (in.)
Slab #1 FRP dowel, 1.0” @6” c/c 0.00227
Slab #2 steel dowel, 1.0” @6” c/c 0.00260
Slab #3 FRP dowel, 1.5” @6” c/c 0.00400
41
Table 4.11 Relative Deflection of Group One from Fatigue Tests
Relative Deflection (in.)
Slab Number 1 M 2 M 4 M 5M
Proper Crack at Mid-
joint
Slab #1 0.0033
(j.w. =0.25”) 0.0128*† 0.0479*† 0.0803*† Yes
Slab #2 0.0018 0.0040† _ _ No
Slab #3 0.0001 _ _ _ No
(NOTE: In Table 4.11,
* Joint width increased to 0.4”:
† An overload factor 1.5 used so that 1.5 times HS25 load was applied for specimen #1 and #2
during fatigue tests started after 1 million cycles)
It can be found that:
1. Larger relative deflection (0.00260”) in slab #2 with steel dowels than slab #1
with FRP dowel (0.00227”) can be attributed to the cracking pattern in slab#2,
where joint crack occurred at a place other than the mid-joint.
2. Slab #3 has much larger relative deflection possibly because the crack formation
is close to the edge of dowel under steel plate rather than at mid-joint. Therefore,
the load transferred by dowel is less including higher relative deflection.
3. When crack occurs at joint location where it is expected to occur, the relative
deflection data from tests seems to be more consistent, such as the relative
deflection for slab #1 increases from 0.0023” to 0.0803”.

42
4. Experimental results on relative deflection are sensitive to supporting base
stiffness (k). It is suggested to consider the base property before and after each
fatigue test.
4.4.1.3.2 Analysis for Specimen Group #2 (12” spacing)
Test results are summarized in Tables 4.12 and 4.13.
Tables 4.12 Relative Deflection of Group Two from Static Tests
Slab Static Relative Deflection (in.) Proper Crack at Mid-
joint
Slab #4 (FRP dowel, 1.5” @12” c/c) 0.029 Yes
Slab #5 (steel dowel, 1.5” @12” c/c) 0.011 Yes
Tables 4.13 Relative Deflection of Group Two from Fatigue Tests
Relative Deflection (in.) Slab Number
2 M 4 M 5M
4 0.025 0.019 0.017
5 0.011 _ _

43
It is noted that:
1. Both slabs #4 and #5 had proper crack occurrence at the joint.
2. In static tests (Table 4.13), slab #4 (1.5” diameter FRP dowel) had a larger
difference in deflection between loaded and unloaded side of the pavement
(relative deflection)than slab #5 (1.5” diameter Steel dowel).
3. The relative deflection for both slabs reduced with progression of fatigue load
from 0 to 5 million cycles. This is partly attributed to compaction/settlement of
aggregate base underneath the pavement slabs with increasing fatigue cycles.
4. Relative deflection decreased more in slab with FRP dowel than with steel dowel,
which can be partly attributed to simulation in stiffness between FRP and concrete.
Benefits of these reductions may be more evident with freeze-thaw variations.
5. Experimental results on relative deflection are sensitive to supporting base
stiffness (k). It is found that the base property (modulus of subgrade reaction, k)
value changed from 400pci to 800 pci after 5 million fatigue cycles.
4.4.2 Joint Load Transfer Efficiency (LTE)
Joint Load Transfer Efficiency (LTE) was calculated from results of static and fatigue
tests by using equation (AASHTO, 1993)
%100×=L
U
dd
LTE (4.1)
The American Concrete Pavement Association (ACPA, 1991) gives joint effectiveness to
measure the performance of joints (ACPA, 1991).
%1002
×+
=UL
U
ddd
E (4.2)

44
ACPA (1991) recommends that a pavement joint is considered adequate if the
effectiveness is 75% or greater. However LTE and E are related by the following equation:
%100)12
2( ×−
−=
ELTE (4.3)
According to equation 4.3, a LTE of 60% corresponds to an E of 75%. When the value of
LTE is between 70% and 100%, the joint provides sufficient load transfer for heavy load.
4.4.2.1 Load Transfer Efficiency of Group #1
4.4.2.1.1 SLAB #1
96.50
97.00
97.50
98.00
98.50
99.00
99.50
100.00
100.50
0.00 2.00 4.00 6.00 8.00 10.00 12.00 14.00
Applied Load (kips)
Loa
d T
rans
fer
Eff
icie
ncy
(%)
Figure 4.16 Joint Load Transfer Efficiency for slab #1
POINT CORRESPONDING
TO HS25 LOADING

45
92.00
93.00
94.00
95.00
96.00
97.00
98.00
LT
E (%
)
12.5 kips 97.09 93.79
static 1 M
Figure 4.17 LTE corresponding to HS25-loading for slab #1 (1.0”diameter @ 6” c/c),
(Static and 1 Million Cycles)
0.00
10.00
20.00
30.00
40.00
50.00
60.00
70.00
80.00
90.00
100.00
LT
E (%
)
12.5 89.71 83.0248307 68.87589344 71.1566092
18.75 89.19 82.07792208 68.24615385 70.75799722
2 M 3 M 4 M 5 M
Figure 4.18 LTE for slab #1 under fatigue tests (>1 million cycles & joint width increased
from 0.25” to 0.4”)

46
Note: In Figure 4.18, 12.5 kips was corresponding to HS25 loading and was applied for
static test and 1 million cycles, 18.75 kips was corresponding to 1.5 times HS25 loading and was
applied for fatigue tests from 2 million to 5 million cycles. Also, joint width was intentionally
separated from to 0.25” to 0.4”.
In order to find the condition of interface between FRP dowel and concrete interface,
after 5 million cycles of HS25 and higher loading, slab #1 was separated by cutting FRP dowel.
Dowel-concrete interface was found to be in good shape with no visible micro cracks (Figure
4.19).
Figure 4.19 Dowel-concrete interface condition in slab #1 after 5 Million load cycles
Good condition after 5 million cycles of HS25 and higher loading
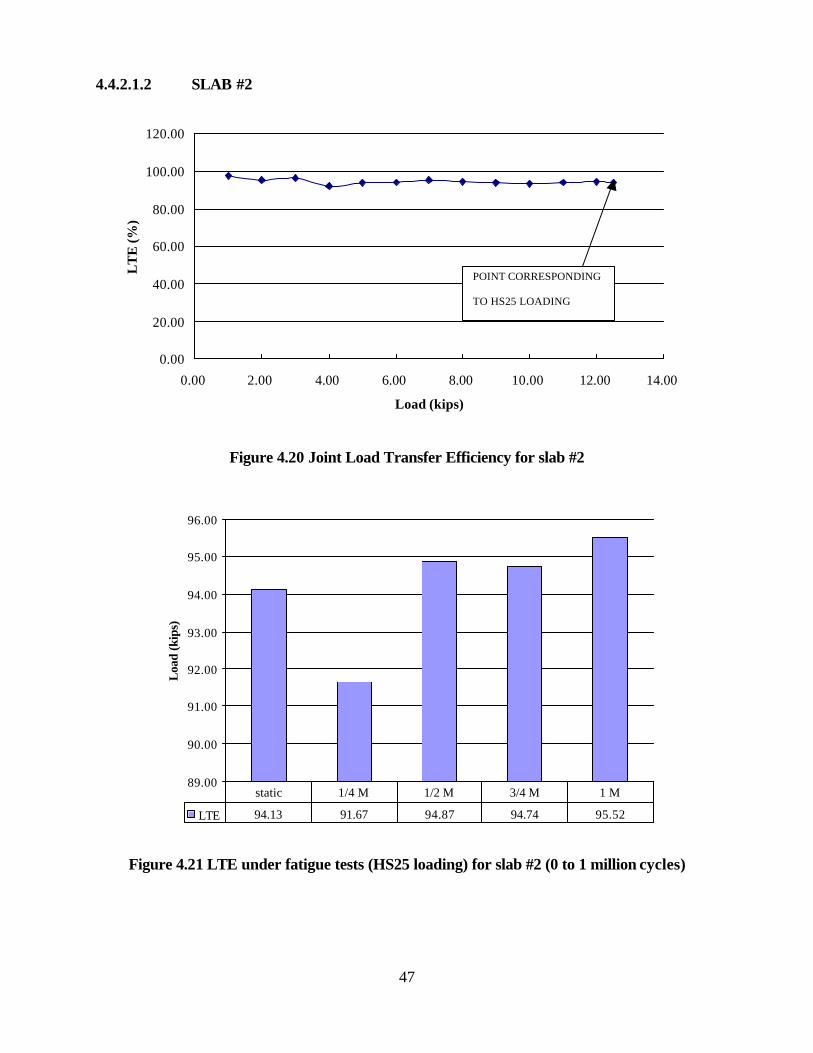
47
4.4.2.1.2 SLAB #2
0.00
20.00
40.00
60.00
80.00
100.00
120.00
0.00 2.00 4.00 6.00 8.00 10.00 12.00 14.00
Load (kips)
LT
E (%
)
Figure 4.20 Joint Load Transfer Efficiency for slab #2
89.00
90.00
91.00
92.00
93.00
94.00
95.00
96.00
Loa
d (k
ips)
LTE 94.13 91.67 94.87 94.74 95.52
static 1/4 M 1/2 M 3/4 M 1 M
Figure 4.21 LTE under fatigue tests (HS25 loading) for slab #2 (0 to 1 million cycles)
POINT CORRESPONDING
TO HS25 LOADING
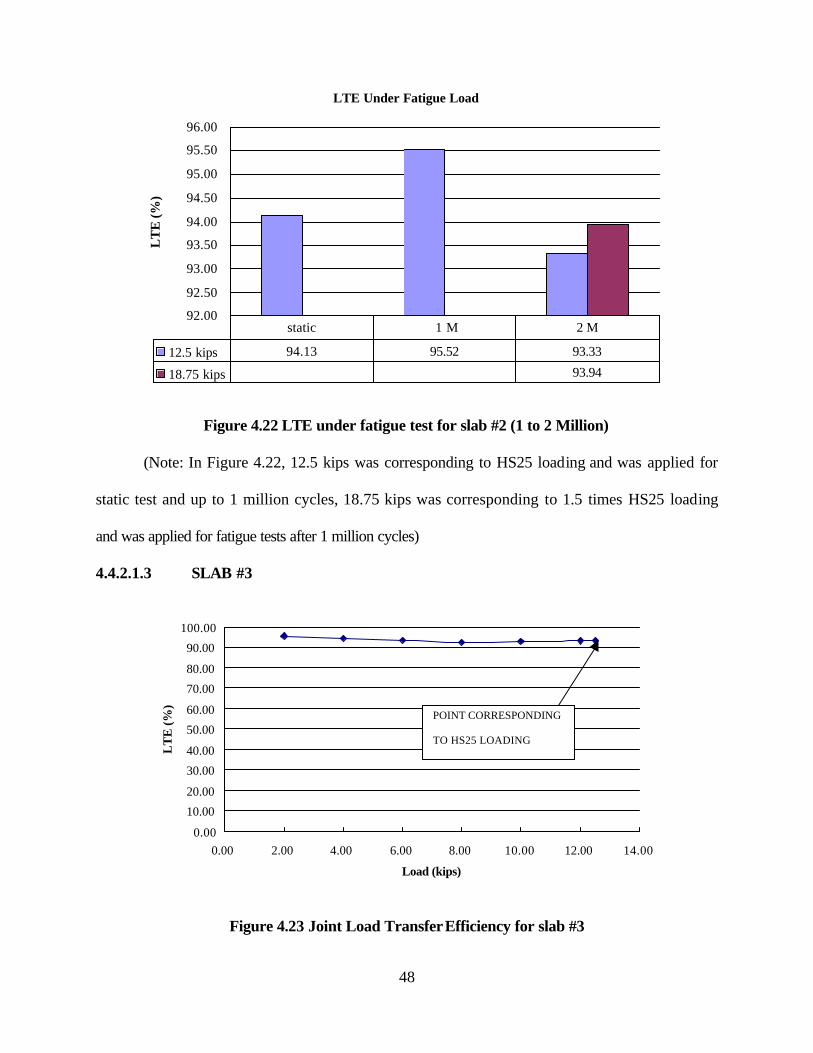
48
LTE Under Fatigue Load
92.00
92.50
93.00
93.50
94.00
94.50
95.00
95.50
96.00
LT
E (%
)
12.5 kips 94.13 95.52 93.33
18.75 kips 93.94
static 1 M 2 M
Figure 4.22 LTE under fatigue test for slab #2 (1 to 2 Million)
(Note: In Figure 4.22, 12.5 kips was corresponding to HS25 loading and was applied for
static test and up to 1 million cycles, 18.75 kips was corresponding to 1.5 times HS25 loading
and was applied for fatigue tests after 1 million cycles)
4.4.2.1.3 SLAB #3
0.00
10.00
20.00
30.00
40.00
50.00
60.00
70.00
80.00
90.00
100.00
0.00 2.00 4.00 6.00 8.00 10.00 12.00 14.00
Load (kips)
LT
E (%
)
Figure 4.23 Joint Load Transfer Efficiency for slab #3
POINT CORRESPONDING
TO HS25 LOADING
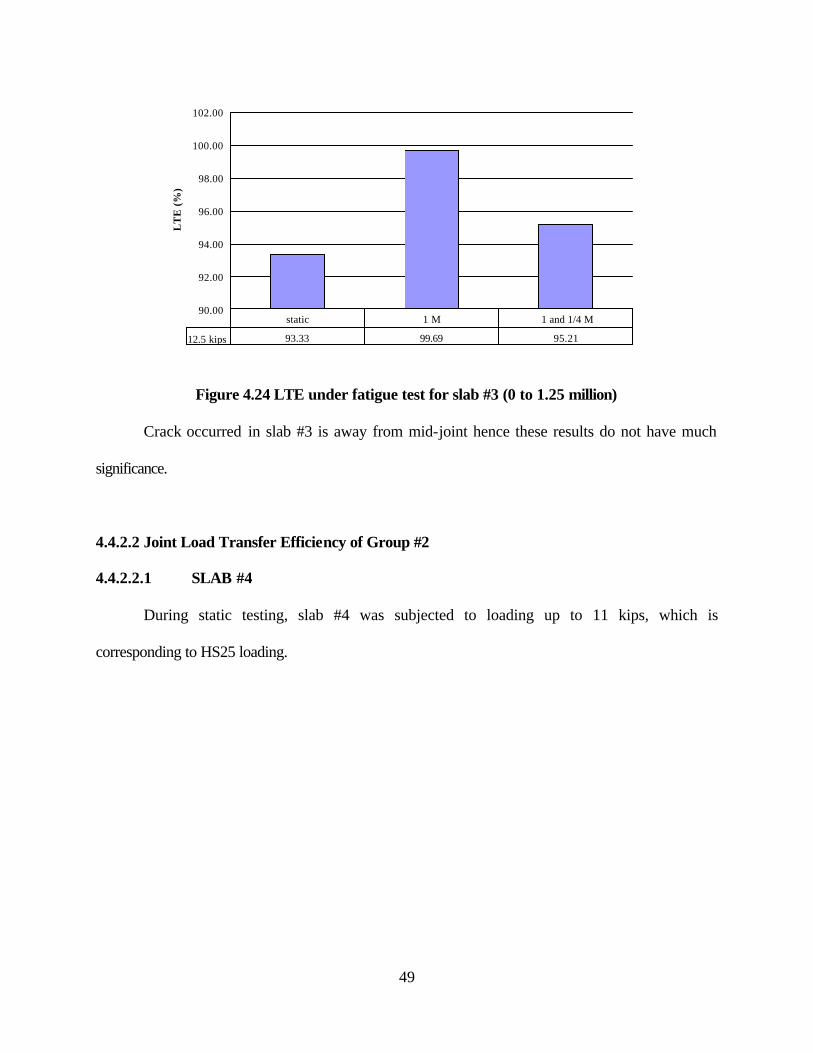
49
90.00
92.00
94.00
96.00
98.00
100.00
102.00
LT
E (
%)
12.5 kips 93.33 99.69 95.21
static 1 M 1 and 1/4 M
Figure 4.24 LTE under fatigue test for slab #3 (0 to 1.25 million)
Crack occurred in slab #3 is away from mid-joint hence these results do not have much
significance.
4.4.2.2 Joint Load Transfer Efficiency of Group #2
4.4.2.2.1 SLAB #4
During static testing, slab #4 was subjected to loading up to 11 kips, which is
corresponding to HS25 loading.
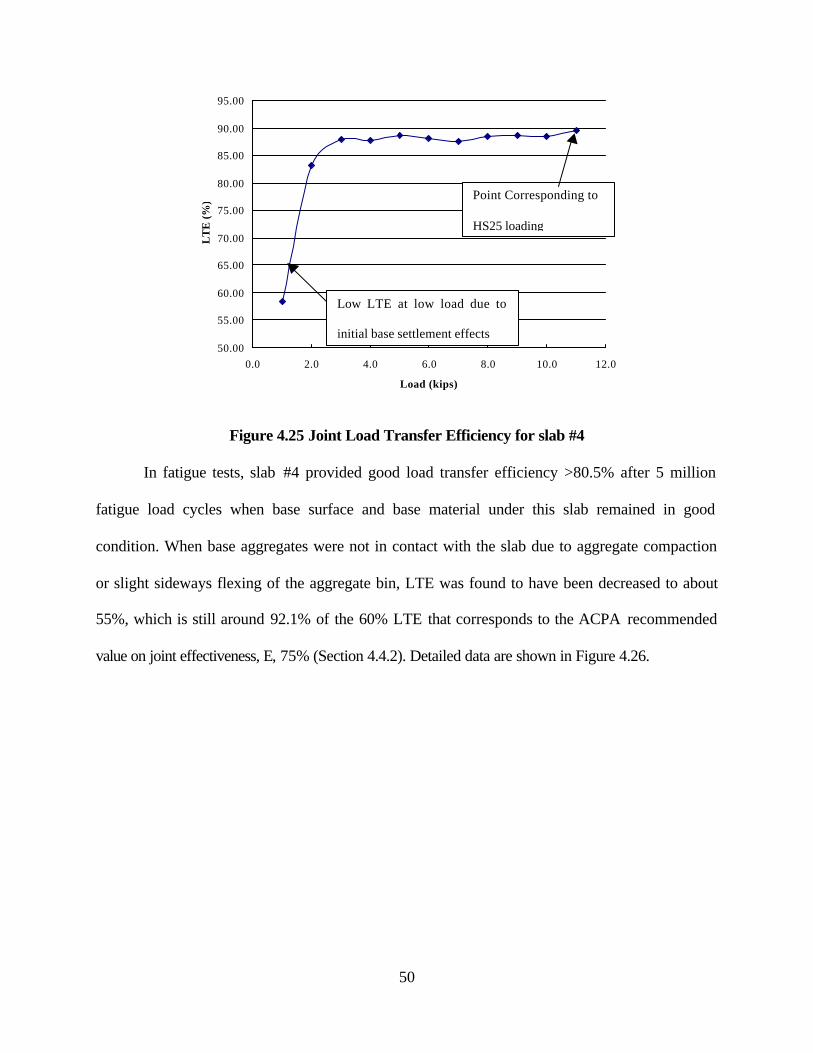
50
50.00
55.00
60.00
65.00
70.00
75.00
80.00
85.00
90.00
95.00
0.0 2.0 4.0 6.0 8.0 10.0 12.0
Load (kips)
LT
E (%
)
Figure 4.25 Joint Load Transfer Efficiency for slab #4
In fatigue tests, slab #4 provided good load transfer efficiency >80.5% after 5 million
fatigue load cycles when base surface and base material under this slab remained in good
condition. When base aggregates were not in contact with the slab due to aggregate compaction
or slight sideways flexing of the aggregate bin, LTE was found to have been decreased to about
55%, which is still around 92.1% of the 60% LTE that corresponds to the ACPA recommended
value on joint effectiveness, E, 75% (Section 4.4.2). Detailed data are shown in Figure 4.26.
Low LTE at low load due to
initial base settlement effects
Point Corresponding to
HS25 loading

51
0
10
20
30
40
50
60
70
80
90
100
LT
E (
%)
Good base condition 89.6 85.1 80.5
Poor base condition 89.6 50.7 55.26
static 2 M 5 M
Figure 4.26 LTE under fatigue test for slab #4 (0 to 5 million)
From Figure 4.26, LTE of slab #4 containing FRP dowel remained about 80% with good
base condition. With poor base condition LTE reduced from 88% to 55% (92.1% of the 60%
LTE, which corresponds to the ACPA recommended value on joint effectiveness, E, 75%). The
poor base condition was observed with concave surface on slab-base surface due to aggregate
compaction and base settlement. Also, it should be no ted that the slabs were not cast directly on
top of the aggregates, which leads to some aggregate repositioning under fatigue loading.
Modulus of subgrade reaction, k was found changed from 400 pci to 800 pci after 5 million
cycles in poor base condition.
In order to find the condition of interface between FRP dowel and concrete interface,
after 5 million cycles of HS25 and higher loading, slab #4 was separated by cutting FRP dowel.
Dowel-concrete interface was found to be in good shape with no visible micro cracks (Figure
4.27).

52
Figure 4.27 Dowel-concrete interface condition in slab #4 after 5 million load cycles
4.4.2.2.2 SLAB #5
50.00
55.00
60.00
65.00
70.00
75.00
80.00
85.00
90.00
95.00
5.5 6.5 7.5 8.5 9.5 10.5 11.5
Load (kips)
LT
E (
%)
Figure 4.28 Joint Load Transfer Efficiency (LTE) for slab #5
Point Corresponding to
HS25 loading
Good condition after 5 million cycles of HS25 and higher loading

53
89.3
89.4
89.5
89.6
89.7
89.8
89.9
90
90.1
90.2
90.3
LT
E (%
)
11 kips 89.64 90.21
static 2 M
Figure 4.29LTE under fatigue test for slab #5 (0 to 5 million)
4.4.2.3 Analysis and Discussion for Joint Load Transfer Efficiency
4.4.2.3.1 Analysis and Discussion for Slab Group #1 (6” spacing)
Tests results were summarized into Tables 4.14 and 4.15.
Tables 4.14 Load Transfer Efficiency of Group One from Static Tests
Slab LTE (%)
#1 97.79
#2 94.13
#3 93.33

54
Tables 4.15 Load Transfer Efficiency of Group #1 During Fatigue Tests
Load Transfer Efficiency (%) Specimen
Number 1 M 2 M 4 M 5M Proper Crack at Mid-
joint
1 93.79
(j.w. =0.25”) 89.71*† 68.88*† 71.57*† Yes
2 95.52 93.33† _ _ No
3 99.69 _ _ _ No
(NOTE: In Table 4.15,
* Joint width increased to 0.4”:
† An overload factor 1.5 used so that 1.5 times HS25 load was applied for specimen #1 and #2
during fatigue tests started from 2 million cycles)
It can be said that:
1. In static tests, all slabs provided good Load Transfer Efficiency, which was
greater than 60% of LTE (corresponding to 75% of joint effectiveness, E)
(ACPA). Slab #1 (1.0” diameter FRP dowel with 6” spacing) with proper crack
formation at mid-joint had a >90% Load Transfer Efficiency, which was slightly
larger than slabs #2 (1” diameter steel dowel with 6” spacing) and #3 (1.5”
diameter FRP dowel with 6” spacing). Slabs #2 and #3 had crack formation away
from mid-joint (Table 4.2). In slab #1, the dowel worked as per design to transfer
maximum load.
2. Even when 1.5 times design load (HS25 loading) and an influence of increased
joint width (increased from 0.25” to 0.4”) was considered, the observed TLE in
slab #1 was consistent (reduced from 93.79% to 71.57%) due to the right crack
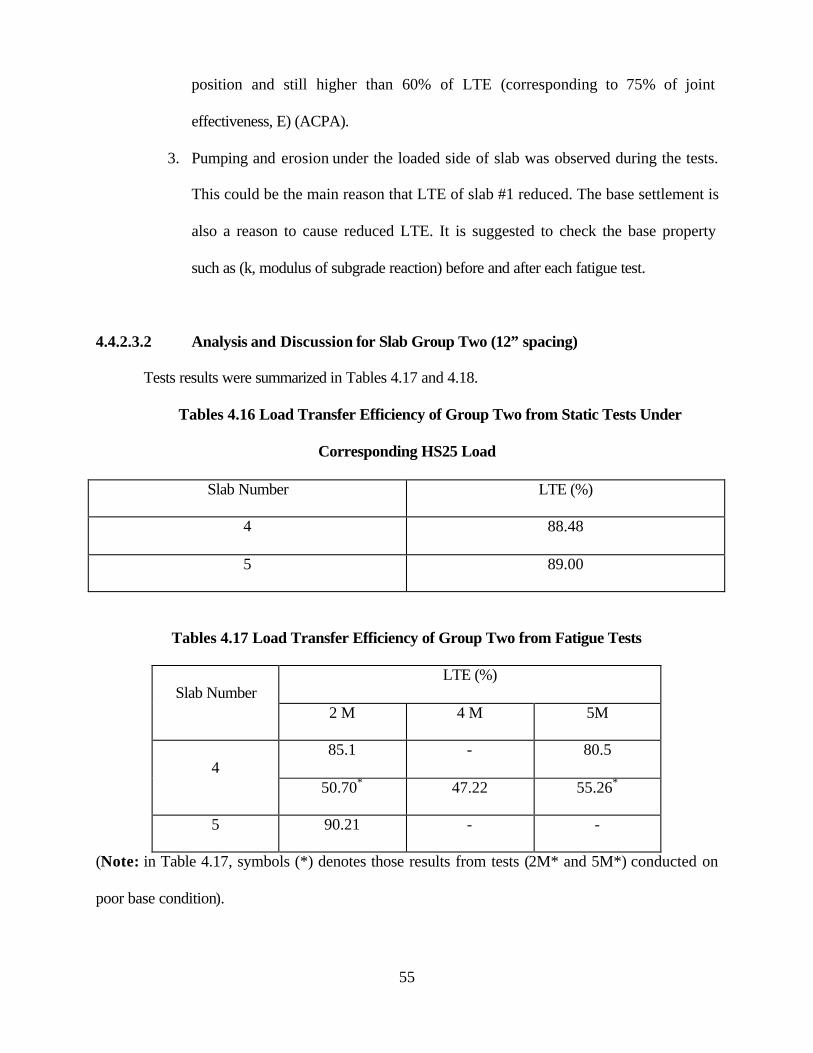
55
position and still higher than 60% of LTE (corresponding to 75% of joint
effectiveness, E) (ACPA).
3. Pumping and erosion under the loaded side of slab was observed during the tests.
This could be the main reason that LTE of slab #1 reduced. The base settlement is
also a reason to cause reduced LTE. It is suggested to check the base property
such as (k, modulus of subgrade reaction) before and after each fatigue test.
4.4.2.3.2 Analysis and Discussion for Slab Group Two (12” spacing)
Tests results were summarized in Tables 4.17 and 4.18.
Tables 4.16 Load Transfer Efficiency of Group Two from Static Tests Under
Corresponding HS25 Load
Slab Number LTE (%)
4 88.48
5 89.00
Tables 4.17 Load Transfer Efficiency of Group Two from Fatigue Tests
LTE (%) Slab Number
2 M 4 M 5M
85.1 - 80.5 4
50.70* 47.22 55.26*
5 90.21 - -
(Note: in Table 4.17, symbols (*) denotes those results from tests (2M* and 5M*) conducted on
poor base condition).
56
It can be found that:
1. Both slabs #4 and #5 had proper crack occurrence at the joint.
2. In static tests, both slabs had very good Load Transfer Efficiency (more than
88%), which were much greater than 60% of LTE (corresponding to 75% of joint
effectiveness, E) (ACPA). Thus, FRP dowel performed as well as steel dowel and
showed load transfer efficiency as good as steel dowel in static test.
3. After 2 million HS25 fatigue loading cycles, for same dowel diameter and spacing,
the concrete pavement containing FRP dowel provided slightly lower LTE
(85.1% vs. 90.21%) than pavement containing STEEL dowel (Table 4.17). But
with poor base condition, LTE of slab with FRP dowel over STEEL dowel is
(50.71% vs. 90.21%).
4. LTE of slab with FRP dowel remained >80% after 5 million loading cycles.
4.4.3 Investigations on Pavement Pumping Problem
Pumping is a common problem occurring in concrete pavements due to the movement of
material underneath the slab or ejection of material from underneath the slab as a result of water
pressure. Pumping will cause decreased structural support of the slab, which can lead to linear
cracking, corner breaks and faulting.
Two cases pumping tests were conducted (Figs 4.30 and 4.33). In case one, base material
under loaded side of slabs was removed for a 2 feet range to simulate the pumping problem
occurring in field (Figure 4.30). These tests were conducted only on slabs #4 (1.5” diameter FRP
dowel @ 12” c/c) and #5 (1.5” diameter steel dowel @ 12” c/c) up to 10 kips. Test results are
shown in Figures 4.31 and 4.32.

57
Figure 4.30 Case One-2 ft. Base Material Removal under Loaded Side of Slabs
-0.005
0
0.005
0.01
0.015
0.02
0.025
0.03
0.0 2.0 4.0 6.0 8.0 10.0 12.0
Load (kips)
Rel
ativ
e D
efle
ctio
n (
in.)
FRP (slab 4)stee (slab 5)
Figure 4.31 Relative Deflection for Pumping Tests (Case One-2 ft. base removal)

58
50.00
60.00
70.00
80.00
90.00
100.00
110.00
0.0 2.0 4.0 6.0 8.0 10.0 12.0
Load (kips)
LT
E(%
)
FRPsteel
Figure 4.32 Load Transfer Efficiency for Pumping
Tests (Case One-2 ft. Base Removal)
In case two, base material under each side of slabs was removed for a 1-foot range
(Figure 4.33). When loading exceeded 3 kips, joint opening closed and the two faces of the joint
bearing againsted each other. Hence, tests were conducted only on slabs #4 and #5 up to 3 kips in
case two. Test results are shown in Figure 4.34 and 4.35.
Figure 4.33 Case Two-1 ft. Base Material Removal under Both Sides of Slabs

59
0
0.002
0.004
0.006
0.008
0.01
0.012
0.014
0.016
0.018
Rel
ativ
e D
efle
ctio
n (in
.)
Relative Deflection 0.0165 0.0011
FRP steel
Figure 4.34 Relative Deflection for Pumping Tests under 3 kips loading (Case Two-1 ft.
base removal under both slabs)
88.00
90.00
92.00
94.00
96.00
98.00
100.00
LT
E (%
)
LTE 91.95 99.09
FRP steel
Figure 4.35 Load Transfer Efficiency for Pumping Tests under 3 kips loading (Case Two-1
ft. base removal under both slabs)
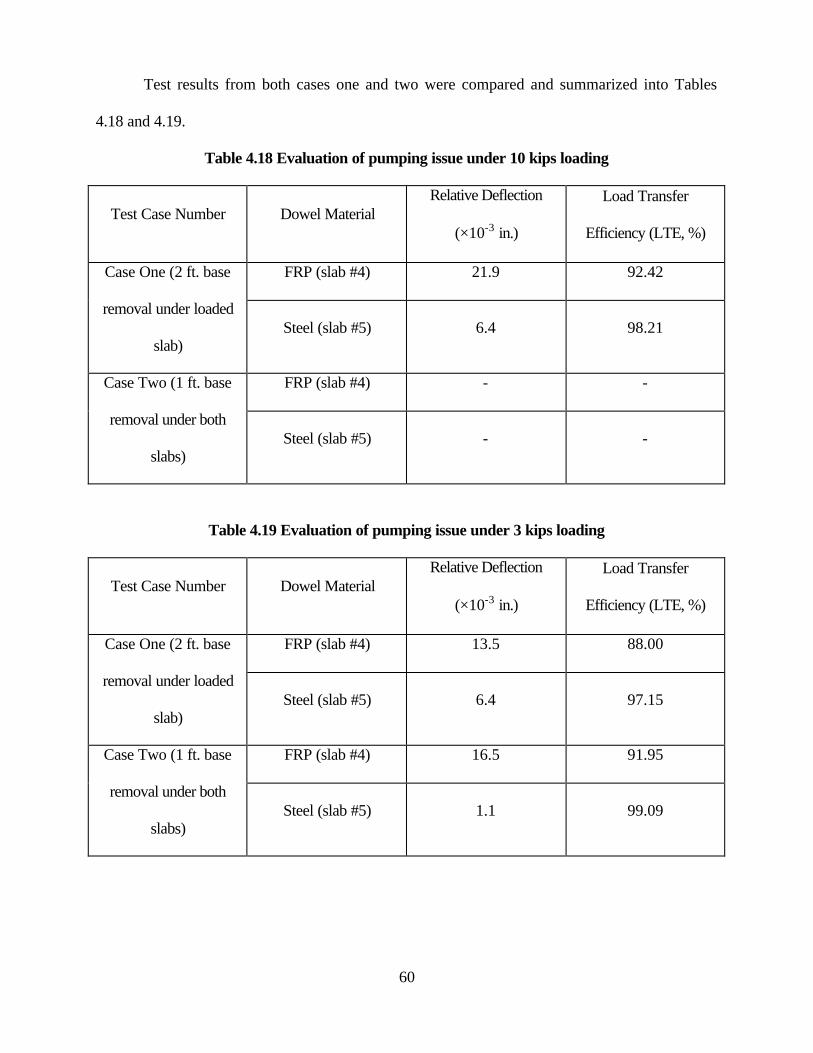
60
Test results from both cases one and two were compared and summarized into Tables
4.18 and 4.19.
Table 4.18 Evaluation of pumping issue under 10 kips loading
Test Case Number Dowel Material Relative Deflection
(×10-3 in.)
Load Transfer
Efficiency (LTE, %)
FRP (slab #4) 21.9 92.42 Case One (2 ft. base
removal under loaded
slab) Steel (slab #5) 6.4 98.21
FRP (slab #4) - - Case Two (1 ft. base
removal under both
slabs) Steel (slab #5) - -
Table 4.19 Evaluation of pumping issue under 3 kips loading
Test Case Number Dowel Material Relative Deflection
(×10-3 in.)
Load Transfer
Efficiency (LTE, %)
FRP (slab #4) 13.5 88.00 Case One (2 ft. base
removal under loaded
slab) Steel (slab #5) 6.4 97.15
FRP (slab #4) 16.5 91.95 Case Two (1 ft. base
removal under both
slabs) Steel (slab #5) 1.1 99.09
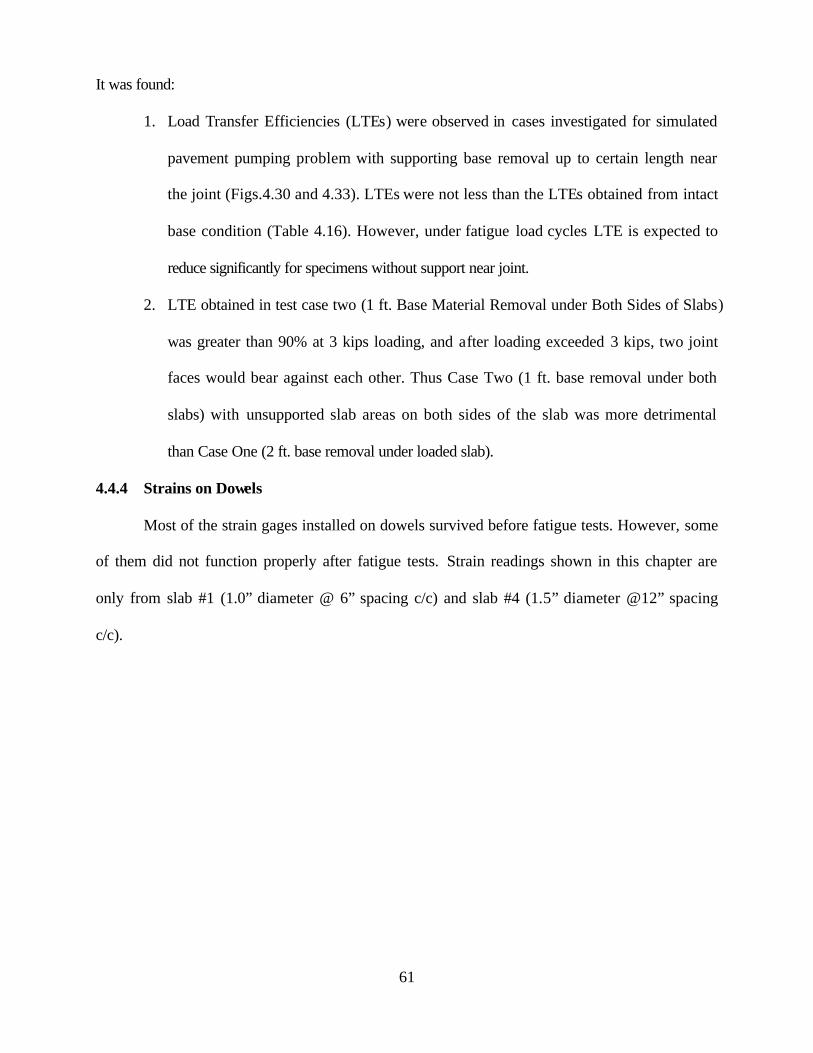
61
It was found:
1. Load Transfer Efficiencies (LTEs) were observed in cases investigated for simulated
pavement pumping problem with supporting base removal up to certain length near
the joint (Figs.4.30 and 4.33). LTEs were not less than the LTEs obtained from intact
base condition (Table 4.16). However, under fatigue load cycles LTE is expected to
reduce significantly for specimens without support near joint.
2. LTE obtained in test case two (1 ft. Base Material Removal under Both Sides of Slabs)
was greater than 90% at 3 kips loading, and after loading exceeded 3 kips, two joint
faces would bear against each other. Thus Case Two (1 ft. base removal under both
slabs) with unsupported slab areas on both sides of the slab was more detrimental
than Case One (2 ft. base removal under loaded slab).
4.4.4 Strains on Dowels
Most of the strain gages installed on dowels survived before fatigue tests. However, some
of them did not function properly after fatigue tests. Strain readings shown in this chapter are
only from slab #1 (1.0” diameter @ 6” spacing c/c) and slab #4 (1.5” diameter @12” spacing
c/c).
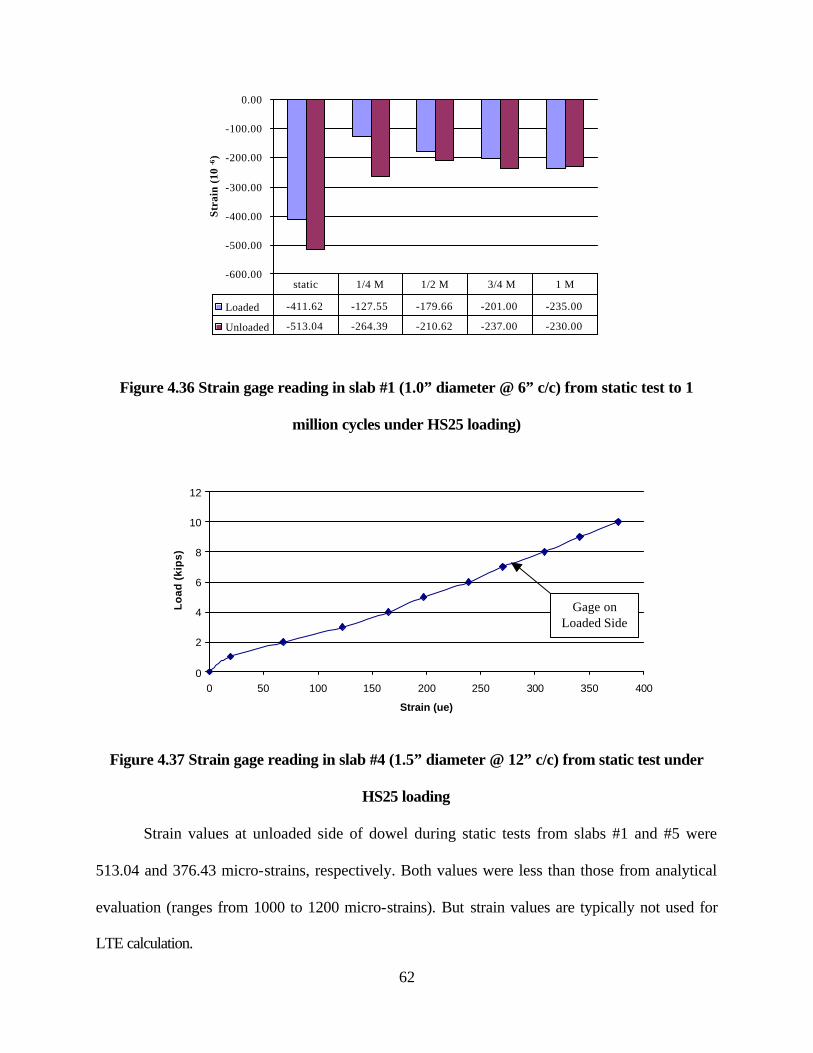
62
-600.00
-500.00
-400.00
-300.00
-200.00
-100.00
0.00
Stra
in (
10-6
)
Loaded -411.62 -127.55 -179.66 -201.00 -235.00
Unloaded -513.04 -264.39 -210.62 -237.00 -230.00
static 1/4 M 1/2 M 3/4 M 1 M
Figure 4.36 Strain gage reading in slab #1 (1.0” diameter @ 6” c/c) from static test to 1
million cycles under HS25 loading)
0
2
4
6
8
10
12
0 50 100 150 200 250 300 350 400
Strain (ue)
Lo
ad (
kip
s)
Figure 4.37 Strain gage reading in slab #4 (1.5” diameter @ 12” c/c) from static test under
HS25 loading
Strain values at unloaded side of dowel during static tests from slabs #1 and #5 were
513.04 and 376.43 micro-strains, respectively. Both values were less than those from analytical
evaluation (ranges from 1000 to 1200 micro-strains). But strain values are typically not used for
LTE calculation.
Gage on Loaded Side

63
Chapter 5
FIELD APPLICATIONS AND TEST RESULTS
5.1 Introduction
Experimental tests and results discussed in Chapter 4 have shown that FRP dowels can
provide sufficient Load Transfer Efficiency under heavy traffic load rating HS25 load and 1.5
times HS25. The purpose of our field test program is to investigate FRP dowel performance and
FRP-Concrete interaction in full-scale highway pavement slabs under realistic loading and field
exposure conditions.
Field application and tests were done in collaboration with Department of Highway
(DOH), West Virginia Department of Transportation (WVDOT). FRP dowels were used for new
pavement construction and rehabilitation of damaged pavement sections. FRP dowel joints were
used for new highway pavement construction in Rt.219 and Rt.33 East in Elkins, WV, during
September-November 2001. Field tests were conducted in July 2002 and June 2003. FRP dowels
were used for pavement rehabilitation at the junction of Rts. 119 and 857, University Avenue,
Morgantown, WV, during October 2002.
5.2 FRP Dowels Used for New Highway Pavement Construction
FRP dowels were used during the construction of new highway Rt.219 and Rt. 33 East in
Elkins, WV. The installation and field test setup are discussed in this section. Field test results
are also analyzed and discussed.

64
5.2.1 Field Locations and Installations
5.2.1.1 Field Locations
Two locations separated by about 4 miles were selected for field installations in corridor
H highway at Rt. 219 and Rt. 33 in Elkins, WV. Location 1 (Figures 5.1 &5.2) was West bound
and location 2(Figures 5.3 & 5.4) was East bound
Figure 5.1 Dowel installation at location 1 of corridor H, Rt. 250, Elkins, WV
Figure 5.2 FRP dowel positions at location 1 of corridor H, Rt. 250, Elkins, WV (Note:
Only dowels with shading are instrumented)

65
Figure 5.3 FRP dowel bars at location 2 of corridor H, Rt. 219, Elkins, WV
(Note: side pipes carry wires from instrumented dowels to outside of shoulder region)
Figure 5.4 FRP dowel positions at location No.2 of corridor H, Rt. 219, Elkins, WV
(Note: Only dowels with shading were instrumented)
1.5” diameter
1.0” diameter

66
5.2.1.2 Field Installation
FRP dowels were instrumented with strain gages (Figure 5.5) to monitor strains in dowel
bars installed in the field. Embeddable concrete strain gages (Figure 5.6) were also installed to
monitor strains in the pavement.
Dowel bars with 1.0” diameter (Figure 5.6) and 1.5” diameter (Figure 5.7) were
supported by plastic baskets at design spacings of 12, 9, 8 or 6 inches (Figures 5.2 & 5.4). Plastic
baskets were anchored by either steel (Fig. 5.6) or plastic stakes (Fig. 5.7).
Construction was carried out as shown in Figures 5.8 & 5.9. Wires from instrumented
dowels were carried through hollow PVC pipes to outside of pavement shoulder (Figure 5.9).
Figure 5.5 FRP dowel bars bonded with strain gages at loaded and unloaded side
Strain gages

67
Figure 5.6 Embeddable Concrete Strain Gage with dowels
Figure 5.7 FRP dowels in dowel basket
Expansion Cap Dowel Basket
Plastic stake
to hold basket
Embeddable
strain gage
Steel stake

68
Figure 5.8 Paving operation in progress
Figure 5.9 FRP dowel bars being covered by concrete
PVC pipe to carry away wires from dowels

69
5.2.2 Field Tests
Standard AASHTO Type-3 truck load (AASHTO, 1992) was used to carry out field
evaluation before and after opening pavement to the traffic (Figure 5.10). Strain gage readings
were recorded prior to and after pavement construction (November 2001), and also during the
field testing conducted in July 2002 and June 2003. Automatic data acquisition system was used
to collect test data.
5.2.2.1 Field Test Before Opening Highway To Traffic In July 2002
Field test was done before opening pavement to the traffic in July 2002. Static and
dynamic tests including brake tests were conducted during this test. Parameters used for field
testing are provided in Table 5.1.
70
Table 5.1 Parameters of the Field Test at location 2, July 2002.
Dowel Material FRP
Dowel Diameter 1.5”, 1.0”
fc’ 3500 psi
Dowel Spacing 12” (1.5” dia.), 9” (1.5” dia.), 8”(1.0” dia.), 6”(1.0” dia.)
Type of Loading
• Truck Type: AASHTO Type 3 (regular two-axle truck)
• Gross Weight: 50000 lbs (AASHTO), 53760 lbs (actual)
• Front Axel: 16000 lbs (AASHTO), 15780 lbs (actual)
• Rear Axel: 34000 lbs (AASHTO), 37980 lbs (actual)
• Wheel load: 8500 lbs (AASHTO), 9495 lbs (actual)
Types of Tests
• Static
• Dynamic: 10, 20, 30, 50mph
• Brake test (speed of 50 mph)
Instrumentations
Strain gages
Dial gages for measuring pavement deflection,
Data acquisition system,
Measurements Strain gage reading
Pavement deflection
Computation
Strain vs. Loading History
Load Transfer Efficiency (LTE)
Relative Deflection

71
5.2.2.1.1 Test Set Up
West Virginia State DOT truck with calibrated loads was used in the tests (Table 5.1).
The truck was positioned at required locations to apply load on instrumented dowels (Figures 5.4
& 5.10).
Loading test fro a joint consisted of guiding a truck slowly towards the designated joint
from about 50 feet distance. Unloading test for a joint consisted of guiding a truck initially
placed on the pavement joint to leave the joint slowly.
All strain gages on FRP dowels and embeddable concrete gages were connected to data
acquisition (Figure 5.11). Dial gages were fixed on a long adjustable stand system. Dial gages
were positioned according to the spacing of dowels (Figs. 5.1 to 5.4) at the pavement joint
considered for testing. Span of the dial gage stand system was long enough to support it on
adjacent pavement to avoid influence of support deflections. Strains in dowels and deflection of
pavement on loaded and unloaded side of the joint were recorded.
Figure 5.10 Dial gages for measuring pavement deflection under truck loading

72
Figure 5.11 Data acquisition system used for field test
5.2.2.1.2 Test Results And Analysis
5.2.2.1.2.1 Strain Data From Field Static Tests
About 60% of strain gages installed on FRP dowels were found to be working properly
after field installation and pavement construction. It was also found that some strain data
recorded by data acquisition system contained significant noise. Field test results of four cases of
FRP dowels were analyzed.
Joints with different diameters and spacing have been described in this section. Data for
brake tests and dynamic test from different vehicle speeds are included.
Performance of FRP dowels with different diameters and/or spacings chosen from the
field installation (Table 5.2) are discussed in next several sections with respect to the following:
• FRP 1.5” diameter @ 9” c/c (dowel A1)
• FRP 1.5” diameter @ 12” c/c (dowel A2)
• FRP 1.0” @ 6” c/c (dowel C5)
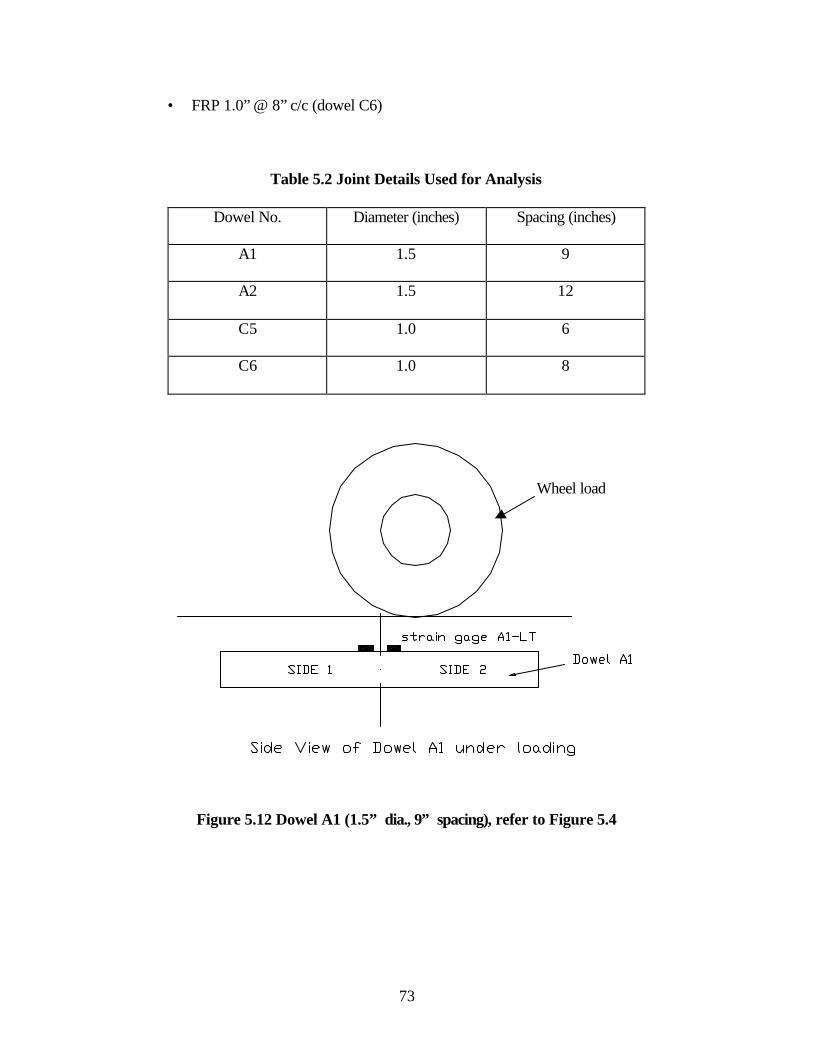
73
• FRP 1.0” @ 8” c/c (dowel C6)
Table 5.2 Joint Details Used for Analysis
Dowel No. Diameter (inches) Spacing (inches)
A1 1.5 9
A2 1.5 12
C5 1.0 6
C6 1.0 8
Figure 5.12 Dowel A1 (1.5” dia., 9” spacing), refer to Figure 5.4
Wheel load

74
-15
-10
-5
0
5
10
15
0 5 10 15 20 25 30
Loading Time (sec.)
Mic
ro-s
trai
n Loading
Unloading
Figure 5.13 Stains in dowel during Loading and Unloading cases for gage A1-LT (1.5” dia.,
9” spacing)
Figure 5.14 Dowel A2 (1.5” dia., 12” spacing), refer to Figure 5.4
Wheel load
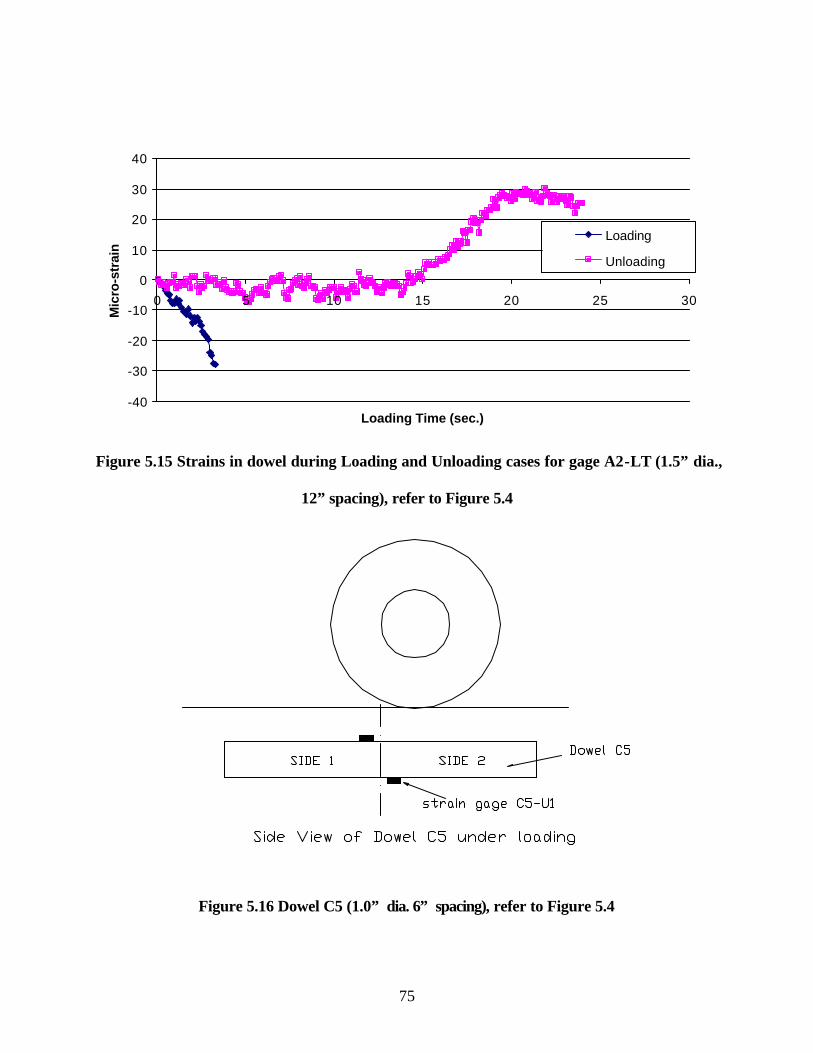
75
-40
-30
-20
-10
0
10
20
30
40
0 5 10 15 20 25 30
Loading Time (sec.)
Mic
ro-s
trai
n
Loading
Unloading
Figure 5.15 Strains in dowel during Loading and Unloading cases for gage A2-LT (1.5” dia.,
12” spacing), refer to Figure 5.4
Figure 5.16 Dowel C5 (1.0” dia. 6” spacing), refer to Figure 5.4

76
-4
-3
-2
-1
0
1
2
3
4
0 10 20 30 40 50 60 70
Loading Time (sec.)
Mic
ro-s
trai
n
Loding
Unloading
Figure 5.17 Strains in dowel during Loading case for gage C5-U1 (1.0” dia., 6” spacing),
refer to Figure 5.4
Figure 5.18 Dowel C6 (1.0” dia. 8” spacing), refer to Figure 5.4
Wheel load

77
-10
0
10
20
30
40
50
60
70
0 2 4 6 8 10 12 14 16
Loading Time (sec.)
Mic
ro-s
trai
n
Figure 5.19 Strains on dowel during Loading case for gage C6-U1 (1.0” dia., 8” spacing),
refer to Figure 5.4
5.2.2.1.2.2 Strain Data From Dynamic Tests
Dynamic tests were conducted in this field evaluation. Loaded WVDOT Truck with speeds of 10,
20, 30 and 50 mph crossed the selected joint containing instrumented FRP dowels. Data were
collected through automatic data acquisition system during truck speeding and braking of the
speeding truck at 30 mph close to joint. Test results are shown in Figures 5.20 and 5.21.

78
-4
-2
0
2
4
6
8
10
12
14
16
Time (sec.)
Str
ain
(M
icro
-str
ain
)
10 mph30 mph50brake test
Figure 5.20 Strain from gage A1-LT (1.5” FRP dowel @ 9” spacing) from dynamic tests
-40
-20
0
20
40
60
80
100
120
0 2 4 6 8 10 12 14 16 18
Time (sec.)
Str
ain
(Mic
ro-s
trai
n)
10 mph30 mph50 mphbrake test
Figure 5.21 Strain from gage A2-LT (1.5” FRP dowel @ 12” spacing) from dynamic tests
Dynamic test results recorded contained significant noise, and hence data are not further
discussed.

79
5.2.2.1.2.3 Analysis of Test Result
Figures (5.12 to 5.19) show changes in dowel strain near pavement joints during truck
loading and unloading. Stresses at points on individual dowel can also be obtained according to
the Stress-Strain relationship under bending. Table 5.3 is a summary of the above strain value.
Table 5.3 Summary of FRP Dowel Strain During Loading and Unloading
Maximum Strain (Micro-strain) Dowel No.
Dowel Diameter
(inches)
Dowel Spacing
(inches) Loading Unloading
A1 1.5 9 9 12
A2 1.5 12 31 29
C5 1.0 6 3 3
C6 1.0 8 60 N/A
It can be found from Table 5.3 that:
1. Change in strain value for the same dowel during loading and unloading cases is
almost same.
2. Effect of dowel spacing
• For FRP dowels (A1 and A2) with 1.5” diameter, dowel A2 with larger
spacing (12”) had bigger strain change of 31 µs than dowel A1 with 9” spacing
that had a strain change of 9 µs. Similarly, for FRP dowels C5 and C6 with same
1.0”diameter, the dowel C5 with smaller spacing (6”) showed small strain change
(3 µs vs. 60 µs) compared to C6 with 8” dowel spacing.
• Thus, decreasing the spacing by 25% (12” to 9” and 8” to 6”) resulted in more
number of dowels sharing the load within radius of relative stiffness (lr, Section
6.2.1) leading to 30% or higher strain reductions in dowels.
• For FRP dowels with 1.0” diameter (C5 and C6), spacing increase from 6” to
8” had higher influence on strain value change (3 µs vs. 60 µs) than the increase
80
of spacing from 9” to 12” in dowels (A1 and A2) with 1.5 diameters (9 µs vs. 31
µs).
• Dowels with different diameters and spacings cannot be compared to each
other with strain value only. Because FRP dowels act as a group, spacing and
diameter are both important factors for the group action. It should be also noted
that FRP dowel with smaller diameter typically have better mechanical properties
per unit area than larger diameter dowels due to shear lag effects. (Refer to
Chapter 6, Section 6.2.1).
5.2.2.1.2.4 Deflection Data
WVDOT truck was guided toward the pavement joint on top of chosen dowel location so
that heavier wheel load, which was located in the rear axles, could be applied. Pavement
deflections increased when the WVDOT truck slowly approached the joint. But most of the
deflection changes were less than the detectable range of dial gages with a least count of 0.001”.
In the second field test, Linear Variable Differential Transformers (LVDTs) were used for better
precision in deflection detection.
5.2.2.2 Field Test After Highway Opened To Traffic, June 2003
This field test was conducted about one year after opening the pavement to traffic. Test
parameters are listed in Table5.4, which are similar to those for the first field test, except that the
deflection measurements were done by using LVDTs and there were no dynamic/brake tests.
Main purpose of this field test was to investigate deflection behavior and Load Transfer
Efficiency of concrete pavement joints with different diameter and spacing of FRP dowel bars.
Figures 5.22 to 5.25 show details of field test set up.

81
Table 5.4 Parameters of the Field Test, June 2003
Dowel Material FRP
Dowel Diameter 1.5”, 1.0”
fc’ 3500 psi
Dowel Spacing 12”, 9”, 8”, 6”
Type of Loading AASHTO Type 3(regular two-axle truck) loaded truck,
similar to the one described in Table 5.1
Types of Tests Static
Instrumentations
Strain gages
LVDT for measuring pavement deflection
Data acquisition system
Measurements Pavement deflection
Strain
Computation Load Transfer Efficiency (LTE)
Relative Deflection
It should be noted that the wheel loads due to AASHTO HS25 is 20000 lbs, which is
about twice the DOT truck wheel load used for this test. Then larger deflections and strains can
be expected.

82
Figure 5.22 DOT truck used for field test
Figure 5.23 WVDOT truck positioned near a joint for test

83
Figure 5.24 Two LVDTs measuring pavement deflections across a joint
Figure 5.25 Measuring distance from tire to LVDTs (when loading is away from selected
dowel)

84
5.2.2.2.1 Test Results from Field Test
Four concrete pavement joints with instrumented dowels were tested during second field
test. Details of the joints and FRP dowels are shown in Table 5.3.
Table 5.5 Pavement joint for deflection analysis
Joint No. Dowel bar diameter
(in.)
Dowel bar spacing
(in.)
Data sets analyzed
3 1.5 12 2
2 1.5 9 2
5 1.0 8 1
6 1.0 6 1
Test result are shown in Figures 5.26 to 5.33 and further analyzed in Section 5.2.2.2
-0.0045
-0.0040
-0.0035
-0.0030
-0.0025
-0.0020
-0.0015
-0.0010
-0.0005
0.0000
0.0005
0.0010
0 5 10 15 20 25 30
Loading Time (sec)
Def
lect
ion
(in)
side 1
side 2
Fully loaded point:Deflection (in.): 0.0038 (loaded) 0.0031 (unloaded)Relative Deflection (in.): 0.0007LTE (%): 81.58%
Figure 5.26 Deflection on pavement joint No. 3 (with 1.5” dia. & 12” spacing FRP dowels)
under loading

85
-0.002
-0.001
0
0.001
0.002
0.003
0.004
5 10 15 20 25
Loading Time (sec)
Def
lect
ion
(in
)
Side 1Side 2
Fully unloaded point:Deflection (in.): 0.0035 (loaded) 0.0033 (unloaded)Relative Deflection (in.): 0.0002LTE (%): 94.29%
Figure 5.27 Deflection on pavement joint No.2 (with 1.5” dia. & 9” spacing FRP dowels)
under unloading
-0.0060
-0.0050
-0.0040
-0.0030
-0.0020
-0.0010
0.0000
0.0010
0.0020
33 43 53 63 73 83 93 103 113 123
Loading Time (sec)
Def
lect
ion
(in
)
side 1
side 2
Fully loaded point:Deflection (in.): 0.0056 (loaded) 0.0053 (unloaded)Relative Deflection (in.): 0.0003LTE (%): 94.64%
Figure 5.28 Deflection on pavement joint No.2 (with 1.5” dia. & 9” spacing FRP dowels)
under loading

86
-0.008
-0.006
-0.004
-0.002
0
0.002
0.004
0.006
0.008
20 30 40 50 60 70
Loading Time (sec)
Def
lect
ion
(in
)
Side 1
Side 2
Fully loaded pointDelfection (in.):0.0020 (loaded) 0.0019 (unloaded)Relative Deflection (in.): 0.0001LTE (%): 95.00%
Figure 5.29 Deflection on pavement joint No.5 (with 1.0” dia. & 8” spacing FRP dowels)
under loading
-0.0025
-0.002
-0.0015
-0.001
-0.0005
0
0.0005
0.001
0.0015
0.002
0 0.5 1 1.5 2 2.5 3
Loading Time (sec)
Def
lctio
n (in
)
Side 1
Side 2
Fully loaded pointDeflection (in.):0.0018 (loaded) 0.0017 (unloaded)Relative Deflction (in.): 0.0001LTE (%): 94.44%
Figure 5.30 Deflection on pavement joint No.6 (with 1.0” dia. & 6” spacing FRP dowels)
under loading

87
5.2.2.2.2 Summary and Analysis of Test Results
A summary of the test results shown in Figs. 5.26 to 5.30 is provided in Table 5.4 in
terms of pavement deflection, Load Transfer Efficiency (LTE) and Relative Deflection for
pavement joints having 1.5”and 1.0” diameter FRP dowels with different spacings of 12”, 9”, 8”
and 6”.
Table 5.6 Summary of joint deflection under maximum loading force
Pavement Deflection
(10-4 in.) Joint Number
(Dia.-Spacing) Refer to
Table Loaded side Unloaded side
Load Transfer
Efficiency
(LTE) (%)
Relative
Deflection
(10-4 in.)
Joint 3
(1.5” @ 12” c/c) 38 31 81.58 7
35 33 94.29 2 Joint 2
1st and 2nd
(1.5” @ 9” c/c) 56 53 94.64 3
Joint 5
(1.0” @ 8” c/c) 20 19 95.00 1
Joint 6
(1.0” @ 6” c/c) 18 17 94.44 1
Values in Table 5.4 cannot be compared to each other directly because in addition to
diameter and spacing, deflections depend on combination of other parameters such as base/sub-
base properties, contact area between concrete and base, etc. It should also be noted that truck
wheel load position on dowels embedded in concrete may vary from one dowel to the other.
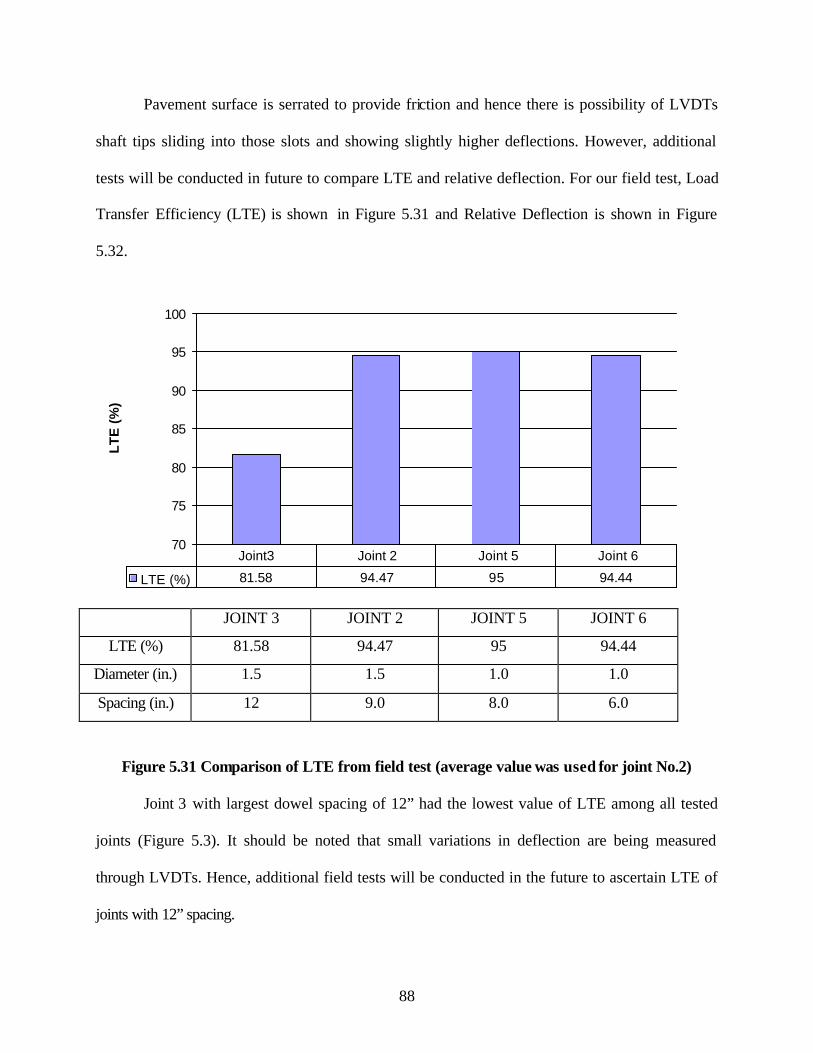
88
Pavement surface is serrated to provide friction and hence there is possibility of LVDTs
shaft tips sliding into those slots and showing slightly higher deflections. However, additional
tests will be conducted in future to compare LTE and relative deflection. For our field test, Load
Transfer Efficiency (LTE) is shown in Figure 5.31 and Relative Deflection is shown in Figure
5.32.
70
75
80
85
90
95
100
LT
E (
%)
LTE (%) 81.58 94.47 95 94.44
Joint3 Joint 2 Joint 5 Joint 6
JOINT 3 JOINT 2 JOINT 5 JOINT 6
LTE (%) 81.58 94.47 95 94.44
Diameter (in.) 1.5 1.5 1.0 1.0
Spacing (in.) 12 9.0 8.0 6.0
Figure 5.31 Comparison of LTE from field test (average value was used for joint No.2)
Joint 3 with largest dowel spacing of 12” had the lowest value of LTE among all tested
joints (Figure 5.3). It should be noted that small variations in deflection are being measured
through LVDTs. Hence, additional field tests will be conducted in the future to ascertain LTE of
joints with 12” spacing.

89
0
0.1
0.2
0.3
0.4
0.5
0.6
0.7
0.8
Rel
ativ
e D
efle
ctio
n (
x10-3
in.)
Relative Deflection 0.7 0.25 0.1 0.1
Joint 3 Joint 2 Joint 5 Joint 6
JOINT 3 JOINT 2 JOINT 5 JOINT 6
Relative Deflection (x10-3 in.) 0.70 0.25 0.10 0.10
Diameter (in.) 1.5 1.5 1.0 1.0
Spacing (in.) 12 9.0 8.0 6.0
Figure 5.32 Comparison of Relative Deflection from field test (average value was used for
joint 2)
Table 5.7 Comparing Joint 2 and Joint 3
Joint 2
(1.5” @9” c/c)
Joint 3
(1.5” @12” c/c)
Percentage of
Difference (%)
LTE 94.47 81.58 15.8
Relative Deflection (10-3 in.) 0.25 0.70 64.3

90
From the above results it can be observed that:
• Both 1.5” diameter FRP dowel group and 1.0” diameter FRP dowel group with
spacing varying from 12” to 6” provided very good Load Transfer Efficiency (LTE)
(greater than LTE of 60%, which is corresponding to ACPA’s 75% joint effectiveness
value).
• For dowel groups in pavement joints 2 and 3 that have same dowel diameter (1.5”),
joint 2 with smaller dowel spacing (9”) had higher Load Transfer Efficiency (94%) than
that provided by joint 3 with 12” dowel spacing (81.58%). Additional tests will be
conducted on other joint locations.
• Joint 2 with 9” dowel spacing had smaller Relative Deflection (0.25 x 10⁻³ in.) than
joint 3 with 12” dowel spacing (0.70 x 10⁻³ in.) for dowel diameter of1.5”.
• Joint 2 with 9” of spacing) provided 15.4% increase in Load Transfer Efficiency
(LTE) in addition to 64.3% reduction in Relative Deflection than Joint 3 with 12” spacing
for dowel diameter of 1.5” (refer to Table 5.5).
• For pavement joint 5 and 6 (with 1.0” dowel diameter, 8.0” and 6.0” dowel spacing,
respectively), the Load Transfer Efficienc ies were very close (95% and 94.44%). Relative
joint deflections were also identical (1 x 10⁻³ in.).
• Currently, there is no requirement or limitation for the Relative Deflection from
AASHTO’s Guide for Pavement Design.
5.3 FRP Dowels Used for Highway Pavement Rehabilitation
FRP dowels were used for pavement rehabilitation at the junction of Rts. 119 and 857,
University Avenue, Morgantown, WV. Two joints were selected; one with 1.5” diameter FRP

91
dowels 12” c/c spacing, the other with 1.5” diameter steel dowel at 12” c/c. Dowel installation
and field test setup are discussed in this section. Test results from both FRP and steel dowels are
analyzed and discussed in subsection of 5.3.1.
5.3.1 Field Location and installation
5.3.1.1 Field Location
Two joints were selected for rehabilitation of an existing pavement near junction of Rts.
119 and 857, University Avenue, Morgantown, WV as shown in Fig. 5.33. Rehabilitation was
carried out during October 2002.
Figure 5.33 Locations of FRP and Steel doweled pavement joints
5.3.1.2 Field Installation
Deteriorated concrete slabs were cut by special concrete Saw-Cutting machine, and then
lifted out. 1.5” diameter holes were drilled through the concrete slabs up to 9” deep (half of
dowel length). Each pavement joint consisted of eleven 1.5”-diameter dowels spaced at 12” c/c.
Two joints were selected for this study

92
Each joint was provided with two instrumented dowels each. Strain gages were bonded onto both
top and bottom surfaces of those dowels prior to installation. Strain gages were about ½” away
from the centerline of joint.
After positioning dowels in the drilled holes, epoxy resin was filled into the
circumferential gap between concrete and dowel. Rehabilitation carried out using FRP and steel
dowels is shown in Figs. 5.34 to 5.37.
Figure 5.34 Drilling holes for inserting dowels
Figure 5.35 FRP dowels in position
Traffic Direction
Dowel A Dowel B

93
Figure 5.36 Steel dowels in position
Figure 5.37 Concrete placement and vibration
Traffic Direction
Dowel C Dowel D

94
5.3.2 Field Tests
5.3.2.1 Test Setup
Standard truck load was not used for field loading purpose. Strain reading due to regular
traffic (Fig. 5.33) including some loaded trucks driving at 25 to 40 miles per hour were recorded
using automatic data acquisition system. Due to the heavy traffic volume existing at this road
section, pavement deflection measurement was not recorded.
Figure 5.38 Data acquisition recording strain readings
5.3.2.2 Results and Analysis
Both strain gages were installed in vehicle approaching side (Figs 5.35 to 5.37) of the
pavement joint. Hence, before a vehicle wheel crossed the joint, strain gage side of the joint
remained loaded side and right after the wheel crossed a joint, strain gage side became unloaded
side.
Strain readings due to a truck load from regular traffic are shown in Figures 5.39 and 5.40.
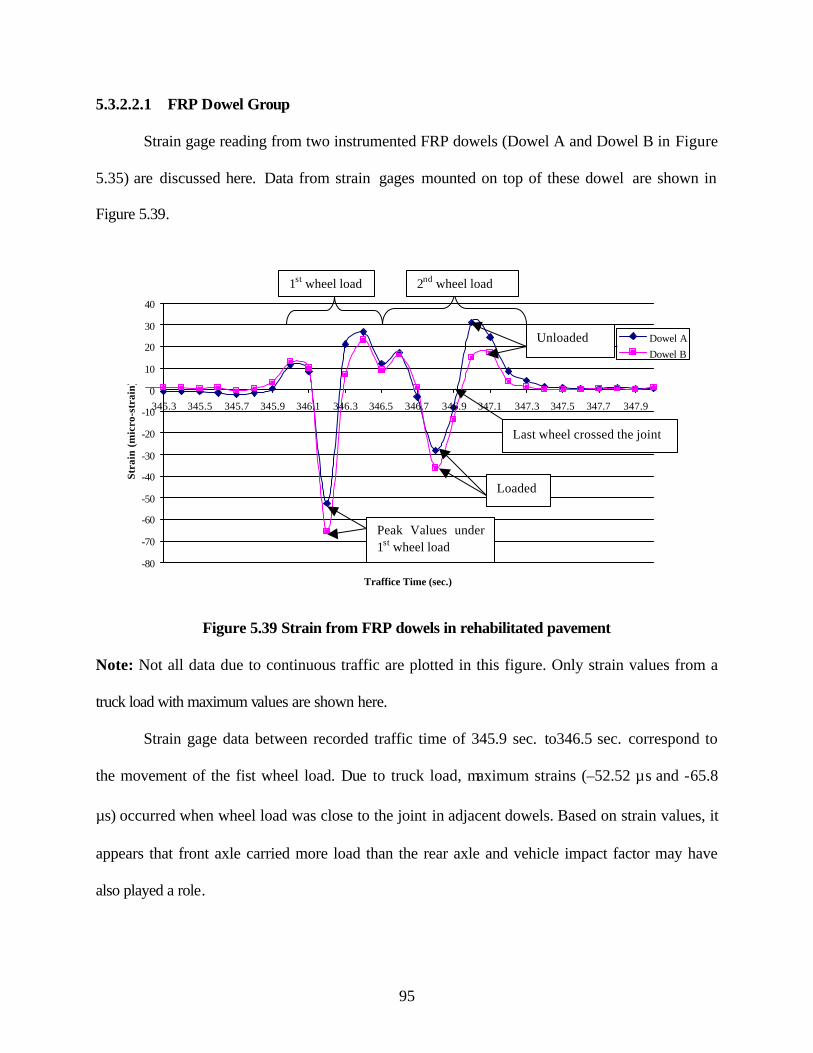
95
5.3.2.2.1 FRP Dowel Group
Strain gage reading from two instrumented FRP dowels (Dowel A and Dowel B in Figure
5.35) are discussed here. Data from strain gages mounted on top of these dowel are shown in
Figure 5.39.
-80
-70
-60
-50
-40
-30
-20
-10
0
10
20
30
40
345.3 345.5 345.7 345.9 346.1 346.3 346.5 346.7 346.9 347.1 347.3 347.5 347.7 347.9
Traffice Time (sec.)
Stra
in (
mic
ro-s
trai
n)
Dowel ADowel B
Figure 5.39 Strain from FRP dowels in rehabilitated pavement
Note: Not all data due to continuous traffic are plotted in this figure. Only strain values from a
truck load with maximum values are shown here.
Strain gage data between recorded traffic time of 345.9 sec. to346.5 sec. correspond to
the movement of the fist wheel load. Due to truck load, maximum strains (–52.52 µs and -65.8
µs) occurred when wheel load was close to the joint in adjacent dowels. Based on strain values, it
appears that front axle carried more load than the rear axle and vehicle impact factor may have
also played a role.
Last wheel crossed the joint
Peak Values under 1st wheel load
Unloaded
Loaded
1st wheel load 2nd wheel load

96
Strain gage data between recorded traffic time of 346.7 sec. to 347.5 sec. correspond to
the movement of last wheel load crossing the joint. During this time period, gages from FRP
dowels A and B experienced a strain change from loaded status (–28.17 µs and -36.24 µs) to
unloaded status (31.04 µs and 17.16 µs), respectively. The total strain change is 59.21
(28.17+31.04) µs for dowel A and 53.4 (36.24+17.16) µs for dowel B. The ratio of unloaded
value to loaded value is 31.04/28.17=1.10 (dowel A) and 17.16/36.24=0.47 (dowel B). These
ratios indicate possibility of the wheel loads crossing at an angle over the dowel. It should be
noted that the pavement is on an upward gradient with respect to traffic direction.
5.3.2.2.2 Steel Dowel Group
Strain gage readings from one instrumented steel dowel (Dowel C in Figure 5.36) are
discussed here. Data from strain gage mounted on top of this dowel are shown in Figure 5.40.
-25
-20
-15
-10
-5
0
5
10
15
151 151.2 151.4 151.6 151.8 152 152.2 152.4
Traffic Time (sec.)
Stra
in (m
icro
-str
ain)
Dowel C
Figure 5.40 Strain from steel dowel in rehabilitated pavement
Note: Not all data due to continuous traffic are plotted in this figure. Only strain values in dowel
C from a truck load with maximum values are shown here.
Unloaded
Loade
Peak value under 1st wheel load
2nd wheel load 1st wheel load

97
Strain gage data between traffic time 151.2 sec. to 151.6 sec. correspond to the movement
of the first wheel load crossing the joint. Maximum compressive strains occurred at the
beginning of the load, which was –11.49 µs, which may partly include vehicle impact effect.
Strain gage data between traffic time 151.8 sec. to 152.2 sec. correspond to the movement
of last wheel load crossing the joint. During this time period, gages from steel dowels C
experienced a strain change from loaded status (–8.14 µs) to unloaded status (12.93 µs),
respectively. The total strain change is 21.07 (8.14+12.93) µs for dowel C. The ratio of unloaded
value to loaded value is 12.93/8.14=1.59 (dowel C). Following factors contribute to this ratio of
unloaded/loaded strain >1, where readings appear to be from those vehicles just beginning to
accelerate from their stopped position near traffic lights at junction.
• Pavement rehabilitated with dowels was situated on an upward gradient.
• Dowels on the upward portion of the joint were bonded to the concrete with
epoxy.
5.4 Conclusion
From both the first and the second field tests conducted on the newly constructed
highway in Elkins, WV (see Chapter 5.2), it is concluded that:
1. Change in strain value for the same dowel during loading and unloading cases is
almost same.
2. Effect of dowel spacing
• For dowel groups in pavement joints 2 and 3 that have same dowel diameter
(1.5”), joint 2 with smaller dowel spacing (9”) had higher Load Transfer
Efficiency (94%) than that provided by joint 3 with 12” dowel spacing (81.58%).
This is attributed to the smaller dowel spacing used in joint 2, which results in
more number of dowels sharing the load within radius of relative stiffness. In

98
addition, larger than expected difference in LTE for 9” and 12” spacing will be
investigated in future tests.
• Joint 2 (with 1.5” diameter and 9” spacing) had smaller Relative Deflection
(0.25 x 10⁻³ in.) than joint 3 with same diameter bar and 12” spacing (0.70 x 10⁻³
in.).
• Joint 2 (1.5” of diameter and 9” of spacing) provided 15.4% increase in Load
Transfer Efficiency (LTE) in addition to 64.3% reduction in Relative Deflection
than Joint 3 (1.5” of diameter and 12” of spacing), refer to Table 5.5.
• For pavement joint 5 and 6 (with 1.0” dowel diameter, 8.0” and 6.0” dowel
spacing, respectively), the Load Transfer Efficiencies were very close (95% and
94.44%). Relative joint deflections were also identical (1 x 10⁻³ in.).
• For FRP dowels (A1 and A2) with 1.5” diameter, dowel A2 with larger
spacing (12”) had bigger strain change of 31 µs than dowel A1 with 9” spacing
that had a strain change of 9 µs. Similarly, for FRP dowels C5 and C6 with same
1.0”diameter, the dowel C5 with smaller spacing (6”) showed small strain change
(3 µs vs. 60 µs) compared to C6 with 8” dowel spacing.
• Thus, decreasing the spacing by 25% (12” to 9” and 8” to 6”) resulted in more
number of dowels sharing the load within radius of relative stiffness (lr, Section
6.2.1) leading to 30% or higher strain reductions in dowels.
• For FRP dowels with 1.0” diameter (C5 and C6), spacing increase from 6” to
8” had higher influence on strain value change (3 µs vs. 60 µs) than the increase
of spacing from 9” to 12” in dowels (A1 and A2) with 1.5 diameters (9 µs vs. 31
µs).
• Dowels with different diameters and spacing cannot be compared directly
with only strain value. Because FRP dowels act as a group, spacing and diameter
are both important factors for the group action. It should be also noted that FRP
dowel with smaller diameter typically have better mechanical properties per unit
area than larger diameter dowels due to shear lag effects. (Refer to Section 6.2.1,
Chapter 6).

99
• Dynamic test results recorded contained significant noise, and hence data are
not further discussed.
3. Effect of dowel diameter
Both 1.5” diameter FRP dowel group and 1.0” diameter FRP dowel group with
spacing varying from 12” to 6” provided very good Load Transfer Efficiency (LTE)
(greater than LTE of 60%, which is corresponding to ACPA’s 75% joint effectiveness
value).
4. Currently, there is no requirement or limitation for the Relative Deflection from
AASHTO’s Guide for Pavement Design. From field tests the maximum Relative
Deflection was 0.70x10⁻³ in., but for lab testing were a max of 43 x10-3 in. (Table
4.11). It should be noticed that joint width due to different joint models and thermal
variables.
From field tests conducted on the rehabilitated pavement in Morgantown, WV (see
Chapter 5.3), it is concluded that:
1. Strains at loaded and unloaded status from FRP dowels (A and B) (28.17 µs and
36.24 µs) were greater than that from Steel dowel (C) (11.49 µs), which conforms
analytical finding of shorter FRP dowel length required than steel dowel (refer to
Fig. 6.14).
2. The strain value ratio from same gage at unloaded status to loaded status does not
represent real load transfer efficiency.
3. It is suggested that Load transfer efficiency should be discovered from pavement
deflection measurement.
100
Chapter 6
ANALYTICAL EVALUATION
6.1 Introduction
Pavement performance (relative deflection and load transfer efficiency) with FRP dowel
in Jointed Plain Concrete Pavement (JPCP) as load transfer device depends on many design
parameters such as dowel diameter, dowel spacing, joint width between adjacent slabs, pavement
thickness, concrete strength, base and subbase properties, environmental conditions including
temperature variation, etc. In this chapter analytical evaluation is carried out for pavement slabs
with FRP dowels.
Several examples provided in this chapter illustrate computations for group action of
dowels, maximum bending and shear deflection of dowel, pavement relative deflection and
bearing stresses. Both steel and FRP dowels are utilized for comparison purpose.
Expansion joint model was used as analytical model; contraction joint model was also
discussed and compared.
6.2 Analytical Model
Computations for a JPCP are carried out by assuming dowel to be a beam and the
concrete to be a Winkler foundation. Based on the original solution by Timoshenko and Lessels
(1925) for the analysis of beams on an elastic foundation, the differential equation of the
deflection of a beam on an elastic foundation is given by:
kydx
ydEI −=
4
4
(6.1)
k is the modulus of foundation that is a constant and y is the deflection. The modulus of
foundation denotes the reaction due to load per unit length when the deflection is equal to unity.
Timoshenko and Lessels (1925) gave solution to the differential equation (6.1) as:

101
)sincos()sincos( xDxCexBxAey xx ββββ ββ +++= − (6.2)
where,
4
4 EIk
=β , Relative stiffness of a dowel embedded in concrete
k= modulus of foundation (psi)
E= modulus of elasticity of the beam (psi)
I= moment of inertia of the beam (in4)
A, B, C, and D are constants and are determined from the boundary conditions for a
particular beam on elastic foundation. For a semi- infinite beam on an elastic foundation subject
to a point load and moment applied at its end, as shown in Fig. 6.1, constant A and B are equal to
zero and C=D= EI
P38 β
.
After substituting A, B, C and D, equation 6.2 becomes
)]sin(coscos[2 03
xxMxPEI
ey
x
βββββ
β
−−=−
(6.3)
Loads P and M0 are positive in Figure 6.1. By considering downward deflection as
positive, and differentiating equation (6.3) with respect to x gives slope, dy/dx, of the beam
along its axis.
]sincos)2[(2 02
xPxPMEI
edxdy x
ββββ
β
−−=−
(6.4)

102
M0 P
x
y
BeamElastic Foundation
Figure 6.1 Semi-infinite beam on an elastic foundation
Applying the solution for a semi- infinite beam on an elastic foundation to dowel bars,
Friberg (1938) developed equations for determining the slope and deflection of a dowel at the
face of a joint as shown in Figure 6.2.
Dowel
Base
PavementPt
y0
z/2
Deflected shape
Figure 6.2 Slope and deflection of dowel at joint face
Substituting –Ptz/2 for M0 and x equal to zero in Equation 6.3, slope dy0/dx and the
maximum deflection, y0, of the dowel at the face of the joint are given by Equations (6.6) and
(6.7) respectively (Friberg, 1938).
M0 = –Ptz/2 (6.5)

103
)1(2 2
0 zIE
pdxdy
dd
t ββ
+−
= (6.6)
dd
t
IEzP
y30 4
)2(β
β+= (6.7)
where,
β = relative stiffness of the dowel bar encased in concrete (in-1)
K0 = modulus of dowel support (pci)
Ed = modulus of elasticity of the dowel bar (psi)
Id = moment of inertia of the dowel bar (in4)
Pt = load transferred through the dowel (lbs)
d = diameter of dowel bar (in.)
z = joint width (in.)
Friberg replaced the modulus of foundation, k, with the expression K0d. The modulus of
dowel support, K0, denotes the reaction per unit area due to applied load when the deflection is
equal to unity. Thus, relative stiffness of a dowel embedded in concrete, β , is given by:
40
4 dd IEdK
=β (6.8)
K0 is an important parameter in Friberg’s design equation. K0 is determined empirically
because of the difficulty in establishing it theoretically. Literature reviews indicate a wide range
of values for the modulus of dowel support. Modulus of dowel support K0 increases increased
concrete strength (fc’), decreases with increased concrete depth below the dowel, and decreases
with increased dowel bar diameter. Yoder and Witczak (1975) found that K0 ranges between
300,000 and 1,500,000 pci. For analytical calculations in this chapter, a value of 1,5000,000 pci
(407 Gpa/m) is used as suggested by Yoder and Witczak to simulate the worst scenario.

104
Friberg’s equations were derived assuming a dowel bar of semi- infinite length. Dowel
bars used in practice are of finite length (typically a total length of 18”); therefore, this equation
would not apply. However, Albertson (1992) and others have shown that this equation can be
still applied to dowel bars with a βL value greater than or equal to 2 with little or no error, where
the length of the dowel bar embedded in one side of the slab is denoted as L.
6.2.1 Load Transfer Across a Joint
If 100 percent load transfer efficiency is achieved by the dowel bars, about 50 percent of
the wheel load would be transferred to the subgrade while the other 50 percent would be
transferred through the dowels to the adjacent slab. However, repetitive loading of the joint
results in the creation of a void directly above or beneath the dowel at the face of the joint.
According to Yoder and Witczak (1975), a 5 to 10 percent reduction in load transfer occurs upon
formation of this void; therefore, a design load transfer of 45 percent of the applied wheel load is
recommended.
Pt = 0.45Pw (6.9)
where,
Pt = load transferred across the joint (lbs)
Pw = applied wheel load (lbs)
Based on Westergaard’s solutions (Wstergaard, 1925), Friberg found that only the dowels
contained within a distance of 1.8lr from the load, where lr is the radius of relative stiffness
defined as the stiffness of the slab relative to the stiffness of the foundation. Radius of relative
stiffness (lr) is determined by the following formula

105
42
3
)1(12 khE
l cr ν−
= (6.10)
where,
Ec = modulus of elasticity of the pavement concrete (psi)
Ec =57,000(fc′) 0.5
h = pavement thickness (in.)
ν = poisson’s ratio for the pavement concrete
k = modulus of subgrade reaction (pci)
Modulus of subgrade reaction k is a measure of the strength of the supporting soil, which
may be the subbase or the subgrade. Its value is given in pounds per square inch per inch
deflection as shown in Equation (6.11):
)(deflection soilpressure soil
pcik = (6.11)
A linear distribution of the load transferred across the joint (Friberg, 1938) is typically
used (Fig. 6.3).
1.0P c
0.0Pc
critical dowel
Pw
0.0Pc
Figure 6.3 Load transfer distribution proposed by Friberg (1938)

106
But Tabatabaie et al. (1979) found that an effective length of 1.0 lr from the applied
wheel load is more appropriate for dowels used in practice today (Figure 6.4). A linear
approximation was also shown to exist with the maximum dowel shear occurring directly
beneath the load and decreasing to a value of zero at a distance 1.0 lr from the load.
1.0Pc
0.0Pc
critical dowel
Pw
0.0Pc
1.0lr 1.0lr
Figure 6.4 Load transfer distribution proposed by Tabatabaie et al. (1979)
From Figure 6.5, the most critical case is that of the critical dowel being located at the
edge of a slab.
1.0Pc
0.0Pc
critical dowel
Pw
1.0l r
Figure 6.5 Most critical dowel at the edge of a slab

107
If the force transferred by a critical dowel, which is located directly beneath the wheel load,
is designated as Pc, then the shear force in any other dowel within lr is determined by multiplying
the height of the triangle below that particular dowel by Pc. A value of 1.0 is assumed for the
height of the triangle directly below the load as shown in Figure 6.4. The shear force in the
dowel directly under the load is obtained by dividing the transferred load, Pt, by the number of
effective dowels, as shown in Equation 6.12. Sum of the heights of the triangle under each dowel
within lr gives the number of effective dowels.
dowels effective ofnumber P t=cP (6.12)
6.2.2 Dowel Bending Moment and Shear
The bending moment and shear force along with the dowel from the face of joint can be
expressed as:
)]cos(sinsin[)( 02
2
xxMxPe
dxyd
IExM t
x
dd βββββ
β
+−−
=−=−
(6.13)
]cossin)2[()( 0 xPxPMedx
dMxV tt
x ββββ +−−== − (6.14)
where,
x = distance along dowel from face of concrete (in.)
M0 = bending moment on dowel at face of concrete, (see Eq. 6.5)
Pt = transferred load
Ed Id = flexural rigidity of dowel
6.2.3 Dowel Bar Deflection and Bearing Stress
The relative deflection between slabs is shown in Figure 6.6, the expression of ∆ is
shown in Equation 6.15.
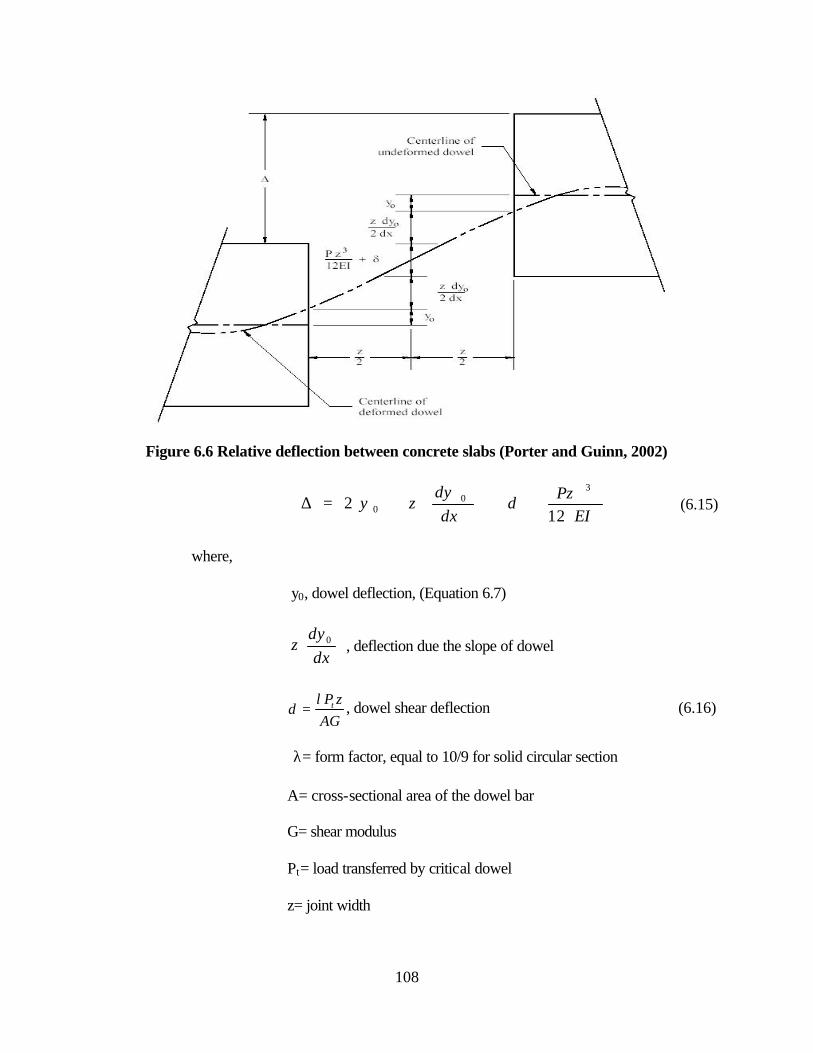
108
Figure 6.6 Relative deflection between concrete slabs (Porter and Guinn, 2002)
EIPz
dxdy
zy12
23
00 ++
+=∆ δ (6.15)
where,
y0, dowel deflection, (Equation 6.7)
dx
dyz 0 , deflection due the slope of dowel
AGzPtλ
δ = , dowel shear deflection (6.16)
λ= form factor, equal to 10/9 for solid circular section
A= cross-sectional area of the dowel bar
G= shear modulus
Pt= load transferred by critical dowel
z= joint width

109
EIPz
12
3
, flexural deflection
For small joint width, deflections due to slope and flexure are very small, thus neglecting those
terms in Equation 6.15
∆=2 y0+δ (6.17)
6.2.4 Bearing Stress Between Dowel/Concrete Interface
The load acting on a dowel is transferred to the supporting/embedding concrete through
bearing. Assuming the dowel behaves as a beam on an elastic foundation, the bearing stress at
the face of the joint, σb is proportional to the deformation:
ddcb IE
zPy 30 4
2β
βσ
+Κ=Κ= (6.18)
The bearing stress defined by Equation 6.18 should not exceed the allowable value. The
following equation was given by American Concrete Institute’s (ACI) Committee 325 (1956).
3)4( '
cb
fdf
−=
(6.19)
where,
fb =allowable bearing stress (psi)
d =dowel diameter (in.)
fc ’=ultimate compressive strength of concrete slab (psi)
6.2.5 Pavement Joint Efficiency
The joint efficiency is determined by its ability to transfer part of an applied load across
the joint to the adjacent slab. American Association of State Highway and Transportation Office
(AASHTO) and American Concrete Pavement Association (ACPA) use deflection

110
measurements to determine the efficiency of a joint. Equation 6.20 is given by ACPA (1991) as a
means of rating joint effectiveness.
%1002
×+
=UL
U
ddd
E (6.20)
where,
E = joint effectiveness (%)
dU = deflection of the unloaded side of a joint (in.)
dL = deflection of the loaded side of a joint (in.)
A joint effectiveness of 75 percent or more is considered adequate for medium to heavy
truck loadings (APCP, 1991). AASHTO (1993)adopts the 75% criteria and gives Equation 6.21
for determining joint effectiveness associated with a 9000 lb wheel load.
%100×=L
U
dd
LTE (6.21)
where,
LTE = Load Transfer Efficiency (%)
AASHTO (1993) also suggests that the value of LTE is between 70 and 100 percent is
very good load transfer, the joint provides sufficient load transfer. Deflection measurements for
use in Equations 6.26 and 6.21 should be taken at the location of the outside wheel path.
However LTE and E are related by the following equation:
%100)12
2( ×−
−=
ELTE (6.22)
According to equation 4.3, a LTE of 60% corresponds to an E of 75%. When the value of
LTE is between 60% and 100%, the joint still provides sufficient load transfer for heavy load.
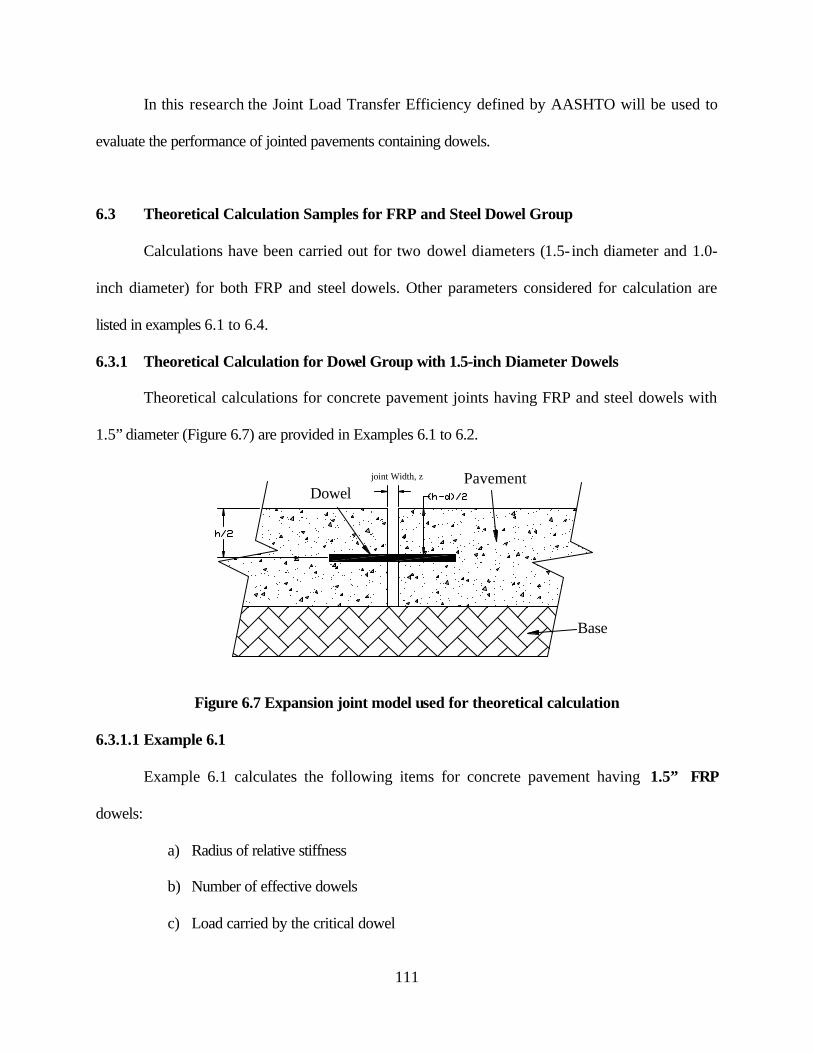
111
In this research the Joint Load Transfer Efficiency defined by AASHTO will be used to
evaluate the performance of jointed pavements containing dowels.
6.3 Theoretical Calculation Samples for FRP and Steel Dowel Group
Calculations have been carried out for two dowel diameters (1.5- inch diameter and 1.0-
inch diameter) for both FRP and steel dowels. Other parameters considered for calculation are
listed in examples 6.1 to 6.4.
6.3.1 Theoretical Calculation for Dowel Group with 1.5-inch Diameter Dowels
Theoretical calculations for concrete pavement joints having FRP and steel dowels with
1.5” diameter (Figure 6.7) are provided in Examples 6.1 to 6.2.
joint Width, z
Dowel
Base
Pavement
Figure 6.7 Expansion joint model used for theoretical calculation
6.3.1.1 Example 6.1
Example 6.1 calculates the following items for concrete pavement having 1.5” FRP
dowels:
a) Radius of relative stiffness
b) Number of effective dowels
c) Load carried by the critical dowel

112
d) Relative deflection ∆ between joints
e) Bearing stress on dowel-concrete interface
Note: Parameters listed below correspond to actual laboratory setup and/or field values
that provide us with useful comparisons.
1. FRP dowel
• Diameter, d = 1.5 in.
• Length, L= 18 in.
• Spacing between each dowel, b = 12.0 in.
• Modulus of elasticity, Ed = 5.5x10⁶ psi
• Shear modulus of dowel, G = 0.4x10⁶ psi
• Moment of inertia of the dowel, Id 0.24850564
4
=×
=dπ
(in4)
• Cross-sectional area of dowel, A = 1.77 in.2
2. Concrete pavement
• Compressive strength, fc’ = 4500 psi
• Modulus of elasticity, Ec = 5.0)'(57000 cf× = 3823676.2 psi=3.82×10⁶ psi
• Pavement thickness, h = 11 in.
• Joint width, z = 0.25 in.
• Poisson’s ratio of concrete, ν = 0.2
• Modulus of dowel support, K0 = 1,500,000 pci
3. Base
• Modulus of subgrade reaction, k = 400 pci
4. Load
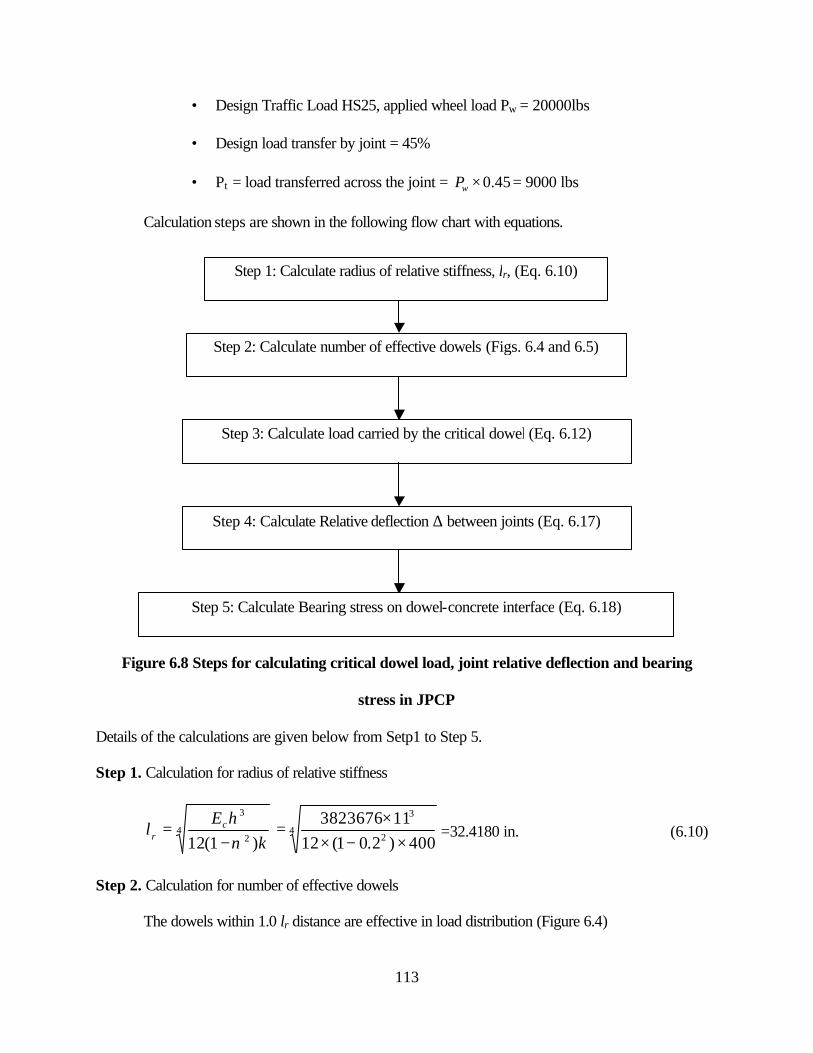
113
• Design Traffic Load HS25, applied wheel load Pw = 20000lbs
• Design load transfer by joint = 45%
• Pt = load transferred across the joint = 45.0×wP = 9000 lbs
Calculation steps are shown in the following flow chart with equations.
Figure 6.8 Steps for calculating critical dowel load, joint relative deflection and bearing
stress in JPCP
Details of the calculations are given below from Setp1 to Step 5.
Step 1. Calculation for radius of relative stiffness
42
3
)1(12 khE
l cr ν−
= 42
3
400)2.01(12113823676×−×
×= =32.4180 in. (6.10)
Step 2. Calculation for number of effective dowels
The dowels within 1.0 lr distance are effective in load distribution (Figure 6.4)
Step 1: Calculate radius of relative stiffness, lr, (Eq. 6.10)
Step 2: Calculate number of effective dowels (Figs. 6.4 and 6.5)
Step 3: Calculate load carried by the critical dowel (Eq. 6.12)
Step 4: Calculate Relative deflection ∆ between joints (Eq. 6.17)
Step 5: Calculate Bearing stress on dowel-concrete interface (Eq. 6.18)

114
Number of dowels in 1.0 lr distance = 2×INT (lr/ b = 32.4180/ 12.0 = 2.7) +1 = 2×2+1=5,
where lr= radius of relative stiffness, b= dowel spacing.
The critical dowel in this dowel group, which is the dowel directly under load, has an
effect 1.0 (Figures 6.4 & 6.5), and other dowel contribution were calculated according to the
triangular ratio. Load was distributed on 5 dowels (1 critical dowel plus 2 effective dowels on
each side) by a triangular variation with due consideration to the available pavement width.
1.0Pc
critical dowel
w
1.0lr 1.0lr
Figure 6.9 Generalized effective dowels for load distribution
In order to obtain most critical load condition, we assume that the critical dowel is
located on the edge of a pavement. Thus, the effective dowel number is reduced to 3 (1 critical
dowel and 2 effective dowels on one side).

115
critical dowel
1.0Pc
w
1.0l r
0.6298Pc
0.2597Pc
Figure 6.10 Most critical load distribution on effective dowels
From calculations, Number of Effective dowels = 1.0+0.6298+0.2597= 1.8895
Step 3. Calculation for load carried by the critical dowel
When wheel load is applied at the edge of a pavement the critical dowel has to carry most
of the transferred load:
dowels effective ofnumber Pt=cP =9000/1.8895 =4763.1472 lbs (6.12)
Note: To obtain the same critical load for lab experiments, it is necessary to apply
%45cP
= 10584.7716 lbs at loaded side of the pavements
Step 4. Calculation for relative deflection ∆ between joints
Maximum dowel deflection, dd
c
IEzP
y30 4
)2(β
β+=
2485.0105800952.40)25.0800952.02(1472.4763
63 ××××+×
=
=0.0037307 in. (6.7)

116
Where, 40
4 dd IEdK
=β
46 2485.0105.54
5.11500000××××
=
= 0.80095168 in.-1 (6.8)
Dowel shear deflection,AG
zPcλδ =
510477.125.01472.4763)910(
××××÷
= = 0.00187 in. (6.16)
Where, λ= form factor, equal to 10/9 for solid circular section
So, Total Relative deflection between pavement joints is:
∆=2 y0+δ = 2 x 0.0037307+0.00187= 0.00933 in. (6.17)
Step 5. Calculation for bearing stress on dowel-concrete interface
Maximum bearing stress occurs at the place where deflection is maximum,
0yb Κ=σ (6.18)
=1,500,000 x 0.0037307
= 5596.05 psi
The allowable bearing stress is:
3)4( '
cb
fdf
−= (6.19)
34500)5.14( ×−=
=3750 psi
Thus, σb > fb (5596.05 >3750), the bearing stress limit is not satisfied.
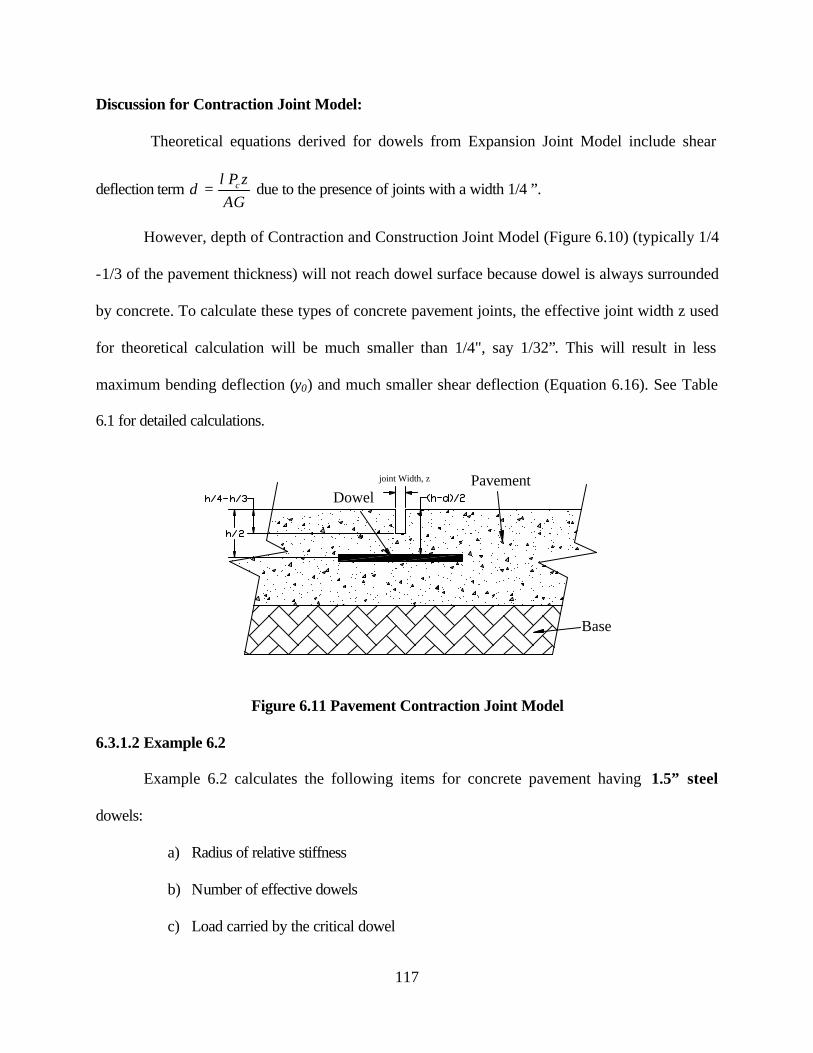
117
Discussion for Contraction Joint Model:
Theoretical equations derived for dowels from Expansion Joint Model include shear
deflection term AG
zPcλδ = due to the presence of joints with a width 1/4 ”.
However, depth of Contraction and Construction Joint Model (Figure 6.10) (typically 1/4
-1/3 of the pavement thickness) will not reach dowel surface because dowel is always surrounded
by concrete. To calculate these types of concrete pavement joints, the effective joint width z used
for theoretical calculation will be much smaller than 1/4", say 1/32”. This will result in less
maximum bending deflection (y0) and much smaller shear deflection (Equation 6.16). See Table
6.1 for detailed calculations.
joint Width, z Pavement
Base
Dowel
Figure 6.11 Pavement Contraction Joint Model
6.3.1.2 Example 6.2
Example 6.2 calculates the following items for concrete pavement having 1.5” steel
dowels:
a) Radius of relative stiffness
b) Number of effective dowels
c) Load carried by the critical dowel
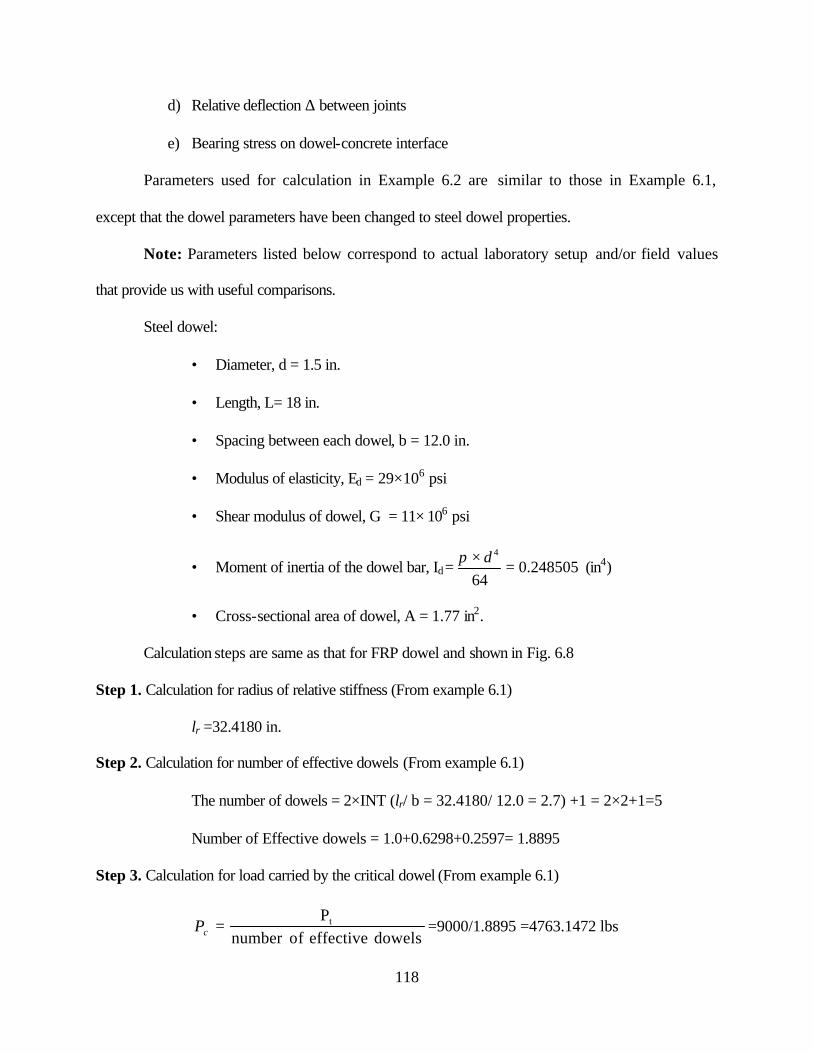
118
d) Relative deflection ∆ between joints
e) Bearing stress on dowel-concrete interface
Parameters used for calculation in Example 6.2 are similar to those in Example 6.1,
except that the dowel parameters have been changed to steel dowel properties.
Note: Parameters listed below correspond to actual laboratory setup and/or field values
that provide us with useful comparisons.
Steel dowel:
• Diameter, d = 1.5 in.
• Length, L= 18 in.
• Spacing between each dowel, b = 12.0 in.
• Modulus of elasticity, Ed = 29×106 psi
• Shear modulus of dowel, G = 11×106 psi
• Moment of inertia of the dowel bar, Id 0.24850564
4
=×
=dπ
(in4)
• Cross-sectional area of dowel, A = 1.77 in2.
Calculation steps are same as that for FRP dowel and shown in Fig. 6.8
Step 1. Calculation for radius of relative stiffness (From example 6.1)
lr =32.4180 in.
Step 2. Calculation for number of effective dowels (From example 6.1)
The number of dowels = 2×INT (lr/ b = 32.4180/ 12.0 = 2.7) +1 = 2×2+1=5
Number of Effective dowels = 1.0+0.6298+0.2597= 1.8895
Step 3. Calculation for load carried by the critical dowel (From example 6.1)
dowels effective ofnumber Pt=cP =9000/1.8895 =4763.1472 lbs

119
Note: To obtain the same critical load for lab experiments, it is necessary to apply (From
example 6.1)
%45cP
= 10584.7716 lbs at loaded side of the pavements
Step 4. Calculation for relative deflection ∆ between joints
Maximum dowel deflection, dd
c
IEzP
y 30 4)2(
ββ+
=
2485.0102952856389.04)25.052856389.02(1472.4763
63 ×××××+×
=
= 0.002386 in.
Where, 40
4 dd IEdK
=β
46 2485.010294
5.11500000××××
=
= 0.52856389 in.-1
Dowel shear deflection,AG
zPcλδ =
7101177.125.01472.4763)910(
××××÷
= = 0.000007 in.
Total relative deflection ∆ = 2 x 0.002386+0.000007= 0.004778 in.
Step 5. Calculation for the bearing stress on dowel-concrete interface
0yb Κ=σ (6.18)
=1,500,000 x 0.002386
= 3578.6247 psi
The allowable bearing stress is:
3)4( '
cb
fdf
−=
(6.19)
120
34500)5.14( −
=
=3750 psi
Thus, σb < fb, (3578.62psi < 3750psi), the bearing stress limit is satisfied.
6.3.2 Theoretical Calculation for Dowel Group with 1.0-inch Diameter Dowels
Theoretical calculations for concrete pavement joints having FRP and steel dowels with
1.5” diameter (Figure 6.7) are provided in Examples 6.3 to 6.4. Expansion Joint Model (Figure
6.7) is used for calculations. For convenience, Figure 6.7 is shown here again.
joint Width, z
Dowel
Base
Pavement
Figure 6.12 Expansion joint model used for theoretical calculation
6.3.2.1 Example 6.3
Example 6.3 calculates the following items for concrete pavement having 1.0” FRP
dowels:
a) Radius of relative stiffness
b) Number of effective dowels
c) Load carried by the critical dowel
d) Relative deflection (∆), between joints

121
e) Bearing stress on dowel-concrete interface
Note: Parameters listed below correspond to actual laboratory setup and/or field values
that provide us with useful comparisons.
1. FRP dowel
• Diameter, d = 1.0 inch
• Length, L=18 in.
• Dowel spacing, b = 6.0 inch
• Modulus of elasticity, Ed = 6.0×10⁶ psi
• Shear modulus of dowel, G = 0.4×10⁶ psi
• Moment of inertia, Id 0.04908764
4
=×
=dπ
(in4)
• Cross-sectional area, A = 0.7854 in.2
2. Concrete pavement
• Compressive strength, fc’ = 4500 psi
• Modulus of elasticity, Ec = 5.0)'(57000 cf× = 3823676.2 psi=3.82×10⁶ psi
• Pavement thickness, h = 11 in.
• Joint width, z = 0.25 in.
• Poisson’s ratio of concrete, ν = 0.2
• Modulus of dowel support, K0 = 1,500,000 pci
3. Base
• Modulus of subgrade reaction, k = 400 pci
4. Load
• Design Traffic Load HS25, applied wheel load, Pw = 20000 lbs

122
• Design load transfer of 45%
• Pt = load transferred across the joint = 45.0×wP = 9000 lbs
Calculation Steps are same as Examples 6.1 & 6.2 and shown in Fig. 6.8. Details of the
calculations are given below from Setp1 to Step 5.
Step 1. Calculation for radius of relative stiffness
42
3
)1(12 khE
l cr ν−
= 42
3
400)2.01(12113823676×−×
×= = 32.4180 in. (6.10)
Step 2. Calculation for number of effective dowels
The dowels within 1.0 lr distance are effective in load distribution.
For the case critical dowel at slab edge (Figure 6.13), the dowels number in 1.0 lr distance
= INT (lr/ b = 32.4180/ 6.0 = 5.40)+1 = 5+1=6, where lr= radius of relative stiffness, b= dowel
spacing.
critical dowel
1.0Pc
Pw
1.0lr
0.0746Pc
0.2597Pc
0.4448Pc
0.6298Pc
0.8149Pc
Figure 6.13 Most critical load distribution on effective dowels
From calculations, Number of Effective dowels
= 1+0.8149+0.6298+0.4448+0.2597+0.0746
=3.2237

123
Step 3. Calculation for the load carried by the critical dowel
When wheel load was applied at the edge of a pavement the critical dowel has to carry
the most of the transferred load:
dowels effective ofnumber Pt=cP =9000/3.2237 =2791.7646 lbs (6.12)
Note: For slabs only containing two 1.0 FRP dowels, in order to obtain the same critical load for
lab experiments, it is necessary to apply
%45)8149.00.1( cP×+
= %45
76.2791)8149.00.1( ×+=12666.93 lbs at loaded side of
pavements in lab tests (two dowels are considered).
Step 4. Calculation for the relative deflection ∆ between joints
Maximum dowel deflection, dd
c
IEzP
y30 4
)2(β
β+= (6.7)
049087.010606225.14)25.006225.12(76.2791
63 ×××××+×
=
= 0.00448 in.
Where, 40
4 dd IEdK
=β (6.8)
46 049087.01064
5.11500000×××
×=
= 1.0623 in.-1
Dowel shear deflection,AG
zPcλδ =
6104.07854.025.076.2791)910(
××××÷
= = 0.002468 in. (6.16)
Where, λ= form factor, equal to 10/9 for solid circular section
So, Total Relative deflection between pavement joints is:

124
∆=2 y0+δ = 2x0.0048+0.002468=0.01143 in. (6.17)
Step 5. Calculation for the bearing stress on dowel-concrete interface
The maximum bearing stress happens at the place where the deflection is the maximum,
0yb Κ=σ (6.18)
=1,500,000 x 0.0048
= 6718.66 psi
The allowable bearing stress is:
3)4( '
cb
fdf
−=
(6.19)
34500)0.14( −
=
=4500 psi
Thus, σb > fb, (6718.66 > 4500 psi) the bearing stress limit is not satisfied.
Discussion for Contraction Joint Model:
In order to meet the bearing stress limit by adjusting dowel spacing only, FRP dowel
spacing should not exceed 3.6”. See the detailed data in Table 6.2.
Detailed data of calculations for Contraction Joint Model (Figure 6.10) are shown in
Table 6.2, where joint width z is used as 1/32”.
6.3.2.2 Example 6.4
Example 6.4 calculates the following items for concrete pavement having 1.0” steel
dowels:
a) Radius of relative stiffness
b) Number of effective dowels
c) Load carried by the critical dowel

125
d) Relative deflection ∆ between joints
e) Bearing stress on dowel-concrete interface
Parameters used for calculation in Example 6.4 are similar to those in Example 6.3,
except dowel parameters have been changed to steel dowel properties.
Note: Parameters listed below correspond to actual laboratory setup and/or field values
that provide us with useful comparisons.
Steel dowel:
• Diameter, d = 1.0 in.
• Length, L= 18 in.
• Spacing between each dowel, b = 12.0 in.
• Modulus of elasticity, Ed = 29x106 psi
• Shear modulus of dowel, G = 11×106 psi
• Moment of inertia of the dowel bar, Id 0.04908764
4
=×
=dπ
(in4)
• Cross-sectional area of dowel, A = 0.7854 in2
Calculation steps are same as those in Example 6.3, which are for FRP dowels.
Step 1. Calculation for the radius of relative stiffness
lr =32.4180 in.
Step 2. Calculation for the number of effective dowels
The number of dowels = 6
Number of Effective dowels = 3.2237
Step 3. Calculation for the load carried by the critical dowel
dowels effective ofnumber Pt=cP =9000/3.2237 =2791.7646 lbs

126
Step 4. Calculation for the relative deflection ∆ between joints
Maximum dowel deflection, dd
c
IEzP
y30 4
)2(β
β+=
04909.06102937164.04
)25.07164.02(7676.2791
××××
×+×=
= 0.002906 in.
Where, 40
4 dd IEdK
=β
404909.0610294
0.11500000
×××
×=
= 0.716417 in.-1
Dowel shear deflection,AG
zPcλδ = = 0.000009 in.
So, Total Relative deflection between pavement joints is:
∆=2 y0+δ = 2x0.002906+0.000009=0.00582 in.
Step 5. Calculation for the bearing stress on dowel-concrete interface
0yb Κ=σ (6.18)
=1,500,000 x 0.002906
= 4358.3564 psi
The allowable bearing stress in this case according to ACI is:
3)4( '
cb
fdf
−=
(6.19)
=4500 psi
Thus, σb < fb, (4358.3564 psi < 4500 psi) the bearing stress limit is satisfied.
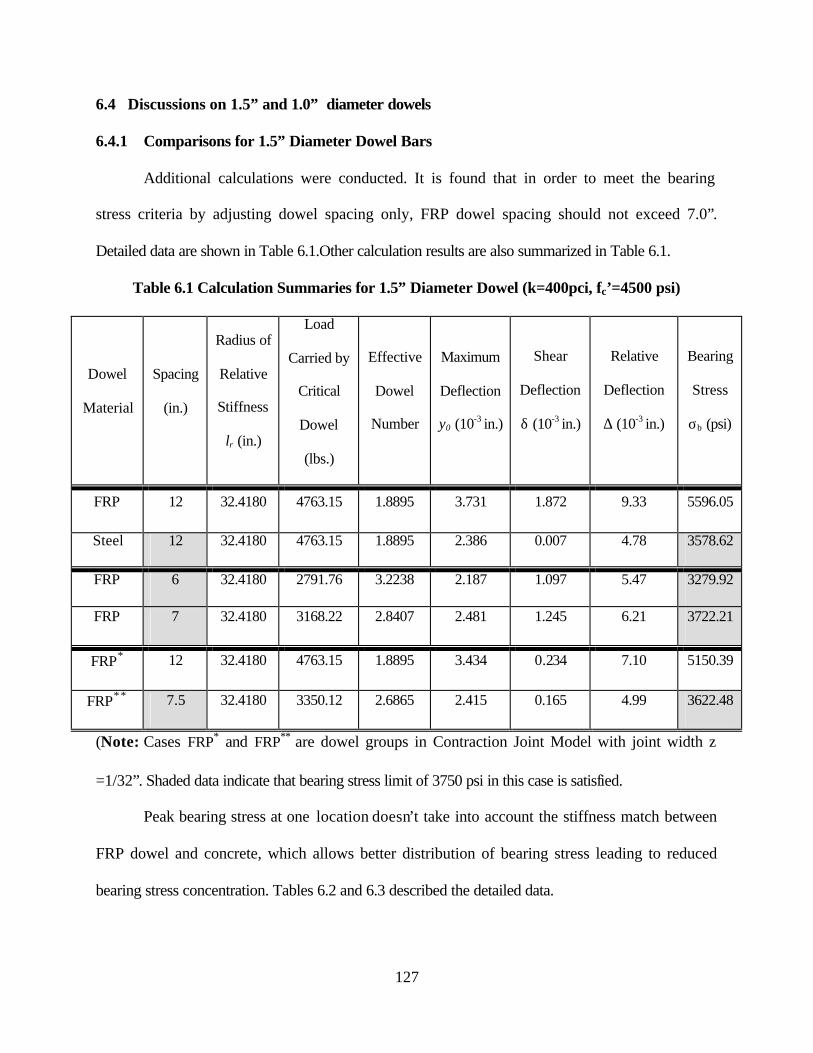
127
6.4 Discussions on 1.5” and 1.0” diameter dowels
6.4.1 Comparisons for 1.5” Diameter Dowel Bars
Additional calculations were conducted. It is found that in order to meet the bearing
stress criteria by adjusting dowel spacing only, FRP dowel spacing should not exceed 7.0”.
Detailed data are shown in Table 6.1.Other calculation results are also summarized in Table 6.1.
Table 6.1 Calculation Summaries for 1.5” Diameter Dowel (k=400pci, fc’=4500 psi)
Dowel
Material
Spacing
(in.)
Radius of
Relative
Stiffness
lr (in.)
Load
Carried by
Critical
Dowel
(lbs.)
Effective
Dowel
Number
Maximum
Deflection
y0 (10-3 in.)
Shear
Deflection
δ (10-3 in.)
Relative
Deflection
∆ (10-3 in.)
Bearing
Stress
σb (psi)
FRP 12 32.4180 4763.15 1.8895 3.731 1.872 9.33 5596.05
Steel 12 32.4180 4763.15 1.8895 2.386 0.007 4.78 3578.62
FRP 6 32.4180 2791.76 3.2238 2.187 1.097 5.47 3279.92
FRP 7 32.4180 3168.22 2.8407 2.481 1.245 6.21 3722.21
FRP∗ 12 32.4180 4763.15 1.8895 3.434 0.234 7.10 5150.39
FRP∗ ∗ 7.5 32.4180 3350.12 2.6865 2.415 0.165 4.99 3622.48
(Note: Cases FRP∗ and FRP∗∗ are dowel groups in Contraction Joint Model with joint width z
=1/32”. Shaded data indicate that bearing stress limit of 3750 psi in this case is satisfied.
Peak bearing stress at one location doesn’t take into account the stiffness match between
FRP dowel and concrete, which allows better distribution of bearing stress leading to reduced
bearing stress concentration. Tables 6.2 and 6.3 described the detailed data.

128
Table 6.2 Peak Bearing Stress and Average Bearing Stress in Dowel (1.5” diameter @ 12”
c/c) Downward Area
Maximum
Deflection
y0 (10-3
in.)
Modulus
of Dowel
Support
(pci)
Peak
Bearing
Stress (psi)
Average
Deflection in
dowel
downward
bending area
(10-3 in.)
Modulus
of Dowel
Support
(pci)
Average
Bearing
Stress
(psi)
Average
/ Peak
Bearing
Stress
(%)
300,000 1119.3 300,000 396.3 FRP 3.731
1,500,000 5596.5
1.321
1,500,000 1981.5 35.40
300,000 715.8 300,000 261.3 Steel 2.386
1,500,000 3578.6
0.871
1,500,000 1307.1 36.50
Note: In Table 6.2, the downward dowel length of FRP and steel dowels ranges from 0”
to 2” and 0” to 3” (Fig. 6.14), respectively. Value of Modulus of Dowel Support ranges from
300,000 pci to 1,500,000 pci (Yoder and Witczak, 1975).
Table 6.3 Peak Bearing Stress and Average Bearing Stress within 1” Dowel (1.5” diameter
@ 12” c/c) Length from Joint Face
Maximum
Deflection
y0 (10-3
in.)
Modulus
of Dowel
Support
(pci)
Peak
Bearing
Stress
(psi)
Average
Deflection
within 1.0”
inch distance
(10-3 in.)
Modulus
of Dowel
Support
(pci)
Average
Bearing
Stress
(psi)
Average /
Peak
Bearing
Stress (%)
300,000 1119.3 300,000 682.5 FRP 3.731
1,500,000 5596.5
2.275
1,500,000 3412.5 60.98
300,000 715.8 300,000 525.6 Steel 2.386
1,500,000 3578.6
1.752
1,500,000 2628.0 73.43
Note: In Table 6.3, average bearing stresses were calculated for dowel with 1” distance
from the face of joint.

129
-0.004
-0.0035
-0.003
-0.0025
-0.002
-0.0015
-0.001
-0.0005
0
0.0005
0 1 2 3 4 5 6 7 8 9 10
Dow
el B
endi
ng D
efle
ctio
n (i
n.)
steel-12" spacingFRP-12" spacingFRP-6" spacingFRP-7" spacingFRP-12"contraction joint model
Figure 6.14 Dowel deflected shape (1.5” diameter)
It can be found that, for dowel with 1.5” diameter:
Effect of Dowel Material
• Equations 6.1 to 6.19 are primarily developed for concrete pavement with
steel dowels. Theses equations do not take into account better stress
distribution and stiffness match between FRP and concrete. For dowels with
same spacing, currently used equations provide lower value of maximum
dowel deflection (y0), dowel shear deflection (δ) and relative deflection (∆) for
slabs with steel dowels as compared to those with FRP dowels. But the
bearing stress (σb) obtained from analytical evaluation need to be modified to
apply on FRP dowel due to the lower stiffness of FRP over steel, thus leading
to better stress distribution.
Minimum FRP dowel length in the joint= 5.5”
Minimum steel dowel length in the joint= 8.5”
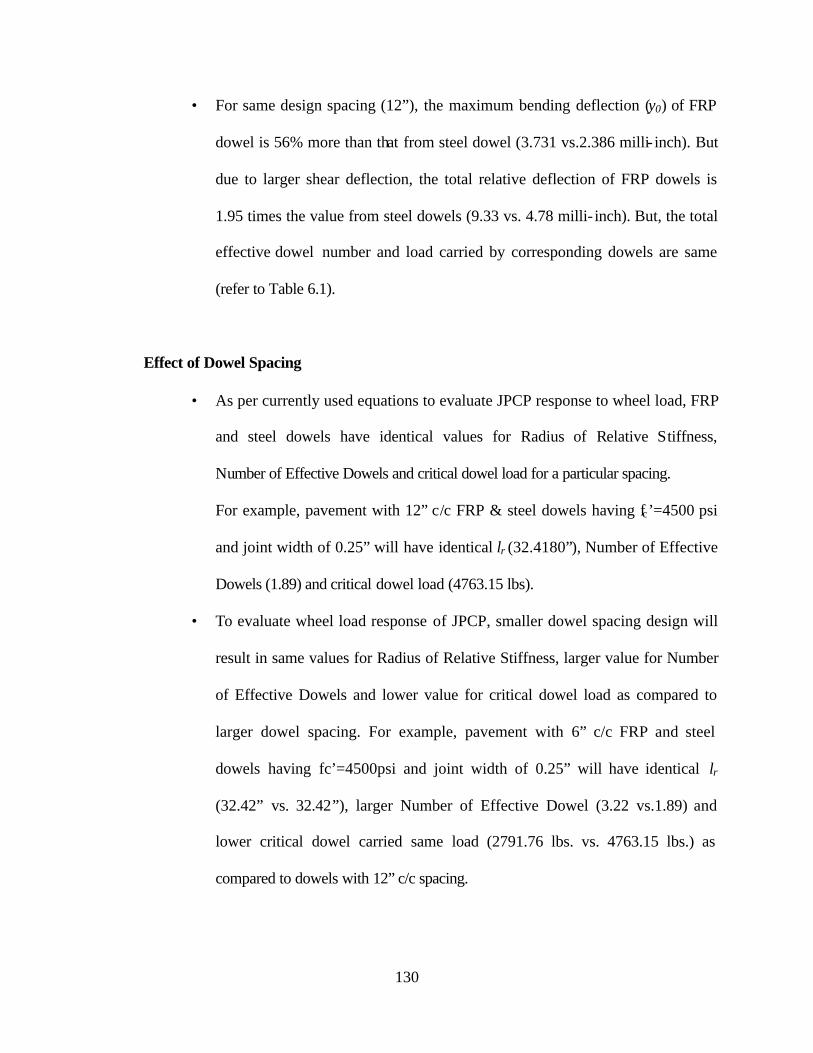
130
• For same design spacing (12”), the maximum bending deflection (y0) of FRP
dowel is 56% more than that from steel dowel (3.731 vs.2.386 milli- inch). But
due to larger shear deflection, the total relative deflection of FRP dowels is
1.95 times the value from steel dowels (9.33 vs. 4.78 milli- inch). But, the total
effective dowel number and load carried by corresponding dowels are same
(refer to Table 6.1).
Effect of Dowel Spacing
• As per currently used equations to evaluate JPCP response to wheel load, FRP
and steel dowels have identical values for Radius of Relative Stiffness,
Number of Effective Dowels and critical dowel load for a particular spacing.
For example, pavement with 12” c/c FRP & steel dowels having fc’=4500 psi
and joint width of 0.25” will have identical lr (32.4180”), Number of Effective
Dowels (1.89) and critical dowel load (4763.15 lbs).
• To evaluate wheel load response of JPCP, smaller dowel spacing design will
result in same values for Radius of Relative Stiffness, larger value for Number
of Effective Dowels and lower value for critical dowel load as compared to
larger dowel spacing. For example, pavement with 6” c/c FRP and steel
dowels having fc’=4500psi and joint width of 0.25” will have identical lr
(32.42” vs. 32.42”), larger Number of Effective Dowel (3.22 vs.1.89) and
lower critical dowel carried same load (2791.76 lbs. vs. 4763.15 lbs.) as
compared to dowels with 12” c/c spacing.

131
• Only when spacings between FRP dowels (1.5” diameter) were reduced to
less than 7” (refer to Table 6.1), dowel maximum bending deflection (y0)
(2.481x 10⁻³ in.) would be close to the value (2.386x10⁻³ in.) of steel dowels
(1.5” diameter) with 12” spacing.
Effect of Joint Width
• Shear deflection depends on joint width and is significant for FRP dowels. For
example, when joint width z =0.25” with 12” dowel spacing, shear deflection
of FRP dowel (δ) was 1.872/9.33=20.06% of the total relative deflection.
Shear deflection of steel dowel with 0.25” joint width was only 0.15%
(0.007/4.78) of its total relative deflection. When joint width is reduced to
1/32” (FRP* case in Table 6.1), the shear deflection of FRP dowels is only
3.30% (0.234/7.10) as compared to 20.06% (refer to Table 6.1).
• For same diameter (1.5”) FRP dowels, contraction joint model will greatly
reduce the shear effect of dowels. For example, relative deflection for joints
with FRP dowel bars are greatly reduced (15.34 vs. 7.80 milli- inch) with joint
width of 1/4" reduced to 1/32”.
Effect of Dowel Length
• Based on inflection points, (from Figure 6.14), minimum total length needed
for steel dowel is 17” (2x8.5”), whereas FRP dowel bars need minimum
length of 11” (2 x 5.5”). Required FRP dowel length is only 64.7% (11/17) of
that of the steel dowel.

132
Effect on Bearing Stress
• For a given set of pavement properties in terms of fc’, thickness, joint width,
dowel diameter and spacing, pavement with FRP and steel dowel show
significant difference in deflection and bearing stress value.
• Bearing stress around dowel-concrete (1.5” diameter) interface is only
associated with maximum bending deflection. In order to meet bearing stress
limit (3750 psi in this case) spacings for steel dowel (1.5” diameter) can not
exceed 12” whereas spacing for FRP dowels (1.5” diameter) should not be
more than 7” (expansion joint) or 7.5” (contraction joint).
• Peak bearing stress at joint location doesn’t take into account the stiffness
match between FRP dowel and concrete, which allows better distribution of
bearing stress leading to reduced bearing stress concentration (Tables 6.2 and
6.3). Theoretical calculations indicate allowable stress is exceeded. However,
for 1.5” diameter FRP dowel bars with 12” c/c spacing, average bearing stress
is only 35.4% (distance from joint face to the first reflection point) and
60.98% (within 1” distance from joint face) of the peak bearing stress.
6.4.2 Comparisons for 1.0” Diameter Dowel Bars
After additional calculations it is found that in order to meet the bearing stress criteria by
adjusting dowel spacing only, FRP dowel spacing should not exceed 3.7”, but for practical
purpose it will be adopted as 3.5”. Detailed data are shown in Table 6.2. Other calculation results
are also summarized in Table 6.4.
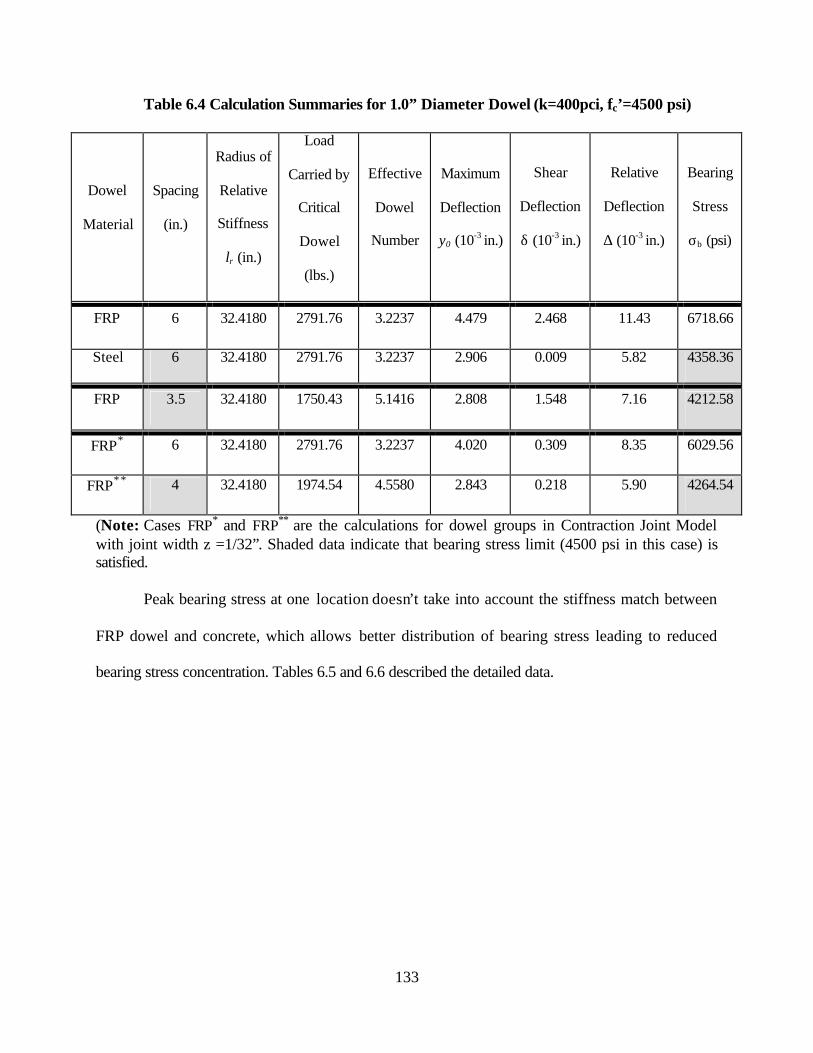
133
Table 6.4 Calculation Summaries for 1.0” Diameter Dowel (k=400pci, fc’=4500 psi)
Dowel
Material
Spacing
(in.)
Radius of
Relative
Stiffness
lr (in.)
Load
Carried by
Critical
Dowel
(lbs.)
Effective
Dowel
Number
Maximum
Deflection
y0 (10-3 in.)
Shear
Deflection
δ (10-3 in.)
Relative
Deflection
∆ (10-3 in.)
Bearing
Stress
σb (psi)
FRP 6 32.4180 2791.76 3.2237 4.479 2.468 11.43 6718.66
Steel 6 32.4180 2791.76 3.2237 2.906 0.009 5.82 4358.36
FRP 3.5 32.4180 1750.43 5.1416 2.808 1.548 7.16 4212.58
FRP∗ 6 32.4180 2791.76 3.2237 4.020 0.309 8.35 6029.56
FRP∗ ∗ 4 32.4180 1974.54 4.5580 2.843 0.218 5.90 4264.54
(Note: Cases FRP∗ and FRP∗∗ are the calculations for dowel groups in Contraction Joint Model with joint width z =1/32”. Shaded data indicate that bearing stress limit (4500 psi in this case) is satisfied.
Peak bearing stress at one location doesn’t take into account the stiffness match between
FRP dowel and concrete, which allows better distribution of bearing stress leading to reduced
bearing stress concentration. Tables 6.5 and 6.6 described the detailed data.

134
Table 6.5 Peak Bearing Stress and Average Bearing Stress in Dowel (1.0” diameter @ 6”
c/c) Downward Area
Maximum
Deflection
y0 (10-3
in.)
Modulus
of Dowel
Support
(pci)
Peak
Bearing
Stress
(psi)
Average
Deflection in
dowel
downward
bending area
(10-3 in.)
Modulus
of Dowel
Support
(pci)
Average
Bearing
Stress
(psi)
Average
/ Peak
Bearing
Stress
(%)
300,000 1343.7 300,000 469.5 FRP 4.479 1,500,000 6718.5
1.565
1,500,000 2347.5 34.94
300,000 871.8 300,000 347.7 Steel 2.906 1,500,000 4358.4
1.159
1,500,000 1739.1 39.88
Note: In Table 6.5, the downward dowel length of FRP and steel dowels ranges from 0”
to 1.5” and 0” to 2” (Fig. 6.15), respectively. Value of Modulus of Dowel Support ranges from
300,000 pci to 1,500,000 pci (Yoder and Witczak, 1975).
Table 6.6 Peak Bearing Stress and Average Bearing Stress within 1” Dowel (1.0” diameter
@ 6” c/c) Length from Joint Face
Maximum
Deflection
y0 (10-3
in.)
Modulus
of Dowel
Support
(pci)
Peak
Bearing
Stress
(psi)
Average
Deflection
within 1.0”
inch distance
(10-3 in.)
Modulus
of Dowel
Support
(pci)
Average
Bearing
Stress
(psi)
Average
/ Peak
Bearing
Stress
(%)
300,000 1343.7 300,000 677.7 FRP 4.479 1,500,000 6718.5
2.259
1,500,000 3388.5 50.44
300,000 871.8 300,000 563.7 Steel 2.906 1,500,000 4358.4
1.879
1,500,000 2818.5 64.66
Note: In Table 6.6, average bearing stresses were calculated for dowel with 1” distance
from the face of joint.
135
-0.005
-0.004
-0.003
-0.002
-0.001
0.000
0.001
0 1 2 3 4 5 6 7 8 9 10
Def
lect
ion
(in.
)
steel-6" spacingFRP-6" spacingFRP-3.5" spacingFRP-6"contraction joint model
Figure 6.15 Dowel deflected shape
It can be found that, for dowel with 1.0” diameter:
Effect of Dowel Material
• Based on Equations 6.1 to 6.19, for dowels with same spacing, steel dowels
provide lower value of maximum dowel deflection (y0), dowel shear
deflection (δ), relative deflection (∆) and bearing stress (σb).
• For same design spacing (6”), the maximum bending deflection (y0) of FRP
dowels is 54.03% more than those from steel dowels (4.479 vs.2.906 milli-
inch). But due to larger shear deflection the total relative deflection of FRP
dowels is 1.96 times the value from steel dowels (11.43 vs.5.82 milli-inch).
Effect of Dowel Spacing
• As per currently used equations (Equations 6.1 to 6.19) to evaluate JPCP
response to wheel load, FRP and steel dowels have identical values for Radius
Minimum FRP dowel length in the joint= 4.5”
Minimum steel dowel length in the joint= 6.5”

136
of Relative Stiffness, Number of Effective Dowels and critical dowel load for
a particular spacing. For example, pavement with 6” c/c FRP and steel dowels
having fc’=4500psi and joint width of 0.25” will have identical lr (32.4180”),
Number of Effective Dowel (3.2237) and critical dowel carried same load
(2791.76 lbs.).
• To evaluate wheel load response of JPCP, smaller dowel spacing design will
result in same values for Radius of Relative Stiffness, larger value for Number
of Effective Dowels and lower value for critical dowel load as compared to
larger dowel spacing. For example, pavement with 3.5” c/c FRP and steel
dowels having fc’=4500psi and joint width of 0.25” will have identical lr
(32.4180” vs. 32.4180”), larger Number of Effective Dowel (5.1416 vs.3.2237)
and lower critical dowel carried same load (1750.43 lbs. vs.2791.76 lbs.) as
compared to dowels with 6” c/c spacing.
• Only when spacings between FRP dowels (1.0” diameter) were reduced to
less than 3.5” (refer to Table 6.4), dowel maximum bending deflection (y0)
(2.808x 10⁻³ in.) is close to the value (2.906x10⁻³ in.) of steel dowels (1.5”
diameter) with 6” spacing.
Effect of Joint Width
• Shear deflection depends on joint width and is significant for FRP dowels. For
example, when joint width z =0.25” with 6” dowel spacing, shear deflection
of FRP dowel (δ) was 2.468/11.43=21.59% of the total relative deflection.
Shear deflection of steel dowel with 0.25” joint width was only 0.15%
(0.009/5.82) of its total relative deflection. When joint width is reduced to

137
1/32” (FRP* case in Table 6.1), the shear deflection of FRP dowels is only
3.70% (0.309/8.35) as compared to 21.59% (refer to Table 6.2).
• For same diameter (1.0”) FRP dowels, contraction joint model will greatly
reduce the shear effect of dowels. For example, relative deflection for joints
with FRP dowel bars are greatly reduced (11.43 vs. 8.35 milli- inch) with joint
width of 1/4" reduced to 1/32”.
Effect of Dowel Length
• Based on inflection points, (from Figure 6.15), minimum needed total length
for steel dowel is 13” (2x6.5”), but for FRP dowel bars the minimum length is
9” (2 x 4.5”). Required FRP dowel length is only 69.23% (9/13) of the
required length of steel dowel.
Effect on Bearing Stress
• For a given set of pavement properties in terms of fc’, thickness, joint width,
dowel diameter and spacing, pavement with FRP and steel dowel show
significant difference in deflection and bearing stress value.
• Bearing stress around dowel-concrete (1.0” diameter) interface is only
associated with maximum bending deflection. In order to meet bearing stress
limit (4500 psi in this case) spacings for steel dowel (1.0” diameter) can not
exceed 12” whereas spacing for FRP dowels (1.0” diameter) should not be
more than 3.5” (expansion joint) or 4.0” (contraction joint).
• For 1.0” diameter FRP dowel bars with 6” c/c spacing, average bearing stress
is only 34.94% (distance from joint face to the first reflection point) and

138
50.44% (within 1” distance from joint face) of the peak bearing stress (Tables
6.5 and 6.6).
6.5 Comparison of Experimental vs. Theoretical Data
Experimental test results from slabs having normal crack formation were compared with
theoretical calculations. As per equations (Eqs. 6.1 to 6.19) used in this chapter, only relative
deflection from static testing were compared in this report.
Table 6.7 Comparison of Experiments vs. Theory for Slab Relative Deflection in Static
Testing Under HS25 Loading
Experimental Data (10-3 in.) Theoretical Data (10-3 in.)
Slab
Static Fatigue at 2
million cycles K=1,500,000 pci K=300,000 pci
#1 (FRP dowel, 1.0”
@6” c/c) 2.27 12.8 11.43 31.26
#4 (FRP dowel, 1.5”
@12” c/c) 29 25 9.33 26.07
#5 (steel dowel, 1.5”
@12” c/c) 11 11 4.78 15.7
It was found that
1. For static testing, relative deflection obtained in concrete slabs (#4) with large FRP
dowel spacing (12”) in laboratory tests were larger than that from theoretical
calculations. But slab #1 with two FRP dowel bars and small spacing (6”) had
smaller relative deflection than that from theory (refer to Table 6.7).
139
2. After 2 million fatigue load cycles, relative deflection of all these three slabs were
within the theoretical relative deflection range calculated by using modulus of
dowel support K from 300,000 to 1,500,000 pci.
3. The assumption of analytical models do not consider the boundary condition of
elastic foundation; in our laboratory tests, both ends of concrete slabs were not
constrained, thus during the testing, both ends were slightly lifted up. Also, the
assumed “s” shape (Figure 6.6) for deformation of dowel bars under loading may
be more like “v” shape for unrestrained slabs. Additional tests are necessary to
correlate laboratory deflection to analytical evaluations.
6.6 Analytical Investigation with Respect to FRP Dowel-Concrete Bearing Stress
More extensive analytical investigation for FRP dowel-concrete bearing stress was
conducted. More parameters were considered for analysis, by using constant values of FRP
dowel material properties.
1) Concrete strength fc′: 3000 psi, 3500 psi, 4000 psi, and 4500 psi
2) Concrete pavement thickness h: 10”, 11” and 12”
3) Concrete joint width z: 0.25”, 0.125”
4) Dowel length: 12”, 18” and 24”
5) Dowel diameter d: 1”, 1.25”, 1.5”, 1.75” and 2”
6) Elasticity modulus of Dowel Ed: 5.5×10⁶ psi and 6×10⁶
7) Shear Modulus of Dowel G: 0.4*106 psi
8) Dowel spacing b: 6”, 8”, 0 and 12”
9) Modulus of subgrade reaction k: 100, 400 and 800 pci

140
Modulus of subgrade reaction is a measure of the strength of the supporting soil, which
may be the sub-base or the subgrade. Its value is given in pounds per square inch per inch
deflection.
10) Modulus of dowel support Κ: 1,500,000 pci
Following are some of the simplified conclusions drawn based on the theoretical analysis
using above parameters:
1) Bearing Stress (σb) can be reduced
By increasing:
• Dowel diameter (d)
• Pavement slab thickness (h)
• Concrete strength (fc′)
By decreasing:
• Dowel spacing (b)
• Joint width (z)
• Modulus of subgrade reaction (k)
• Modulus of dowel support (Κ)
2) Bearing Stress (σb) cannot be significantly affected by the dowel length beyond
certain length, for FRP dowels, this length is 64.7% and 69.23% of steel dowels for
1.5” and 1.0” dowels respectively.
3) Allowable bearing stress (fb) can be increased by:
• Decreasing the dowel diameter (d)
• Increasing concrete strength (fc′)

141
Chapter 7
CONCLUSIONS AND RECOMMENDATION
7.1 Introduction
In this research, FRP dowel bars with 1.5” and 1.0” diameter spaced at different intervals
as load transferring devices in JPCP were evaluated under static and fatigue loads corresponding
to HS-25 trucks. Their responses were compared with JPCP consisting of steel dowels under
laboratory and field conditions. Performance of JPCP rehabilitated with FRP and steel dowels
was also evaluated.
Analysis and discussions corresponding to experimental results and theoretical
calculations are summarized in this chapter.
7.2 Conclusions for Laboratory Tests
Laboratory evaluations were carried out on contraction joints (Figure 6.11) with FRP and
steel dowels, similar to field implementation. During laboratory tests, crack formations were
noted right under the joint (refer to as proper crack formation, Figure 4.1 Chapter 4) or away
from the joint near dowel edges (Figures 4.2 and 4.3). Proper crack formation at joint location
was noted in slab #1 (6” c/c spacing for 1.0” diameter FRP dowel), slab #4 (12” c/c spacing for
1.5” diameter FRP dowel) and slab #5 (12” c/c spacing for 1.5” diameter steel dowel).
Crack formation at locations away from joint and close to the edge of dowel end was
observed in slabs #2 (6” c/c spacing for 1.0” diameter for steel dowel) and #3 (6” c/c spacing for
1.5” diameter for steel dowel).
Results are mainly focused upon slabs with proper crack formation at the middle joint.
Conclusion on laboratory tests are provided with respect to:
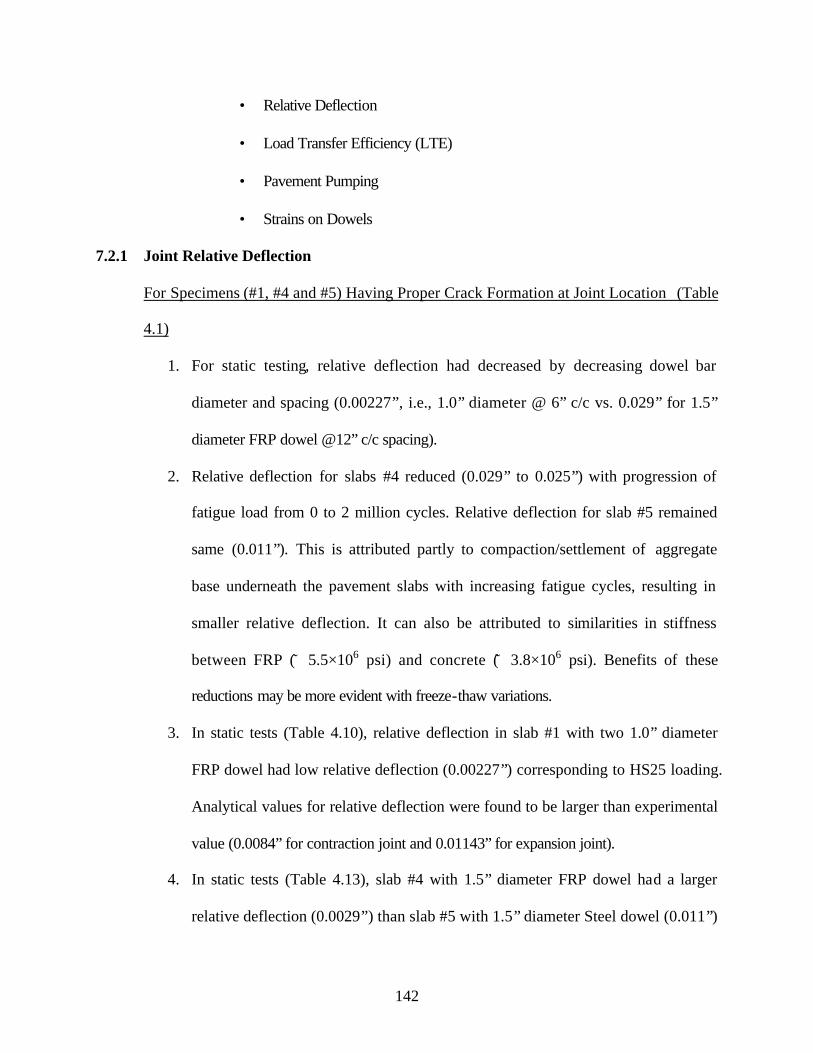
142
• Relative Deflection
• Load Transfer Efficiency (LTE)
• Pavement Pumping
• Strains on Dowels
7.2.1 Joint Relative Deflection
For Specimens (#1, #4 and #5) Having Proper Crack Formation at Joint Location (Table
4.1)
1. For static testing, relative deflection had decreased by decreasing dowel bar
diameter and spacing (0.00227”, i.e., 1.0” diameter @ 6” c/c vs. 0.029” for 1.5”
diameter FRP dowel @12” c/c spacing).
2. Relative deflection for slabs #4 reduced (0.029” to 0.025”) with progression of
fatigue load from 0 to 2 million cycles. Relative deflection for slab #5 remained
same (0.011”). This is attributed partly to compaction/settlement of aggregate
base underneath the pavement slabs with increasing fatigue cycles, resulting in
smaller relative deflection. It can also be attributed to similarities in stiffness
between FRP (̃ 5.5×10⁶ psi) and concrete (̃ 3.8×10⁶ psi). Benefits of these
reductions may be more evident with freeze-thaw variations.
3. In static tests (Table 4.10), relative deflection in slab #1 with two 1.0” diameter
FRP dowel had low relative deflection (0.00227”) corresponding to HS25 loading.
Analytical values for relative deflection were found to be larger than experimental
value (0.0084” for contraction joint and 0.01143” for expansion joint).
4. In static tests (Table 4.13), slab #4 with 1.5” diameter FRP dowel had a larger
relative deflection (0.0029”) than slab #5 with 1.5” diameter Steel dowel (0.011”)

143
where the ratio of relative deflections was 2.64 (0.029/0.011) corresponding to
HS-25 loading.
For Specimens Having Crack Formation Away From Joint Location (Table 4.1)
Slightly larger relative deflection were noted under static tests (Table 4.10) for
slab #2 (1.0” steel dowel) and slab #3 (1.5” FRP dowel) due to crack formation at
dowel edges. In addition to higher relative deflection, the load transferred by
dowels is less due to that crack formation.
For Base Material Properties (Table 4.1)
Experimental results on relative deflection are sensitive to supporting base
stiffness (k). During our tests, base property (modulus of subgrade reaction, k)
value changed from 400pci to 800 pci after 5 million fatigue cycles were applied
on slab #4. Relative deflection is expected to increase due to increase in value of
subgrade reaction k.
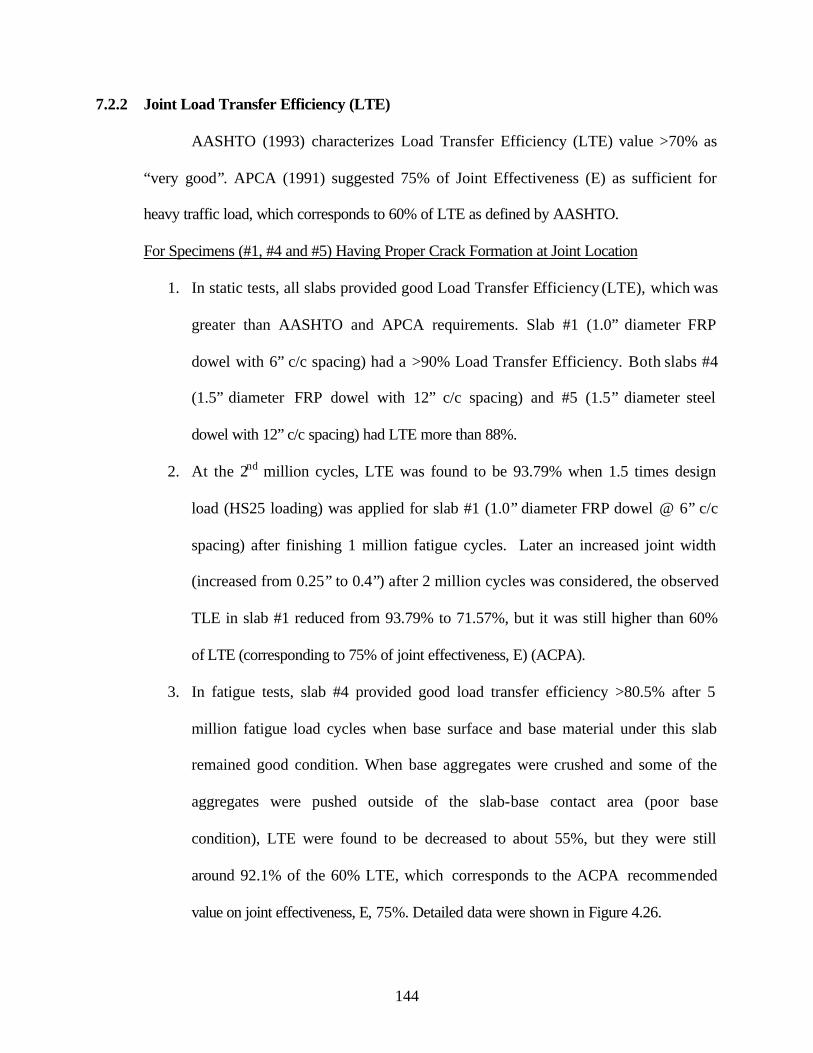
144
7.2.2 Joint Load Transfer Efficiency (LTE)
AASHTO (1993) characterizes Load Transfer Efficiency (LTE) value >70% as
“very good”. APCA (1991) suggested 75% of Joint Effectiveness (E) as sufficient for
heavy traffic load, which corresponds to 60% of LTE as defined by AASHTO.
For Specimens (#1, #4 and #5) Having Proper Crack Formation at Joint Location
1. In static tests, all slabs provided good Load Transfer Efficiency (LTE), which was
greater than AASHTO and APCA requirements. Slab #1 (1.0” diameter FRP
dowel with 6” c/c spacing) had a >90% Load Transfer Efficiency. Both slabs #4
(1.5” diameter FRP dowel with 12” c/c spacing) and #5 (1.5” diameter steel
dowel with 12” c/c spacing) had LTE more than 88%.
2. At the 2nd million cycles, LTE was found to be 93.79% when 1.5 times design
load (HS25 loading) was applied for slab #1 (1.0” diameter FRP dowel @ 6” c/c
spacing) after finishing 1 million fatigue cycles. Later an increased joint width
(increased from 0.25” to 0.4”) after 2 million cycles was considered, the observed
TLE in slab #1 reduced from 93.79% to 71.57%, but it was still higher than 60%
of LTE (corresponding to 75% of joint effectiveness, E) (ACPA).
3. In fatigue tests, slab #4 provided good load transfer efficiency >80.5% after 5
million fatigue load cycles when base surface and base material under this slab
remained good condition. When base aggregates were crushed and some of the
aggregates were pushed outside of the slab-base contact area (poor base
condition), LTE were found to be decreased to about 55%, but they were still
around 92.1% of the 60% LTE, which corresponds to the ACPA recommended
value on joint effectiveness, E, 75%. Detailed data were shown in Figure 4.26.

145
4. At 2 million cycles, slab #4 containing FRP dowel provided slightly lower LTE
(85.1% vs. 90.21%) than slab #5 containing STEEL dowel up to cycles (Table
4.17). But with poor base condition (as defined in bullet 3), LTE of slab with FRP
dowel over STEEL dowel was (50.71% vs. 90.21%). The most possible reason
caused low LTE was the poor base condition. It should be noted that the modulus
of subgrade reaction, k was found changed from 400 pci to 800 pci after 5 million
cycles.
5. Compaction of base was noted especially under loaded side of slab during the
tests, which will create slight concave surface under the slab, possibly leading to
reduction in LTE. It is suggested to check the base property such as (k, modulus
of subgrade reaction) before and after each fatigue test.
For Specimens Having Crack Formation Away Joint Location (Table 4.1)
Due to the crack formation, Load Transfer Efficiencies from slabs #2 (1” diameter
steel dowel with 6” spacing) and #3 (1.5” diameter FRP dowel with 6” spacing)
were slightly lower than that from Slab#1 in static tests (Table 4.14).
7.2.3 Investigation of Pavement Pumping Problem
1. Load Transfer Efficiencies (LTEs) were observed in cases investigated for
simulated pavement pumping problem with supporting base removal up to certain
length near the joint (Figs.4.30 and 4.33). LTEs were not less than the LTEs
obtained from intact base condition (Table 4.16). However, under fatigue load

146
cycles LTE is expected to reduce significantly for specimens without support near
joint.
2. LTE obtained in test case two (1 ft. Base Material Removal under Both Sides of
Slabs) was greater than 90% at 3 kips loading, and after loading exceeded 3 kips,
two joint faces would bear against each other. Thus Case Two (1 ft. base removal
under both slabs) with unsupported slab areas on both sides of the slab was more
detrimental than Case One (2 ft. base removal under loaded slab).
7.2.4 Strains on Dowels
Strain values at unloaded side of dowel during static tests from slabs #1 and #5
were 513.04 and 376.43 micro-strains, respectively. Both values were less than those
from analytical evaluation (ranges from 1000 to 1200 micro-strains)(Appendix C). But
strain values are typically not used for LTE calculation.
7.3 Conclusions for Field Applications and Test Results
7.3.1 Conclusions for FRP Dowels Used for New Highway Pavement Construction
1. Effect of dowel spacing
• For dowel groups in pavement joints 2 and 3 that have same dowel diameter
(1.5”), joint 2 with smaller dowel spacing (9”) had higher Load Transfer
Efficiency (94%) than that provided by joint 3 with 12” dowel spacing
(81.58%).
• Joint 2 (with 1.5” diameter and 9” spacing) had smaller Relative Deflection
(0.25 x 10⁻³ in.) than joint 3 with same diameter bar and 12” spacing (0.70 x
10-3 in.).

147
• Joint 2 (1.5” of diameter and 9” of spacing) provided 15.4% increase in Load
Transfer Efficiency (LTE) in addition to 64.3% reduction in Relative
Deflection than Joint 3 (1.5” of diameter and 12” of spacing), refer to Table
5.5.
• Pavement joint 5 and 6 (with 1.0” dowel diameter, 8.0” and 6.0” dowel
spacing, respectively), the Load Transfer Efficienc ies were very close (95%
and 94.44%). Relative joint deflections were also identical (1 x 10⁻³ in.).
• For JPCP with 1.0” or 1.5” FRP dowels, larger dowel spacings of 12” (for
1.0” diameter dowel) or 8” (for 1.0” diameter dowel) resulted in higher dowel
strains compared t those with 9” or 6” spacing (for 1.5” diameter dowel and
1.0” diameter dowel respectively) under AASHTO Type-3 truck loading.
i. For example, For FRP dowels (A1 and A2) with 1.5” diameter, dowel A2 with
larger spacing (12”) had bigger strain change of 31 µs than dowel A1 with 9”
spacing that had a strain change of 9 µs. Similarly, for FRP dowels C5 and C6
with same 1.0”diameter, the dowel C5 with smaller spacing (6”) showed small
strain change (3 µs vs. 60 µs) compared to C6 with 8” dowel spacing.
ii. Decreasing the spacing by 25% (12” to 9” and 8” to 6”) resulted in more number
of dowels sharing the load within radius of relative stiffness (lr, Section 6.2.1)
leading to 30% or higher strain reductions in dowels.
• For FRP dowels with 1.0” diameter (C5 and C6), spacing increase from 6” to
8” had higher influence on strain value change (3 µs vs. 60 µs) than the
increase of spacing from 9” to 12” in dowels (A1 and A2) with 1.5 diameters
(9 µs vs. 31 µs).
• Dowels with different diameters and spacing cannot be compared with one
another based on only strain value. Because FRP dowels act as a group,

148
spacing and diameter are both important factors for the group action. It should
be also noted that FRP dowel with smaller diameter typically have better
mechanical properties per unit area than larger diameter dowels due to shear
lag effects. (Refer to Chapter 6, Section 6.2.1).
2. Effect of dowel diameter
Both 1.5” diameter FRP dowel group and 1.0” diameter FRP dowel group with
spacing varying from 12” to 6” provided very good Load Transfer Efficiency
(81% and higher) greater than LTE of 60%, which is corresponding to ACPA’s
75% Joint Effectiveness (E) value.
3. Currently, there is no requirement or limitation for the Relative Deflection from
AASHTO’s Guide for Pavement Design. From field tests the maximum Relative
Deflection was 0.70x10⁻³ in. corresponding to AASHTO Type-3 truck loading, but
for laboratory test maximum value was 43 x10-3 in. (Table 4.11) corresponding to
HS-25 loading. It should be noted that joint width due to different joint models
(contraction vs. expansion joint models) and thermal variables also affect field LTE
values.
7.3.2 Conclusions for FRP Dowels Used for Pavement Rehabilitation
Pavement rehabilitation was successfully carried out using FRP dowels near
junction of Rts. 119 and 857, University Avenue, Morgantown, WV. After one year of
rehabilitation, this pavement is performing well without any pavement distress. Strain
were monitored on this pavement where has one of the busiest traffic in Morgantown,
WV.

149
1. Strains at loaded and unloaded status from FRP dowels (A and B) (28.17 µs and
36.24 µs) were greater than those from Steel dowel (C) (11.49 µs), which conforms
analytical finding of shorter FRP dowel length required than steel dowel and higher
deflection in FRP dowel (refer to Fig. 6.14).
2. The strain value ratio from same gage at unloaded status to loaded status does not
represent proper measure of load transfer efficiency. It is suggested that Load
Transfer Efficiency should be calculated from pavement deflection measurement.
7.4 Conclusions for Analytical Evaluation
Calculations have been carried out for two dowel diameters (1.5- inch diameter
and 1.0- inch diameter) for both FRP and steel dowels. In those calculations, base
modulus of subgrade reaction k=400 pci, fc’=4500 psi, other parameters considered for
calculation are listed in examples 6.1 to 6.4.
7.4.1 Conclusions for 1.5” Diameter Dowel with 12” c/c Spacing
Effect of Dowel Material
• Based on current equations, for dowels with same spacing, steel dowels
provide lower value of maximum dowel deflection (y0), dowel shear
deflection (δ), relative deflection (∆) and bearing stress (σb) as compared to
FRP dowels.
• For same design spacing (12”), the maximum bending deflection (y0) of FRP
dowels is 56% more than those from steel dowels (3.731 vs.2.386 milli- inch).
But due to larger shear deflection, the total relative deflection of FRP dowels
is 1.95 times the value from steel dowels (9.33 vs. 4.78 milli-inch).

150
Effect of Dowel Spacing
• Currently used equations to evaluate JPCP response to wheel load do not
include dowel material properties. Radius of Relative Stiffness, Number of
Effective Dowels and critical dowel load remain identical for FRP and steel
dowels for a given spacing.
i. For example, pavement with 12” c/c FRP & steel dowels having fc’=4500 psi
and joint width of 0.25” will have identical lr (32.4180”), Number of Effective
Dowels (1.89) and critical dowel load (4763.15 lbs).
• As per currently used equations to evaluate JPCP response to wheel load,
smaller dowel spacing design will result in same values for Radius of Relative
Stiffness, larger value for Number of Effective Dowels and lower value for
critical dowel load as compared to a larger dowel spacing.
i. For example, pavement with 6” c/c FRP and steel dowels having fc’=4500psi
and joint width of 0.25” will have identical lr (32.4180” vs. 32.4180”), larger
Number of Effective Dowel (3.2238 vs.1.8895) and lower critical dowel
carried same load (2791.76 lbs. vs. 4763.15 lbs.) as compared to dowels with
12” c/c spacing.
• Spacings between FRP dowels (1.5” diameter) less than 7” provided dowel
maximum dowel bending deflection (y0) (2.481x 10⁻³ in.) that close to the
value (2.386x10⁻³ in.) provided by steel dowels with 1.5” diameter and 12”
spacing (refer to Table 6.1).
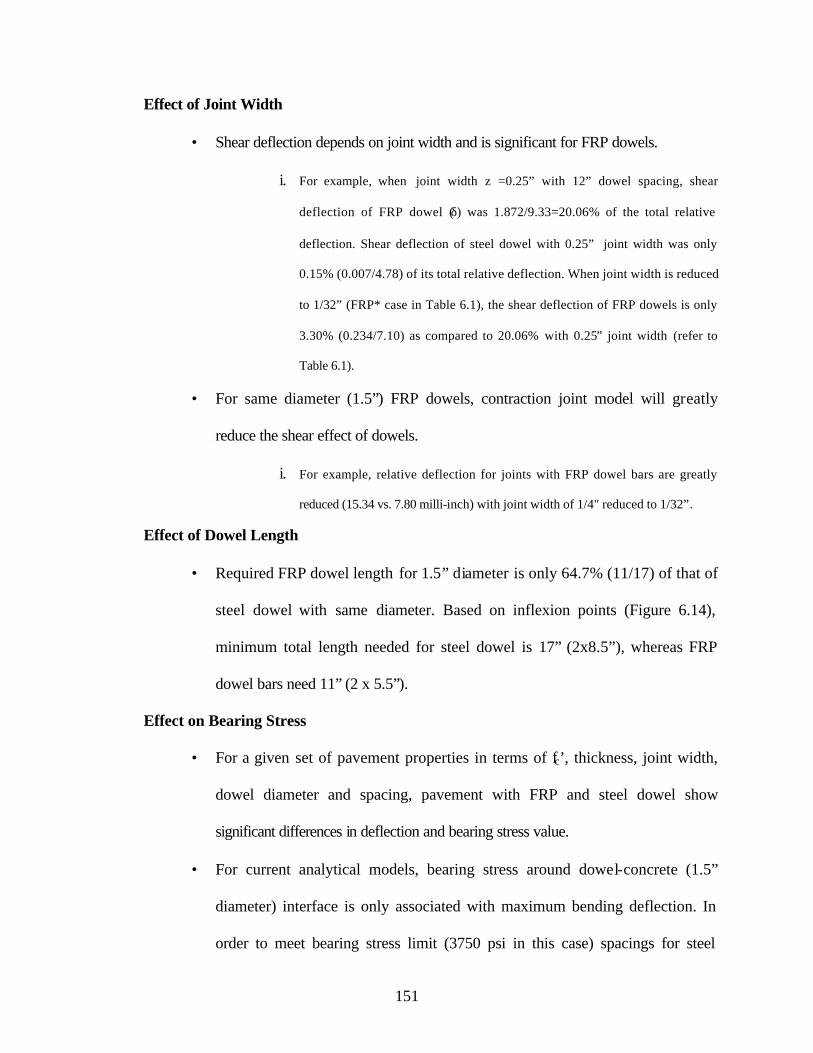
151
Effect of Joint Width
• Shear deflection depends on joint width and is significant for FRP dowels.
i. For example, when joint width z =0.25” with 12” dowel spacing, shear
deflection of FRP dowel (δ) was 1.872/9.33=20.06% of the total relative
deflection. Shear deflection of steel dowel with 0.25” joint width was only
0.15% (0.007/4.78) of its total relative deflection. When joint width is reduced
to 1/32” (FRP* case in Table 6.1), the shear deflection of FRP dowels is only
3.30% (0.234/7.10) as compared to 20.06% with 0.25” joint width (refer to
Table 6.1).
• For same diameter (1.5”) FRP dowels, contraction joint model will greatly
reduce the shear effect of dowels.
i. For example, relative deflection for joints with FRP dowel bars are greatly
reduced (15.34 vs. 7.80 milli-inch) with joint width of 1/4" reduced to 1/32”.
Effect of Dowel Length
• Required FRP dowel length for 1.5” diameter is only 64.7% (11/17) of that of
steel dowel with same diameter. Based on inflexion points (Figure 6.14),
minimum total length needed for steel dowel is 17” (2x8.5”), whereas FRP
dowel bars need 11” (2 x 5.5”).
Effect on Bearing Stress
• For a given set of pavement properties in terms of fc’, thickness, joint width,
dowel diameter and spacing, pavement with FRP and steel dowel show
significant differences in deflection and bearing stress value.
• For current analytical models, bearing stress around dowel-concrete (1.5”
diameter) interface is only associated with maximum bending deflection. In
order to meet bearing stress limit (3750 psi in this case) spacings for steel

152
dowel (1.5” diameter) can not exceed 12” whereas spacing for FRP dowels
(1.5” diameter) should not be more than 7” (expansion joint) or 7.5”
(contraction joint) (refer to Table 6.1).
• Peak bearing stress at joint location doesn’t take into account the stiffness
match between FRP dowel and concrete, which allows better distribution of
bearing stress leading to reduced bearing stress concentration. Theoretical
calculations indicate allowable stress is exceeded. However, for 1.5” diameter
FRP dowel bars with 12” c/c spacing, average bearing stress is only 35.4%
(distance from joint face to the first inflexion point) and 60.98% (within 1”
distance from joint face) of the peak bearing stress (Tables 6.2 and 6.3).
• Bearing Stress (σb) can be reduced by increasing dowel diameter (d),
pavement slab thickness (h), and concrete strength (fc′) or by decreasing dowel
spacing (b), joint width (z), modulus of subgrade reaction (k), modulus of
dowel support (Κ0)
7.4.2 Conclusions for 1.0” Diameter Dowel with 6” c/c Spacing
Effect of Dowel Material
• For same design spacing (6”), the maximum bending deflection (y0) of FRP
dowels is 54.03% more than those from steel dowels (4.479 vs.2.906 milli-
inch). But due to larger shear deflection the total relative deflection of FRP
dowels is 1.96 times the value from steel dowels (11.43 vs.5.82 milli-inch).

153
Effect of Dowel Spacing
• Trends of the effect of dowel spacing were found to be similar to that of 1.5”
diameter FRP dowel bars.
• Spacings between FRP dowels (1.0” diameter) less than 3.5” provided dowel
maximum bending deflection (y0) (2.808x 10⁻³ in.) that close to the value
(2.906x10⁻³ in.) of steel dowels (1.5” diameter) with 6” spacing (refer to Table
6.4).
Effect of Joint Width
• Shear deflection depends on joint width and is significant for FRP dowels.
i. For example, when joint width z =0.25” with 6” dowel spacing, shear
deflection of FRP dowel (δ) was 2.468/11.43=21.59% of the total relative
deflection. Shear deflection of steel dowel with 0.25” joint width was only
0.15% (0.009/5.82) of its total relative deflection. When joint width is reduced
to 1/32” (FRP* case in Table 6.1), the shear deflection of FRP dowels is only
3.70% (0.309/8.35) as compared to 21.59% (refer to Table 6.2).
• For same diameter (1.0”) FRP dowels, contraction joint model will greatly
reduce the shear effect of dowels.
i. For example, relative deflection for joints with FRP dowel bars are greatly
reduced (11.43 vs. 8.35 milli-inch) with joint width of 1/4" reduced to 1/32”.
Effect of Dowel Length
• Required FRP dowel length for 1.0” diameter is only 69.23% (9/13) of the
required length of steel dowel with same diameter. Based on inflexion points
(Figure 6.15), minimum total length for steel dowel is 13” (2x6.5”), whereas
for FRP dowel is 9” (2 x 4.5”).

154
Effect on Bearing Stress
• In order to meet bearing stress limit (4500 psi in this case) spacings for steel
dowel (1.0” diameter) should be limited to 12” whereas spacing for FRP
dowels (1.0” diameter) should not be more than 3.5” (expansion joint) or 4.0”
(contraction joint) (Table 6.4).
• For 1.0” diameter FRP dowel bars with 6” c/c spacing, average bearing stress
is only 34.94% (distance from joint face to the first reflection point) and
50.44% (within 1” distance from joint face) of the peak bearing stress (Tables
6.5 and 6.6). Hence, based on stress redistribution, peak bearing stress doesn’t
appear to have damaged concrete surface.
7.5 General Conclusions from This Research
1. In this research, FRP dowels were found to be good alternatives to traditional
steel dowels for transferring joint loads in JPCP pavements. Joints with FRP
dowels provided adequate Load Transfer Efficiency exceeding the values
recommended by AASHTO (75%) and ACPA (60%) in both laboratory tests
and field tests.
2. FRP dowel-concrete interfaces in slab #1 and slab #4 after 5 million HS25 load
cycles were found to be in excellent condition with no visible damage,
microcrack or separation between FRP dowel and surrounding concrete (refer to
Figures 4.19 and 4.27).
3. Stiffness match between FRP dowel and concrete leads to comparable FRP
dowel flexing under joint loads leading to shorter FRP dowel length. Required
length of FRP dowel with 1.5” diameter is 64.7% of that for steel dowel with
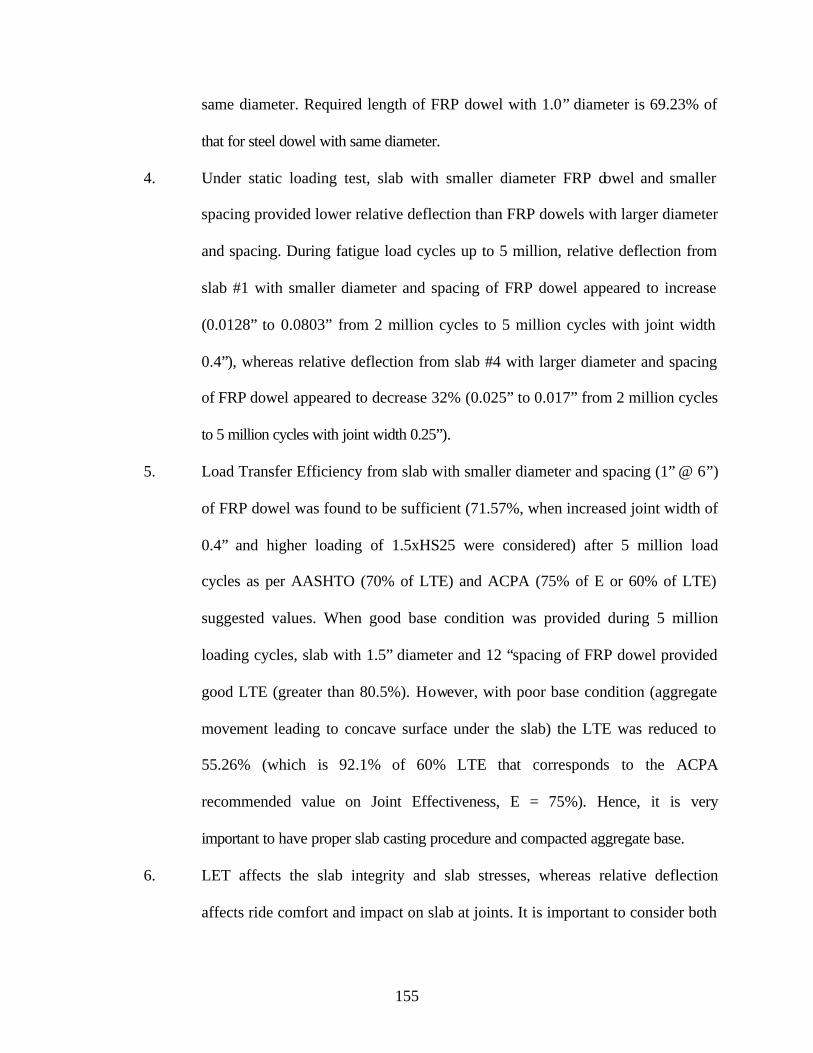
155
same diameter. Required length of FRP dowel with 1.0” diameter is 69.23% of
that for steel dowel with same diameter.
4. Under static loading test, slab with smaller diameter FRP dowel and smaller
spacing provided lower relative deflection than FRP dowels with larger diameter
and spacing. During fatigue load cycles up to 5 million, relative deflection from
slab #1 with smaller diameter and spacing of FRP dowel appeared to increase
(0.0128” to 0.0803” from 2 million cycles to 5 million cycles with joint width
0.4”), whereas relative deflection from slab #4 with larger diameter and spacing
of FRP dowel appeared to decrease 32% (0.025” to 0.017” from 2 million cycles
to 5 million cycles with joint width 0.25”).
5. Load Transfer Efficiency from slab with smaller diameter and spacing (1” @ 6”)
of FRP dowel was found to be sufficient (71.57%, when increased joint width of
0.4” and higher loading of 1.5xHS25 were considered) after 5 million load
cycles as per AASHTO (70% of LTE) and ACPA (75% of E or 60% of LTE)
suggested values. When good base condition was provided during 5 million
loading cycles, slab with 1.5” diameter and 12 “spacing of FRP dowel provided
good LTE (greater than 80.5%). However, with poor base condition (aggregate
movement leading to concave surface under the slab) the LTE was reduced to
55.26% (which is 92.1% of 60% LTE that corresponds to the ACPA
recommended value on Joint Effectiveness, E = 75%). Hence, it is very
important to have proper slab casting procedure and compacted aggregate base.
6. LET affects the slab integrity and slab stresses, whereas relative deflection
affects ride comfort and impact on slab at joints. It is important to consider both

156
relative deflection and Load Transfer Efficiency when the performance of JPCP
is evaluated. For example, at 5 million cycles, slab #4 with 1.5” diameter FRP
dowel spaced at 12” c/c had 55.26% LTE, but its relative deflection (0.017”)
was less than that of the slab #1 with 1.0” diameter FRP dowel with 71.6% LTE
spaced at 6” c/c (0.0803”).
7. FRP dowel can be used as effective alternatives for construction and
rehabilitation of JPCP under highway traffic with advantages of corrosion
resistance and decreased maintenance. Long-term performance evaluation of
JPCP with FRP dowels is being continued by CFC-WVU.
7.6 Recommendations
1. More number of laboratory specimens are recommended to be tested for establishing
possible ranges of Load Transfer Efficiency and Relative Deflection values for
different diameter, spacing and length of dowel.
2. Further investigate crack formation location by using increased FRP dowel length
including deflection shapes.
3. Evaluate actual dowel bar deflected shapes in the slab under different base removal
conditions.
4. Evaluate effect of peak bearing stress and average bearing stress on dowel/concrete
interface.
5. Evaluate effect of Fiber Volume Fraction on dowel behavior including shear
properties that affect joint load transfer efficiency and relative deflection.
6. Evaluate durability of FRP dowel.
7. Utilize Finite Element Modeling to envision stress field in the concrete pavement.
8. Continue long-term field monitoring.

157
REFERENCES
1. Vijay, P.V. and GangaRao, H.V.S., “Development of Fiber Reinforced Plastics
for Highway Applicatioin: Aging Behavior of Concrete Beams Reinforced with
GFRP bars”, CFC-WVU Report No.99-265 (WVDOH RP #T-699-FRP1), 1999.
2. Timoshenko, S. and J.M. Lessels, “Applied Elasticity”, Westinghouse Technical
Night School Press, Pennsylvania, 1925.
3. American Concrete Pavement Association (ACPA), “Design and Construction of
Joints for Concrete Highways”, ACPA, Skokie, Illinois, 1991.
4. American Association of State Highway and Transportation Officials (AASHTO),
“AASHTO Guide for Design of Pavement Structures”, AASHTO, Washington,
D.C., 1993.
5. Huang, Y.H., “Pavement Analysis and Design”, Prentice Hall, Inc., New Jersey,
1993.
6. Friberg, B.F., “Design of Dowels in Transverse Joints of Concrete Pavements”,
Transactions, American Society of Civil Engineers. Vol. 105, No. 2081, 1940.
7. Yoder, E.J. and M.W. Witczak, “Principles of Pavement Design”, 2nd ed. John
Wiley & Sons, Inc., New York, 1975.
8. Westergaard, H.M., “Computation of Stresses in Concrete Roads”, Proceedings,
5th Annual Meeting of the Highway Research Board, Washington, D.C., 1925.
9. Tabatabaie, A.M., E.J. Barenburg, and R.E. Smith., “Longitudinal Joint Systems
in Slipformed Rigid Pavements”, Vol. II-Analysis of Load Transfer Systems for

158
Concrete Pavements. Report No. DOT/FAA.RD-79/4, Federal Aviation
administration, U.S. Department of Transportation, 1979.
10. Max L. Porter, Robert J. Guinn Jr., Andrew L. Lundy, Dustin D. Davis, John G.
Rhner, “Investigation of Glass Fiber Composite Dowel Bars For Highway
Pavement Slabs”, Project No. TR-408, Iowa State University, 2001.
11. Albertson, M.D., “Fiber composite and Steel Pavement Dowels”, Masters Thesis.
Iowa State University, 1992.
12. Max l. Porter, Robert J. Guinn Jr., “Assessment of Dowel Bar Research”, Iowa
DOT Project HR-1080, Center for Transportation Research and Education, Iowa
State University, 2002.
13. Eddie, D., Shalaby, A., Rizkalla, S., “Glass Fiber-Reinforced Polymer Dowels for
Concrete Pavements”, American Concrete Institute Structural Journal, vol. 98, no.
2, March-April, 2001.
14. Ahmed, S., Scott M., “Using Fiber-Reinforced Polymer Load Transfer Devices in
Jointed Concrete Pavements”, 7th International Conference on Concrete
Pavements - Orlando, Florida, USA- September 9-13, 2001.
15. Ambroz, J., “Dowel Bars for You, Me, and PCC”, American Highway
Technology,
http://www.americanhighwaytechnology.com/loadtransfer/loadtransfer.html
16. American Association of State Highway and Transportation Officials (AASHTO),
“Standard Specifications for Highway Bridges”, 15th ed., AASHTO, Washington,
DC., 1992.
159
17. V. L. Brown and C. L. Bartholomew, “FRP Dowel Bars in Reinforced Concrete
Pavements”, 1993.
18. Advisory Circular, Federal Aviation Administration, U.S. Department of
Transportation, AC No: 150/5320-6D.
19. American Standard for Testing and Materials (ASTM), “Annual Book of ASTM
Standards, Concrete and Aggregates, Vol. 0402.
20. Washington State Department of Transportation (WSDOT), Pavement Guide,
http://hotmix.ce.washington.edu/wsdot_web/

160
APPENDIX A
Test of Timber Tie with FRP Dowels
Before evaluating FRP dowels in concrete slabs joints, pilot tests were carried out
using rectangular timber beams. Long timer beam was cut into two halves and drilled
with 1.75” diameter holes to simulate dowel sockets in a slab. Dowel sockets facilitated
placement of instrumented dowel inside the timber beams. Load tests were conducted by
turning dowels at 45-degree angles to measure dowel strains from longitudinal and
transverse gages (Figs. A.1 to A.3).
Four cases were evaluated based on loading position and timber depth
(corresponding to positioning of the timber beam surface on the base), test set up of each
case were shown in Figure A.2.
Figure A.1 Lab test of timber tie with FRP dowel bar as the load transfer device

161
Figure A.2 Four Timber Test Cases

162
Figure A.3 Rosette strain gages
Table A.1 Strains during loading and unloading on Case-I-A
a) Loading b) Unloading Load (kips)
Transverse Gage
Longitudinal Gage
Load (kips)
Transverse Gage
Longitudinal Gage
0 0 0 20 1627 7836 1 64 576 19 1610 7797 2 229 1707 18 1580 7752 3 377 2585 17 1554 7707 4 493 3182 16 1527 7662 5 624 3848 15 1498 7609 6 725 4389 14 1467 7562 7 804 4770 13 1432 7522 8 871 5118 12 1391 7420 9 933 5415 11 1346 7365 10 1021 5668 10 1292 7167 11 1105 5962 9 1226 7032 12 1166 6188 8 1135 6982 13 1223 6384 7 1032 6670 14 1285 6584 6 940 6495 15 1347 6844 5 790 5957 16 1393 7011 4 674 5610 17 1451 7204 3 560 4971 18 1515 7409 2 605 3987 19 1564 7599 1 171 2370 20 1627 7781 0 0 0

163
Table A.2 Strains during loading and unloading on Case-I-B
a) Loading b) Unloading Load (kips)
Transverse Gage
Longitudinal Gage
Load (kips)
Transverse Gage
Longitudinal Gage
0 0 0 20 1357 5920 1 59 49 16 1332 5976 2 220 592 12 1302 5931 3 511 1787 8 1265 5863 4 734 3238 4 1081 5066 5 799 3419 0 0 136 6 899 3872 7 908 4040 8 1012 4325 9 1040 4559 10 1067 4740 11 1106 4901 12 1137 5044 13 1144 5091 14 1152 5119 15 1186 5241 16 1206 5339 17 1251 5473 18 1277 5610 19 1310 5746 20 1357 5920
0
5
10
15
20
25
0 2000 4000 6000 8000 10000Strain (Micro Strain)
Lo
ad (K
ips)
Loaded
unloaded
Figure A.4 Plot for Longitudinal Strain Gages (Case-I-A & Case-I-B)

164
Table A.3 Strains during loading and unloading on Case-II-A
a) Loading b) Unloading
Load (kips)
Transverse Gage
Longitudinal Gage
Load (kips)
Transverse Gage
Longitudinal Gage
0 0 0 20 1 7 2 1 8 16 1 6 4 1 7 12 1 6 6 1 7 8 1 6 8 1 7 4 1 6 10 1 7 0 0 0 12 1 7 14 1 7 16 1 6 18 1 7 20 1 7
Table A.4 Deflections of Timber Tie on Case-I-A
Load (kips) Dial gage reading at Loaded end
(in.)
Deflection at x1 (in.)
Dial gage reading at Unloaded End
(in.)
Deflection at x2 (in.)
0 0.469 0.000 0.515 0.000 1 0.402 0.067 0.490 0.025 2 0.335 0.134 0.465 0.050 3 0.238 0.231 0.468 0.047 4 0.170 0.299 0.467 0.048 5 0.130 0.339 0.466 0.049 6 0.080 0.389 0.465 0.050 7 0.048 0.421 0.465 0.050 8 0.020 0.449 0.465 0.050 9 -0.190 0.659 0.465 0.050 10 -0.170 0.639 0.465 0.050 11 -0.160 0.629 0.465 0.050 12 -0.150 0.619 0.465 0.050 13 -0.162 0.631 0.465 0.050 14 -0.176 0.645 0.466 0.049 15 -0.197 0.666 0.466 0.049 16 -0.215 0.684 0.467 0.048 17 -0.229 0.698 0.467 0.048 18 -0.247 0.716 0.468 0.047 19 -0.262 0.731 0.468 0.047 20 -0.275 0.744 0.469 0.046

165
Table A.5 Deflections of Timber Tie on Case-I- B
Load (kips) Dial gage reading at Loaded end
(in.)
Deflection at y1 (in.)
Dial gage reading at Unloaded End
(in.)
Deflection at y2 (in.)
0 0.915 0.000 0.525 0.000 1 0.870 0.045 0.501 0.024 2 0.825 0.090 3 0.660 0.255 4 0.575 0.340 0.406 0.119 5 0.515 0.400 6 0.462 0.453 7 0.430 0.485 8 0.390 0.525 0.397 0.128 9 0.365 0.550 10 0.331 0.584 11 0.300 0.615 12 0.272 0.643 0.388 0.137 13 0.250 0.665 14 0.228 0.687 15 0.202 0.713 16 0.185 0.730 0.383 0.142 17 0.165 0.750 18 0.140 0.775 19 0.123 0.792 20 0.090 0.825 0.382 0.143

166
0
5
10
15
20
25
0.000 0.100 0.200 0.300 0.400 0.500 0.600 0.700 0.800
Lo
ad (
kip
s)Loaded X1unloaded x2
Figure A.5 Load vs. Deflection of Timber Tie for CASE-I-A
0
5
10
15
20
25
0.000 0.200 0.400 0.600 0.800 1.000
Lo
ad (
kip
s)
Loaded Y1unloadedy2
Figure A.6 Load-Deflection (arm with regular gage) for CASE-I-B
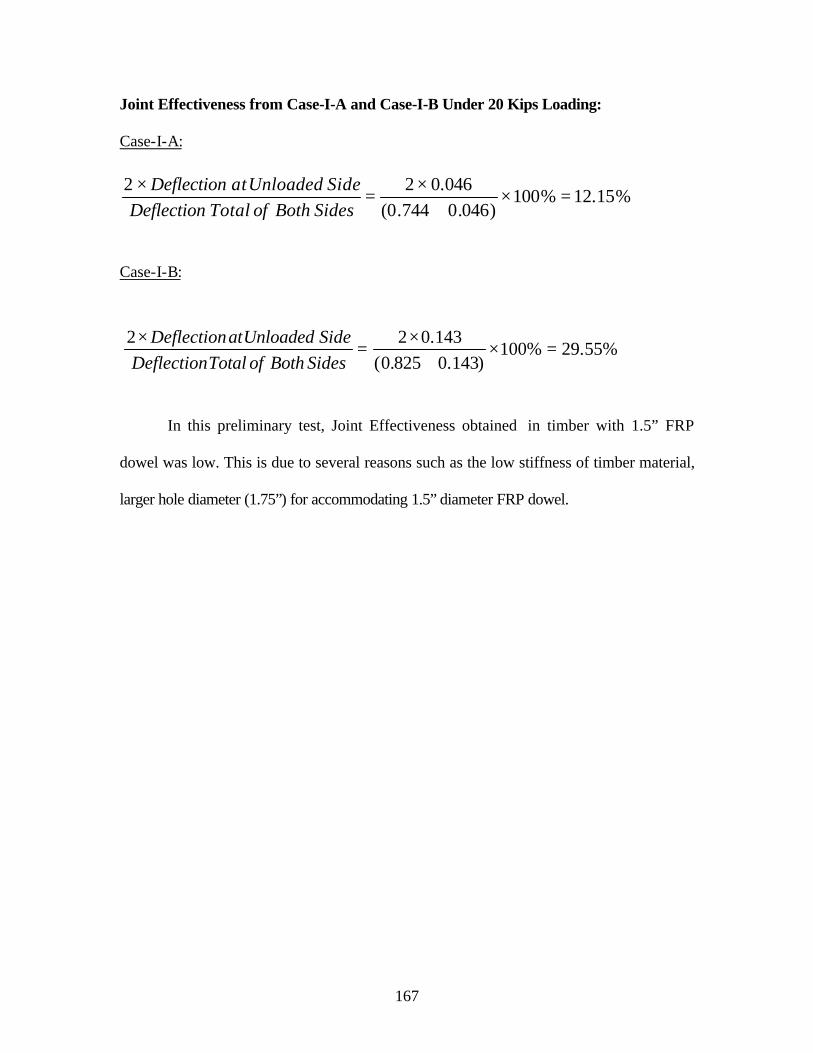
167
Joint Effectiveness from Case-I-A and Case-I-B Under 20 Kips Loading: Case-I-A:
Case-I-B:
In this preliminary test, Joint Effectiveness obtained in timber with 1.5” FRP
dowel was low. This is due to several reasons such as the low stiffness of timber material,
larger hole diameter (1.75”) for accommodating 1.5” diameter FRP dowel.
%15.12%100)046.0744.0(
046.022=×
+×
=×
SidesBothofTotalDeflectionSideUnloadedatDeflection
%55.29%100)143.0825.0(
143.022=×
+×
=×
SidesBothofTotalDeflectionSideUnloadedatDeflection

168
APPENDIX B
Analytical Evaluation of Effect of FRP Dowel Shear Modulus on Pavement Relative
Deflection
Analytical Evaluation was conducted to find the effect of a dowel shear modulus on
pavement relative deflection. Parameters used for calculation were listed below. Detailed
data were shown in Tables B.1 and B.2, and Figures B.1 and B.2:
1. FRP dowel
• Diameter, d = 1.5” and 1.0”
• Length, L= 18”
• Spacing between each dowel, b = 6”, 8”, 10”, and 12.0”
• Modulus of elasticity, Ed = 5.5x10⁶ psi for 1.5” diameter dowel and Ed =
6.0x10⁶ psi for 1.0” diameter
• Shear modulus of dowel, Low Gd = 0.4x10⁶ psi and High Gd =
0.75x10⁶ psi
• Moment of inertia of the dowel, Id 0.24850564
4
=×
=dπ
(in4)
• Cross-sectional area of dowel, A = 1.77 in.2
2. Concrete pavement
• Compressive strength, fc’ = 4500 psi
• Modulus of elasticity, Ec = 5.0)'(57000 cf× = 3823676.2 psi=3.82×10⁶ psi
• Pavement thickness, h = 11 in.
• Joint width, z = 0.25 in.
• Poisson’s ratio of concrete, ν = 0.2
• Modulus of dowel support, K0 = 1,500,000 pci
3. Base
• Modulus of subgrade reaction, k = 400 pci
4. Load
• Design Traffic Load HS25, applied wheel load Pw = 20000lbs
• Design load transfer by joint = 45%
• Pt = load transferred across the joint = 45.0×wP = 9000 lbs

169
Table B.1 Relative Deflection With Low Dowel Shear Modulus (Gd= 0.4×10⁶ psi)
Dia. of Dowel
(in.)
Bending Deflection
(in.)
Bending Deflection
(in.)
Shear Deflection
(in.)
Total Relative Deflection
(in.)
1.0 0.0045 0.0045 0.0025 0.0114
1.5 0.0022 0.0022 0.0011 0.0055
1.0 0.0057 0.0057 0.0031 0.0145
1.5 0.0028 0.0028 0.0014 0.0070
1.0 0.0067 0.0067 0.0037 0.0171
1.5 0.0033 0.0033 0.0016 0.0082
1.0 0.0076 0.0076 0.0042 0.0195
1.5 0.0037 0.0037 0.0019 0.0093
Table B.2 Relative Deflection With High Dowel Shear Modulus (Gd= 7.5×10⁶ psi)
Dia. of Dowel
(in.)
Bending Deflection
(in.)
Bending Deflection
(in.)
Shear Deflection
(in.)
Total Relative Deflection
(in.)
1.0 0.0045 0.0045 0.0013 0.0103
1.5 0.0022 0.0022 0.0006 0.0050
1.0 0.0057 0.0057 0.0017 0.0131
1.5 0.0028 0.0028 0.0007 0.0063
1.0 0.0067 0.0067 0.0020 0.0154
1.5 0.0033 0.0033 0.0009 0.0074
1.0 0.0076 0.0076 0.0022 0.0175
1.5 0.0037 0.0037 0.0010 0.0085

170
0.0000
0.0020
0.0040
0.0060
0.0080
0.0100
0.0120
0.0140
0.0160
0.0180
0.0200
Def
lect
ions
. (in
.)
Shear 0.0025 0.0011 0.0031 0.0014 0.0037 0.0016 0.0042 0.0019
Bending 0.0045 0.0022 0.0057 0.0028 0.0067 0.0033 0.0076 0.0037
Bending 0.0045 0.0022 0.0057 0.0028 0.0067 0.0033 0.0076 0.0037
6 in. c/c Dowel A
6 in. c/c Dowel B
8 in. c/c Dowel A
8 in. c/c Dowel B
10 in. c/c
Dowel A
10 in. c/c
Dowel B
12 in. c/c
Dowel A
12 in. c/c
Dowel B
Figure B.1 Components of Relative Deflection for Dowel Types A (1.0" diameter) and B
(1.5" diameter), with k=400pci, fc'=4500psi, Joint width=0.25" and Gd=0.4×10⁶psi
0.00000.0020
0.00400.0060
0.00800.01000.0120
0.01400.0160
0.01800.0200
Def
lect
ions
. (in
.)
Shear 0.0013 0.0006 0.0017 0.0007 0.0020 0.0009 0.0022 0.0010
Bending 0.0045 0.0022 0.0057 0.0028 0.0067 0.0033 0.0076 0.0037
Bending 0.0045 0.0022 0.0057 0.0028 0.0067 0.0033 0.0076 0.0037
6 in. c/c Dowel A
6 in. c/c Dowel B
8 in. c/c Dowel A
8 in. c/c Dowel B
10 in. c/c
Dowel A
10 in. c/c
Dowel B
12 in. c/c
Dowel A
12 in. c/c
Dowel B
Figure B.2 Components of Relative Deflection for Dowel Types A (1.0" diameter) and B
(1.5" diameter), with k=400pci, fc'=4500psi, Joint width=0.25" and Gd=0.75×10⁶psi

171
APPENDIX C
Fiber Burnout Tests for Determining Fiber Weight Fraction and Fiber Volume
Fraction for FRP Dowels
Burnout tests were conducted to determine the fiber weight fraction (FWF) and fiber
volume fraction (FVF) for both 1.0” diameter FRP dowel and 1.5” diameter FRP dowel bars.
Details are listed in Tables C.1 and C.2.
Table C.1 FWF and FVF for FRP dowel with 1.0” diameter
FRP Sample
Total
E-glass Fiber Sample
Weight
(g)
Volume
(in3)
Resin
Weight (g)
Weight
(g)
Volume
(in3)
Fiber
Weight
Fraction
(FWF, %)
Fiber
Volume
Fraction
(FVF, %)
A1 23.00 0.7399 6.38 16.62 0.3977 72.26 53.75
A2 23.12 0.7383 6.40 16.72 0.4001 72.31 54.20
Average 72.29 53.98
NOTE: E-glass fiber volume was calculated by using E-glass fiber weight divided by its
density (2.55 g/cm3), a converter factor 1 cm3 = 0.06102374 in3 was used for the calculations.
Table C.2 FWF and FVF for FRP dowel with 1.5” diameter
FRP Sample
Total
E-glass Fiber Sample
Weight
(g)
Volume
(in3)
Resin
Weight (g)
Weight
(g)
Volume
(in3)
Fiber
Weight
Fraction
(FWF, %)
Fiber
Volume
Fraction
(FVF, %)
B1 54.81 1.7737 16.736 38.074 0.9111 69.47 51.37
B2 54.19 1.7576 16.546 37.644 0.9009 69.47 51.25
Average 69.47 51.31
NOTE: E-glass fiber volume was calculated by using E-glass fiber weight divided by its
density (2.55 g/cm3, 0.092 lb/in3), a conversion factor 1 cm3 = 0.06102374 in3 was used for
the calculations.