EVALUATION OF INTEGRATED FISH FARMING WITH …...EVALUATION OF INTEGRATED FISH FARMING WITH CHICKEN...
8
EVALUATION OF INTEGRATED FISH FARMING WITH CHICKEN AND VEGETABLES IN SILTE DISTRICT OF SOUTHERN ETHIOPIA ABSTRACT The study was conducted in Silte district of Southern Ethiopia with the objective to assess the productivity and profitability of integrated fish with chicken and vegetable farming in the study area. A pond with a surface area of 150 m 2 (10m*15m) and depth of 1.2m was used for the investigation. A poultry house was constructed over the pond with an open garden and a laying room. Twenty five White Leghorn chicken (5 cocks and 20 pullets) of two months old were introduced in to the shelter. Fingerlings of Nile Tilapia (Oreochromis niloticus) 330 fish in number were used to stock the ponds. Three vegetables, viz., onion (Red bombey), cabbage (Vikima) and tomato (ROMA VFN) were grown near by the pond using pond and stream water with or without inorganic fertilizer application.The result indicates that the mean values of pond water physico-chemical characteristics such as conductivity, average temperature, total digestible solute, salinity, resistivity, pH and dissolved oxygen (DO) of the pond water were 113.5μS, 25 0 C, 84.5 mg/L, 0.07ppt, 8.3 MΩ, 8.1 and 4.5 mg/L, respectively. A total of 2392 chicken eggs were produced within 161 days. The total fishes produced in number were 3000 and their total weight was 326000 gram (g). The average weight of a fish was 108.7g. Vegetable production varied significantly (p<0.05) with pond and stream water and with or without inorganic fertilizer use. The partial budget analysis of the integrated farming indicates that the estimated net profit obtained on 0.25ha of land was 9336.13 Eth Birr (1 Birr = 0.044 USD). However, the net profits from a common crop in the area (maize), fish, chicken and vegetables alone were 2, 9, 18.2 and 72.8 % of the net profit obtained from the integrated system. This indicates that poultry-fish-vegetables integration fetches a higher revenue over the mono crop or mono livestock activities. However, to fetch maximum revenue from the integration, the water physio- chemical characteristics should be kept at constant, with proper species and number of fish introduced, managed and fed with chicken droppings from the optimum chicken number per square meter. Keywords: Fish-Chicken-vegetable integration, productivity, profitability, Silte Zone. Name of the Author: Dinku Getu 1* , Fekadu Amare 1 , Tekleyohannes Berhanu 2 , Hizkiel Kinfo 1 , Tsegaye Terefe 1 1 Worabe Agricultural Research Center, Silte zone, Worabe, Ethiopia* 2 Southern Agricultural Research Institute, P. O. Box 6, Hawassa, Ethiopia Advance Research Journal of Multi-Disciplinary Discoveries I Vol. 17.0 I Issue – I ISSN NO : 2456-1045 ISSN : 2456-1045 (Online) (ICV-AGS/Impact Value): 3.08 (GIF) Impact Factor: 2.174 Copyright@IJF 2017 Journal Code: ARJMD/AGS/V-17.0/I-1/C-5/SEP-2017 Category : AGRICULTURAL SCIENCE Volume : 17.0 / Chapter- V / Issue -1 (SEPTEMBER) Website: www.journalresearchijf.com Received: 11.08.2017 Accepted: 30.08.2017 Date of Publication: 12-10-2017 Page: 20-27 Citation of the Article Original Research Article Getu D; Amare F; Berhanu T; Kinfo H. & Terefe T. (2017). Evaluation of Integrated Fish Farming with Chicken and Vegetables in Silte District of Southern Ethiopia; Advance Research Journal of Multidisciplinary Discoveries.17.0,C- 5(2017):20-27; available at : http://www.journalresearchijf.com e; An open access journal of International Journal Foundation ( www.journalresearchijf.com) Page I 20
Transcript of EVALUATION OF INTEGRATED FISH FARMING WITH …...EVALUATION OF INTEGRATED FISH FARMING WITH CHICKEN...

EVALUATION OF INTEGRATED FISH FARMING WITH CHICKEN AND
VEGETABLES IN SILTE DISTRICT OF SOUTHERN ETHIOPIA
ABSTRACT
The study was conducted in Silte district of Southern Ethiopia
with the objective to assess the productivity and profitability of
integrated fish with chicken and vegetable farming in the study
area. A pond with a surface area of 150 m2 (10m*15m) and
depth of 1.2m was used for the investigation. A poultry house
was constructed over the pond with an open garden and a
laying room. Twenty five White Leghorn chicken (5 cocks and
20 pullets) of two months old were introduced in to the shelter.
Fingerlings of Nile Tilapia (Oreochromis niloticus) 330 fish in
number were used to stock the ponds. Three vegetables, viz.,
onion (Red bombey), cabbage (Vikima) and tomato (ROMA
VFN) were grown near by the pond using pond and stream
water with or without inorganic fertilizer application.The result
indicates that the mean values of pond water physico-chemical
characteristics such as conductivity, average temperature, total
digestible solute, salinity, resistivity, pH and dissolved oxygen
(DO) of the pond water were 113.5µS, 250C, 84.5 mg/L,
0.07ppt, 8.3 MΩ, 8.1 and 4.5 mg/L, respectively. A total of
2392 chicken eggs were produced within 161 days. The total
fishes produced in number were 3000 and their total weight was
326000 gram (g). The average weight of a fish was 108.7g.
Vegetable production varied significantly (p<0.05) with pond
and stream water and with or without inorganic fertilizer use.
The partial budget analysis of the integrated farming indicates
that the estimated net profit obtained on 0.25ha of land was
9336.13 Eth Birr (1 Birr = 0.044 USD). However, the net
profits from a common crop in the area (maize), fish, chicken
and vegetables alone were 2, 9, 18.2 and 72.8 % of the net
profit obtained from the integrated system. This indicates that
poultry-fish-vegetables integration fetches a higher revenue
over the mono crop or mono livestock activities. However, to
fetch maximum revenue from the integration, the water physio-
chemical characteristics should be kept at constant, with proper
species and number of fish introduced, managed and fed with
chicken droppings from the optimum chicken number per
square meter.
Keywords:
Fish-Chicken-vegetable integration,
productivity,
profitability,
Silte Zone.
Name of the Author:
Dinku Getu1*
, Fekadu Amare1, Tekleyohannes
Berhanu2, Hizkiel Kinfo
1, Tsegaye Terefe
1
1 Worabe Agricultural Research Center, Silte zone, Worabe,
Ethiopia*
2 Southern Agricultural Research Institute, P. O. Box 6,
Hawassa, Ethiopia
Advance Research Journal of Multi-Disciplinary Discoveries I Vol. 17.0 I Issue – I ISSN NO : 2456-1045
ISSN : 2456-1045 (Online)
(ICV-AGS/Impact Value): 3.08
(GIF) Impact Factor: 2.174
Copyright@IJF 2017
Journal Code: ARJMD/AGS/V-17.0/I-1/C-5/SEP-2017
Category : AGRICULTURAL SCIENCE
Volume : 17.0 / Chapter- V / Issue -1 (SEPTEMBER)
Website: www.journalresearchijf.com
Received: 11.08.2017
Accepted: 30.08.2017
Date of Publication: 12-10-2017
Page: 20-27
Citation of the Article
Original Research Article
Getu D; Amare F; Berhanu T; Kinfo H. & Terefe T. (2017).
Evaluation of Integrated Fish Farming with Chicken and
Vegetables in Silte District of Southern Ethiopia; Advance
Research Journal of Multidisciplinary Discoveries.17.0,C-
5(2017):20-27; available at : http://www.journalresearchijf.com
e;
An open access journal of International Journal Foundation ( www.journalresearchijf.com) Page I 20
Advance Research Journal of Multi-Disciplinary Discoveries I Vol. 17.0 I Issue – I ISSN NO : 2456-1045
2.2. Pond preparation and watering
A pond with surface area of 150 m2 (10m*15m) and depth of
1.0m to 1.3m (in the out let side) was used for the
investigation. The floor of the pond was lined with fine red clay
soil to reduce down ward water percolation. A water inlet canal
was prepared for the pond with two silt boxes for the protection
of mud/sand siltation. The water was streamed to the pond
through a pipe fixed by cement on the rear silt box. Similarly, a
water out let pipe/canal was fixed to the pond. Both the inlet
and out let canals/pipes were covered with a mesh wire of
0.5cm size in order to protect fish predators. The pond was
filled with water directly from the stream in 3 days interval.
Lime at a rate of 15kg/100m2 (about 22.5kg) was added to the
pond to neutralize the water pH. Manure was added to the pond
once a month at the rate of 10.5/100m2 to enhance the
development of algae flora. The pond water was refreshed
weekly and kept until the required parameters were measured.
2.3. Chicken stocking and management
A poultry house was constructed over the pond with
an opening garden and a laying room. It was designed to have
an access to the terrestrial and to furnish the chicken droppings
directly to the pond. Twenty five White Leghorn chicken (5
cocks and 20 pullets) of two months age were introduced to the
shelter. The chicken was kept for 15 days before introduction
of fish fingerlings to furnish the pond water with chicken
droppings. The chickens were supplied with layers concentrate
feed at the rate of 100-120 g/day/chicken and clean water as ad
labium. Chicken were vaccinated for Marex, Gumboro and
New castle diseases as recommended. Diseased chicken were
separated from the healthy ones and treated by appropriate
medicine. Laying boxes were prepared and placed in the
darkest part of the shelter and daily egg production was
collected from the boxes and recorded. Egg data was collected
for a total of 161 consecutive days.
2.4. Fish stocking
Fingerlings of Nile Tilapia (Oreochromis niloticus)
were used to stock the ponds. The fish was selected due to its
fast growth and suitability to the environmental condition of
the study area. The stocked fingerlings were two months old,
weighing on an average 20g. The fish fingerlings were obtained
from Sebeta National Fisheries and Other Aquatic Life
Research Center, central Ethiopia. The total fingerlings
stocked in the pond were 330 fish in number, assuming 2 fish
per meter square and a mortality rate of 10%. The fish
fingerlings were supplied with wheat bran and Noug cake in a
3:1 mix. The selected supplement was prepared to float on the
surface. The quantity of feeding varied with the age of the fish.
During the first to the 3rd months of age, the fish were fed 5%
of their body weight (BW) and above 3 months of age fed at a
rate of 2% of their BW. Feed was provided twice a day (at 10
AM and 3 PM).
2.5. Vegetable production and management
The vegetables selected for the evaluation were onion
(Red bombey), cabbage (Vikima) and tomato (ROMA VFN).
The vegetable were planted randomly in four treatment designs
(Table 1), on a plot of 3m x 2m using randomized complete
block design (RCBD) with 4 replications, between plots and
between replications sizes were 0.5m and 1m, respectively. The
vegetables were planted 6 months and 5.5 months after the
chicken and fish introductions, respectively. Vegetable plots
were managed for seasonal and off time weed. The inorganic
fertilizers DAP and urea (Table 1) was applied at sowing and
after 40days of vegetable sowing, respectively. Anti fungal and
insecticidal chemicals were applied as necessary.
INTE
RN
ATI
ON
AL
JO
UR
NA
L F
OU
ND
ATI
ON
An open access journal of International Journal Foundation ( www.journalresearchijf.com) Page I 21
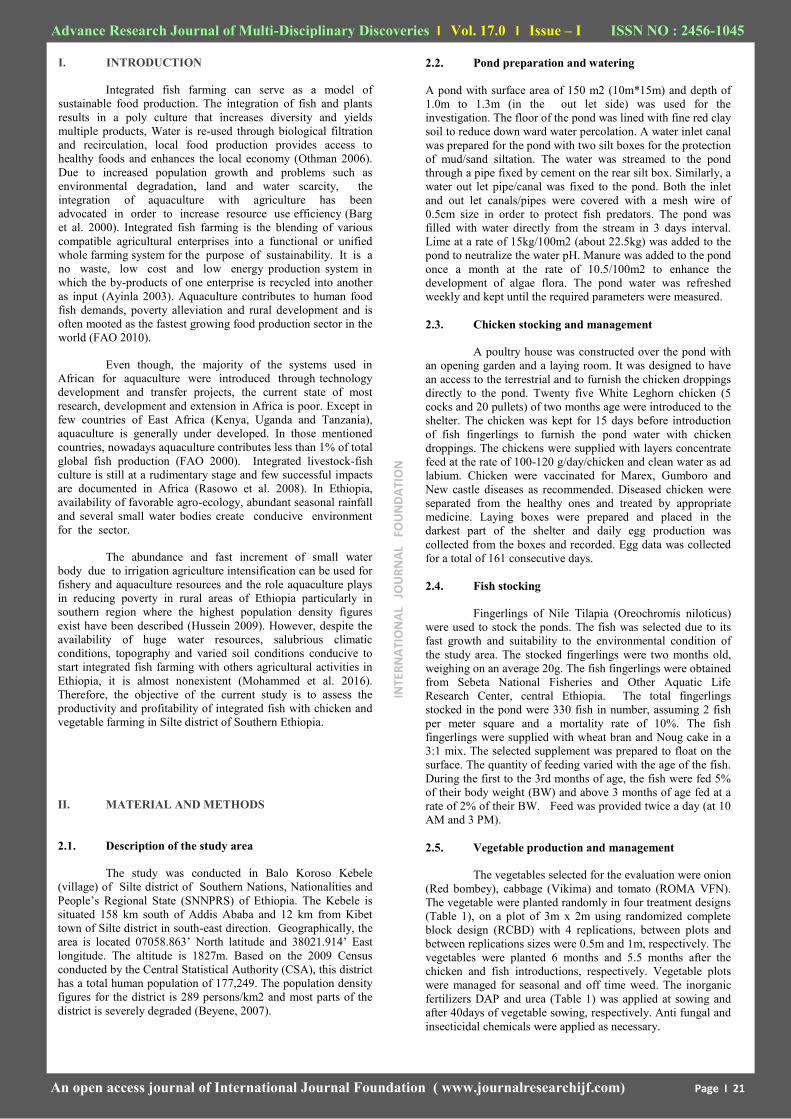
I. INTRODUCTION
Integrated fish farming can serve as a model of
sustainable food production. The integration of fish and plants
results in a poly culture that increases diversity and yields
multiple products, Water is re-used through biological filtration
and recirculation, local food production provides access to
healthy foods and enhances the local economy (Othman 2006).
Due to increased population growth and problems such as
environmental degradation, land and water scarcity, the
integration of aquaculture with agriculture has been
advocated in order to increase resource use efficiency (Barg
et al. 2000). Integrated fish farming is the blending of various
compatible agricultural enterprises into a functional or unified
whole farming system for the purpose of sustainability. It is a
no waste, low cost and low energy production system in
which the by-products of one enterprise is recycled into another
as input (Ayinla 2003). Aquaculture contributes to human food
fish demands, poverty alleviation and rural development and is
often mooted as the fastest growing food production sector in the
world (FAO 2010).
Even though, the majority of the systems used in
African for aquaculture were introduced through technology
development and transfer projects, the current state of most
research, development and extension in Africa is poor. Except in
few countries of East Africa (Kenya, Uganda and Tanzania),
aquaculture is generally under developed. In those mentioned
countries, nowadays aquaculture contributes less than 1% of total
global fish production (FAO 2000). Integrated livestock-fish
culture is still at a rudimentary stage and few successful impacts
are documented in Africa (Rasowo et al. 2008). In Ethiopia,
availability of favorable agro-ecology, abundant seasonal rainfall
and several small water bodies create conducive environment
for the sector.
The abundance and fast increment of small water
body due to irrigation agriculture intensification can be used for
fishery and aquaculture resources and the role aquaculture plays
in reducing poverty in rural areas of Ethiopia particularly in
southern region where the highest population density figures
exist have been described (Hussein 2009). However, despite the
availability of huge water resources, salubrious climatic
conditions, topography and varied soil conditions conducive to
start integrated fish farming with others agricultural activities in
Ethiopia, it is almost nonexistent (Mohammed et al. 2016).
Therefore, the objective of the current study is to assess the
productivity and profitability of integrated fish with chicken and
vegetable farming in Silte district of Southern Ethiopia.
II. MATERIAL AND METHODS
2.1. Description of the study area
The study was conducted in Balo Koroso Kebele
(village) of Silte district of Southern Nations, Nationalities and
People’s Regional State (SNNPRS) of Ethiopia. The Kebele is
situated 158 km south of Addis Ababa and 12 km from Kibet
town of Silte district in south-east direction. Geographically, the
area is located 07058.863’ North latitude and 38021.914’ East
longitude. The altitude is 1827m. Based on the 2009 Census
conducted by the Central Statistical Authority (CSA), this district
has a total human population of 177,249. The population density
figures for the district is 289 persons/km2 and most parts of the
district is severely degraded (Beyene, 2007).

Advance Research Journal of Multi-Disciplinary Discoveries I Vol. 17.0 I Issue – I ISSN NO : 2456-1045
An open access journal of International Journal Foundation ( www.journalresearchijf.com) Page I 22
Table 1. Treatment design for vegetable production
Code Treatments
T1 Vegetable production with stream water
only (control)
T2 Vegetable production with pond water only
T3
Vegetable production with river water +
Inorganic Fertilizer ( DAP and UREA ) each
at a rate of 100 kg/ha
T4
Vegetable production with pond water +
Inorganic Fertilizer ( DAP and UREA ) each
at a rate of 100 kg/ha
T1=treatment 1; T2 = Treatment 2; T3= Treatment 3; T4=
Treatment 4; kg= kilo gram; ha= hectare; DAP=
Diammonium sulphate.
3.3 Partial budget analysis
The total investment budget analysis was conducted using
the cost and revenue values of using the investment land size.
Costs and revenue analysis were made using the estimated cost-
revenue of the local area at that season. Partial budget analysis
was conducted for measuring profit margin of integrated poultry-
fish-vegetable production. Using the method Upton (1979), net
income (NI) was calculated as a difference between total return
(TR) and total variable cost; change in net income (ΔNI) was
calculated as a difference between changes in total return (ΔTR)
and change in total variable cost (ΔTVC). Marginal rate of return
(MRR) measures the increase in net income (ΔNI) associated
with each additional unit of expenditure (ΔTVC) and was
calculated as MRR= (ΔNI/ΔTVC) x 100.
2.7. Data collection and statistical analysis
Fish total weight and total length was measured at
every two months interval. This was done 5 times before the
total fish harvest. Costs of pond preparation, supplemental feed,
plot preparation and management, chicken production and
management and costs of vegetable production were recorded.
Other data collected include number of chicken eggs, weight of
eggs, yield of vegetables and physico-chemical parameters of
pond water such as, conductivity, average temperature, total
digestible solute, salinity, resistivity, pH and dissolved oxygen
(DO) were adjusted and collected continually. The condition
factors (K) was calculated for individual fish species for each
month using the conventional formulae described by
Worthington & Richardo (1930) as:
K = W×100
L3
Where K = the condition factor
W = weight of fish in grams
L = Total length of fish in cm.
Vegetable yields using different treatments were subjected to
ANOVA using General Linear Model (GLM) procedure of
SPSS Version 22 (SPSS 2014). Means were separated using
Duncan’s Multiple range test at P<0.05.
The model used for analysis of the three vegetable yields in
four treatments was
Yi = µ + i + еi
Where: Yi = Vegetable yield in kg (i= tomato, onion and
cabbage);
μ = over all mean;
i = effect of three treatments and
ei = random error.
III. RESULT AND DISCUSSIONS
3.1 Pond water physico-chemical characteristics
The mean values of the physico-chemical parameters
such as conductivity, average temperature, total digestible solute,
salinity, resistivity, pH and dissolved oxygen (DO) of the pond
water were 113.5µS, 250C, 84.5 mg/L, 0.07ppt, 8.3 MΩ, 8.1 and
4.5 mg/L, respectively. The mean pH value of this experiment
(8.1) was lied within the recommended range of FAOs’ (2011)
and Charles et al (2007) who have reported pH values of 6.7-8.6
and 6.5-9.0, respectively. The average temperature in the current
experiment was 250C which corresponds to the values report by
Gangwara et al. (2013) (20-30ºC) and Abdel-Tawwab (2000)
(24.20C -27.70C).
The value of dissolved oxygen of this experiment was
4.5mg/L. According to Charles et al.(2007) this value is more
than the required amount for tilapia because it can survive below
2.3mg/L as long as the temperature and the pH value remained
constant. Olapade et al (2015) reported that there was observed
variability of DO from season to season. According to their
report mean DO was 6.7+0.2mg/L-7.09 +0 .18mg/L and the
highest was recorded in July but least was in September. The
authors added that body oxygen demand (BOD) values were
obtained throughout the sampling period in the range of 3.07 ±
0.12 mg/L –3.93 ± 0.06 mg/L and asserted the absence of
significant difference with locations and months of sampling.
Therefore, according to Olapade et al (2015), 4mg/L for fish
culture in the tropics is sufficient.
The conductivity value of the pond water was 113.5µS.
From measured observation, low conductivity value resulted
from the water source. Water from the eroded land and from
bicarbonate reach sources has low conductivity. Total digestible
solute was 84.5 mg/L. This value was assumed to be enough for
fish. Among the main digestible solutes, Caco3, NH3 and NH4
are the primary ones on which the fish consume directly and also
used as source of input for Eukaryotes. The salinity value of the
pond water in this experiment was 0.07ppt. This value was more
than the salinity of the FAO’s (2011) report (0.004ppt). Even
though the salinity of the pond site of the current study was
neutral, the area from where the stream water comes may have
caused the variation.
3.2 Chicken and Fish productivity
The chicken (5%) started laying eggs after 5 months and
all the chicken laid eggs after 6 months old. A total of 2392
eggs were produced within 161 days. This shows that 0.743
egg/day/chicken was produced (on an average 272 eggs/year)
which was within the range of maximum egg production in an
intensive poultry farm. In addition to egg production, droppings
from the chicken were used as a feed source for the fish.
The study showed that in the last fish harvesting day, 300
fish weighed 300g, 1000 fish weighed 100g and 1700 fish
weighed 80g. There were also fingerlings less than 80g and taken
as insignificant. The total fish harvest in number was 3000 and
their total weight was 326000g. The average weight was found
as 108.7g. In the last day of sample collection, using manually
made net with the size of 6cm, 7cm, 8cm, 9cm and 10cm, the
maximum weight was 303g. This maximum weight was found
only on limited samples. Among captured samples in 10cm size
net, majority of fish samples weighed in the range of 205-230g.
From the experiment, the average fish production in 306
experimental periods was 326kg (2.17kg/ m2), excluding
INTE
RN
ATI
ON
AL
JO
UR
NA
L F
OU
ND
ATI
ON

Advance Research Journal of Multi-Disciplinary Discoveries I Vol. 17.0 I Issue – I ISSN NO : 2456-1045
An open access journal of International Journal Foundation ( www.journalresearchijf.com) Page I 23
fingerlings which weighed less than 80g.The yield in this experiment was better than the one reported by Gangward et al (2013). However,
the lower weight in the current study (80g) was much lower than the report of Lally (2000) in which the fish were within the weight range
of 180 - 250g and most of them were indigenous tilapias (Oreochromis andersonni, Oreochromis mossambicus, O. niloticus, C. gariepinus
and Cyprinus carpio). The upper limit of their experiment (500g) was also higher than the current study (303g). The deviate size of this
experiment may be due to over breeding of the fish since there were enormous fingerlings on the day of total harvest.
3.3. Condition factor
The mean length, weight and condition factor (k) of tilapia was presented in Table 2. The k value of for female tilapia was 1.872 +
0.002, for male tilapia was 1.927 + 0.002 and for both sexed was 1.911+ 0.001. From the result male tilapia had higher k value followed by
both sexed tilapia but females’ had the lowest. This was due to the variation in body weight and length of the fish.
The condition factors (k) of the fish species in the current study was greater than what was obtained in other tropical water bodies
like in Nigeria, where a k-value of 0.49 - 1.48 have been recorded (Nwadiaro & Okorie, 1985). The k-value in the current study for male
and female fishes, however, was less than the earlier report of Bernard et al. (2010) but lied between the range studied by Kumolu-Johnson
& Ndimele (2011) & Ahmed et al (2011). Bagenal & Tesch (1978) reported that k value greater than 1 was an indication that the fish
species were doing well in the reservoir. According to them, heavier fish of a particular length were in a better physiological condition.
Table 2. Mean length (cm), weight (g) and condition factor (k) of tilapia tested in the experiment
Parameter Fish sex N Mean total length (cm) STD SE
Mean length(cm)
F 41 18.25 4.55 0.661
M 41 18.43 4.30 0.661
Both sex 46 19.27 4.22 0.624
Mean weight(gm)
F 41 134.59 93.98 14.551
M 41 140.40 94.49 14.551
Both sex 46 153.32 91.24 13.737
Condition factor(k)
F 41 1.872 0.01 0.002
M 41 1.927 0.01 0.002
Both sex 46 1.911 0.00 0.001
Where: N= Population number; F= female tilapia; M= Male tilapia; cm = centimeter; STD= Standard deviation; SE= standard error
3.4. Vegetable production
The vegetable production values were presented on Table 3. Vegetable production among the treatments varied significantly (P <
0.05). Highest onion was produced in T3 and T4 but lowest in T1. However, onion yield in T3 was equivalent with T2. Similar yield
variation among the treatments was observed in tomato and cabbage. Vegetable production with pond water (T2) had equivalent effect as
stream water + inorganic fertilizer (T3) except for cabbage for which T3 has more yield than T2. For onion, pond water (T2) produced 75%
more yield than the control (stream water, T1). For tomato, T2 was more productive over T1 (by 67%) and T3 was more productive over T1
and T2 by 96% and 14%, respectively, while T4 was more productive over T1, T2 and T3 by 100.3%, 18% and 3% respectively. For
cabbage, T2 was more productive over T1 (by 27%) and T3 was more productive over T1 and T2 by 51% and 10% respectively, while T4
was more productive over T1, T2 and T3 (by 61%, 15% and 4%), respectively. Among the three treatments (T2, T3 and T4), the highest
yield difference was observed in cabbage production than onion and tomato. This shows that T2 with T3 and T3 with T4 were comparable
in onion and tomato yield but greatly vary in cabbage yield. The variation in vegetable yields was attributed to the variation in availability
of valuable minerals in the pond water since poultry litter was rich in valuable nutrient for plant growth (FAO, 2011).
Table 3. Vegetable production (kg/plot)(Mean ± SE)
Vegetable
ypes
Treatments
SE P-value
T1 T2 T3 T4
Onion 7.80a* 13.70 b 15.02 bc 15.35c 0.473 P<0.05
Tomato 54.50a 94.02b 107.10 bc 110.60c 5.046 P<0.05
Cabbage 164.67a 373.90b 412.87c 429.25c 7.559 P<0.05
*Row values bearing different superscripts vary significantly (p<0.05). T1= vegetable production with stream water; T2= with pond water;
T3= with stream water + inorganic fertilizer; T4= with pond water + inorganic fertilizer; kg = kilo gram; SE= standard error; P= probability.

Advance Research Journal of Multi-Disciplinary Discoveries I Vol. 17.0 I Issue – I ISSN NO : 2456-1045
An open access journal of International Journal Foundation ( www.journalresearchijf.com) Page I 24
3.5. Investment Economic analysis
The partial budget analysis of the integrated fish farming is depicted in Table 4. The estimated net profit of the integrated farm
obtained on 0.25ha of land was 9336.13 Eth Birr. This profit was obtained within 306 working days. The profit was inclusive of the
farmers’ daily wage cost during the experimental period.
When the net profit obtained in this study compared with a single crop production (in this case maize, with a current price of
450 Birr/quintal), the highest estimated yield of maize was nearly 12 quintals/ 0.25 ha, which was equivalent to 48 q/ha and the least
estimate was 8 q/0.25 ha, the average maize yield being 10 quintals/ 0.25 ha. If it was sold by 450 Eth Birr, it would be 4500 Birr. The
estimated cost was 60% which equated 2700 Eth Birr. Therefore, the net profit from maize would be 1800 Eth Birr which was less than
2% of the net profit from the integrated farming. Similarly, the net profit from fish was 9%, from poultry was 18.2% and from vegetable
was 72.8% of the integrated farming. This indicates that integrated fish-poultry-vegetable farming is more profitable than the unitary
systems of agriculture as it ensures the spread of financial risk (Ogello et al. 2013). AIFP (2005) and Pullin (1994) also stated that
farmers practicing pig-fish farming reported 28% - 30% economic advantage over normal pig farming.
Table 4. Investment economic analysis obtained on 0.25ha of land for 306 days
Cost title Cost lists Estimated value (Birr*)
a. Fixed cost Chicken house construction 4500
Pond construction 1830
b. Operating cost
Land rent 2000
Vegetable seed 1000
Chicken 1125
Chemicals and inputs 1010.08
Labor 18360
Feed 3600
c. Others Transportation 1000
Summary cost Fixed capital 6330
Operating expenses 28845.08
15%bankloan 5276.26
Cost sum
40451.34
a. Revenue Fish sale 4500
Egg sale 6578
Poultry sale 2500
Vegetable sale 36400
Total revenue
49978
Gross profit
9526.66
2% income tax
190.53
Net profit
9336.13
*Birr= basic monetary unit of Ethiopia (1Birr= 0.044 USD)
3.6. Treatments economic analysis
Treatments economic analysis is depicted in Table 5. As shown in the table, there was profit difference between the treatments.
The net maximum profit was obtained in T2 and T4. But when it was calculated as the change in net income, T3 was more profitable than
the other treatments. Marginal rate of revenue was higher in T3 followed by T4. Based on the treatments’ yield variability, T2 was 7.6
times more profitable than T1. T3 was profitable over T1 and T2 by 21.77 and 2.53 times, respectively. Similarly, T4 was profitable over
T1 and T2 by 21.87 and 2.55 times, respectively. T3 was similar with T4 in profitability. Treatment 3 and 4 earned better revenue over
T1 and T2.

Advance Research Journal of Multi-Disciplinary Discoveries I Vol. 17.0 I Issue – I ISSN NO : 2456-1045
An open access journal of International Journal Foundation ( www.journalresearchijf.com) Page I 25
Table 5.Treatment economic analysis obtained from 0.25ha of land for 306 days
Justification Treatments
a. Major costs T1 T2 T3 T4
Land rent 500 500 500 500
Wage 4590 4590 4590 4590
Seed 250 250 250 250
Insecticide 250 250 250 250
Loading and unloading 250 250 250 250
Bank loans(15%) 876 1753.875 876 1753.875
Investment cost sum 6716 7593.87 6716 7593.87
Income tax(2%)(a) 4.16 155.02 90.29 214.32
Major cost sum 13436.16 15342.77 13522.29 15402.07
b. Variable cost
Fish management
375
375
Poultry house construction
2250
2250
Chicken purchase
512.5
512.5
Feed
1800
1800
Fertilizer cost
5.04 5.04
Mesh wire
45
45
Water inlet and outlet tubes (PVC)
120
120
Fish net
750
750
c. Variable cost sum(b)
5852.5 5.04 5857.54
d. Revenue
Vegetable sale 6924.08 8455.72 11230.76 11420.95
Egg sale
3389
3389
Fish sale
2250
2250
Chicken sale
1250
1250
Estimated gross income 6924.08 15344.72 11230.76 18309.95
Estimated total return(c) 208.08 7750.85 4514.76 10716.08
Estimated net income(c-(a+b)) 203.92 1743.33 4419.43 4440.3
Δ NI - 1540 4215.51 3148.82
ΔTVC - 5852.5 5.04 5857.54
MRR - 26.31 83641.07 53.76
Where: T1= stream water; T2= pond water; T3= stream water + inorganic fertilizer; T4= pond water + inorganic fertilizer; Δ NI= change
in net income; ΔTVC= change in total variable cost; MRR= marginal rate of revenue.
3.7. Fish revenue maximization period
Within the treatment period, the cost verses profit margin value trend for fishing is depicted in Figure 1. Based on the data, cost for the
investment was high at initial. Starting from the 4th month when the fish reached a lower weight for table size, the cost was comparable
with revenue. Following the 4th month, the revenue slightly increased above the cost but not increased continually.
Figure 1. Cost verses profit determination margin within treatment period for fish culture

Advance Research Journal of Multi-Disciplinary Discoveries I Vol. 17.0 I Issue – I ISSN NO : 2456-1045
An open access journal of International Journal Foundation ( www.journalresearchijf.com) Page I 26
The estimated cost curve showed a rapid increasing
logarithmic trend followed by a steady trend while the gain
estimated curve had a steady logarithmic trend followed by a
rapid increasing trend at initial. Starting from 119 to 187 days
of fish fingerlings introduction, profit from fishing part evolved
as a profit business. Within this period the profit trend showed a
steady increment but the cost curve showed slight increment.
Starting from day 187 to day 238 of fish introduction, the profit
and cost margins were increased rapidly. Starting from day 238
to day 260 the profit margin was increased similarly but the
cost margin started to shoot up. Following day 260 till end
period, the cost margin increased rapidly and started to be
asymptotic to the perpendicular line but the gain was in similar
fashion as the previous one. The gain from fishery was
dependent on the amount and weight of captured fish. From the
result, revenue from fish was maximized between days 238 to
260 of fish introduction.
IV. CONCLUSION
Integration of poultry with fish production (poultry
house being erected above the periphery of the pond) doesn’t
affect the potential productivity of the chicken as long as the
management and feed quality and quantity for the chicken kept
properly. Semi-intensive integration of fish and poultry farming
resulted higher fish production per square of pond size which
was attributed to the suitability of the pond water physio-
chemical characteristics and management condition which was
proved by the condition factor(k). The net integration profit was
much higher than the unitary system of agricultural activity. For
vegetables (onion and tomato) pond water has equivalent
productivity effect as application of inorganic fertilizer.
Maximum revenue from fish depends on the fish size, captured
number and harvest time. The longer the fetch time the higher
fish number that inversely affect the fish size. Fish yield and
revenue was maximum on a given square meter of pond size
within 238 to 260 days of fingerlings introduction. Generally,
chicken integrated with fish and horticultural crops resulted
better benefit on a given plot of land than single agricultural
activity. However, to fetch better revenue from the integration,
the water physio-chemical characteristics should be kept at
constant, with proper species and number of fish introduced,
managed and fed from the optimum chicken number per square
meter. Moreover, farmers who have suitable land with
continuous water supply should be selected and a regular
technical support from research or extension side is required for
the farmers to realize the benefits from the integration system.
V. ACKNOWLEDGMENT
The Authors would like to thank Southern
Agricultural Research Institute for the financial support of this
research and Mr. Adugna Gashaw and Mr, Yesuf Kedela for the
technical assistance given during the field work of the
experiment.
REFERENCES
[1] Abdel-Tawwab, M. (2000). Food and feeding habits of
Oreochromis niloticus under the effect of inorganic
fertilizer with different N:P:K ratios in Abbassa
fishponds, Egypt. Journal of Agricultural Research,
78(1): 437-448.
[2] Ahmed, E.O., Ali, M.E. & Aziz, A.A. (2011). Length-
weight Relationships and Condition factors of six fish
species in Atbara River and Khashm el-girba Reservoir,
Sudan. International Journal of Agriculture Sciences. 3
(1): 65-70.
[3] AIFP (Aquaculture and Inland Fisheries Project).
(2005). Farming Nigeria waters Newsletter of the
National special Program for food security in Nigeria.
FAO Office Abuja, Nigeria. 2005; 3 (4): 2 - 4.
[4] Ayinla, O.A (2003). Integrated fish farming: A
veritable tool for poverty alleviation/Hunger
eradication in the Niger Delta Region. In A.A. Eyo &
J.O. Atanda (eds). Conference Proceedings of
Fisheries Society of Nigeria, Owerri, Nigeria. 2003;
40-41.
[5] Bagenal T. B. & Tesch, F. W. (1978). Methods of
Assessment of Fish Production in Fresh Waters. IBP
Handbook. No. 3, 3rd ed. Oxford Blackwell Scientific
Publication, London. 101-136.
[6] Barg, U., Bartley, D., Kapetsky, J., Pedini, M.,
Satia, B., Wijkstrom, U. & Willmann, R. (2000).
Integrated resource management for sustainable inland
fish production. FAO Aquaculture Newsletter 23 , 4-8.
[7] Bernard, E., Ayinla. A.O., Akande, G.R, Ayo-
Olalusi, C.I. & Olusola, A.O. (2010). wet weight-dry
weight relationship of oreochromis niloticus (tilapia)
in Egah river at Idah l.G.A. of Kogi state, Nigeria.
Internet journal of food safety, vol.12, 2010, p. 109-
114.
[8] Beyene, D. (2007). Population and Major Livelihoods
in Silte and Dalocha Woredas of Silte Zone. Working
papers on population and land use change in central
Ethiopia, nr. 11. Acta Geographica-Trondheim.
Series A, No. 19.
[9] Charles, C.N., James R.B. & Bethuel O.O. (2007).
A new Guide to Fish Farming in Kenya. Department
of Fisheries and Aquatic Sciences, Moi University.
[10] FAO. (2011). Integrated fish farming Strategies.
World water day.
[11] FAO.(2010).The State of World Fisheries and
Aquaculture. FAO Fisheries and Aquaculture
Department, Food and Agriculture Organization of the
United Nations Rome, 2010.
[12] FAO.(2000) Small ponds make a big difference.
Integrating fish with crop and livestock farming. Farm
Management and Production Economics Service,
Inland Water Resources and Aquaculture Service.
FAO, Rome.
[13] Gangwara, L.S., Sandeep S. & Sarvesh K. (2013).
Integrated poultry-fish farming systems for sustainable
rural livelihood security in kumaon hills of
uttarakhand. Agricultural Economics Research
Review.Vol. 26, pp 181-188.
[14] Hussein, A. (2009). The Pilot Project on Aquaculture
Development in Ethiopia: - Bridging the gap of fish
seed demand through hatchery establishment and
village based extension approach. Ministry of
Agriculture and Rural Development, Kampala.
[15] Kumolu-Johnson, C.A. & Ndimele, P.E. (2011). Length-weight relationships of nine fish species
from Ologe Lagoon, Lagos, Nigeria. African Journal
of Biotechnology. 10 (2): 241-243.

Advance Research Journal of Multi-Disciplinary Discoveries I Vol. 17.0 I Issue – I ISSN NO : 2456-1045
An open access journal of International Journal Foundation ( www.journalresearchijf.com) Page I 27
[16] Lally E. (2000). Zambian farm finds a winning
formula. Fish Farmer 2000; 14-35.
[17] Mohammed,I.G., Tadesse M. & Haile K. (2016).
Poverty Alleviation through Integrated Pond Fish
Farming with Poultry and Vegetables Production at
Small Scale Farmers’ in Dilla Zuria Woreda, Southern
Ethiopia. Journal of Poverty, Investment and
Development . Vol.24, 2016
[18] Nwadiaro, C.S. & Okorie, P.U. (1985). Biometric
characteristics: length weight relationships and
condition factors in Chrychthys filamentosus, Pisces,
Bagridae from Oguta Lake Nigeria. Biol. Afr. 2: 48-56
[19] Ogello E.O., Mlingi F.T., Nyonje B.M., Charo-
Karisa H. & Munguti J.M. (2013).Can Integrated
Livestock-Fish Culture Be A Solution To East Africa’s
Food Insecurity? A Review. African Journal Of Food,
Agriculture, Nutrition And Development. Volume 13
No. 4.
[20] Olapade, O.J., Alimamy T., Momoh, R.R. (2015). Economic Assessment of Integrated Fish Farming
(Fish-Rice-Piggery) in Sierra Leone. Agriculture,
Forestry and Fisheries. Vol. 4, No. 3, pp. 87-94.
[21] Othman, K. (2006). Integrated farming system and
multi-functionality of agriculture in Malaysia. Acta
Hortic., 655: pp291-296.
[22] Pullin, R.S.V.(1994). Aquaculture, Integrated resources
management and the environment. In: Mathias, J.A.,
Charles A.T., & Baotong H. (Eds.) Proceedings of a
Workshop on Integrated Fish Farming held in Wuxi,
Jiangsu Province, People's Republic of China. October
11-15, 1994. CRC Press. Boca Raton, New York, 1998;
19 - 42 p.
[23] Rasowo J, Auma E, Ssanyu G. & Ndunguru M.
(2008). Does African cat fish (Clarias gariepinus) affect
rice in integrated rice-fish culture in Lake Victoria
Basin, Kenya? African Journal of Environmental
Science and Technology, 2 (10): 336-341.
[24] SPSS (Software Package for Social
Sciences).(2014).Version 22. Software Package for
social sciences for windows
[25] Upton, M.(1979). Farm Management in Africa: The
Principle of Production and Planning. Oxford
University Press, Great Britain. Pp. 282- 298
[26] Worthington, E.B., & Richardo, C.K. (1930). Scientific results of the Cambridge expedition East
Africa lakes. The fish of Lake Radiolf and Lake
Baringo. Journal of limnology Society., 15, pp. 353-
389.
*****
Corresponding author : Dinku Getu
Worabe Agricultural Research Center, Silte zone,
Worabe, Ethiopia
Email : fretse93[at]gmail[dot]com