EVALUATION OF GROUND -WATER MONITORING...
332
Evaluation of Ground-Water Monitoring Plan (WETS): Volume II - Appendices Authors Wilson, L. G.; Martin, P.; Lonergan, E. D. Publisher Water Resources Research Center, University of Arizona (Tucson, AZ) Download date 24/06/2018 22:26:58 Link to Item http://hdl.handle.net/10150/296914
Transcript of EVALUATION OF GROUND -WATER MONITORING...

Evaluation of Ground-Water MonitoringPlan (WETS): Volume II - Appendices
Authors Wilson, L. G.; Martin, P.; Lonergan, E. D.
Publisher Water Resources Research Center, University of Arizona (Tucson,AZ)
Download date 24/06/2018 22:26:58
Link to Item http://hdl.handle.net/10150/296914
EVALUATION OF GROUND -WATER MONITORINGPLAN (WETS)
VOLUME II - APPENDICES
COMPLETION REPORTCONTRACT NO. 26 -235- 816 -40 -2- 050 -0735
ARIZONA DEPARTMENT OF HEALTH SERVICESBUREAU OF WATER QUALITY CONTROL
By
L. G. WilsonP. Martin
E. D. Lonergan
Water Resources Research CenterThe University of Arizona
Tucson, Arizona
November 1, 1977

EVALUATION OF GROUND -WATER MONITORINGPLAN (WETS)
VOLUME II - APPENDICES
COMPLETION REPORTCONTRACT NO. 26- 235 -816 -40 -2- 050 -0735
ARIZONA DEPARTMENT OF HEALTH SERVICESBUREAU OF WATER QUALITY CONTROL
By
L. G. WilsonP. Martin
E. D. Lonergan
Water Resources Research CenterThe University of Arizona
Tucson, Arizona
November 1, 1977

TABLE OF CONTENTS
APPENDIX
A COPY OF WATER ENGINEERING AND TECHNICAL SERVICE,INC. METHODOLOGY AND FLOW DIAGRAM
B SOURCE EVALUATION QUESTIONNAIRE
C WELL INVENTORY OF THE STUDY AREA
D SOURCES OF INFORMATION
E WATER QUALITY DATA FROM MONITORING PROGRAM IN STUDYAREA, OCTOBER 1, 1976 TO SEPTEMBER 30, 1977

APPENDIX A
COPY OF WATER ENGINEERING ANDTECHNICAL SERVICE, INC. METHODOLOGY
AND FLOW DIAGRAM

I. Proposed Waste Discharge
A. Quantity of waste (daily, monthly, annual)
B. Type of waste
1. liquid
a. dissolved constituents in solute
b. colloidal suspension or solid particulate matter in liquid
2. solid
a. water soluble
b. acid or base soluble
c insoluble
C. Types of constituents in the waste
1. chemical
2. bacteriological
3. thermal
4. radioactive
5. physical
D. Quality (constituents, concentration)
1. list of constituents, sources and concentration
a. transport characteristics of each constituent
b. geochemical reactions which will or could occur during surface
transport, percolation or rainfall
2. determine the dispersion and dilution factors during transport,
rainfall, percolation, or upon entering a body of water (surface
or groundwater)
3. draw a flow diagram showing the effects of the present treatment of
waste
A.-2

E. Does the waste constitute a pollutant?
I. if yes, proceed with study
2. if no, terminate study
F. Alternative methods of disposal of waste
1. discharge into environment
a. streams and lakes
1) perennial
a) influent type
b) effluent type
2) ephemeral
b. landfill
1) total volume of waste discharge into landfill per annum
a) solid
b) liquid
volume of infiltration
a) from liquid waste
b) from rainfall dissolving solid waste
3) leachate migration
c. disposal on land surface or into lagoons
1) sealed
a) detailed description of area and sealing methods
b) volume of leakage
2) unsealed
a) volume of recharge or percolation
3) total evaporation
A-3
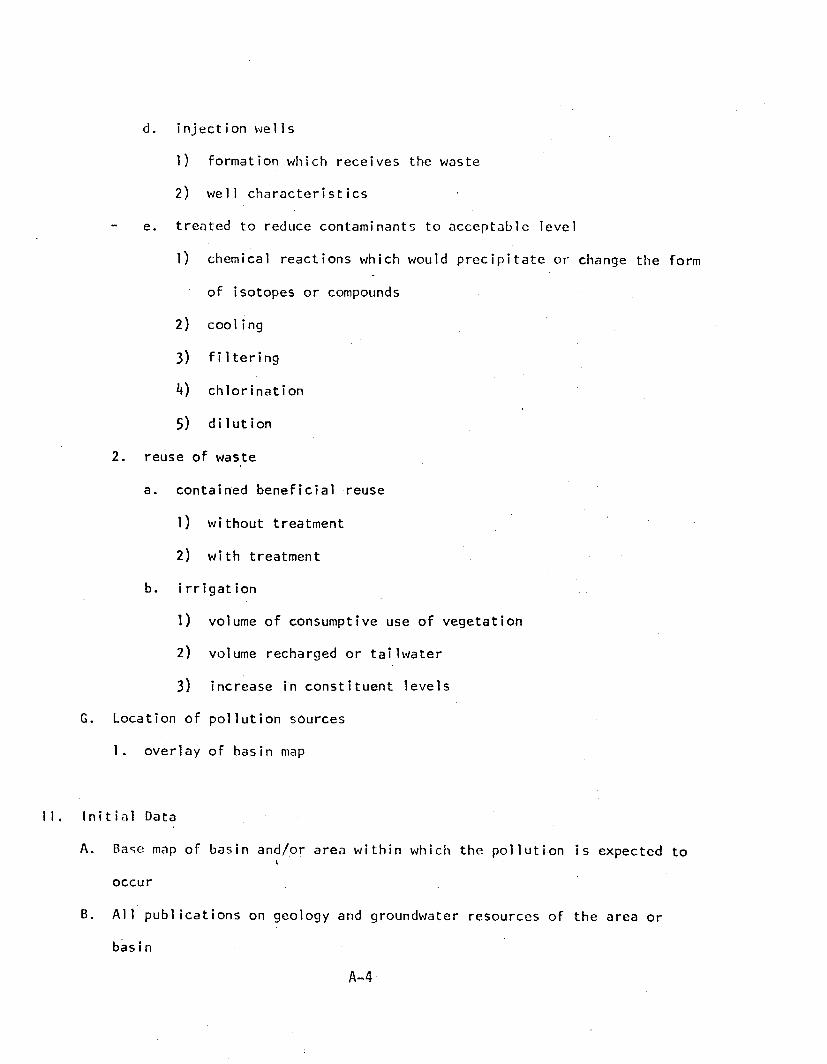
d. injection wells
1) formation which receives the waste
2) well characteristics
e. treated to reduce contaminants to acceptable level
1) chemical reactions which would precipitate or change the form
of isotopes or compounds
2) cooling
3) filtering
4) chlorination
5) dilution
2. reuse of waste
a. contained beneficial reuse
1) without treatment
2) with treatment
b. irrigation
1) volume of consumptive use of vegetation
2) volume recharged or taliwater
3) increase in constituent levels
G. Location of pollution sources
1. overlay of basin map
II. Initial Data
A. Base map of basin and /or area within which the pollution is expected to
occur
B. All publications on geology and groundwater resources of the area or
basin
A--4

C. All the available well data within the basin or area
1. well characteristics
2. water levels through time
3. pumping tests data
4. lithologic logs .
5. chemical data of the groundwaters
D. NASA imagery of basin and low altitude aerial photography of study area
III. Delineating the Physical Parameters of the Environment
A. Geology (description)
1. map (overlay) the geology
a. surface geology
1) remote sensing analysis of aerial imagery
2) field observation and mapping
b. structural features
1) faults
2) joints
3) subsidence cracks
2. depth to bedrock
a. contour bedrock surface (map overlay)
b. points (wells) where depth to bedrock complex known
3. stratigraphy
a. geologic cross sections showing stratigraphic sequence
1) unsaturated zone
2) aquicludes
3) aqu i tards
4) aquifers
5) bedrock complex
A-5

b. lithologic characteristics
B. Hydrology
I. unsaturated zone parameters and aquifer parameters (map overlays)
a. transmissivity
b. storage coefficient
c. diffusivity
2. groundwater characteristics
a. depth to water (map overlay)
b. groundwater flow direction (map overlay)
1) natural conditions
2) changes from natural conditions caused by withdrawal from
the aquifer
c. chemical and physical characteristics (map overlay)
1) natural base
2) historical changes which have occurred
3 recharge
a. description of stream flow so.r:.e and headwaters (map overlay)
b. intermittant recharge caused by precipitation
c. planned recharge from waste
d. chemical and physical characteristics of recharge from each
source
e. volume of recharge from each source
4. perched water
a. caliche or other aquitard
b. leakage where perched water percolates to water table
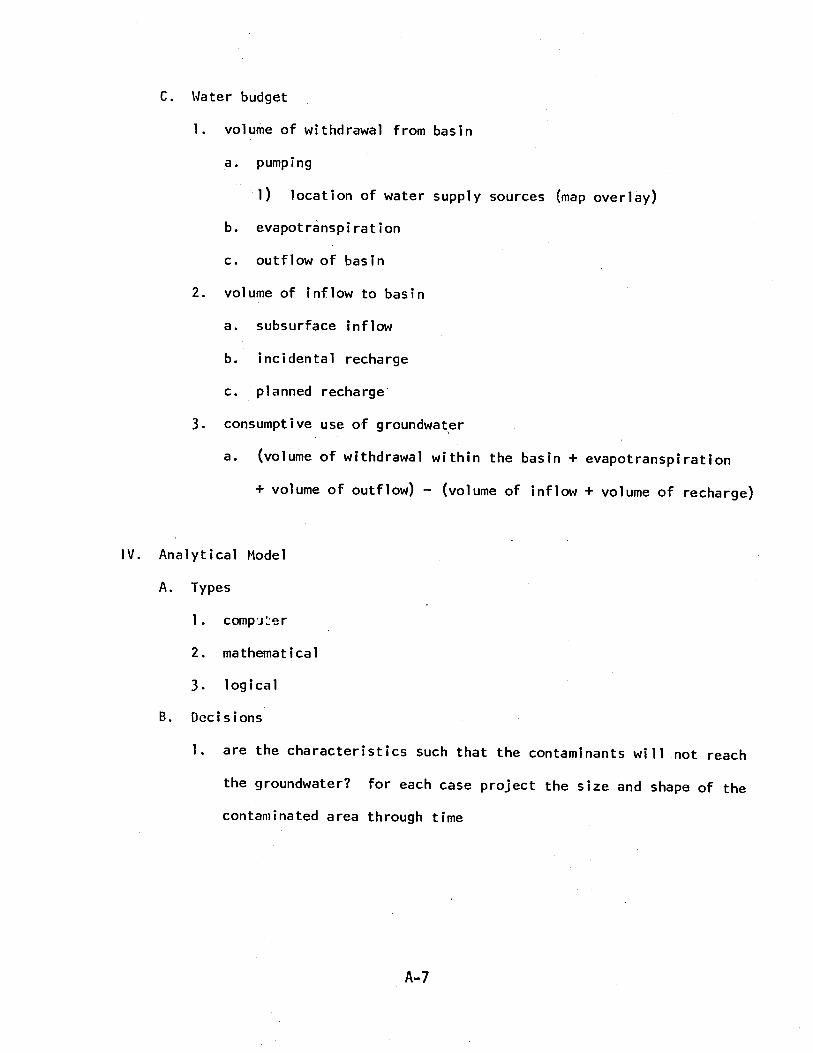
C. Water budget
1. volume of withdrawal from basin
a. pumping
1) location of water supply sources (map overlay)
b. evapotranspiration
c. outflow of basin
2. volume of inflow to basin
a. subsurface inflow
b. incidental recharge
c. planned recharge
3 consumptive use of groundwater
a. (volume of withdrawal within the basin + evapotranspiration
+ volume of outflow) - (volume of inflow + volume of recharge)
IV. Analytical Model
A. Types
1. compi er
2. mathematical
3. logical
B. Decisions
1. are the characteristics such that the contaminants will not reach
the groundwater? for each case project the size and shape of the
contaminated area through time

a. geologic control
1) monitor the area and materials to which the contaminants
will be confined
b. extreme depth to groundwater
1) monitor the unsaturated zone
c. geochemical reactions that will change the contaminants to
within acceptable limits prior to interception by the groundwater
1) monitor the area of geochemical change to determine if a
reversal reaction could occur
d. sealed ponds or landfill
1) monitor shallow depths for seepage
e. perched water
1) monitor perched water
2) monitor unsaturated zone
a) above the perched water
b) below the perched water
f. is the time frame of dumping the wastes limited so that the
contaminants will remain localized?
1) monitor the projected depth and areal extent of the waste
penetration
2. are the characteristics such that the contaminants will reach the
groundwater?
a, what amount of degradation can occur without changing the
beneficial use of the groundwater?
1) project the volume of waste which will be required to exceed
this limit
b. what is the projected volume of waste that will reach the
groundwater?
1) what contaminants?
2) what concentration?
3) what time frame?
c. what is the projected shape and dimension of the potential
contaminated area?
1) two dimensional
2) three dimensional
3 injection wells
a. what is the shape and dimension of the formation utilized for
the waste disposal?
1) what shape and dimension will the contaminated water develop?
b. is the formation totally confined?
1) if yes, what volume of waste can it hold?
2) if no, monitor above and below the formation utilized for
waste disposal
C. Final determinations
1. the location of wells or well sites in the monitoring network
a. field check the wells already constructed to determine if they
can be used for monitoring purposes
2. the depth and perforated area of each monitoring well
3. the contaminant or contaminants to monitor
4. the time frame of the sampling periods
5. type of monitoring required
a. representative water samples for chemical and physical analysis
b. instrumentation for the determination of changes in soil moisture
c. instrumentation for the determination of changes in radioactivity
d. temperature changes
6. will scavenger wells limit the area of contamination?
a. number required
b. total depth of wells
c, diameter of well
d. volume of water to be pumped
1) from each well
2) total
e. method of disposal of pumped water
7 what is the cumulative impact on the groundwater reservoir?
a. combination of existing discharges of wastes
b. addition of new discharge of waste
c. degredation which will occur within the aquifer
1) areal extent of degredation
APPENDIX B
SOURCE EVALUATION QUESTIONNAIRE

STATEWIDE GROUND -WATER MONITORING PLAN
POLLUTION POTENTIAL OF WASTE SOURCES
A. WASTE SOURCE: Roger Road Wastewater Treatment Plant (Effluent)
B. INDIVIDUAL OR AGENCY PRODUCING OR MANAGING WASTE:City of Tucson
C. LOCATION OF SOURCE: (D- 13- 13)21C
D. LOCATION SKETCH:
/1040/4/4 POW(.....'iü?.:_ .... , . . ......
\ _-to- /Y4: c .,o.vLJ ve...:'iT[,!_tt
5L.UooE GLD
P,vr:ER r?t?r2fiArN,crv r
PLHN r
\"
er7y ofTvc;, G,N FARMS
/2F,1lTqTF_n Fi9hM/N6
JAIL A/vN/_x5,Ni r , RV LRNDF /LL
E. TYPE OF WASTE: SOLID
F.
G.
LIQUID q1. Dissolved or microbial [j
2. Suspended sediment C-?
CLASSIFICATION OF WASTE:
1. MUNICIPAL: C1 ; Specify
2. ; SpecifyAGRICULTURAL: I
3. INDUSTRIAL: IT; Specify
4. MISCELLANEOUS: Q ; Specify
ESTIMATED QUANTITY OF WASTE:
Wastewater Treated 1975 -76: 12,013.92 MGPlant No. 1 3995.70Plant No. 2 3310.39Plant No. 3 4707.83
Sewagp Affluent
B-la
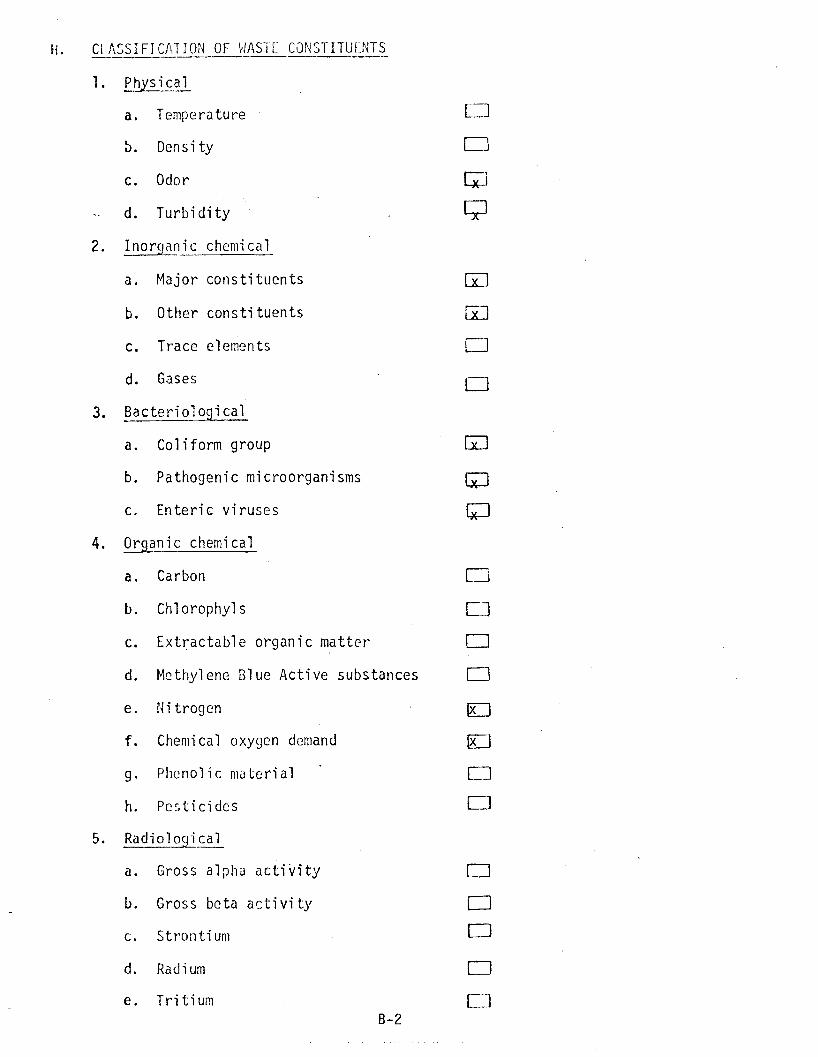
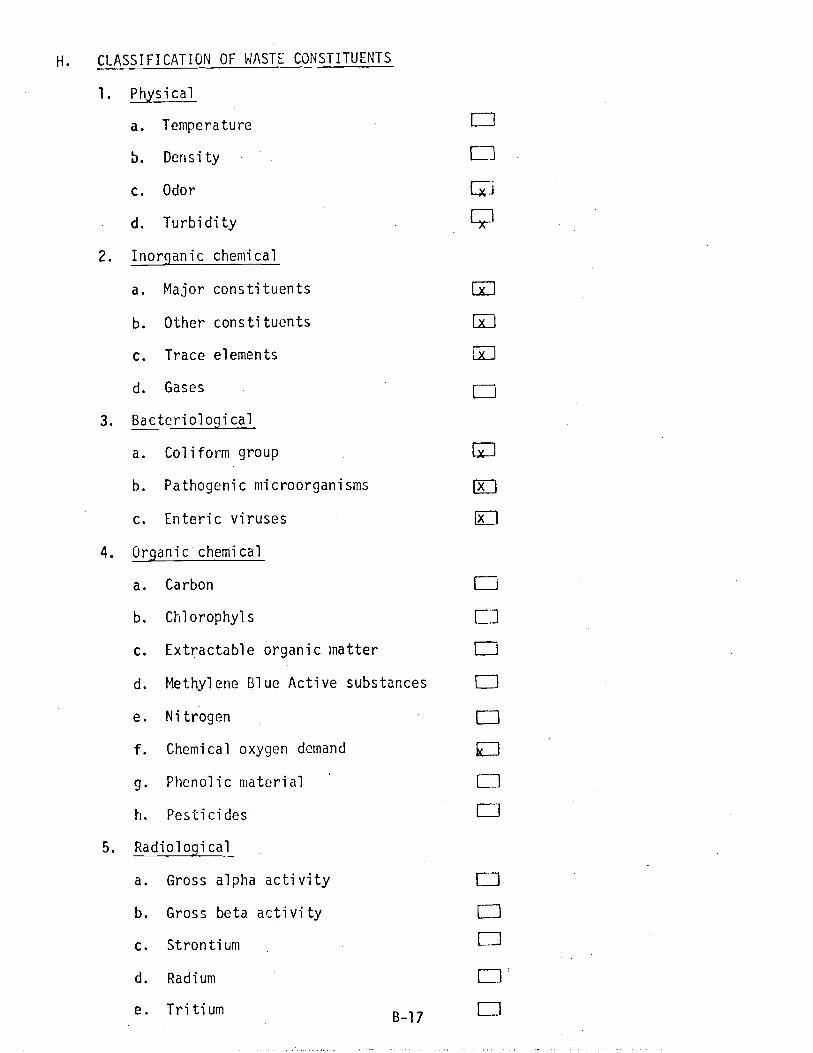
I CI ASSIFICATION OF WASTE CONSTITUENTS
1. Physical
a. Temperature [i]
b. Density L -J
c. Odor rTi
d. Turbidity Çx
2. Inorganic chemical
a. Major constituents Lx_}
b. Other constituents ai
c. Trace elements [ 1
d. Gases (-1
3. Bacteriological
a. Coliform group
b. Pathogenic microorganismsIx
i
c. Enteric viruses jX I
4. Organic chemical
a. Carbon
b. Chlorophyls [l
c. Extractable organic matter I 1
d. Methylene Blue Active substances
e. Nitrogen
f. Chemical oxygen demand x(-j
g. Phenolic material El
h. Pesticides El5. Radiological
a. Gross alpha activity []
b. Gross beta activity L..i
c. Strontium Lid. Radium
e. Tritium (yJ
i 1
1x 1
B-2

REPRESENTATIVE ANALYSES:
Date of analysis: 1975 -76Location: Final Effluent Plant No. i
Major Trace
Calcium 72 mg /1 meq /1 Arsenic mg/1
Magnesium 18 mg /1 meq /1 Barium mg /1
Sodium 98 mg /1 _ meq /1 Cadmium mg/1
Potassium mg/1 meq /i Chromium mg /1
Carbonate 0 mg /1 meq /1 Copper mg/1
Bicarbonate 294 mg /1 meq /1 Cyanide mg /1
Sulfate 152 mg /1 meq /1 Fluoride mg /1
Chloride 95 mg /1 meq /l Iron D_2 mg /1
Nitrate mg /1 meq /1 Lead mg /1
Manganese mg /1
Other ConstituentsMercury mg /1
Nitrate -N 0.0 mg /1Selenium mg /1
Ammonia -N 17.1 mg /1Silver mg /1
UN 25.0 mg/1Strontium mg/1
Total -N 25.2 mg /1Zinc my /1
Specific conductance mg /1
Total dissolved solids 671 mg /1 Microorganisms
pH 7.5 mg /1 Total coliform # /100m1
Silica 42 mg /1 Fecal coliform #/100m1
Boron mg /1 Fecal Strep. # /100mî
Fluoride mg /1
Phosphorous 18 mg /1
Hardness mg /1
Alkalinity 241 mg /1
B.O.D. 21 mg /1
C.O.D. 48 mg /1
S.S. 68 mg /1
Organic -N 7.9 mg /1
B -3
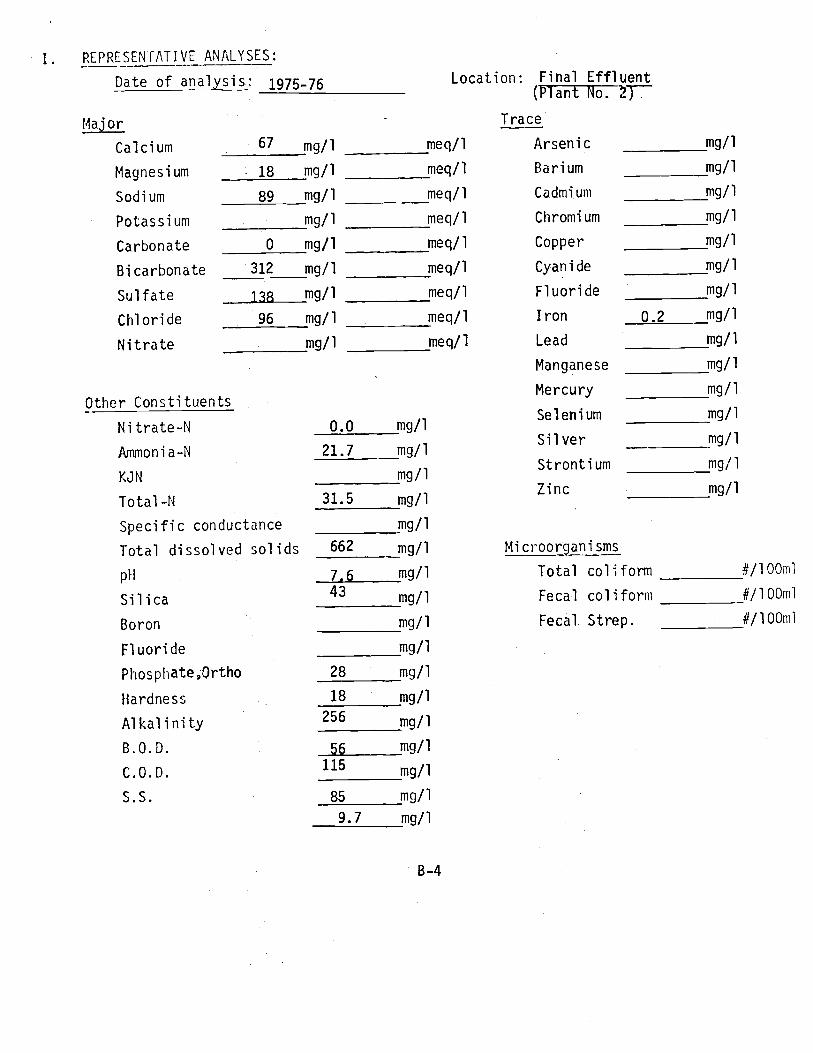
I. REPRESENTATIVE ANALYSES:
Date of analysis: 1975 -76 Location: CP.inat Noinal
Major Trace
Calcium 67 mg /1 meq /1 Arsenic mg /1
Magnesium 18 mg /1 meq /1 Barium mg /1
Sodium 89 mg /1 meq /1 Cadmium mg /1
Potassium mg /1 meq /1 Chromium mg /1
Carbonate 0 mg /1 meq /1 Copper mg /1
Bicarbonate 312 mg /] meq /1 Cyanide mg /1
Sulfate 138 mg /1 meq /1 Fluoride mg /1
Chloride 96 mg /1 meq /1 Iron 0.2 mg /1
Nitrate mg /1 meq /1 Lead mg /1
Manganese mg /1
Other ConstituentsMercury mg/1
Nitrate -N 0.0 mg /1Selenium mg /1
Ammonia -N 21.7 mg /1Silver mg /1
KJN mg /1Strontium mg /1
Total -N 31.5 mg /1Zinc mg /i
Specific conductance mg /i
Total dissolved solids 662 mg /1 Microorganisms
pH 7.6 mg /1 Total coliform #/100m1
Silica 43 mg /1 Fecal coliform # /100m1
Boron mg /1 Fecal Strep. #/100m1
Fluoride mg /1
Phosphate,Ortho 28 mg /1
Hardness 18 mg /1
Alkalinity256 mg /1
B.O.D. 56 mg /1
C.O.D.115 mg /1
S.S. 85 mg /1
9.7 mg /1
B-4
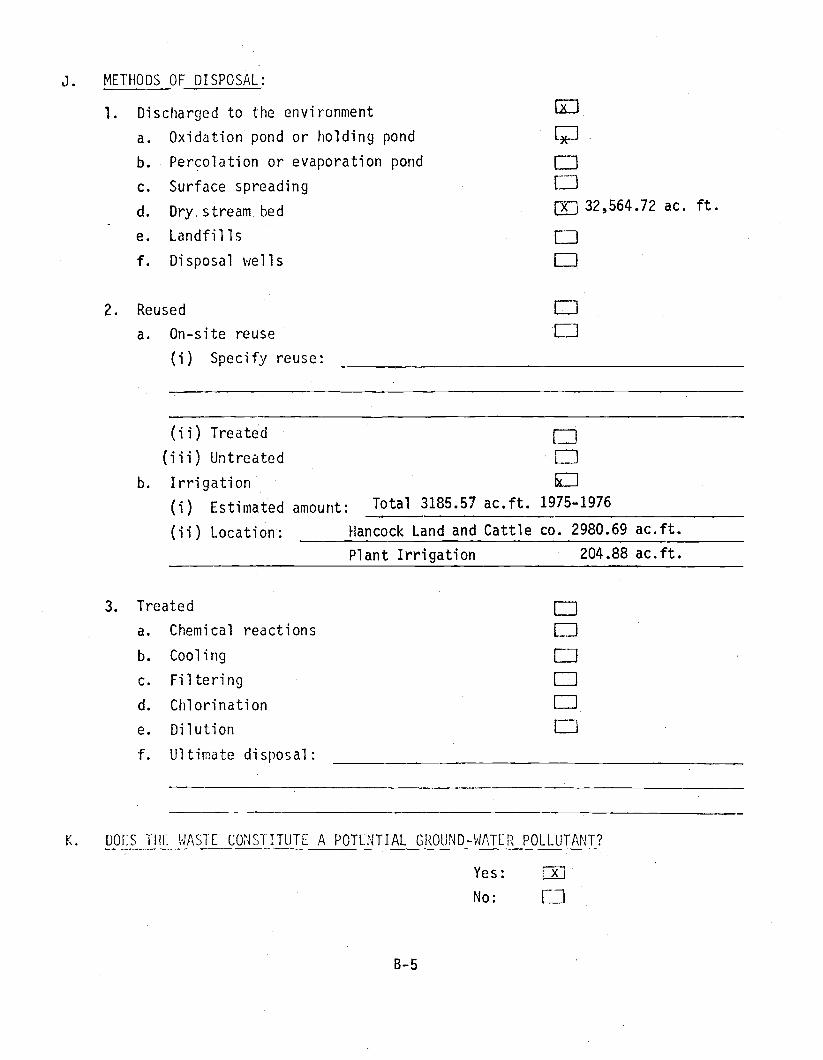
J. METHODS OF DISPOSAL:
1. Discharged to the environment
a. Oxidation pond or holding pond
b. Percolation or evaporation pond
c. Surface spreading
d. Dry, stream bed
e. Landfills
f. Disposal wells
2. Reused
a. On -site reuse
(i) Specify reuse:
k 1
LT(--1
nCJ
U 32,564.72 ac. ft.
I
(ii) Treated
(iii) Untreated
b. Irrigation
(i) Estimated amount: Total 3185.57 ac.ft. 1975 -1976
LJi I
b(I
(ii) Location: Hancock Land and Cattle co. 2980.69 ac.ft.
Plant Irrigation 204.88 ac.ft.
3. Treated
a. Chemical reactions
b. Cooling
c. Filtering
d. Chlorination
e. Dilution
f. Ultimate disposal:
LJn
1
K. DOES THE WASTE CONSTITUTE A POTENTIAL GROUND -WATER POLLUTANT?
Yes:
No: C1
B-5
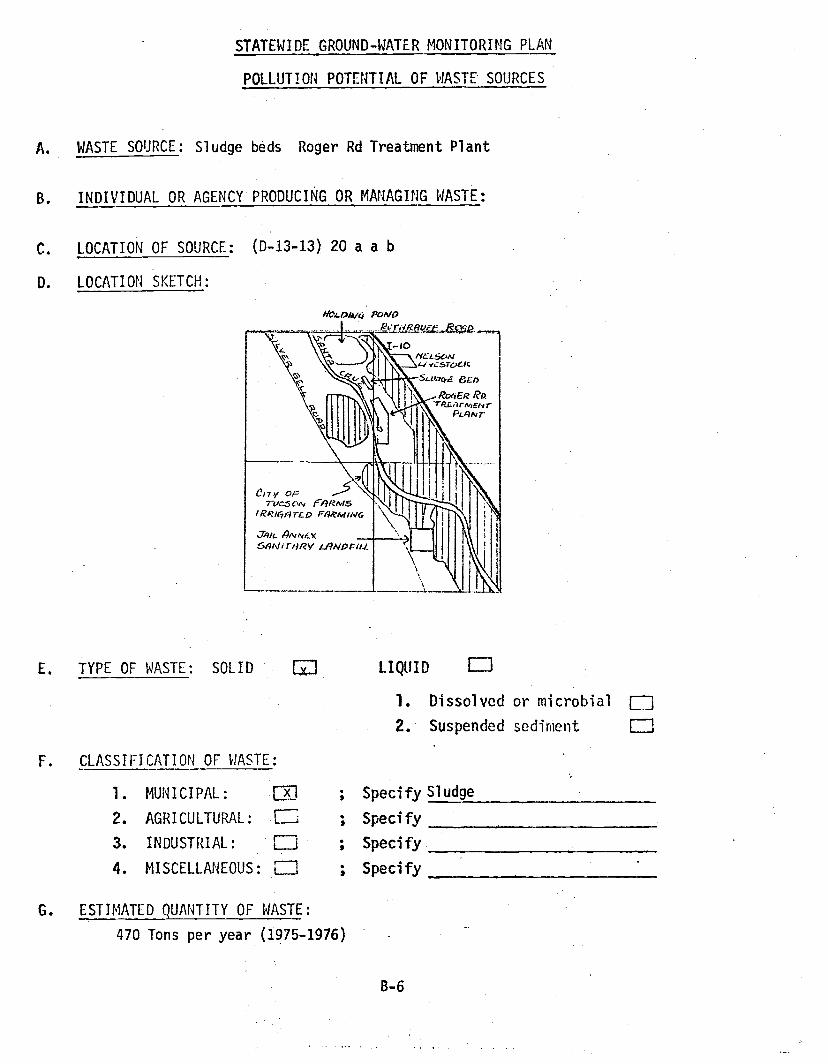
STATEWIDE GROUND -WATER MONITORING PLAN
POLLUTION POTENTIAL OF WASTE SOURCES
A. WASTE SOURCE: Sludge beds Roger Rd Treatment Plant
B. INDIVIDUAL OR AGENCY PRODUCING OR MANAGING WASTE:
C. LOCATION OF SOURCE: (D- 13 -13) 20 a a b
D. LOCATION SKETCH:
1/040M/4 PöND
Rapar . eop
Cr Ty o,=Tvw orv FApM5
/RR7tyRr0 rAiZMIN4
E. TYPE OF WASTE: SOLID
F. CLASSIFICATION OF WASTE:
1. MUNICIPAL:
2. AGRICULTURAL:
3. INDUSTRIAL: F-1
4. MISCELLANEOUS: (1
LIQUID F-7
1. Dissolved or microbial U2. Suspended sediment
; Specify Sludge
; Specify; Specify.
; Specify
G. ESTIMATED QUANTITY OF WASTE:
470 Tons per year (1975 -1976)
B-6
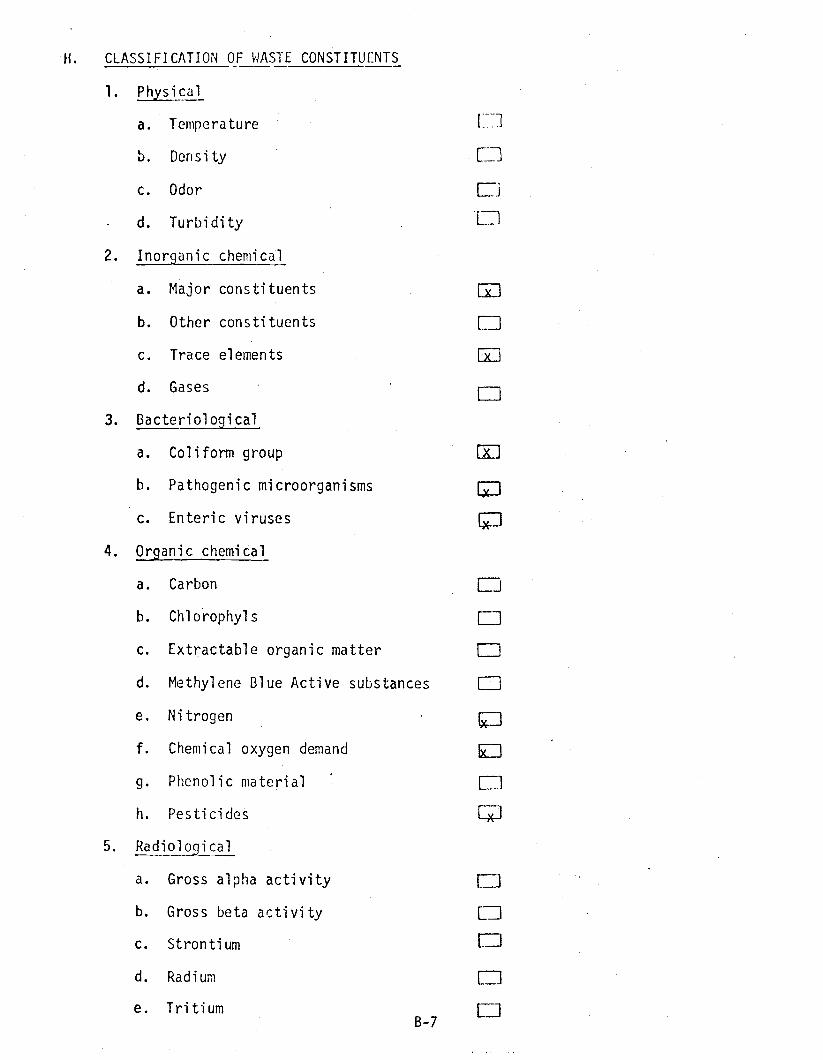
Fi. CLASSIFICATION OF WASTE CONSTITUENTS
1. Physical
a. Temperature
b. Density
C. Odor
d. Turbidity
2. Inorganic chemical
a. Major constituents
b. Other constituents
C. Trace elements
d. Gases
3. Bacteriological
a. Coliform group
b. Pathogenic microorganisms
c. Enteric viruses
4. Organic chemical
a. Carbon
b. Chlorophyls
c. Extractable organic matter
d. Methylene Blue Active substances
e. Nitrogen
f. Chemical oxygen demand
g. Phenolic material
h. Pesticides
5. Radioluical
a. Gross alpha activity
b. Gross beta activity
c. Strontium
d. Radium
e. TritiumB-7
ED
Eln
bd I
LiLi
Li
LiiED
Li
ri

I. REPRESENTATIVE ANALYSES:
Date of analysis: Location:
See attached
Major Trace
Calcium mg /1 meq /1 Arsenic mg /1
Magnesium nag /1 meq /1 Barium mg /1
Sodium mg/1 _______ meq /l Cadmium mg /1
Potassium mg /1 meq /1 Chromium mg /1
Carbonate mg /1 meq /1 Copper mg /1
Bicarbonate mg /1 meq /1 Cyanide mg/1
Sulfate mg /1 meq /i Fluoride mg /1
Chloride mg/1 meq /1 Iron mg /1
Nitrate mg /1 meq /1 Lead mg /1
Manganese mg /1
Other ConstituentsMercury mg /1
Nitrate -N mg /1Selenium mg /1
Ammonia -N mg /1Silver mg /1
KJN mg/1Strontium mg /1
Total -N /1 Zinc mg /1
Specific conductance mg /1
Total dissolved solids mg /1 Microorganisms
pH mg/1 Total coliform #/100m1
Silica mg /1 Fecal coliform # /lOOml
Boron mg /1 Fecal. Strep. #/100m1
Fluoride mg /1
Phosphorous mg /1
Hardness mg /1
Alkalinity mg /1
B.O.D. mg /1
C.O.D. mg /1
S.S. mg /1
B-8
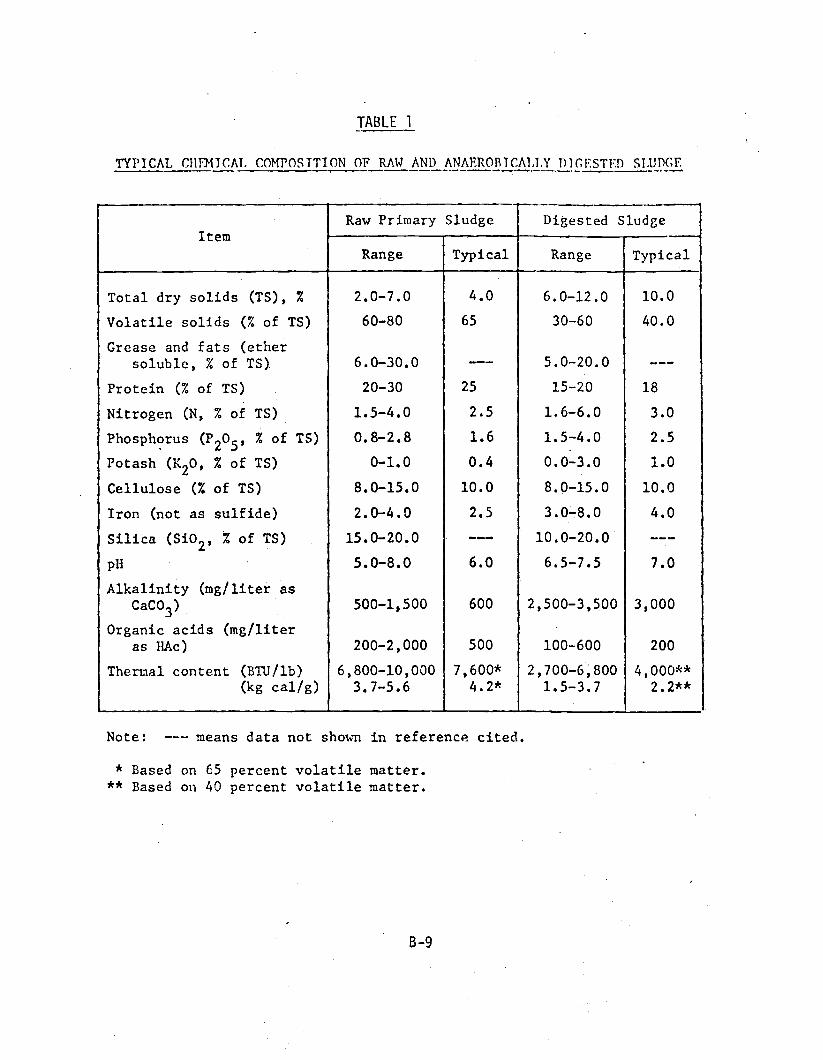
TABLE 1
TYPICAL CHEMICAL COMPOSITION OF RAW AND ANAE OBTCALLY DIGESTED SLUDGE
ItemRaw Primary Sludge Digested Sludge
Range Typical Range Typical
Total dry solids (TS), % 2.0 -7.0 4.0 6.0 -12.0 10.0
Volatile solids (% of TS) 60 -80 65 30 -60 40.0
Grease and fats (ethersoluble, % of TS). 6.0 -30.0 - -- 5.0 -20.0 - --
Protein (% of TS) 20 -30 25 15 -20 18
Nitrogen (N, % of TS) 1.5 -4.0 2.5 1.6 -6.0 3.0
Phosphorus (P205, % of TS) 0.8 -2.8 1.6 1.5 -4.0 2.5
Potash (1(20, % of TS) 0 -1.0 0.4 0.0 -3.0 1.0
Cellulose (% of TS) 8.0 -15.0 10.0 8.0 -15.0 10.0
Iron (not as sulfide) 2.0 -4.0 2.5 3.0 -8.0 4.0
Silica (Si02, % of TS) 15.0 -20.0 - -- 10.0 -20.0 ---
pH 5.0 -8.0 6.0 6.5 -7.5 7.0
Alkalinity (mg /liter asCaCO3) 500 -1,500 600 2,500 -3,500 3,000
Organic acids (mg /literas HAc) 200 -2,000 500 100 -600 200
Thermal content (BTU /lb) 6,800 -10,000 7,600* 2,700 -6,800 4,000 **
(kg cal /g) 3.7 -5.6 4.2* 1.5 -3.7 2.2 **
Note: - -- means data not shown in reference cited.
* Based on 65 percent volatile matter.** Based on 40 percent volatile matter.

TABLE 2. Metals In Sludge
1971 -1973
Literature Atomic AbsorptionElement Geometric. Geometric
Mean Spread* Mean
(ppm) (PPm)
Cd 61 5.89 93Cu 905 2.66 1840Hg 14.5 5.24 3.2Ni 223 4.54 733
Pb 404 4.13 2400Zn 2420 2.78 6380
Spread is antilog of standard deviation of log -normal distribution.
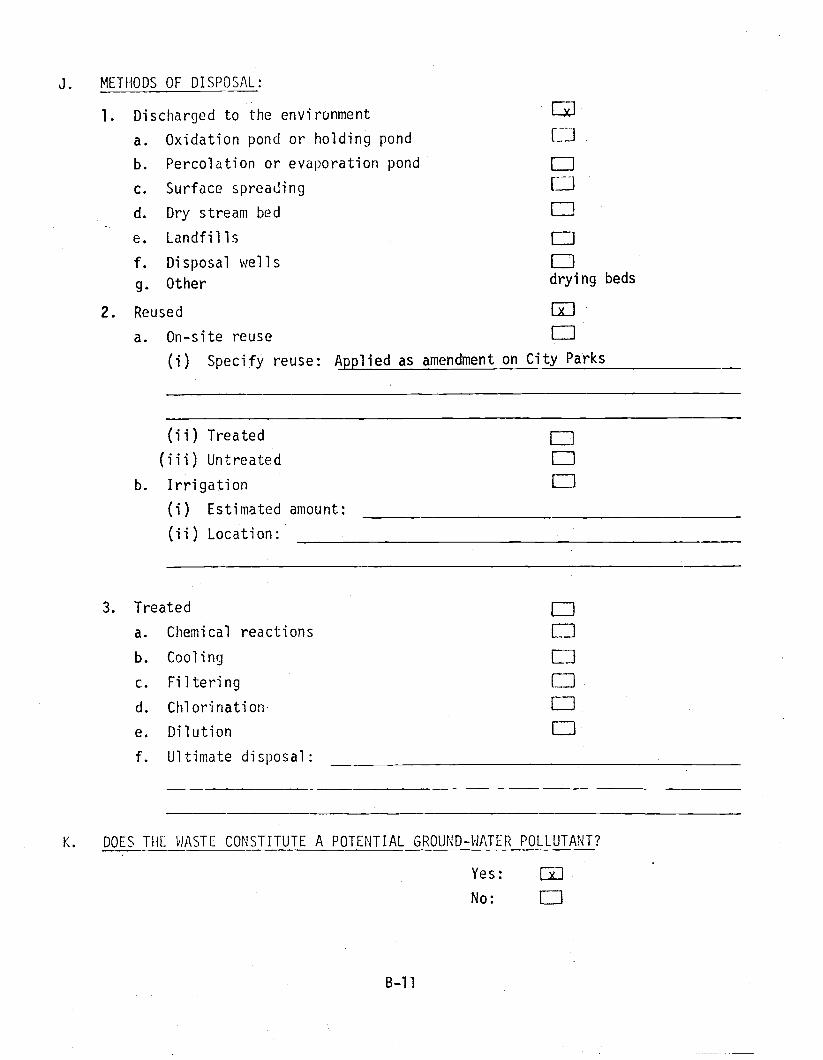
J. METHODS OF DISPOSAL:
1. Discharged to the environment
a. Oxidation pond or holding pond
b. Percolation or evaporation pond
C. Surface spreading
d. Dry stream bed
e. Landfills
f. Disposal wells
g. Other
2. Reused
a. On -site reuse
(i) Specify reuse: Applied as amendment on City Parks
1
drying beds
(ii) Treated
(iii) Untreated
b. Irrigation
(ì) Estimated amount:
(ii) Location:
3. Treated
a. Chemical reactions
b. Cooling
c. Filtering
d. Chlorination
e. Dilution
f. Ultimate disposal:
K. DOES THE WASTE CONSTITUTE A POTENTIAL GROUND -WATER POLLUTANT?
Yes: [No:
B -11
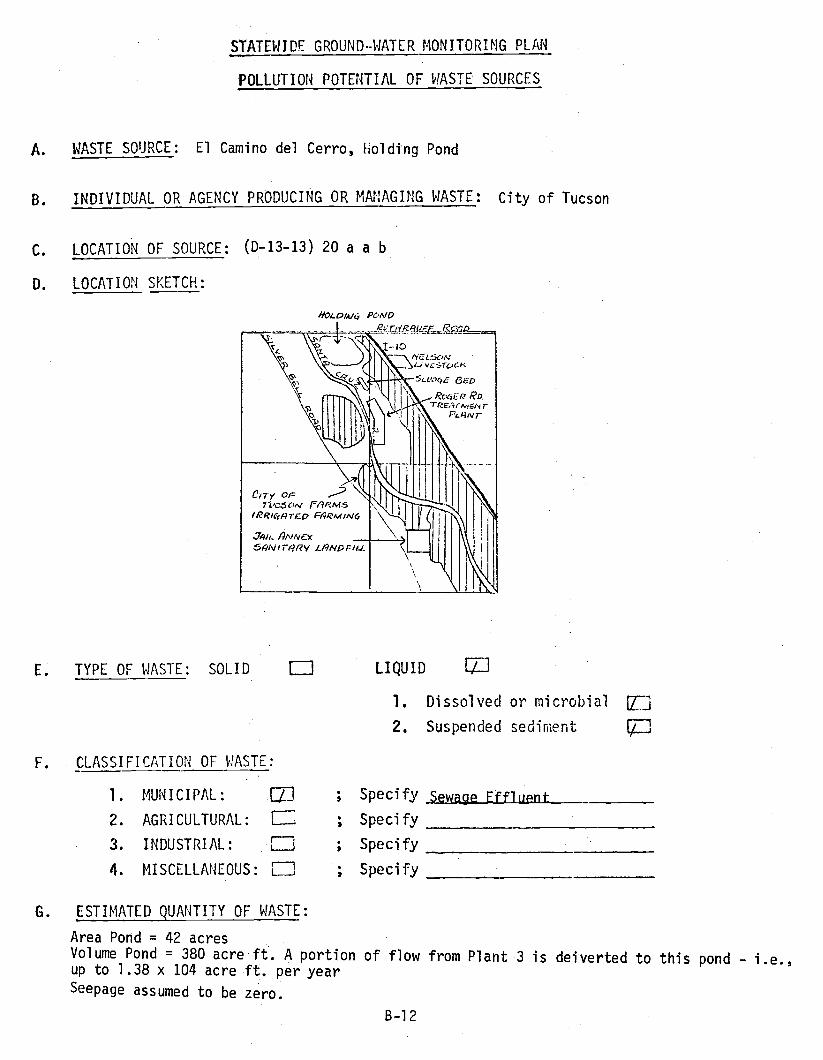
STATEWIDE GROUND-WATER MONITORING PLAN
POLLUTION POTENTIAL OF WASTE SOURCES
A. WASTE SOURCE: El Camino del Cerro, Holding Pond
8. INDIVIDUAL OR AGENCY PRODUCING OR MANAGING WASTE: City of Tucson
C. LOCATION OF SOURCE: (D- 13 -13) 20 a a b
D. LOCATION SKETCH:
POMAr;{Rao 2gy.w
-10-h'c LSC'N
l.J vL$7 Ü :I
5cuar;E G'ED
RorER Ro
Y'LHN r
CITy OF I ,74,c6 ON rOr<M5
1RKI4F)TF_p FtÿRMiNG
E. TYPE OF WASTE: SOLID
F. CLASSIFICATION OF WASTE:
1. MUNICIPAL:
2. AGRICULTURAL:
3. INDUSTRIAL:
4. MISCELLANEOUS:
LIQUID 171
1. Dissolved or microbial
2. Suspended sediment
E73
; Specify .ewage Effluent
; Specify
; Specify
Specify
G. ESTIMATED QUANTITY OF WASTE:
Area Pond = 42 acresVolume Pond = 380 acre ft. A portion of flow from Plant 3 is deiverted to this pond - i.e.,up to 1.38 x 10⁴ acre ft. per year
Seepage assumed to be zero.
B-12

H. CLASSIFICATION OF WASTE CONSTITUENTS
1. Physical
a. Temperature
b. Density
c. Odor
d. Turbidity
2. Inorganic chemical
a. Major constituents
b. Other constituents
c. Trace elements
d. Gases
3. Bacteriological
a. Coliform group
b. Pathogenic microorganisms
c. Enteric viruses
4. Organic chemical
a. Carbon
b. Chlorophyls
c. Extractable organic matter
d. Methylene Blue Active substances
e. Nitrogen
f. Chemical oxygen demand
g. Phenolic material
h. Pesticides
5. Radiological
a. Gross alpha activity
b. Gross beta activity
c. Strontium
d. Radium
e. Tritium
x
Ix
ICL7
Ix 1
LiLJ
L_J
ÏÏB-13
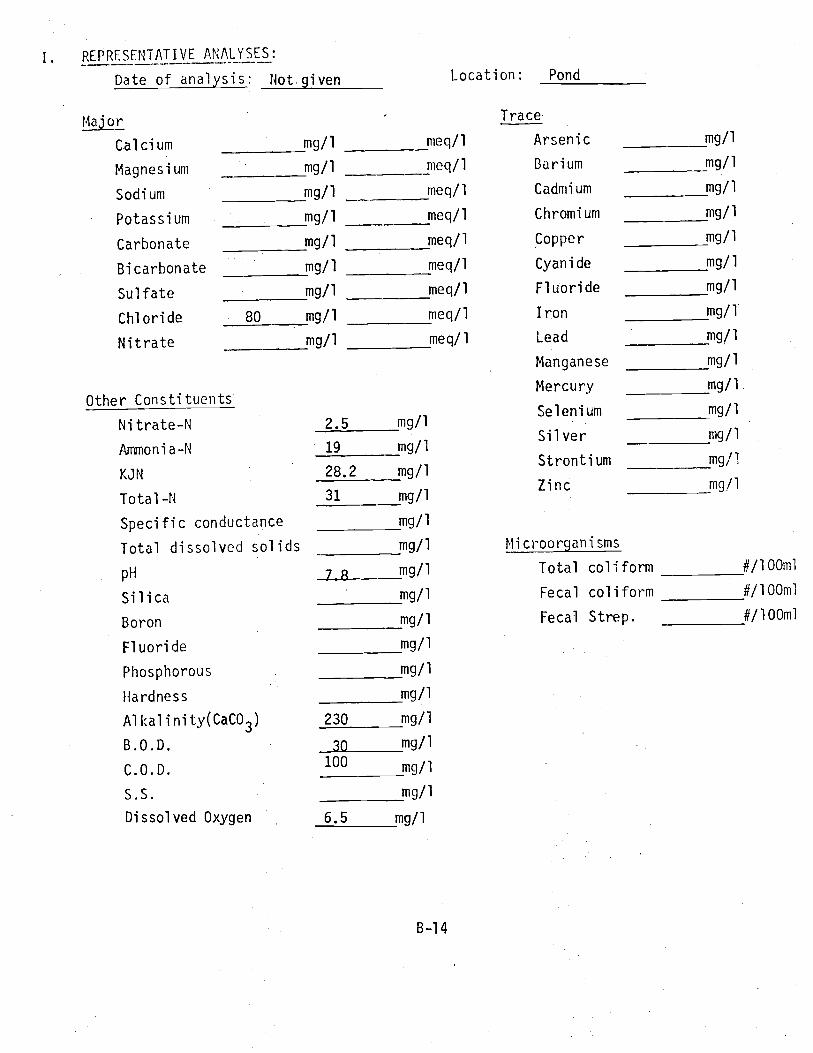
I. REPRESENTATIVE ANALYSES:
Date of analysis: Not given Location: Pond
Major Trace
Calcium mg /1 meq /1 Arsenic mg /1
Magnesium mg /1 meq /1 Barium mg /1
Sodium mg /1 meq /1 Cadmium mg /1
Potassium mg /1 meq /1 Chromium mg /1
Carbonate mg /1 meq /1 Copper mg /1
Bicarbonate mg /1 meq /1 Cyanide mg /1
Sulfate mg /i meq /1 Fluoride mg /1
Chloride 80 mg /1 meq /1 Iron mg /1
Nitrate mg /1 meq /1 Lead mg /1
Manganese mg /1
Other ConstituentsMercury mg /1
Nitrate -N 2.5 mg /1Selenium mg /1
Ammonia -N 19 mg /1Silver mg /1
KJN 28.2 mg/1Strontium mg/1
Total -N 31 mg /1Zinc mg /1
Specific conductance mg /1
Total dissolved solids mg /1 Microorganisms
pH 7 8 mg /1 Total coliform #/100m1
Silica mg /1 Fecal coliform # /100m1
Boron mg /1 Fecal Strep. # /100m1
Fluoride mg /1
Phosphorous mg /1
Hardness mg /1
Alkalinity(CaCO3) 230 mg /1
B.O.D. 30 mg /1
C.O.D.100
mg /1
S.S. mg /1
Dissolved Oxygen 6.5 mg /1
B-] 4

J. METHODS OF DISPOSAL:
1. Discharged to the environment
a. Oxidation pond or holding pond
b. Percolation or evaporation pond
c. Surface spreading
d. Dry stream bed
e. Landfills
f. Disposal wells
2. Reused
a. On -site reuse
(i) Specify reuse:
(ii) Treated
(iii) Untreated
b. Irrigation
(i) Estimated amount:
(ii) Location:
LJ
3. Treated
a. Chemical reactions
b. Cooling
c. Filtering
d. Chlorination
e. Dilution
f. Ultimate disposal:
1
K. DOES THE WASTE CONSTITUTE A POTENTIAL GROUND -WATER POLLUTANT?
Yes: Cix3
No:
B-15

STATEWIDE GROUND -WATER MONITORING PLAN
POLLUTION POTENTIAL OF WASTE SOURCES
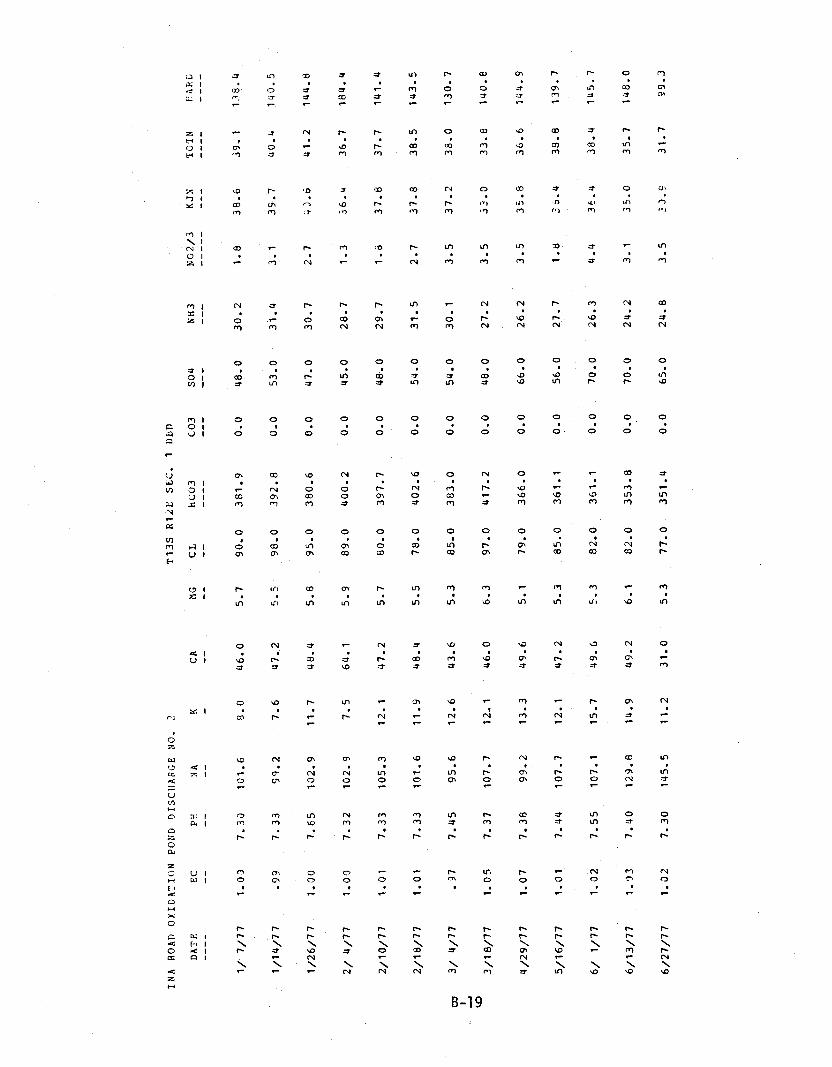
A. WASTE SOURCE: Ina Road Oxidation Ponds
B. INDIVIDUAL OR AGENCY PRODUCING OR MANAGING WASTE:
C. LOCATION OF SOURCE: (D- 13 -12) ldba
D. LOCATION SKETCH:
E. TYPE OF WASTE: SOLID LIQUID E1. Dissolved or microbial EJ
2. Suspended sediment
F. CLASSIFICATION OF WASTE:
1. MUNICIPAL: al ; Specify Sewage Ffflupnt
2. AGRICULTURAL: 1T ; Specify
3. INDUSTRIAL: E ; Specify_
4. MISCELLANEOUS: ¡`l ; Specify
ESTIMATED QUANTITY OF WASTE:
3.5 mgd mgd ere used to irrigateArthur Pack Park Golf Course(No longer in use)
B-16
H. CLASSIFICATION OF WASTE CONSTITUENTS
1. Physical
a. Temperature I--J
b. Density [i]c. Odord. Turbidity
2. Inorganic chemical
a. Major constituents
b. Other constituents
c. Trace elements
d. Gases
3. Bacteriological
a. Coliform group
b. Pathogenic microorganisms
c. Enteric viruses
4. Organic chemical
a. Carbon
b. Chlorophyls
c. Extractable organic matter
d. Methylene Blue Active substances
e. Nitrogen
f. Chemical oxygen demand
g. Phenolic material
h. Pesticides
5. Radiological
a. Gross alpha activity
b. Gross beta activity
c. Strontium
d. Radium
e. TritiumB-17
Fri
n)u 1
LJ

0'9Ot
0'87
E'L7
l'£
l'Z7
0'8S
0'0
S'hZE
0'L8
9'S
O'hE
L'lt
0'Lll
Oh 'L
6é'
LL/LZ/9
Z'Oht
S'ZE
1. '7E
8'l
E'LZ
0'09
0'0
L'9EE
0'L8
E'S
9'0S
6'hl
L'1.El
6Z 'L
66'
LL/EL/9
L'Zhl
S'Zh
L't^
S'E
l'hZ
0'Lh
0'0
9'£9E
0'Z8
E'S
1'8h
E'St
6'SOL
Eh 'L
ZO '1
LL/1. /9
Z'L£l
S'hE
9'F£
I. "E
E'LZ
O'ZS
0'0
6'80E
0' LL
.
L'h
Z'Lh
t'ZL
h'00t
Oh 'L
LL/9l/S
8'Sht
l'8E
Z' LE
S'E
S'SZ
0'69
0'0
L'8SE
0'08
9"h
8'05
L'6
8'96
6E 'L
90't
LL/h IS
9',hl
O'r,£
E'E£
I. -£
0"LZ
O'L
0'0
L"ZZh
0'h8
9'h
8'0S
l'Zl
9'S6
Zt+'L
5O 't
LL/6Z/h
6'011.
L'rE
-'_E
L'Z
t'6Z
0'8
0'0
h'6Zh
0'L OL
9'S
h'81
t'ZL
E'SOL
OE 'L
CC'l
LL/8l/E
S'OhL
E'LE
L'9=
L'Z
9'8E
O'SZ
0'0
E'Zth
O'06
S.'S
Z'Lh
L'LL
l'tt04
OE "L
r6'
LL/h /E
S'hEL
t'9E
r'_ E
L'Z
Z'8Z
O'hZ
O'0
L'ZZh
0'8L
S'S
8'htt
9'l l
h'tr6
EE 'L
86'
LL/8l/Z
8'SEl
L'SE
Z'SE
Z'Z
E'8Z
0'6
0"0
9'hZ1
0"E6
8'S
8'hh
9'iL
Z'E6
LL 'L
66'
LL/Ol/Z
L'7hl
h"LE
t'9£
6'h
9'LZ
O'h
0"0
E'h£h
0'LOL
E'S
h'811
S'8
Z'66
OE 'L
9'
LL/h /Z
h'LhL
L'6E
0' EE
t'E
Q'8Z
0'LL
0'0
0'0
0'SOh
L'S
9'6h
t'6
S'90l
Ph "L
00'L
LL/9Z/L
5.'1hl
S'L£
8'9E
1'E
9'8Z
O'E
0'0
0'LZh
0"E6
5'S
Z'Lh
L'8
0'86
9l'L
66'
LL/hL/L
6'
ht
9'BE
l'9E
L'Z
9"8Z
0'Z1.
0'0
8'hth
0'LOl
9'S
h'8h
9'L
9'1.0L
OZ "L
GC't
LL/L /t
----
----
---
---
---
---
----
--
--
--
---
--
--
----
7VR
NZO.L
i:Cv
E/ZON
EHN
hOS
CO
DE
JJHID
OW
YJ
NitÁ
i?ùJ3
YHQ
t'J3S 3Z18
SELZ
'ON
356YH7S:4 CNOd
HvI1YGI\O
E-66
L'LE
6'CE
S'£
8'hZ
0'S9
0'0
h'LSE
0'LL
£'S
0'LE
Z'lt
S'Shl
OE'L
ZC't
LL/LZ/9
0'8nl
L'SE
O'SE
l'E
Z'hZ
O'0L
0'0
9-ESE
0'Z8
l'9
Z'6n
6-ht
8'6ZL
On'L
EG'L
LL/EL/9
L'SnL
h'8E
n'SE
h'h
E'9Z
0'OL
0'0
l't9E
0'Z8
E'S
9'6h
L'SL
L'LOL
SS'L
ZO'l
LL/L /9
L'6El
8'8E
h'9E
R'L
L'LZ
0'95
0'0
l'L9E
0'S8
E'S
Z'Lh
l'ZL
L'LOL
hh'L
l0't
LL/9L/S
6'nhl
9'9E
8'_E
S'E
Z'9Z
0'99
0'0
0'99E
0'6L
L'S
9'6h
E'Et
Z'66
8E'L
LO't
LL/6Z/h
8'0h1
9'EE
0'=E
S'E
Z'LZ
0'8h
0'0
Z'Lth
O'L6
E'9
0'9h
l'Zl
L'LOL
LE'L
SO't
LL/Bt/E
L'OEL
0'9E
Z'LE
S'E
L'OE
Oft
0'0
O'E8E
0'S8
E'S
9-Eh
9'ZL
9'S6
Sh'L
LE'
LL/t/ /E
S'Eht
S'8E
8'LE
L'Z
S'LE
O'hS
0'0
9ZOh
0'8L
S'S
h'Hh
6-lt
9'1.01
EE'L
l0'L
LL/81./Z
h'Lhl
L'LE
8-LE
8'L
L'6Z
0'8h
0'0
L'L6E
0'08
L'S
Z'Lh
l'ZL
E'SOt
EE'L
t0'L
LL/OL/Z
h'h8L
L'9E
h'9E
E'l
L'8Z
O'Sh
0'0
Z'OOn
0'68
6'S
l'h9
S'L
6'ZOL
ZE'L
00't
LL/h /Z
8'hhl
Z'lh
9'C'
L'Z
L'OE
0'Lh
0'0
9'08E
0'S6
8'S
h'Bh
L'lt
6'ZOL
S9'L
00't
-LL/9Z/L
5'Ohl
h'Oh
L'6E
t'E
h'lE
O'ES
0'0
8Z6E
0'86
S'S
Z'Ln
9'L
Z'66
EE'L
66'
LL/hl/L
h'8tL
L`6E
9'8E
8't
Z'OE
0'8h
0'0
6'L8E
0'06
L'S
0'9h
0'8
9'L0l
OE'L
00'L
LL/L IL
----
----
---
---
---
---
----
--
--
--
---
--
--
----
alYFl
Nÿoz
Nrx
E/zoN
EHN
noS
E01
EO1K
TJ
ot,
VO
xVN
rd
02
a,IYC
CCU
t"D3S 37411
SELZ
Z'0N
30yVIlJSIU CNOd
NOI,:.YCIXO UV011 VNI

J. METHODS OF DISPOSAL:
1. Discharged to the environment Ill
a. Oxidation pond or holding pond
b. Percolation or evaporation pond
c. Surface spreading
d. Dry stream bed
e. Landfills
f. Disposal wells
2. Reused
a. On -site reuse Li(i) Specify reuse:
(ii) Treated
(iii) Untreated
b. Irrigation
(i) Estimated amount: .7 MGD
(ii) Location: Arthur Pack Park Golf Course
3. Treated
a. Chemical reactions
b. Cooling
c. Filtering
d. Chlorination
e. Dilution
f. Ultimate disposal:
Li
K. DOES THE WASTE CONSTITUTE A POTENTIAL GROUND -WATER POLLUTANT?
Yes:
No:
B-20
Ìxc1

STATEWIDE GROUND -WATER MONITORING PLAN
POLLUTION POTENTIAL OF WASTE SOURCES
A. WASTE SOURCE: Ina Road Wastewater Reclamation Plant
B. INDIVIDUAL OR AGENCY PRODUCING OR MANAGING WASTE:City of Tucson
C. LOCATION OF SOURCE: (D- 13 -12) 1 dba
D. LOCATION SKETCH:
E. TYPE OF WASTE: SOLID
F. CLASSIFICATION OF WASTE:
LIQUID I1. Dissolved or microbial f
2. Suspended sediment
1. MUNICIPAL: [mil ; Specify sewage eff1iPnt + sludge
2.. AGRICULTURAL: E] ; Specify
3. INDUSTRIAL: E Specify
4. MISCELLANEOUS: ; Specify( ;
G. ESTIMATED QUANTITY OF WASTE:
3.5 mgd
=0.7 mgd are used to irrigate Arthur Pack Park Golf Course
B-21
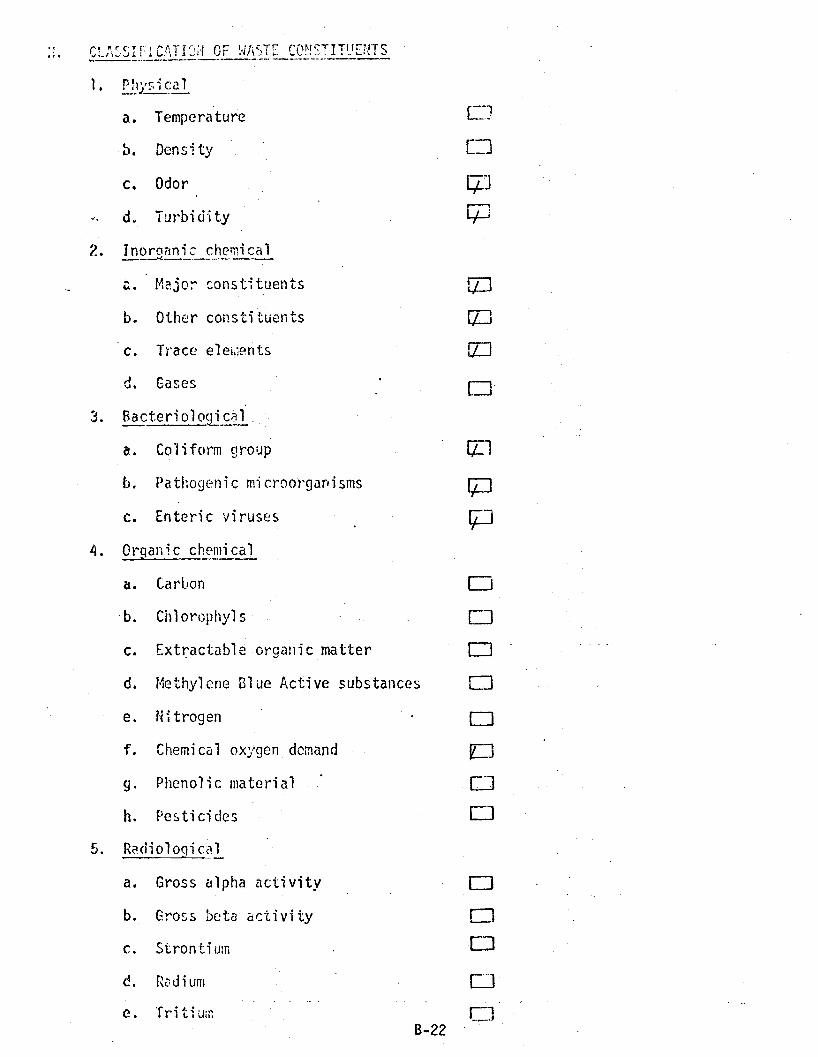
C;A:SIIICATIA OF W/J,TE CON7TITHE:ffS
1. Plysical
a. Temperature
b. Density
C. Odor
d. Turbidity
2. Inoroanic chemical
a. Major constituents
b. Other constituents
c. Trace elehlents
d. Gases
3. Bacteriologjcal
a. Coliform group 5E1
b. Pathogenic microorganisms
C. Enteric viruses
4. Organic chemical
a. Carbon
b. Chlorophyls F-1
c. Extractable organic matter
d. Methylene Blue Active substances fle. Nitrogen flf. Chemical oxygen demand
9. Phenolic material
h. Pesticides
5. Radiological
a. Gross alpha activity flb. Gross beta activity =-1
C. Strontium E.3
d. Radium
e. TritiumB-22
[7]

L1 I ulCC_ ax ¡ rn
zl ON iO 1
ON 1
z 1r7 1
IE 1rn
N
M 1N. 1
N i cAO Iz 1
cO
N
OI
O 1 DV1 I !`
Pi 1 OO IU 1 O
OM Io f rr)U I.y.. I
O
a t mU I Ot
a 1U I
Y. 1
MDN
CTS
U 1 71,1 I O
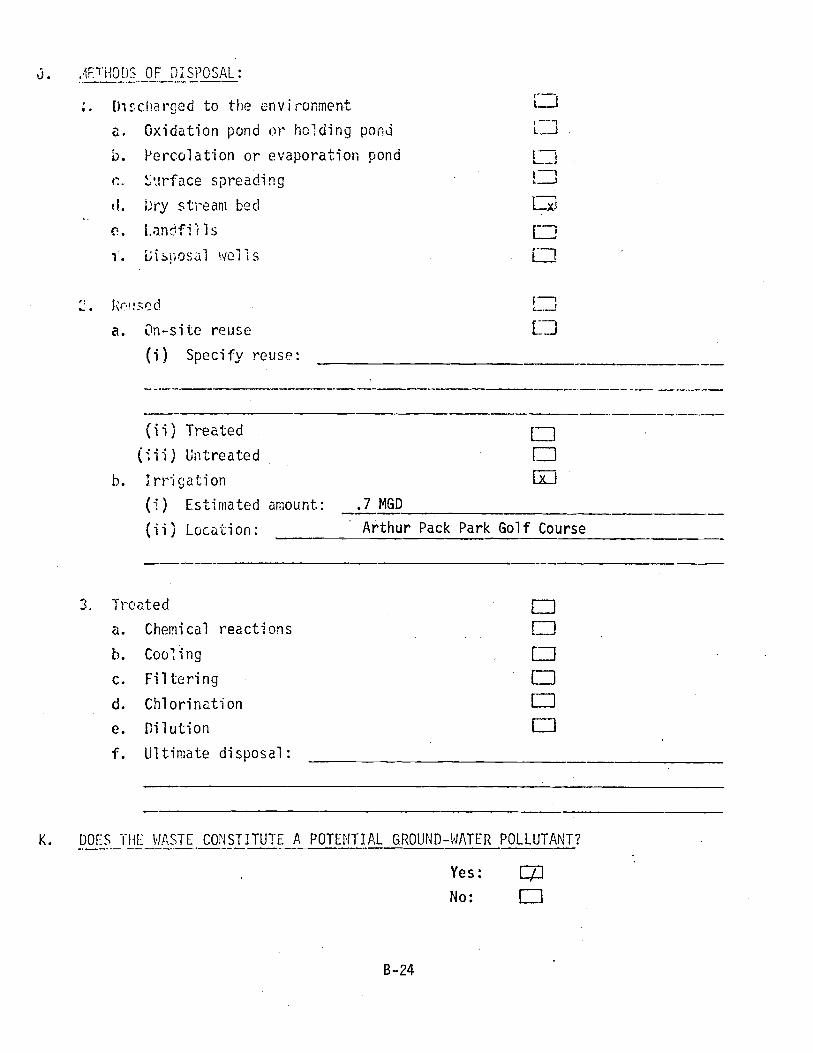
J. ,iF :THOUS OF DISPOSAL:
Discharged to the environment
a. Oxidation pond or holding pond
b. Percolation or evaporation pond
r. surface spreading
d. Dry stream bed
c:. Lanf.Iffi l s
1. Disposal wells
L. R used
a. On -site reuse
(i) Specify reuse:
(ii) Treated
(Iii) Untreated
b. irrigation
(i) Estimated amount:
(ii) Location:
U
.7 MGD
Arthur Pack Park Golf Course
E3. Treated
a. Chemical reactions
b. Cooling
c. Filtering
d. Chlorination
e. Dilution
f. Ultimate disposal:
K. DOES THE WASTE CONSTITUTE A POTENTIAL GROUND -WATER POLLUTANT?
Yes: [¡1
No: Li
B-24
A. WASTE SOURCE:
STATEWIDE GROUND -WATER MONITORING PLAN
POLLUTION POTENTIAL OF WASTE SOURCES
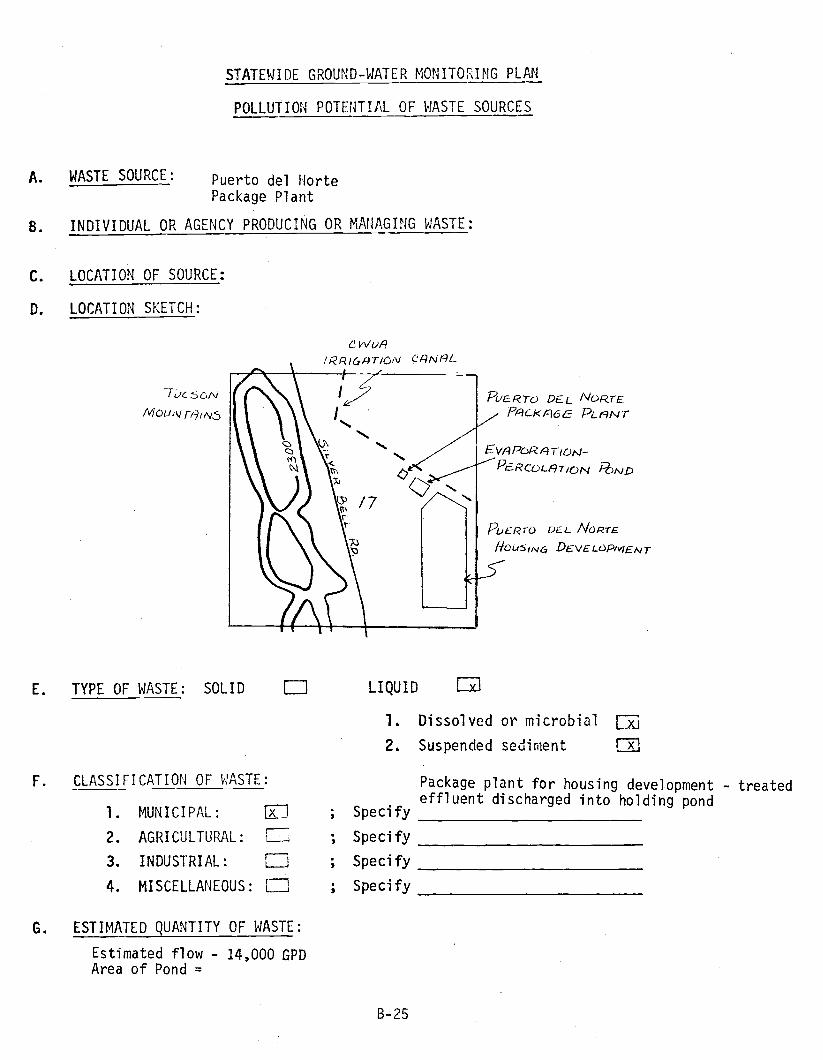
Puerto del NortePackage Plant
B. INDIVIDUAL OR AGENCY PRODUCING OR MANAGING WASTE:
C. LOCATION OF SOURCE:
D. LOCATION SKETCH:
7vL5aNNiouiv NoNS
C'_ vvUR
;!?RIC,laT/U%v CR/vr-lL
PvERro DEL NORTEPPco6E PLANT
EVAPUR ATICInJ-PERCOLATION R)ND
PULR+`C7 Di_L NORTE
lfoUSfnfG DEVELUp/v/ENT
E. TYPE OF WASTE: SOLID LIQUID Ei!
I. Dissolved or microbial [
2. Suspended sediment
F. CLASSIFICATION OF WASTE: Package plant for housing development - treatedeffluent discharged into holding pond
1. MUNICIPAL: Li._I ; Specify
2. AGRICULTURAL: ; Specify
3. INDUSTRIAL: F-1 ; Specify
4. MISCELLANEOUS: L ; Specify
G. ESTIMATED QUANTITY OF WASTE:
Estimated flow - 14,000 GPDArea of Pond =
B-25

H. CLASSIFICATION OF WASTE CONSTITUENTS
1. Physical
a. Temperature
5. Density
c. Odor
d. Turbidity
2. Inorganic chemical_
a. Major constituents
b. Other constituents
c. Trace elements
d. Gases
3. Bacteriological
a. Coliform group
b. Pathogenic microorganisms
c. Enteric viruses
4. Organic chemical
a. Carbon
b. Ctrl orophyl s
c. Extractable organic matter
d. Methylene Blue Active substances
e. Nitrogen
f. Chemical oxygen demand
g. Phenolic material
h. Pesticides
5. Radiological
a. Gross alpha activity
b. Gross beta activity
c. Strontium
d. Radium
e. Tritium
(x j
Li
LJ

REPRESENTATIVE ANALYSES:
Date of analysis: +, 2/25/77 Location: Package` Plant Effluent
EC 2.05 x 10³ mmhos
Trace
mg /1 meq /1 Arsenic mg/1
nag /1 meq /1 Barium mg /1
mg /1 meq /1 Cadmium mg /1
mg /1 meq /i Chromium mg/1
mg /1 meq /1 Copper mg /1
mg /1 meq /1 Cyanide mg /1
mg /1 meq /1 Fluoride mg /1
mg /1 meq /1 Iron mg /1
mg /1 meq /i Lead mg /1
Manganese mg /1
Other ConstituentsMercury mg /1
Nitrate -N .84 mg /1Selenium mg /1
Ammon i a -N 32.00 mg /1Silver mg /1
KJfv40.88 /1 Strontium mg/ 1
Total -N 41.72 mg /1Zinc mg /1
Specific conductance 2.05x10³ mg /1
Total dissolved solids mg /1 Microorganisms
pH 7.46 mg /1 Total coliform #/100m1
Silica mg /1 Fecal co1iform #/100m1
Boron mg /1 Fecal Strep. #/100m1
Fluoride mg /1
Phosphorous mg /1
Hardness 290.34 mg /1
Alkalinity mg /1
B.O.D. AverageInefum 249
mg /1Effl at 34
C.O.D. mg /1
S.S. mg /1
Major
105.6Calcium
Magnesium 13.53
Sodium 217.8
Potassium26.95
Carbonate 0
Bicarbonate 797.9
Sulfate 2
Chloride 293
Nitrate 3.72
B-27
J. METHODS OF DISPOSAL:
1. Discharged to the environment CD
a. Oxidation pond or holding pond LJb. Percolation or evaporation pond
c. Surface spreading [_.J
d. Dry stream bed
e. Landfills
f. Disposal wells U
2. Reused 0a. On -site reuse
(i) Specify reuse:
(ii) Treated
(iii) Untreated
b. Irrigation
(i) Estimated amount:
(ii) Location:
3. Treated
a. Chemical reactions
b. Cooling
c. Filtering
d. Chlorination
e. Dilution
f. Ultimate disposal:
LJl0IXI
0
K. DOES THE WASTE CONSTITUTE A POTENTIAL GROUND -WATER POLLUTANT?
Yes: DONo:
STATEWIDE GROUND -WATER MONITORING PLAN
POLLUTION POTENTIAL OF WASTE SOURCES
N. WASTE SOURCE: Rabies Control Package Plant
3. INDIVIDUAL OR AGENCY PRODUCING OR MANAGING WASTE: Pima County
V LOCATION OF SOURCE: (D- 13- 13)ddc
D. LOCATION SKETCH:
E. TYPE OF WASTE: SOLID ( z 1 LIQUID C
1. Dissolved or microbial
2. Suspended sediment
F. CLASSIFICATION OF WASTE:
1. MUNICIPAL: al ; Specify Package P1 an _ effl lien _ el Paçed to
Specify leach field2. AGRICULTURAL: Li ;
3. INDUSTRIAL: ; Specify
4. MISCELLANEOUS: [ ; Specify
G. ESTIMATED QUANTITY OF WASTE:
Discharge 1200 gpd
B-29

H. CLASSIFICATION OF WASTE CONSTITUENTS
1. Physical
a. Temperature
b. Density
c. Odor
d. Turbidity
2. Inorganic chemical
a. Major constituents
b. Other constituents
c. Trace elements
d. Gases
3. Bacteriological
a. Coliform group
b. Pathogenic microorganisms
c. Enteric viruses
4. Organic chemical
a. Carbon
b. Chlorophyls
c. Extractable Organic matter
d. Methylene Blue Active substances
e. Nitrogen
f. Chemical oxygen demand
g. Phenolic material
h. Pesticides
5. Radiological
a. Gross alpha activity
b. Gross beta activity
c. Strontium
d. Radium
e. Tritium
U
L
x
(
Ei1
LJ
r
L__J
Ì1B-30

f;Cï'RI: SE:aA I VE î I\LYS_`.;
Dte_9_t_(7,E ysi : unknown Location:
ih or: Trace
Calcium mg/1 meq/1 Arsenic mg/1
Magnesium mg/1 n'eq/1 Barium __mg/1
Sodium mg/1 meq/1 Cadmium mg/1
Potassium mg /1 meq /1 Chromium my /1
Carbonate mg /1 meq /1 Copper ____.__._mg /1
Bicarbonate mg /1 meq /1 Cyanide mg /1
Sulfate mg /1 mecs /1 Fluoride mg /1
Chloride mg/ 1 mec; /1 Iron _ mg /1
Nitrate mg /1 meq /1 Lead _______ mg /,
Manganese ____ mg /1
Ot.h r ConstituentsMercury mg /1
Nitrate-tl mg/1Selenium mg /1
Silver .;
KJN mg /1Strontium mg/ 1
'total --I; reg /1Zinc mg /1
Specific conductance mg /1
Total dissolved solids mg /1
pH mg /1
Silica mg /1
Boron mg /1
Fluoride mg /1
Phosphorous mg /1
Hardness mg /1
Alkalinity mg /1
B..O.D. mg /1
C.O.D. mg /1
S.S. mg /i
B-31
Microorganisms
Total coliform 11/100
Fecal coliform ; /10"
Fecal Strap. P/100::
J. METHODS OF DI `>('OSfal.
1. Discharged to the environment Fin
a. Oxidation pond or holding pond
b. Percolation or evaporation pond (-1c. Surface spreading
d. Dry stream bed
e. Landfills [f. Disposal wells
g. Other (leach fluid)
2. Reused C7
a. On -site reuse ri
(1) Specify reuse:
l 1
(ii) Treated
(iii) Untreated
b. Irrigation
(i) Estimated amount:
(ii) Location:
3. Treated
a. Chemical reactions
b. Cooling
c. Filtering
d. Chlorination
e. Dilution
f. Ultimate disposal:
K. DOES THE WASTE CONSTITUTE A POTENTIAL GROUND -WATER POLLUTANT?
Yes:
No:
B-32
fx 1

STATEWIDE GROUND -WATER MONITORING PLAN
POLLUTION POTENTIAL OF WASTE SOURCES
A. WASTE SOURCE: Ruthrauff Rd Sanitary Landfill(El Camino del Cerro)
B. INDIVIDUAL OR AGENCY PRODUCING OR MANAGING WASTE: Pima County Dept. of Sanitation
C. LOCATION OF SOURCE:
D. LOCATION SKETCH:
D-13-13) 17 dcc
E. TYPE OF WASTE: SOLID
2.-10
Airs RgL,Fr` Ro,405u9Ni rRRY \\LH/vOFILL
RurHR/avFF Ro.
LIQUID ED
1. Dissolved or microbial [71
2. Suspended sediment
F. CLASSIFICATION OF WASTE:
1. MUNICIPAL: [ ; Specify Residual yrastP
2. AGRICULTURAL: [7] ; Specify
3. INDUSTRIAL: Q ; Specify
4. MISCELLANEOUS: h ; Specify
G. ESTIMATED QUANTITY OF WASTE:
330 Tons per day
B-33

H. CLASSIFICATION OF WASTE CONSTITUENTS
1. Physical
a. Temperature
b. Density
C. Odor
d. Turbidity
2. Inorganic chemical
a. Major constituents
b. Other constituents
C. Trace elements
d. Gases
3. Bacteriological
a. Coliform group
b. Pathogenic microorganisms
c. Enteric viruses
4. Organic chemical
a. Carbon
b. Chlorophyls
c. Extractable organic matter
d. Methylene Blue Active substances
e. Nitrogen
f. Chemical oxygen demand
g. Phenolic material
h. Pesticides
5. Radiological
a. Gross alpha activity
b. Gross beta activity
c. Strontium
d. Radium
e. Tritium
B-34
Liczi
)171
i
Li
I I
nn
El
Li
E3
El
Ei
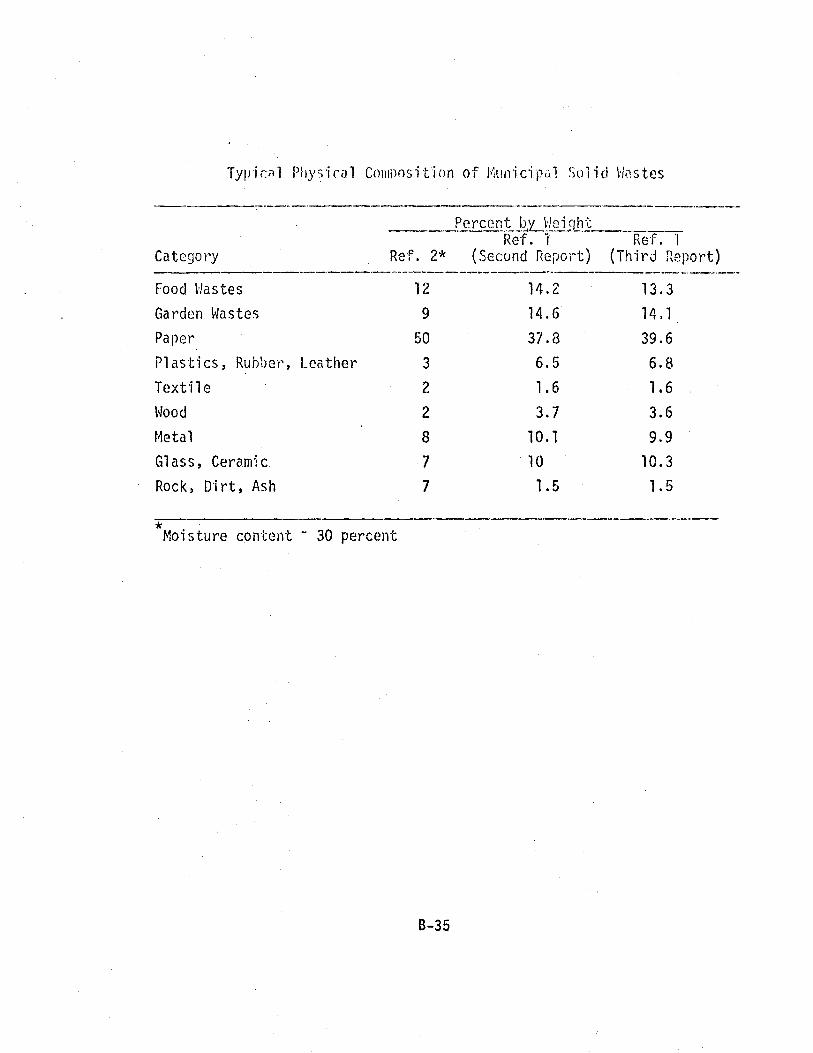
Typ'ic.il1 Physical Composition of Mull'iclpi.ìl Solid Wastes
Percent Icy Weigh c
Ref. l Ref.. i
Category Ref. 2* (Second Report) (Third Report)
Food Wastes 12 14.2 13.3
Garden Wastes 9 14.6 14.1
Paper 50 37.8 39.6
Plastics, Rubber, Leather 3 6.5 6.8
Textile 2 1.6 1.6
Wood 2 3.7 3.6
Metal 8 10.1 9.9
Glass, Ceramic 7 10 10.3
Rock, Dirt, Ash 7 1.5 1.5
*Moisture content ` 30 percent

I. REPRESENTATIVE ANALYSES: (Leachate) Well located at west end of fill, in perching layer
Date of analysis: 10/1/76 Location:
Major - Trace
Calcium 73h mg /1 meq /1 Arsenic mg /1
Magnesium 85 mg /1 meq /1 Barium mg /1
Sodium 193 mg /1 meq /l Cadmium tr. mg /1
Potassium 41 mg /1 meq /1 Chromium 0.1 mg /1
Carbonate mg /1 meq /1 Copper 0.2 mg /1
Bicarbonate mg /1 meq /1 Cyanide mg /1
Sulfate 1157 mg /1 meq /1 Fluoride mg /1
Chloride 106 mg /1 meq /1 Iron 7.9 mg /1
Nitrate mg /1 meq /1 Lead 0.5 mg /1
Manganese 34 mg /1
Other ConstituentsMercury mg /1
Nitrate -N 0.25 mg /1Selenium mg /1
Ammonia -N 8.68 mg /1Silver mg /1
KJN 10.64 mg /1Strontium mg /1
Total -N1U.89
mg /1Zinc 0.3 mg /1
Specific conductance 1900 mmhos /cm
Total dissolved
pH
Silica
Boron
Fluoride
Phosphorous
Hardness
Alkalinity
B.O.D.
C.O.D.
S.S.
TOC 0.03%
solids 1216 mg /1 Microorganisms
6.2 mg /i Total coliform #/100m1
mg /1 Fecal coliform #/100m1
mg /1 Fecal Strep. #/100m1
mg/1
mg/1
mg/1
mg/1
mg/1
mg/1
mg/1
B-36

J. METHODS OF DISPOSAL:
1. Discharged to the environment
a. Oxidation pond or holding pond
b. Percolation or evaporation pond
c. Surface spreading
d. Dry stream bed
e. Landfills
f. Disposal wells
2. Reused
a. On -site reuse
(i) Specify reuse:
rnLnnxj
nn
(ii) Treated
(iii) Untreated
b. Irrigation
(i) Estimated amount:
(ii) Location:
nl
3. Treated
a. Chemical reactions
b. Cooling
c. Filtering
d. Chlorination
e. Dilution
f. Ultimate disposal:
K. DOES THE WASTE CONSTITUTE A POTENTIAL GROUND -WATER POLLUTANT?
Yes: 5]No:
B-37

STATEWIDE GROUND -WATER MONITORING PLAN
POLLUTION POTENTIAL OF WASTE SOURCES
A. WASTE SOURCE: Ina Rd Sanitary Landfill
3. INDIVIDUAL OR AGENCY PRODUCING OR MANAGING WASTE: City of Tucson
C. LOCATION OF SOURCE: (D- 12 -12) 36 cd
D. LOCATION SKETCH:
INA RD SANITARY LANDFILL AND ENVIP.ûNS, SHOWINGLOCATION OF O,SERVPTION WELLS
E. TYPE OF WASTE: SOLID
F. CLASSIFICATION OF WASTE:
1. MUNICIPAL: LL
2. AGRICULTURAL: L13. INDUSTRIAL: ,[21
4. MISCELLANEOUS: Li
G. ESTIMATED QUANTITY OF WASTE:
30' deep, 60 acres, 250Garbage + trash
LIQUID I
/ ( Leachate
1. Dissolved or microbial
2. Suspended sediment
Specify
; Specify
Specify
; Specify
LxJ1-1
closedtons /day
B-38

H. CLASSIFICATION OF WASTE CONSTITUENTS
1. Physical
a. Temperature
b. Density
c. Odor
d. Turbidity
2. Inorganic chemical
a. Major constituents
b. Other constituents
c. Trace elements
d. Gases
3. Bacteriological
a. Coliform group
b. Pathogenic microorganisms
e. Enteric viruses
4. Organic chemical
a. Carbon
b. Chlorophyls
c. Extractable organic matter
d. Methylene Blue Active substances
e. Nitrogen
f. Chemical oxygen demand
g. Phenolic material
h. Pesticides
5. Radiological
a. Gross alpha activity
b. Gross beta activity
c. Strontium
d. Radium
e. Tritium

Typical Physical Composition of Municipal Solid Wastes
Percent by WeirTht
Ref. 1 Ref. 1
Catogo,T Ref. 2* (Second Report) (Third Report)
FoDd V,,stes 12 14.2 13.3
Gardon Wi.s!os 9 14.6 14.1
Paper 50 37.8 39.G
Rubber , Loather 3 6.5 6.8
Textile 2 1.6 1.6
Wood 2 3.7 3.6
Metal 8 10.1 9.9
Glass, Ceramic 7 10 10.3
Rock, Dirt, Ash 7 1.5 1.5
Moisture content - 30 percent
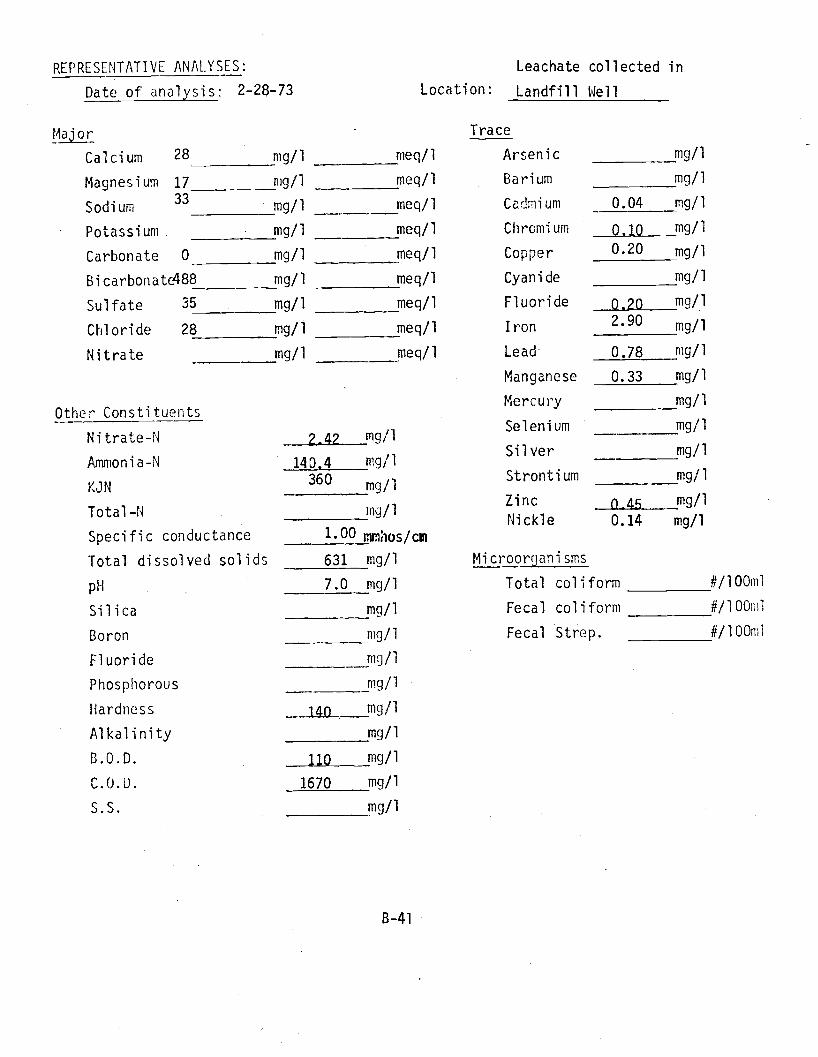
REPRESENTATIVE ANALYSES: Leachate collected in
Date of analysis: 2 -28 -73 Location: Landfill Well
Major
Calcium 28
Magnesium 17
Sodium33
Potassium
Carbonate 0
Trace
mg /1 meq /l Arsenic mg /1
nag /1 meq /i Barium mg /1
mg /1 meq /1 Cadmium 0.04 mg /i
mg /1 meq /1 Chromium 0.10 mg /1
mg /1 meq /l Copper 0.20 mg/1
Bicarbonate488 mg /1 meq /i Cyanide mg /1
Sulfate 35 mg/1 meq /1 Fluoride 0,20 mg /1
Chloride 28 mg /1 meq /1 Iron 2.90 mg /1
Nitrate mg /1 meq /1 Lead. 0.78 mg /1
Manganese 0.33 mg /1
Other ConstituentsMercury mg /1
Nitrate -N mg/1Selenium mg /1
2, 47
Ammonia -N 140.4 mg /1Silver mg/1
KJN360 /1 Strontium mg/ 1
Total -N mg /1Zinc 4S mg/1
Specific conductance 1.00 mmhos /cm
Nickle 0.14 mg /1
Total dissolved solids 631 mg /1
pH 7.0 mg /1
Silica mg /1
Boron mg /1
Fluoride mg /1
Phosphorous mg /1
Hardness 14n mg /1
Alkalinity mg /1
B.O.D. 110 mg /1
C.O.D. 1670 mg /1
S.S. mg /1
B-41
Microorganisms
Total coliform #/100m1
Fecal coliform #/100.,111
Fecal Strep. #/10Om1

J. METHODS OF DISPOSAL:
1. Discharged to the environment ED
a. Oxidation pond or holding pond Lib. Percolation or evaporation pond I`-I
c. Surface spreading [Jd. Dry stream bed ne. Landfills Qf. Disposal wells
2. Reused CIa. On -site reuse r -1
(i) Specify reuse:
(ii) Treated
(iii) Untreated
b. Irrigation.
(i) Estimated amount:
(ii) Location:
3. Treated
a. Chemical reactions
b. Cooling
c. Filtering
d. Chlorination
e. Dilution
f. Ultimate disposal:
Li1 I
I I
K. DOES THE WASTE CONSTITUTE A POTENTIAL GROUND -WATER POLLUTANT?
Yes:
No: 1B-42
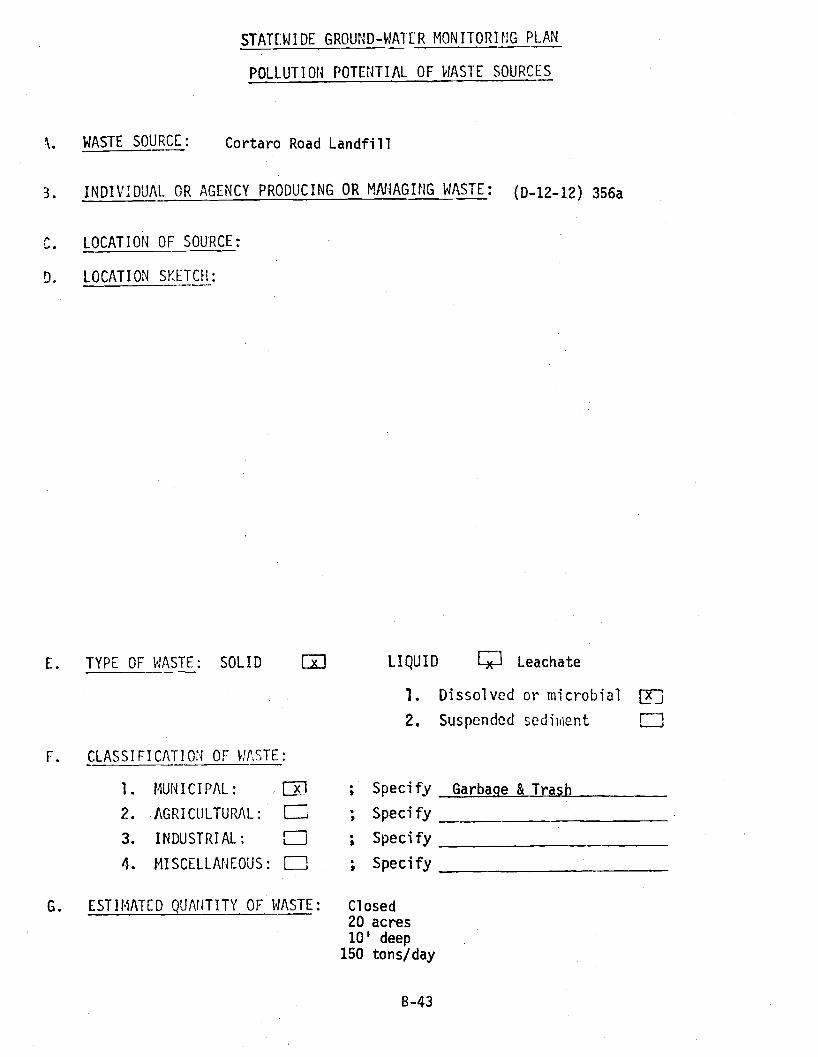
N. WASTE SOURCE:
STATEWIDE GROUND -WATER MONITORING PLAN
POLLUTION POTENTIAL OF WASTE SOURCES
Cortaro Road Landfill
3. INDIVIDUAL OR AGENCY PRODUCING OR MANAGING WASTE: (D- 12 -12) 356a
C. LOCATION OF SOURCE:
D. LOCATION SKETCH:
E. TYPE OF WASTE: SOLID nil LIQUID CTO Leachate
1. Dissolved or microbial
2. Suspended sediment
F. CLASSIFICATION OF WASTE:
1. MUNICIPAL: [x Specify Garbage & Trash
2. AGRICULTURAL: 1 ; Specify
3. INDUSTRIAL: F-1 ; Specify
4. MISCELLANEOUS: r-i ; Specify
G. ESTIMATED QUANTITY OF WASTE: Closed20 acres10' deep
150 tons /day
8 -43

H. CLASSIFICATION OF WASTE CONSTITUENTS
1. Physical
a. Temperature
b. Density
c. Odor
d. Turbidity
2. Inorganic chemical
a. Major constituents
b. Other constituents
c. Trace elements
d. Gases
3. Bacteriological
a. Coliform group
b. Pathogenic microorganisms
c. Enteric viruses
4. Organic chemical
a. Carbon
b. Chlorophyls
c. Extractable organic matter
d. Methylene Blue Active substances
e. Nitrogen
f. Chemical oxygen demand
g. Phenolic material
h. Pesticides
5. Radiological
a. Gross alpha activity
b. Gross beta activity
c. Strontium
d. Radium
e. Tritium
B-44

Typical Physical Composition of Municipal Solid Wastes
Percent b,L We i ght
Ref. 1 Ref. 1
Category Ref. 2* (Second Report) (Third Report)
Food Wastes 12 14.2 13.3
Carden Wastes 9 14.6 14.1
Paper 50 37.8 39.6
Plastics, Rubber, Leather 3 6.5 6.8
Textile 2 1.6 1.6
Wood 2 3.7 3.6
Metal 8 10.1 9.9
Glass, Ceramic 7 10 10.3
Rock, Dirt, Ash 7 1.5 1.5
*Moisture content " 30 percent
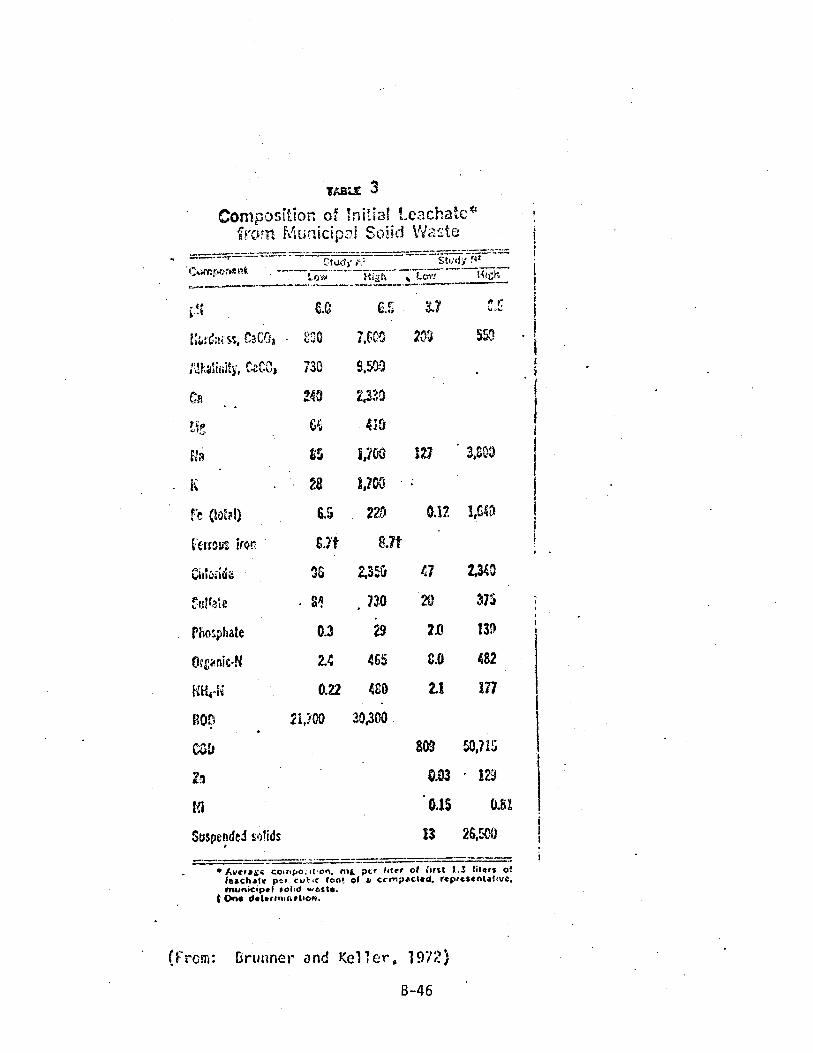
SABLE 3
COmposition of !nitia! Lez-lchate*from Municipi Soiid Vtc
t
LOW
fl i StUdi fit, Low
c. ES S.7r
Mani ss, f.:?C(1,
nkatiiiity, CaCO)
e`JO
730
7,6C0
9,50)
20-3 553
240 2,330
64; 4; 9
Fla 65 1,700 127 3,C00
28 1,700
Ft (total) 6.5 221) 0.12 1,C4
Vet tote; hr. &t kltcí;id 36 Z355
tii s 730
Phosphate 0.3 D
Oconic-N 2.4 465
0.22 CO
Flop 21,?00 30,300
C;0
Zn
Suspended solids
47 2,343
20 375
2.0 139
C.0 482
2.1 177
809 50,715
0.03 ID
0.15 0.81
13 26,:n
Average comp°. won, nq. pca bier at itrst L3 Mere ofteachate per cutic foot et i, ccrnpactred. representative.municipet /olio iwaste.One determination.
(From: Brunner and Keller, 1972)
B-46

J. METHODS OF DISPOSAL:
1. Discharged to the environment
a. Oxidation pond or holding pond
b. Percolation or evaporation pond
c. Surface spreading
d. Dry stream bed
e. Landfills
f. Disposal wells
2. Reused
a. On -site reuse
(i) Specify reuse:
ÜC7
n¡ x¡
[n
(ii) Treated
(iii) Untreated
b. Irrigation
(i) Estimated amount:
(ii) Location:
3. Treated
a. Chemical reactions
b. Cooling
c. Filtering
d. Chlorination
e. Dilution
f. Ultimate disposal:
LJ
K. DOES THE WASTE CONSTITUTE A POTENTIAL GROUND -WATER POLLUTANT?
Yes: nNo:
STATEWIDE GROUND -WATER MONITORING PLAN
POLLUTION POTENTIAL OF WASTE SOURCES
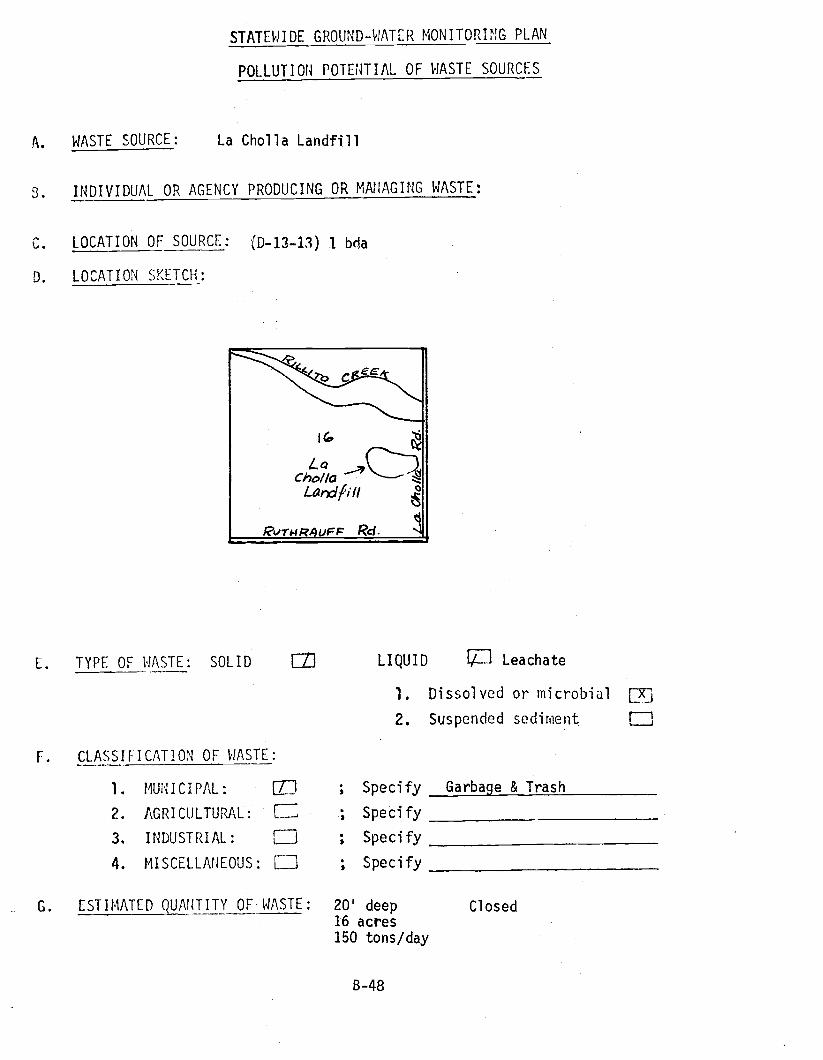
A. WASTE SOURCE: La Cholla Landfill
S. INDIVIDUAL OR AGENCY PRODUCING OR MANAGING WASTE:
C. LOCATION OF SOURCE: (D_13 -13) 1, bola
D. LOCATION SKETCH:
EE
I%
LaC'hollp
Landfill
eaTMRAIlFF-F Rd. J
E. TYPE OF WASTE: SOLID LIQUID Leachate
1. Dissolved or microbial Lxj
2. Suspended sediment QF. CLASSIFICATION OF WASTE:
1. MUNICIPAL: C ; Specify Garbage & Trash
2. AGRICULTURAL: Specify
3. INDUSTRIAL: F--1 ; Specify
4. MISCELLANEOUS: { ; Specify
G. ESTIMATED QUANTITY OF WASTE: 20' deep16 acres150 tons /day
B-48
Closed

H. CLASSIFICATION OF WASTE CONSTITUENTS
1. Physical
a. Temperature
b. Density
c. Odor
d. Turbidity
2. Inorganic chemical
a. Major constituents
b. Other constituents
c. Trace elements
d. Gases
3. Bacteriological
a. Coliform group
b. Pathogenic microorganisms
c. Enteric viruses
4. Organic chemical
a. Carbon
b. Chlorophyls
c. Extractable organic matter
d. Methylene Blue Active substances
e. Nitrogen
f. Chemical oxygen demand
g. Phenolic material
h. Pesticides
5. Radiological
a. Gross alpha activity
b. Gross beta activity
c. Strontium
d. Radium
e. Tritium
B-49
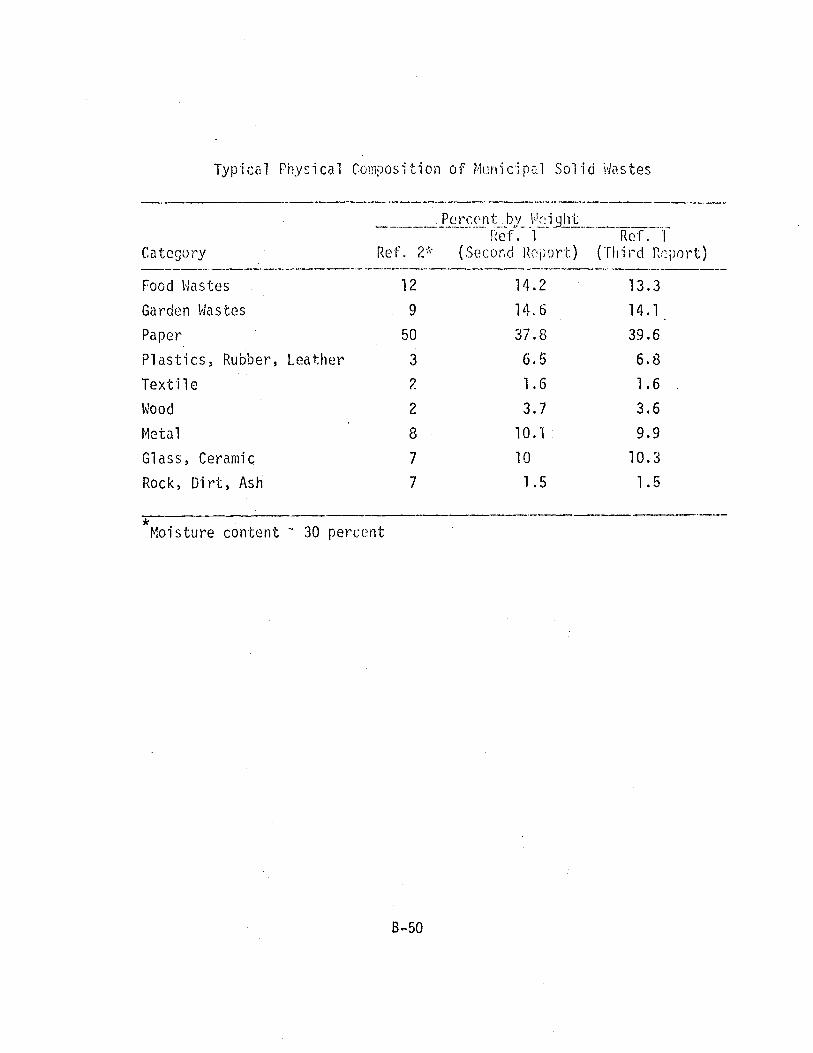
Typical Physical Composition of Municipal Solid Wastes
Category Ref. 2*
Percent bv lqetght
Ref. 1-(Second Report)
[WT.
(Third Report)
Food Wastes 12 14.2 13.3
Garden Wastes . 9 14.6 14.1
Paper 50 37.8 39.6
Plastics, Rubber, Leather 3 6.5 6.8
Textile 2 1.6 1.6
Wood 2 3.7 3.6
Metal 8 10.1 9.9
Glass, Ceramic 7 10 10.3
Rock, Dirt, Ash 7 1.5 1.5
Moisture content - 30 percent

TABLE 3
Composition of Initial Leachate°from Municipal Solid Waste
'ComponentStudy A' Study B'
Low High Low High
off 6.0 6.5 3.7 8.5
Hardness, CaCO, 890 7,600 200 550
Alkalinity, CaCO, 730 9,500
Ca 240 2,330
Nj 64 410
Na 85 1,700 127 3,800
K 28 1,700
re (total) 6.5 220 0.12 1,640
ferrous iron 8.7t 8.7t
Chloride 96 2,350 47 2.340
Sulfate 84 730 20 375
Phosphate 0.3 19 2.0 130
Organic -N 2.4 465 8.0 482
HR -N 0.22 480 2.1 177
Bop 21,700 30,300.
COD 809 50,715
to 0.03 129
M 015 0.81
Suspended solids 13 26,500
Average compos't.on. mg per Mer of first 1.3 liters of;sac/sate per cubic foot of a compacted. representative.municipal solid waste.
t Ona determination.
(From: Brunner and Keller, 1972)
B-51

J. METHODS OF DISPOSAL:
1. Discharged to the environment
a. Oxidation pond or holding pond
b. Percolation or evaporation pond
c. Surface spreading
d. Dry stream bed
e. Landfills
f. Disposal wells
2. Reused
a. On -site reuse
(i) Specify reuse:
nnI x I
fl
(ii) Treated
(iii) Untreated
b. Irrigation
(i) Estimated amount:
(ii) Location:
rn
3. Treated
a. Chemical reactions
b. Cooling
c. Filtering
d. Chlorination
e. Dilution
f. Ultimate disposal:
LJ
( (
K. DOES THE WASTE CONSTITUTE A POTENTIAL GROUND -WATER POLLUTANT?
Yes: (x1
No:
B-52
STATEWIDE GROUND -WATER MONITORING PLAN
POLLUTION POTENTIAL OF WASTE SOURCES
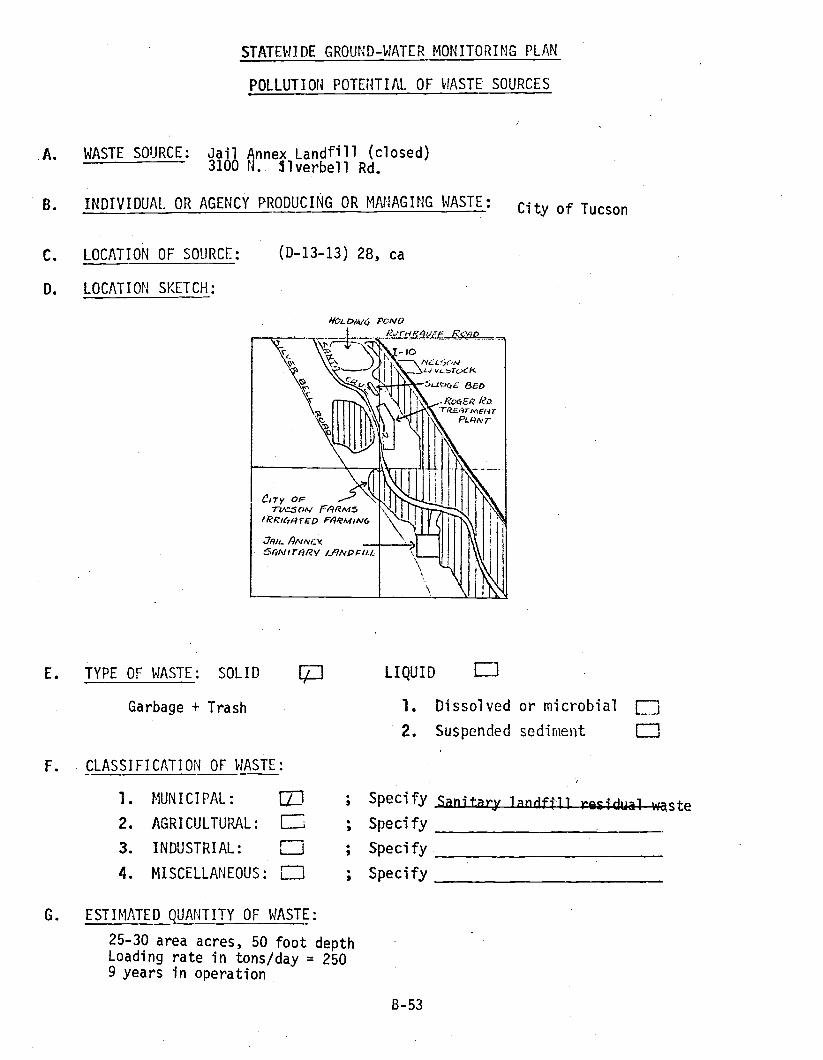
A. WASTE SOURCE: Jail Annex Landfill (closed)3100 N. Slverbell Rd.
B. INDIVIDUAL OR AGENCY PRODUCING OR MANAGING WASTE:
C. LOCATION OF SOURCE: (D- 13 -13) 28, ca
D. LOCATION SKETCH:
HOL Dl4/q ACNU`P.a".0 700X...RG'FID-----._-
--,o
c; v:STUtK5t15006 BED
. RocrER RDT(tïA7NiE(q r
pLHNr
JRh_ /)NNox5nN(t'yRY 4/7NAG/tG
E. TYPE OF WASTE: SOLID
F.
Garbage + Trash
n
City of Tucson
LIQUID lÌ
1. Dissolved or microbial [
2. Suspended sediment
CLASSIFICATION OF WASTE:
1. MUNICIPAL: F71 ; Specify ., . 1 .
2. AGRICULTURAL: LJ ; Specify
3. INDUSTRIAL: E ; Specify
4. MISCELLANEOUS: i-1 ; Specify
G. ESTIMATED QUANTITY OF WASTE:
25 -30 area acres, 50 foot depthLoading rate in tons /day = 2509 years in operation
B-53

H. CLASSIFICATION OF WASTE CONSTITUENTS
1. Physical
a. Temperature Ei
b. Density C]
c. Odor C.l
d. Turbidity F-1
2. Inorganic chemical
a. Major constituents
b. Other constituents
c. Trace elements
d. Gases E3. Bacteriological
a. Col i form group
b. Pathogenic microorganisms
c. Enteric viruses I I ?
4. Organic chemical
a. Carbon
b. Chlorophyls Elc. Extractable organic matter nd. Methylene Blue Active substances LJe. Nitrogen
f. Chemical oxygen demand ]g. Phenolic material
h. Pesticides
5. Radiological
a. Gross alpha activity _ 1
b. Gross beta activity
c. Strontium Lid. Radium
e. Tritium riB -54
x
Ix 1
x
I I
I I
I I
1

TABUS 3
Composition of Initial Leachate*from Municipal Solid Waste
Study A'Component
Study B'Low High Low High
PN 6.0 6.5 3.7 8.5
Hardness, CaCO, 890 7,600 200 550
Alkalinity, CaCO, 730 9,500
Ca 240 2.330
htz 64 410
Ns 85 1,700 127 3,800
K 28 1,700
Fe (total) 6.5 220 0.12 1.640
ferrous iron 8.7t 8.71
Chloride 96 2,350 47 2,340
Sulfate 84 730 20 375
Phosphate 0.3 29 2.0 130
Organic-N 2.4 465 8.0 482
NNe-N 0.22 480 2.1 177
BOD 21,700 30300
COD 809 50,715
ta 0.03 129
Ni 0.15 0.81
Suspended solids 13 26,500
Average compositon, mg per Mer of first 1.3 liters ofleachate per cubic foot of compacted. representativ.municipal solid waste.
t One determination.
(From: Brunner and Keller, 1972)
B-55

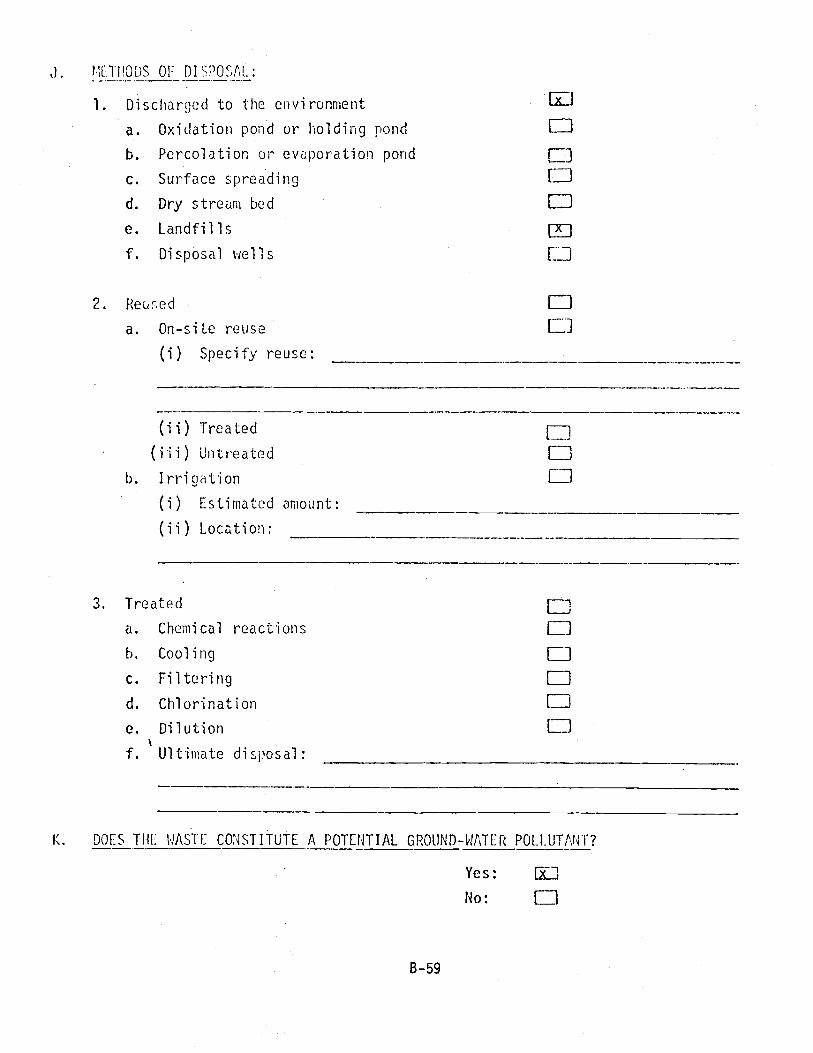
J. METHODS OF DISPOSAL:
1. Discharged to the environment Cx-Ï
a. Oxidation pond or holding pond [J
b. Percolation or evaporation pond (-1c. Surface spreading CJ
d. Dry stream bed LJe. Landfills [C1
f. Disposal wells j 1
2. Reused C-1
a. On -site reuse C-1
(i) Specify reuse:
(ii) Treated
(iii) Untreated
b. Irrigation
(i) Estimated amount:
(ii) Location:
LJ
3. Treated
a. Chemical reactions
b. Cooling
c. Filtering
d. Chlorination
e. Dilution
f. Ultimate disposal:
LJ
El
K. DOES THE WASTE CONSTITUTE A POTENTIAL GROUND -WATER POLLUTANT?
Yes:
No:
B-56
j xl
UU

STATEWIDE GROUND -WATER MONITORING PLAN
POLLUTION POTENTIAL OF WASTE SOURCES
WASTE SOURCE: University of Arizona Dump
3. INDIVIDUAL OR AGENCY PRODUCING OR MANAGING WASTE: University of Arizona
C. LOCATION OF SOURCE: `D -13- 13)34ód
D. LOCATION SKETCH:
E. TYPE OF WASTE: SOLID. LIQUID id (leachate)
1. Dissolved or microbial
2. Suspended sediment
F. CLASSIFICATION OF WASTE:
1. MUNICIPAL: ED ; Specify Landfill leachate
2. AGRICULTURAL: E ; Specify
3. INDUSTRIAL: F-1 ; Specify
4. MISCELLANEOUS: F73 ; Specify
G. ESTIMATED QUANTITY OF WASTE:
Estimated Area - 5 acresEstimated Depth - 10 feetLoading Rate - 2 tons /month
B-57

H. CLASSIFICATION OF 14/15,TE CONSTITUENTS
I.
a. Temperature
b. Density
C. Odor
d. Turbidity
2. Inorganic chemical
a. Major constituents
b. Other constituents
C. Trace elements
d. Gases
3. Bacteriological
a. Coliform group.
b. Pathogenic microorganisms
C. Enteric viruses
4. Organic chemical
a. Carbon
b. Chlorophyls
c. Extractable organic matter Lid. Methylene Blue Active substances Li
e. Nitrogen
f. themical oxygen demand
g. Phenolic material
h. Pesticides
5. Radiological
a. Gross alpha activity
b. Gross beta activity
c. Strontium
d. Radium
e. Tritium
3
IiiLi
[x I
Li
I
Ej
Li
J. rLl:Tl{OüS OF I) I S('OSAL :
1. Discharged to the environment
a. Oxidation pond or holding pond
b. Percolation or evaporation pond
c. Surface spreading
d. Dry stream bed
e. Landfills
f. Di spósal wells
2. Reused
a. On -site reuse
(i) Specify reuse:
CJU
UI I
Ix
L
(ii) Treated
(iii) Untreated
b. Irrigation
(i) Estimated amount:
(ii) Location:
L,1LJL_J
3. Treated
a. Chemical reactions (__]
b. Cooling [-1
c. Filtering f i
d. Chlorination x.13
e. Dilution LIf. Ultimate disposal:
K. DOES THE WASTE CONSTITUTE A POTENTIAL GROUND -WATER POLLUTANT?
Yes: Ix -
No : F-1
B -59

I. REPRESENTATIVE ANALYSES:
Date of analysis: Location;
Major Trace
Calcium mg/1_.__
meq /1 Arsenic mg /1
Magnesium mg/1 meq /l Barium mg /1
Sodium mg /1 meg/1 Cadmium mg /1
Potassium mg /1 meq /1 Chromium mg /1
Carbonate mg /1 meq /1 Copper mg /1
Bicarbonate ;g /1 meq /1 Cyanide mg /1
Sulfate mg /1 meq /1 Fluoride mg /2
Chloride mg /i meq /1 Iron mg /1
Nitrate mg /1 meq /1 Lead mg /1
Manganese mg /1
Othcr ConstituentsMercury mg/1
naSelenium g /1
Nitrate -P; mg /1
Ammonii a -N/1 Silver
______._..___. '`I /1
KJt. mg/ 1Strontium mg /1
Total -N/1 Zinc nag /1
Specific conductance mg /1
Total dissolved solids mg /1 Microorganisms
pH mg /1 Total col i form i! /100
Silica mg /1 Fecal col i form #/10(.4
Boron nag /1 Fecal Strep. # /1C0:..
Fluoride mg /1
Phosphorous mg /1
Hardness mg /1
Alkalinity mg /1
8,0. D. mg /1
C.O.D. mg /i
S.S. mg /1

STATEWIDE GROUND -WATER MONITORING PLAN
POLLUTION POTENTIAL OF WASTE SOURCES
A. WASTE SOURCE: Septic Tanks
3. INDIVIDUAL OR AGENCY PRODUCING OR MANAGING WASTE: Rural Individual Households
C. LOCATION OF SOURCE:
D. LOCATION SKETCH:
North of Camino del Cerro and West of the Santa Cruz River(see Source Map)
E. TYPE OF WASTE: SOLID [ 1 LIQUID
1. Dissolved or microbial L'J
2. Suspended sediment
F. CLASSIFICATION OF WASTE:
1. MUNICIPAL: [¡1 ; Specify
2. AGRICULTURAL: l ; ; Specify
3. INDUSTRIAL: F-1 ; Specify
4. MISCELLANEOUS: [xi ; Specify Rural -Urban
G. ESTIMATED QUANTITY OF WASTE:
821 Septic tanks in areaAverage septic size = 960 gallons
90 gal /day capita x 4 cap x 821 = 295,560 gal /day
house
B-61= 0.3 mgd
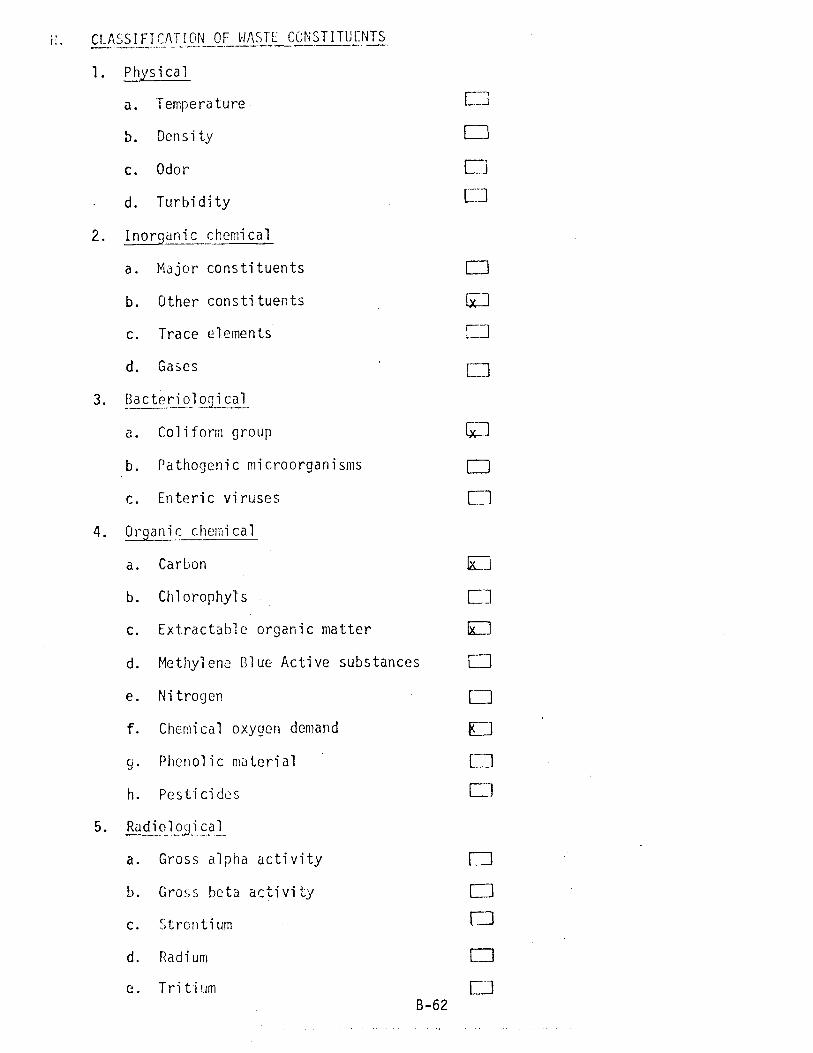
H. CLASSIFICATION OF '.JASTE CONSTITUENTS
1. Physical
a. Temperature 1
b. Density L_i
c. Odor Cld. Turbidity
2. Inorganic chemical
a. Major constituents
b. Other constituents
c. Trace elements C]
d. Gases
3. Bacteriological
a. Coliform group Ei1
b. Pathogenic microorganisms
c. Enteric viruses L]
A. Organic chemical
a. Carbon
b. Chlorophyls f -]
c. Extractable organic matter E:i
d. Methylene Blue Active substances
e. Nitrogen
f. Chemical oxygen demand
<. Phenolic material [ =]
h. Pesticides L_J
5. Radiológical
a. Gross alpha activity L_J
b. Gross beta activity [i
c. Strontium I--]
d. Radium ne. Tritium r]
B -62
1
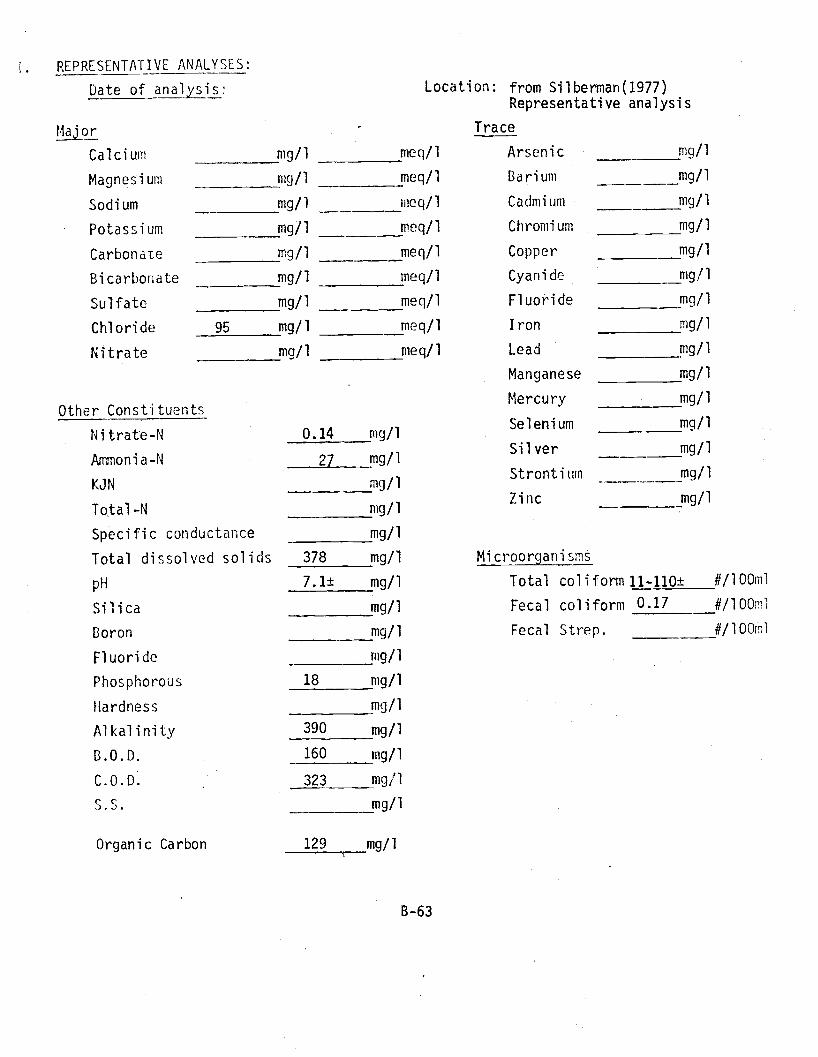
[. REPRESENTATIVE ANALYSES:
Date of analysis:
Major
Calcium mg /1
Magnesium mg /1
Sodium - mg /1
Potassium mg /1
Carbonate mg /1
Bicarbonate mg /1
Sulfate mg /1
Chloride 95 mg /1
Nitrate mg /1
Other Constituents
Nitrate -N 0 14 mg /1
Ammonia -N 27 mg /1
KJN mg/1
Total -N mg /1
Specific conductance mg /1
Total dissolved solids 378 mg /1
pH 7.1± mg /1
Silica mg /1
Boron mg/1
Fluoride mg /1
Phosphorous 18 mg /1
Hardness mg /1
Alkalinity 390 mg /1
B.O.D. 160 mg /1
C.O.D. 323 mg /1
mg/1
Organic Carbon 129 mg/ 1
Location: from Silberman(1977)Representative analysis
Trace
meq /1 Arsenic mg /1
meq /1 Barium mg /1
meq /1 Cadmium mg /1
meq /1 Chromium mg /1
meq /i Copper mg /1
meq /1 Cyanide mg /1
meq /1 Fluoride mg /1
meq /1 Iron mg /1
meq /1 Lead mg /1
Manganese mg /1
Mercury mg /1
Selenium mg /1
B-63
Silver mg /1
Strontium mg /1
Zinc mg /1
Microorganisms
Total coliform 11 -110± # /100m1
Fecal coliform 0.17 #/100m1
Fecal Strep. # /100m1
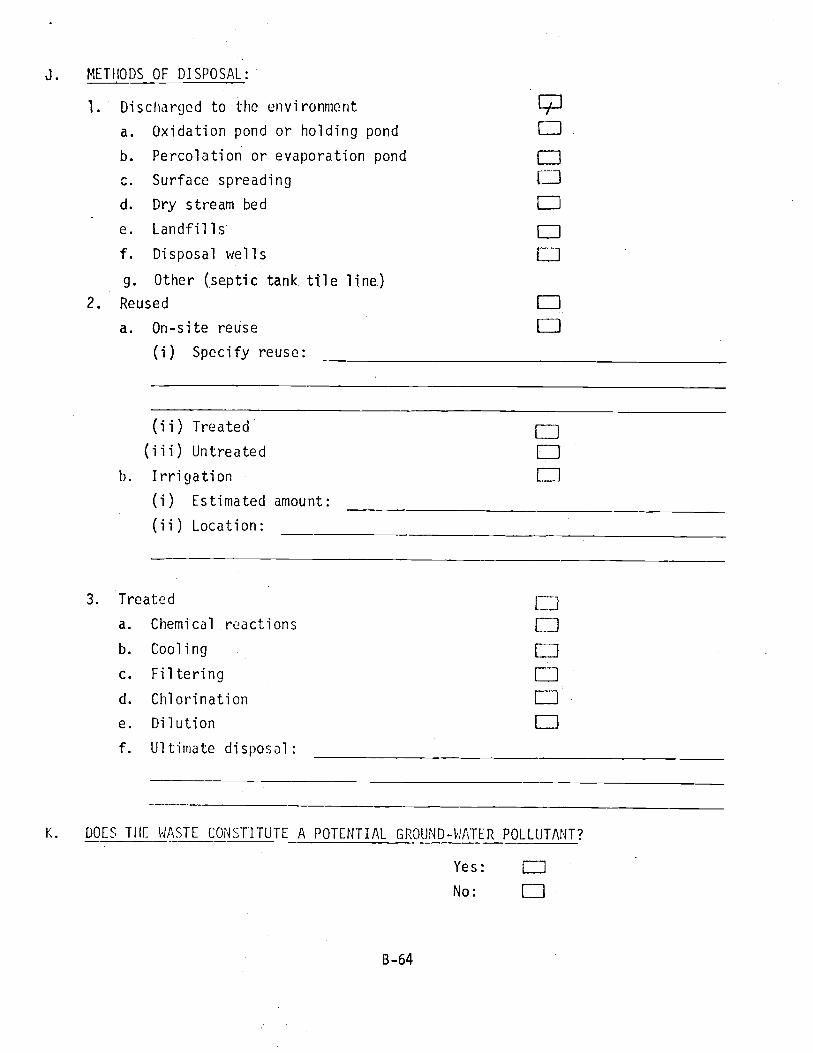
J. METHODS OF DISPOSAL:
1. Discharged to the environment
a. Oxidation pond or holding pond
1 1
LJ
b.
c.
Percolation or evaporation pond
Surface spreading
( 1
d.
e.
Dry stream bed
Landfills
ll
f.
g.
Disposal wells
Other (septic tank tile line.)
l' {
2. Reused
a. On -site reuse
(i) Specify reuse:
F
(ii) Treated
(iii) Untreated
b. Irrigation
(i) Estimated amount:
(ii) Location:
1
3. Treated
a. Chemical reactions
b. Cooling
c. Filtering
d. Chlorination
e. Dilution
f. Ultimate disposal:
K. DOES THE WASTE CONSTITUTE A POTENTIAL GROUND -WATER POLLUTANT?
Yes: nNo: [l
B-64

STATEWIDE GROUND -WATER MONITORING PLAN
POLLUTION POTENTIAL OF WASTE SOURCES
A,. WASTE SOURCE: Urban Runoff
3. INDIVIDUAL OR AGENCY PRODUCING OR MANAGING WASTE:
C. LOCATION OF SOURCE:
D. LOCATION SKETCH:
E. TYPE OF WASTE: SOLID ßxl LIQUID I1. Dissolved or microbial
2. Suspended sediment
F. CLASSIFICATION OF WASTE:
1. MUNICIPAL: [_1
2. AGRICULTURAL:
3. INDUSTRIAL: El]
4. MISCELLANEOUS: C _1
G. ESTIMATED QUANTITY OF WASTE:
See attached sheet
Specify
Specify
Specify
; Specify Rainfall runoff from naturaldesert, agricultural areas, pavedand unpaved roads, etc.
B-65

PEAK FLOW:
2 Years 125 cfs
10 " 689 cfs
100 " 2466 cfs
ANNUAL RUNOFF:
2 Years 60 acre feet /year
10 " 470 "
100 " 1150

H. CLASSIFICATION OF WASTE CONSTITUENTS
1. Physical
a. Temperature
b. Density
c. Odor
d. Turbidity
2. Inorganic chemical
a. Major constituents
b. Other constituents
c. Trace elements
d. Gases
3. Bacteriological
a. Coliform group
b. Pathogenic microorganisms
c. Enteric viruses
4. Organic chemical
a. Carbon
b. Chlorophyls
c. Extractable organic matter
d. Methylene Blue Active substances
e. Nitrogen
f. Chemical oxygen demand
g. Phenolic material
h. Pesticides
5. Radiological
a. Gross alpha activity
b. Gross beta activity
c. Strontium
d. Radium
e. Tritium
n
LJ
L-
1B-67
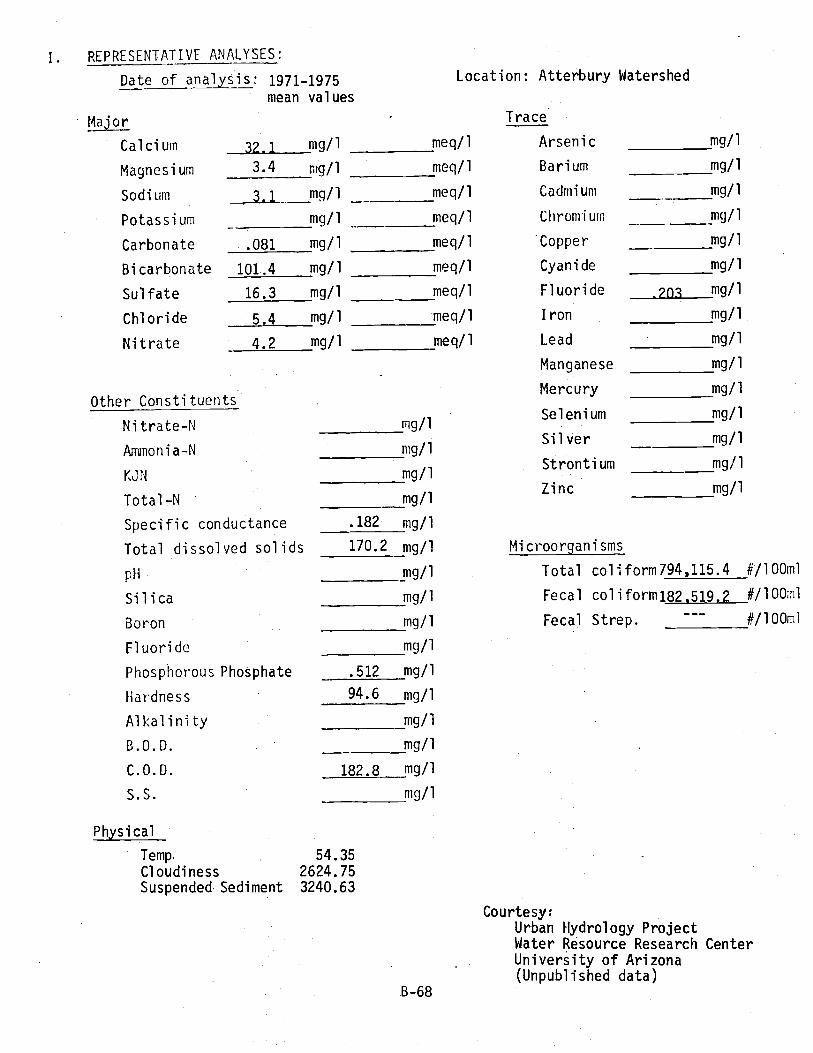
I. REPRESENTATIVE ANALYSES:
Date of analysis: 1971 -1975mean values
Major
Calcium 32.1
Magnesium 3.4
Sodium 3.1
Potassium
Carbonate .081
Bicarbonate 101..4
Location: Atterbury Watershed
Trace
mg /i meq /1 Arsenic mg /1
mg /1 meq /1 Barium mg /1
mg /i meq /1 Cadmium mg /1
mg /1 meq /1 Chromium mg /1
mg /1 meq /1 Copper mg /1
mg /1 meq /1 Cyanide mg /1
mg /1 meq /1 Fluoride _2n3 mg /1
mg /1 meq /1 Iron mg /i
mg /1 meq /1 Lead mg /1
Manganese mg /1
Other ConstituentsMercury mg /1
Nitrate -N m9 /1Selenium mg /1
Ammonia-N mg /1 Silver mg /1
UN mgStrontium mg /1
Total -N 'mg /i
Zinc mg /1
Sulfate 16.3
Chloride 5.4
Nitrate 4.2
Specific conductance .182 mg/1
Total dissolved solids 170.2 mg/1 Microorganisms
pH mg/1 Total coliform794,115.4 #/100m1
Silica mg/1 Fecal coliform182,519.2 #/100,n1
Boron mg/1 Fecal Strep. --- #/100mi
Fluoride mg/1
Phosphorous Phosphate .512 mg/1
Hardness 94.6 mg/1
Alkalinity mg/1
B.O.D. mg/i
C.O.D. 182.8 mg/1
S.S. mg/1
Physical
Temp. 54.35
Cloudiness 2624.75Suspended Sediment 3240.63
B -68
Courtesy:Urban Hydrology ProjectWater Resource Research CenterUniversity of Arizona(Unpublished data)

J. METHODS,.OF DISPOSAL:
1. Discharged to the environment (x)
a. Oxidation pond 'Or holding pond Cb. Percolation or evaporation pond F`1
c. Surface spreading [Jid. Dry stream bed
e. Landfills'
f. Disposal wells
-g. -Other (Urban Runoff)
Reused
a. On-site reuse
(i) Specify reuse:
i
(ii) Treated
(iii) Untreated
b. Irrigation
(i) Estimated amount:
(ii) Location:
3. =: Treated
a. Chemical reactions
b. Cooling
c. Filtering
d. Chlorination
e. Dilution
f. Ultimate disposal:
1 J
LJÌi
K. DOES THE WASTE CONSTITUTE A POTENTIAL GROUND -WATER POLLUTANT?
Yes: a]No: L
STATEWIDE GROUND -WATER MONITORING PLAN
POLLUTION POTENTIAL OF WASTE SOURCES
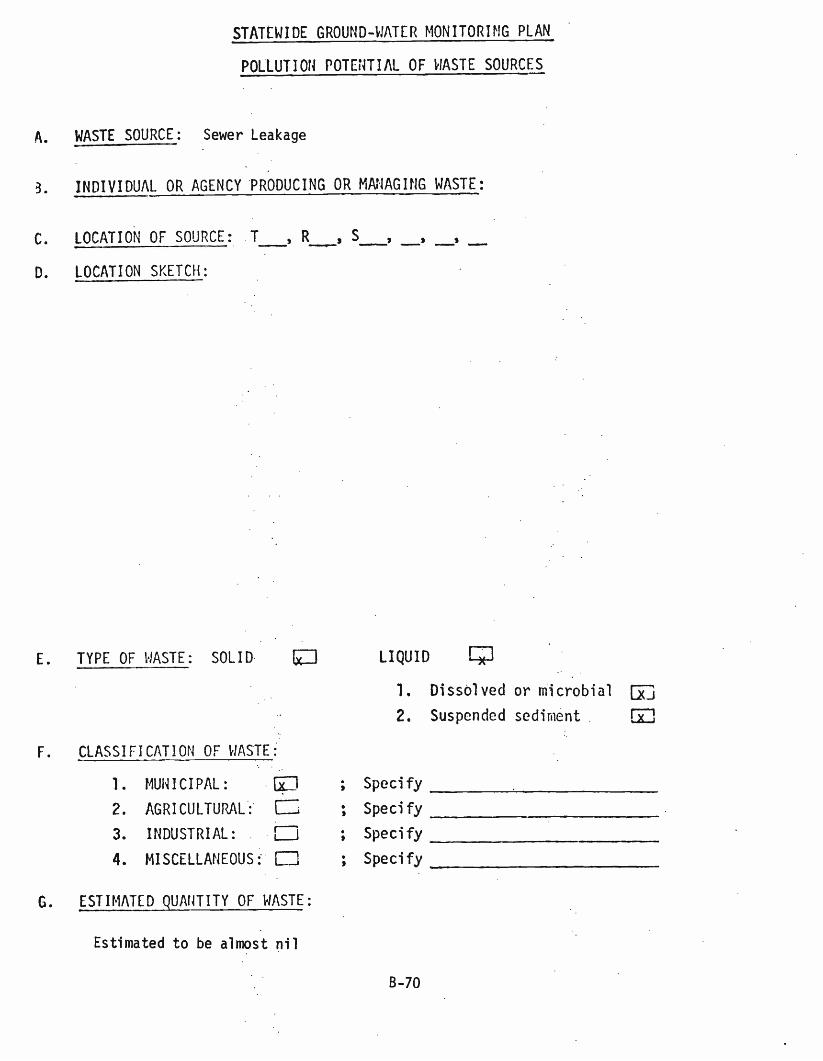
A. WASTE SOURCE: Sewer Leakage
3. INDIVIDUAL OR AGENCY PRODUCING OR MANAGING WASTE:
C. LOCATION OF SOURCE:
D. LOCATION SKETCH:
s , ,
E. TYPE OF WASTE: SOLID J LIQUID [ x 1
1. Dissolved or microbial
2. Suspended sediment
Lx3
F. CLASSIFICATION OF WASTE:
1. MUNICIPAL: 1 1 ; Specify
2. AGRICULTURAL: I i Specify
3. INDUSTRIAL: ; Specify
4. MISCELLANEOUS: Li ; Specify
G. ESTIMATED QUANTITY OF WASTE:
Estimated to be almost nil
B-70

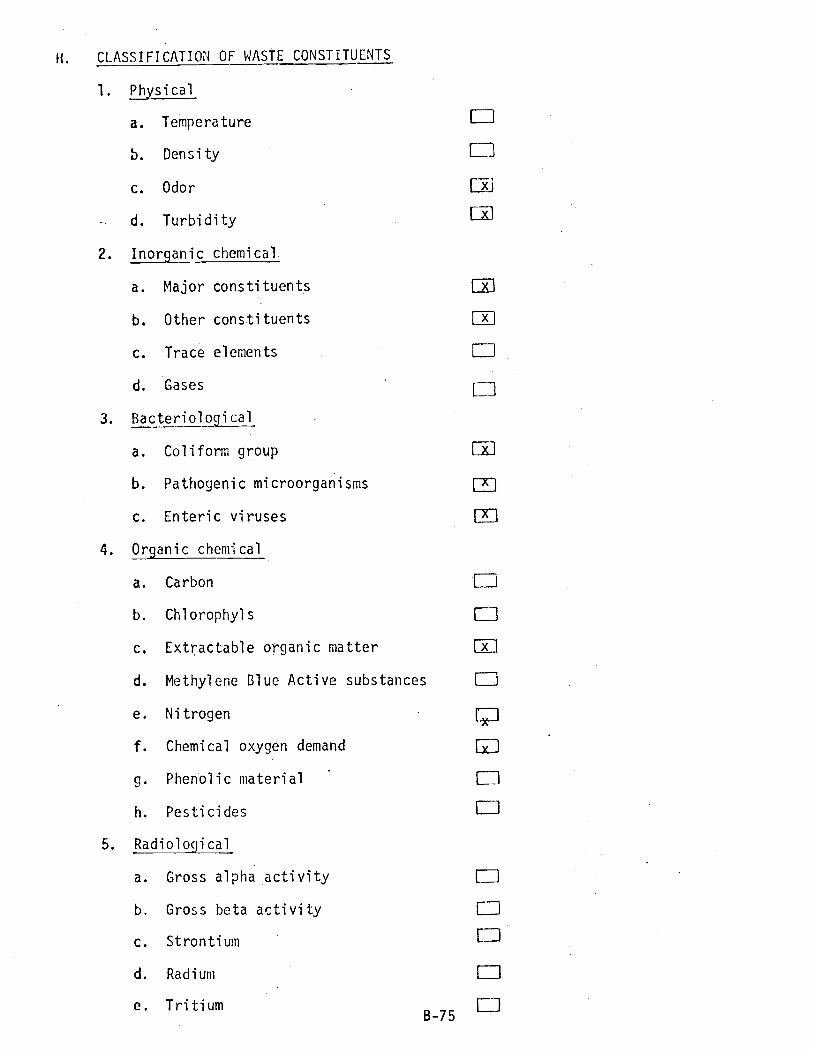
H. CLASSIFICATION OF WASTE CONSTITUENTS
1. Physical
a. Temperature
b. Density
c. Odor
d. Turbidity
2. Inorganic chemical
a. Major constituents
b. Other constituents
c. Trace elements
d. Gases
3. Bacteriological
a. Coliform group
b. Pathogenic microorganisms
c. Enteric viruses
4. Organic chemical
a. Carbon
b. Chlorophyls
c. Extractable organic matter
d. Methylene Blue Active substances
e. Nitrogen
f. Chemical oxygen demand
g. Phenolic material
h. Pesticides
5. Radiological
a. Gross alpha activity
b. Gross beta activity
c. Strontium
d. Radium
e. TritiumB -71

I. REPRESENTATIVE ANALYSES: not available
Date of analysis: Location:
Major Trace
Calcium mg/1 meq /1 Arsenic mg /1
Magnesium mg /1 meq /1 Barium mg /1
Sodium mg/1 meq /1 Cadmium mg /1
Potassium mg /1 meq /1 Chromium mg /1
Carbonate mg /1 meq /1 Copper mg /1
Bicarbonate mg /1 meq /1 Cyanide mg /1
Sulfate mg /1 meq /1 Fluoride mg /1
Chloride mg/1 meq /1 Iron mg /1
Nitrate mg /1 meq /1 Lead mg /1
Manganese mg /1
Other ConstituentsMercury mg /1
Nitrate -N mg /1Selenium mg /1
Ammonia -N mg /1Silver mg /l
KJN mg /1Strontium mg /1
Total -N/1 Zinc mg /1
Specific conductance mg /1
Total dissolved solids mg /1 Microorganisms
pH mg/1 Total coliform #/100m1
Silica mg /1 Fecal coliform #/100m
Boron mg /1 Fecal Strep. #/100m'
Fluoride mg /1
Phosphorous mg /1
Hardness mg /1
Alkalinity mg /1
B.O.D. mg /1
C.O.D. mg /1
S.S. mg /1

J. METHODS OF DISPOSAL:
1. Discharged to the environment
a. Oxidation pond or holding pond
b. Percolation or evaporation pond
c. Surface spreading
d. Dry stream bed
e. Landfills
f. Disposal wells
g. Other (sewer line leakage)
2. Reused
a. On -site reuse
(i) Specify reuse:
(ii) Treated
(iii) Untreated
b. Irrigation
(i) Estimated amount:
(ii) Location:
nLinL_l
1 1
i 1
[
l 1
1 1
fn
3. Treated
a. Chemical reactions
b. Cooling
c. Filtering
d. Chlorination
e. Dilution
f. Ultimate disposal:
K. DOES THE WASTE CONSTITUTE A POTENTIAL GROUND -WATER POLLUTANT?
Yes:
No:
B-73
L

STATEWIDE GROUND -WATER MONITORING PLAN
POLLUTION POTENTIAL OF WASTE SOURCES
A. WASTE SOURCE: Santa Cruz River (Effluent discharge)
B. INDIVIDUAL OR AGENCY PRODUCING OR MANAGING WASTE:
C. LOCATION OF SOURCE: See Source Map
D. LOCATION SKETCH: See Source Map
E. TYPE OF WASTE: SOLID
F. CLASSIFICATION OF WASTE:
1. MUNICIPAL: Ix-1
2. AGRICULTURAL: C]
3. INDUSTRIAL:
4. MISCELLANEOUS: LJ
G. ESTIMATED QUANTITY OF WASTE:
36 mgd
LIQUID I /1
1. Dissolved or microbial
2. Suspended sediment
CZJ
; Specify Sewage Pffluert
; Specify
; Specify
; Specify
B-74
H. CLASSIFICATION OF WASTE CONSTITUENTS
1. Physical
a. Temperature
b. Density
c. Odor
d. Turbidity
2. Inorganic chemical.
a. Major constituents
b. Other constituents
c. Trace elements
d. Gases
3. Bacteriological
a. Coliform group
b. Pathogenic microorganisms
c. Enteric viruses
4. Organic chemical
a. Carbon
b. Chlorophyls
c. Extractable organic matter
d. Methylene Blue Active substances
e. Nitrogen
f. Chemical oxygen demand
g. Phenolic material
h. Pesticides
5. Radiological
a. Gross alpha activity
b. Gross beta activity
c. Strontium
d. Radium
e. Tritium
Là
x
Li
Lx7
x
L_1
L 1
B-75
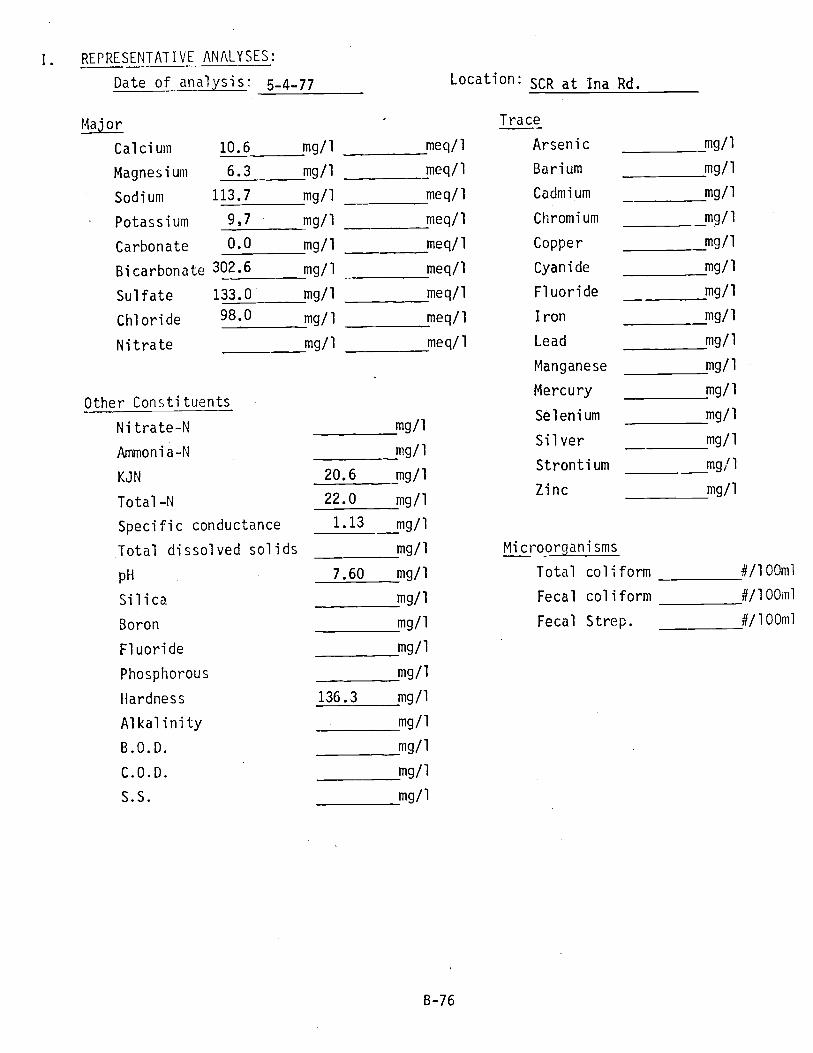
I. REPRESENTATIVE ANALYSES:
Date of analysis: 5_4_77 Location: SCR at Ina Rd.
Major
Calcium 10.6
Magnesium 6.3
Sodium 113.7
- Potassium 9,7
Carbonate 0.0
Trace
mg /1 meq /1 Arsenic mg /1
mg /1 meq /1 Barium mg /1
mg /1 meq /1 Cadmium mg /1
mg/1 meq /1 Chromium mg /1
mg /1 meq /i Copper mg /1
Bicarbonate 302.6 mg /1 meq /1 Cyanide mg /1
Sulfate 133.0 mg /1 meq /1 Fluoride mg /1
Chloride 98.0 mg /1 meq /1 Iron mg /1
Nitrate mg /1 meq /1 Lead mg /1
Manganese mg /1
Other ConstituentsMercury mg /1
Nitrate -N mg /1Selenium mg /1
Ammonia -N mg /1Silver mg /1
KJN 20.6 mg /1Strontium mg /1
Total -N 22.0 mg /1Zinc mg /1
Specific conductance 1.13 mg /1
Total dissolved solids mg /1 Microorganisms
pH 7.60 mg /1 Total coliform #/100m1
Silica mg/1 Fecal coliform #/100m1
Boron mg /1 Fecal Strep. #/100m1
Fluoride mg /1
Phosphorous mg /1
Hardness 136.3 mg /1
Alkalinity mg /1
B.O.D. mg /1
C.O.D. mg /1
S.S. mg /1

SANTA CRUZ
DATE
RIPER AT
EC
THE NARROWS
PH
NA
KCA
HG
T12S
CL
R12E SEC. 8
HCO3
DHC
CO3
SO4
NH3
NO2/3
KJN
TOTN
HARO
1/14/77
1.09
7.47
111.3
7.9
61.7
7.4
96.0
339.2
0.0
145.0
22.2
6.2
28.6
30.0
184.6
1/26/77
1.12
7.95
118.6
11.0
56.9
7.5
104.0
335.5
0.0
155.0
21.7
4.9
28.2
29.2
173.0
2/ 4/77
1.10
7.60
112.5
8.5
59.3
6.8
101.0
341.6
0.0
135.0
21.0
5.3
26.5
27.7
176.1
2/10/77
1.08
7.60
115.0
9.2
52.0
7.0
96.0
336.7
0.0
130.0
21.1
5.8
28.8
27.0
158.7
2/18/77
1.09
7.62
113.7
9.2
60.5
7.6
90.0
346.5
0.0
140.0
22.9
2.7
25.3
25.9
182.4
3/ 4/77
1.05
7.78
118.6
12.8
55.7
7.4
97.0
336.7
0.0
130.0
21.6
4.4
26.4
27.4
169.6
3/18/77
1.09
7.66
118.6
13.8
55.7
7.3
91.0
353.8
0.0
130.0
20.6
3.5
25.7
26.5
169.2
4/ 1/77
1.12
7.81
115.0
12.6
49.6
7.1
97.0
347.7
0.0
115.0
21.1
3.1
25.6
26.3
153.1
4/15/77
.70
7.72
111.3
9.3
55.7
7.0
105.0
327.0
0.0
117.0
21.0
4.4
24.0
25.0
167.9
4/29/77
1.16
7.75
112.2
14.5
54.5
6.3
91.0
327.0
0.0
120.0
19.5
4.9
23.0
24.2
162.1
5/16/77
1.03
7.90
107.7
12.1
50.8
6.9
77.0
301.3
0.0
116.0
18.5
3.1
23.0
23.6
155.3
6/ 1/77
1.07
7.73
118.0
15.5
54.5
6.9
89.0
317.2
0.0
110.0
16.2
3.1
20.0
20.7
164.5
6/ 6/77
1.00
7.61
123.8
15.1
52.9
7.5
73.0
291.6
0.0
115.0
20.2
2.7
23.0
23.5
163.0
6/13/77
1.04
7.77
133.8
16.2
51.9
8.5
80.0
297.7
0.0
120.0
18.2
3.1
21.3
22.0
164.6
7/11/77
1.00
7.90
111.0
10.8
33.0
9.3
68.0
211.0
0.0
130.0
13.5
6.2
16.0
17.4
120.7
7/19/77
.44
7.90
29.0
8.6
78.0
9.5
15.0
141.5
0.0
37.0
2.8
13.7
9.6
12.7
233.9
8/ 1/77
.59
7.70
50.5
7.2
52.5
7.8
31.0
172.0
0.0
45.0
2.6
10.6
16.7
16.6
163.2
8/12/77
1.24
7.70
120.0
20.4
56.0
7.4
94.8
229.3
0.0
135.0
10.0
13.7
11.6
14.7
170.3
8/19/77
1.15
8.10
117.0
18.3
52.0
7.6
87.0
246.4
0.0
150.0
7.8
13.7
11.8
14.9
161.2
6/27/77
1.00
8.20
44.0
11.6
33.8
4.2
80.0
280.6.
0.0
115.0
13.7
4.4
16.3
17.3
122.3

SANTA CRUZ
DATE
RIVER EC
AT INA ROAD
PH
NA
KCA
MG
T12S
CL
R12E SEC.35 DDD
HCO3
CO3
SO4
NH3
NO2/3
KJN
TOTN
HARE
5/ 4/77
1.13
7.60
113.7
9.7
10.6
6.3
98.0
302.6
0.0
133.0
16.9
6.2
20.6
22.0
52.4
7/11/77
1.12
7.70
127.5
14.8
31.3
8.8
84.0
254.0
0.0
140.0
19.8
1.8
24.4
24.8
114.4
7/19/77
.90
7.80
77.0
18.5
117.0
8.0
64.0
201.3
0.0
100.0
3.9
17.3
19.0
23.0
325.2
8/ 1/77
.56
7.60
45.5
7.8
78.0
9.7
33.0
164.7
0.0
47.0
2.4
13.7
19.0
21.1
234.8
8/19/77
1.20
7.30
130.5
13.5
80.0
7.1
84.0
257.4
0.0
110.0
3.6
12.4
5.9
8.7
229.0

SANTA CRUZ RIVER AT RUTHRAUFF ROAD
T12S R13E SEC.17 CDD
DATE
EC
PH
NA
KCA
NG
CL
HCO3
CO3
SO4
NH3
NO2/3
KJN
TCIN
HARD
1/ 7/77
1.13
7.50
108.9
7.0
61.7
8.1
97.0
309.9
0.0
180.0
22.1
3.1
26.5
27.2
187.5
1/14/77
1.10
7.40
108.9
7.4
60.5
7.9
94.0
327.0
0.0
175.0
23.5
6.2
27.1
28.5
183.6
1/26/77
1.0d
7.73
118.6
11.7
62.9
8.4
101.0
319.6
0.0
175.0
22.7
11.1
25.6
28.1
191.7
2/ 4/77
1.10
7.40
112.5
8.4
60.5
7.5
99.0
317.2
0.0
180.0
21.6
4.9
28.8
27.0
182.0
2/10/77
1.13
8.37
107.7
11.6
69.0
8.4
94.0
324.5
0.0
140.0
23.3
12.8
28.4
31.8
206.9
2/18/77
1.09
7.70
107.7
8.4
59.3
7.5
84.0
330.6
0.0
175.0
25.0
4.0
28.0
28.9
179.0
3/ 4/77
1.09
7.62
118.6
11.1
60.5
9.2
100.0
317.2
0.0
170.0
21.4
7.1
24.9
25.8
189,0
3/18/77
1.16
7.50
124.6
11.6
59.3
8.2
104.0
319.6
0.0
137.0
20.3
12.4
26.0
27.5
181.9
4/22/77
1.10
7.30
113.7
8.5
60.5
7.3
86.0
286.7
0.0
136.0
17.9
15.1
24.1
23.5
181.2
W 1
4/29/77
1.17
7.50
122.2
10.9
59.3
6.9
87.0
285.5
0.0
128.0
16.8
12.4
20.7
22.3
176.5
AD
5/16/77
1.00
7.61
108.9
10.9
54.5
7.3
76.0
266.0
0.0
0.0
15.5
11.1
19.7
22.2
166.2
6/ 1/77
1.11
7.60
122.2
13.1
55.7
7.7
89.0
275.7
0.0
145.0
14.1
9.7
18.2
20.5
170.8
6/13/77
1.03
7.35
131.7
14.0
54.6
9.6
81.0
264.7
0.0
145.0
14.4
17.3
18.6
22.5
175.9
8/19/77
1.25
7.80
132.0
7.9
73.0
8.4
88.0
276.9
0.0
175.0
14.1
17.3
19.9
23.9
216.9
6/27/77
1.15
7.60
138.0
9.8
40.8
8.7
83.0
287.9
0.0
170.0
16.7
9.3
18.8
20.9
137.7
7/11/77
.52
7.60
48.0
8.7
190.0
8.5
32.0
123.0
0.0
66.0
2.8
7.5
5.9
7.5
509.5
7/19/77
1.00
7.90
53.0
10.5
75.0
8.5
71.0
222.0
0.0
140.0
6.2
11.1
22.1
24.6
222.3
8/ 1/77
.59
7.70
50.5
7.2
52.5
7.8
31.0
172.0
0.0
60.0
2.6
10.6
16.7
18.0
163.2

J. METHODS OF DISPOSAL:
1. Discharged to the environment Üa. Oxidation pond or holding pond LJb. Percolation or evaporation pond 1Ic. Surface spreading E-11
d. Dry stream bed fX 1
e. Landfills C:i
f. Disposal wells
2. Reused
a. On -site reuse
(i) Specify reuse:
(ii) Treated
(iii) Untreated
b. Irrigation
(i) Estimated amount:
(ii) Location:
3. Treated
a. Chemical reactions
b. Cooling
c. Filtering
d. Chlorination
e. Dilution
f. Ultimate disposal:
LI
K. DOES THE WASTE CONSTITUTE A POTENTIAL GROUND -WATER POLLUTANT?
Yes:
No:
B -80

STATEWIDE GROUND -WATER MONITORING PLAN
POLLUTION POTENTIAL OF WASTE SOURCES
A. WASTE SOURCE: Santa Cruz River (Natural discharge)
. INDIVIDUAL OR AGENCY PRODUCING OR MANAGING WASTE:
C. LOCATION OF SOURCE:
D. LOCATION SKETCH:
RITE R3E
E. TYPE OF WASTE: SOLID
F. CLASSIFICATION OF WASTE:
LIQUID F-0
1. Dissolved or microbial
2. Suspended sediment
1. MUNICIPAL: [:1 ; Specify
2. AGRICULTURAL: ET ; Specify
3. INDUSTRIAL: ED ; Specify
4. ; Specify River rlicchargeMISCELLANEOUS: Ix 1
G. ESTIMATED QUANTITY OF WASTE:
Total volume in 1975 at Cortaro 20,812 cubic feetMean discharge rate in 1975 57 cfs
B -81
T ( 25
T135
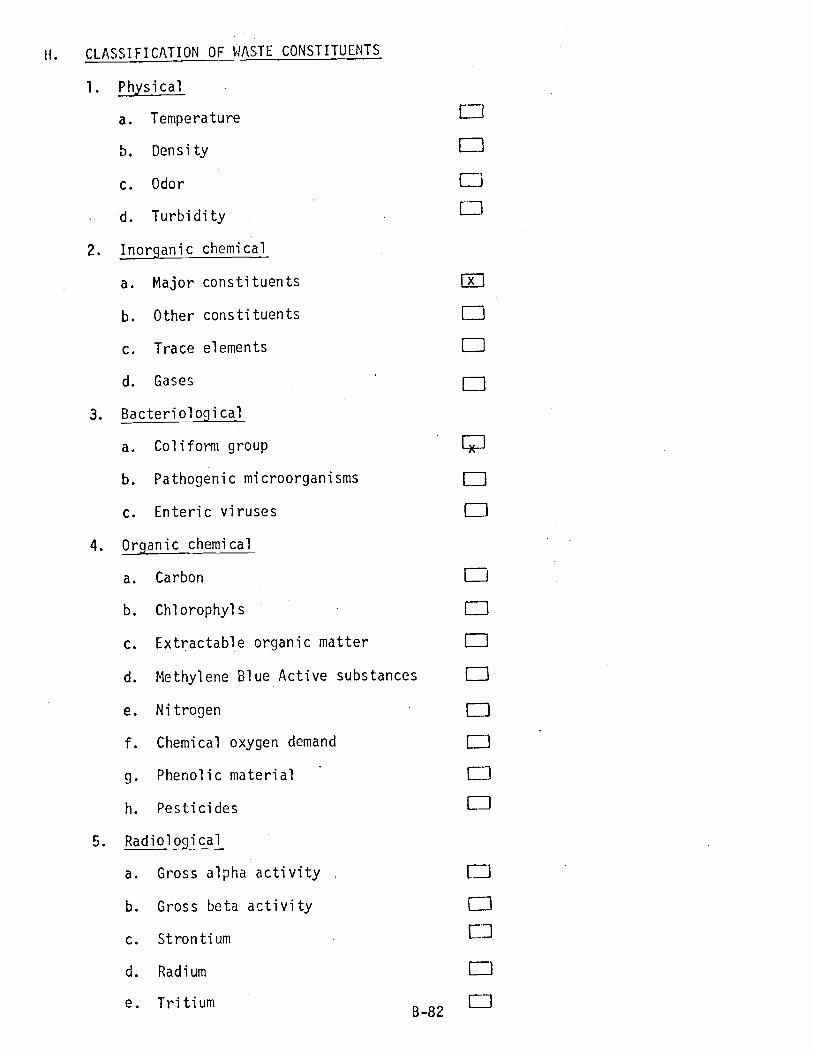
H. CLASSIFICATION OF WASTE CONSTITUENTS
1. Physical
a. Temperature
b. Density
c. Odor
d. Turbidity
2. Inorganic chemical
a. Major constituents
b. Other constituents
c. Trace elements
d. Gases
3. Bacteriological
a. Coliform group
b. Pathogenic microorganisms
c. Enteric viruses
4. Organic chemical
a. Carbon
b. Chlorophyls
c. Extractable organic matter
d. Methylene Blue Active substances
e. Nitrogen
f. Chemical oxygen demand
g. Phenolic material
h. Pesticides
5. Radiological
a. Gross alpha activity ,
b. Gross beta activity
c. Strontium
d. Radium
e. Tritium
nLJ
n
I 1
(^7
n
n
ÌiB-82

I. REPRESENTATIVE ANALYSES:
Date of analysis: 1968 Location: WRRC Field Lab
Major Trace
Calcium 22 mg /1 meq /1 Arsenic mg /1
Magnesium 5 mg /1 meq /1 Barium mg /i
Sodium 17 mg /1 meq /1 Cadmium mg /1
Potassium mg /i meq /1 Chromium mg /1
Carbonate O mg /1 meq /1 Copper mg /1
Bicarbonate 45 mg /1 meq /1 Cyanide mg /1
Sulfate 36 mg /1 meq /i Fluoride mg /i
Chloride 12 mg /i meq /1 Iron mg /1
Nitrate mg /1 meq /1 Lead mg /i
Manganese mg /1
Other ConstituentsMercury mg /1
Nitrate -N 1.3 mg/1Selenium mg /1
Ammonia -N mg /1Silver mg /1
KJN mg /1Strontium mg /1
Total -N mg /iZinc mg /1
Specific conductance .22 mg /1
Total dissolved solids 149 mg /1 Microorganisms
pH 7,5 mg /1 Total coliform #/100m1
Silica mg/1 Fecal coliform #/100m1
Boron mg /1 Fecal Strep. #/100m-
Fluoride mg/1
Phosphorous mg /1
Hardness mg /1
Alkalinity mg /1
B.O.D. mg /1
C.O.D. mg /1
S.S. mg /1
B-83

J. METHODS OF DISPOSAL:
1. Discharged to the environment 0a. Oxidation pond or holding pond EJ
b. Percolation or evaporation pond Ec. Surface spreading ÏJd. Dry stream bed (-x-1
e. Landfills
f. Disposal wells
2. Reused
a. On -site reuse
(i) Specify reuse:
0
(ii) Treated
(iii) Untreated
b. Irrigation
(i) Estimated amount:
(ii) Location:
n
3. Treated
a. Chemical reactions
b. Cooling
c. Filtering
d. Chlorination
e. Dilution
f. Ultimate disposal:
LJ
1
K. DOES THE WASTE CONSTITUTE A POTENTIAL GROUND -WATER POLLUTANT?
Yes: [QNo:
B -84
x

A. WASTE SOURCE:
STATEWIDE GROUND -WATER MONITORING PLAN
POLLUTION POTENTIAL OF WASTE SOURCES
Sunset Dairy Feedlot
B. INDIVIDUAL OR AGENCY PRODUCING OR MANAGING WASTE:
C. LOCATION OF SOURCE: T 13S R13E, S7 & 8
D. LOCATION SKETCH:
Sunset Dairy
E. TYPE OF WASTE: SOLID
F. CLASSIFICATION OF WASTE:
Fri LIQUID El
1. Dissolved or microbial
2. Suspended sediment
1. MUNICIPAL: Cl ; Specify
2. AGRICULTURAL: F77 ; Specify
3. INDUSTRIAL: El ; Specify
4. MISCELLANEOUS: U ; Specify
G. ESTIMATED QUANTITY OF WASTE:
Information unavailable
B-85

H. CLASSIFICATION OF WASTE CONSTITUENTS
1. Physical
a. Temperature
b. Density
c. Odor
d. Turbidity
2. Inorganic chemical
a. Major constituents
ljï
b. Other constituents nc. Trace elements
d. Gases
3. Bacteriological
a. Coliform group
b. Pathogenic microorganisms
c. Enteric viruses
4. Organic chemical
a. Carbon
b. Chlorophyls
c. Extractable organic matter
d. Methylene Blue Active substances
e. Nitrogen
f. Chemical oxygen demand
g. Phenolic material
h. Pesticides
5. Radiological
a. Gross alpha activity
b. Gross beta activity
c. Strontium
d. Radium
e. Tritium
B-86
nmI/ i
nn
Ui
rn
1
ri
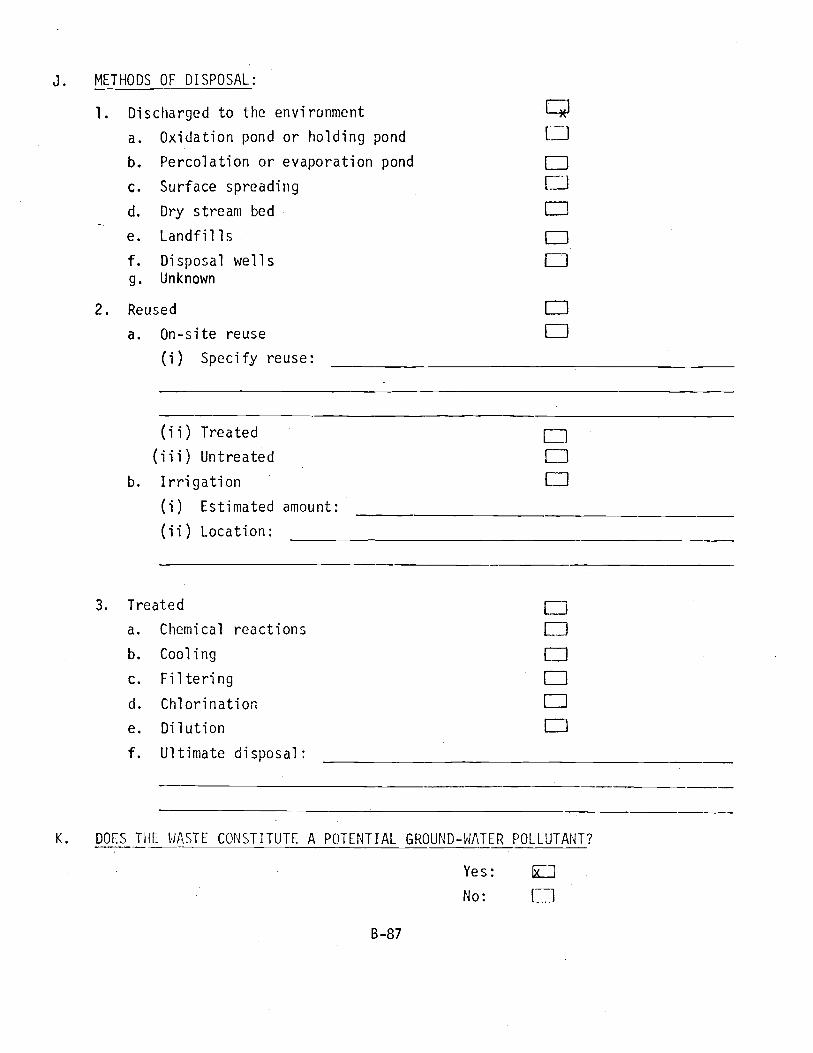
J. METHODS OF DISPOSAL:
1. Discharged to the environment
a. Oxidation pond or holding pond
b. Percolation or evaporation pond
c. Surface spreading
d. Dry stream bed
e. Landfills
f. Disposal wells
g. Unknown
2. Reused
a. On -site reuse
(i) Specify reuse:
(ii) Treated
(iii) Untreated
b. Irrigation
(i) Estimated amount:
(ii) Location:
LJ
3. Treated
a. Chemical reactions
b. Cooling
c. Filtering
d. Chlorination
e. Dilution
f. Ultimate disposal:
K. DOES THE WASTE CONSTITUTE A POTENTIAL GROUND -WATER POLLUTANT?
Yes:
No: (nB-87
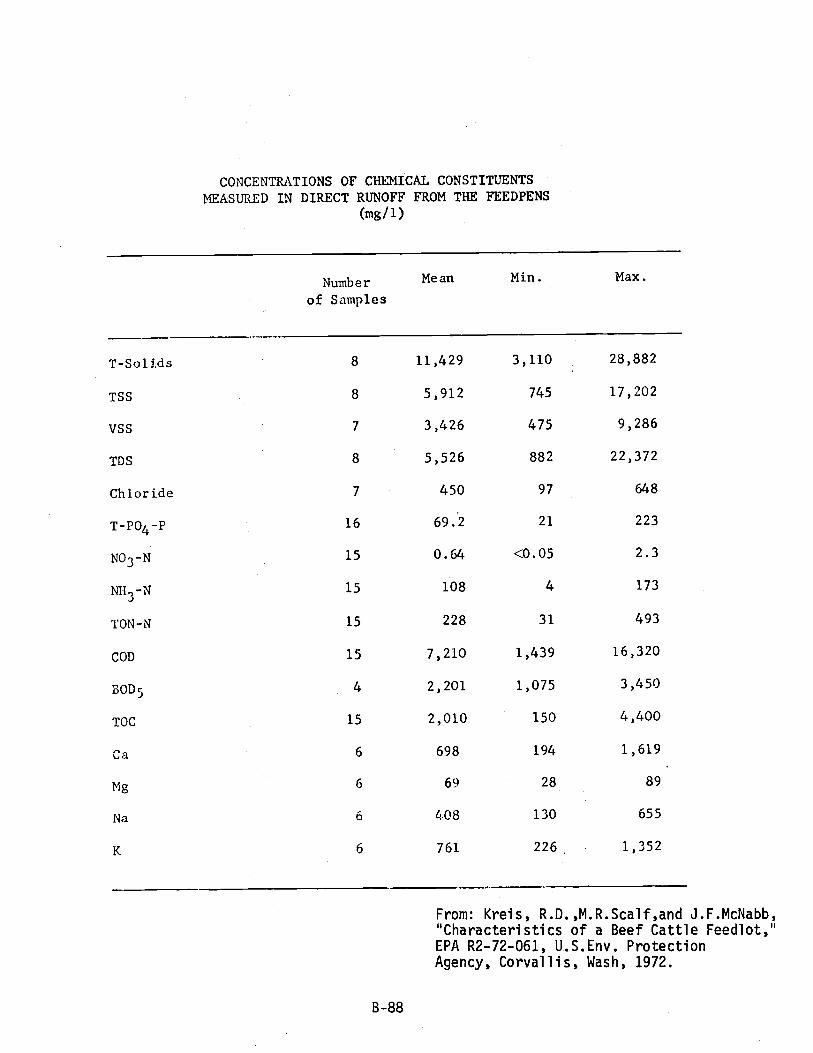
CONCENTRATIONS OF CHEMICAL CONSTITUENTSMEASURED IN DIRECT RUNOFF FROM THE FEEDPENS
(mg /1)
Number
of Samples
Mean Min. Max.
T-Solids 8 11,429 3,110 28,882
TSS 8 5,912 745 17,202
VSS 7 3,426 475 9,286
TDS 8 5,526 882 22,372
Chloride 7 450 97 648
T-PO4-P 16 69.2 21 223
NO3-N 15 0.64 <0.05 2.3
NIi3-N 15 108 4 173
TON-N 15 228 31 493
COD 15 7,210 1,439 16,320
BOD5 4 2,201 1,075 3,450
TOC 15 2,010 150 4,400
Ca 6 698 194 1,619
Mg 6 69 28 89
Na 6 408 130 655
K. 6 761 226 1,352
From: Kreis, R.D.,M.R.Scalf,and J.F.McNabb,"Characteristics of a Beef Cattle Feedlot,"EPA R2 -72 -061, U.S.Env. ProtectionAgency, Corvallis, Wash, 1972.
B-88
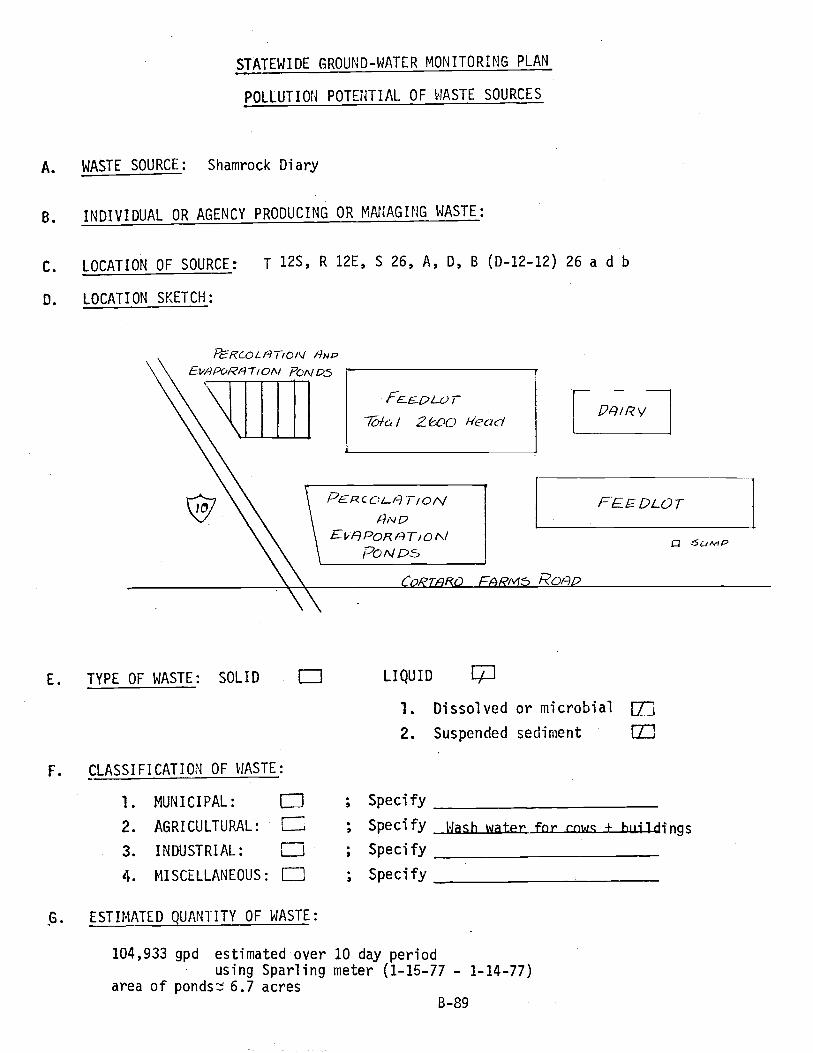
STATEWIDE GROUND -WATER MONITORING PLAN
POLLUTION POTENTIAL OF WASTE SOURCES
A. WASTE SOURCE: Shamrock Diary
B. INDIVIDUAL OR AGENCY PRODUCING OR MANAGING WASTE:
C. LOCATION OF SOURCE: T 12S, R 12E, S 26, A, D, B (D- 12 -12) 26 a d b
D. LOCATION SKETCH:
E. TYPE OF WASTE: SOLID
F. CLASSIFICATION OF WASTE:
LIQUID n1. Dissolved or microbial
2. Suspended sediment 71
1. MUNICIPAL: ; Specifyi
2. AGRICULTURAL: ; SpecifyE3. INDUSTRIAL: E7.1 ; Specify
4. MISCELLANEOUS: 1 1 ; Specify
G. ESTIMATED QUANTITY OF WASTE:
Wash water fnr rnwg + w 1dïngs
104,933 gpd estimated over 10 day periodusing Sparling meter (1 -15 -77 - 1- 14 -77)
area of ponds 6.7 acresB-89
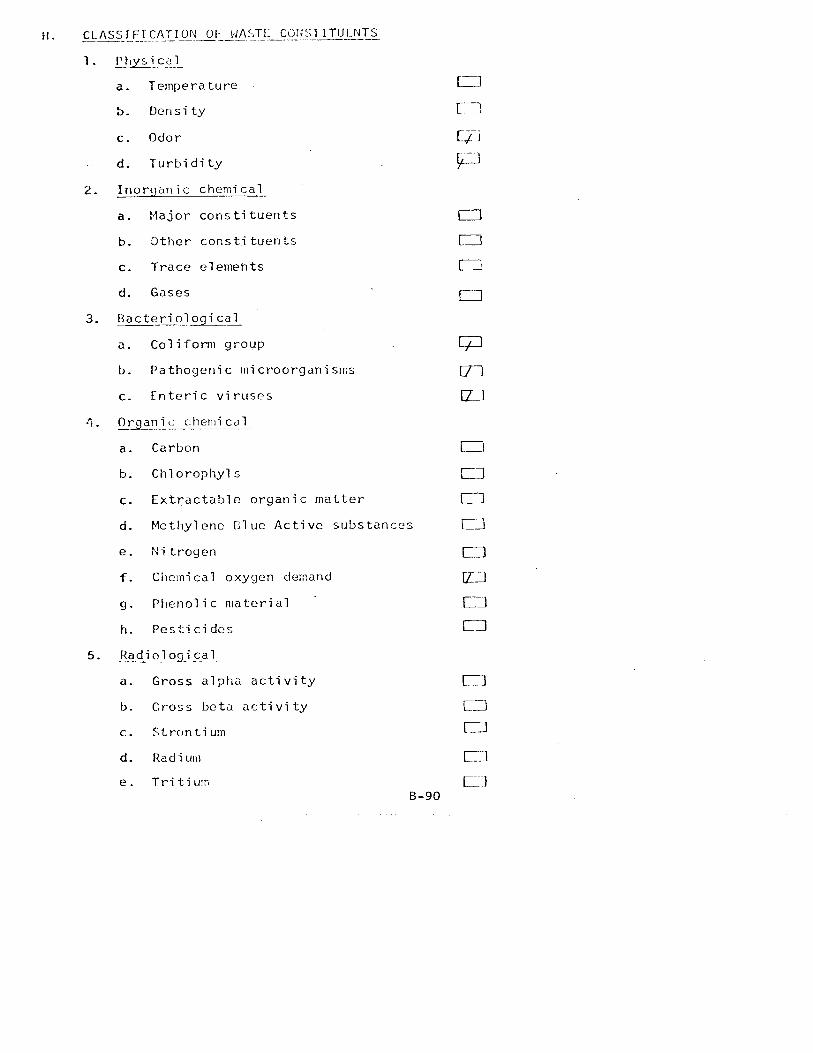
H. CLASSIFICATION OF WASTE CONSTITUENTS
1. Physical
a. Temperature -
b. Density
c. Odor
d. Turbidity
2. Inorganic chemical
a. Major constituents
b. Other constituents
c. Trace elements
d. Gases
3. Bacteriological
a. Coliform group
b. Pathogenic microorganisms
c. Enteric viruses
4. Organic chemical
a. Carbon
b. Chlorophyls
c. Extractable organic matter
d. Methylene Blue Active substances
e. Nitrogen
f. Chemical oxygen demand
g. Phenolic material
h. Pesticides
5. Radiological
a. Gross alpha activity
b. Gross beta activity [_jc. Strontium ----1
d. Radium I I
e. Tritium C }B -90
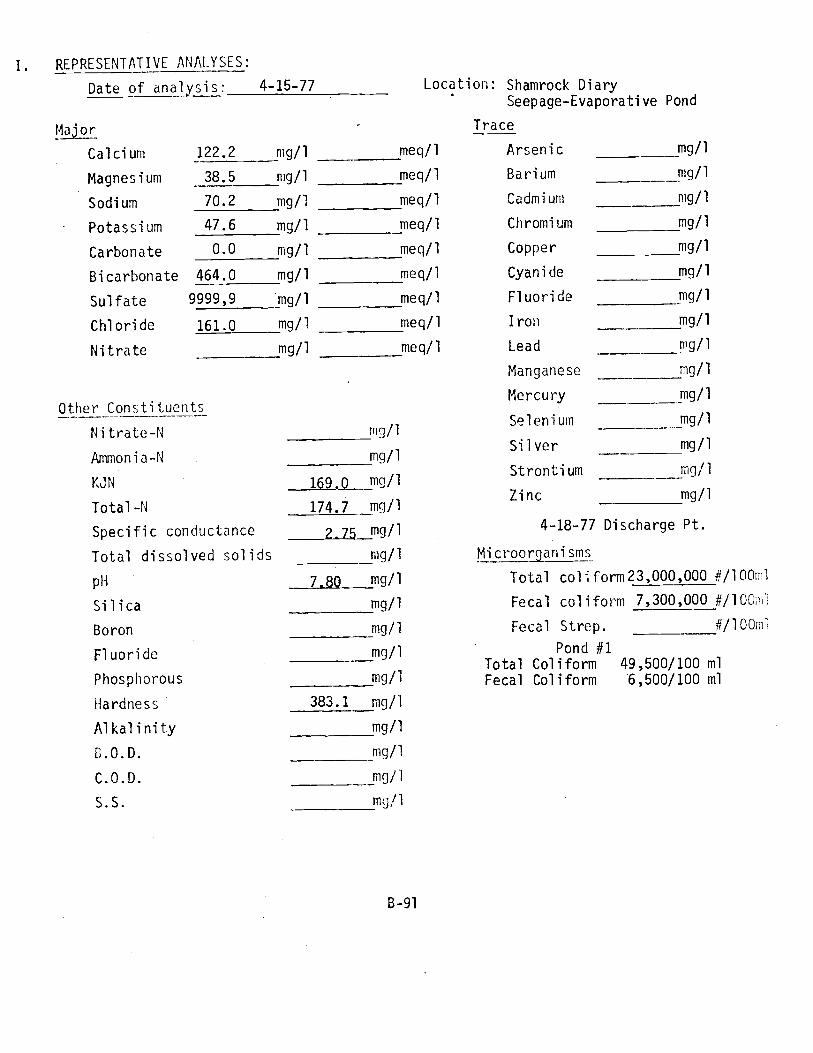
I. REPRESENTATIVE ANALYSES:
Date of analysis: 4 -15 -77
Major
Calcium 122.2
Magnesium 38.5
Sodium 70.2
Potassium 47.6
Carbonate 0.0
Bicarbonate 464.0
Sulfate 9999,9
Chloride 161.0
Nitrate
Other Constituents
Nitrate -N
Ammonia -N
KJN
Total -N
Specific conductance
Total dissolved solids
pH
Silica
Boron
Fluoride
Phosphorous
Hardness
Alkalinity
B.O.D.
C.Q.D.
S.S.
Location: Shamrock DiarySeepage- Evaporative Pond
Trace
mg /1 meq /1 Arsenic mg /1
mg /1 meq /1 Barium nag /1
mg /1 meq /l Cadmium mg /1
mg /1 meq /1 Chromium mg/1
mg /1 meq /1 Copper mg /1
mg/1 meq /1 Cyanide mg /1
mg /1 meq /1 Fluoride mg /1
mg /1 meq /1 Iron mg /1
mg /1 meq /1 Lead mg/1
Manganese mg /1
Mercury mg /1
Selenium mg /1
Silver mg /1
Strontium mg/1
Zinc mg /1
4 -18 -77 Discharge Pt.
Microorganisms
Total col form 23,000,000 #/100m1
Fecal coliform 7,300,000 #/100u1
Fecal Strep. #/100m1
Pond #1Total Coliform 49,500/100 mlFecal Coliform 6,500/100 mi
mg/1
mg/1
169.0 m9/1
174.7 mg/1
2.75 mg/1
mg/1
7.80 mg/1
mg/1
mg/1
mg/1
mg/1
383.1 mg/1
mg/1
mg/1
m9/1
mg/1
B-91
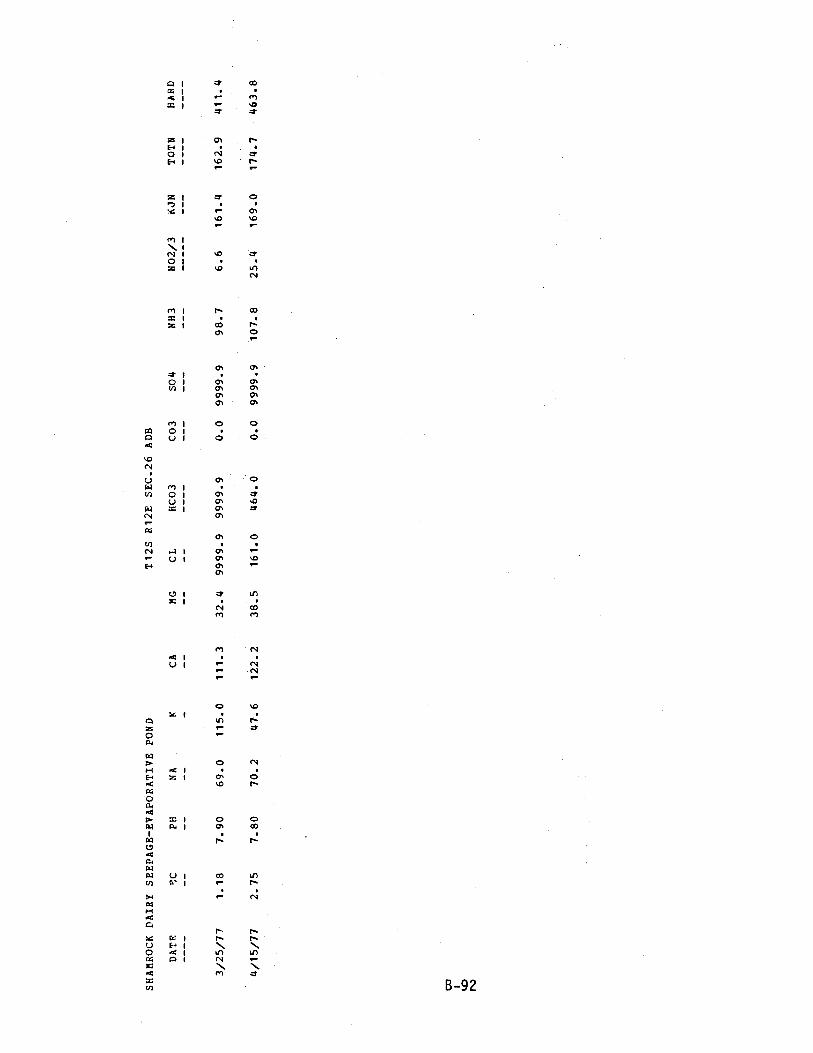
SHAMROCK DAIRY SEEPAGE -EVAPORATIVE POND
T12S R12E SEC.26 ADB
DATE
FC
PH
NA
KCA
MG
CL
HCO3
CO3
SO4
NH3
NO2/3
KJN
TOTN
HARD
3/25/77
1.18
7.90
69.0
115.0
111.3
32.4
9999.9
9999.9
0.0
9999.9
98.7
6.6
161.4
162.9
411.4
4/15/77
2.75
7.80
70.2
47.6
122.2
38.5
161.0
464.0
0.0
9999.9
107.8
25.4
169.0
174.7
463.8

SHAMROCK DAIRY WASTE WATER
DATE
EC
PH
EFFLUENT
NA
KCA
MG
T128
CL
R12E SEC.26 ADD
HCO3
CO3
SO4
NH3
NO2/3
KJN
TOTN
HARD
2/17/77
2.13
7.80
49.6
19.7
64.1
21.2
110.0
927.2
0.0
9999.9
52.9
14.3
197.4
200.7
247.4
4/ 1/77
1.75
8.30
49.6
115.0
50.8
22.9
9999.9
9999.9
0.0
9999.9
47.0
16.8
155.7
159.5
221.2
4/15/77
3.28
7.80
64.1
47.6
99.2
35.1
198.0
1464.0
0.0
9999.9
223.3
24.8
294.0
299.6
392.3
6/27/77
1.90
7.80
48.5
172.5
47.3
22.2
100.0
858.9
0.0
300.0
95.0
12.0
150.0
152.7
209.6

J. METHODS OF DISPOSAL:
1. Discharged to the environment
a. Oxidation pond or holding pond
b. Percolation or evaporation pond
c. Surface spreading
d. Dry stream bed
e. Landfills
f. Disposal wells
2. Reused
a. On -site reuse
(i) Specify reuse:
(ii) Treated
(iii) Untreated
b. Irrigation
(i) Estimated amount:
(ii) Location:
f -1
I i
3. Treated
a. Chemical reactions
b. Cooling
c. Filtering
d. Chlorination
e. Dilution
f. Ultimate disposal:
Li
K. DOES THE WASTE CONSTITUTE A POTENTIAL GROUND -WATER POLLUTANT?
Yes: C71-
No:
B-94

STATEWIDE GROUND -WATER MONITORING PLAN
POLLUTION POTENTIAL OF WASTE SOURCES
A. WASTE SOURCE: Nelson Livestock Feedlot
B. INDIVIDUAL OR AGENCY PRODUCING OR MANAGING WASTE:
C. LOCATION OF SOURCE:
D. LOCATION SKETCH:
(D-13-13) 21 b b
/17LD/N4 PONOp4 r;{Rgf/= .1-426
Z_./O'-1 /VcL5ON
[-1 vGSTUC.K
51.U':0E ßF_I)
RCfrER PD.T2F.,-irnii=Nr
PiANT
CITy OFTacSON fr/iI?M5
I RRI!-IHTEO FARnd 'NG
E. TYPE OF WASTE: SOLID FP LIQUID lx
1. Dissolved or microbial
2. Suspended sediment
DE.1
F. CLASSIFICATION OF WASTE:
1. MUNICIPAL: t1J ; Specify
2. AGRICULTURAL: Specify Manus + Runoff
3. INDUSTRIAL: ú ; Specify
4. MISCELLANEOUS: i i ; Specify
G. ESTIMATED QUANTITY OF WASTE:
No. of livestock varies on daily basis. Between 300 -2000. Stockpile manure and giveaway. 32,000 head over past year. No idea as to water useManure: 160000 lbs per year (dry weight)Urine: 160,000 gal per year
B -95

H. CLASSIFICATION OF WASTE CONSTITUENTS
1. Physical
a. Temperature
b. Density
c. Odor
d. Turbidity
2. Inorganic chemical
a. Major constituents
b. Other constituents
c. Trace elements
d. Gases
3. Bacteriological
a. Coliform group
b. Pathogenic microorganisms
c. Enteric viruses
4. Organic chemical
a. Carbon
b. Chlorophyls
c. Extractable organic matter
d. Methylene Blue Active substances
e. Nitrogen
f. Chemical oxygen demand
g. Phenolic material
h. Pesticides
5. Radiological
a. Gross alpha activity
b. Gross beta activity
c. Strontium
d. Radium
e. Tritium
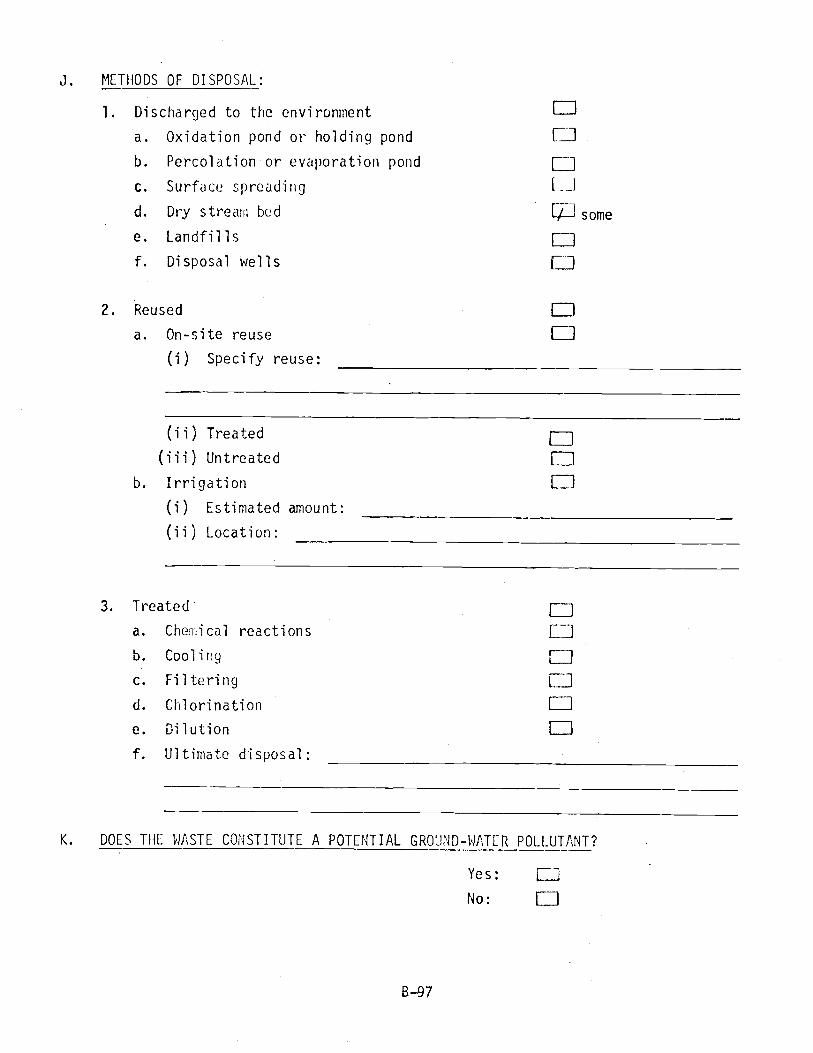
J. METHODS OF DISPOSAL:
1. Discharged to the environment
a. Oxidation pond or holding pond
b. Percolation or evaporation pond
c. Surface spreading
d. Dry stream bed
e. Landfills
f. Disposal wells
2. Reused
a. On -site reuse
(i) Specify reuse:
1l
(ii) Treated
(iii) Untreated
b. Irrigation
(i) Estimated amount:
(ii) Location:
L1
3. Treated
a. Chemical reactions
b. Cooling
c. Filtering
d. Chlorination
e. Dilution
f. Ultimate disposal:
r_n
f n
K. DOES THE WASTE CONSTITUTE A POTENTIAL GROUND -WATER POLLUTANT?
Yes: r-i
No: Li
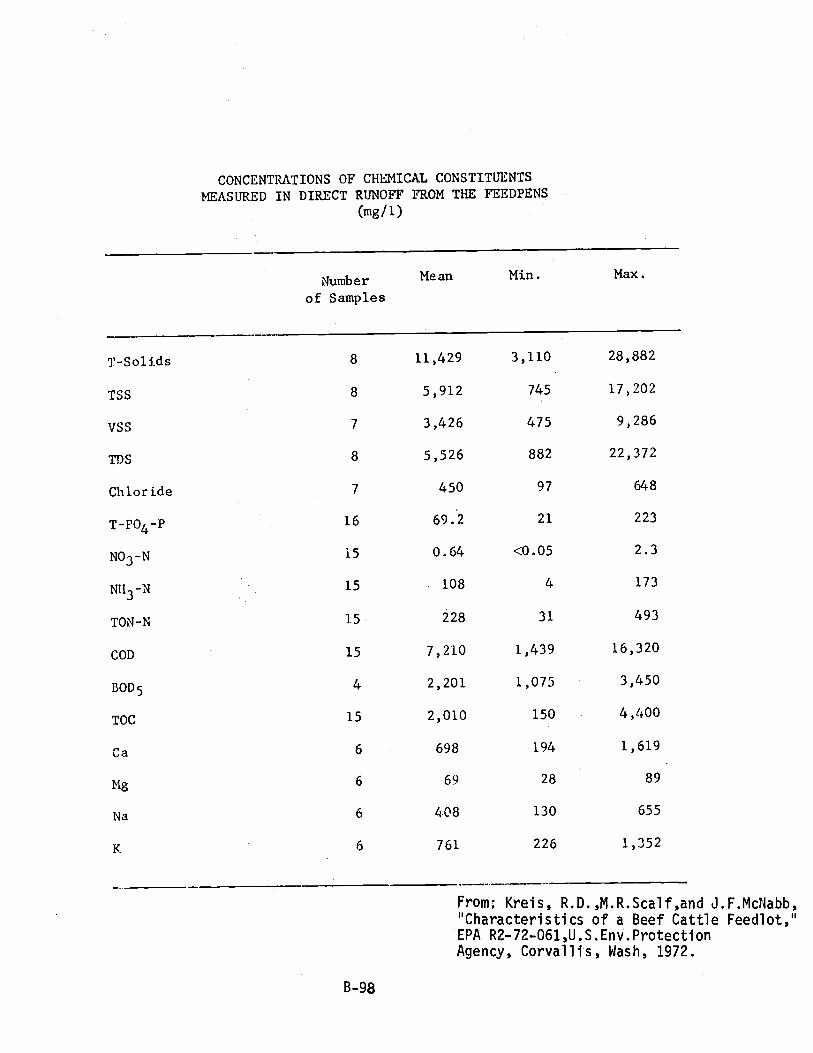
CONCENTRATIONS OF CHEMICAL CONSTITUENTSMEASURED IN DIRECT RUNOFF FROM THE FEEDPENS
(mg /1)
Numberof Samples
Mean Min. Max.
T- Solids 8 11,429 3,110 28,882
TSS 8 5,912 745 17,202
VSS 7 3,426 475 9,286
TDS 8 5,526 882 22,372
Chloride 7 450 97 648
T -PO4 -P 16 69.2 21 223
NO3 -N 15 0.64 <0.05 2.3
NH3 -N 15 108 4 173
TON -N J.5 228 31 493
COD 15 7,210 1,439 16,320
BOD5 4 2,201 1,075 3,450
TOC 15 2,010 150 4,400
Ca 6 698 194 1,619
Mg 6 69 28 89
Na 6 408 130 655
K. 6 761 226 1,352
From: Kreiss, R.D.,M.R.Scalf,and J.F.McNabb,"Characteristics of a Beef Cattle Feedlot,"EPA R2- 72 -061, U. S. Env. Protection
Agency, Corvallis, Wash, 1972.
B-98

A. WASTE SOURCE:
STATEWIDE GROUND -WATER MONITORING PLAN
POLLUTION POTENTIAL OF WASTE SOURCES
Tucson Gas and Electric Company cooling tower blowdowneffluent
3. INDIVIDUAL OR AGENCY PRODUCING OR MANAGING WASTE: Tucson Gas and Electric
Company, recharged by Water Resource Research Center, U. of A.
LOCATION OF SOURCE:
D. LOCATION SKETCH:
0713-13) 34 acc
See over page
E. TYPE OF WASTE: SOLID
F. CLASSIFICATION OF WASTE:
1. MUNICIPAL: El2. AGRICULTURAL: E
3. INDUSTRIAL: ,x
4. MISCELLANEOUS:
G. ESTIMATED QUANTITY OF WASTE:
100 to 400 gpm
LIQUID fx1
1. Dissolved or microbial
2. Suspended sediment
LxJ
Specify
Specify
; Specify Cooling tower blowdown effluent
; Specify
B-146

H. CLASSIFICATION OF WASTE CONSTITUENTS
1. Physical
a. Temperature
b. Density
c. Odor
d. Turbidity
2. Inorganic chemical
a. Major constituents
b. Other constituents
c. Trace elements
d. Gases
3. Bacteriological
a. Coliform group
b. Pathogenic microorganisms
c. Enteric viruses
4. Organic chemical
a. Carbon
b. Chlorophyls
c. Extractable organic matter
d. Methylene Blue Active substances
e. Nitrogen
f. Chemical oxygen demand
g. Phenolic material
h. Pesticides
5. Radiological
a. Gross alpha activity
b. Gross beta activity
c. Strontium
d. Radium
e. Tritium
Jf/ J
n
I/ I
fiI/ I
B-100 ,

Table 3-- Chemical composition of selected animal vastest
Type ofanimal waste
Chemical composition
Refer,r.,.N P K Ca Mg S Mn Fe B Cu Zn Mo
% dry weight PPmBroiler litter 2.3 1.1 1.7 2.0 0.4 0.4 272 1,244 33 29 128 13 Perkins arid Parle (1971Ilen litter 2.0 1.9 1.9 3.4 0.5 0.5 333 1,347 28 31 120 14 Perkins and Parker (197' )Dairy cow 2.7 0.5 2.4 1.6 0.6 0.3 56 222 83 23 83 6 Benne et al. (iS61)Fattening cattle 3.5 1.0 2.3 0.6 0.5 0.4 23 182 91 23 68 2 Benne et a. (1:3i)Iiog 2.0 0.6 1.5 2.0 0.3 0.5 72 1,002 143 18 215 4 Benne et a). (131)Horse 1.7 0.3 1.5 2.9 0.5 0.3 37 500 56 19 56 4 Benne et a:. 0.961)Sheep 4.0 0.6 2.9 1.9 0.6 0.3 32 518 32 16 81 3 Benne et al. (1961,1
t Cited in Azevedo and Stout (1974).
B-101

I. REPRESENTATIVE ANALYSES:
Date of analysis: Location:
Major Trace
Calcium mg /1 meq /1 Arsenic mg /1
Magnesium mg /1 meq /1 Barium mg /1
Sodium mg /1 meq /1 Cadmium mg /1
Potassium mq /1 meq /1 Chromium mg /1
Carbonate mg /1 meq /1 Copper mg /1
Bicarbonate mg /1 meq /i Cyanide mg /1
Sulfate mg /1 meq /1 Fluoride mg /1
Chloride mg /1 meq /1 Iron mg /1
Nitrate mg /1 meq /1 Lead mg /1
Manganese mg/1
Other ConstituentsMercury mg /1
Nitrate -N mg /1Selenium mg /1
Ammonia -N mg/1Silver mg /1
KJN mg /1Strontium mg /1
Total -N mg /1Zinc mg /1
Specific conductance mg /1
Total dissolved solids mg /1 Microorganisms
pH mg /1 Total coliform #/100m1
Silica mg /1 Fecal coliform #/100m1
Boron mg /1 Fecal Strep. #/100m1
Fluoride mg /1
Phosphorous mg /1
Hardness mg /1
Alkalinity mg /1
B.O.D. mg /1
C.O.D. mg /1
S.S. mg /1

J. METHODS OF DISPOSAL:
1. Discharged to the environment
a. Oxidation pond or holding pond
b. Percolation or evaporation pond
c. Surface spreading
d. Dry stream bed
e. Landfills
f. Disposal wells
2. Reused
a. On -site reuse
(i) Specify reuse:
(ii) Treated
(iii) Untreated
b. Irrigation
(i) Estimated amount:
(ii) Location:
r1
3. Treated
a. Chemical reactions
b. Cooling
c. Filtering
d. Chlorination
e. Dilution
f. Ultimate disposal:
Li{ 1
K. DOES THE WASTE CONSTITUTE A POTENTIAL GROUND -WATER POLLUTANT?
Yes: f Xi
No: Li
B-103

STATEWIDE GROUND -WATER MONITORING PLAN
POLLUTION POTENTIAL OF WASTE SOURCES
A. WASTE SOURCE: U of A Feedlot
B. INDIVIDUAL OR AGENCY PRODUCING OR MANAGING WASTE:
C. LOCATION OF SOURCE: (D- 13 -13) 34 bd
D. LOCATION SKETCH:
E. TYPE OF WASTE: SOLID
F. CLASSIFICATION OF WASTE:
LIQUID I--1
1. Dissolved or microbial
2. Suspended sediment C23
1. MUNICIPAL: [_1 ; Specify
2. AGRICULTURAL: ; Specify(x,
3. INDUSTRIAL: EJ ; Specify
4. MISCELLANEOUS: U ; Specify
G. ESTIMATED QUANTITY OF WASTE:
Manure: 1.5 to 2 tons /dayUrine: 1500 gal /day
See Section L, Additional Comments
B-104

H. CLASSIFICATION OF WASTE CONSTITUENTS
1. Physical
a. Temperature
b. Density
c. Odor
d. Turbidity
2. Inorganic chemical
a. Major constituents
b. Other constituents
c. Trace elements
d. Gases
3. Bacteriological
a. Coliform group
b. Pathogenic microorganisms
c. Enteric viruses
4. Organic chemical
a. Carbon
b. Chlorophyls
c. Extractable organic matter
d. Methylene Blue Active substances
e. Nitrogen
f. Chemical oxygen demand
g. Phenolic material
h. Pesticides
5. Radiological
a. Gross alpha activity
b. Gross beta activity
c. Strontium
d. Radium
e. Tritium
Li
L_J
L
ni l
L_l
L_i
8 -10
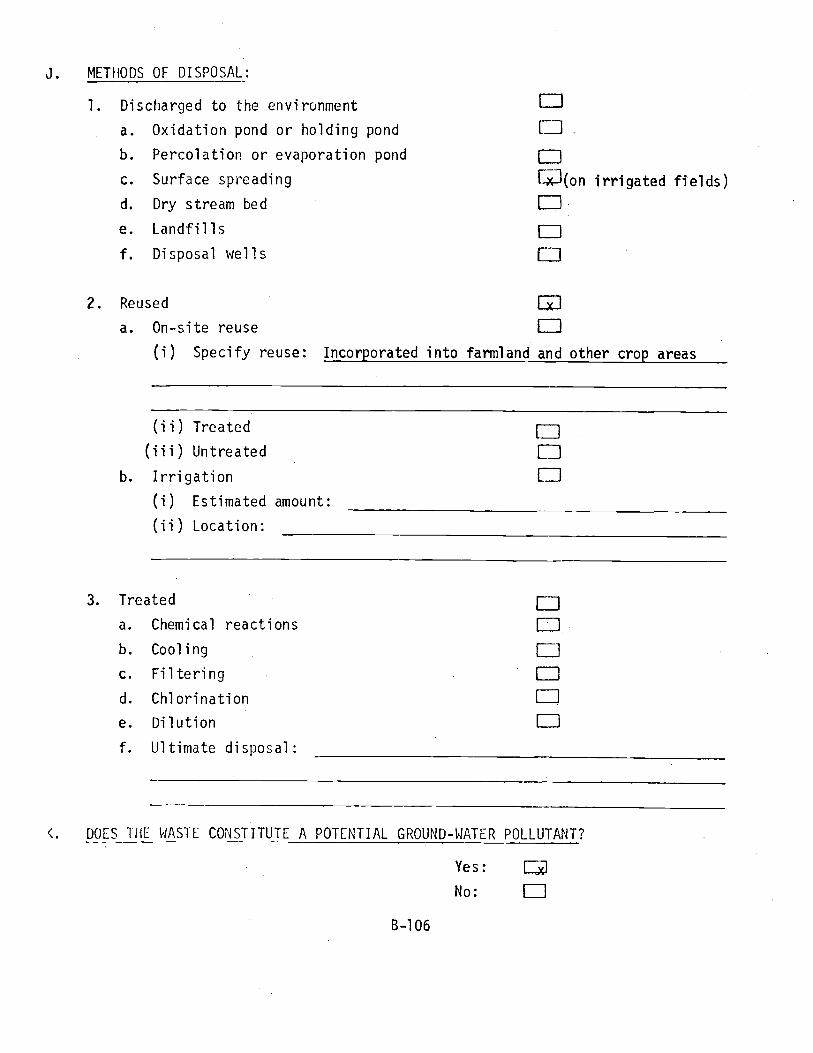
J. METHODS OF DISPOSAL:
1. Discharged to the environment
a. Oxidation pond or holding pond
b. Percolation or evaporation pond
c. Surface spreading
d. Dry stream bed
e. Landfills
f. Disposal wells
2. Reused
a. On -site reuse Cl(i) Specify reuse: Incorporated into farmland and other crop areas
0Un[J(on irrigated fields)
n
(ii) Treated
(iii) Untreated
b. Irrigation
(i) Estimated amount:
(ii) Location:
3. Treated
a. Chemical reactions
b. Cooling
c. Filtering
d. Chlorination
e. Dilution
f. Ultimate disposal:
LJ
K. DOES THE WASTE CONSTITUTE A POTENTIAL GROUND -WATER POLLUTANT?
Yes:
No:
B-106
ja

CONCENTRATIONS OF CHEMICAL CONSTITUENTSMEASURED IN DIRECT RUNOFF FROM THE FEEDPENS
(mg /1)
Numberof Samples
Mean Min. Max.
T-Solids 8 11,429 3,110 28,882
TSS 8 5,912 745 17,202
VSS 7 3,426 475 9,286
TDS 8 5,526 882 22,372
Chloride 7 450 97 648
T-PO4-P 16 69.2 21 223
NO3-N 15 0.64 <0.05 2.3
NII3-N 15 108 4 173
TON-N 15 228 31 493
COD 15 7,210 1,439 16,320
BOD5 4 2,201 1,075 3,450
TOC 15 2,010 150 4,400
Ca 6 698 194 1,619
Mg 6 69 28 89
Na 6 408 130 655
K 6 761 226 1,352
From; Kreis, R.D., M.R. Scalf,andJ.F. McNabb,
"Characteristics of a Beef Cattle Feedlot,"EPA R2- 72- 061,U.S. Env.Protection
Agency, Corvallis, Wash, 1972.B-107

A. WASTE SOURCE:
STATEWIDE GROUND -WATER MONITORING PLAN
POLLUTION POTENTIAL OF WASTE SOURCES
Shamrock Dairy Feedlot
B. INDIVIDUAL OR AGENCY PRODUCING OR MANAGING WASTE:
C. LOCATION OF SOURCE:
D. LOCATION SKETCH:
E. TYPE OF WASTE: SOLID LIQUID 71
1. Dissolved or microbial
2. Suspended sediment
F. CLASSIFICATION OF WASTE:
1. MUNICIPAL: (`f ; Specify
2. AGRICULTURAL: Ï¡ ;; ; Specify manure. urine
3. INDUSTRIAL: E ; Specify
4. MISCELLANEOUS: ; Specify
G. ESTIMATED QUANTITY OF WASTE:
2600 head5 gpd urine /cow = 13,000 gpd urine7 lbs /day tanure (dry weight) /cow = 18,200 lbs /day manure
B-108
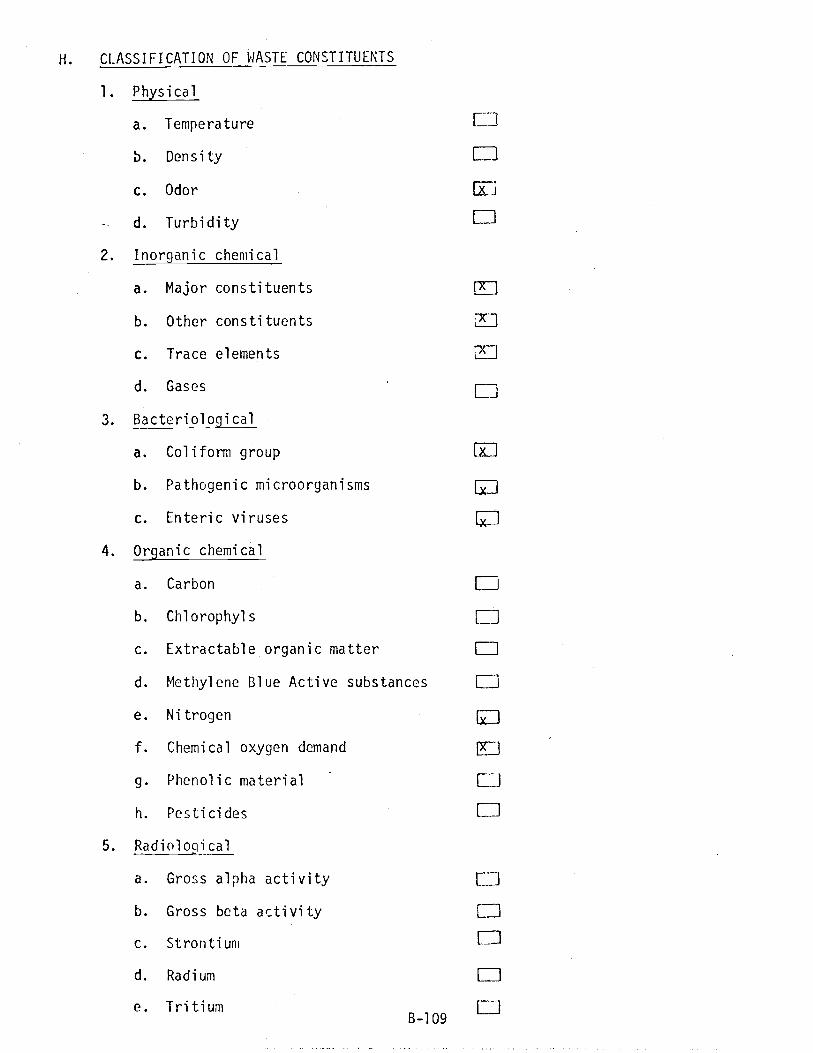
H. CLASSIFICATION OF WASTE CONSTITUENTS
1. Physical
a. Temperature
b. Density
c. Odor
d. Turbidity
2. Inorganic chemical
a. Major constituents
b. Other constituents
c. Trace elements
d. Gases
3. Bacteriological
a. Coliform group
b. Pathogenic microorganisms
c. Enteric viruses
4. Organic chemical
a. Carbon
b. Chlorophyls
c. Extractable organic matter
d. Methylene Blue Active substances
e. Nitrogen
f. Chemical oxygen demand
g. Phenolic material
h. Pesticides
5. Radiological
a. Gross alpha activity
b. Gross beta activity
c. Strontium
d. Radium
e. Tritium r- -1B-109
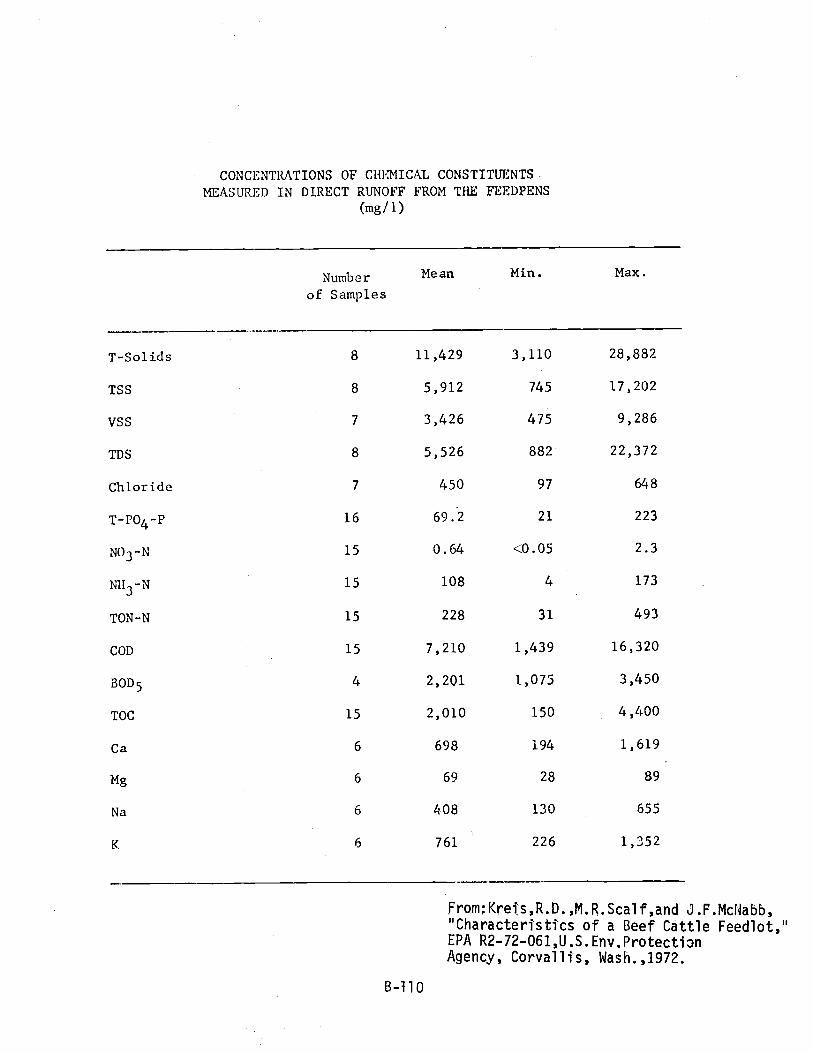
CONCENTRATIONS OF CHEMICAL CONSTITUENTS.MEASURED IN DIRECT RUNOFF FROM THE FEEDPENS
(mg /1)
Numberof Samples
Mean Min. Max.
T- Solids 8 11,429 3,110 28,882
TSS 8 5,912 745 17,202
VSS 7 3,426 475 9,286
TDS 8 5,526 882 22,372
Chloride 7 450 97 648
T -PO4 -P 16 69.2 21 223
NO3 -N 15 0.64 <0.05 2.3
NH3 -N 15 108 4 173
TON -N 15 228 31 493
COD 15 7,210 1,439 16,320
B OD 5 4 2,201 1,075 3,450
TOC 15 2,010 150 4,400
Ca 6 698 194 1,619
Mg 6 69 28 89
Na 6 408 130 655
K. 6 761 226 1,352
From ;Krei;s,R.D.,M.R.Scalf,and J.F.McNabb,
"Characteristics of a Beef Cattle Feedlot,"EPA R2- 72- 061,U.S.Env.Protecti3nAgency, Corvallis, Wash.,1972.
B-110
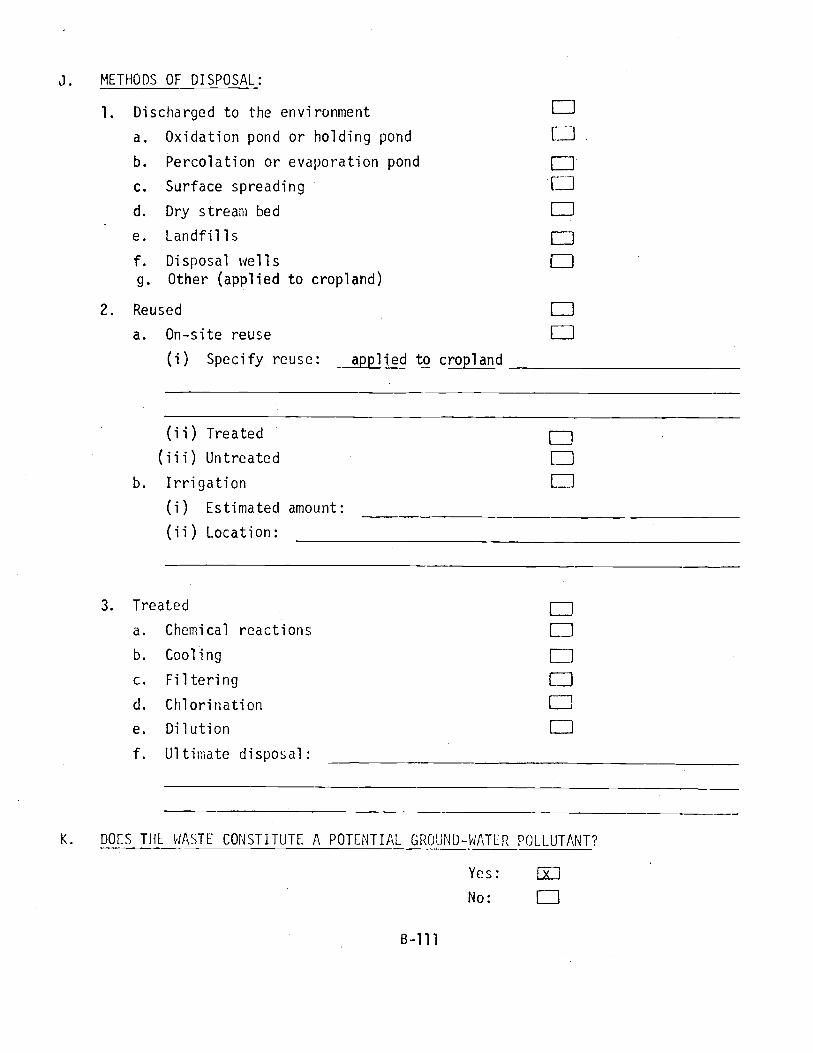
J. METHODS OF DISPOSAL:
1. Discharged to the environment
a. Oxidation pond or holding pond
b. Percolation or evaporation pond
c. Surface spreading
d. Dry stream bed
e. Landfills
f. Disposal wells
g. Other (applied to cropland)
2. Reused
a. On -site reuse
(i) Specify reuse: applied to cropland
nI I
(ii) Treated
(iii) Untreated
b. Irrigation
(i) Estimated amount:
(ii) Location:
LJ
3. Treated
a. Chemical reactions
b. Cooling
c. Filtering
d. Chlorination
e. Dilution
f. Ultimate disposal:
LJ
K. DOES THE WASTE CONSTITUTE A POTENTIAL GROUND -WATER POLLUTANT?
Yes:
No:
B-111
nx.7

STATEWIDE GROUND -WATER MONITORING PLAN
POLLUTION POTENTIAL OF WASTE SOURCES
- A. WASTE SOURCE: Arthur Pack Park. - Effluent i rri gatton
B. INDIVIDUAL OR AGENCY PRODUCING OR MANAGING WASTE:
C. LOCATION OF SOURCE: (D- 13 -13) 7 a bb
D. LOCATION SKETCH:
z io
PAL, F.
ARTHUR
PACK
PARK
SHHM0.'KDn,lRy
pi'Oi?Tq{ZG Fgr=/h5 RR
o.
Ly'kg;
D}2'
G..
ti
(
E. TYPE OF WASTE: SOLID LIQUID f l1. Dissolved or microbial
2. Suspended sediment
F. CLASSIFICATION OF WASTE:
1. MUNICIPAL: ED Specify
2. AGRICULTURAL. ¡ ;; ; Specify effluent irrigation
3. INDUSTRIAL: Ell ; Specify
4. MISCELLANEOUS: 7.1 ; Specify
G. ESTIMATED QUANTITY OF WASTE:
0.7 mgd.
B -112
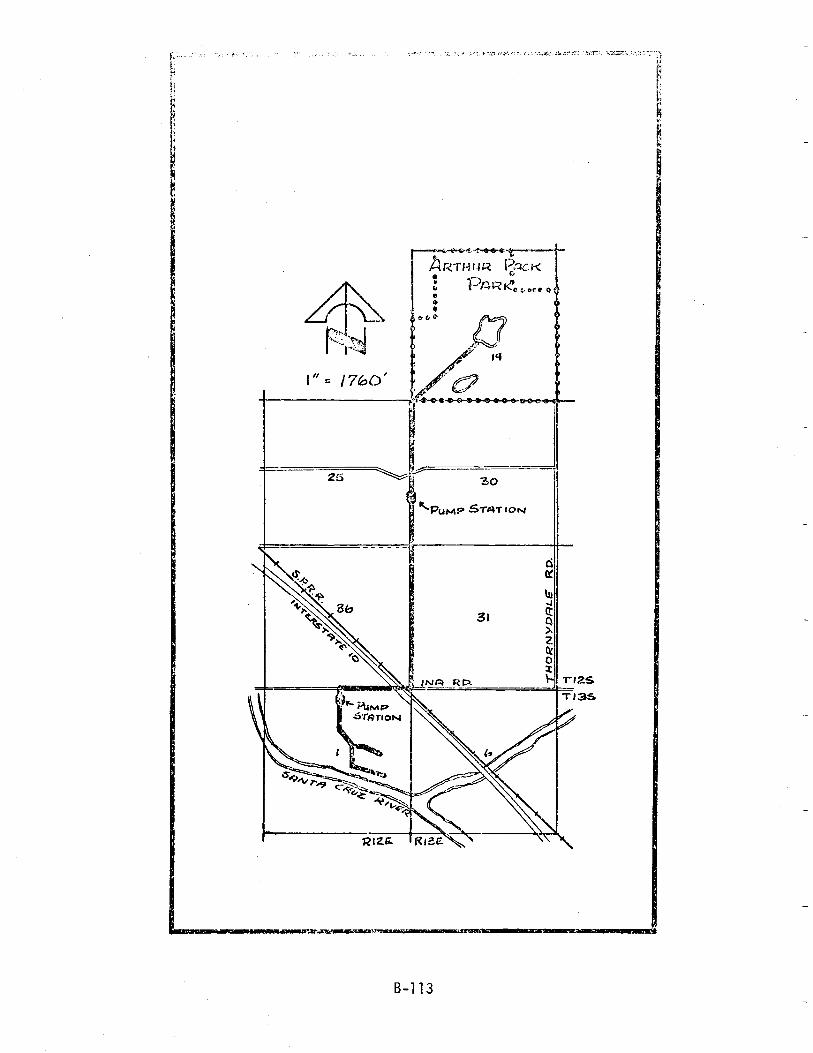
B-113

H. CLASSIFICATION OF WASTE CONSTITUENTS
1. Physical
a. Temperature
b. Density
c. Odor
d. Turbidity
2. Inorganic chemical
a. Major constituents
b. Other constituents
c. Trace elements
d. Gases
3. Bacteriological
a. Coliform group (/ I
b. Pathogenic microorganisms I/j
c. Enteric viruses LJ
4. Organic chemical
a. Carbon [b. Chlorophyls [L]
c. Extractable -organic matter
d. Methylene Blue Active substances Le. Nitrogen ri
f. Chemical oxygen demand
g. Phenolic material LJ
h. Pesticides Ìl5. Radiological
a. Gross alpha activity [_J
b. Gross beta activity CD
c. Strontium L_J
d. Radium L i
e. TritiumB -114
LEiLJ
V!
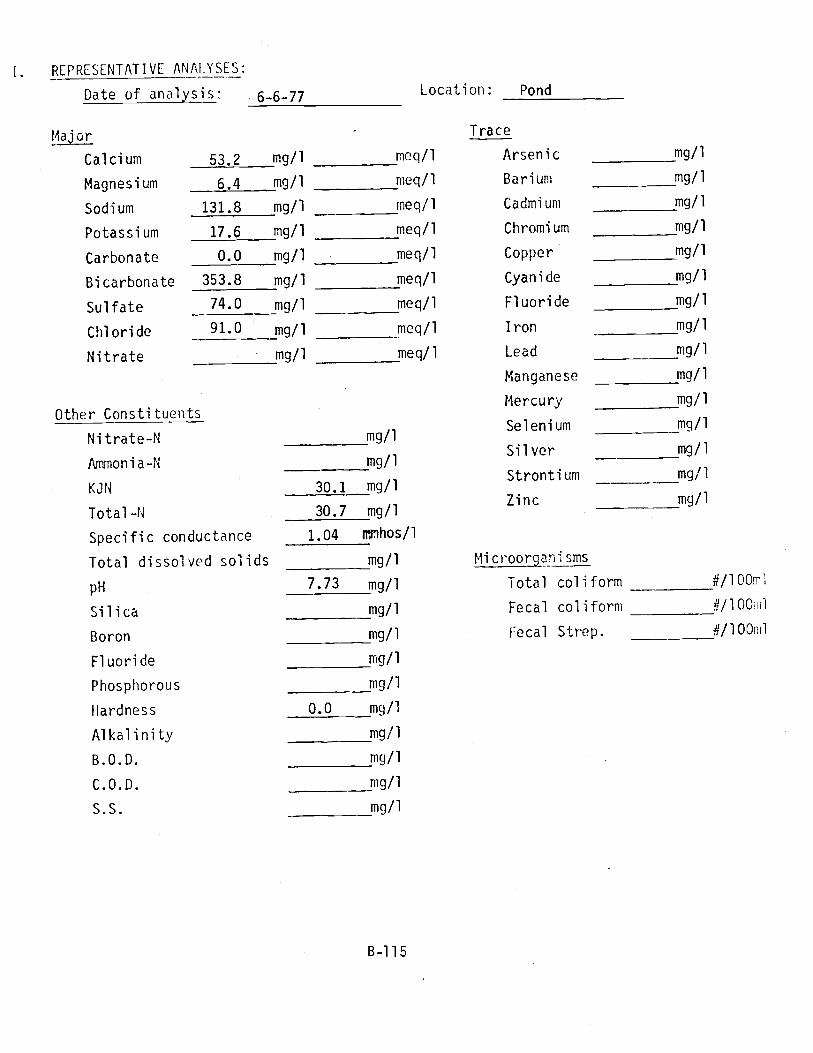
(. REPRESENTATIVE ANALYSES:
Date of analysis: 6-6-77Location: Pond
Major Trace
Calcium 53.2 mg /1 meq /1 Arsenic mg /1
Magnesium 6.4 mg /1 meq /1 Barium mg /1
Sodium 131.8 mg /1 rneq /1 Cadmium mg /1
Potassium 17.6 mg /1 meq /1 Chromium mg /1
Carbonate 0.0 mg /1 meq /1 Copper mg /1
Bicarbonate 353.8 mg /1 meq /1 Cyanide mg /1
Sulfate 74.0 mg/1 meq /1 Fluoride mg /1
Chloride 91.0 mg /1 meq /1 Iron mg /1
Nitrate mg /1 meq /1 Lead mg/1
Manganese mg /1
Other ConstituentsMercury mg/1
Nitrate -N mg /1Selenium mg /1
Ammonia -N mg /1Silver mg /1
KJN 30.1 mg /1Strontium mg/ 1
Total -N 30.7 mg /1Zinc mg /1
Specific conductance 1.04 rnrnhos /1
Total dissolved solids mg /1
pH 7.73 mg /1
Silica mg /1
Boron mg/1
Fluoride mg /1
Phosphorous mg /1
Hardness 0.0 mg /1
Alkalinity mg /1
B.O.D. mg /1
C.O.D. mg /1
S.S. mg /1
Microorganisms
Total coliform #/100m1
Fecal coliform # /1OOH
Fecal Strep. #/100m1

J. METHODS OF DISPOSAL:
1. Discharged to the environment
a. Oxidation pond or holding pond
b. Percolation or evaporation pond
c. Surface spreading
d. Dry stream bed
e. Landfills
f. Disposal wells
2. Reused
a. On -site reuse
(i) Specify reuse:
nn
(ii) Treated
(iii) Untreated
b. Irrigation
(i) Estimated amount:
(ii) Location:
x
unknown
3. Treated
a. Chemical reactions
b. Cooling
c. Filtering
d. Chlorination
e. Dilution
f. Ultimate disposal:
LJnun
K. DOES THE WASTE CONSTITUTE A POTENTIAL GROUND -WATER POLLUTANT?
Yes: [x]
No:

STATEWIDE GROUND -WATER MONITORING PLAN
POLLUTION POTENTIAL OF WASTE SOURCES
N. WASTE SOURCE: CWVA IRR CANAL
3. INDIVIDUAL OR AGENCY PRODUCING OR MANAGING WASTE:
C. LOCATION OF SOURCE:
D. LOCATION SKETCH: see attached figure
E. TYPE OF WASTE: SOLID Ï7
F. CLASSIFICATION OF WASTE:
1. MUNICIPAL: E:3
2. AGRICULTURAL:
3. INDUSTRIAL: 14. MISCELLANEOUS:
n
G. ESTIMATLD QUANTITY OF WASTE:
LIQUID Q1. Dissolved or microbial
2. Suspended sediment
ETCJ
; Specify
; Specify Irr. water
; Specify
; Specify
B-117
16.8 miles in length7% loss
90 cfs average discharge6.3 cfs water loss or0.4 cfs per mile
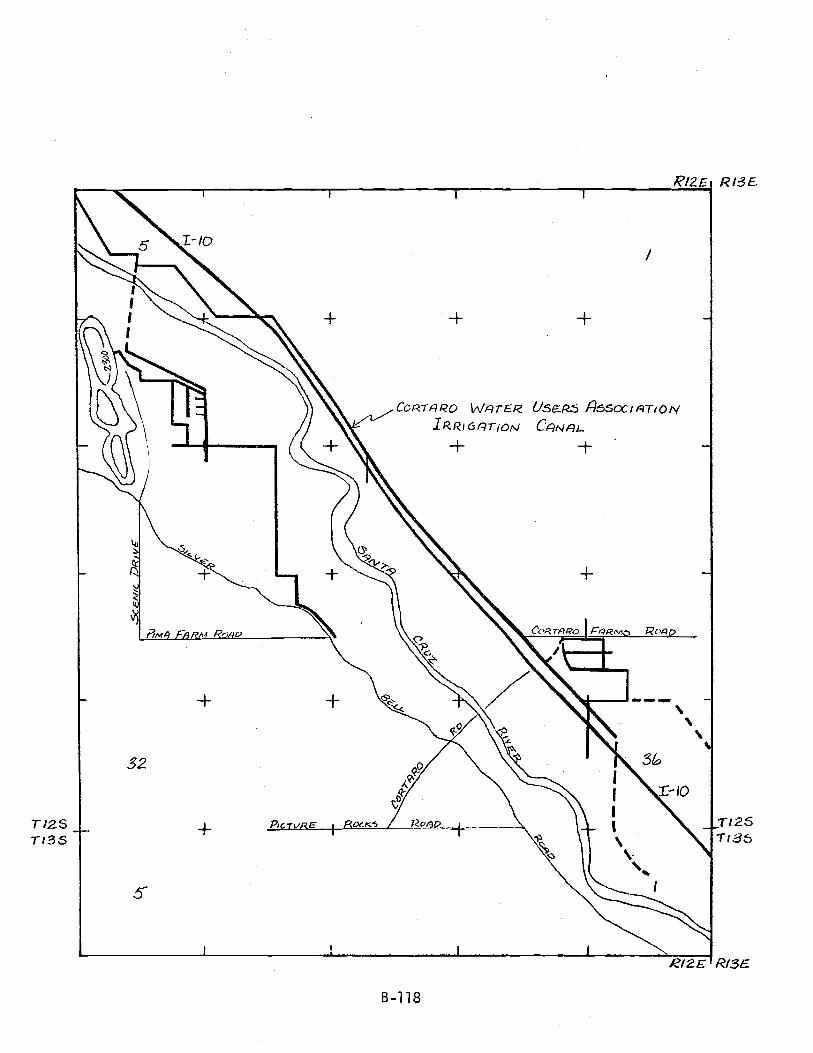
RI2E RI3E.
I-10
CORTA RO WATER USERS ASSOCI AT/ONIRRICsATION CANAL
-{' t
TI2STí35
j3M4 FARM Roi_-- ---- --
32
5
CC'RTA RD r FiaRA,5 Rc'AD1/
,...
oC5>
11-
v-E Roe K.5
;AI
B-118
ri 25T136
R12E Rl3E

H. CLASSIFICATION OF WASTE CONSTITUENTS
1. Physical
a. Temperature
b. Density
c. Odor
d. Turbidity
2. Inorganic chemical
a. Major constituents
b. Other constituents
c. Trace elements
d. Gases
3. Bacteriological
a. Coliform group
b. Pathogenic microorganisms
c. Enteric viruses
4. Organic chemical
a. Carbon
b. Chlorophyls
c. Extractable organic matter
d. Methylene Blue Active substances
e. Nitrogen
f. Chemical oxygen demand
g. Phenolic material
h. Pesticides
5. Radiological
a. Gross alpha activity
b. Gross beta activity
c. Strontium
d. Radium
e. Tritium
[
F-1
B-119

I. REPRESENTATIVE ANALYSES: Not available - blend of CWVA wells
Date of analysis: Location:
Major - Trace
Calcium mg /1 meq /1 Arsenic mg /1
Magnesium mg /1 meq /1 Barium mg /1
Sodium mg /1 meq /1 Cadmium mg/1
Potassium mg /1 meq /1 Chromium mg/1
Carbonate mg/1 meq /1 Copper mg /1
Bicarbonate mg /1 meq /1 Cyanide mg /1
Sulfate mg /1 meq /1 Fluoride mg /1
Chloride mg /1 meq /1 Iron mg /1
Nitrate mg /1 meq /1 Lead mg /1
Manganese mg /1
Other ConstituentsMercury mg /1
Nitrate -N mg /1Selenium mg /1
Ammonia -N mg /1Silver mg /1
KJN mg /1Strontium mg/1
Total -N mg /1Zinc mg /1
Specific conductance mg /1
Total dissolved solids mg /1 Microorganisms
pH mg /1 Total coliform #/100m1
Silica mg /1 Fecal coliform #/100m1
Boron mg /1 Fecal Strep. #/100m1
Fluoride mg /1
Phosphorous mg /1
Hardness mg /1
Alkalinity mg /1
B.O.D. mg /1
C.O.D. mg /1
S.S. mg /1

J. METHODS OF DISPOSAL:
1. Discharged to the environment
a. Oxidation pond or holding pond
b. Percolation or evaporation pond
c. Surface spreading
d. Dry stream bed
e. Landfills
f. Disposal wells
g. Other (seepage)
2. Reused
a. On -site reuse
(i) Specify reuse:
CJ
n
(ii) Treated
(iii) Untreated
b. Irrigation
(i) Estimated amount:
(ii) Location:
3. Treated
a. Chemical reactions
b. Cooling
c. Filtering
d. Chlorination
e. Dilution
f. Ultimate disposal:
LJ
1
K. DOES THE WASTE CONSTITUTE A POTENTIAL GROUND -WATER POLLUTANT?
Yes:
No:
B-121
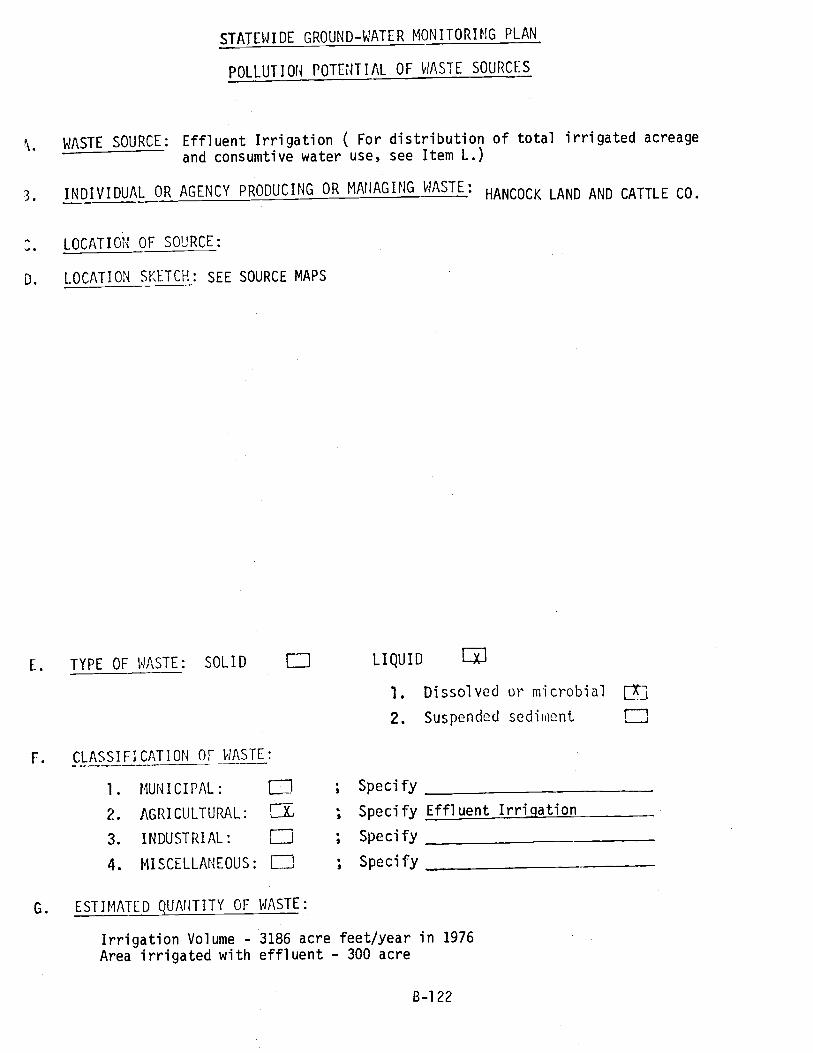
STATEWIDE GROUND -WATER MONITORING PLAN
POLLUTION POTENTIAL OF WASTE SOURCES
WASTE SOURCE: Effluent Irrigation ( For distribution of total irrigated acreage
and consumtive water use, see Item L.)
3. INDIVIDUAL OR AGENCY PRODUCING OR MANAGING WASTE: HANCOCK LAND AND CATTLE CO.
::. LOCATION OF SOURCE:
D. LOCATION SKETCH: SEE SOURCE MAPS
E. TYPE OF WASTE: SOLID I 1 LIQUID [ X1
1. Dissolved or microbial LXj
2. Suspended sediment [1
F. CLASSIFICATION OF WASTE:
1. MUNICIPAL: El ; Specify
2. AGRICULTURAL: L ; Specify Effluent Irrigation
3. INDUSTRIAL: i I ; Specify
4. MISCELLANEOUS: [ ; ; Specify
G. ESTIMATED QUANTITY OF WASTE:
Irrigation Volume - 3186 acre feet /year in 1976Area irrigated with effluent - 300 acre
8-1 22
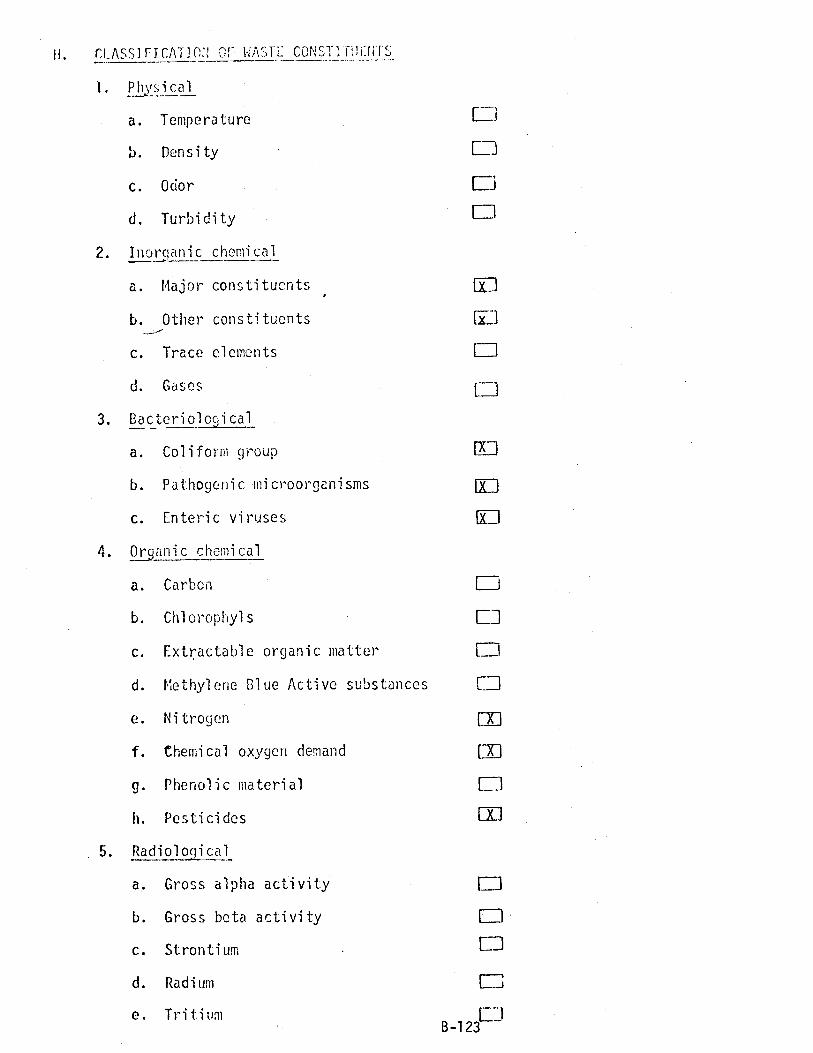
H. r..1_ASSIrICATICt, :WASTE CONSTITUENTS
I. Phvsic_a1
a. Temperature F-1
b. Density C13
c. Odor Eä
d. Turbidity
2. Inorganic chemical
a. Major constituents L_.1
b. Other constituents BC-1
c. Trace elements (-1
d. Gases Ei3. Bacteriological
a. Coliform group
b. Pathogenic microorganisms a-]
c. Enteric viruses. lXJ
4. Organic chemical
a. Carbon 1 i
b. Chlorophyls []
c. Extractable organic matter I 1
d. Methylene Blue. Active substances Cl
e. Nitrogen
f. Chemical oxygen demand
g. Phenolic material L_)
h. Pesticides
5. Radiological
a. Gross alpha activity
b. Gross beta activity
Ix 1
[XI
c. Strontium
d. Radium
e. Tritium
xi

SI.N_!dl ! i
Date oF an,tl . I:'75--Y6 Location: l-in l h.fflucr,t f Iant No. 1
e } t oir Tr;r::r`..,,/
-.. _...
Calcium 7' __._. mg /1 meq /1 Arsenic !IÌq /1
Magnesium 1;__, mg/1 nleq /1 Barium mg /1
Sodium 98 nub /1 meq /1 Cadmium um mg /1
Potassium mg /1 meq /1 Chromium mg /1
Carbonate 0 mg /1 meq /1 Copper mg /1
Bicarbonate 294 mg /1 meq /1 Cyanide mg /1
Sulfate 152 mg /1 meq /1 Fluoride mg /1
Chloride 95 mg /1 meq /1 Iron 0.2 mg /1
Nitrate mg /1 meq /1 Lead mg/1
Manganese mg /1
Other ConstituentsMercury mg /1
Nitrate -N 0.0 mg /1Selenium mg /1
Ammonia -N 17.1 mg /1Silver mg /1
KJN 25.0 mg/1Strontium mg /1
Total -N 25.2 mg /1Zinc mg /1
E` Specific conductance mg /1
Total dissolved solids 671 mg /1 Microorganisms
pH 7.5 mg /1 Total coliform #/100::::
Silica 4? mg /1 Fecal coliform # /10Cr.,i
Boron mg /1 Fecal Strep. # /100r
Fluoride mg /1
Phosphorous (Phosphate, 18 mg /1
HardnessOrtho)
mg/1
Alkalinity 241 mg/1
B.O.D. 21 mg/1
C.O.D. 48 mg/1
S.S. 68 mg /1
Organic -N 7.9 mg /1

1976
CR
OP
SU
RV
EY
ALF
ALF
A'
CO
RN
'C
OT
TO
N1
GR
AIN
1S
OR
GH
UM
1P
AS
TU
RE
1P
EC
AN
S1
CR
OP
TO
TA
LF
ALL
OW
1A
CR
EA
GE
TO
TA
LC
WU
2
T12
3,R
12`
Sec
. 8949,
146
146
386
038
6`"
109
-9-
4848
960
9624
0i6
295
295
029
510
33--
i/40
4040
8010
62_
.I.38
338
379
462
1341
-
221.
0410
468
172
364
_693
930
9332
627
3636
3066
126
L80
7676
0-
3164
640
6416
0Se
c.40
400
\40
100
1919
,19
86i'
15-3
715
1538
.,-'1
31--
ec.
i25
2510
20
102
272
-.1
-4-
1650
050
'' L.iI-
it22
2222
8816
5642
9898
308
W;
75
75
75
263
?O77
1766
8343
2110
010
020
00
200
500
2s14
98
149
306
106
412
774
290-
1212
--
0
TO
TA
L53
274
1088
672
259
8015
2441
477
2918
7438
1In
acre
s
Inac
re -
feet
.
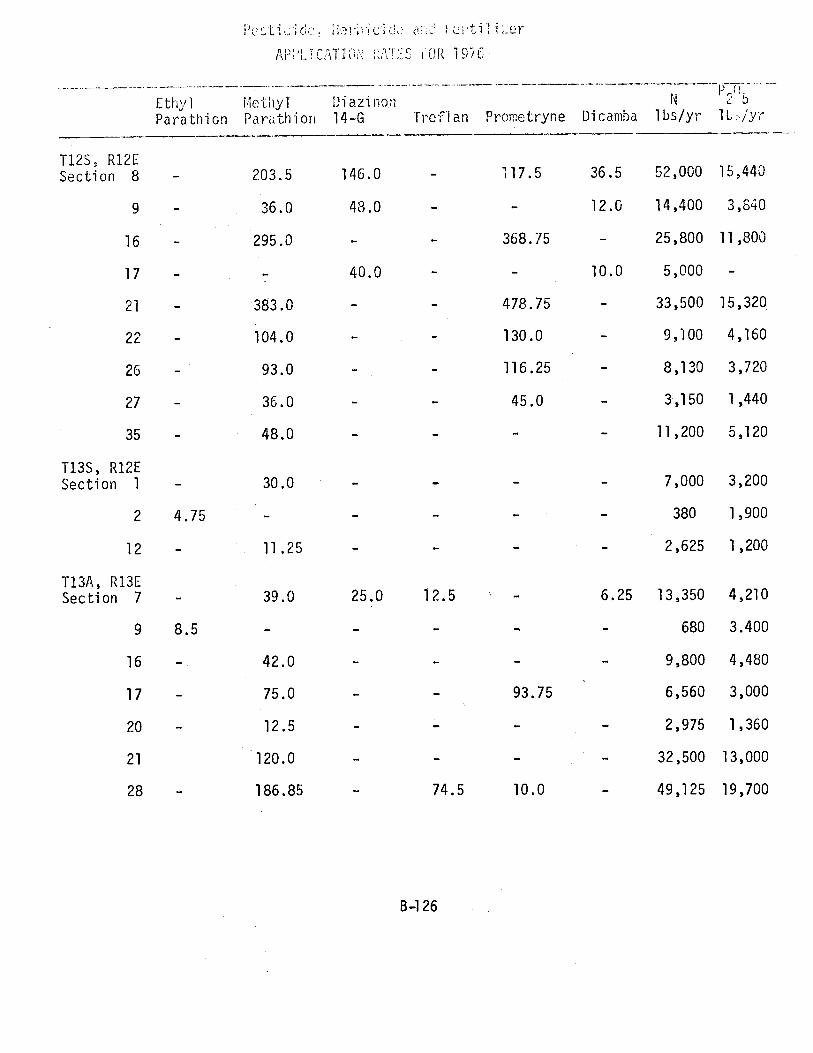
Pesticidc. HptilLer
Ethyl
Parathion
APPLICATIM 1-;ATES 19-/C
DicambaN
lbs/yr
P,f).
1LVyrNethyIParathion
Diazinon14-G Treflan Prometryne
T12S, R12ESection 8 203.5 146.0 117.5 36.5 52,000 15,440
9 - 36.0 48.0 - 12.0 14,400 3,840
16 295.0 - 368.75 - 25,800 11,800
17 - - 40.0 - 10.0 5,000 -
21 - 383.0 - - 478.75 - 33,500 15,320
22 104.0 130.0 - 9,100 4,160
26 93.0 116.25 8,130 3,720
27 - 36.0 - - 45.0 3,150 1,440
35 48.0 - - - 11,200 5,120
T13S, R12ESection 1 - 30.0 - - 7,000 3,200
2 4.75 - - 380 1,900
12 11.25 - - 2,625 1,200
113A, R13ESection 7 39.0 25.0 12.5 - 6.25 13,350 4,210
9 8.5 - - - 680 3.400
16 42.0 9,800 4,480
17 - 75.0 93.75 6,560 3,000
20 - 12.5 - 2,975 1,360
21 120.0 - 32,500 13,000
28 - 186.85 74.5 10.0 - 49,125 19,700
B-126
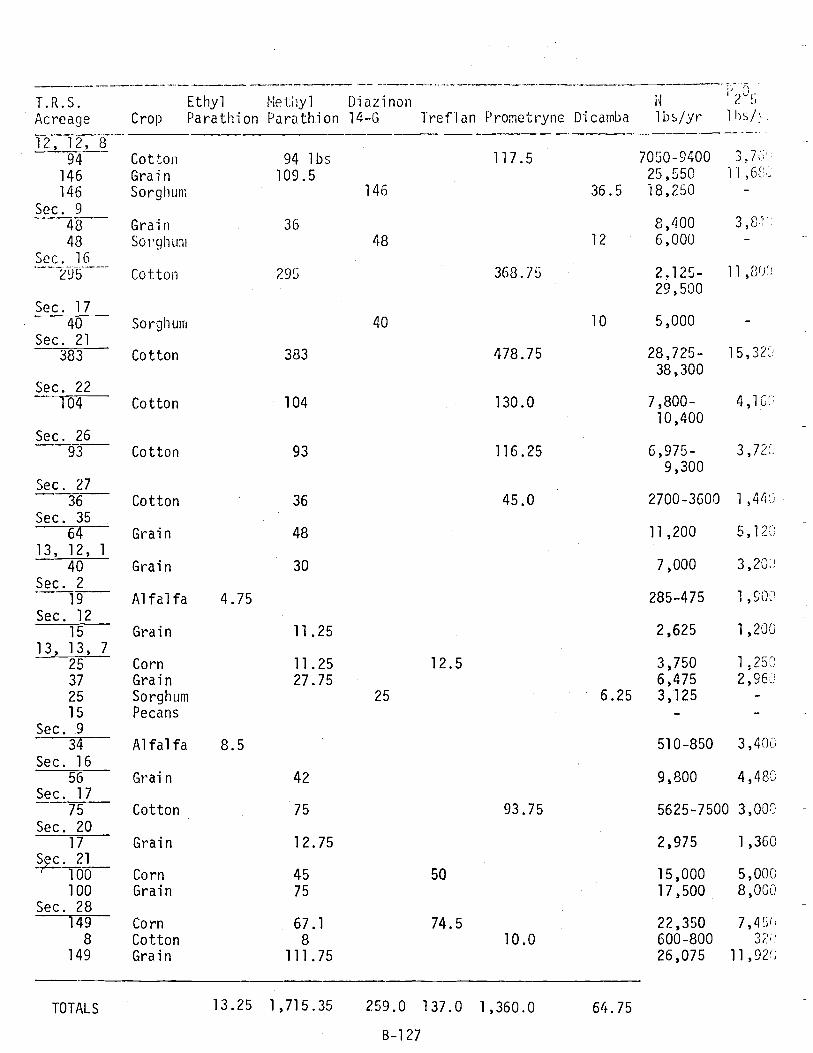
T.R.S.
Acreage
12, 12, 894
146
146
Sec. 94848
Sec. 16~_.195
_ - --
Sec. 1740
Sec. 21383
Sec. 22104
Sec. 2693
Sec. 2736
Sec. 3564
13, 12, 1
40
Sec. 219
Sec. 1215
13, 13, 725
37
25
15
Sec. 934
Sec. 1656
Sec. 1775
Sec. 2017
Sec. 21100100
Sec. 28149
8
149
Ethyl Methyl Di azi non
Crop Parathion Parathion 14 -G Treffan Prometryne Dicamba
Cotton 94 lbs 117.5
Grain 109.5Sorghum 146
Grain 36
Sorghum 48
Cotton 295 368.75
Sorghum 40
Cotton 383 478.75
Cotton 104 130.0
Cotton 93 116.25
Cotton 36 45.0
Grain 48
Grain 30
Alfalfa 4.75
Grain 11.25
Corn 11.25 12.5
Grain 27.75Sorghum 25
Pecans
Alfalfa 8.5
Grain 42
Cotton 75 93.75
Grain 12.75
Corn 45 50
Grain 75
Corn 67.1 74.5Cotton 8 10.0Grain 111.75
36.5
id 2`)5
lbs/yr lhs/y
7050-9400 3,7,7,`.
25,550 11,6L-',C
18,250 -
8,400 3,81(
12 6,000 -
2.125- 11,80
29,500
10 5,000
6.25
TOTALS 13.25 1,715.35 259.0 137.0 1,360.0 64.75
28,725-38,300
7,800-10,400
6,975-9,300
2700 -3600
11,200
7,000
285 -475
2,625
3,7506,4753,125
15,320
4,16,
3,72L
1,446 -
5 ,120
3,20!
1,900
1,200
1,250
2,960
510 -850 3,406
9,800 4,486
5625 -7500 3,000
2,975 1,360
15,000 5,000
17,500 8,000
22,350 7,4'>c,
600-800 32
26,075 11,92(;

.. r - ,ir r r-rr1
F;,.,t,l[ri l ,s 1Er?Tái-I;ER ARM ICr. 1,a.Y_.
CROP PESTICIDE. .-2.
D+St, HERBICIDE, 2
DOSAGE2
P205 N`
Alfalfa Ethyl Parathion .25 None 100 15 -25
Corn Methyl Parathion .45 Treflan .50 50 150
Cotton Methyl Parathion 1.0 Prometryne 1.25 40 75 -100
Grain Methyl Parathion .75 None DO 175
Sorghum Diazinon 14 -G 1.0 Dicamba .25 0 125
Pecans None - None
1Contri butors :
Dennis, R.E., R.K. Thompson, A.D. Day, E.B. Jackson, Growing Wheat in Arizona,College of Agriculture, Coop. Ext. Ser., Univ. of Arizona, Tucson, AZ.
Dennis, R.E., et al, Growing Alfalfa in Arizona, College of Agriculture, Coop.Ext. Ser., University of Arizona, Tucson, 1977.
Ibid., Oral communication.
Helms, Dempsey, Written communication.
2lbs /acre
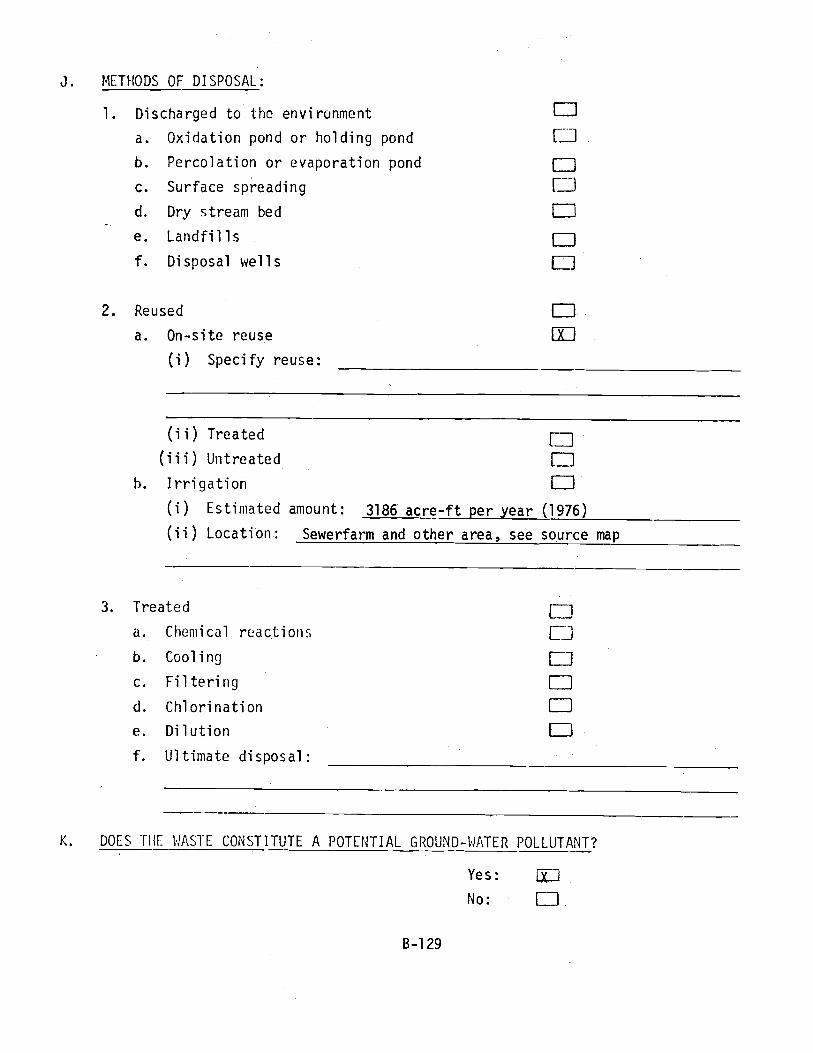
J. METHODS OF DISPOSAL:
1. Discharged to the environment
a. Oxidation pond or holding pond
b. Percolation or evaporation pond
c. Surface spreading
d. Dry stream bed
e. Landfills
f. Disposal wells
2. Reused
a. On -site reuse
(i) Specify reuse:
lx
(ii) Treated
(iii) Untreated
b. Irrigation
n(i) Estimated amount: 3186 acre -ft per year (1976)
(ii) Location: Sewerfarm and other area, see source map
3. Treated
a. Chemical reactions
b. Cooling
c. Filtering
d. Chlorination
e. Dilution
f. Ultimate disposal:
K. DOES THE WASTE CONSTITUTE A POTENTIAL GROUND -WATER POLLUTANT?
Yes:
No:
B-129

STATEWIDE GROUND -WATER MONITORING PLAN
POLLUTION POTENTIAL OF WASTE SOURCES
A. WASTE SOURCE: Non -effluent irrigation, (For distribution of total irrigated acreageand consumptive water use, see Item L.)
3. INDIVIDUAL OR AGENCY PRODUCING OR MANAGING WASTE:
C. LOCATION OF SOURCE:
D. LOCATION SKETCH: See Source Map
E. TYPE OF WASTE: SOLID ED LIQUID
1. Dissolved or microbial
2. Suspended sediment
Ix 1
F. CLASSIFICATION OF WASTE:
1. MUNICIPAL: [il ; Specify
2. AGRICULTURAL: ; Specify
3. INDUSTRIAL: F-1 ; Specify
4. MISCELLANEOUS: I 1 ; Specify
G. ESTIMATED QUANTITY OF WASTE:
Irrigation Volume - 10,700 acre feet /yr in 1976For loading of pesticides and fertilizer see over pageNon -effluent irrigated area - 2141 acres
B-130
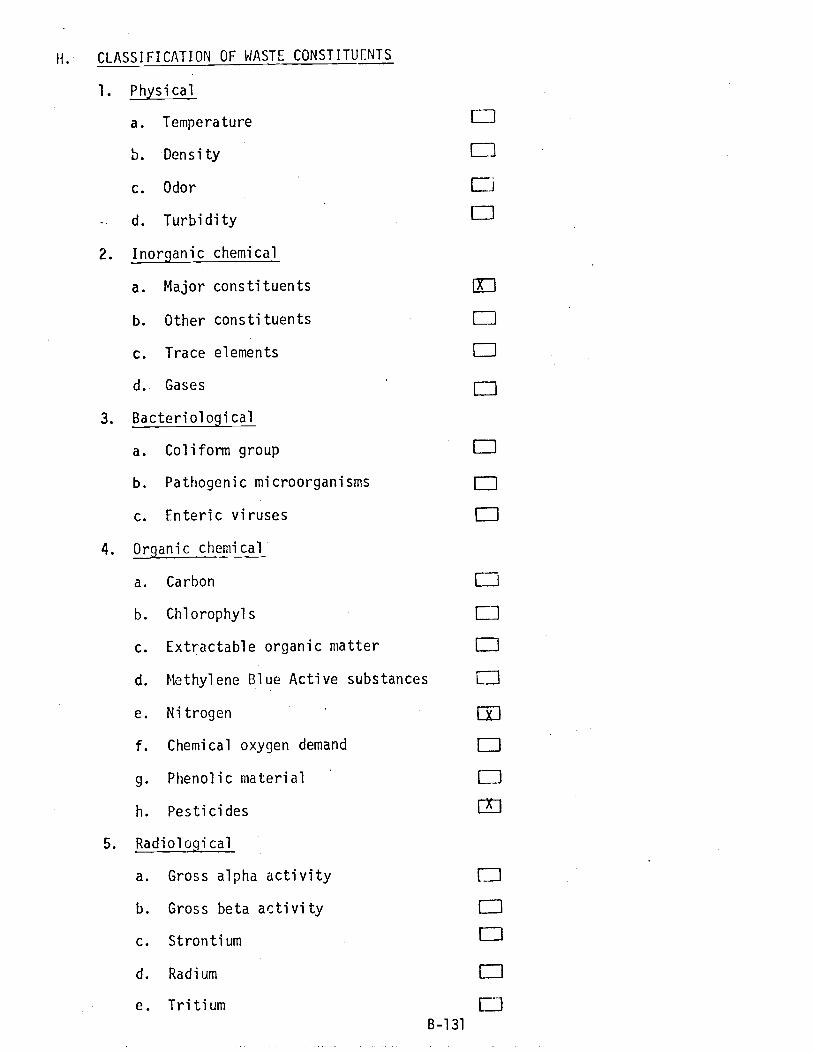
H. CLASSIFICATION OF WASTE CONSTITUENTS
1. Physical
a. Temperature I-J
b. Density Uc. Odor Eid. Turbidity
2. Inorganic chemical
a. Major constituents [71
b. Other constituents ( 1
c. Trace elements
d. Gases
3. Bacteriological
a. Coliform group E]
b. Pathogenic microorganisms []
c. Enteric viruses [D
4. Organic chemical
a. Carbon I
b. Chlorophyls 11
c. Extractable organic matter Eld. Methylene Blue Active substances
e. Nitrogen
f. Chemical oxygen demand
g. Phenolic material
h. Pesticides 1x1
5. Radiological
a. Gross alpha activity [J
b. Gross beta activity
c. Strontium nd. Radium E1
e. Tritium
l
1 1
C_7
B-131

I. REPRESENTATIVE ANALYSES:
Date of analysis: see over page Location:
Major Trace
Calcium mg /1 meq /1 Arsenic mg /1
Magnesium mg /1 meq /1 Barium mg /1
Sodium mg /1 meq /1 Cadmium mg /1
- Potassium mg /1 meq /1 Chromium mg /1
Carbonate mg /1 meq /1 Copper mg /i
Bicarbonate mg /1 meq /1 Cyanide mg /1
Sulfate mg /1 meq /1 Fluoride mg /1
Chloride mg /1 meq /1 Iron mg /1
Nitrate mg /1 meq /1 Lead mg /1
Manganese mg /1
Other ConstituentsMercury mg /1
Nitrate -N mg /7Selenium mg /1
Ammonia -N mg /1Silver mg /1
KJN mg /1Strontium mg /1
Total -N mg /1Zinc mg /1
Specific conductance mg /1
Total dissolved solids mg /1 Microorganisms
pH mg /1 Total coliform #/100m1
Silica mg /1 Fecal coliform # /100m1
Boron mg /1 Fecal Strep. # /100m1
Fluoride mg/1
Phosphorous mg /1
Hardness mg /1
Alkalinity mg /1
B.O.D. mg /1
C.O.D. mg /1
S.S. mg /1
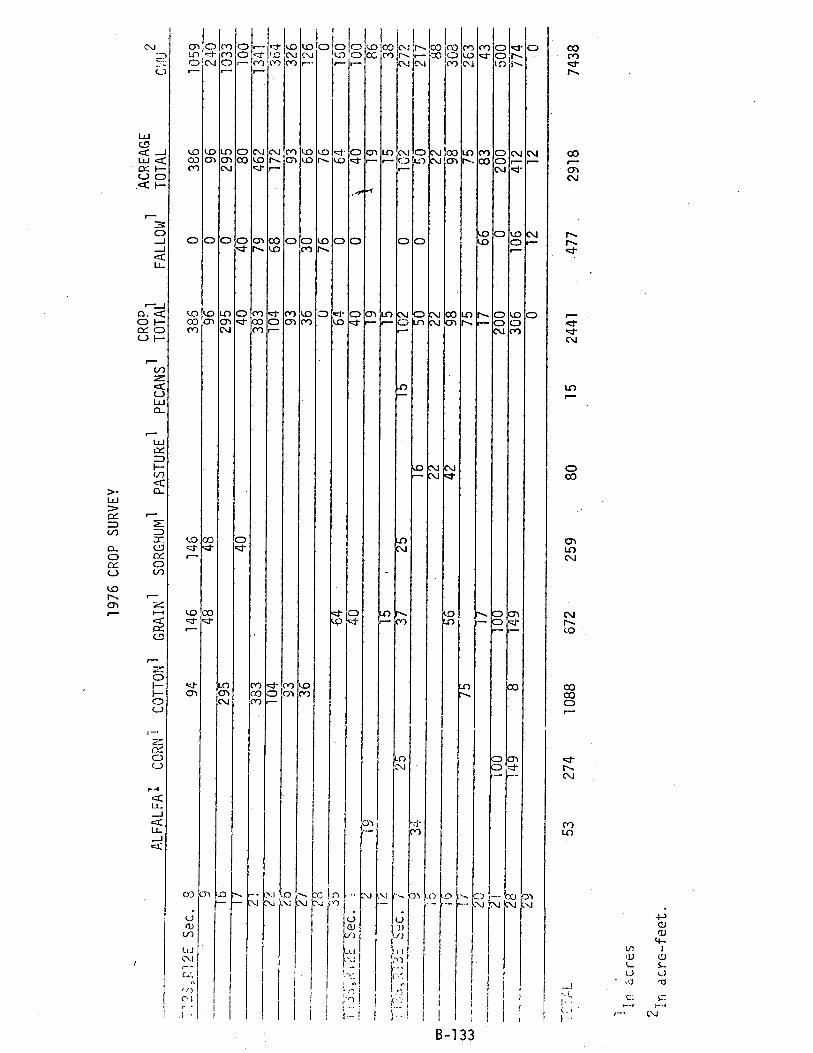
1976
CR
OP
SU
RV
EY
11
-C
RO
P1
1ACREAGE
2A
LFA
LFA
1CORN
CO
TT
ON
1G
RA
IN'
SO
RG
HU
M'
PASTURE
PECANS
TOTAL
FALLOW
TO
TA
LC
;!U
F:12
E S
ec. 8
9414
614
638
50
386
1059
g48
4896
096
240
1629
529
50
295
1033
>/
40.
4040
8010
02i
-.38
338
379
462
1341
104
104
6817
236
493
930
9332
636
3630
6612
60
7676
064
640
6415
0'
4-0
400
40
100
c19
1919
861?
.15
1515
38__
__' 3
=/
2537
2515
102
010
227
2_
9,3=
1650
050
217
i.0
2222
2288
105-
642
9898
308
1/75
7575
263
¿O
1717
6683
4321
100
100
200
020
050
028
----
--T
498
149
306
106
412
774
290
120
27-
z6--
2 35
;...
..,
YY,L
5327
410
8867
225
980
1524
41.4
7729
1874
38
acre
s
21n
acre
-fe
et.
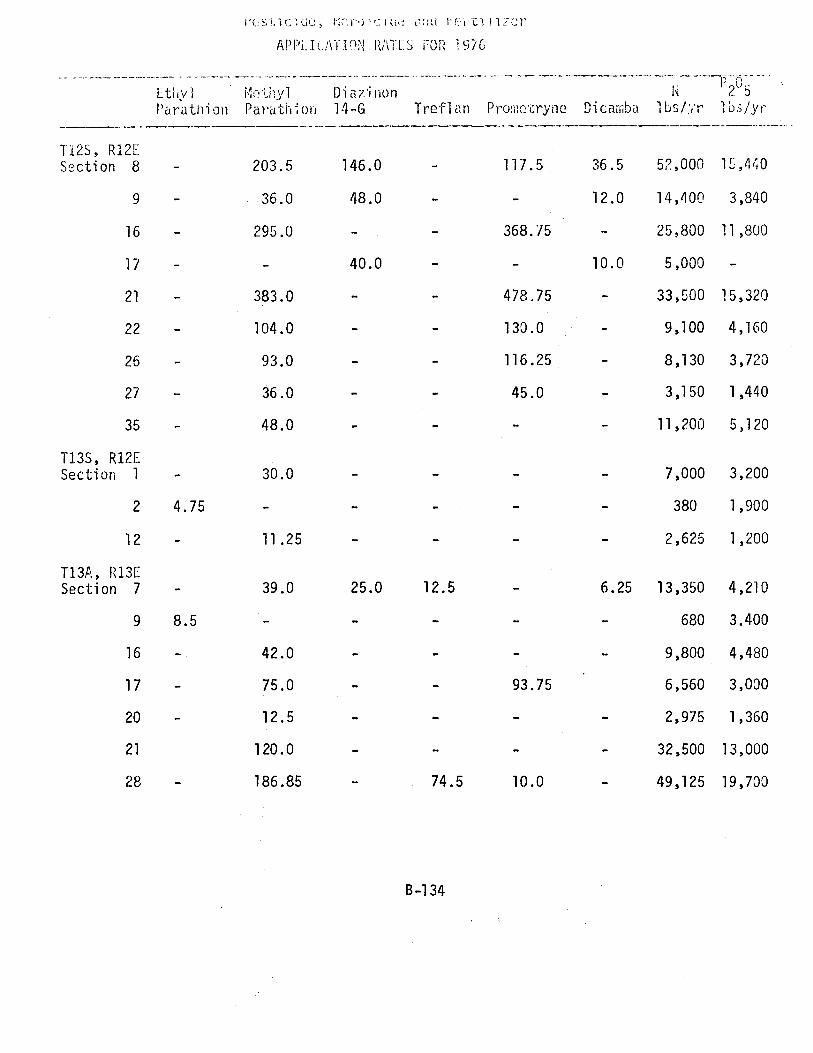
f'(.`:`,I.ÎciGis i,ri
APPi_I(.:'1-(InN RiiTC.S FOR 1976
- _. __ ____------ _ __. __.__ _ _ _.. .
Ethyl
Parathion¡;o:.y1Parati+;orl
Diazirn14-G Treilan Promotryüe Dicamba
W
lbs/:/r
2`71bs/yr
T:i2S, R12E
Section 8 203.5 146.0 117.5 36.5 52,000 1ft,440
9 - 36.0 48.0 - - 12.0 14,400 3,840
16 - 295.0 - 368.75 - 25,800 11,800
17 40.0 - - 10.0 5,000
21 383.0 - 478.75 - 33,500 15,320
22 - 104.0 - 130.0 9,100 4,160
26 93.0 116.25 - 8,130 3,720
27 - 36.0 45.0 3,150 1,440
35 - 48.0 11,200 5,120
T13S, R12ESection 1 30.0 - - 7,000 3,200
2 4.75 - 380 1,900
12 - 11.25 - 2,625 1,200
T13A, R13ESection 7 39.0 25.0 12.5 6.25 13,350 4,210
9 8.5 - - 680 3.400
16 - 42.0 - 9,800 4,480
17 75.0 - 93.75 6,560 3,000
20 - 12.5 - 2,975 1,360
21 120.0 - - 32,500 13,000
28 - 186.85 - 74.5 10.0 49,125 19,700
B-134
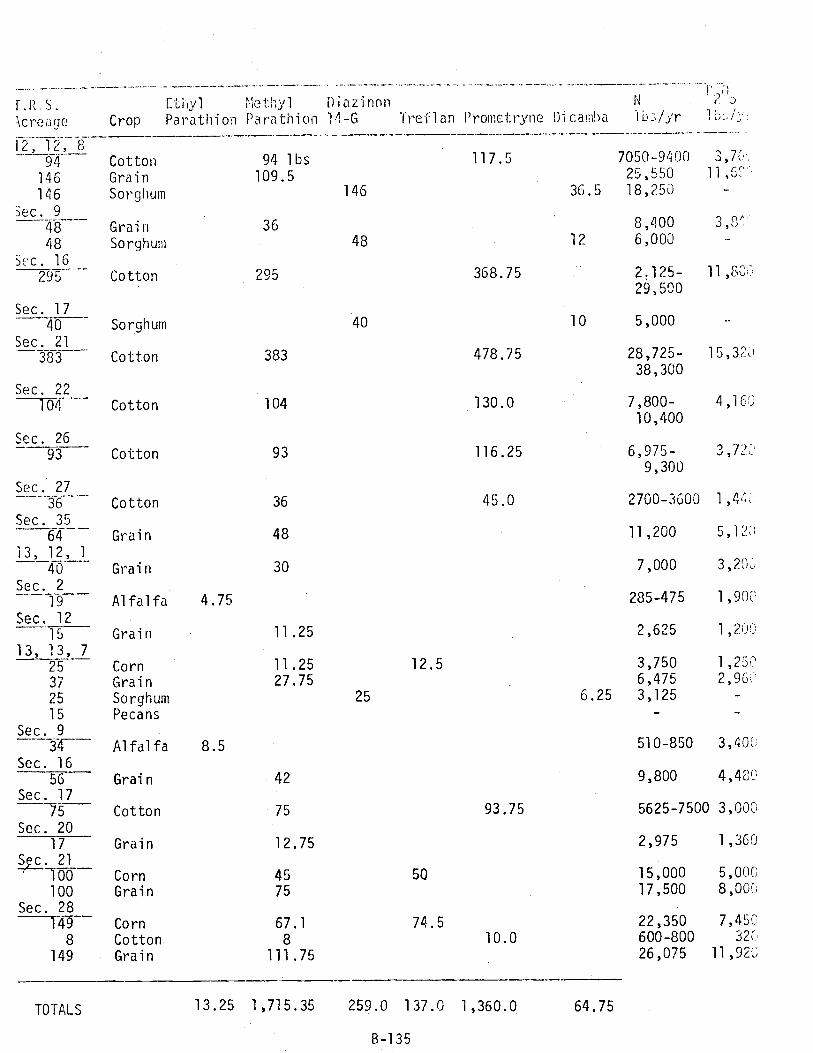
F.1Z,S.
kreage
12, 12, 8
146
146
Sec. 9
4848
Sec. 16295
Sec. 1740
Sec. 21363
Sec. 22104
Sec. 2693
Sec. 2736
Sec. 3564
13, 12, 1
Sec. 2
l9
Sec. 1215
13, 13, 725
37
25
15
Sec. 934
Sec. 1656
Sec. 1775
Sec. 2017
Sec. 21100100
Sec. 28
8
149
Ethyl Methyl D i azi non N t",'Crop Parathion Parathion 14 -G Teeflan Prometryne Dicamba
Cotton 94 lbs
Grain 109.5
Sorghum
Grain 36
Sorghum
Cotton 295
Sorghum
Cotton 383
Cotton 104
Cotton 93
Cotton 36
Grain 48
Grain 30
Alfalfa 4.75
Grain 11.25
Corn 11.25
Grain 27.75
SorghumPecans
Alfalfa 8.5
Grain 42
Cotton 75
Grain 12.75
Corn 45
Grain 75
Corn 67.1
Cotton 8
Grain 111.75
146
43
40
25
12.5
50
74.5
117.5
368.75
478.75
130.0
116.25
45.0
93.75
10.0
7050-9400 3,7íe:25,550 11,6,fl:-
36.5 18,250
8,40012 6,000
'1 (1;.,
2;125- 11,800
29,500
10 5,000
28,725-38,300
7,800-10,400
6,975-9,300
15,320
4,160
3,720
2700 -3600 1,44;
11,200
7,000
285 -475
2,625
3,7506,475
6.25 3,125
TOTALS 13.25 1,715.35 259.0 137.0 1,360.0 64.75
B -135
,2r'2,960
510 -850 3,400
9,800 4,480
5625 -7500 3,000
2,975 1,360 .
15,000 5,000
17,500 8,000
22,350 7,450600 -800 320
26,075 11,920
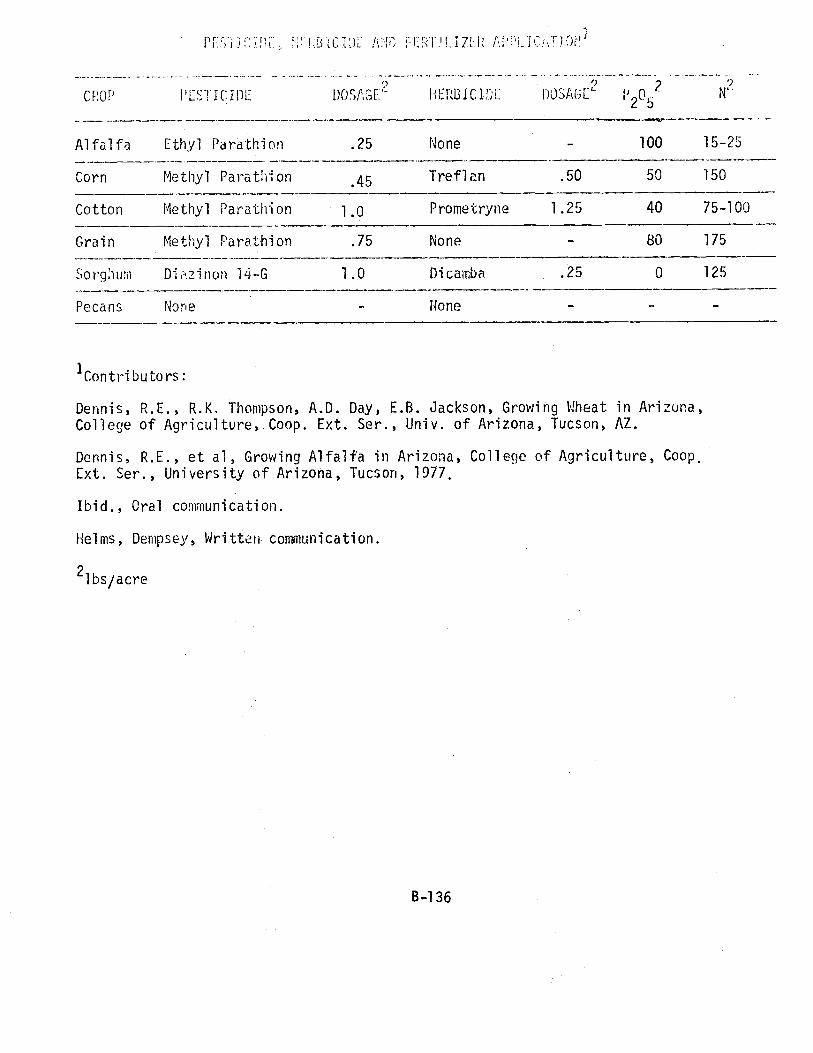
PES))C*J1.1L, I...RBTCIDL FLMJLI7FR fLIÇTJOM
.? 9
CROP PESTICIDE DOSAGE'9
HERBICIDE DOSAGL' P2052 N-
______-
Alfalfa Ethyl Parathion .25 None - 100 15-25
Corn Methyl Parathion .45 Treflan .50 50 150
Cotton Methyl Parathion 1.0 Prometryne 1.25 40 75-100
Grain Methyl Parathion .75 None 80 175
Sorghum Dizinon 14-G 1.0 Dicamba .25 0 125
Pecans None None
1Contributors:
Dennis, R.E., R.K. Thompson, A.D. Day, E.B. Jackson, Growing Wheat in Arizona,College of Agriculture, Coop. Ext. Ser., Univ. of Arizona, Tucson, AZ.
Dennis, R.E., et al, Growing Alfalfa in Arizona, College of Agriculture, Coop.Ext. Ser., University of Arizona, Tucson, 1977.
Ibid., Oral communication.
Helms, Dempsey, Written communication.
2lbs/acre

O. METHOD`_' OF CISPOSA.L:
i. Discharge; to the environment
... UW.idatiun pend or holding pond
b. Percolation or evaporation pond
r,. Surface spreading 00'. Dry stream bed Cle. Landfills C]
i; sposal wells
g. Other (irrigated water)
.... i4,:flt'd
a. On -site reuse
(i) Specify reuse:
(ii) Treated
(ii;) Untreated
h. Irrigation
(i) Estimated amount:
(ii) Location:
3. Trcr,.ted
a. Chemical reactions
b. Cooling
c. Filtering
d. Chlorination
e. Dilution
f. Ultimate disposal:
K. DOES THE WASTE CONSTITUTE A POTENTIAL GROUND -WATER POLLUTANT?
Yes:
No:
B-137

STATEWIDE GROUND -WATER MONITORING PLAN
POLLUTION POTENTIAL OF WASTE SOURCES
Sand and Gravel Operation
A. WASTE SOURCE:
P. INDIVIDUAL OR AGENCY PRODUCING OR MANAGING WASTE:Concrete Sand & Gravel
C. LOCATION OF SOURCE:
D. LOCATION SKETCH:
(D-12-12) 35 ddd
E. TYPE OF WASTE: SOLID LIQUID n Gravel wash water
1. Dissolved or microbial
2. Suspended sediment
F. CLASSIFICATION OF WASTE:
1. MUNICIPAL: ED ; Specify
2. AGRICULTURAL: ; Specify
3. INDUSTRIAL: %1 ; Specify Gravel pit effluent
4. MISCELLANEOUS: { 7 ; Specify
G. ESTIMATED QUANTITY OF WASTE:
Unknown
B-138

H. CLASSIFICATION OF WASTE CONSTITUENTS
1. Physical
a. Temperature
b. Density L_)
c. Odor CJ
d. Turbidity [xi
2. Inorganic chemical
a. Major constituents ix i
b. Other constituents
c. Trace elements
d. Gases
3. Bacteriological
a. Coliform group L)
b. Pathogenic microorganisms
c. Enteric viruses
4. Organic chemical
a. Carbon
b. Chlorophyls Elc. Extractable organic matter f`]
d. Methylene Blue Active substances C-1
e. Nitrogen nf. Chemical oxygen demand L1
g. Phenolic material Lh. Pesticides
5. Radiological
a. Gross alpha activity
b. Gross beta activity
c. Strontium
I I
d. Radium
e. Tritium8-139
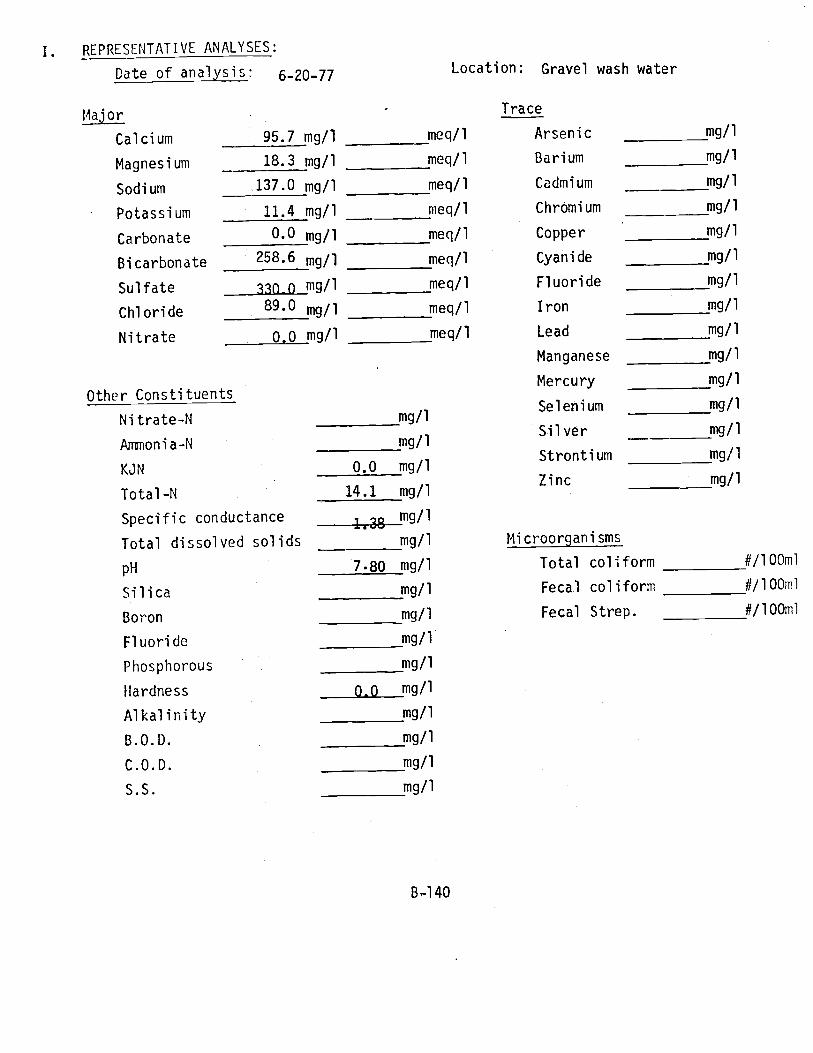
I. REPRESENTATIVE ANALYSES:
Date of analysis: 6 -20 -77Location: Gravel wash water
Major Trace
Calcium 95.7 mg /1 meq /1 Arsenic mg /1
Magnesium 18.3 mg /1 meq /1 Barium mg /1
Sodium 137.0 mg /1 meq /1 Cadmium mg /1
Potassium 11.4 mg /1 meq /1 Chromium mg /1
Carbonate 0.0 mg /1 meq /1 Copper mg /1
Bicarbonate 258.6 mg /1 meq /1 Cyanide mg /1
Sulfate 330.0 mg /1 meq /1 Fluoride mg /1
Chloride89.0 mg /1 meq /1 Iron mg /1
Nitrate 0.0 mg /1 meq /1 Lead mg /1
Manganese mg /1
Other ConstituentsMercury mg/1
Nitrate -N mg /ISelenium mg /1
Ammonia -N mg /1Silver mg /1
KJN 0.0 mg /1Strontium mg /1
Total -N 14.1 mg /1Zinc mg /1
Specific conductance 1.38mg/1
Total dissolved solids mg /1
pH 7.80 mg /1
Silica mg /1
Boron mg /1
Fluoride mg /1
Phosphorous mg /1
Hardness 0.0 mg /1
Alkalinity mg /1
B.O.D. mg /1
C.O.D. mg /1
S.S. mg /1
B-140
Microorganisms
Total coliform # /100m1
Fecal coliform # /100m1
Fecal Strep. # /100m1

v. FHODS OF DISPOSAL:
1. Discharged to the environment FT()
:. Oxidation pond or holding pond E -'
i'. PPrcolation or evaporation pond LJr.. Surface spreading l
:;. Dry stream bed C-x
1. l.andfi 11 s
Ti sposa i wells EJ
Ret.aed
On -site reuse
(i) Specify reuse:
(ii) Treated
(iii) Untreated
L. Irr gation
(i) Estimated amount:
(ii) Location:
LL 1
3. Treated
a. Chemical reactions
b. Cooling
c. Filtering
d. Chlorination
e. iiilution
f. Ultimate disposal:
F-1
LJnEDLJL_J.
K. DOES THE WASTE CONSTITUTE A POTENTIAL GROUND -WATER POLLUTANT?
Yes:
No:
6 -141

STATEWIDE GROUND -WATER MONITORING PLAN
POLLUTION POTENTIAL OF WASTE SOURCES
A. WASTE SOURCE:
B. INDIVIDUAL OR AGENCY PRODUCING OR MANAGING WASTE: Tucson Rock and Sand, Tanner Co.
C. LOCATION OF SOURCE: (D- 13 -13) 6 cc
D. LOCATION SKETCH:
E. TYPE OF WASTE: SOLID LIQUID C,c
1. Dissolved or microbial
2. Suspended sediment (L
F. CLASSIFICATION OF WASTE:
1. MUNICIPAL: Q ; Specify
2. AGRICULTURAL: ; Specify
3. INDUSTRIAL: ; Specify
4. MISCELLANEOUS: il ; Specify
G. ESTIMATED QUANTITY OF WASTE:
Not known: well water used as wash and process water in gravel sand operation.
B-142

i. CLASSIFICATION OF MASTE CONTITFNTS
1. rwi,Aral_1- .-
a. Temperature
b. Density E:D
c. Odor
d. Turbidity
2. Inorganic chemical
a. Major constituents
b. Other constituentsr-n
c. Trace elements
d. GasesF-1
3. Bacteriological
a. Coliform group Elb. Pathogenic microorganisms F-1
C. Enteric viruses
4. Organc chemical
a. Carbon EJ
b. Chlorophyls F-1
C. Extractable organic matter EJ
d. Methylene Blue Active substances Ele. Nitrogen r-1
f. Chemical oxygen demand F-1
g. Phenolic material
h. Pesticides EJ
5. Radiological
a. Gross alpha activity [.]
b. Gross beta activity
c. Strontium
d. Radium
e. TritiumB-143

I. REPRESENTATIVE ANALYSES: Ná available
Date of analysis: Location:
Major Trace
Calcium mg /1 meq /1 Arsenic mg /1
Magnesium mg /1 meq /1 Barium mg /1
Sodium mg /1 meq /1 Cadmium mg /1
Potassium mg /1 meq /1 Chromium mg /1
Carbonate mg /i meq /1 Copper mg /1
Bicarbonate mg /1 meq /1 Cyanide mg/1
Sulfate mg /1 meq /1 Fluoride mg /1
Chloride mg /1 meq /1 Iron mg /1
Nitrate mg /1 meq /1 Lead mg /1
Manganese mg /1
Other ConstituentsMercury mg /1
Nitrate -N mg /1Selenium mg /1
Ammonia -N mg /1Silver mg /1
UN mg /1Strontium mg /1
Total -N mg /1Zinc mg /1
Specific conductance mg /1
Total dissolved solids mg/1 Microorganisms
pH mg /1 Total coliform #/100m1
Silica mg /1 Fecal coliform #/100m1
Boron mg/1 Fecal Strep. #/100m1
Fluoride mg /1
Phosphorous mg /1
Hardness mg /1
Alkalinity mg /1
B.O.D. mg /1
C.O.D. mg /1
S.S. mg /1

J. METHODS OF DISPOSAL:
1. Discharged to the environment Íß.j
a. Oxidation pond or holding pond (7;1
b. Percolation or evaporation pond
c. Surface spreading
ct. Dry stream bed
e. Landfills
f. Disposal wells E -
2. Reused r
a. On -site reuse ED(i) Specify reuse: Reused as wash water
(ii) Treated
(iii) Untreated
b. Irrigation
(i) Estimated amount:
(ii) Location:
(
n
3. Treated
a. Chemical reactions
b. Cooling
c. Filtering
d. Chlorination
e. Dilution
f. Ultimate disposal:
1 1
L_J
[
K. [)OES THE WASTE CONSTITUTE A POTENTIAL GROUND -WATER POLLUTANT?
Yes:
No: i xl

STATEWIDE GROUND -WATER MONITORING PLAN
POLLUTION POTENTIAL OF WASTE SOURCES
A. WASTE SOURCE: Tucson Gas and Electric Company cooling tower blowdowneffluent
3. INDIVIDUAL OR AGENCY PRODUCING OR MANAGING WASTE: Tucson Gas and Electric
Company, recharged by Water Resource Research Center, U. of A.
. LOCATION OF SOURCE: (D713-13) 34 acc
D. LOCATION SKETCH: See over page
E. TYPE OF WASTE: SOLID I 1 LIQUID n
F. CLASSIFICATION OF WASTE:
1. MUNICIPAL: [¡1 ;
2. AGRICULTURAL: F-7
3. INDUSTRIAL: fX ;
4. MISCELLANEOUS: f ;
G. ESTIMATED QUANTITY OF WASTE:
100 to 400 gpm
I. Dissolved or microbial LXJ
2. Suspended sediment
Specify
Specify
Specify Cooling tower blowdown effluent
Specify
B-146
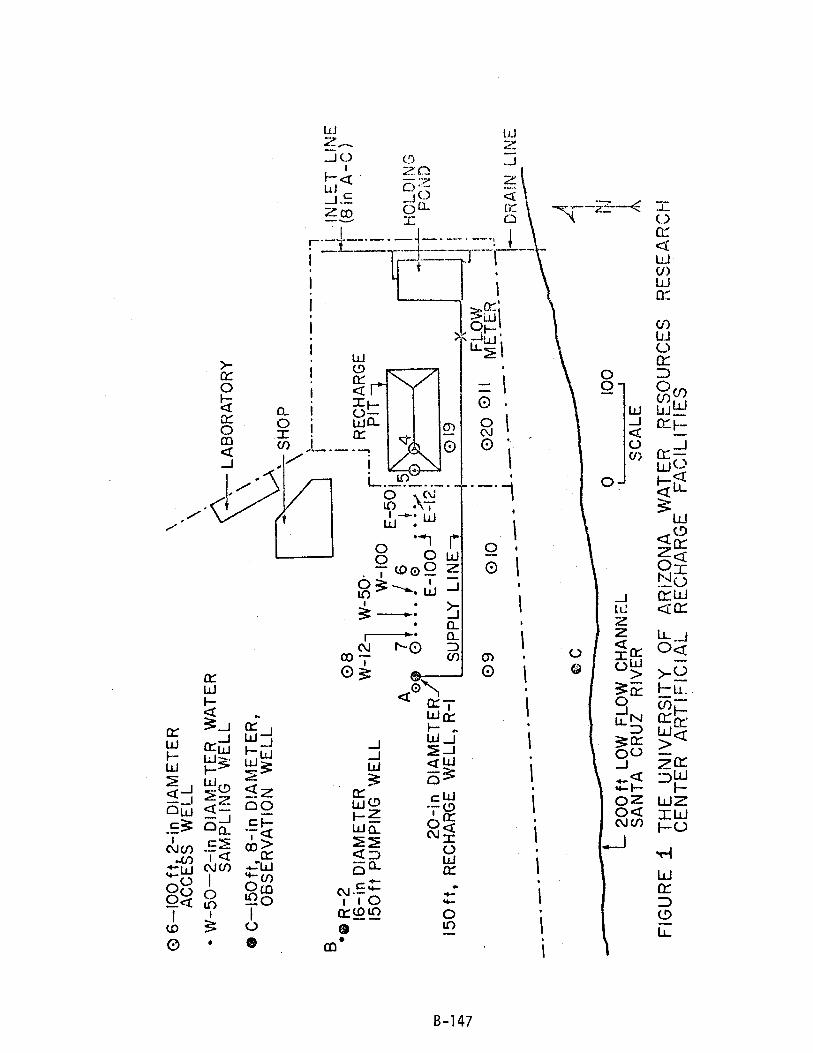
0 6
-100
ft 2
-in
DIA
ME
TE
RA
CC
ES
S W
ELL
W-
50 -
2 -in
DIA
ME
TE
R W
AT
ER
SA
MP
LIN
G W
ELL
® C
- I5
0ft,
8 -in
DIA
ME
TE
R,
OB
SE
RV
AT
ION
WE
LL
B
- LA
BO
RA
TO
RY
'SH
OP
0 R
-2
16 -
in D
IAM
ET
ER
W8-
12W
-50
._
j RE
CH
AR
GE
150
ft P
UM
PIN
G W
ELL
rP
IT
71
j 6W -
100
E¡5
0jA
oo
;9I
20 -
in D
IAM
ET
ER
.E
-10
0T
E -
12i
150
ft, R
EC
HA
RG
E W
ELL
, R -
IS
UP
PLY
LI N
EB
Q19
0901
0
r
FLO
W02
0 01
1M
ET
E;
.
- D
RA
IN L
INE
INE
100
E
,CS
GA
LE
i ïLD
INV
PON
D
L20
0 f t
LO
W F
LOW
CH
AN
NE
LS
AN
TA
CR
UZ
RIV
ER
FIG
UR
E 1
TH
E U
NIV
ER
SIT
Y O
F A
RIZ
ON
A W
AT
ER
RE
SO
UR
CE
S R
ES
EA
RC
HC
EN
TE
R A
RT
IFIC
IAL
RE
CH
AR
GE
FA
CIL
ITIE
S

H. CLASSIFICATION OF WASTE CONSTITUENTS
1. Physical
a. Temperature
b. Density
c. Odor
d. Turbidity
2. Inorganic chemical
a. Major constituents
b. Other constituents
c. Trace elements
d. Gases
3. Bacteriological
a. Coliform group
b. Pathogenic microorganisms
c. Enteric viruses
4. Organic chemical
a. Carbon I 1
b. Chlorophyls
c. Extractable organic matter
d. Methylene Blue Active substances Li
e. Nitrogen
f. Chemical oxygen demand
g. Phenolic material [_]
h. Pesticides
5. Radiological
a. Gross alpha activity
Ei
n
l l
b. Gross beta activity
c. Strontium
d. Radium
e. TritiumB-148
F-1

TABLE ;>.
COMPLETI: ANALYSES OF SAMPLES OF EFFLUENTSUPPLY AND FROM WELLS R-1, R-2 AND DOMESTIC WELL
EFFLUENTSUPPLY
WELLR -1
WELLR -2 DOMESTIC WELL
9/4/74 9/4/74 9/4/74 2/28/69 9/4/74
Soluble Salt (mg/ 1) 2245 2158 2100 947 1233
ECX103 4.8 3.75 2.82 1.2 1.7
Calcium (mg /1) 148 282 278 104 166
Magnesium (mg /1) 33.6 15.6 21.6 19 51.6
Sodium (mg /1) 700 385 350 156 208
Chloride (mg /1) 342 344 328 140 158
Sulfate (mg /1) 925 882 906 340 405
Carbonate (mg /1). 0 0 0 0 0
Bicarbonate (mg /1) 49 117 176 171 227
Nitrate (mg /1) 44.7 28.5 36.3 17.0 14.4
pH 6.8 7.0 7.3 7.3 7.6
Hardness (gr /gal) 769 783 338 626
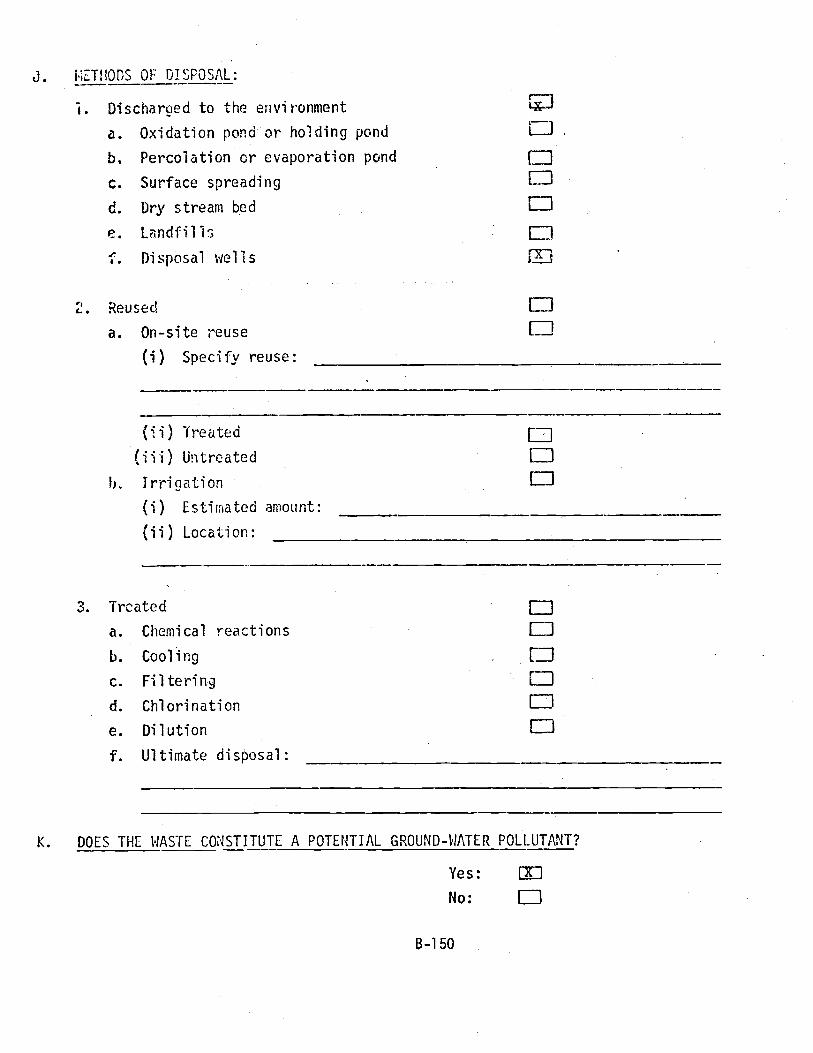
J. METHODS OF DISPOSAL:
ï. Discharged to the environnent
a. Oxidation pond or holding pond EJ .
b. Percolation or evaporation pond
c. Surface spreading ED
d. Dry stream bed 0e. Landfill;
f. Disposal wells
Reused
a. On -site reuse EJ
(i) Specify reuse:
(ii) Treated
(iii) Untreated
b. Irrigation
(i) Estimated amount:
(ii) Location:
E3
3. Treated EJa. Chemical reactions E!b. Cooling EJ
c. Filtering E_)
d. Chlorination Üe. Dilution EJf. Ultimate disposal:
K. DOES THE WASTE CONSTITUTE A POTENTIAL GROUND -WATER POLLUTANT?
Yes: EI]
No: OB-150

STATEWIDE GROUND -WATER MONITORING PLAN
POLLUTION POTENTIAL OF WASTE SOURCES
A. WASTE SOURCE: Wells in Source Area
INDIVIDUAL OR AGENCY PRODUCING OR MANAGING WASTE:
LOCATION OF SOURCE:
D. LOCATION SKETCH:
(D-12-12) 8, abd8, bbb.
8, cbc8, dba16,bba16,bdc16,ddd17,aad17,ddc17,ddd20,baa20,cad20,dcd
22,bba22,bbd22,dcd22,ddb25,cca26,bca26,cba
See Well Location Map
(D-12-12) 26,dba26,dbd27,cbb
33,aca33,dad34,baa35,add36,add36,cbc36,cdc36,ddc
(D- 13 -12) 1,bda
(D- 13 -13) 5,ccb
(D- 13 -13) 7,dda8,baa8,cdd8,cda
17,acc17,acc17,acc17,acc17,dba17,dba17,ddc18,aca18, cad
21,cbd21,dcc27,ccd
E. TYPE OF WASTE: SOLID F-1 LIQUID
1. Dissolved or microbial
2. Suspended sediment
F. CLASSIFICATION OF WASTE:
1. MUNICIPAL: ; Specify
2. AGRICULTURAL: L ; Specify
3. INDUSTRIAL: [ 1 ; Specify
4. MISCELLANEOUS: Ix! ; Specify Leakage into well
G. ESTIMATED QUANTITY OF WASTE:
Unknown
B-151
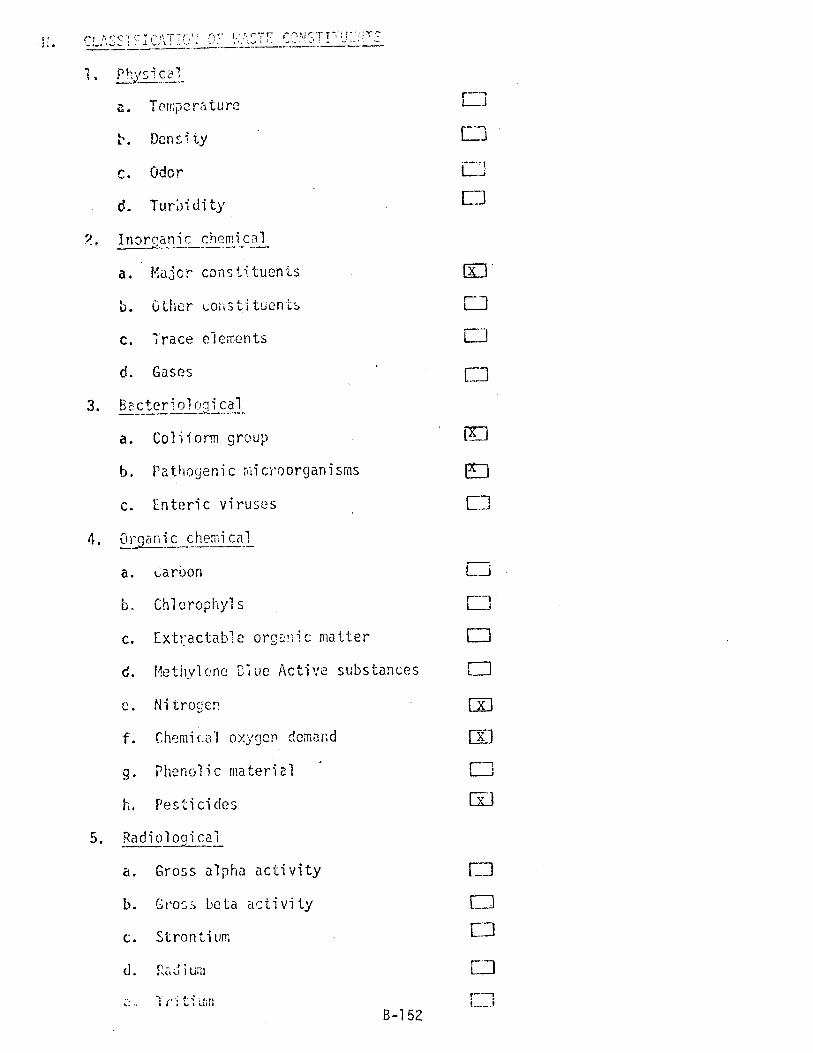
Y ^
e6-.
_a%
. ? ry
fi i . C.-....._
a. Temperature
Density
C. Odor
d. Turmidit`y,
Inorganic chemical
a. Major constituents
b. Other Lohstï tuenïs
c. Trace elements
d. Gases
3. Bcteri ol ;pi cal
a. Coliform group
b. Pathogenic microorganisms
c. Enteric viruses
4. Oh anic chemical
a. carbon
b. Chlcrophyl s
c. Extractable org r;ic matter
d. Methylene Eöue Active substances
e. Nitrogen
f. Chemical oxygen demand
g. Phenolic material
h. Pesticides
5. Radiological
a. Gross alpha activity
b. Gloss beta activity
c. Strontium
d. «Blum
. i ti Lim
B-152
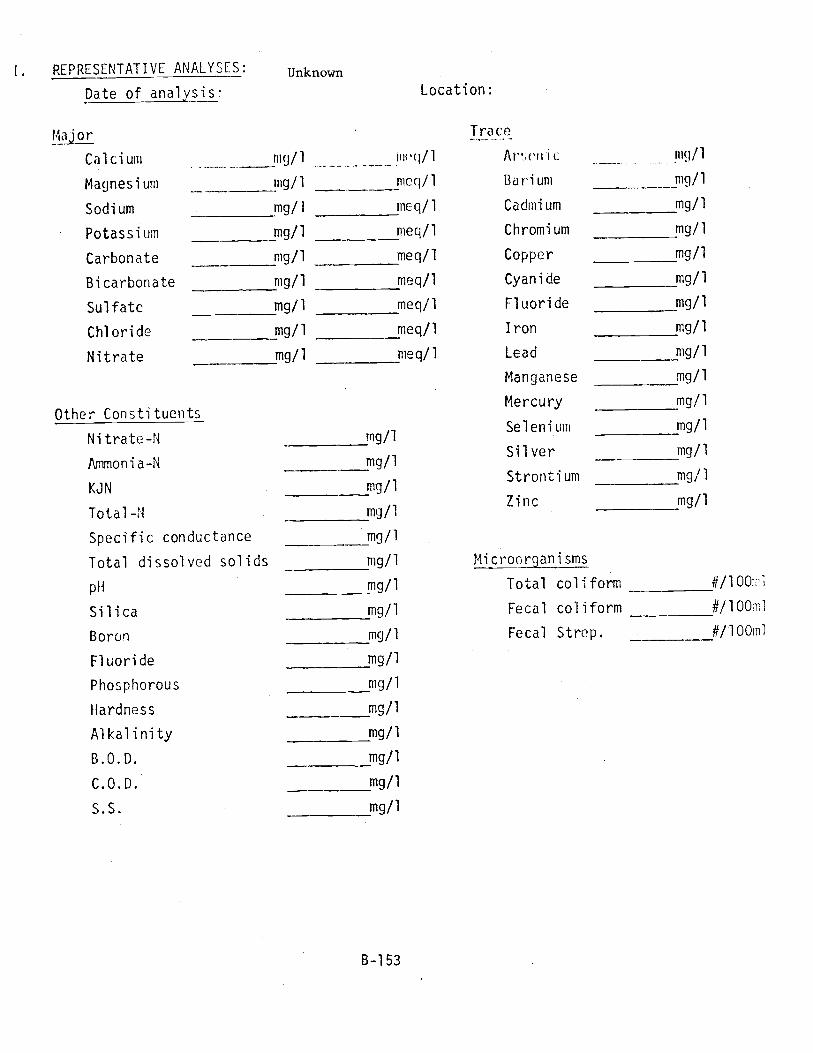
[. REPRESENTATIVE ANALYSES: Unknown
Date of analysis? Location:
Major Trace
Calcium mg /1 -moq /1 A' 'riic .... mq /1
Magnesium mg /1 meq /1 Barium mg /1
Sodium mg /1 meq /1 Cadmium mg /1
Potassium mg /1 meq /1 Chromium mg /1
Carbonate mg /1 meq /1 Copper mg /1
Bicarbonate mg /1 meq /1 Cyanide mg /i
Sulfate mg /1 meq /1 Fluoride mg /1
Chloride mg /1 meq /1 Iron mg /1
Nitrate mg /1 meq /1 Lead mg /1
Manganese mg /1
Other ConstituentsMercury mg /1
Nitrate -N mg /1Selenium mg /1
Ammonia -N mg /1Silver mg /1
KJN mg /1Strontium mg /1
Total -N mg /1 Zinc mg /1
Specific conductance mg /1
Total dissolved solids mg /1 Microorganisms
pH mg /1 Total coliform # /100m1
Silica mg /1 Fecal coliform # /100m1
Boron mg /1 Fecal Strep. #/100m1
Fluoride mg /1
Phosphorous mg /1
Hardness mg /1
Alkalinity mg /1
B.O.D. mg /1
C.O.D.- mg /1
S.S. mg /1

J. METW^S OF DISPOSAL:
E. Discharged to the environment
a. Oxidation pond or holding pond
b. Percolation or evaporation pond ED
c. Surface spreading [
d. Dry stream bed te. Landfills []z=. Ci sposal wells L_J
g. Other (Leakage into wells.) X
" Reused I...
a. -On -site reuse [(i) Specify reuse:
(ii) Treated
(iii) Untreated
b. Irrigation
(i) Estimated amount:
(ii) Location:
3.
ED
Treated
a. Chemical reactions
b. Cooling
c. Filtering
d. Chlorination.
e. Dilution
f. Ultimate disposal:
K. DOES THE WASTE CONSTITUTE A POTENTIAL GROUND -WATER POLLUTANT?
Yes: Ix J
No: O
B-154

APPENDIX C
WELL INVENTORY OF THE STUDY AREA
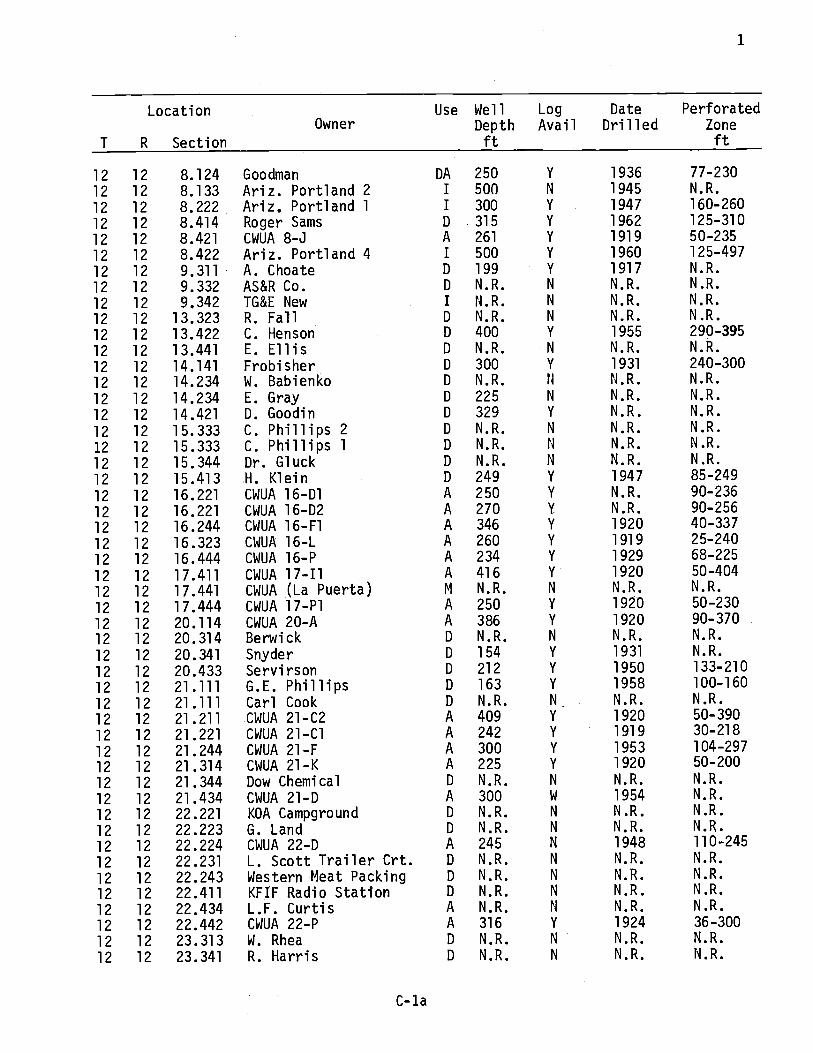
1
T R
Location
SectionOwner
Use Well
Depthft
LogAvail
DateDrilled
PerforatedZoneft
12 12 8.124 Goodman DA 250 Y 1936 77-230
12 12 8.133 Ariz. Portland 2 I 500 N 1945 N.R.
12 12 8.222 Ariz. Portland 1 I 300 Y 1947 160-260
12 12 8.414 Roger Sams D .315 Y 1962 125-310
12 12 8.421 CWUA 8-J A 261 Y 1919 50-235
12 12 8.422 Ariz. Portland 4 I 500 Y 1960 125-497
12 12 9.311 A. Choate D 199 Y 1917 N.R.
12 12 9.332 AS&R Co. D N.R. N N.R. N.R.
12 12 9.342 TG&E New .I N.R. N N.R. N.R.
12 12 13.323 R. Fall D N.R. N N.R. N.R.
12 12 13.422 C. Henson D 400 Y 1955 290-395
12 12 13.441 E. Ellis D N.R. N N.R. N.R.
12 12 14.141 Frobisher D 300 Y 1931 240-300
12 12 14.234 W. Babienko D N.R. N N.R. N.R.
12 12 14.234 E. Gray D 225 N N.R. N.R.
12 12 14.421 D. Goodin D 329 Y N.R. N.R.
12 12 15.333 C. Phillips 2 D N.R. N N.R. N.R.
12 12 15.333 C. Phillips 1 D N.R. N N.R. N.R.
12 12 15.344 Dr. Gluck D N.R. N N.R. N.R.
12 12 15.413 H. Klein D 249 Y 1947 85-249
12 12 16.221 CWUA 16-D1 A 250 Y N.R. 90-236
12 12 16.221 CWUA 16-D2 A 270 Y N.R. 90-256
12 12 16.244 CWUA 16-F1 A 346 Y 1920 40-337
12 12 16.323 CWUA 16-L A 260 Y 1919 25-240
12 12 16.444 CWUA 16-P A 234 Y 1929 68-225
12 12 17.411 CWUA 17-I1 A 416 Y 1920 50-404
12 12 17.441 CWUA (La Puerta) M N.R. N N.R. N.R.
12 12 17.444 CWUA 17-P1 A 250 Y 1920 50-230
12 12 20.114 CWUA 20-A A 386 Y 1920 90-370
12 12 20.314 Berwick D N.R. N N.R. N.R.
12 12 20.341 Snyder D 154 Y 1931 N.R.
12 12 20.433 Servirson D 212 Y 1950 133-210
12 12 21.111 G.E. Phillips D 163 Y 1958 100-160
12 12 21.111 Carl Cook D N.R. N. N.R. N.R.
12 12 21.211 CWUA 21-C2 A 409 Y 1920 50-390
12 12 21.221 CWUA 21-C1 A 242 Y 1919 30-218
12 12 21.244 CWUA 21-F A 300 Y 1953 104-297
12 12 21.314 CWUA 21-K A 225 Y 1920 50-200
12 12 21.344 Dow Chemical D N.R. N N.R. N.R.
12 12 21.434 CWUA 21-D A 300 W 1954 N.R.
12 12 22.221 KOA Campground D N.R. N N.R. N.R.
12 12 22.223 G. Land D N.R. N N.R. N.R.
12 12 22.224 CWUA 22-D A 245 N 1948 110-245
12 12 22.231 L. Scott Trailer Crt. D N.R. N N.R. N.R.
12 12 22.243 Western Meat Packing D N.R. N N.R. N.R.
12 12 22.411 KFIF Radio Station D N.R. N N.R. N.R.
12 12 22.434 L.F. Curtis A N.R. N N.R. N.R.
12 12 22.442 CWUA 22-P A 316 Y 1924 36-300
12 12 23.313 W. Rhea D N.R. N N.R. N.R.
12 12 23.341 R. Harris D N.R. N N.R. N.R.
C-la

2
T R
Location
SectionOwner
Use Well
Depthft
LogAvail
DateDrilled
PerforatedZone
ft
12 12 23.344 B. Terrell D N.R. N N.R. N.R.
12 12 23.431 H. Saunders D N.R. N N.R. N.R.
12 12 25.143 A. Davis D N.R. N N.R. N.R.
12 12 25.232 H. L.Davis D N.R. N N.R. N.R.
12 12 25.233 Hartman D 340 Y . 1966 219-319
12 12 25.234 Gilles D N.R. N N.R. N.R.
12 12 25.313 CWUA 25-K A 238 Y 1942 80-224
12 12 25.443 J. Crawford D N.R. N N.R. N.R.
12 12 26.142 Shamrock Hill Farm D 344 Y 1965 112-344
12 12 26.242 CWUA 26-E A 312 Y 1938 71-280
12 12 26.321 Dow Chemical (Antel) D N.R. N N.R. N.R.
12 12 26.241 CWUA 26-J2 A 248 Y 1922 60-24012 12 26.423 M. Konklin D N.R. N N.R. N.R.
12 12 26.424 CWUA 26-53 A 250 Y 1923 70-245
12 12 27.232 R. Cockey D N.R. N N.R. N.R.
12 12 27.233 J. Acosta D N.R. N N.R. N.R.
12 12 27.322 Lane Johnson D 180 Y 1958 110-18012 12 27.322 CWUA 27-L A 236 Y N.R. 65-208
12 12 28.143 Lil Abner's (L. Lewis) D N.R. N N.R. N.R.
12 12 29.214 David Cutler D N.R. N N.R. N.R.
12 12 29.244 Lazy K-Bar (Krah) D 250 Y 1954 150-245
12 12 29.423 W. Allen 1 Blackarrow D 212 Y 1947 N.R.
12 12 29.431 W. Allen 2 D N.R. N N.R. N.R.
12 12 29.444 J. E. Norton D N.R. N N.R. N.R.
12 12 33.131 Neiheisel D 230 Y N.R. N.R.
12 12 33.141 C. D. Miller D N.R. N N.R. N.R.
12 12 33.231 Rielly D. N.R. N N.R. N.R.
12 12 33.244 0. Cooke 1 D 301 Y N.R. 144-30112 12 33.314 K. K. Koempfer D 520 Y 1964 240-52012 12 33.334 Mrs. Konklin D 210 Y 1938 N.R.
12 12 33.414 Sahuaro Vista Ranch D 390 Y 1954 75-32712 12 33.423 G. Bingham D N.R. N N.R. N.R.
12 12 34.211 Redemptorist Fathers M 376 Y 1965 105-21012 12 34.313 W. Nichols D 328 Y N.R. N.R.
12 12 34.314 G. Meech D N.R. N N.R. N.R.
12 12 34.322 J. Smolen D N.R. N N.R. N.R.
12 12 34.333 M. L. Babb D N.R. N N.R. N.R.
12 12 34.342 L. Mogge D N.R. N N.R. N.R.
12 12 34.413 B. B. Reeves D 138 N 1936 N.R.
12 12 34.414 R. Hampton D N.R. N N.R. N.R.
12 12 34.422 C. D. Emmons 1 D 300 Y 1958 254-30012 12 34.423 A. L. Cornell D N.R. N N.R. N.R.
12 12 34.424 Curtis Barrett D N.R. N N.R. N.R.
12 12 34.424 E. Grondí1n D N.R. N N.R. N.R.
12 12 34.431 Karl Monroe D N.R. N N.R. N.R.
12 12 34.434 E. E. Hanson D N.R. N N.R. N.R.
12 12 34.442 Kline D N.R. N N.R. N.R.
12 12 35.144 CWUA 35-H A 200 Y 1918 35-190
12 12 36.111 Bob Boykin D N.R. N N.R. N.R.
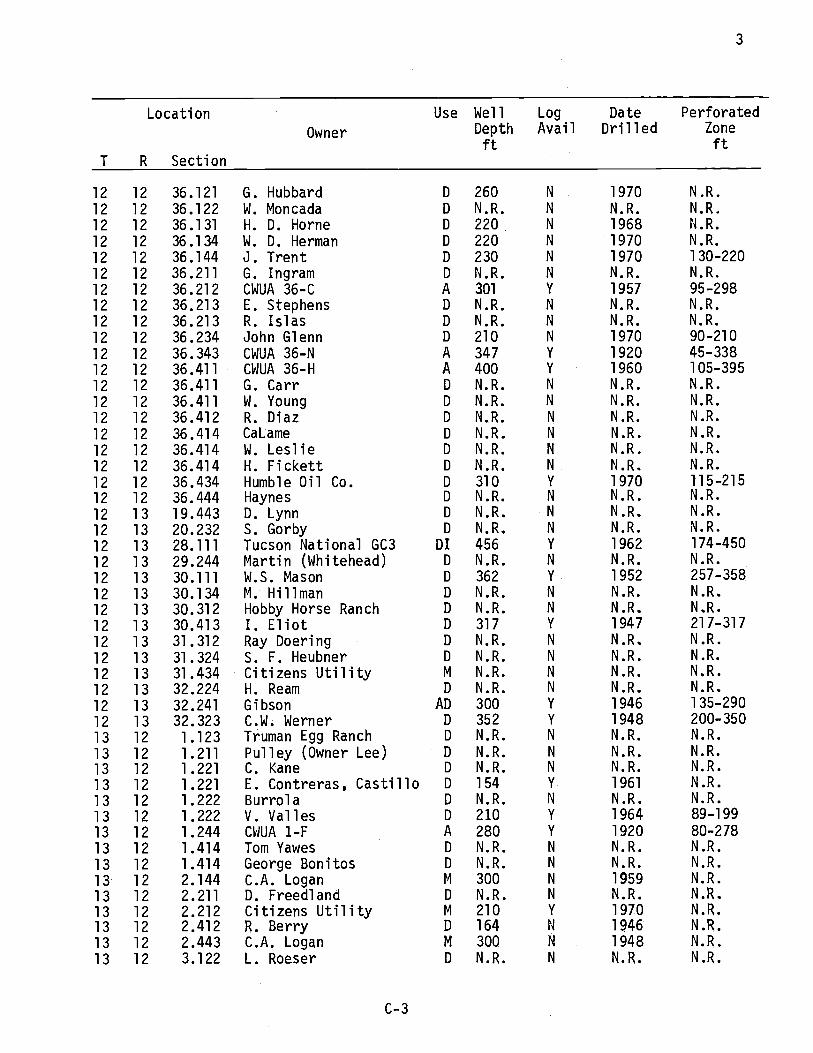
3
T
Location
R Section
Owner
Use Well
Depthft
Log
Avail
DateDrilled
PerforatedZone
ft
12 12 36.121 G. Hubbard D 260 N 1970 N.R.
12 12 36.122 W. Moncada D N.R. N N.R. N.R.
12 12 36.131 H. D. Horne D 220 N 1968 N.R.
12 12 36.134 W. D. Herman D 220 N 1970 N.R.
12 12 36.144 J. Trent D 230 N 1970 130-220
12 12 36.211 G. Ingram D N.R. N N.R. N.R.
12 12 36.212 CWUA 36-C A 301 Y 1957 95-298
12 12 36.213 E. Stephens D N.R. N N.R. N.R.
12 12 36.213 R. Islas D N.R. N N.R. N.R.
12 12 36.234 John Glenn D 210 N 1970 90-210
12 12 36.343 CWUA 36-N A 347 Y 1920 45-338
12 12 36.411 CWUA 36-H A 400 Y 1960 105-395
12 12 36.411 G. Carr D N.R. N N.R. N.R.
12 12 36.411 W. Young D N.R. N N.R. N.R.
12 12 36.412 R. Diaz D N.R. N N.R. N.R.
12 12 36.414 CaLame D N.R. N N.R. N.R.
12 12 36.414 W. Leslie D N.R. N N.R. N.R.
12 12 36.414 H. Fickett D N.R. N N.R. N.R.
12 12 36.434 Humble Oil Co. D 310 Y 1970 115-215
12 12 36.444 Haynes D N.R. N N.R. N.R.
12 13 19.443 D. Lynn D N.R. N N.R. N.R.
12 13 20.232 S. Gorby D N.R. N N.R. N.R.
12 13 28.111 Tucson National GC3 DI 456 Y 1962 174-450
12 13 29.244 Martin (Whitehead) D N.R. N N.R. N.R.
12 13 30.111 W.S. Mason D 362 Y. 1952 257-358
12 13 30.134 M. Hillman D N.R. N N.R. N.R.
12 13 30.312 Hobby Horse Ranch D N.R. N N.R. N.R.
12 13 30.413 I. Eliot D 317 Y 1947 217-317
12 13 31.312 Ray Doering D N.R. N N.R. N.R.
12 13 31.324 S. F. Heubner D N.R. N N.R. N.R.
12 13 31.434 Citizens Utility M N.R. N N.R. N.R.
12 13 32.224 H. Ream D N.R. N N.R. N.R.
12 13 32.241 Gibson AD 300 Y 1946 135-290
12 13 32.323 C.W. Werner D 352 Y 1948 200-350
13 12 1.123 Truman Egg Ranch D N.R. N N.R. N.R.
13 12 1.211 Pulley (Owner Lee) D N.R. N N.R. N.R.
13 12 1.221 C. Kane D N.R. N N.R. N.R.
13 12 1.221 E. Contreras, Castillo D 154 Y 1961 N.R.
13 12 1.222 Burrola D N.R. N N.R. N.R.
13 12 1.222 V. Valles D 210 Y 1964 89-199
13 12 1.244 CWUA 1-F A 280 Y 1920 80-278
13 12 1.414 Tom Yawes D N.R. N N.R. N.R.
13 12 1.414 George Bonitos D N.R. N N.R. N.R.
13 12 2.144 C.A. Logan M 300 N 1959 N.R.
13 12 2.211 D. Freedland D N.R. N N.R. N.R.
13 12 2.212 Citizens Utility M 210 Y 1970 N.R.
13 12 2.412 R. Berry D 164 N 1946 N.R.
13 12 2.443 C.A. Logan M 300 N 1948 N.R.
13 12 3.122 L. Roeser D N.R. N N.R. N.R.
C-3
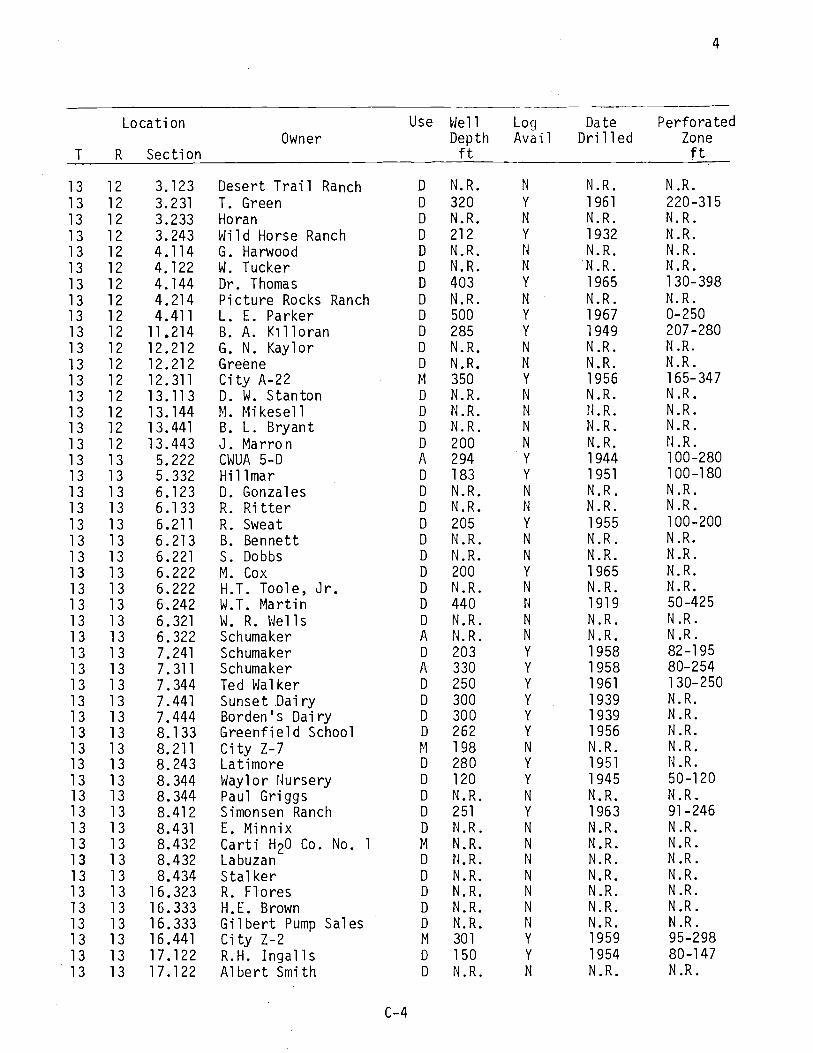
4
T
Location
R SectionOwner
Use Well
Depthft
LogAvail
DateDrilled
PerforatedZoneft
13 12 3.123 Desert Trail Ranch D N.R. N N.R. N.R.
13 12 3.231 T. Green D 320 Y 1961 220-315
13 12 3.233 Horan D N.R. N N.R. N.R.
13 12 3.243 Wild Horse Ranch D 212 Y 1932 N.R.
13 12 4.114 G. Harwood D N.R. N N.R. N.R.
13 12 4.122 W. Tucker D N.R. N N.R. N.R.
13 12 4.144 Dr. Thomas D 403 Y 1965 130-398
13 12 4.214 Picture Rocks Ranch D N.R. N N.R. N.R.
13 12 4.411 L. E. Parker D 500 Y 1967 0-250
13 12 11.214 B. A. Killoran D 285 Y 1949 207-280
13 12 12.212 G. N. Kaylor D N.R. N N.R. N.R.
13 12 12.212 Greene D N.R. N N.R. N.R.
13 12 12.311 City A-22 M 350 Y 1956 165-347
13 12 13.113 D. W. Stanton D N.R. N N.R. N.R.
13 12 13.144 M. Mikesell D N.R. N N.R. N.R.
13 12 13.441 B. L. Bryant D N.R. N N.R. N.R.
13 12 13.443 J. Marron D 200 N N.R. N.R.
13 13 5.222 CWUA 5-D A 294 Y 1944 100-280
13 13 5.332 Hillmar D 183 Y 1951 100-180
13 13 6.123 D. Gonzales D N.R. N N.R. N.R.
13 13 6.133 R. Ritter D N.R. N N.R. N.R.
13 13 6.211 R. Sweat D 205 Y 1955 100-200
13 13 6.213 B. Bennett D N.R. N N.R. N.R.
13 13 6.221 S. Dobbs D N.R. N N.R. N.R.
13 13 6.222 M. Cox D 200 Y 1965 N.R.
13 13 6.222 H.T. Toole, Jr D N.R. N N.R. N.R.
13 13 6.242 W.T. Martin D 440 N 1919 50-425
13 13 6.321 W. R. Wells D N.R. N N.R. N.R.
13 13 6.322 Schumaker A N.R. N N.R. N.R.
13 13 7.241 Schumaker D 203 Y 1958 82-195
13 13 7.311 Schumaker A 330 Y 1958 80-254
13 13 7.344 Ted Walker D 250 Y 1961 130-250
13 13 7.441 Sunset Dairy D 300 Y 1939 N.R.
13 13 7.444 Borden's Dairy D 300 Y 1939 N.R.
13 13 8.133 Greenfield School D 262 Y 1956 N.R.
13 13 8.211 City Z-7 M 198 N N.R. N.R.
13 13 8.243 Latimore D 280 Y 1951 N.R.
13 13 8.344 Waylor Nursery D 120 Y 1945 50-120
13 13 8.344 Paul Griggs D N.R. N N.R. N.R.
13 13 8.412 Simonsen Ranch D 251 Y 1963 91-246
13 13 8.431 E. Minnix D N.R. N N.R. N.R.
13 13 8.432 Carti H20 Co. No. 1 M N.R. N N.R. N.R.
13 13 8.432 Labuzan D N.R. N N.R. N.R.
13 13 8.434 Stalker D N.R. N N.R. N.R.
13 13 16.323 R. Flores D N.R. N N.R. N.R.
13 13 16.333 H.E. Brown D N.R. N N.R. N.R.
13 13 16.333 Gilbert Pump Sales D N.R. N N.R. N.R.
13 13 16.441 City Z-2 M 301 Y 1959 95-298
13 13 17.122 R.H. Ingalls D 150 Y 1954 80-147
13 13 17.122 Albert Smith D N.R. N N.R. N.R.
C-4

5
T R
Location
SectionOwner
Use Well
Depthft
Log
Avail
Date
DrilledPerforated
Zone
ft
13 13 17.123 City Z -4 M 230 N 1957 90 -225
13 13 17.133 P. Pierce South Well D 230 N 1957 90 -22513 13 17.133 P. Pierce North Well D N.R. N N.R. N.R.13 13 17.133 Mohawk Apartments F 230 N 1957 100 -22513 13 17.211 Simonsen Brick House D 190 Y 1949 N.R.13 13 17.211 J. Hummer North Well D N.R. N N.R. N.R.13 13 17.214 J. Hummer South Well D N.R. N N.R. N.R.13 13 17.314 T.P.A.C., Inc. ID N.R. N N.R. N.R.13 13 17.413 Tumbleweed Inn D N.R. N N.R. N.R.13 13 17.421 Al Darris D N.R. N N.R. N.R.13 13 17.421 Eicholtz D 400 Y 1947 N.R.13 13 17.422 Casa Motel D N.R. N N.R. N.R.13 13 17.443 Robert Pike D N.R. N N.R. N.R.13 13 17.444 H.C. Smith D N.R. N N.R. N.R.13 13 18.122 V. Chandler D 198 Y 1956 150 -19313 13 18.131 Frank Howard D 115 Y 1939 72 -115
13 13 18.231 H. Darimont D N.R. N N.R. N.R.13 13 18.313 E. Heuston D N.R. N N.R. N.R.13 13 18.314 Pat Owen D N.R. N N.R. N.R.13 13 18.332 J. West D N.R. N N.R. N.R.
13 13 18.344 R. W. Miley D N.R. N N.R. N.R.
13 13 18.432 R. Schad D 250 N 1970 150 -250
13 13 18.433 H.O. Barber D N.R. N N.R. N.R.
13 13 18.434 W. L. Shearer D N.R. N N.R. N.R.
13 13 19.113 J. Saunders D N.R. N N.R. N.R.13 13 19.344 City A -43 M 450 Y 1966 190 -445
13 13 19.434 J. J. Jackson D N.R. N N.R. N.R.13 13 19.441 J. W. Maupin D N.R. N N.R. N.R.
13 13 19.444 City A -44 M 300 Y 1956 185 -29E
13 13 20.224 Citizens Utility 2 D N.R. N N.R. N.R.13 13 20.443 Rabies Control Ctr. D 450 Y 1963 110 -418
13 13 21.242 Wentz Bros. Stockyard D N.R. N N.R. N.R.13 13 21.324 Infilco U 360 Y 1966 90 -355
13 13 21.433 City Sewage Farm D 251 Y 1950 75 -N.R.
13 13 27.331 Circle Bar Motel D N.R. N N.R. N.R.13 13 27.331 Crecelius D N.R. N N.R. N.R.13 13 27.332 Arizona Ranch School D 200 Y 1954 90 -107
13 13 27.334 Tratel Tucson D N.R. N N.R. N.R.
13 13 27.343 Town & Country Apt. D N.R. N N.R. N.R.13 13 27.344 USDA Romero Rd. A 300 Y 1963 150 -300
13 13 28.332 Citizens Utility D 270 N 1970 N.R.13 13 28.342 Haciendas Del Oeste D N.R. N N.R. N.R.13 13 29.122 R. Crull D N.R. N N.R. N.R.13 13 29.124 R.G. Marsland D 128 Y 1948 73 -12813 13 29.212 S. Ott D N.R. N N.R. N.R.13 13 29.214 P. Martin D N.R. N N.R. N.R.13 13 29.313 M. Soweres D N.R. N N.R. N.R.13 13 29.313 M. Barnett D N.R. N N.R. N.R.13 13 29.314 Dr. Bloss D 210 Y 1952 N.R.13 13 29.314 P. Smith D N.R. N N.R. N.R.
C-5
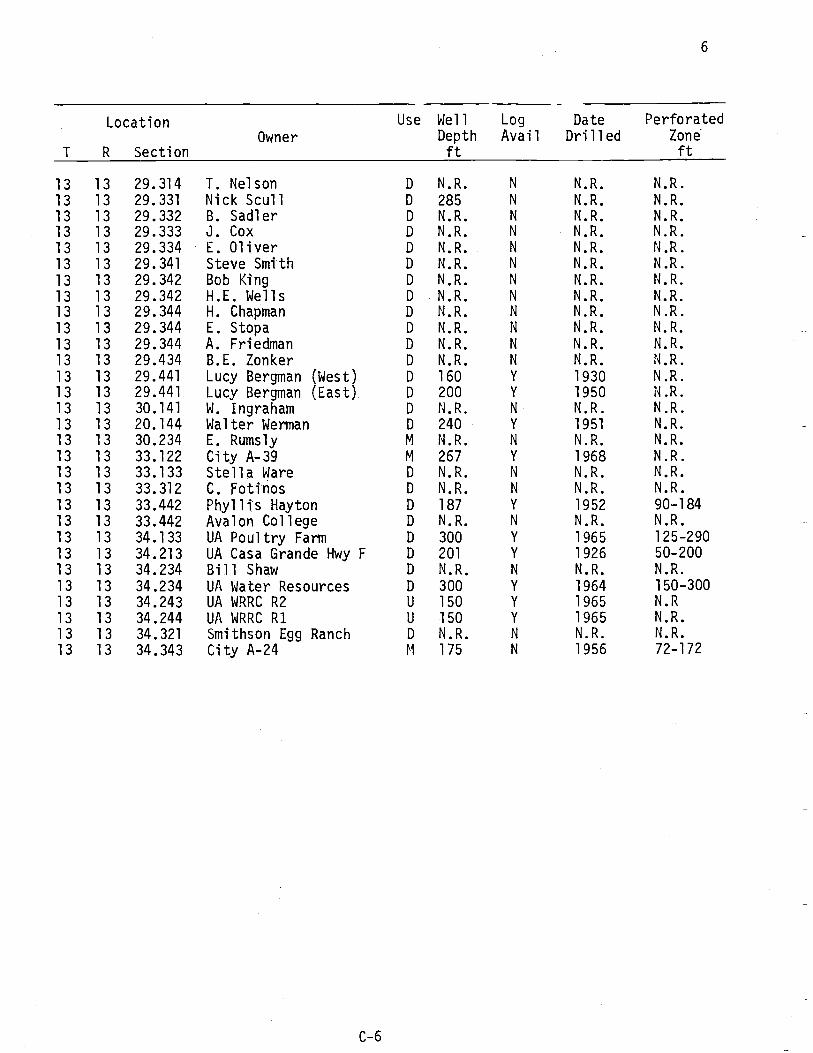
6
T
Location
R SectionOwner
Use Well
Depthft
Log
AvailDate
DrilledPerforated
Zoneft
13 13 29.314 T. Nelson D N.R. N N.R. N.R.
13 13 29.331 Nick Scull D 285 N N.R. N.R.
13 13 29.332 B. Sadler D N.R. N N.R. N.R.
13 13 29.333 J. Cox D N.R. N N.R. N.R.
13 13 29.334 E. Oliver D N.R. N N.R. N.R.
13 13 29.341 Steve Smith D N.R. N N.R. N.R.
13 13 29.342 Bob King D N.R. N N.R. N.R.
13 13 29.342 H.E. Wells D N.R. N N.R. N.R.
13 13 29.344 H. Chapman D N.R. N N.R. N.R.
13 13 29.344 E. Stopa D N.R. N N.R. N.R.
13 13 29.344 A. Friedman D N.R. N N.R. N.R.
13 13 29.434 B.E. Zonker D N.R. N N.R. N.R.
13 13 29.441 Lucy Bergman (West) D 160 Y 1930 N.R.
13 13 29.441 Lucy Bergman (East) D 200 Y 1950 N.R.
13 13 30.141 W. Ingraham D N.R. N N.R. N.R.
13 13 20.144 Walter Werman D 240 Y 1951 N.R.
13 13 30.234 E. Rumsly M N.R. N N.R. N.R.
13 13 33.122 City A-39 M 267 Y 1968 N.R.
13 13 33.133 Stella Ware D N.R. N N.R. N.R.
13 13 33.312 C. Fotìrios D N.R. N N.R. N.R.
13 13 33.442 Phyllis Hayton D 187 Y 1952 90-18413 13 33.442 Avalon College D N.R. N N.R. N.R.
13 13 34.133 UA Poultry Farm D 300 Y 1965 125-290
13 13 34.213 UA Casa Grande Hwy F D 201 Y 1926 50-200
13 13 34.234 Bill Shaw D N.R. N N.R. N.R.
13 13 34.234 UA Water Resources D 300 Y 1964 150-30013 13 34.243 UA WRRC R2 U 150 Y 1965 N.R
13 13 34.244 UA WRRC R1 U 150 Y 1965 N.R.
13 13 34.321 Smithson Egg Ranch D N.R. N N.R. N.R.
13 13 34.343 City A-24 M 175 N 1956 72-172

7
T R
Location
SectionOwner
Use Well
Depthft
LogAvail
DateDrilled
PerforatedZoneft
12 12 13.123 Ray S. Burton D 500 Y 1973 334 -500
12 12 14.231 Earl Gray D 400 Y 1973 250 -395
12 12 15.332 Wayne Holley D 190 Y 1973 Between12 12 22.221 Clete O'Neil D 200 Y 1972 110 -190
12 12 25.132 Richard Carreon D 280 Y 1974 170 -270
12 12 25.244 Tom Elliot D 296 Y 1972 176 -276
12 12 25.422 Richard Gentry D 308 Y 1973 183 -298
12 13 17.111 City C -101 M 570 Y 1972 400 -560
12 13 17.431 Wilford Construction D 500 Y 1973 368 -488
12 13 30.242 Bill Wright D 400 Y 1972 250 -390
12 13 31.333 City Z -13 M 300 Y 1972 100 -280
13 13 16.314 Diamond Grove M 420 Y 1974 131 -420
13 13 18.132 Sam Borders D 300 Y 1973 140 -300

APPENDIX D
SOURCES OF INFORMATION

NAME
Mr. J. RobertsMr. Wm. FaustMr. D. HylandMr. Earl SmithMr. Tom DereksonMr. Bill VoiceMr. Wayne BarteauMr. Gordon DavisMr. J. PosedlyMr. E.J. TruebloodMr. Sam DunlapDr. J. WrightDr. R. PhillipsMr. A. OshrinMr. G. FoggMr. Dempsey HelmsDr. W.H. HaleMr. Brad DeSpainMr. Maurice BasuteDr. B. ReidMr. Joe WeberDr. James DeCookMr. Bill BatemanMr. Jeffery RandallMr. BlackwellDr. W. KneeboneDr. R.E. Dennis
CONTRIBUTORS
AGENCY
Colombia Sand and GravelPima Co. Dept. of SanitationPima Co. Dept. of SanitationPima Co. Dept. of SanitationPima Co. Dept. of SanitationShamrock FarmsTucson Rock and SandCity of Tucson, Dept. of Water & SewersSoils, Water and EngineeringCity Wastewater Treatment PlantSunset FarmsCity of Tucson, Dept. of Water & SewersU. of A. Dept. of Sanitary EngineeringOshrin RealtyU. of A. Grad. Student- HydrologySoils, Water and EngineeringAnimal SciencesCortaro Water Users AssociationSoil Conservation ServicePoultry Scientist, U. of A.Water Resources Research CenterWater Resources Research CenterU. of A. Undergrad.U. of A. Grad. Student -HydrologyCounty AgentPlant Sciences, U. of A.Plant Sciences, U. of A.

APPENDIX E
WATER QUALITY DATA FROMMONITORING PROGRAM IN
STUDY AREA, OCTOBER 1, 1976TO SEPTEMBER 30, 1977
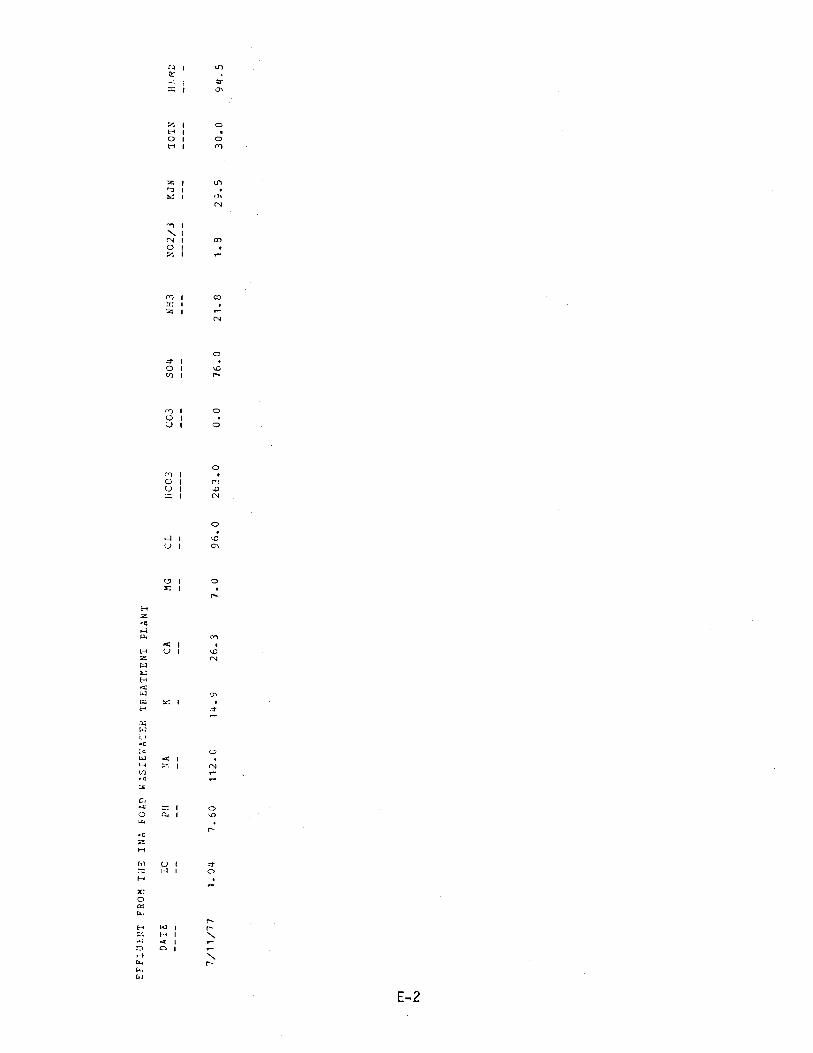
EFFLUENT FROM THE INA FOAP WASIEWA Ek
TREATMENT PLANT
DATE
-".0
PH
NA
!{
CA
MG
CL
tiCO3
CC3
SO4
NH3
NO2/3
KJN
TOTN
HLRi
----
--
--
--
---
--
--
----
---
---
---
-----
---
----
--
-
7/11/77
1.04
7.60
112.6
14.9
26.3
7.0
96.0
263.0
0.0
76.0
21.8
1.8
29.5
30.0
9q.5

9'L8Z
9'E
0'0
6'SL
0'0
O'OSL
0'0
S'E9Z
0'EL
B'£L
0'06
L'E
S'99
OE'L
8h'L
LL/ZL/8
9'S8Z
L'h
O'0
Z'8L
0'0
0'08l
0'0
S'E9Z
0'ZL
E'SL
L'68
Z'Z
S'L8
OZ'L
OG'L
'
LL/S IL
h'LZE
9'E
0'0
6'Sl
0'0
0'9SL
0'0
9'8SZ
O'L9
0'ZL
6'80L
Z'l
£'S9
SL'L
56'
LL/9L/S
MB'ZE£
9'E
0'0
6'SL
0'0
0'S6L
0'0
L'h9Z
0'hL
E'EL
E'LLL
8'L
h'LL
SZ'L
Z6'
LL/SZ/E
wB'LEZ
6'E
0'0
L'LL
0'0
O'S6l
0'0
0'99Z
0'hL
L'El
9'ZL
L'L
O'SL
09'L
h0'L
LL/OL/E
9-LOE
L'h
0'0
0'8L
0'0
0'SOZ
0'0
8'OLZ
0'SL
8'EL
0'86
L'L
9'ZL
OZ'L
00'L
LL/SZ/Z
h'LOE
h'h
O'0
h'6L
0'0
0'0
0'0
E'ELZ
O'L8
6'hl
S'86
9'Z
0'8L
OZ'L
80'L
9L/8 It
S'LhE
S'S
0'0
S'hZ
0'0
0'0
0'0
h'9hZ
0'E8
Chi.
S'ZLL
0'9
0'Z8
8Z'L
SO'L
SL/lZ/8
9'8SE
S'h
0'0
l'OZ
0'0
0'0
0'0
h'89Z
0'E6
9'hL
S"6LL
S'9
0'Z8
9Z'L
SO'L
SL/LL/9
S'hhE
9'S
0'0
6'hZ
0'0
0'0
0'0
8'0LZ
O'Z6
6'EL
O'SLL
9'9
E'S8
LO'L
ZO'L
SL/LL/L
HH7H
NbOI
NPN
E/ZON
EHN
POS
EGO
EOJH
Ta
9W
VD
NVN
Hd
3:1
3úyC
a80
8'33S 3Z18
SZLI
(NOISV9IHHI)
C-8 TTSM
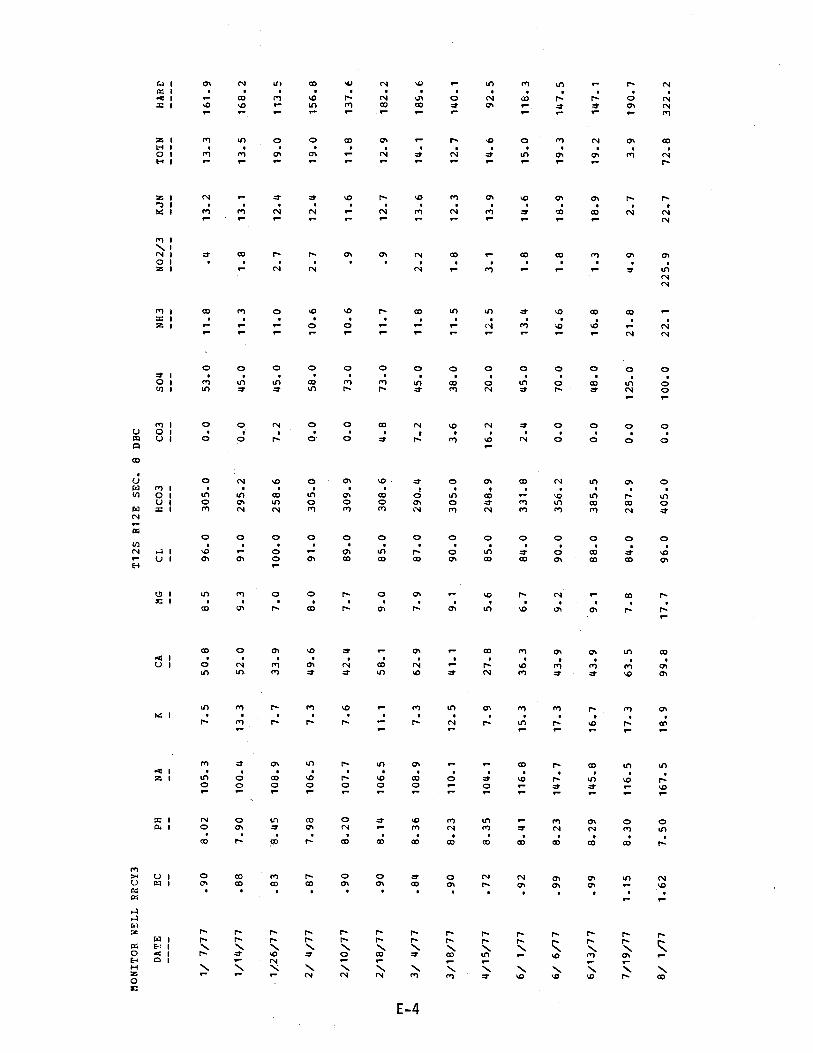
MONITOR WELL RRCY3
T12S R12E SEC. 8 DHC
DATE
EC
PH
NA
KCA
MG
CL
HCO3
CO3
SO4
NH3
NO2/3
KJN
TOTN
HARD
----
--
--
--
---
--
--
----
---
---
---
---
----
----
1/ 7/77
.90
8.02
105.3
7.5
50.8
8.5
96.0
305.0
0.0
53.0
-
11.8
.4
13.2
13.3
161.9
1/14/77
.88
7.90
100.4
13.3
52.0
9.3
91.0
295.2
0.0
45.0
11.3
1.8
13.1
13.5
168.2
1/26/77
.83
8.45
108.9
7.7
33.9
7.0
100.0
258.6
7.2
45.0
11.0
2.7
12.4
19.0
113.5
2/ 4/77
.87
7.98
106.5
7.3
49.6
8.0
91.0
305.0
0.0
58.0
10.6
2.7
12.4
19.0
156.8
2/10/77
.90
8.20
107.7
7.6
42.4
7.7
89.0
309.9
0.0
73.0
10.6
.9
11.6
11.8
137.6
2/18/77
.90
8.14
106.5
11.1
58.1
9.0
85.0
308.6
4.8
73.0
11.7
.9
12.7
12.9
182.2
m 4a
3/ 4/77
.84
8.36
108.9
7.3
62.9
7.9
87.0
290.4
7.2
45.0
11.8
2.2
13.6
14.1
189.6
3/18/77
.90
8.23
110.1
12.5
41.1
9.1
90.0
305.0
3.6
38.0
11.5
1.8
12.3
12.7
140.1
4/15/77
.72
8.35
104.1
7.9
27.8
5.6
85.0
248.9
16.2
20.0
12.5
3.1
13.9
14.6
92.5
6/ 1/77
.92
8.41
116.8
15.3
36.3
6.7
84.0
331.8
2.4
45.0
13.4
1.8
14.6
15.0
118.3
6/ 6/77
.99
8.23
147.7
17.3
43.9
9.2
90.0
356.2
0.0
70.0
16.6
1.8
18.9
19.3
147.5
6/13/77
.99
8.29
145.8
16.7
43.9
9.1
88.0
385.5
0.0
48.0
16.8
1.3
18.9
19.2
147.1
7/19/77
1.15
8.30
116.5
17.3
63.5
7.8
84.0
287.9
0.0
125.0
21.8
4.9
2.7
3.9
190.7
8/ 1/77
1.62
7.50
167.5
18.9
99.8
17.7
96.0
405.0
0.0
100.0
22.1
225.9
22.7
72.8
322.2
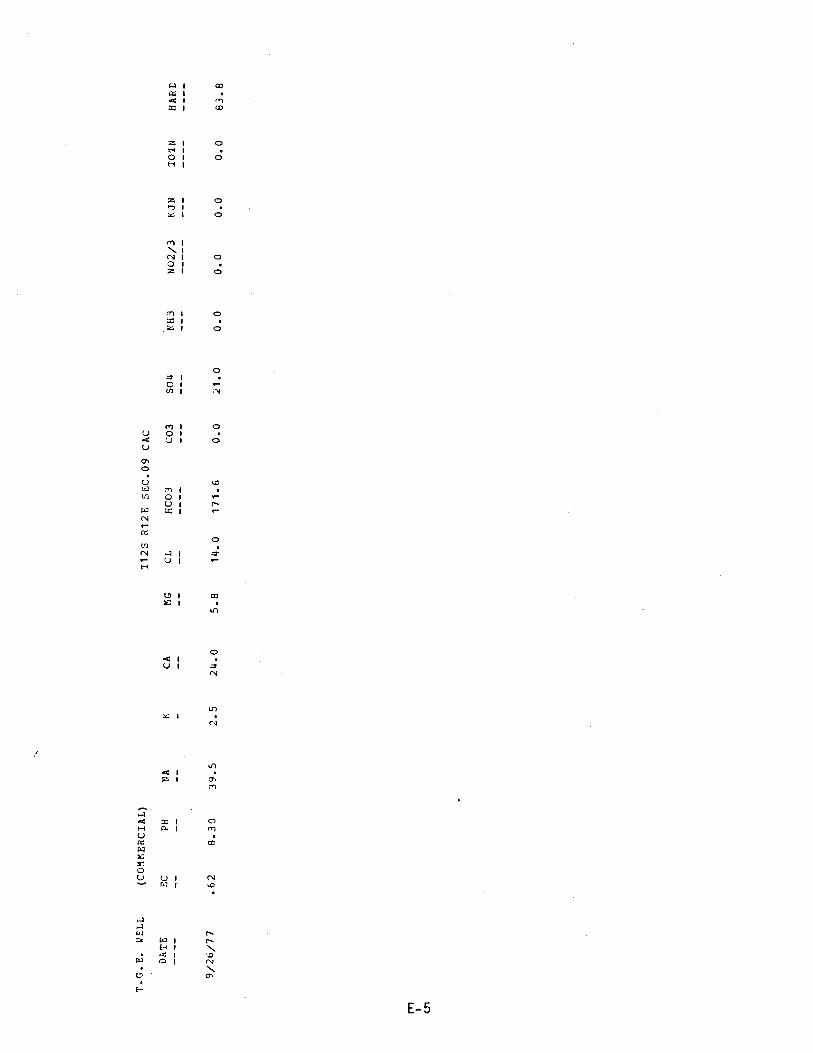
T.G.E.
L'ELL
(COMMERCIAL)
T12S R12E SEC.09 CAC
DATE
EC
PH
NA
KCA
MG
CL
hCO3
CO3
SO4
NH3
NO2/3
KJN
TOTN
HARE
----
--
--
--
---
--
--
----
---
---
---
---
----
----
9/26/77
.62
8.30
39.5
2.5
24.0
5.8
14.0
171.6
0.0
21.0
0.0
0.0
0.0
0.0
83.8
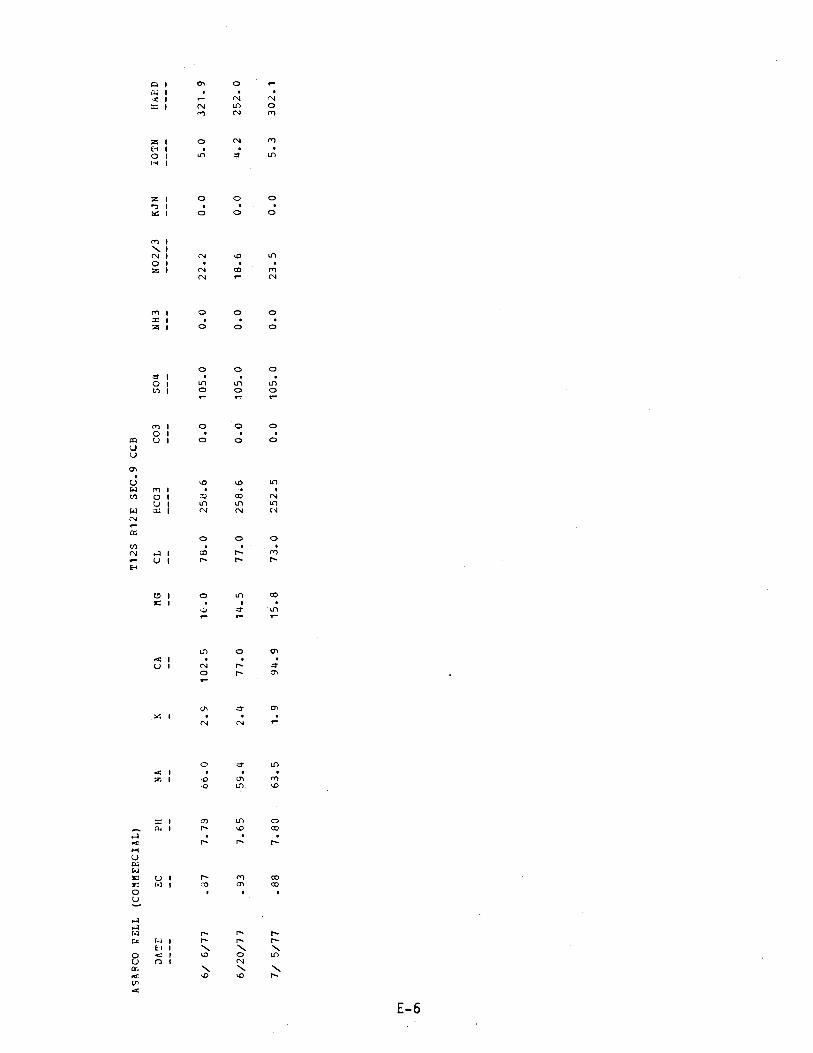
ASARCO L'ELL
(COMMEP,CIAL)
T12S 812E SEC.9 CCB
DATE
EC
PH
NA
KCA
MG
CL
HCO3
CO3
SO4
NH3
NO2/3
KJN
iOTN
HtiY,D
----
--
--
--
---
--
--
---
---
---
---
---
----
----
6/ 6/77
.87
7.73
66.0
2.9
102.5
16.0
78.0
258.6
0.0
105.0
0.0
22.2
0.0
5.0
321.9
6/20/77
.93
7.65
59.4
2.4
77.0
14.5
77.0
258.6
0..0
105.0
0.0
18.6
0.0
4.2
252.0
7/ 5/77
.88
7.80
63.5
1.9
94.9
15.8
73.0
252.5
0.0
105.0
0.0
23.5
0.0
5.3
302.1
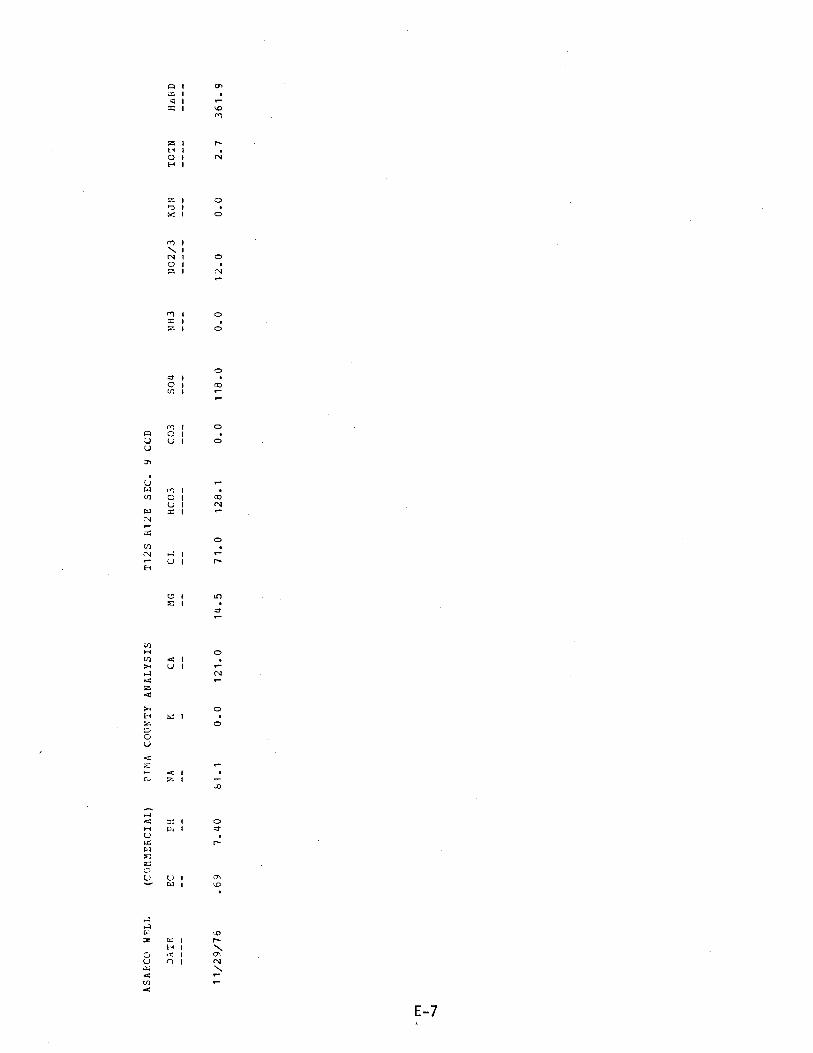
ASAECO WELL
(COMMERCIAL)
PIMA COUNTY ANALYSIS
T12S 012E SEC.
9 CCU
DATE
EC
PH
NA
KCA
MG
CL
HCO3
CO3
SO4
NH3
NO2/3
KJN
TOTN
Ha6D
----
--
--
--
---
--
--
----
---
---
---
---
----
----
11/29/76
.69
7.40
61.1
0.0
121.0
14.5
71.0
128.1
0.0
118.0
0.0
12.0
0.0
2.7
361.9

C.W.U.A.
DATE
----
WELL 16D1
EC
--
(IP.RIGATION)
PH
NA
--
--
K -CA--
MG
--
T12S R12E SEC.16
CL
HCO3
--
----
BBA
CO3
---
SO4
---
NH3
---
NO2/3
KJN
---
TOTN
----
HARO
----
1/17/75
.69
7.37
48.0
6.5
75.8
13.1
65.0
219.6
0.0
0.0
0.0
16.1
0.0
3.6
243.3
6/11/75
.70
7.29
46.0
5.8
76.8
13.3
62.0
217.2
0.0
0.0
0.0
13.8
0.0
3.1
246.6
8/21/75
0.00
0.00
42.0
5.8
71.0
12.5
0.0
0.0
0.0
0.0
0.0
12.8
0.0
2.9
228.8
4/ 3/76
.66
7.57
36.5
2.4
71.0
12.2
48.0
212.3
0.0
0.0
0.0
12.1
0.0
2.7
227.6
2/17/77
.67
7.50
41.1
1.9
78.7
11.4
52.0
222.0
0.0
98.0
0.0
12.8
0.0
2.9
243.5
2/25/77
.70
7.60
38.7
1.9
66.6
12.3
51.0
217.2
0.0
90.0
0.0
11.2
0.0
2.5
217.0
m 1 00
3/10/77
.55
7.60
39.9
1.8
73.8
10.9
47.0
212.3
0.0
92.0
0.0
11.5
0.0
2.6
229.2
3/25/77
.60
7.58
61.7
1.7
70.2
10.9
43.0
205.0
0.0
82.0
0.0
8.0
0.0
1.8
220.2
4/22/77
.68
7.30
33.9
2.4
84.7
12.1
47.0
218.4
0.0
74.0
0.0
16.1
0.0
3.6
261.4
5/16/77
.66
7.51
33.9
1.8
79.9
12.8
49.0
214.7
0.0
62.0
0.0
11.1
0.0
2.5
252.3
6/ 6/77
.64
7.60
43.9
2.9
77.2
14.2
47.0
212.3
0.0
75.0
0.0
9.7
0.0
2.2
251.3
6/20/77
.66
7.45
38.0
2.3
58.3
11.7
47.0
211.1
0.0
71.0
0.0
11.1
0.0
2.5
193.8
7/ 5/77
.67
7.50
41.5
2.2
55.5
13.5
43.0
207.4
0.0
78.0
0.0
12.4
0.0
2.8
194.2
8/12/77
1.00
7.70
36.5
2.7
57.5
10.9
44.0
236.7
0.0
85.0
0.0
12.4
0.0
2.8
188.5
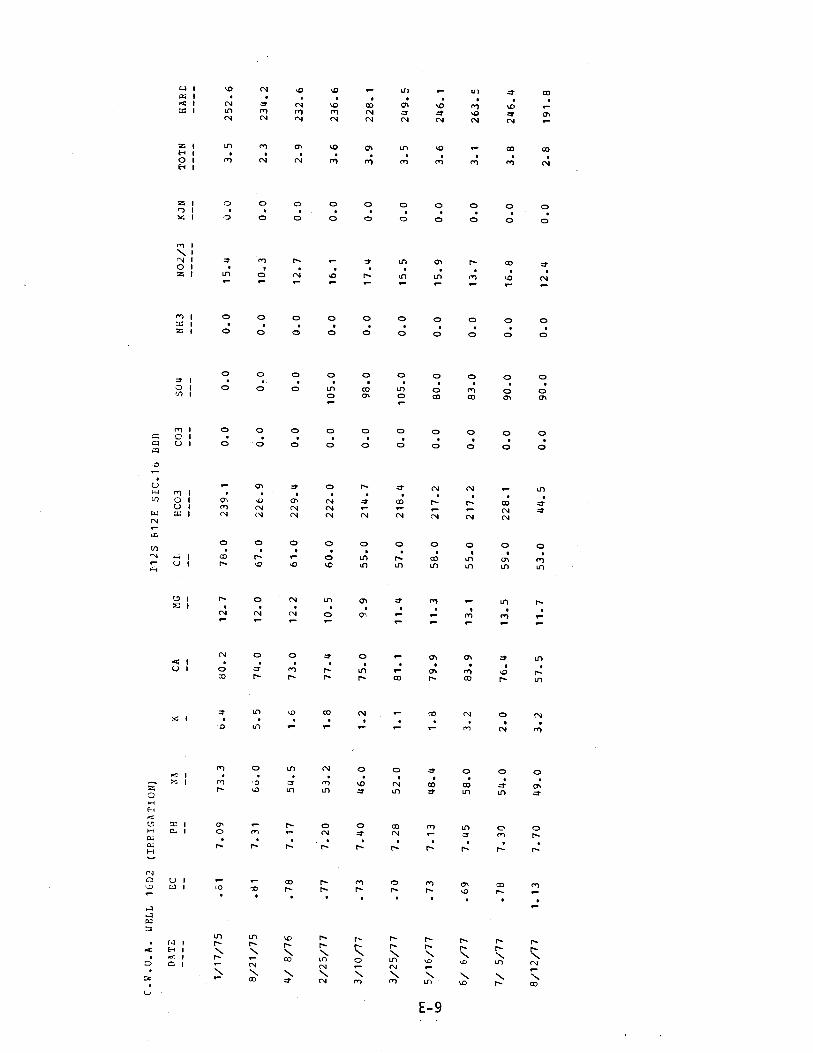
C.W.U.A. llELL 16D2 (IRRIGATION)
112S k12E SEC.16 DDD
DATE
EC
PH
NA
KCA
MG
CL
HCO3
CO3
SO4
NH3
NO2/3
KJN
TOTN
HARE
1/17/75
.81
7.09
73.3
ti.4
80.2
12.7
78.0
239.1
0.0
0.0
0.0
15.4
0.0
3.5
252.6
8/21/75
.81
7.31
6ó.0
5.5
74.0
12.0
67.0
226.9
0.0
0.0
0.0
10.3
0.0
2.3
234.2
4/ 8/76
.78
7.17
54.5
1.6
73.0
12.2
61.0
229.4
0.0
0.0
0.0
12.7
0.0
2.9
232.6
2/25/77
.77
7.20
53.2
1.8
77.4
10.5
60.0
222.0
0.0
105.0
0.0
16.1
0.0
3.6
236.6
3/10/77
.73
7.40
46.0
1.2
75.0
9.9
55.0
214.7
0.0
98.0
0.0
17.4
0.0
3.9
228.1
3/25/77
.70
7.28
52.0
1.1
81.1
11.4
57.0
218.4
0.0
105.0
0.0
15.5
0.0
3.5
249.5
ril
5/16/77
.73
7.13
48.4
1.8
79.9
11.3
58.0
217.2
0.0
80.0
0.0
15.9
0.0
3.6
246.1
uo
6/ 6/77
.69
7.45
58.0
3.2
83.9
13.1
55.0
217.2
0.0
83.0
0.0
13.7
0.0
3.1
263.5
7/ 5/77
.78
7.30
54.0
2.0
76.4
13.5
59.0
228.1
0.0
90.0
0.0
16.8
0.0
3.8
246.4
8/12/77
1.13
7.70
49.0
3.2
57.5
11.7
53.0
44.5
0.0
90.0
0.0
12.4
0.0
2.8
191.8
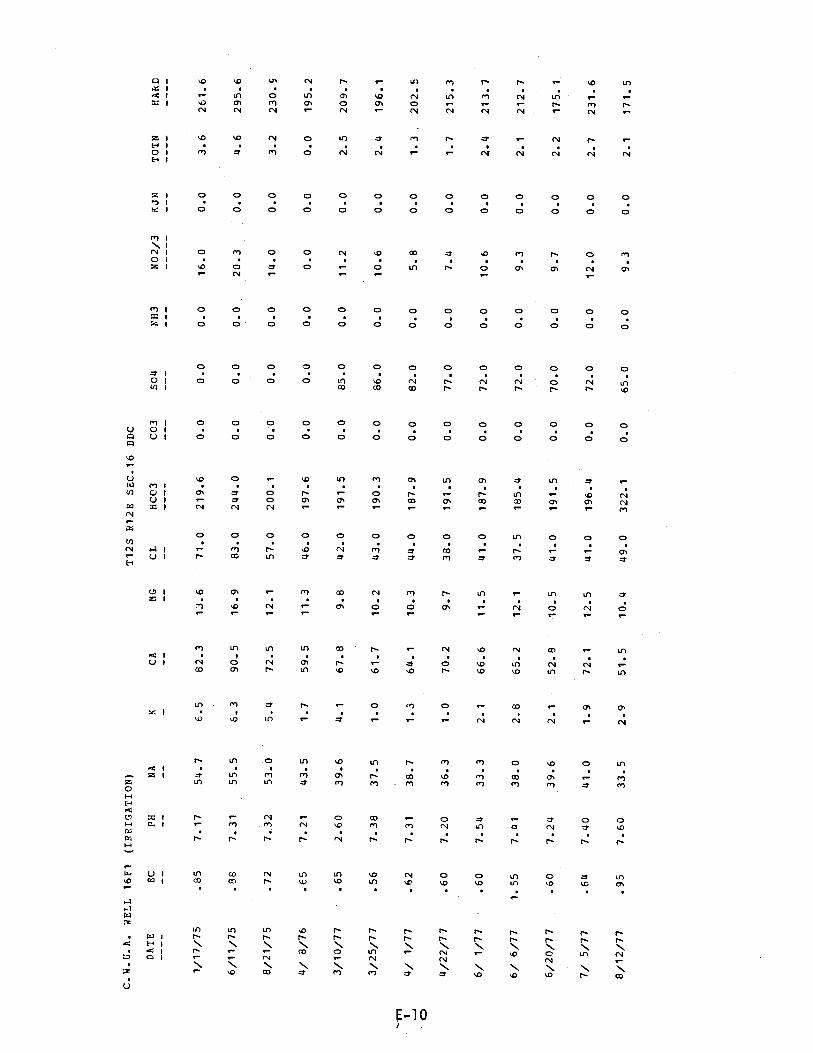
C.ii.U.A. WELL 16F1
(IRRIGATION)
T12S R12E SEC.16 BDC
DATE
EC
PH
NA
KCA
MG
CL
HCO3
CO3
SO4
NH3
NO2/3
KJN
TOTN
HARD
----
--
--
--
---
--
--
----
---
---
---
---
----
----
1/17/75
.85
7.17
54.7
6.5
82.3
13.6
71.0
219.6
0.0
0.0
0.0
16.0
0.0
3.6
261.6
6/11/75
.88
7.31
55.5
6_3
90..5
16.9
83.0
244.0
0.0
0.0
0.0
20.3
0.0
4.6
295.6
8/21/75
.72
7.32
53.0
5.4
72.5
12.1
57.0
200.1
0.0
0.0
0.0
14.0
0.0
3.2
230.5
4/ 8/76
.65
7.21
43.5
1.7
59.5
11.3
46.0
197.6
0.0
0.0
0.0
0.0
0.0
0.0
195.2
3/10/77
.65
2.60
39.6
4.1
67.8
9.8
42.0
191.5
0.0
85.0
0.0
11.2
0.0
2.5
209.7
3/25/77
.56
7.38
37.5
1.0
61.7
10.2
43.0
190.3
0.0
86.0
0.0
10.6
0.0
2.4
196.1
vm 1
4/ 1/77
.62
7.31
38.7
1.3
64.1
10.3
44.0
187.9
0.0
82.0
0.0
5.8
0.0
1.3,
202.5
_.. 0
4/22/77
.60
7.20
36.3
1.0
70.2
9.7
38.0
191.5
0.0
77.0
0.0
7.4
0.0
1.7
215.3
6/ 1/77
.60
7.54
33.3
2.1
66.6
11.5
41.0
187.9
0.0
72.0
0.0
10.6
0.0
2.4
213.7
6/ 6/77
1.55
7.41
38.0
2.8
65.2
12.1
37.5
185.4
0.0
72.0
0.0
9.3
0.0
2.1
212.7
6/20/77
.60
7.24
39.6
2.1
52.8
10.5
41.0
191.5
0.0
70.0
0.0
9.7
0.0
2.2
175.1
7/ 5/77
.64
7.40
41.0
1.9
72.1
12.5
41.0
196.4
0.0
72.0
0.0
12.0
0.0
2.7
231.6
8/12/77
.95
7.60
33.5
2.9
51.5
10.4
49.0
322.1
0.0
65.0
0.0
9.3
0.0
2.1
171.5
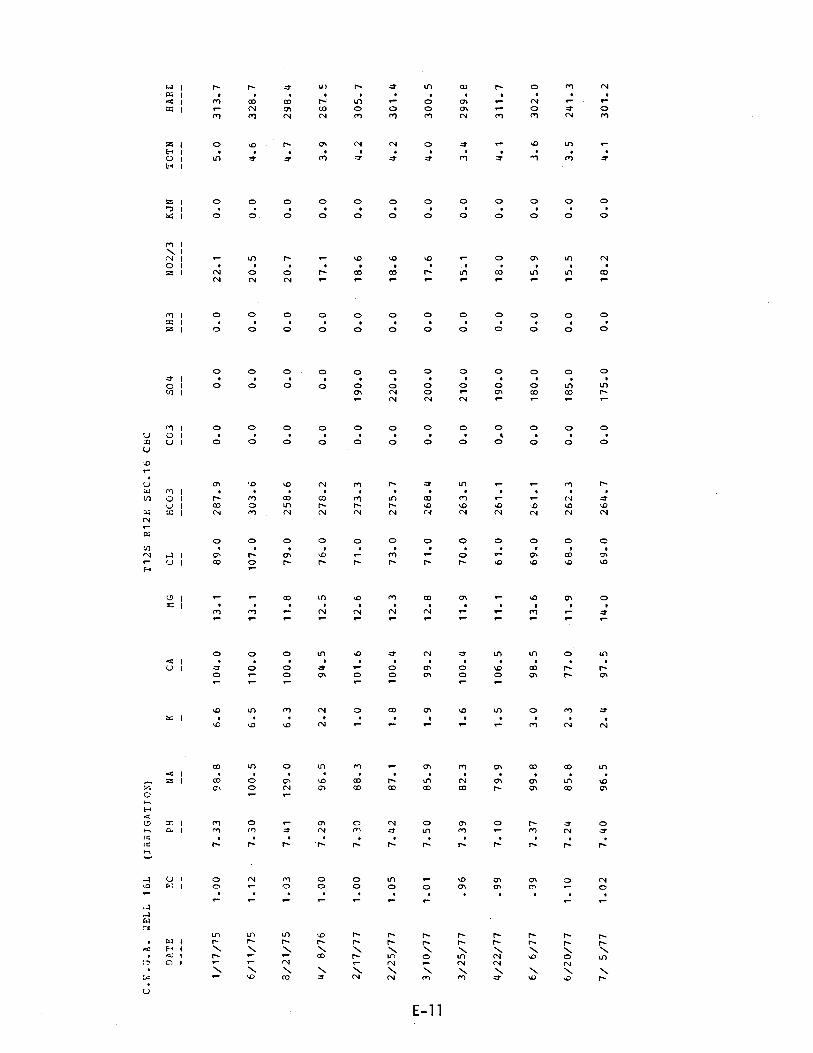
C.B.J.A. 'IELL 16L
(IRRIGATION)
T12S R12E SEC.16 CBC
DATE
EC
P9
NA
KCA
MG
CL
HCO3
CO3
SO4
NH3
NO2/3
KJN
TCTN
HARE
----
--
--
--
---
--
--
----
---
---
---
---
----
----
1/17/75
1.00
7.33
98_8
6_6
104.0
13.1
89.0
287.9
0.0
0.0
0.0
22.1
0.0
5.0
313.7
6/11/75
1.12
7.30
100.5
6.5
110.0
13.1
107.0
303.6
0.0
0.0
0.0
20.5
0.0
4.6
328.7
8/21/75
1.03
7.41
129.0
6.3
100.0
11.8
79.0
258.6
0.0
0.0
0.0
20.7
0.0
4.7
298.4
4/ 8/76
1.00
7.29
96.5
2.2
94.5
12.5
76.0
278.2
0.0
0.0
0.0
17.1
0.0
3.9
287.5
2/17/77
1.00
7.30
88.3
1.0
101.6
12.6
71.0
273.3
0.0
190.0
0.0
18.6
0.0
4.2
305.7
2/25/77
1.05
7.42
87.1
1.8
100.4
12.3
73.0
275.7
0.0
220.0
0.0
18.6
0.0
4.2
301.4
rm
3/10/77
1.01
7.50
85.9
1.9
99.2
12.8
71.0
268.4
0.0
200.0
0.0
17.6
0.0
4.0
300.5
-.A
3/25/77
.96
7.39
82.3
1.6
100.4
11.9
70.0
263.5
0.0
210.0
0.0
15.1
0.0
3.4
299.8
4/22/77
.99
7.10
79.9
1.5
106.5
11.1
61.0
261.1
0,0
190.0
0.0
18.0
0.0
4.1
311.7
6/ 6/77
.99
7.37
99.8
3.0
98.5
13.6
69.0
261.1
0.0
180.0
0.0
15.9
0.0
3.6
302.0
6/20/77
1.10
7.24
85.8
2.3
77.0
11.9
68.0
262.3
0.0
185.0
0.0
15.5
0.0
3.5
241.3
7/ 5/77
1.02
7.40
96.5
2.4
97.5
14.0
69.0
264.7
0.0
175.0
0.0
18.2
0.0
4.1
301.2

C.W.U.A.
DATE
----
WELL 16P
EC--
(IRRIGATION)
PH
NA
--
--
K -CA--
EG
--
112S
Cl --
R12£ SEC.16
ECO3
----
DDC CO3
---
SO4
---
NH3
---
NO2/3
KJN
---
TOTN
----
HARD
----
1/17/75
.43
7.55
31.2
6.2
43.0
8.1
34.0
164.7
0.0
0.0
0.0
15.4
0.0
3.5
140.8
6/11/75
.80
7.33
60.5
6.1
80.4
15.8
75.0
248.9
0.0
0.0
0.0
14.3
0.0
3.2
265.9
8/21/75
.42.
7.70
30.5
4.9
34.0
5.9
25.0
146.4
0.0
0.0
0.0
8.4
0.0
1.9
109.2
6/20/77
.35
7.78
24.8
1.9
28.6
4.3
12.0
136.6
0.0
17.5
0.0
5.8
0.0
1.3
69.1
8/12/77
.57
7.90
24.2
2.6
31.0
4.4
26.5
241.0
0.0
20.0
0.0
7.5
0.0
1.7
95.5
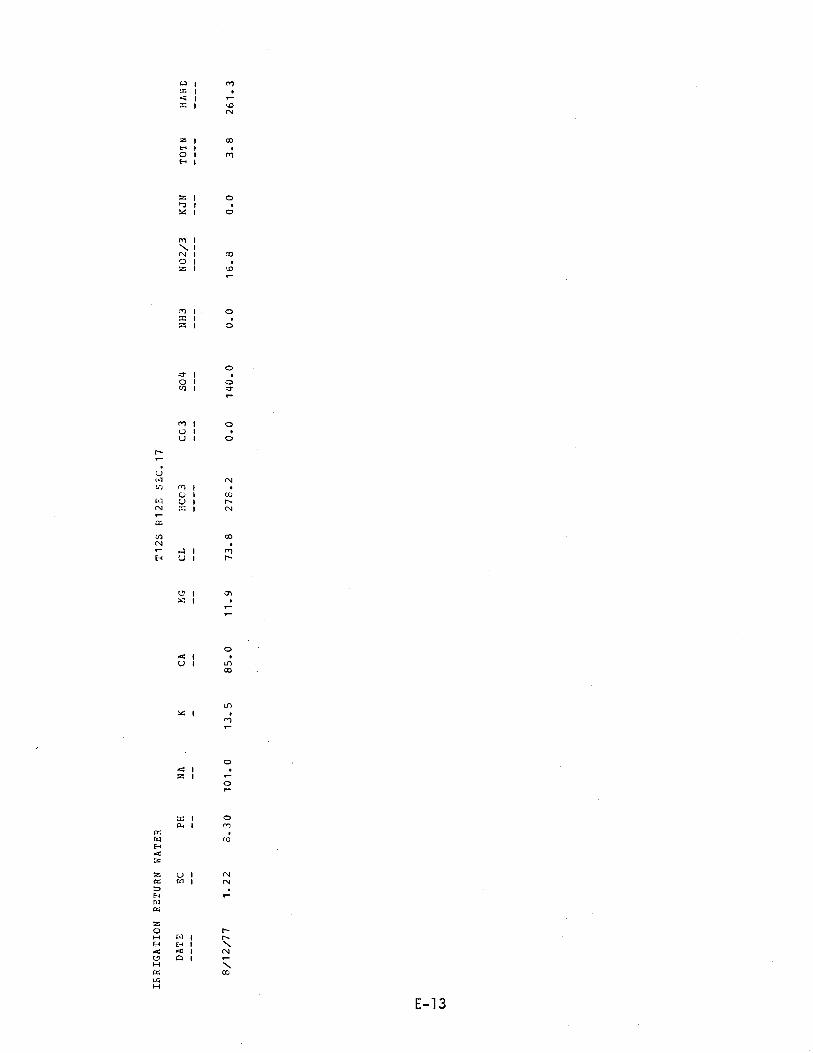
v1 m
xI
.
44 I
I
N
Z 1 CO
H 1O 1 mH I
.". I O7I O
mtN I CO
O 1Z 1 kiD
("I I ox 14(---; 1
o-1 1
o t óN 1
rm 1 0U 1U I O
N 04)N a I mH U I r
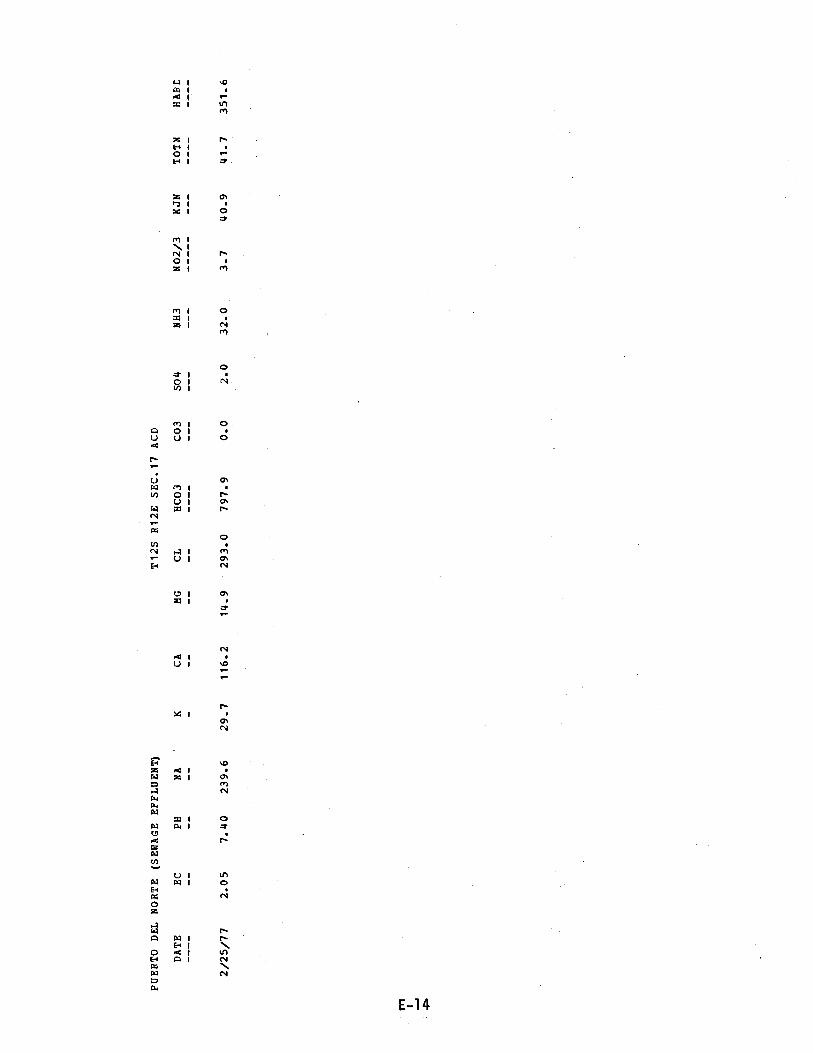
PUERTO DEL NORTE (SEWAGE EFFLUENT)
T12S R12E SEC.17 ACD
DATE
EC
PH
NA
'
KCA
MG
CL
HCO3
CO3
SO4
NH3
NO2/3
KJN
TOTN
HARE
----
--
--
--
---
--
--
----
---
---
---
---
----
----
2/25/77
2.05
7.40
239.6
29.7
116.2
14.9
293.0
797.9
0.0
2.0
32.0
3.7
40.9
41.7
351.6
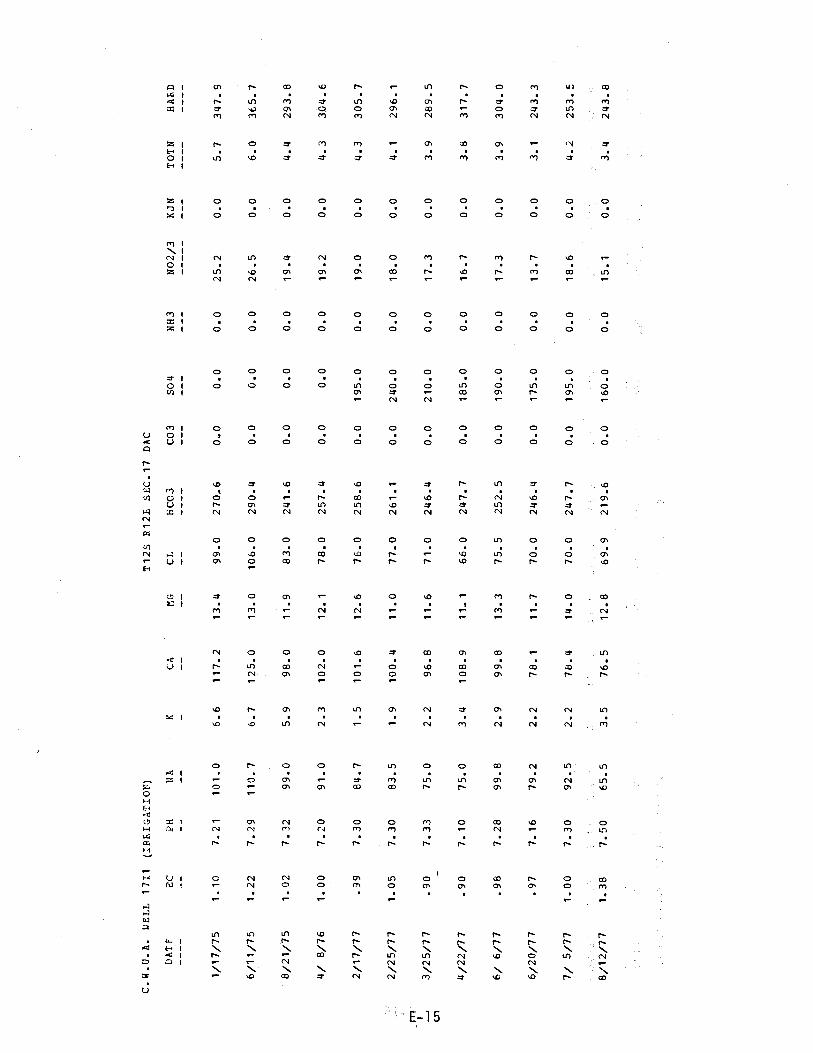
C.W.U.A. DELL 17I1
(IRRIGATIOP')
T12S R12E SEC.17 DAC
DATE
EC
PH
NA
KCA
MG
CL
HCO3
CO3
SO4
NH3
NO2/3
KJN
TOTN
HARD
----
--
--
--
---
--
--
----
---
---
---
---
----
----
1/17/75
1.10
7.21
101.0
6.6
117.2
13.4
99.0
270.6
0.0
0.0
0.0
25.2
0.0
5.7
347.9
6/11/75
1.22
7.29
110.7
6.7
125.0
13.0
106.0
290.4
0.0
0.0
0.0
26.5
0.0
6.0
365.7
8/21/75
1.02
7.32
99.0
5.9
98.0
11.9
83.0
241.6
0.0
0.0
0.0
19.4
0.0
4.4
293.8
4/ 8/76
1.00
7.20
91.0
2.3
102.0
12.1
78.0
257.4
0.0
0.0
0.0
19.2
0.0
4.3
304.6
2/17/77
.99
7.30
84.7
1.5
101.6
12.6
76.0
258.6
0.0
195.0
0.0
19.0
0.0
4.3
305.7
2/25/77
1.05
7.30
83.5
1.9
100.4
11.0
77.0
261.1
0.0
240.0
0.0
18.0
0.0
4.1
296.1
-1 J
3/25/77
.90
7.33
75.0
2.2
96.8
11.6
71.0
246.4
0.0
210.0
0.0
17.3
0.0
3.9
289.5
cri
..
4/22/77
.90
7.10
75.0
3.4
108.9
11,.1
66.0
247.7
0.0
185.0
0.0
16.7
0.0
3.8
317.7
6/ 6/77
.98
7.28
99.8
2.9
99.8
13.3
75.5
252.5
0.0
190.0
0.0
17.3
0.0
3.9
304.0
6/20/77
.97
7.16
79.2
2.2
78.1
11.7
70.0
246.4
0.0
175.0
0.0
13.7
0.0
3.1
243.3
7/ 5/77
1.00
7.30
92.5
2.2
78.4
14.0
70.0
247.7
0.0
195.0
0.0
18.6
0.0
4.2
253.5
8/12/77
1.38
7.50
65.5
3.5
76.5
12.8
69.9
219.6
0.0
160.0
0.0
15.1
0.0
3.4
243.8
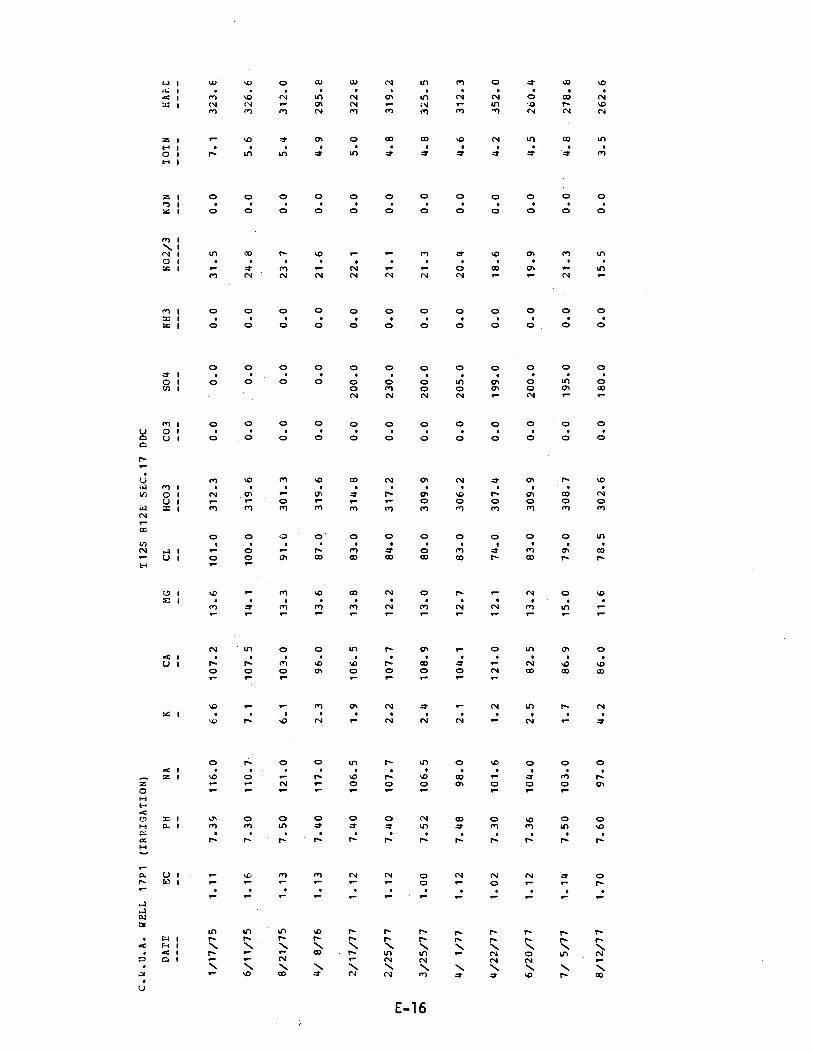
C.G.U.A. WELL 17P1
(IRRIGATION)
112S R12E SEC.17 DDC
DATE
EC
PH
NA
KCA
MG
CL
HCO3
CO3
SO4
NH3
NO2/3
KJN
TOTN
RARE
----
--
--
--
---
--
--
----
---
---
---
---
----
----
1/17/75
1.11
7.39
116.0
6.6
107.2
13.6
101.0
312.3
0.0
0.0
0.0
31.5
0.0
7.1
323.6
6/11/75
1.16
7.30
110.7
7.1
107.5
14.1
100.0
319.6
0.0
0.0
0.0
24.8
0.0
5.6
326.6
8/21/75
1.13
7.50
121.0
6.1
103.0
13.3
91.0
301.3
0.0
0.0
0.0
23.7
0.0
5.4
312.0
4/ 8/76
1.13
7.40
117.0
2.3
96.0
13.6
87.0
319.6
0.0
0.0
0.0
21.6
0.0
4.9
295.6
2/17/77
1.12
7.40
106.5
1.9
106.5
13.8
83.0
314.8
0.0
200.0
0.0
22.1
0.0
5.0
322.E
2/25/77
1.12
7.40
107.7
2.2
107.7
12.2
84.0
317.2
0.0
230.0
0.0
21.1
0.0
4.8
319.2
m i al
3/25/77
1.00
7.52
106.5
2.4
108.9
13.0
80.0
309.9
0.0
200.0
0.0
21.3
0.0
4.8
325.5
4/ 1/77
1.12
7.48
98.0
2.1
104.1
12.7
83.0
306.2
0.0
205.0
0.0
20.4
0.0
4.6
312.3
4/22/77
1.02
7.30
101.6
1.2
121.0
12.1
74.0
307.4
0.0
199.0
0.0
18.6
0.0
4.2
352.0
6/20/77
1.12
7.36
104.0
2.5
82.5
13.2
83.0
309.9
0.0
200.0
0.0
19.9
0.0
4.5
260.4
7/ 5/77
1.14
7.50
103.0
1.7
86.9
15.0
79.0
308.7
0.0
195.0
0.0
21.3
0.0
4.8
278.6
8/12/77
1.70
7.60
97.0
4.2
86.0
11.6
78.5
302.6
0.0
180.0
0.0
15.5
0.0
3.5
262.6
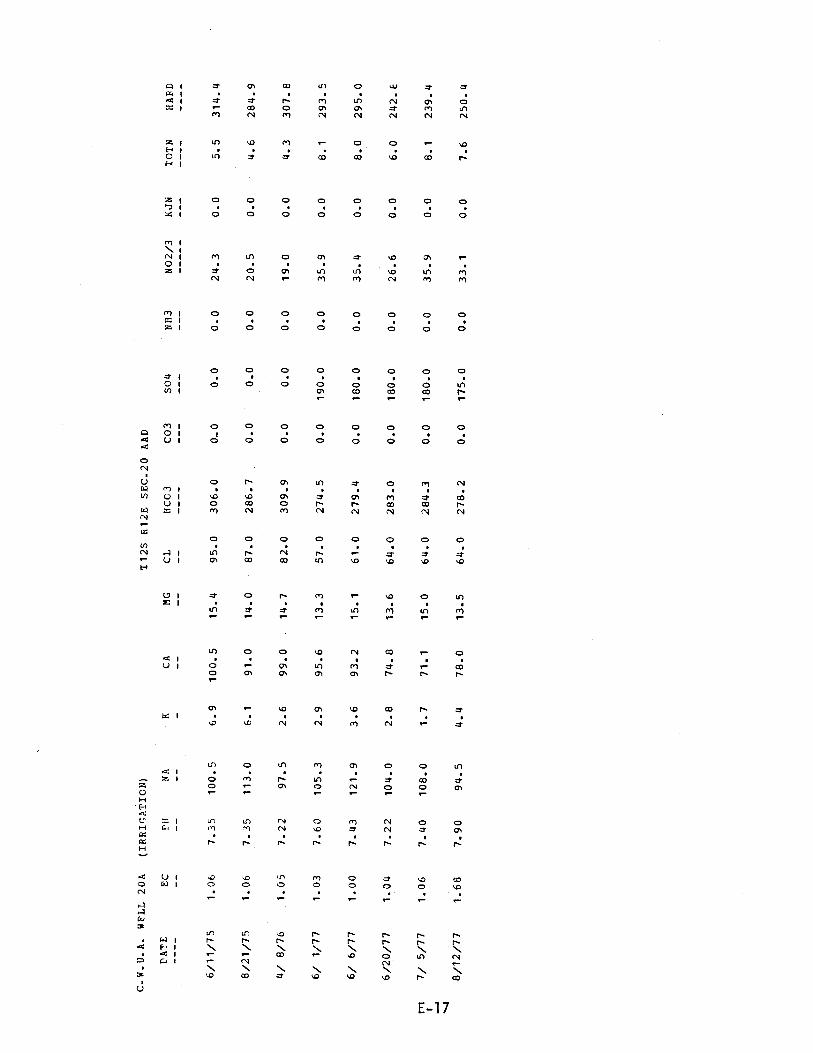
C. W. U. A. WELL 20A
(IRRIGATION)
T12S R12E SEC.20 AAD
DATE
EC
FEI
NA
KCA
MG
CL
HCO3
CO3
SO4
NH3
NO2/3
KJN
TOTN
HARD
----
--
--
--
--
--
--
----
---
---
---
---
----
----
6/11/75
1.06
7.35
100.5
6.9
100.5
15.4
95.0
306.0
0.0
0.0
0.0
24.3
0.0
5.5
314.4
8/21/75
1.06
7.35
113.0
6.1
91.0
14.0
87.0
286.7
0.0
0.0
0.0
20.5
0.0
4.6
284.9
4/ 8/76
1.05
7.22
97.5
2.6
99.0
.
14.7
82.0
309.9
0.0
0.0
0.0
19.0
0.0
4.3
307.8
6/ 1/77
1.03
7.60
105.3
2.9
95.6
13.3
57.0
274.5
0.0
190.0
0.0
35.9
0.0
8.1
293.5
6/ 6/77
1.00
7.43
121.9
3.6
93.2
15.1
61.0
279.4
0.0
180.0
0.0
35.4
0.0
8.0
295.0
6/20/77
1.04
7.22
104.0
2.8
74.8
13.6
64.0
283.0
0.0
180.0
0.0
26.6
0.0
6.0
242.E
m7/ 5/77
1.06
7.40
108.0
1.7
71.1
15.0
64.0
284.3
0.0
180.0
0.0
35.9
0.0
8.1
239.4
1 V8/12/77
1.68
7.90
94.5
4.4
78.0
13.5
64.0
278.2
0.0
175.0
0.0
33.1
0.0
7.6
250.4
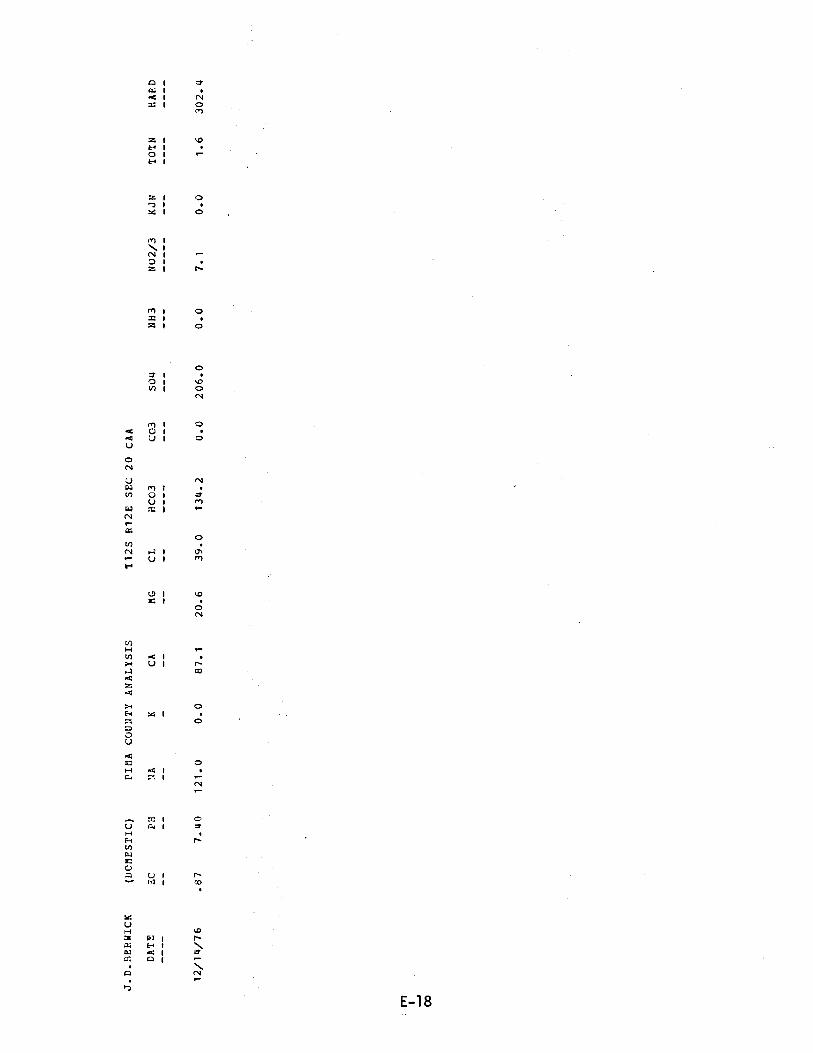
G] 1 7at 1
4 1 (Nx 1 0PI
z 1 cH 1O 1
H 1
Z 1
h 1b4 I 0
1,1 t1N I
z Ì
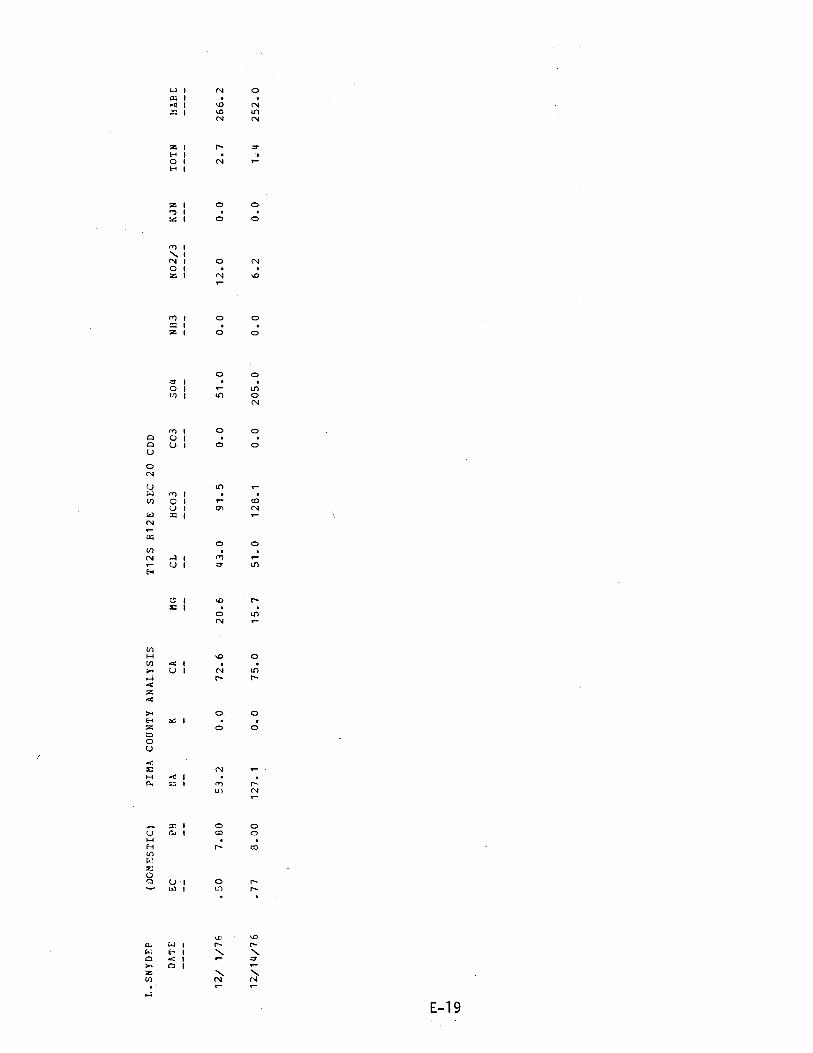
L.SNYDFP
(DOM'ESTIC)
PIMA COUNTY ANALYSIS
T12S R12E SEC 20 CDD
DATE
EC
PH
NA
KCA
MG
CL
HCO3
CC3
SO4
NH3
NO2/3
KJN
TOTN
HARE
12/ 1/75
.50
7.80
53.2
0.0
72.6
20.6
43.0
91.5
0.0
51.0
0.0
12.0
0.0
2.7
266.2
12/14/76
.77
8.00
127.1
0.0
75.0
15.7
51.0
128.1
0.0
205.0
0.0
6.2
0.0
1.4
252.0

C.W.U.A.
DATE
----
WELL 21C2
EC
--
(IRRIGATION)
PH
NA
--
--
K -CA
--
MG--
T12S R12E SEC.21
CL
HCC3
--
BAA
CO3
SO4
---
NH3
---
NO2/3
KJN
TOIN
HAED
1/17/75
.96
7.21
100.0
6.5
100.0
12.1
91.0
261.1
0.0
0.0
0.0
26.9
0.0
6.1
299.6
6/11/75
.98
7.30
89.0
6.1
90.5
10.7
85.0
261.1
0.0
0.0
0.0
21.7
0.0
4.9
270.1
8/21/75
.92
7.39
92.0
5.5
86.0
11.0
73.0
247.7
0.0
0.0
0.0
17_7
0.0
4.0
260.1
4/ 8/76
.98
7.20
93.0
1.5
86.0
10.9
72.0
257.4
0.0
0.0
0.0
16.7
0.0
3.8
259.7
2/25/77
1.00
7.30
90.8
1.9
89.5
11.1
68.0
263.5
0.0
185.0
0.0
19.8
0.0
4.5
269.3
3/10/77
.99
7.40
88.3
1.9
92.0
10.9
64.0
251.3
0.0
190.0
0.0
19.2
0.0
4.3
274.7
nn Ó
3/25/77
.89
7.30
78.7
1.7
88.3
10.7
63.0
251.3
0.0
180.0
0.0
17.3
0.0
3.9
264.6
4/ 1/77
.70
7.31
71.5
1.3
89.5
10.8
63.0
253.8
0.0
170.0
0.0
19.0
0.0
4.3
268.0
4/22/77
.95
7.10
84.7
1.5
99.2
10.7
63.0
261.1
0.0
171.0
0.0
16.1
0.0
3.6
291.8
6/ 6/77
.92
7.33
105.9
3.5
94.5
12.8
65.0
255.0
0.0
170.0
0.0
18.2
0.0
4.1
288.7
6/20/77
.94
7.18
85.8
2.3
73.7
10.7
65.0
259.9
0.0
160.0
0.0
17.3
0.0
3.9
228.1
7/ 5/77
.96
7.30
95.5
2.2
70.4
12.8
63.0
253.8
0.0
170.0
0.0
18.2
0.0
4.1
228.6
8/12/77
.95
7.80
68.0
3.6
71.5
11.1
63.0
229.4
0.0
140.0
0.0
15.9
0.0
3.6
224.3
8/12/77
1.17
7.70
82.0
3.5
79.8
11.9
72.0
258.6
0.0
180.0
0.0
13.7
0.0
3.1
248.3

C.;J.U.A. WELL 21C1
(IHRIGATION)
T12S R12E SEC.21 BAB
DATE
EC
PH
'IA
KCA
MG
CL
HCO3
CO3
SO4
NH3
NO2/3
KJN
TOTN
HARE
1/17/75
1.05
7.19
108.3
6.6
110.7
12.1
104.0
292.8
0.0
0.0
0.0
24.7
0.0
5.6
326.3
6/11/75
1.15
7.30
102.5
4.8
117.3
12.9
106.0
295.2
0.0
0.0
0.0
21.4
0.0
4.8
346.1
8/21/75
1.10
7.35
108.0
5.9
105.5
11.8
90.0
268.4
0.0
0.0
0.0
19.6
0.0
4.4
312.1
4/ 8/76
1.05
7.25
98.5
2.0
103.5
11.4
83.0
283.0
0.0
0.0
0.0
13.3
0.0
3.0
305.5
2/17/77
1.03
7.30
100.4
2.2
101.6
11.7
72.0
280.6
0.0
240.0
0.0
25.4
0.0
5.7
301.9
2/25/77
1.10
7.40
99.2
2.2
104.1
11.7
74.0
285.5
0.0
260.0
0.0
25.9
0.0
5.9
308.2
m 13/10/77
1.10
7.60
96.8
1.8
102.9
13.0
74.0
280.6
0.0
230.0
0.0
24.8
0.0
5.6
310.5
N ...,
3/25/77
1.00
7.45
99.2
1.9
104.1
12.6
70.0
275.7
0.0
210.0
0.0
25.3
0.0
5.7
311.5
4/22/77
.70
7.20
92.0
1.7
111.3
11.6
66.0
274.5
0.0
195.0
0.0
23.6
0.0
5.3
325.8
6/ 6/77
1.02
7.52
119.8
3.5
102.5
15.7
67.5
283.0
0.0
200.0
0.0
15.9
0.0
3.6
320.7
7/ 5/77
1.Oó
7.30
98.0
2.5
82.5
14.3
71.0
27b.2
0.0
185.0
0.0
26.1
0.0
5.9
265.0
8/12/77
1.20
7.70
87.0
3.0
81.5
12.2
74.0
268.4
0.0
65.0
0.0
19.0
0.0
4.3
253.8
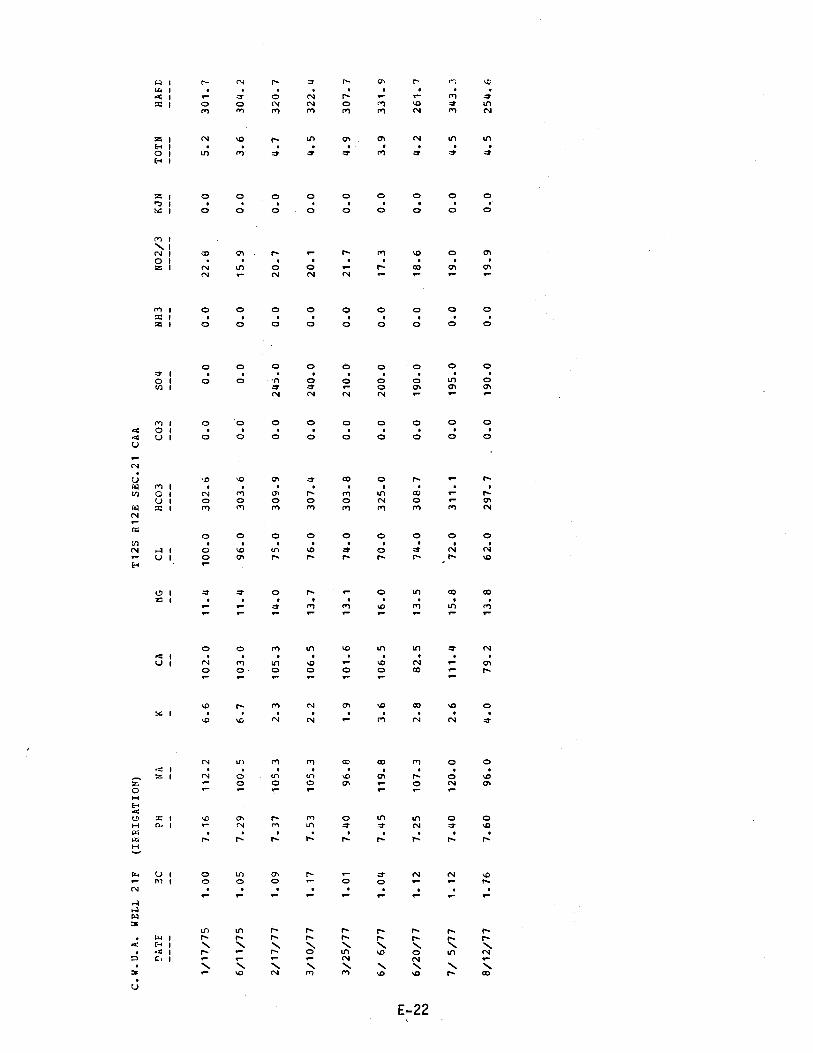
C.W.U.A. WELL 21F
(IFRIGATION)
T12S R12E SEC.21 CAA
DATE
3C
PH
NA
KCA
MG
CL
HCO3
CO3
SO4
NH3
NO2/3
KJN
TOTN
RAFE
----
--
--
--
---
--
--
----
---
---
---
---
----
----
1/17/75
1.00
7.16
112.2
6.6
102.0
11.4
100.0
302.6
0.0
0.0
0.0
22.8
0.0
5.2
301.7
6/11/75
1.05
7.29
100.5
6.7
103.0
11.4
96.0
303.6
0.0
0.0
0.0
15.9
0.0
3.6
304.2
2/17/77
1.09
7.37
105.3
2.3
105.3
14.0
75.0
309.9
0.0
24.0
0.0
20.7
0.0
4.7
320.7
3/10/77
1.17
7.53
105.3
2.2
106.5
13.7
76.0
307.4
0.0
240.0
0.0
20.1
0.0
4.5
322.4
3/25/77
1.01
7.40
96.8
1.9
101.6
13.1
74.0
303.8
0.0
210.0
0.0
21.7
0.0
4.9
307.7
6/ 6/77
1.04
7.45
119.8
3.6
106.5
16.0
70.0
325.0
0.0
200.0
0.0
17.3
0.0
3.9
331.9
m Ñ6/20/77
1.12
7.25
107.3
2.8
82.5
13.5
74.0
308.7
0.0
190.0
0.0
18.6
0.0
4.2
261.7
N
7/ 5/77
1.12
7.40
120.0
2.6
111.4
15.8
72.0
311.1
0.0
195.0
0.0
19.0
0.0
4.5
343.3
8/12/77
1.76
7.60
96.0
4.0
79.2
13.8
62.0
297.7
0.0
190.0
0.0
19.9
0.0
4.5
254.6

C.W.U.A. WELL 21K
(IPRIGATION)
T12S P.12E SEC.21 CAD
DATE
EC
PH
NA
KCA
MG
CL
HCO3
CO3
SO4
NH3
NO2/3
KJN
TGTN
HARD
----
--
--
--
---
--
--
----
---
---
---
---
----
----
6/11/75
1.10
7.23
108.5
7.2
98.7
12.8
95.0
317.2
0.0
0.0
0.0
9.8
0.0
2_2
299.2
8/21/75
1.14
7.41
129.0
6.4
94.5
11.8
87.0
300.1
0.0
0.0
0.0
21.4
0.0
4.8
284.6
4/ 8/76
1.12
7.22
120.0
2.8
102.0
12.4
85.5
322.1
0.0
0.0
0.0
20.5
0.0
4.6
305.E
3/10/77
.84
7.42
116.2
2.3
102.9
12.0
88.0
312.3
0.0
200.0
0.0
18.0
0.0
4.1
306.4
3/25/77
.98
7.45
110.1
2.3
105.3
11.9
82.0
312.3
0.0
198.0
0.0
18.6
0.0
4.2
312.0
6/ 6/77
1.09
7.40
135.8
3.5
98.5
13.8
84.0
313.5
0.0
190.0
0.0
15.9
0.0
3.6
302.9
6/20/77
1.09
7.22
113.9
2.5
80.3
12.4
81.0
316.0
0.0
185.0
0.0
19.0
0.0
4.3
251.6
m i Co
7/ 5/77
1.16
7.30
183.0
2.5
74.4
14.0
80.0
312.3
0.0
190.0
0.0
21.3
0.0
4.8
243.5
8/12/77
1.22
7.60
105.5
4.6
71.0
12.6
76.0
229.4
0.0
170.0
0.0
20.4
0.0
4.6
229.2

C. W. U. A. WELL
DATE
----
210
EC
--
(IP.NIGATION)
PH
NA
--
--
K -CA--
MG--
T12S R12E SEC.21
CL
HCO3
--
----
DCD CO3
---
SO4
---
NH3
---
NO2/3
KJN
---
TOTN
----
HARD
----
8/21/75
1.08
7.40
116.0
6.1
89.5
12.5
84.0
310.0
0.0
0.0
0.0
18.3
0.0
4.1
275.0
4/ 8/76
1.09
7.30
98.0
2.4
89.0
13.5
82.5
329.4
0.0
0.0
0.0
19.2
0.0
4.3
277.9
3/25/77
1.00
7.35
111.3
2.2
96.8
13.0
79.0
319.6
0.0
195.0
0.0
17.3
0.0
3.9
295.3
4/ 1/77
1.11
7.26
104.1
1.7
92.0
12.8
79.0
317.2
0.0
175.0
0.0
17.3
0.0
3.9
282.5
6/20/77
1.10
7.26
115.5
2.5
75.9
13.2
79.0
320.9
0.0
170.0
0.0
15.9
0.0
3.6
243.9
7/ 5/77
1.13
7.40
115.0
1.6
100.8
15.3
78.0
323.3
0.0
180.0
0.0
18.2
0.0
4.1
314.E
8/12/77
1.28
7.70
110.0
3.2
77.0
14.0
73.0
312.3
0.0
130.0
0.0
17.3
0.0
3.9
250.0
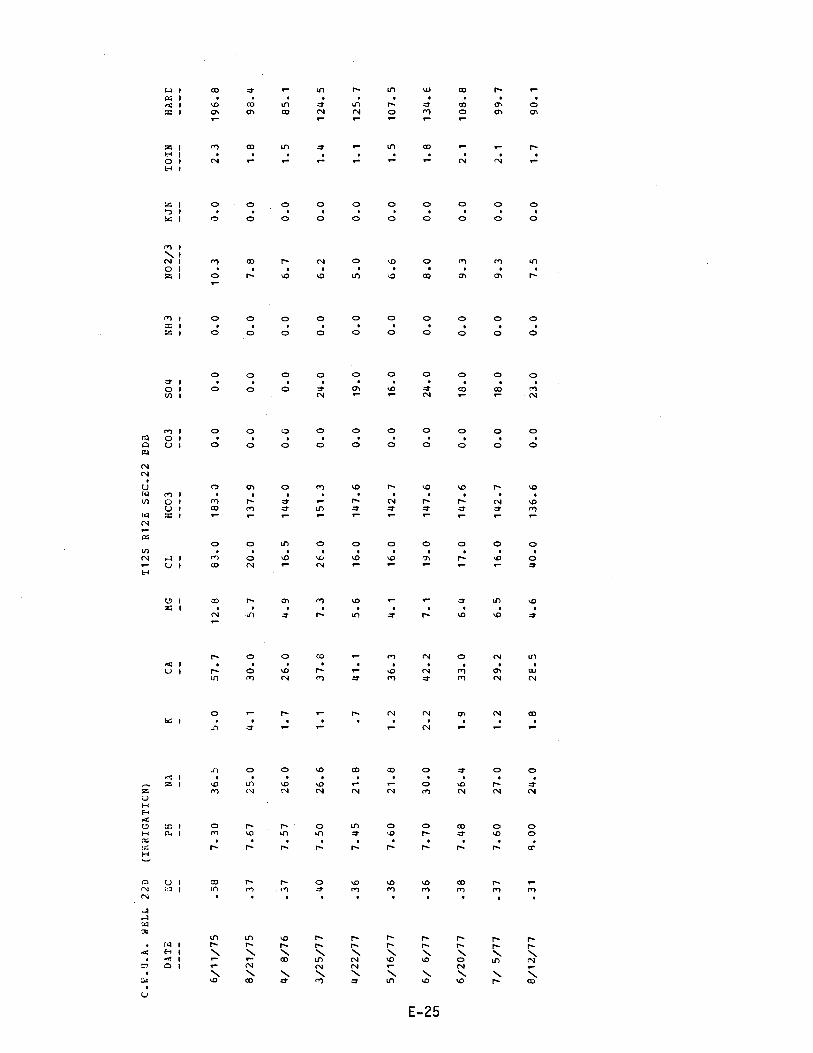
C.}:.!J.A. WELL 220
(IRRIGATION)
T12S R12E SEC.22 BDB
DATE
3C
PH
NA
KCA
MG
CL
HCO3
CO3
SO4
NH3
NO2/3
KJN
TOIN
HARE
----
--
--
--
---
--
--
----
---
---
---
---
----
----
6/11/75
.58
7.30
36.5
5.0
57.7
12.8
83.0
183.0
0.0
0.0
0.0
10.3
0.0
2.3
196.8
8/21/75
.37
7.67
25.0
4.1
30.0
5.7
20.0
137.9
0.0
0.0
0.0
7.8
0.0
1.8
98.4
4/ 8/76
.37
7.57
26.0
1.7
26.0
4.9
16.5
144.0
0.0
0.0
0.0
6.7
0.0
1.5
85.1
3/25/77
.40
7.50
26.6
1.1
37.8
7.3
26.0
151.3
0.0
24.0
0.0
6.2
0.0
1.4
124.5
4/22/77
.36
7.45
21.8
.7
41.1
5.6
16.0
147.6
0.0
19.0
0.0
5.0
0.0
1.1
125.7
5/16/77
.36
7.60
21.8
1.2
36.3
4.1
16.0
142.7
0.0
16.0
0.0
6.6
0.0
1.5
107.5
m Ñ6/ 6/77
.36
7.70
30.0
2.2
42.2
7.1
19.0
147.6
0.0
24.0
0.0
8.0
0.0
1.8
134.6
ci
6/20/77
.38
7.48
26.4
1.9
33.0
6.4
17.0
147.6
0.0
18.0
0.0
9.3
0.0
2.1
108.8
7/ 5/77
.37
7.60
27.0
1.2
29.2
6.5
16.0
142.7
0.0
18.0
0.0
9.3
0.0
2.1
99.7
8/12/77
.31
8.00
24.0
1.8
28.5
4.6
40.0
136.6
0.0
23.0
0.0
7.5
0.0
1.7
90.1
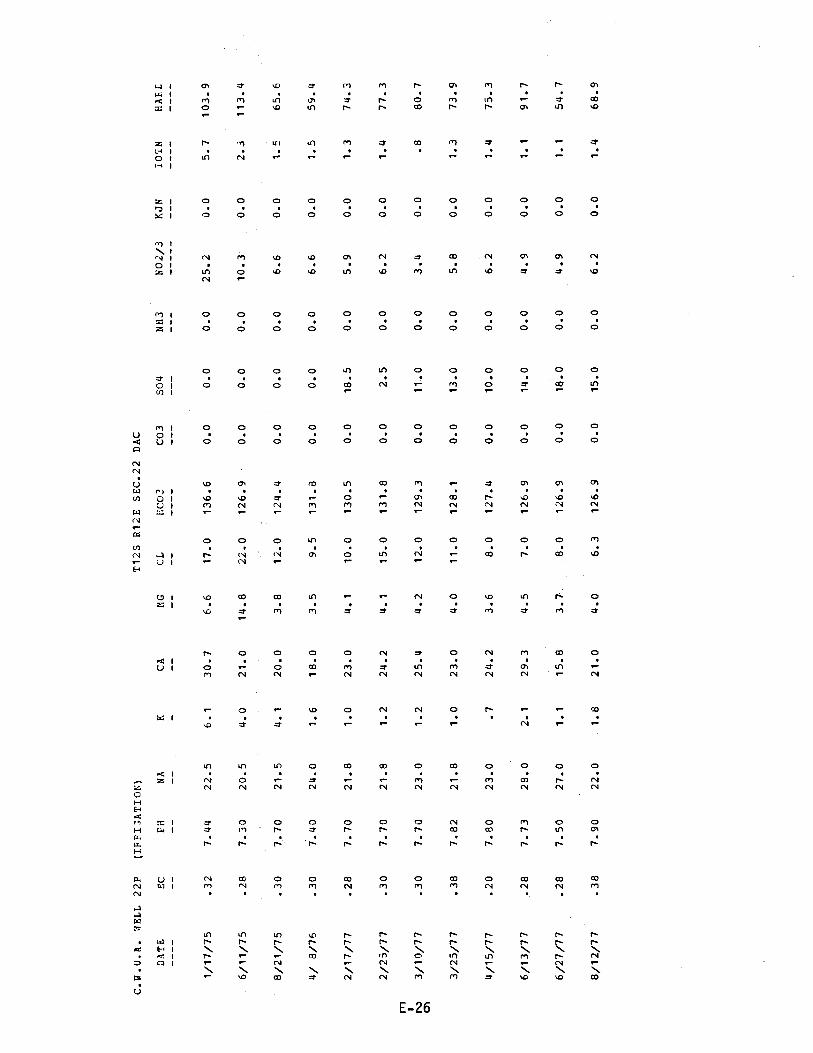
C.H.O.A. WELL 22P
(IP°I:,ATIOt:)
T12S R12E SEC.22 DAC
DATE
EC
PH
NA
KCA
MG
CL
HCO3
CO3
SO4
NH3
NO2/3
KJN
IOiN
HARE
----
--
--
--
---
--
--
----
---
---
---
---
----
----
1/17/75
.32
7.44
22.5
6.1
30.7
6.6
17.0
136.6
0.0
0.0
0.0
25.2
0.0
5.7
103.9
6/11/75
.28
7.30
20.5
4.0
21.0
14.8
22.0
126.9
0.0
0.0
0.0
10.3
0.0
2.3
113.4
8/21/75
.30
7.70
21.5
4.1
20.0
3.8
12.0
124.4
0.0
0.0
0.0
6.6
0.0
1.5
65.6
4/ 8/76
.30
7.40
24.0
1.6
18.0
3.5
9.5
131.8
0.0
0.0
0.0
6.6
0.0
1.5
59.4
2/17/77
.28
7.70
21.8
1.0
23.0
4.1
10.0
130.5
0.0
18.5
0.0
5.9
0.0
1.3
74.3
2/25/77
.30
7.70
21.8
1.2
24.2
4.1
15.0
131.8
0.0
2.5
0.0
6.2
0.0
1.4
77.3
m Ñ3/10/77
.30
7.70
23.0
1.2
25.4
4.2
12.0
129.3
0.0
11.0
0.0
3.4
0.0
.8
80.7
ch
3/25/77
.38
7.82
21.8
1.0
23.0
4.0
11.0
128.1
0.0
13.0
0.0
5.8
0.0
1.3
73.9
4/15/77
.20
7.80
23.0
.7
24.2
3.6
8.0
127.4
0.0
10.0
0.0
6.2
0.0
1.4
75.3
6/13/77
.28
7.73
28.0
2.1
29.3
4.5
7.0
126.9
0.0
14.0
0.0
4.9
0.0
1.1
91.7
6/27/77
.28
7.50
27.0
1.1
15.8
3.7.
8.0
126.9
0.0
18.0
0.0
4.9
0.0
1.1
54.7
8/12/77
.38
7.90
22.0
1.8
21.0
4.0
6.3
126.9
0.0
15.0
0.0
6.2
0.0
1.4
68.9

(IRRIGATION)
T12S R12E SEC.22DDC
DATE
EC
P9
NA
KCA
MG
CL
HCO3
CO3
SO4
NH3
NC2/3
KJN
TOTN
HARD
6/27/77
.57
7.30
54.5
2.0
33.0
9.4
29.0
169.6
0.0
75.0
0.0
12.8
0.0
2.9
121.1
7/ 5/77
.56
7.40
50.5
1.8
28.1
15.8
28.0
170.8
0.0
75.0
0.0
14.2
0.0
3.2
135.3
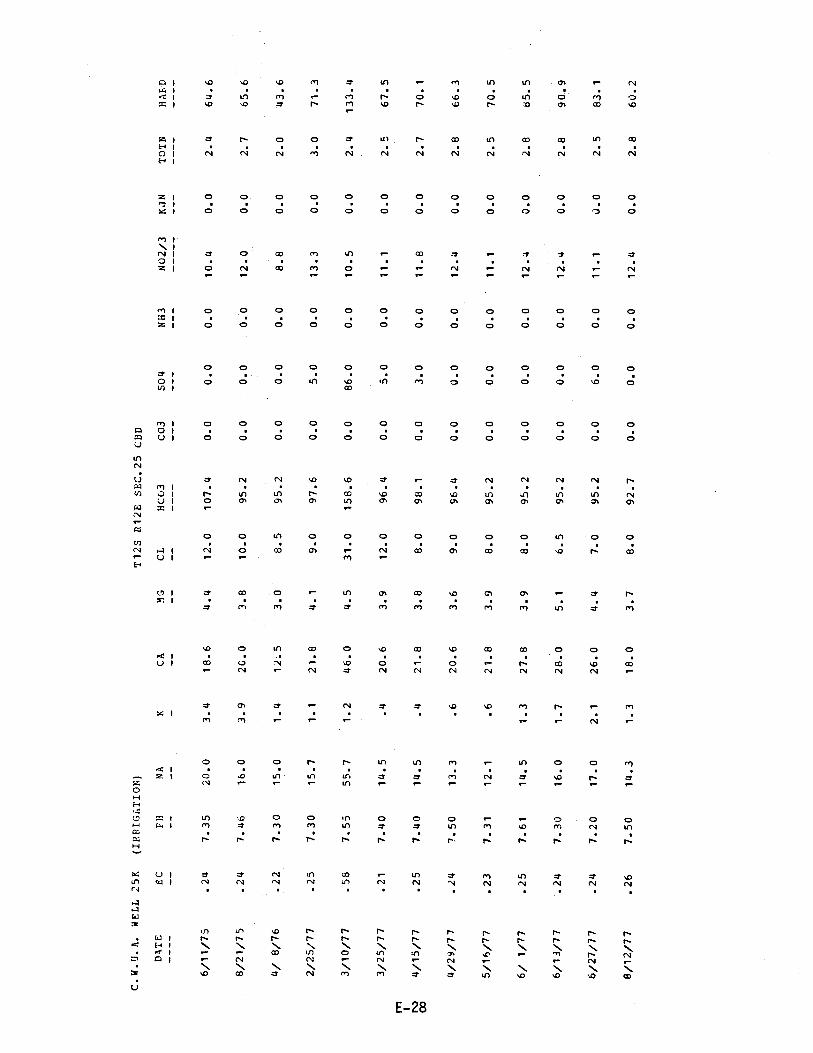
C. W. U. A.
WELL 25K
(IRRIGATION)
T12S R12E SEC.25 CBD
DATE
EC
PH
NA
KCA
MG
CL
HCG3
CO3
SO4
NH3
NO2/3
KJN
TOTN
HAED
----
--
--
--
---
--
--
--
---
---
---
---
----
----
6/11/75
.24
7.35
20.0
3.4
18.6
4.4
12.0
107.4
0.0
0.0
0.0
10.4
0.0
2.4
64.6
8/21/75
.24
7.46
16.0
3.9
20.0
3.8
10.0
95.2
0.0
0.0
0.0
12.0
0.0
2.7
65.6
4/ 8/76
.22
7.30
15.0
1.4
12.5
3.0
8.5
95.2
0.0
0.0
0.0
8.8
0.0
2.0
43.6
2/25/77
.25
7.30
15.7
1.1
21.8
4.1
9.0
97.6
0.0
5.0
0.0
13.3
0.0
3.0
71.3
3/10/77
.58
7.55
55.7
1.2
46.0
4.5
31.0
158.6
0.0
86.0
0.0
10.5
0.0
2.4
133.4
3/25/77
.21
7.40
14.5
.4
20.6
3.9
12.0
96.4
0.0
5.0
0.0
11.1
0.0
2.5
67.5
m CO
4/15/77
.25
7.40
14.5
.4
21.8
3.8
8.0
98.1
0.0
3.0
0.0
11.8
0.0
2.7
70.1
4/29/77
.24
7.50
13.3
.6
20.6
3.6
9.0
96.4
0.0
0.0
0.0
12.4
0.0
2.8
66.3
5/16/77
.23
7.31
12.1
.6
21.8
3.9
8.0
95.2
0.0
0.0
0.0
11.1
0.0
2.5
70.5
6/ 1/77
.25
7.61
14.5
1.3
27.8
3.9
8.0
95.2
0.0
0.0
0.0
12.4
0.0
2.8
85.5
6/13/77
.24
7.30
16.0
1.7
28.0
5.1
6.5
95.2
0.0
0.0
0.0
12.4
0.0
2.8
90.9
6/27/77
.24
7.20
17.0
2.1
26.0
4.4
7.0
95.2
0.0
6.0
0.0
11.1
u.0
2.5
83.1
8/12/77
.26
7.50
14.3
1.3
18.0
3.7
8.0
92.7
0.0
0.0
0.0
12.4
0.0
2.8
60.2
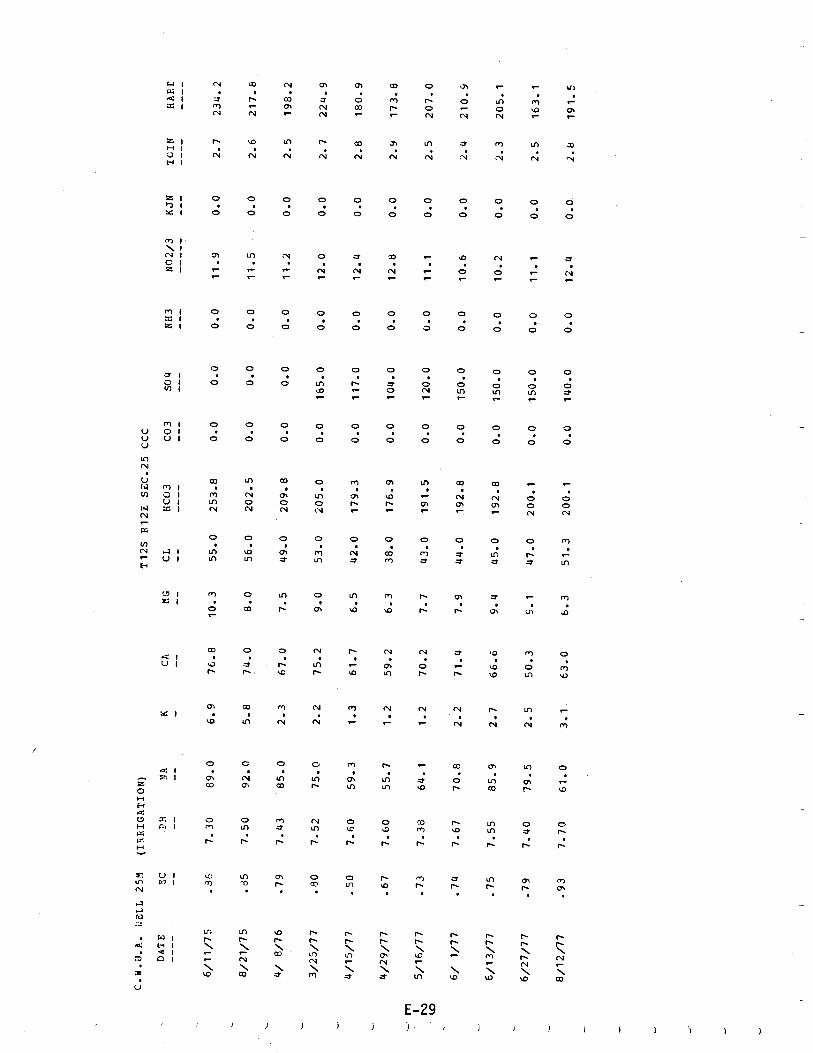
C.B.U.A. HELL 25M
(IRRIGATION)
T12S R12E SEC.25 CCC
DATE
EC
PH
NA
KCA
MG
CL
HCO3
CO3
SO4
NH3
NO2/3
KJN
TCTN
HARE
----
--
--
--
---
--
--
----
---
---
---
---
----
----
6/11/75
.36
7.30
89.0
6.9
76.8
10.3
55.0
253.8
0.0
0.0
0.0
11.9
0.0
2.7
234.2
8/21/75
.35
7.50
92.0
5.8
74.0
8.0
56.0
202.5
0.0
0.0
0.0
11.5
0.0
2.6
217.8
4/ 8/76
.79
7.43
85.0
2.3
67.0
7.5
49.0
209.8
0.0
0.0
0.0
11.2
0.0
2.5
198.2
3/25/77
.80
7.52
75.0
2.2
75.2
9.0
53.0
205.0
0.0
185.0
0.0
12.0
0.0
2.7
224.9
4/15/77
.50
7.60
59.3
1.3
61.7
6.5
42.0
179.3
0.0
117.0
0.0
12.4
0.0
2.8
180.9
4/29/77
.67
7.60
55.7
1.2
59.2
6.3
38.0
176.9
0.0
104.0
0.0
12.8
0.0
2.9
173.8
- m
5/16/77
.73
7.38
64.1
1.2
70.2
7.7
43.0
191.5
0.0
120.0
0.0
11.1
0.0
2.5
207.0
UD
6/ 1/77
.74
7.67
70.8
2.2
71.4
7.9
44.0
192.8
0.0
150.0
0.0
10.6
0.0
2.4
210.9
6/13/77
.75
7.55
85.9
2.7
66.6
9.4
45.0
192.8
0.0
150.0
0.0
10.2
0.0
2.3
205.1
6/27/77
.79
7.40
79.5
2.5
50.3
9.1
47.0
200.1
0.0
150.0
0.0
11.1
0.0
2.5
163.1
8/12/77
.93
7.70
61.0
3.1
63.0
8.3
51.3
200.1
0.0
140.0
0.0
12.4
0.0.
2.8
191.5
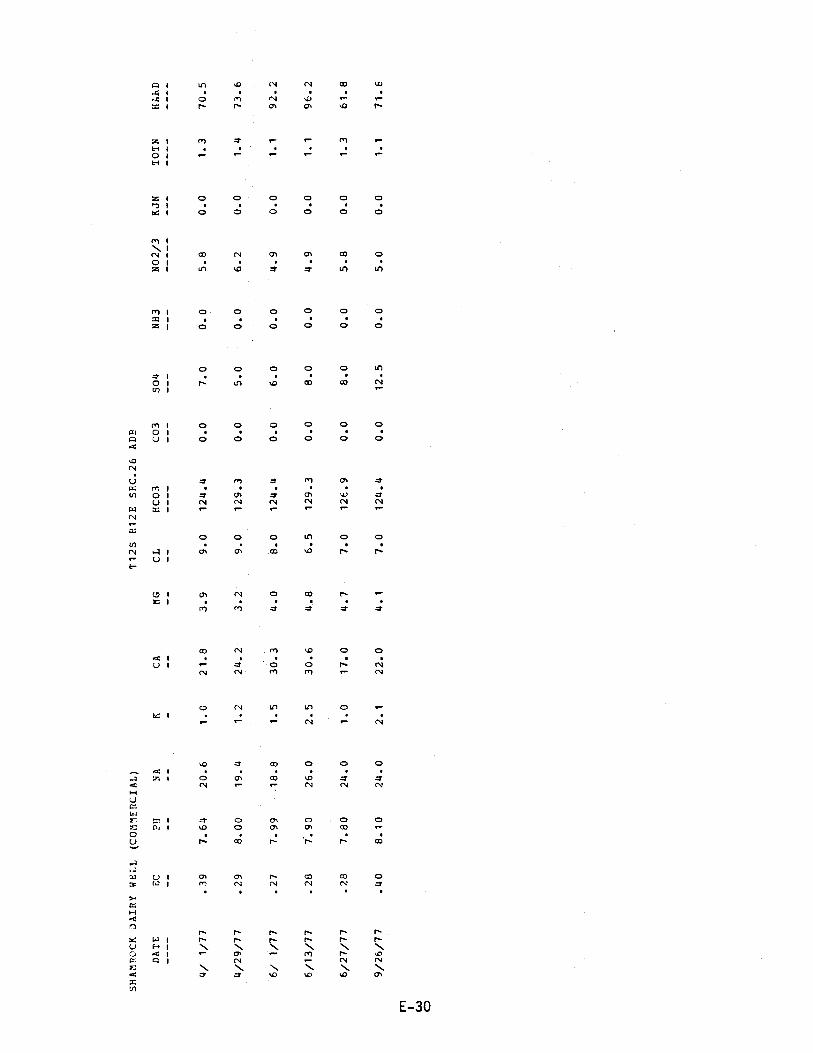
SHAMROCK DAIRY WELL (COMMERCIAL)
T12S R12E SEC.26 ADP
DATE
EC
PH
NA
KCA
MG
CL
HCO3
CO3
SO4
NH3
NO2/3
KJN
TOTN
HARD
----
--
--
--
---
--
--
----
---
---
---
---
----
----
4/ 1/77
.39
7.64
20.6
1.0
21.8
3.9
9.0
124.4
0.0
7.0
0.0
5.8
0.0
1.3
70.5
4/29/77
.29
8.00
19.4
1.2
24.2
3.2
9.0
129.3
0.0
5.0
0.0
6.2
0.0
1.4
73.6
6/ 1/77
.27
7.99
18.8
1.5
30.3
4.0
8.0
124.4
0.0
6.0
0.0
4.9
0.0
1.1
92.2
6/13/77
.28
7.90
26.0
2.5
30.6
4.8
6.5
129.3
0.0
8.0
0.0
4.9
0.0
1.1
96.2
6/27/77
.28
7.80
24.0
1.0
17.0
4.7
7.0
126.9
0.0
8.0
0.0
5.8
0.0
1.3
61.8
9/26/77
.40
8.10
24.0
2.1
22.0
4.1
7.0
124.4
0.0
12.5
0.0
5.0
0.0
1.1
71.6

C.W.U.A. 'JELL 26E
(IRRIGATION)
T12S R12E SEC.26 BBD
DATE
EC
PH
NA
KCA
MG
CL
HCO3
CO3
SO4
NH3
NO2/3
KJN
TCTN
HAFC
----
--
--
--
---
--
--
----
---
---
---
---
----
----
1/17/75
.47
7.30
37.2
6.1
50.0
6.8
31.0
153.7
0.0
0.0
0.0
27.2
0.0
6.1
152.9
6/11/75
.52
7.28
51.5
4.8
42.3
5.5
34.0
158.6
0.0
0.0
0.0
15.2
0.0
3.4
128.3
8/21/75
.40
7.40
28.0
4.2
32.5.
5.7
20.0
133.0
0.0
0.0
0.0
12.1
0.0
2.7
104.6
4/ 8/76
.38
7.30
28.5
1.1
26.0
5.2
16.0
144.0
0.0
0.0
0.0
11.8
0.0
2.7
8b.4
2/17/77
.35
7.40
26.6
1.2
31.5
4.5
14.0
136.6
0.0
23.0
0.0
12.1
0.0
2.7
97.2
2/25/77
.35
7.30
26.6
1.3
31.5
5.2
14.0
139.1
0.0
21.0
0.0
11.0
0.0
2.5
100.1
m I GO
3/10/77
.39
7.30
27.8
1.0
30.3
5.0
15.0
129.3
0.0
22.0
0.0
11.2
0.0
2.5
96.3
3/25/77
.31
7.41
25.4
.5
27.8
5.1
15.0
128.1
0.0
22.0
0.0
11.1
0.0
2.5
90.4
4/15/77
.35
7.40
24.2
.5
30.3
4.7
15.0
128.1
0.0
15.5
0.0
10.5
0.0
2.4
95.0
5/16/77
.33
7.30
21.8
1.2
31.5
4.8
12.0
126.9
0.0
16.0
0.0
10.6
0.0
2.4
98.4
6/ 1/77
.34
7.50
23.6
1.6
35.1
4.7
13.0
122.0
0.0
20.0
0.0
11.1
0.0
2.5
107.0
6/27/77
.34
7.30
0.0
0.0
0.0
0.0
0.0
126.9
0.0
18.0
0.0
10.6
0.0
2.4
0.0
8/12/77
.40
7.60
25.5
1.4
24.5
5.0
13.0
126.9
0.0
20.0
0.0
10.6
0.0
2.4
81.6
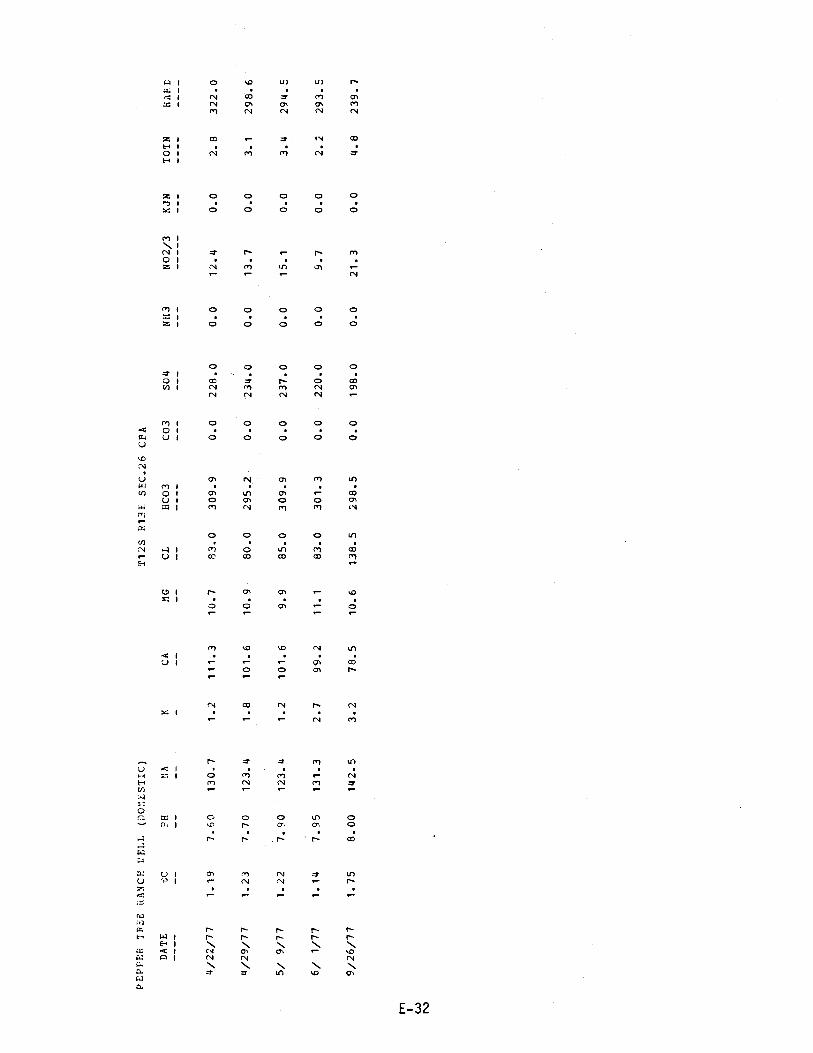
PEPPER TREE
DATE
RANCH STELL
(DO';ESTIC)
EC
PH
NA
KCA
MG
T12S
CL
R13E SEC.26 CPA
HCO3
CO3
SO4
NH3
NO2/3
KJN
TOTN
HARE
4/22/77
1.19
7.60
130.7
1.2
111.3
10.7
83.0
309.9
0.0
228.0
0.0
12.4
0.0
2.8
322.0
4/29/77
1.23
7.70
123.4
1.8
101.6
10.9
80.0
295.2
0.0
234.0
0.0
13.7
0.0
3.1
298.6
5/ 9/77
1.22
7.90
123.4
1.2
101.6
9.9
85.0
309.9
0.0
237.0
0.0
15.1
0.0
3.4
294.5
6/ 1/77
1.14
7.95
131.3
2.7
99.2
11.1
83.0
301.3
0.0
220.0
0.0
9.7
0.0
2.2
293.5
9/26/77
1.75
8.00
142.5
3.2
78.5
10.6
138.5
298.5
0.0
198.0
0.0
21.3
0.0
4.8
239.7
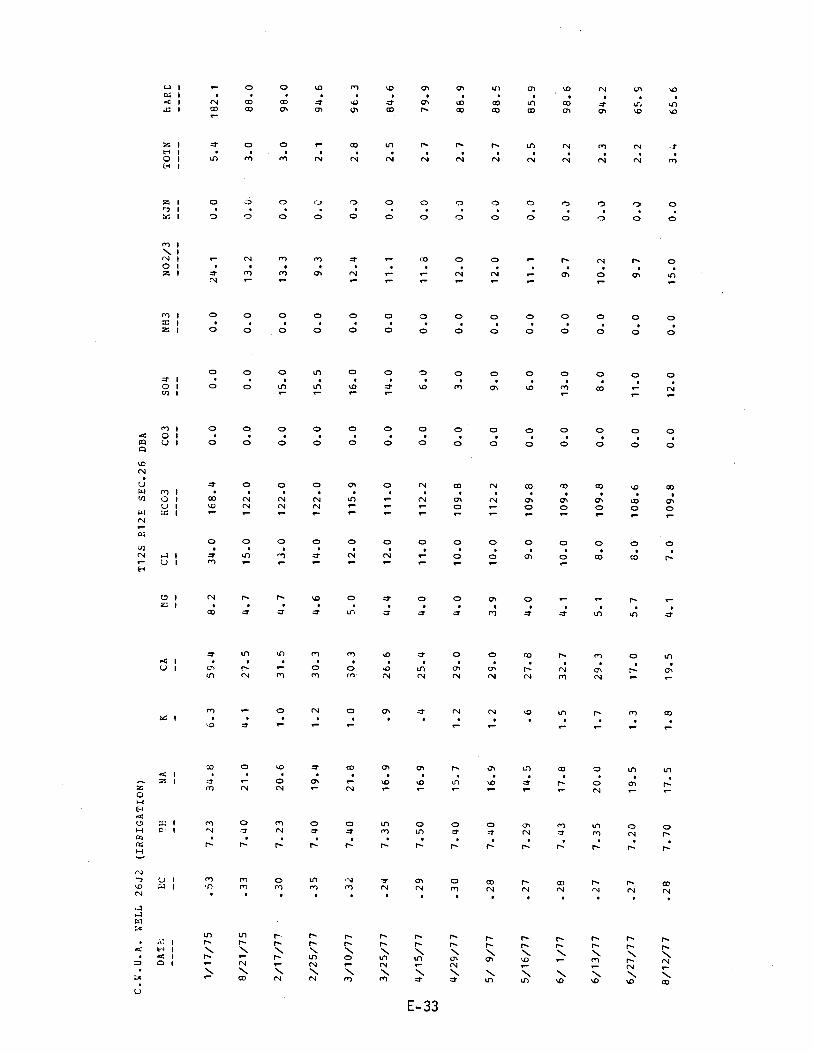
C.u.U.A. ;;ELL 26J2 (IRRIGATION)
T12S R12E SEC.26 DBA
DAT?
EC
nH
NA
KCA
HG
CL
HCO3
CO3
SO4
NH3
NO2/3
KJN
TOTN
HARE
----
--
--
--
---
--
--
----
---
---
---
---
----
----
1/17/75
.53
7.23
34.8
6.3
59.4
8.2
34.0
168.4
0.0
0.0
0.0
24.1
0.0
5.4
182.1
8/21/75
.33
7.40
21.0
4.1
27.5
4.7
15.0
122.0
0.0
0.0
0.0
13.2
0.0
3.0
88.0
2/17/77
.30
7.23
20.6
1.0
31.5
4.7
13.0
122.0
0.0
15.0
0.0
13.3
0.0
3.0
98.0
2/25/77
.35
7.40
19.4
1.2
30.3
4.6
14.0
122.0
0.0
15.5
0.0
9.3
0.0
2.1
94.6
3/10/77
.32
7.40
21.8
1.0
30.3
5.0
12.0
115.9
0.0
16.0
0.0
12.4
0.0
2.8
96.3
3/25/77
.24
7.35
16.9
.9
26.6
4.4
12.0
111.0
0.0
14.0
0.0
11.1
0.0
2.5
84.6
m 14/15/77
.29
7.50
16.9
.4
25.4
4.0
11.0
112.2
0.0
6.0
0.0
11.8
0.0
2.7
79.9
t,J C...
)
4/29/77
.30
7.40
15.7
1.2
29.0
4.0
10.0
109.8
0.0
3.0
0.0
12.0
0.J
2.7
88.9
5/ 9/77
.28
7.40
16.9
1.2
29.0
3.9
10.0
112.2
0.0
9.0
0.0
12.0
0.0
2.7
88.5
5/16/77
.27
7.29
14.5
.6
27.8
4.0
9.0
109.8
0.0
6.0
0.0
11.1
0.0
2.5
85.9
6/ 1/77
.28
7.43
17.8
1.5
32.7
4.1
10.0
109.8
0.0
13.0
0.0
9.7
0.0
2.2
98.6
6/13/77
.27
7.35
20.0
1.7
29.3
5.1
8.0
109.8
0.0
8.0
0.0
10.2
0.0
2.3
94.2
6/27/77
.27
7.20
19.5
1.3
17.0
5.7
8.0
108.6
0.0
11.0
0.0
9.7
0.0
2.2
65.5
8/12/77
.28
7.70
17.5
1.8
19.5
4.1
7.0
109.8
0.0
12.0
0.0
15.0
0.0
3.4
65.6
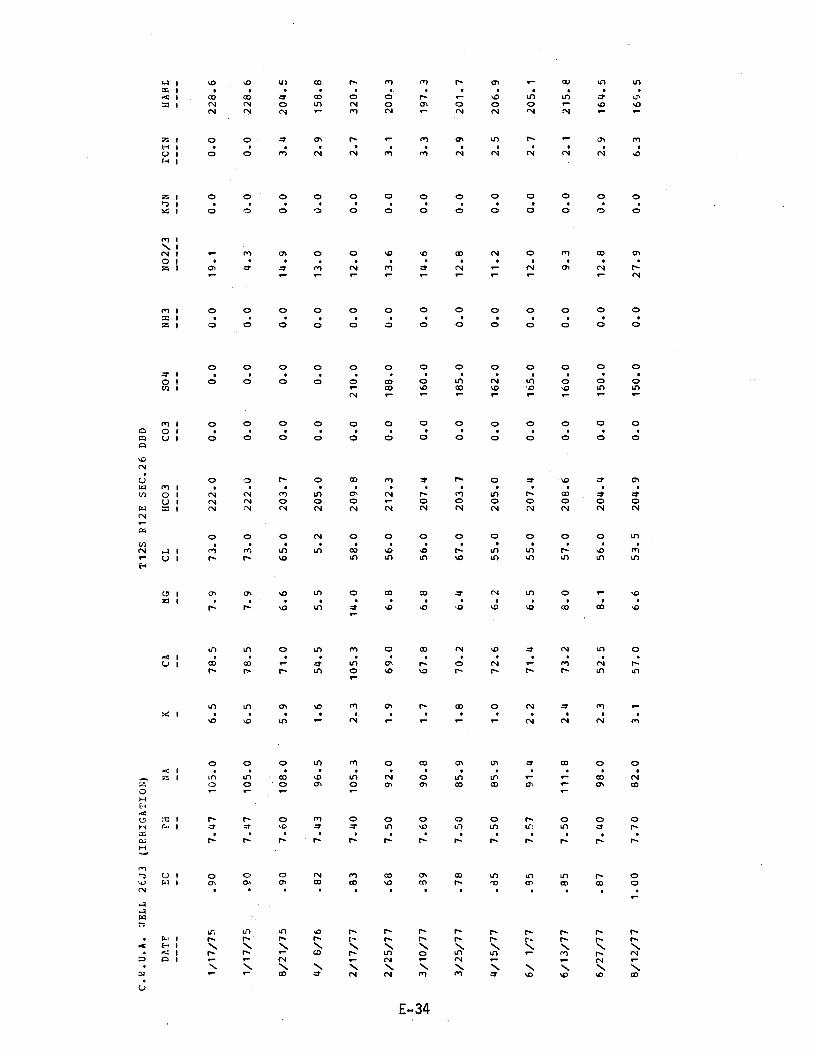
C.E.U.A. JELL 2603 (IPHIGATIO?:)
T12S B12E SEC-26 DBD
DAT£
EC
PH
NA
KCA
MG
CL
HCO3
CO3
SO4
NH3
NO2/3
KJN
TCTN
BABE
----
--
--
--
---
--
--
----
---
---
---
---
----
----
1/17/75
.90
7.47
105.0
6.5
78.5
7.9
73.0
222.0
0.0
0.0
0.0
19.1
0.0
0.0
228.6
1/17/75
.90
7.47
105.0
6.5
78.5
7.9
73.0
222.0
0.0
0.0
0.0
4.3
0.0
0.0
228.6
8/21/75
.90
7.60
108.0
5.9
71.0
6.6
65.0
203.7
0.0
0.0
0.0
14.9
0.0
3.4
204.5
4/ 8/76
.82
7.43
96.5
1.6
54.5
5.5
5.2
205.0
0.0
0.0
0.0
13.0
J.0
2.9
158.8
2/17/77
.83
7.40
105.3
2.3
105.3
14.0
58.0
209.8
0.0
210.0
0.0
12.0
0.0
2.7
320.7
2/25/77
.68
7.50
92.0
1.9
69.0
6.8
56.0
212.3
0.0
188.0
0.0
13.6
0.0
3.1
200.3
m 1 GJ
.3/10/77
.39
7.60
90.8
1.7
67.8
6.8
56.0
207.4
0.0
160.0
0.0
14.6
0.0
3.3
197.3
p
3/25/77
.78
7.50
85.9
1.8
70.2
6.4
67.0
203.7
0.0
185.0
0.0
12.8
0.0
2.9
201.7
4/15/77
.85
7.50
85.9
1.0
72.6
6.2
55.0
205.0
0.0
162.0
0.0
11.2
0.0
2.5
206.9
6/ 1/77
.95
7.57
91.4
2.2
71.4
6.5
55.0
207.4
0.0
165.0
0.0
12.0
0.0
2.7
205.1
6/13/77
.85
7.50
111.8
2.4
73.2
8.0
57.0
208.6
0.0
160.0
0.0
9.3
0.0
2.1
215.8
6/27/77
.87
7.40
98.0
2.3
52.5
8.1
56.0
204.4
0.0
150.0
0.0
12.8
0.0
2.9
164.5
8/12/77
1.00
7.70
82.0
3.1
57.0
6.6
53.5
204.9
0.0
150.0
0.0
27.9
0.0
6.3
165.5
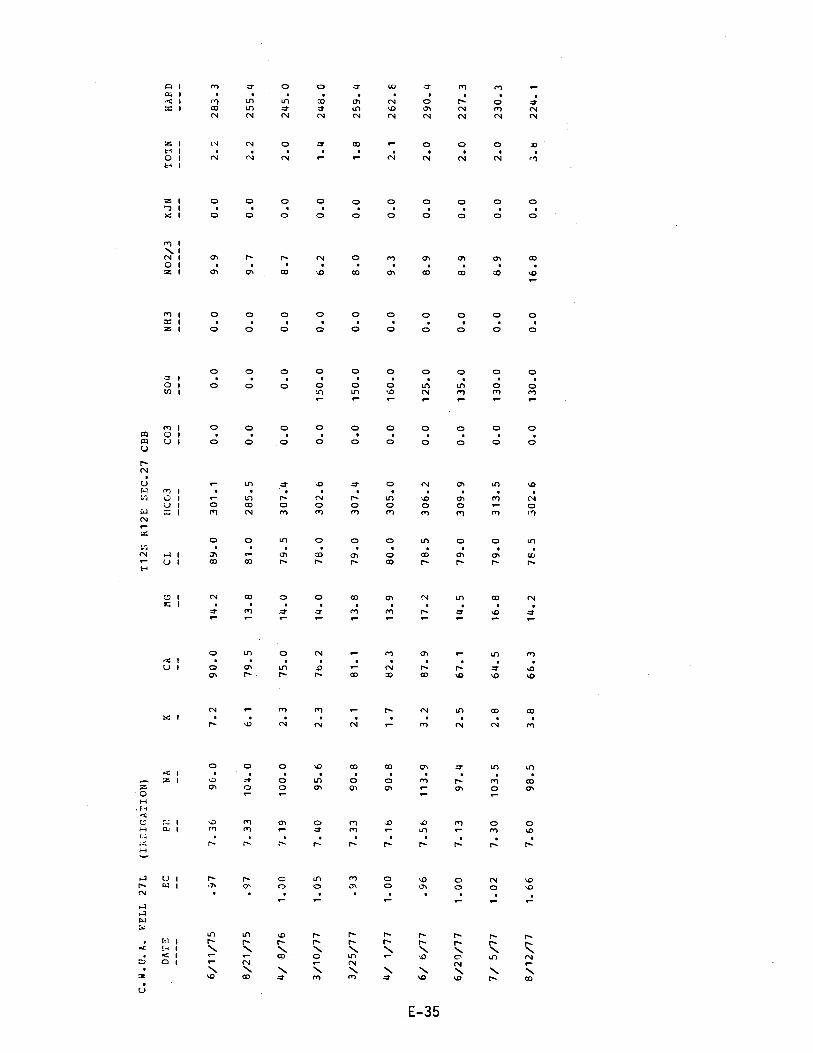
C.A.U.A. WELL 27L
(IF.IGATION)
T12S R12E SEC.27 CBS
DATE
EC
Pi'.
NA
KCA
[9G
CL
HCO3
CO3
SO4
NH3
NO2/3
KJN
TOTN
HARD
----
--
--
--
---
--
--
----
---
---
---
---
----
----
6/11/75
.97
7.36
96.0
7.2
90.0
14.2
89.0
301.1
0.0
0.0
0.0
9.9
0.0
2.2
283.3
8/21/75
.97
7.33
104.0
6.1
79.5
13.8
81.0
285.5
0.0
0.0
0.0
9.7
0.0
2.2
255.4
4/ 8/76
1.00
7.19
100.0
2.3
75.0
14.0
79.5
307.4
0.0
0.0
0.0
8.7
0.0
2.0
245.0
3/10/77
1.05
7.40
95.6
2.3
76.2
14.0
78.0
302.6
0.0
150.0
0.0
6.2
0.0
1.4
248.0
3/25/77
.93
7.33
90.8
2.1
81.1
13.8
79.0
307.4
0.0
150.0
0.0
8.0
0.0
1.8
259.4
4/ 1/77
1.00
7.18
90.8
1.7
82.3
13.9
80.0
305.0
0.0
160.0
0.0
9.3
0.0
2.1
262.E
m 1
6/ 6/77
.96
7.56
113.9
3.2
87.9
17.2
78.5
306.2
0.0
125.0
0.0
8.9
0.0
2.0
290.4
w on
6/20/77
1.00
7.13
97.4
2.5
67.1
14.5
79.0
309.9
0.0
135.0
0.0
8.9
0.0
2.0
227.3
7/ 5/77
1.02
7.30
103.5
2.8
64.5
16.8
79.0
313.5
0.0
130.0
0.0
8.9
0.0
2.0
230.3
8/12/77
1.66
7.60
98.5
3.8
66.3
14.2
76.5
302.6
0.0
130.0
0.0
16.8
0.0
3.6
224.1

L. JOHNSON
(DOMES'TIC1
PIMA COUNTY ANALYSIS
T12S B12E SEC 27 CBB
DATE
EC
PH
NA
KCA
MG
CL
HCO3
CO3
SO4
NH3
NO2/3
KJN
TWIN
KAM'
12/13/76
.B0
7.40
133.1
0.0
106.5
9.7
70.0
158.6
0.0
121.0
0.0
9.3
0.0
2.1
305.9

J.OLMSTEAD
(DOMESTIC)
PIMA COUNTY ANALYSIS
T12S R12E SEC 27 CCD
DATE
EC
PH
NA
KCA
MG
CL
CO3
SO4
NH3
NO2/3
KJN
TOTN
HAfiE
----
--
--
--
---
--
--
----
---
---
---
---
----
----
12/13/76
.83
7.30
121.0
0.0
102.9
14.5
74.0
152.5
0.0
130.0
0.0
7.1
0.0
1.6
316.7

(DOMESTIC)
T12S 1112E SEC.28ADC
DATE
EC
PH
NA
KCA
MG
CL
HCO3
CO3
SO4
NH3
NO2/3
KJN
TOTN
HARE
----
--
--
--
---
--
--
----
---
---
---
---
----
----
9/26/77
1.50
7.80
91.0
3.4
84.5
15.2
136.0
301.2
0.0
189.0
0.0
22.1
0.0
5.0
273.7

ca 1ut
rt 1
1
1
M
Z I CO
N 1O 1N I
Z oh Ih4 1
M 1\ IN 1 OO Iz I w
M 1 OIz 1 O
0a 1O I .ON 1 -
M 1 OU O 1ca U I o
wN
10M 10 w(.../ 1 C(1
S 1
o.a I CO
U1 r
C9 I OI
MN
%.O
C 1CJ I
0
0I
ó
nti I
Z I .-
z I OM I
r
U I cf1G1 I 7C)
If)cn o61 CO I rz F I \ro Ia G If-1 ÑHn7

(DOMESTIC)
T12S R12E SEC.33ACA
DATE
EC
PH
NA
KCA
MG
CL
HCC3
CO3
SO4
NH3
NO2/3
KJN
TOTN
HALE
9/ 2/77
.82
7.90
56.5
4.2
47.5
15.8
36.2
185.4
0.0
81.8
0.0
7.0
500.0
1.7
183.7
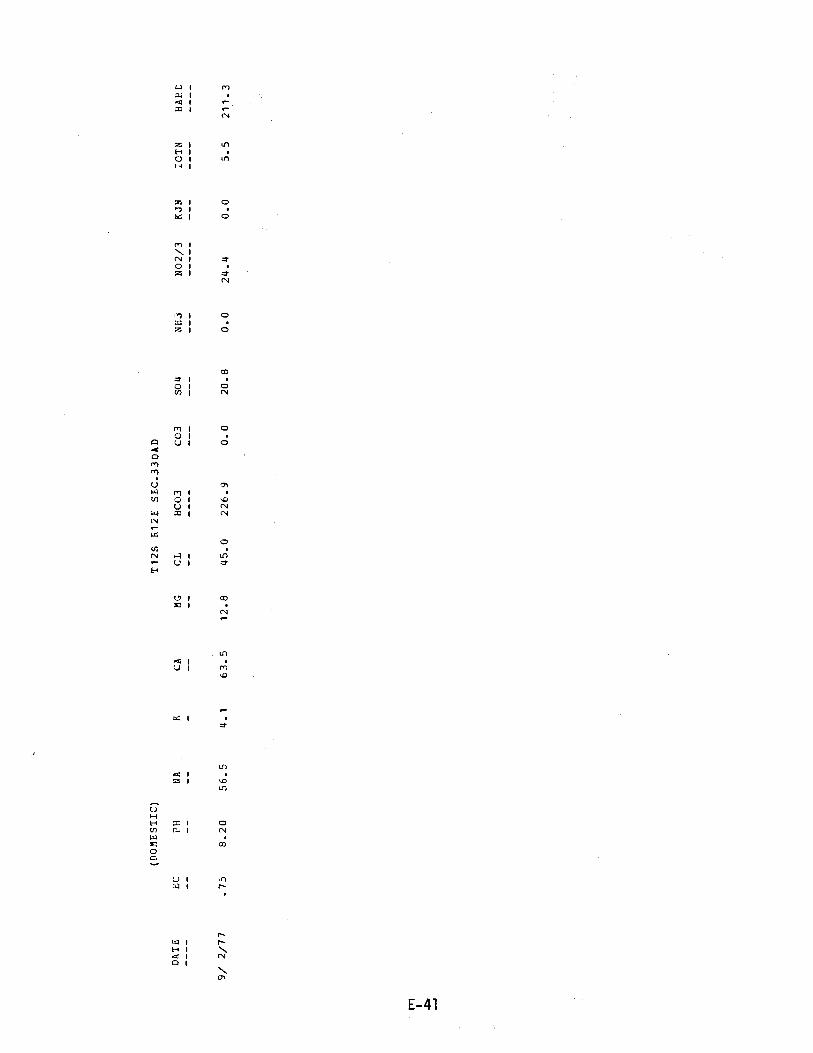
(DOMESTIC)
T12S E12E SEC.33DAD
DATE
EC
PH
NA
KCA
MG
CL
HCO3
CO3
SO4
NH3
NO2/3
KJN
IOTN
HAEC
----
--
--
--
---
--
--
----
---
---
---
---
----
----
9/ 2/77
.75
8.20
56.5
4.1
63.5
12.8
45.0
226.9
0.0
20.8
0.0
24.4
0.0
5.5
211.3
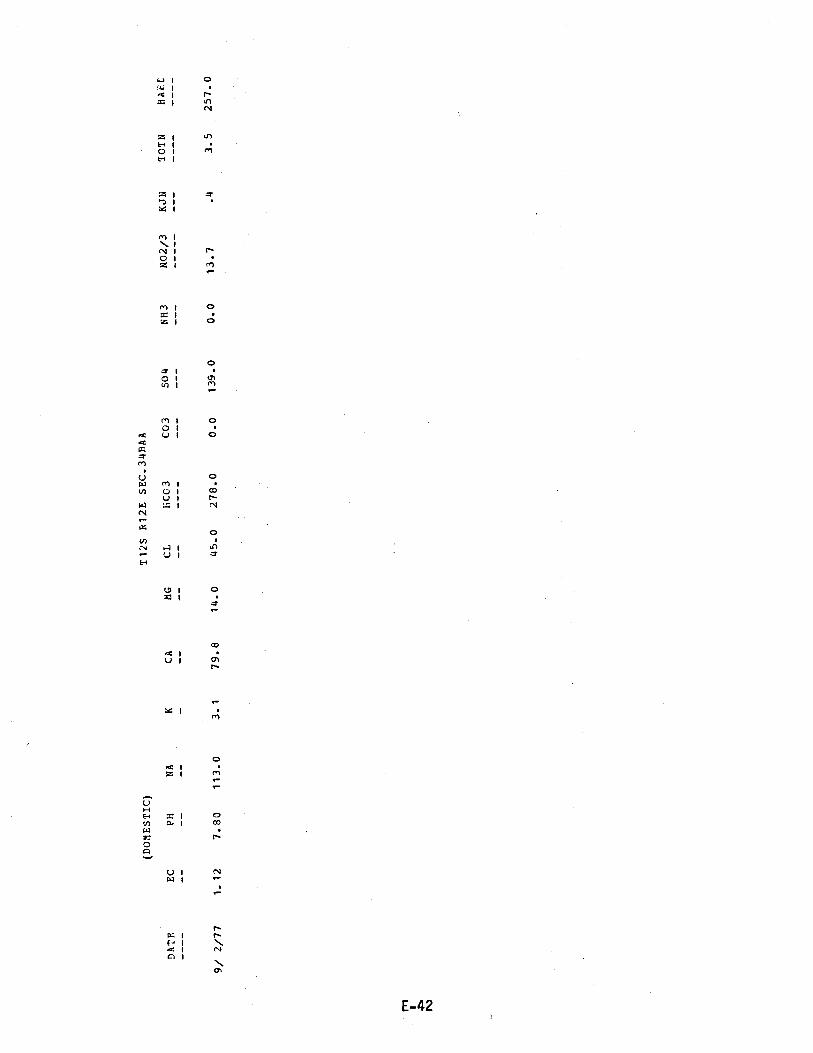
(DOMESTIC)
T12S 612E SEC.34BAA
DATE
EC
PH
NA
KCA
MG
CL
HCC3
CO3
SO4
NH3
NO2/3
KJN
TCTN
HALE
----
--
--
--
---
--
--
----
---
---
---
---
----
----
9/ 2/77
1.12
7.80
113.0
3.1
79.8
14.0
45.0
278.0
0.0
139.0
0.0
13.7
.4
3.5
257.0

Ca 1 NIr. 1a t tñx1 0
zIH IO 1 ^1H I
IZ17 1
hd 1
r7
rn 1
N.N I ,OO IZ I 7
rt
M I OI
<. I o
o7 1O 1 MV1 1 -
cf I OO 1
U 1 o
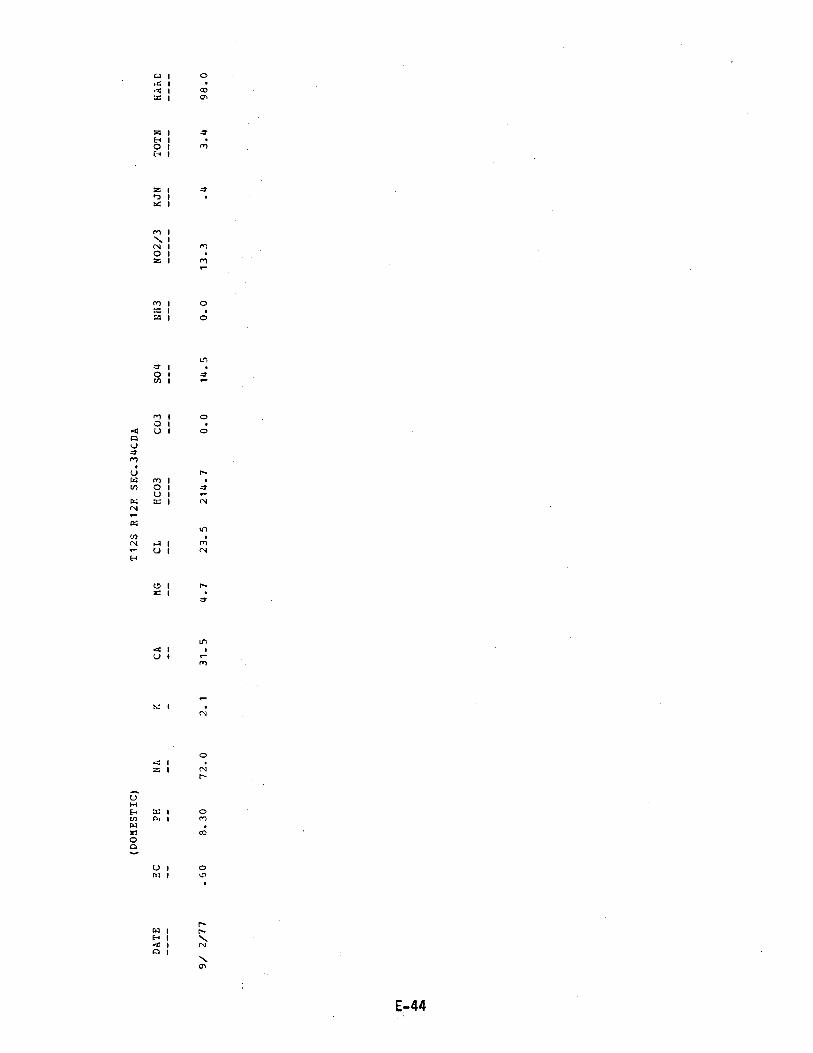
C-1 I
-G I4 I
I cr,
zl sE 1O 1 ^H I
Z I'7 1
1
E-44
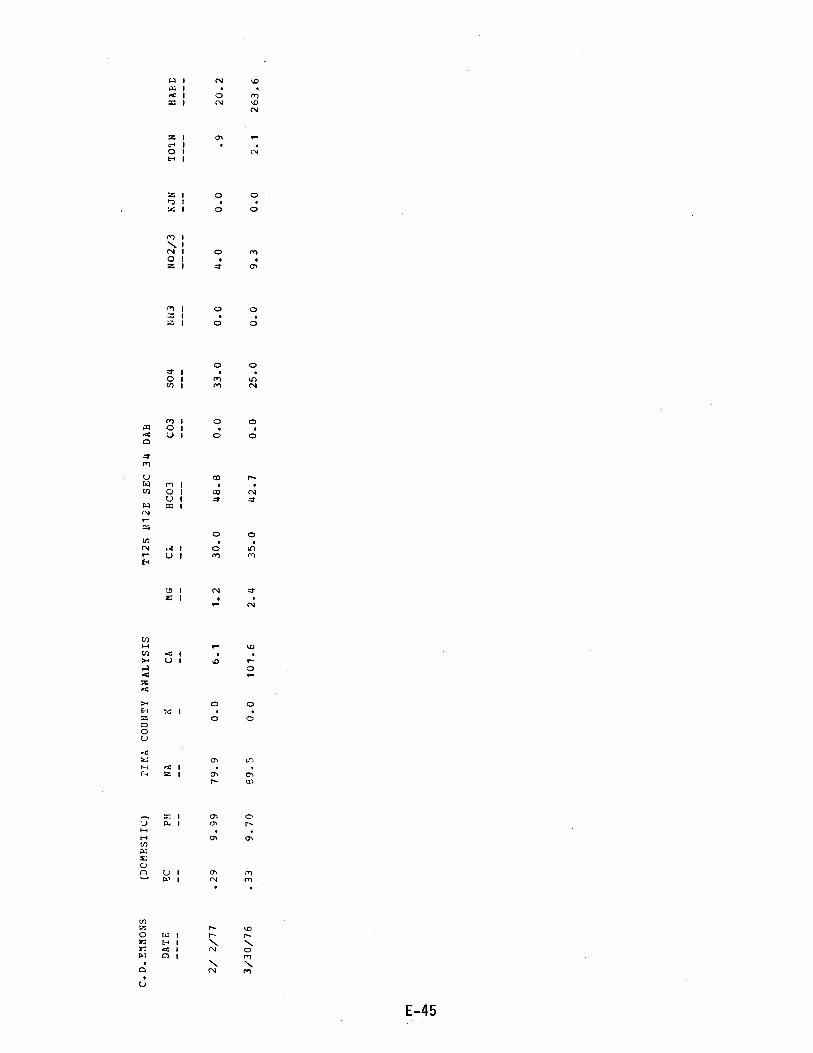
C.D.EIMONS
(DOMESTIC)
2IMA COUNTY ANALYSIS
T12S 1212E SEC 34 DAB
DATE
EC
PH
NA
KCA
MG
CL
HCO3
CO3
SO4
NH3
NO2/3
KJN
T07N
HAYE
----
--
--
--
---
--
--
----
---
---
---
---
----
----
2/ 2/77
.29
9.99
79.9
0.0
6.1
1.2
30.0
48.8
0.0
33.0
0.0
4.0
0.0
.9
20.2
3/30/76
.33
9.70
89.5
0.0
101.6
2.4
35.0
42.7
0.0
25.0
0.0
9.3
0.0
2.1
263.6

(DOMESTIC)
T12S P12E SEL.34DAC
DATE
EC
PH
YA
KCA
MG
CL
HCO3
CO3
SO4
NH3
NO2/3
KJN
TOTN
HARD
9/ 2/77
.57
7.90
54.5
3.4
49.0
14.3
37.1
229.4
0.0
29.3
0.0
15.1
0.0
3.4
181.3
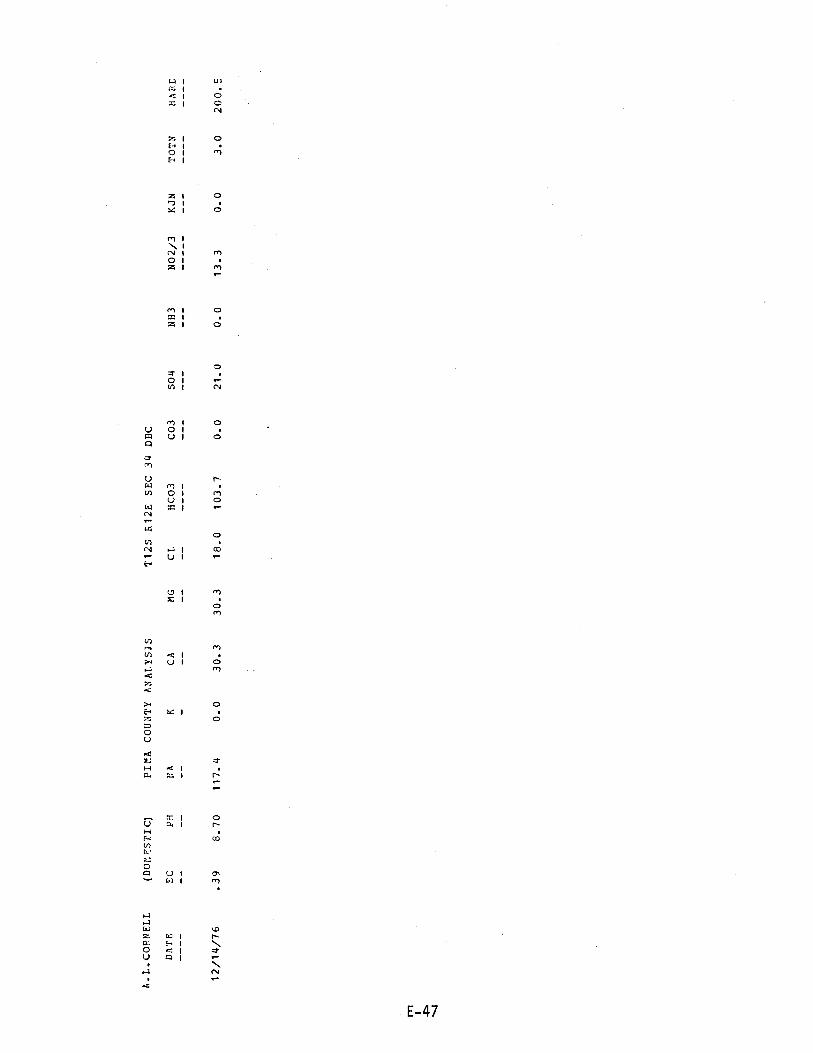
1-1 I ti,IZd1 oT
I ON
1 OEoO 1 ^1F 1
?. I O7Y I O
rl 1\(N1 1 r1O 1z
r1 1 o=z 1 O
0-7 1
O 11/) I N
o I r1z 1 Or1
r1
4 IV I O
rn
o

(DOMESTIC)
T12S R12E SEC.34DCD
DATE
EC
PH
NA
KCA
MG
CL
HCO3
CO3
SO4
NH3
NO2/3
KJN
TON
H>FD
9/ 2/77
.70
7.60
52.0
2.6
56.1
11.3
38.0
239.1
0.0
11.8
0.0
13.3
0.0
3.0
18..7

IEONNOOD RANCH (DOMESTIC)
PIMA COUNTY ANALYSIS
T12S R12E SEC 34 DCD
DATE
EC
PH
NA
KCA
MG
CL
HCO3
CO3
SO4
NH3
NO2/3
KJN
TOTN
HARI.
1/13/77
.37
7.90
69.0
0.0
72.6
18.2
28.0
140.3
0.0
23.0
0.0
13.3
0.0
3.0
256.3
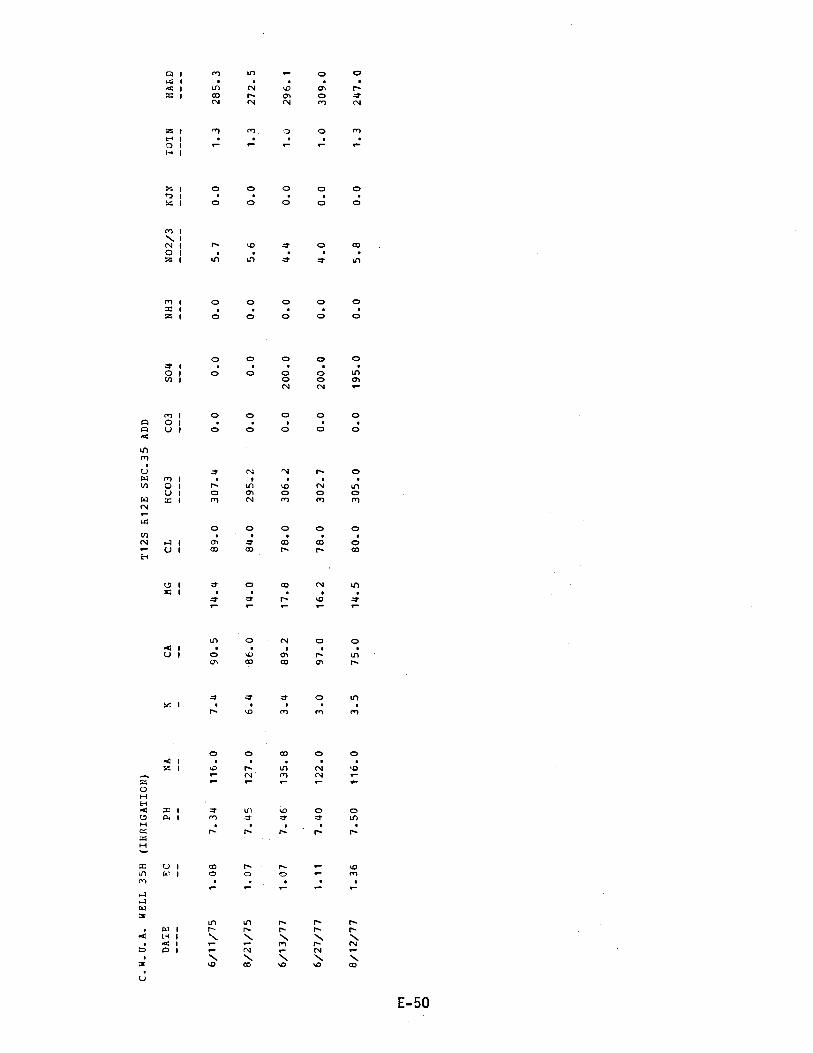
C.W.U.A.
WELL 35H
(IRRIGATION)
T12S R12E SEC.35 ADD
DATE
EC
PH
NA
KCA
MG
CL
HCO3
CO3
SO4
NH3
NO2/3
KJN
ION
HARD
----
--
--
--
---
--
--
----
---
---
---
---
----
----
6/11/75
1.08
7.34
116.0
7.ü
90.5
14.4
89.0
307.4
0.0
0.0
0.0
5.7
0.0
1.3
285.3
8/21/75
1.07
7.45
127.0
6.4
86.0
14.0
84.0
295.2
0.0
0.0
0.0
5.6
0.0
1.3
272.5.
6/13/77
1.07
7.46
135.8
3.4
89.2
17.8
78.0
306.2
0.0
200.0
0.0
4.4
0.0
1.0
296.1
6/27/77
1.11
7.40
122.0
3.0
97.0
16.2
78.0
302.7
0.0
200.0
0.0
4.0
0.0
1.0
309.0
8/12/77
1.36
7.50
116.0
3.5
75.0
14.5
80.0
305.0
0.0
195.0
0.0
5.8
0.0
1.3
247.0
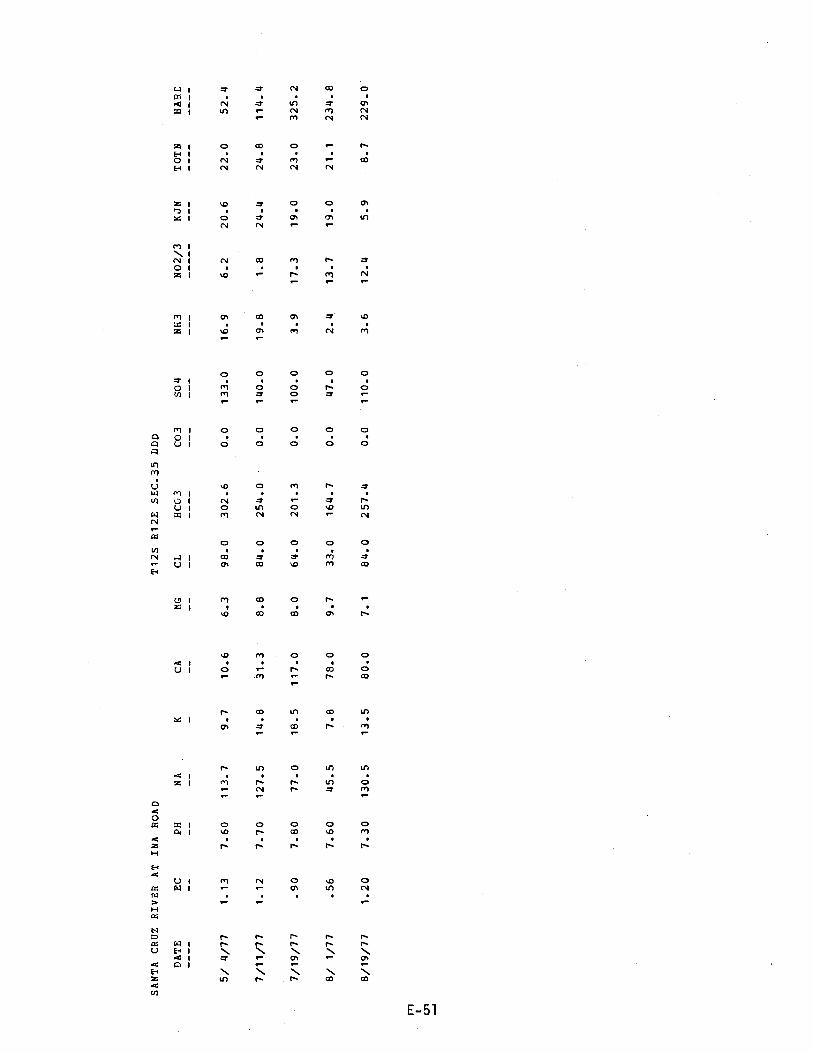
SANTA CRUZ
DATE
RIVER AT
EC
INA ROAD
PH
NA
KCA
MG
T12S R12E SEC.35 DDD
CL
HCO3
CO3
SO4
NH3
NO2/3
KJN
TOTN
HARE
5/ 4/77
1.13
7.60
113.7
9.7
10.6
6.3
98.0
302.6
0,.0
133.0
16.9
6.2
20.6
22.0
52.4
7/11/77
1.12
7.70
127.5
14.8
31.3
8.8
84.0
254.0
0.0
140.0
19.8
1.8
24.4
24.8
114.4
7/19/77
.90
7.80
77.0
18.5
117.0
8.0
64.0
201.3
0.0
100.0
3.9
17.3
19.0
23.0
325.2
8/ 1/77
.56
7.60
45.5
7.8
78.0
9.7
33.0
164.7
0.0
47.0
2.4
13.7
19.0
21.1
234.8
8/19/77
1.20
7.30
130.5
13.5
80.0
7.1
84.0
257.4
0.0
110.0
3.6
12.4
5.9
8.7
229.0
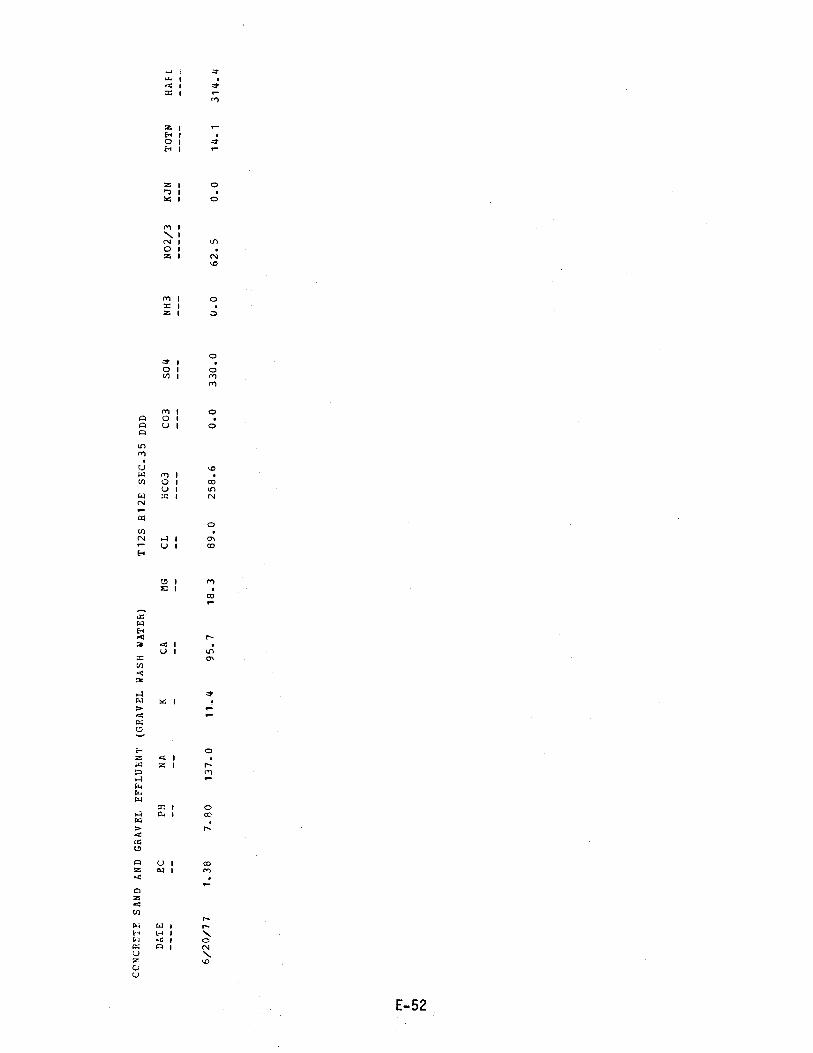
z I .-H 1O IH 1 -
7 1 oI
m i\ 1N I NO 1
Z 1 NsD
m I O5 1Z I O
O*' I
O 1 oV1 1 rI
m
m I Oq O 1
ca U 1c'a
P.)
1+7 m 1V1 O 1 CO
U 1 nW C I NNCO
Oti(N a 1
U I CO
H
O 1 m1
CO
k7Hc r3 .4 I
U 1 1nOV)
a
O
O6 1.. 1 r
m
r. I oW 1
U I cottl I m
rW 1 nH I.z I oO
I N%D
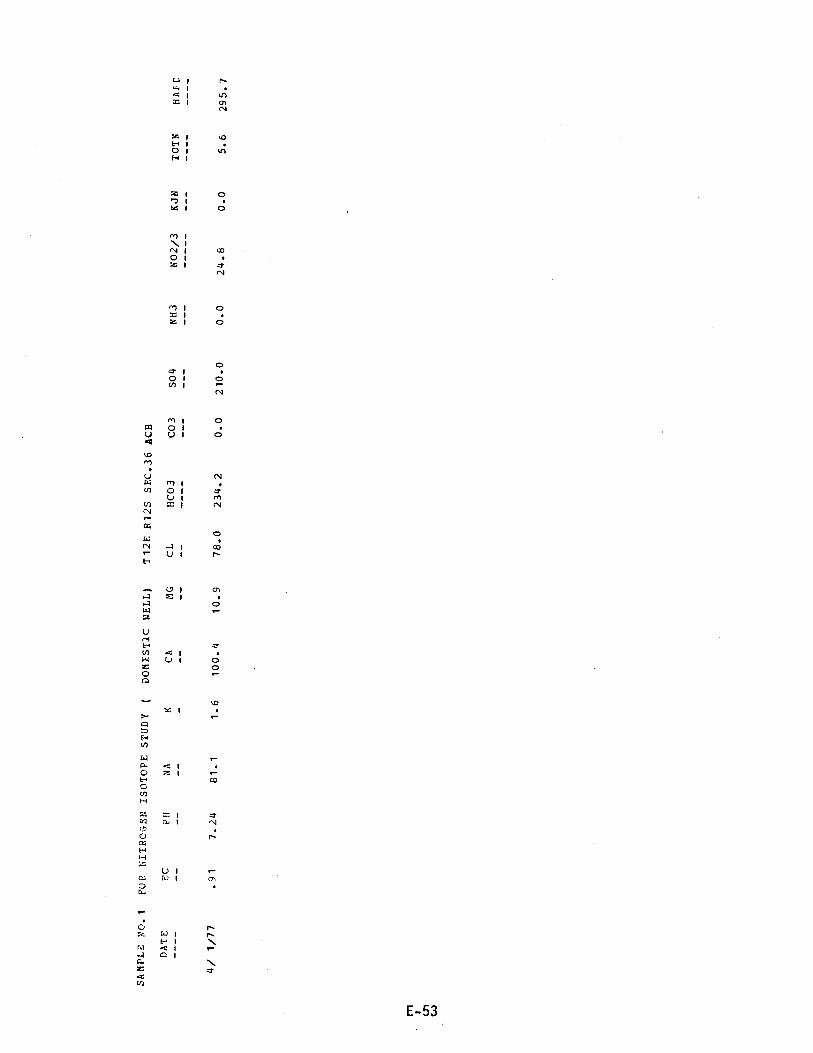
SAMPLE NO.1
FOR NITROGEN ISOTOPE STUDY
(DOMESTIC WELL)
112E R12S SEC.36 ACB
DATE
EC
PH
NA
KCA
MG
CL
HCO3
CO3
SO4
NH3
NO2/3
KJN
TOTN
HAFC
----
--
--
--
---
--
--
----
---
---
---
---
----
----
4/ 1/77
.91
7.24
81.1
1.6
100.4
10.9
78.0
234.2
0.0
210.0
0.0
24.8
0.0
5.6
295.7
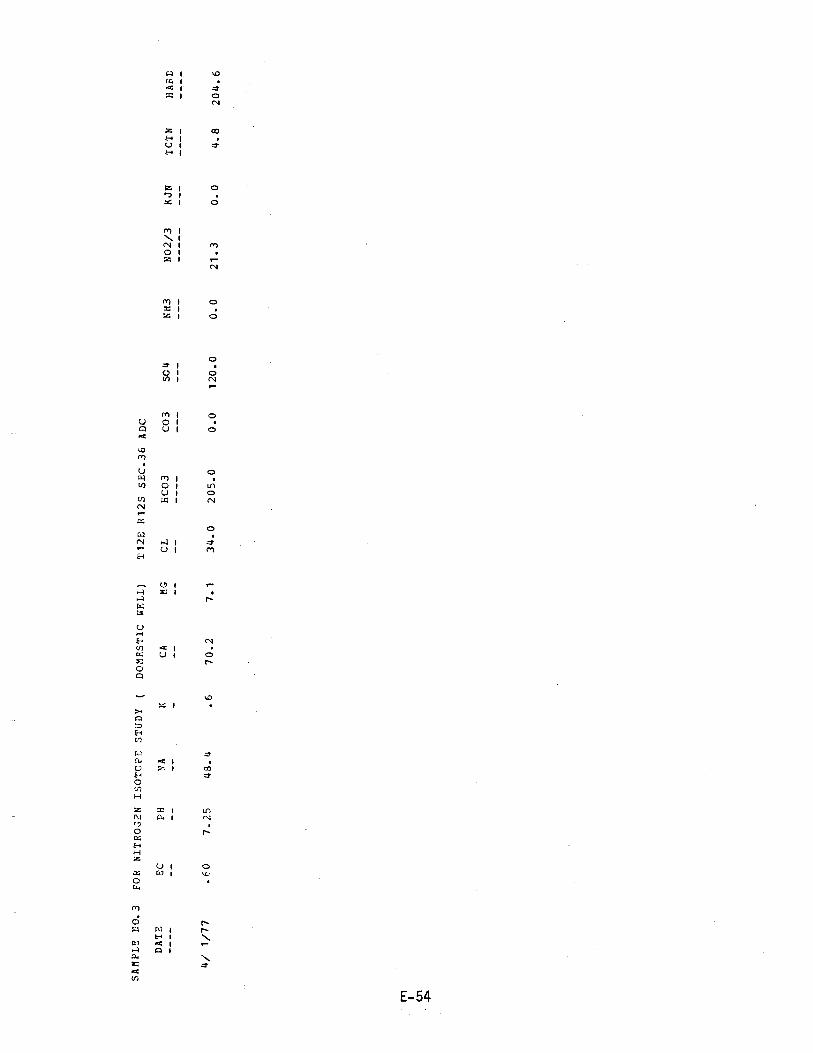
A 1 OIx ,a,m 1 0
IN
z 1 OHO 1
H
Z1 O
7 1
1
M I oxtz I O
oO 1
In 1 N
in 1 oU O 1
A U 1 o
MU ow m 1In O 1 n
U I O/1 C 1 NN
C4
N
O .
W
rPI I rH 1¢ I .-A 1
\

C.W.U.A. WELL 369
(IRRIGATION)
T12S R12E SEC.36 ADD
DATE
SC
PH
NA
KCA
MG
CL
HCO3
CO3
SO4
NH3
NO2/3
KJN
TCTN
HARD
----
--
--
--
---
--
--
----
---
---
---
---
----
----
6/11/75
.55
7.32
46.0
4.7
50.8
5.9
42.0
170.8
0.0
0.0
0.0
10.5
0.0
2.4
151.2
8/21/75
.53
7.61
47.0
6.3
46.0
4.8
33.0
168.4
0.0
0.0
0.0
10.3
0.0
2.3
134.7
4/ 8/76
.55
7.50
45.0
1.6
46.0
4.0
31.0
173.2
0.0
0.0
0.0
9.6
0.0
2.2
131.4
3/25/77
.50
7.53
44.8
1.1
54.5
5.1
32.0
163.5
0.0
85.0
0.0
8.9
0.0
2.0
157.1
4/15/77
.30
7.55
43.6
.5
50.8
4.8
31.0
161.0
0.0
70.0
0.0
11.2
0.0
2.5
146.6
4/29/77
.56
7.60
41.1
1.2
54.5
4.8
30.0
163.5
0.0
66.0
0.0
11.5
0.0
2.6
155.9
m i t7i
cn
5/16/77
.52
7.39
38.7
1.2
53.2
4.8
29.0
161.8
0.0
68.0
0.0
9.3
0.0
2.1
152.6
6/ 1/77
.52
7.85
43.6
1.5
54.5
5.1.
29.0
162.3
0.0
70.0
0.0
9.7
0.0
2.2
157.1
6/13/77
.52
7.49
50.0
1.8
53.2
6.2
28.0
163.5
0.0
70.0
0.0
6.2
0.0
1.4
158.4
6/27/77
.52
7.30
47.5
1.8
36.3
6.6
27.0
161.0
0.0
70.0
0.0
10.6
0.0
2.4
117.8
8/12/77
.61
7.90
42.0
1.7
38.8
4.7
26.0
158.6
0.0
55.0
0.0
8.9
0.0
2.0
116.3
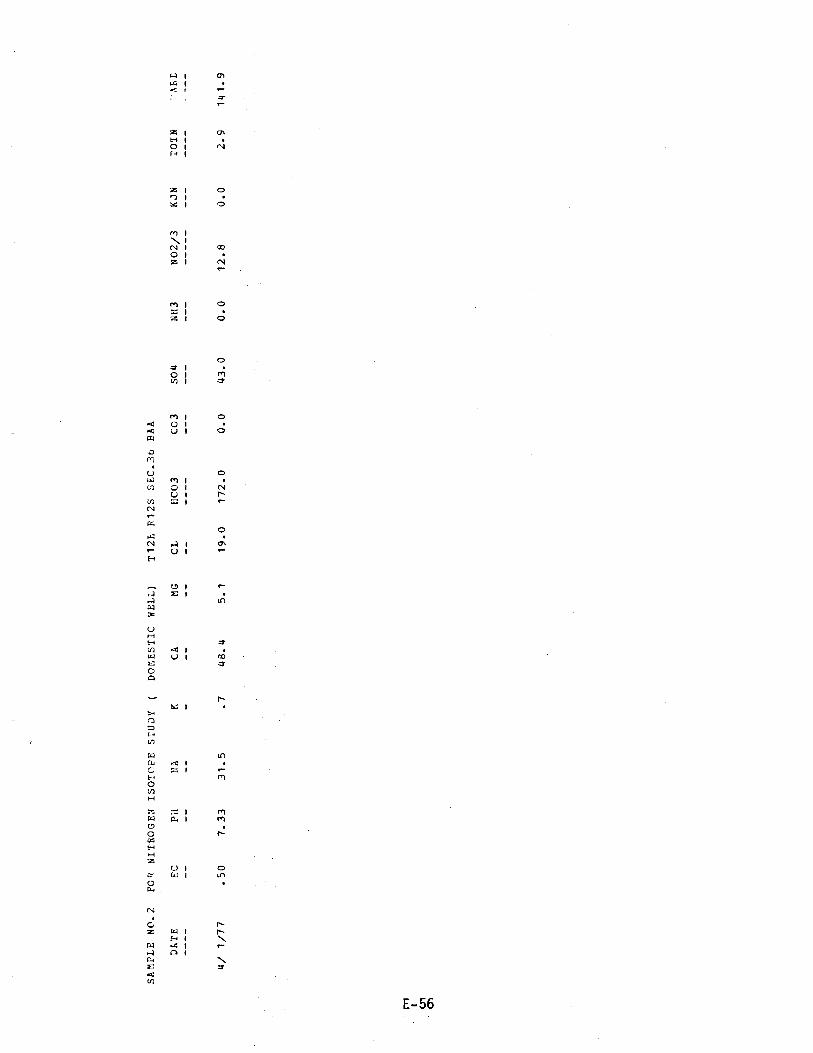
SAMPLE NO.2
FOR NITROGEN ISOTOPE STUDY
(DOMESTIC WELL)
T12E R12S SEC.3b BAP,
DATE
EC
Pii
NA
KCA
MG
CL
HCO3
CO3
SO4
NH3
NO2/3
KJN
TOIN
'ARC
----
--
--
--
---
--
--
----
---
---
---
---
----
----
4/ 1/77
.50
7.33
31.5
.7
48.4
5.1
19.0
172.0
0.0
43.0
0.0
12.8
0.0
2.9
141.9

C.W.U.A. WELL 36C
(IRRIGATION)
T12S R12E SEC.36 BAB
DATE
EC
PH
NA
KCA
MG
CL
HCO3
CO3
SO4
NH3
NO2/3
KJN
TCTN
HAFD
6/11/75
.59
7.30
62.5
5.4
50.8
5.3
44.0
170.8
0.0
0,.0
0.0
12.4
0.0
2.8
148.7
8/21/75
.54
7.59
58.0
4.9
39.0
4.0
33.0
153.7
0.0
0.0
0.0
10.9
0.0
2.5
113.9
4/ 8/76
.51
7.50
52.5
1.6
35.5
3.6
28.0
167.1
0.0
0.0
0.0
11.2
0.0
2.5
103.5
2/25/77
.62
7.55
58.1
1.3
56.9
5.6
40.0
170.8
0.0
120.0
0.0
12.4
0.0
2.8
165.2
3/10/77
.25
7.28
16.9
1.1
21.8
4.1
10.0
97.6
0.0
5.0
0.0
11.8
0.0
2.7
71.3
3/25/77
.51
7.42
50.8
1.3
46.0
4-1
36.0
152.5
0.0
82.0
0.0
8.9
0.0
2.0
131.8
m4/15/77
.50
7.50
50.8
.7
41.4
3.5
30.0
149.3
0.0
67.0
0.0
8.7
0.0
2.0
117.8
Cn V
4/29/77
.52
7.58
38.7
.6
36.3
3.2
28.0
153.7
0.0
63.0
0.0
10.6
0.0
2.4
103.8
6/ 1/77
.48
7.61
49.6
1.7
43.6
3.5
29.0
146.4
0.0
65.0
0.0
7.5
0.0
1.7
123.3
6/13/77
.48
7.51
62.0
2.3
42.6
4.0
27.0
150.1
0.0
60.0
0.0
7.5
0.0
1.7
122.9
6/27/77
.49
7.40
56.5
2..1
29.0
4.1
26.0
151.3
0.0
61.0
0.0
8.9
0.0
2.0
89.3
8/12/77
.57
7.70
49.5
2.2
30.0
3.2
25.8
156.2
0.0
45.0
0.0
9.7
0.0
2.2
89.1

a 1 oL.14
1 cox 1 Ln
M
z 1 ,r)H IO 1 NH
Z I O'7 I
J4 I O
M 1N. 1
N I
O 1Z I '-
M I ox Iz I O
07 I0 1 t`V1 1
N
M 1 OO O 1
V U 1 Ott1
DMU Ln
M 1(1) 0 1 N
U 1 Ln[il x 1 r-NC.
OU)N .-7 1
U I
H
t9 t
E 1
N
34 1
O
fe£ NH <C I
C), z I
st>
U 1 rw I m
vpW I rH 1 NKt I OA I N
N

CCLUMBIA
DATE
----
SAND AND GY.AVEL
EC
P!'
--
-
WELL
(COMMERCIAL)
NA
K--
-CA
--
MG--
T12S
CL
--
R12E SEC.36
HCO3
----
CBC
CO3
---
504
---
NH3
---
NO2/3
KJN
---
TOTN
----
HALE
----
6/27/77
1.15
7.50
132.0
2.4
53.8
14.0
84.0
303.8
0.0
175.0
0.0
14.2
0.0
3.2
192.0
6/27/77
1.15
7.30
127.5
1.6
55.0
14.3
83.0
303.8
0.0
180.0
0.0
12.8
0.0
2.9
196.3
9/ 9/77
1.48
7.50
148.5
2.9
122.0
12.8
97.5
307.4
0.0
160.0
0.0
15.1
.3
3.7
357.4

C.W.U.A.
DATE
WELL 36N
EC
(IRRIGATIOP:)
FH
NA
KCA
MG
T12S R12E SEC.36
CL
HCO3
CCD
CO3
SO4
NH3
NO2/3
KJN
TOTN
HARE
8/21/75
1.25
7.37
140.0
7.1
107.0
14.5
100.0
290.4
0.0
0.0
0.0
21.0
0.0
4.7
327.0
3/10/77
.60
7.60
47.2
1.2
52.0
5.0
32.0
163.5
0.0
75.0
0.0
8.7
0.0
2.0
150.5
6/20/77
1.27
7.38
122.1
3.1
91.3
15.2
92.0
295.2
0.0
250.0
0.0
35.4
0.0
8.0
290.6
6/27/77
1.28
7.40
127.0
3.3
92.5
17.3
92.0
292.8
0.0
240.0
0.0
18.6
0.0
4.2
302.3

u I OaKC i 7O.) 1
M
I
H 1V 1
H 1
z I OI'D
1 OO
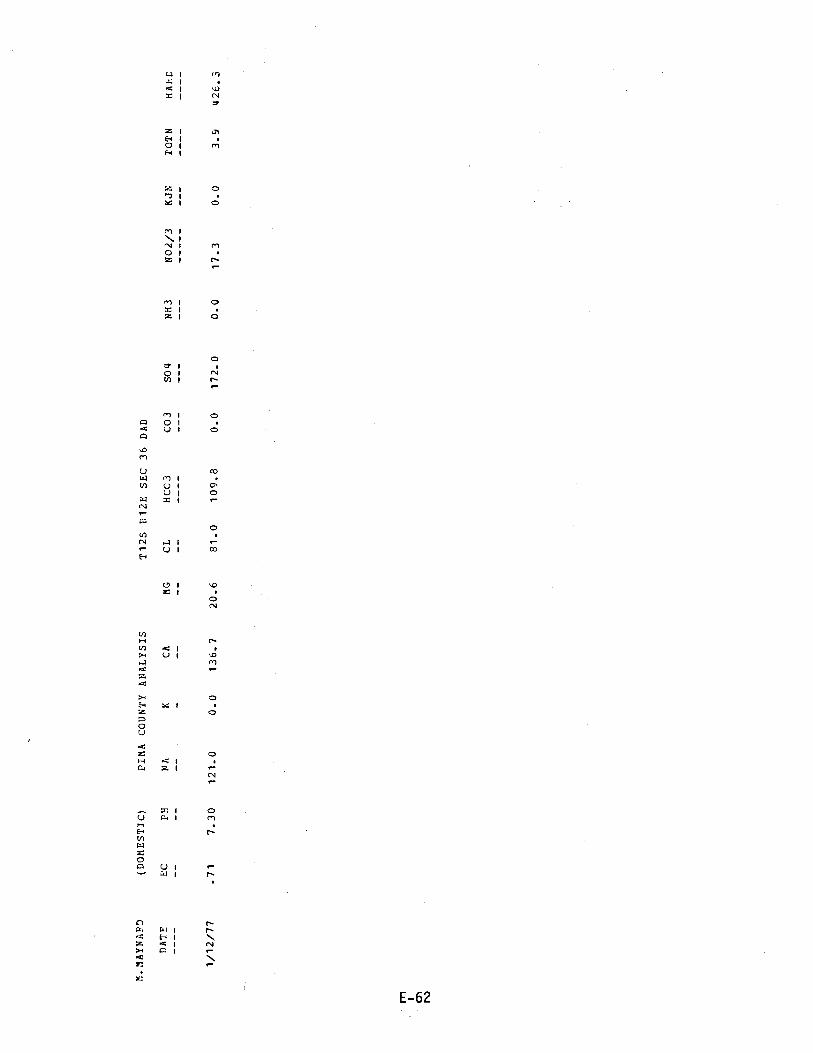
La 1 Mw 14 I Ox1 N
z IE IO 1 MH 1
2 I Oh Iae I
O7 1O 1 NI/1 1 n
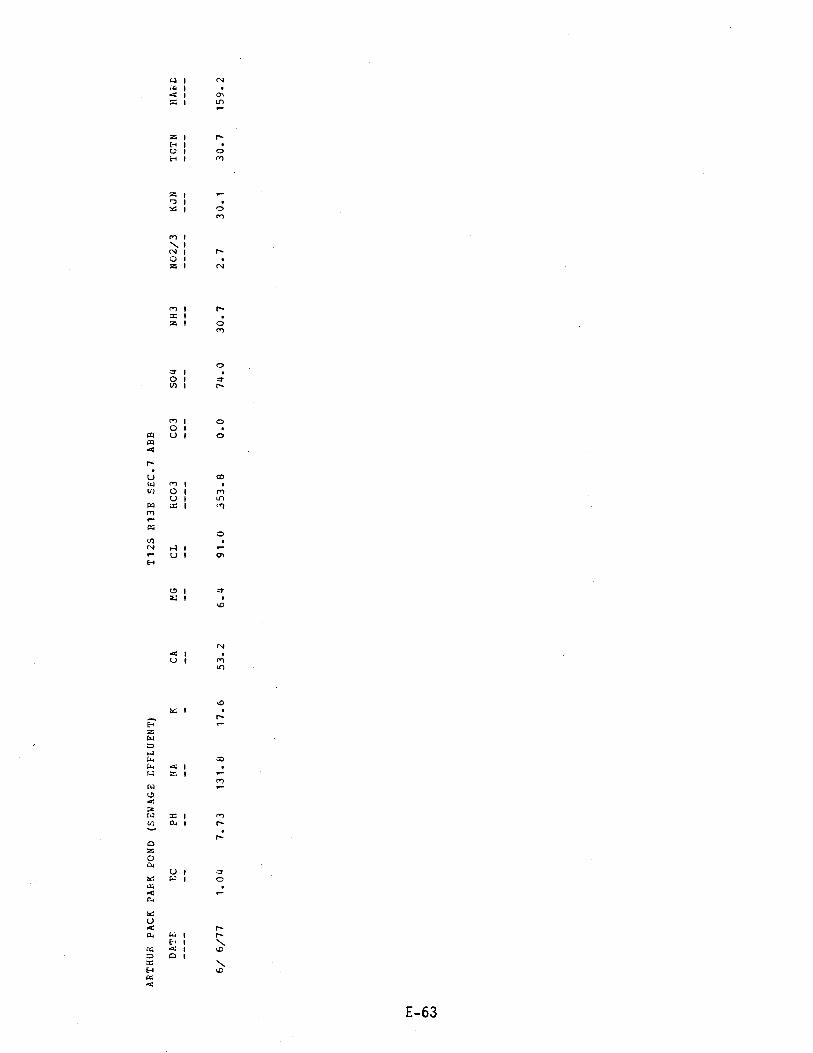
ARTHUR PACK PARK POND (SEWAGE EFFLUENT)
T12S R13E SEC.7 ABB
DATE
EC
PH
NA
KCA
MG
CL
HCO3
CO3
SO4
NH3
NO2/3
KJN
TCTN
HALL
----
--
--
--
---
--
--
----
---
---
---
---
----
----
6/ 6/77
1.04
7.73
131.8
17.6
53.2
6.4
91.0
353.8
0.0
74.0
30.7
2.7
30.1
30.7
159.2
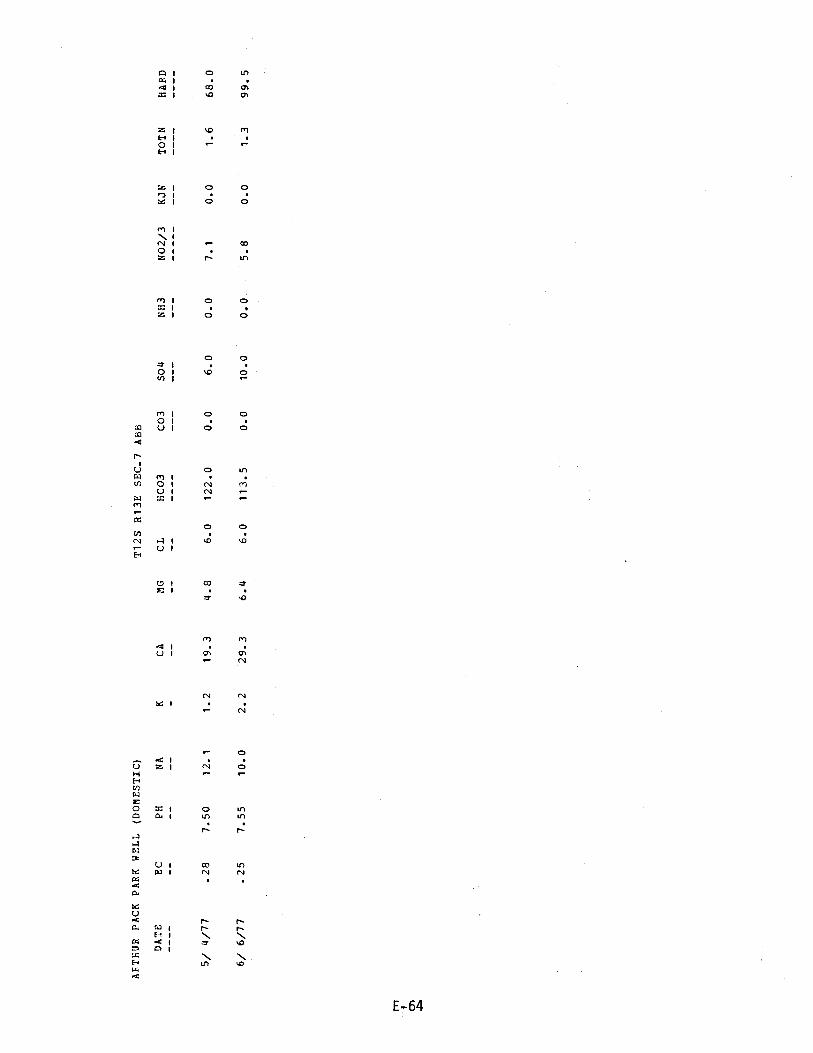
q I o u1Gq I
1ap 01. 1 1/4O 01
z i 1/4O mN 1 e
O 1H 1
z 1 O(-J 1
1
PI 1
\ 1
(N I mO 1
1 N
m I o 0=z 1 0
O
0
o7 IOy I
m I oO
wcg
r-
U 1 0
u o viW m 1N O I N m
U 1 N rWma
= 1 '- .
0 01!1 .N a. I
U1H
O 1 tpE I
m md 1U 1 O o
r- N
N N
E-64

CITY WELL A -50 (MUNICIPAL)
T12S R13E SEC.30 DAD
DATE
EC
PH
NA
KCA
MG
CL
HCO3
CO3
SO4
NH3
NO2/3
KJN
TOTN
HARD
----
--
--
--
---
--
--
----
---
---
---
---
----
----
7/11/77
.26
7.70
16.5
1.1
11.0
5.5
7.0
89.0
0.0
7.0
0.0
10.6
0.0
2.4
50.1
8/ 1/77
.28
7.60
18.0
1.1
19.5
3.0
4.0
109.8
0.0
4.0
0.0
8.0
0.0
1.8
61.1

CITY WELL Z -13 (MUNICIPAL)
T12S R13E SEC.31 CCC
DATE
----
EC
--
PH
--
NA--
K -CA--
MG--
CL--
HCO3
----
CO3
---
SO4
---
NH3
---
NO2/3
KJN
---
TOTN
----
HARD
----
6/22/76
1.08
7.32
77.4
1.2
96.8
9.7
66.0
222.0
0.0
190.0
0.0
27.9
0.0
6.3
281.7
7/ 6/77
.97
7.50
24.5
1.0
111.1
11.3
74.0
174.0
0.0
165.0
0.0
26.6
0.0
6.0
324.0
8/ 1/77
1.05
7.50
94.0
2.0
118.5
11.3
69.0
212.0
0.0
90.0
0.0
32.3
.2
7.4
342.5
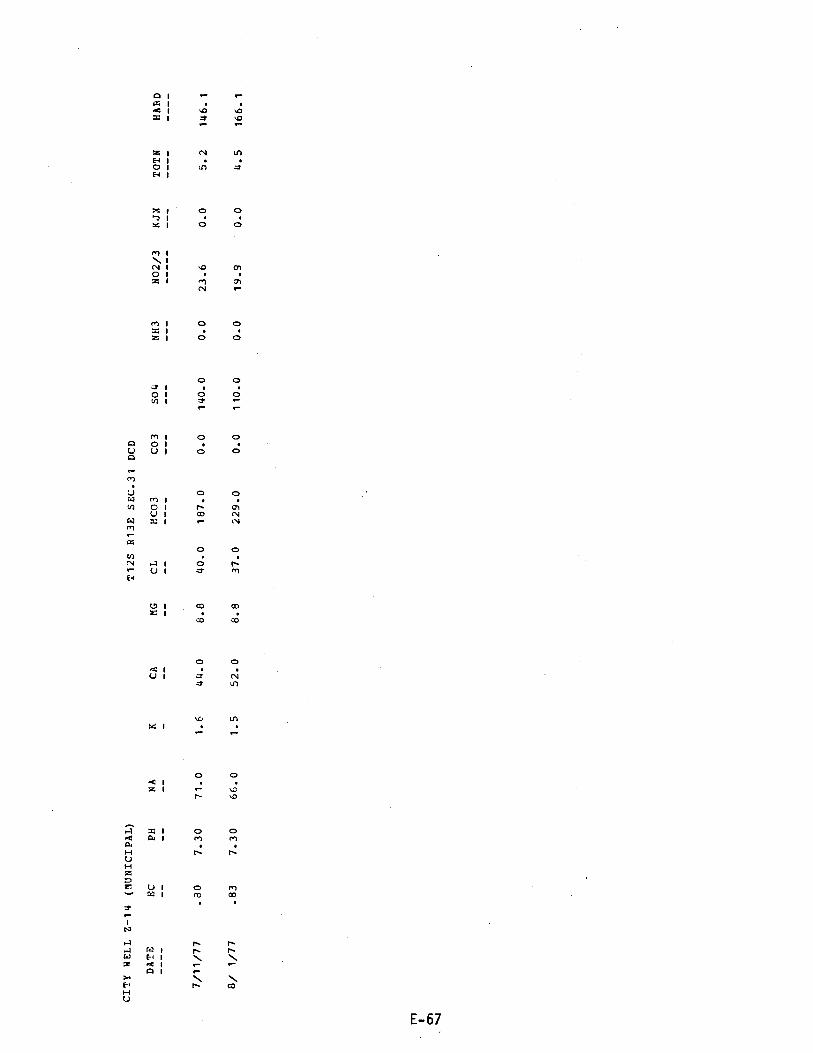
CITY WELL Z -14 (MUNICIPAL)
T12S R13E SEC.31 DCD
DATE
EC
PH
NA
KCA
MG
CL
CO3
SO4
NH3
NO2/3
KJN
TOTN
HARD
----
--
--
--
---
--
--
---
---
---
---
----
----
7/11/77
.80
7.30
71.0
1.6
44.0
8.8
40.0
187.0
0.0
140.0
0.0
23.6
0.0
5.2
146.1
8/ 1/77
.83
7.30
66.0
1.5
52.0
8.8
37.0
229.0
0.0
110.0
0.0
19.9
0.0
4.5
166.1
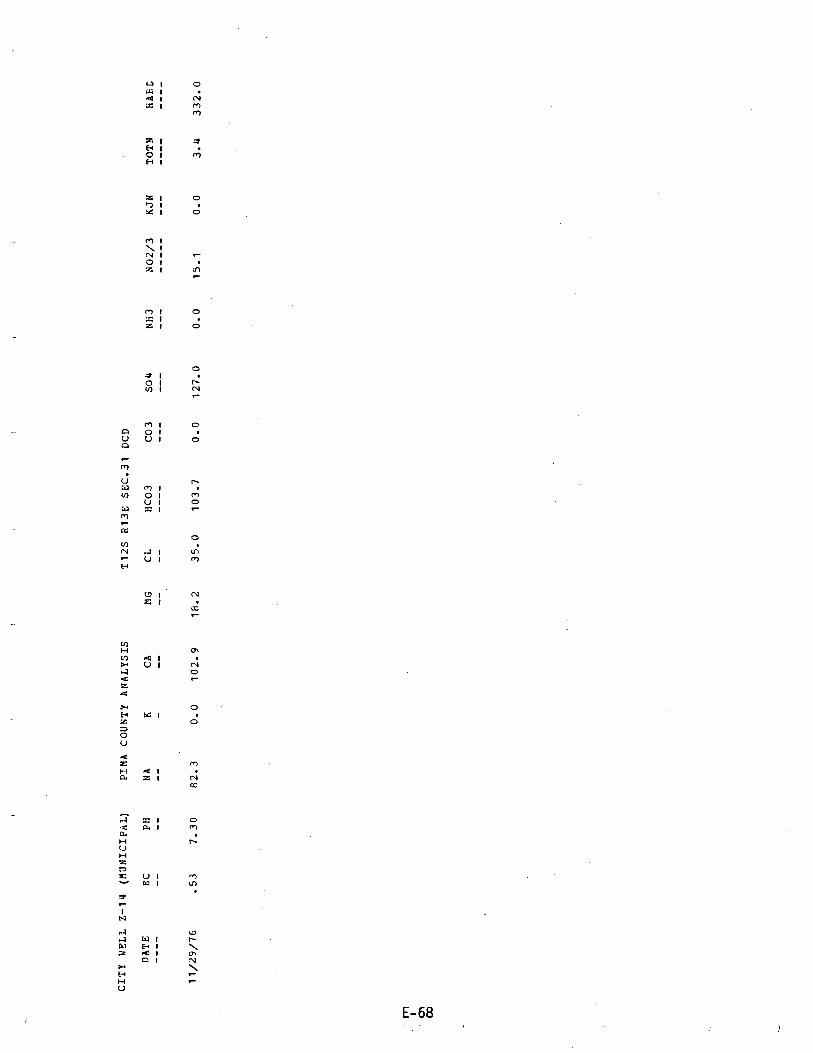
CITY WELL Z -14 (MUNICIPAL)
PIMA COUNTY ANALYSIS
T12S R13E SEC.31 DCD
DATE
EC
PH
NA
KCA
MG
CL
HCO3
CO3
SO4
NH3
NO2/3
KJN
TOTN
HAFC
----
--
--
--
---
--
--
----
---
---
---
---
----
----
11/29/76
.53
7.30
82.3
0.0
102.9
18.2
35.0
103.7
0.0
127.0
0.0
15.1
0.0
3.4
332.0
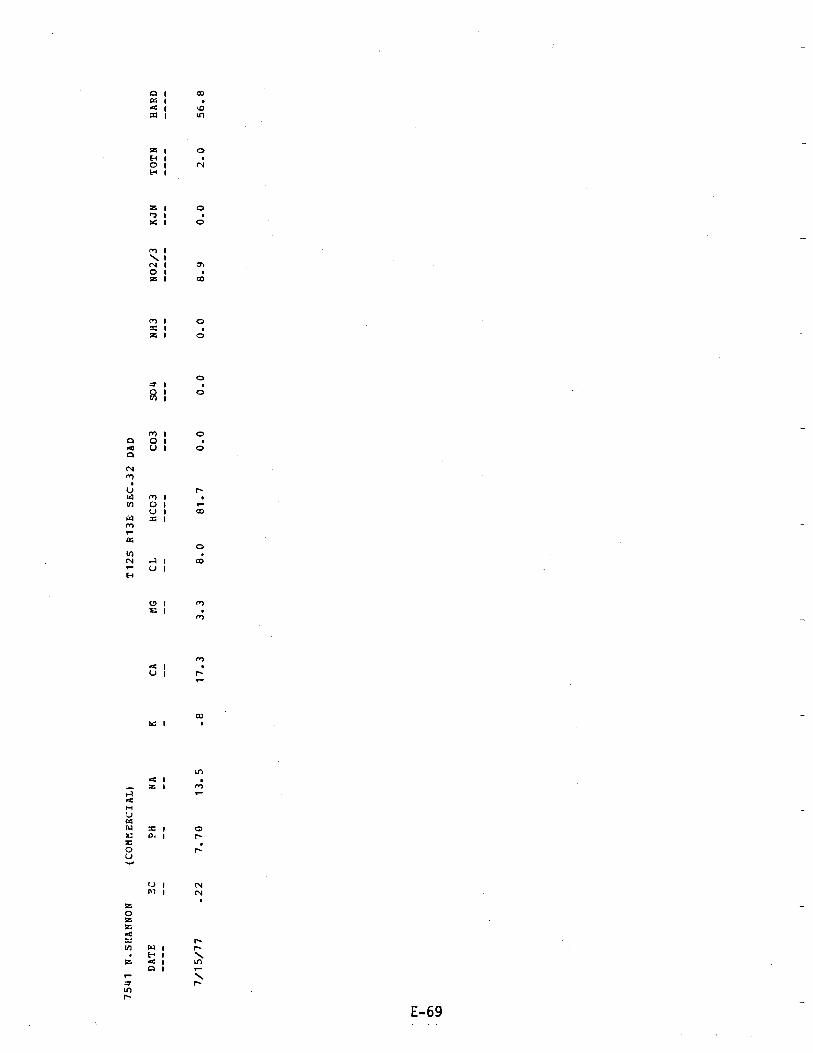
7541 N.SHANNON
(COMMERCIAL)
T12S R13E SEC.32 DAD
DATE
3C
PH
NA
7/15/77
.22
7.70
13.5
KCA
MG
.8
17.3
3.3
CL
HCO3
CO3
SO4
NH3
NO2/3
KJN
TOTN
HARD
8.0
81.7
0.0
0.0
0.0
8.9
0.0
2.0
56.8
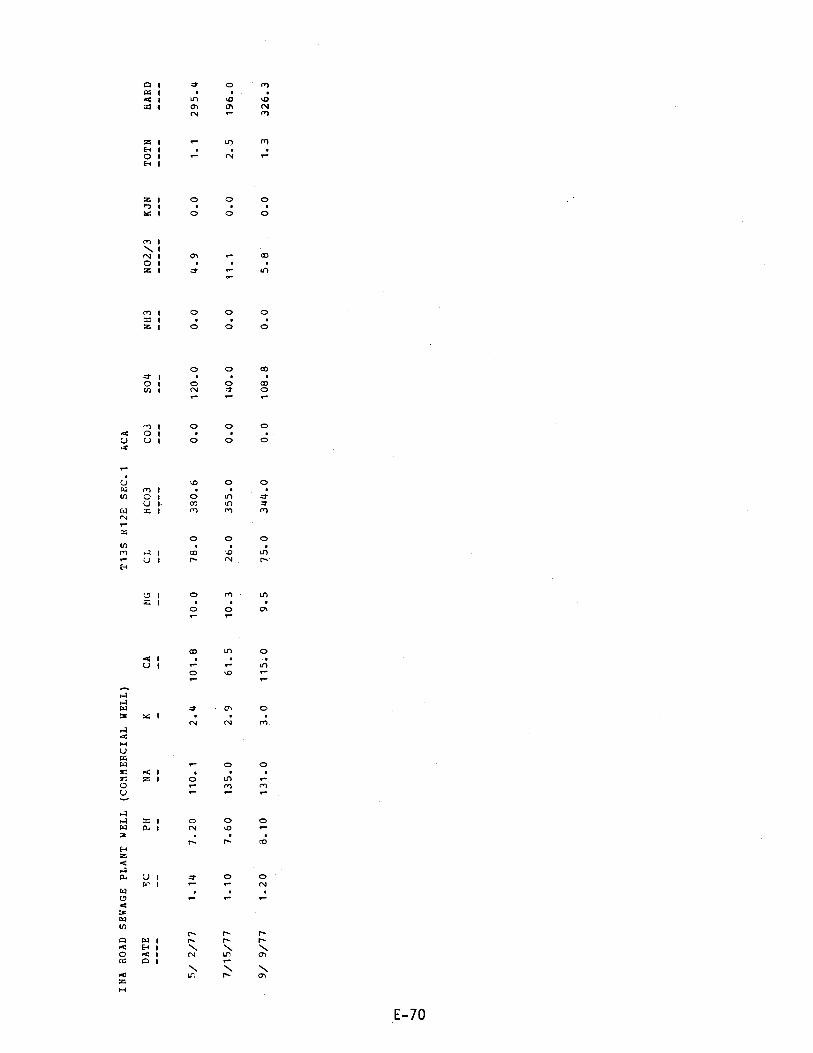
INA ROAD SEWAGE PLANT WELL (COMMERCIAL WELL)
T13S R12E SEC.1
ACA
DATE
5C
PH
NA
KCA
NG
CL
HCO3
CO3
SO4
NH3
NO2/3
KJN
TOTN
HARD
- - --
--
--
--
---
--
--
- - --
---
---
---
---
-- --
- - --
5/ 2/77
1.14
7.20
110.1
2.4
101.8
10.0
78.0
380.6
0.0
120.0
0.0
4.9
0.0
1.1
295.4
7/15/77
1.10
7.60
135.0
2.9
61.5
10.3
26.0
355.0
0.0
140.0
0.0
11.1
0.0
2.5
196.0
9/ 9/77
1.20
8.10
131.0
3.0
115.0
9.5
75.0
344.0
0.0
108.8
0.0
5.8
0.0
1.3
326.3

MONITOR WELL
DATE
----
I °A1
E.:
--
PH--
NA
--
K -CA --
MG--
;135
CL --
R12E SEC.
HCO3
----
1ACC
CO)
---
504
---
NH3
---
NO2/3
KJN
---
TOTN
----
HARD
----
7/ 3/74
1. 18
7.67
133.0
15.0
68.0
15.8
95.0
447.0
0.0
0.0
1.2
1.8
0.0
0.0
234.9
7/10/74
1.12
7.66
120.0
15.0
75.0
17.5
94.0
505.0
0.0
0.0
1.0
1.8
0.0
0.0
259.4
8/14/74
.9d
7.70
123.5
5.3
41.0
19.0
95.0
0.0
0.0
0.0
1.3
3.7
1.2
0.0
180.7
8/29/74
.99
7.67
125.5
5.7
39.0
18.8
93.0
0.0
0.0
0.0
1.3
2.8
1.3
0.0
174.8
9/ 5/74
1.05
7.97
142.0
6.0
25.0
18.5
99.0
0.0
0_0
0.0
1.2
3.1
1.0
0.0
138.6
9/12/74
1.01
7.92
115.5
4.3
35.5..
13.5
93.0
0.0
0.0
0.0
1.0
2.3
1.0
0.0
144.3
9/26/7u
.92
8.25
96.5
4.0
24.0
10.8
100.0
434.0
0.0
0.0
.9
2.3
1.0
0.0
104.4
10/17/74
.75
8.27
174.0
5.5
31.0
17.0
69.0
402.6
0.0
0.0
1.1
2.6
.7
0.0
147.5
10/31/74
.B0
9.36
166.0
6.5
8.0
15.7
93.0
356.2
10.8
0.0
.9
2.5
2.2
2.b
84.7
11/21/74
.83
6.83
161.0
9.5
13.5
17.2
107.0
339.6
9.6
0.0
.7
3.0
.7
1.4
104.6
12/ 5/74
.83
8.98
153.0
9.8
6.0
0.0
97.0
380.6
10.8
0.0
.9
2.6
1.0
1.6
15.0
12/31/74
.88
8.92
166.5
9.5
7.2
14.3
90.0
385.5
7.2
0.0
.7
3.4
1.8
2.6
76.9
2/21/75
.89
8.66
179.0
7.3
10.0
14.3
88.0
446.5
4.2
0.0
.2
.S
.7
:8
b3.9
3/14/75
.99
8.48
186.0
7.3
13.5
14.3
90.0
456.7
1.6
0.0
.6
1.5
1.7
2.1
92.6
3/27/75
.93
8.33
187.0
7.0
25.0
15.2
89.0
500.2
0.0
0.0
.6
.9
1.3
1.5
125.1
4/ 9/75
.98
8.13
134.0
7.2
15.6
14,14
85.0
527.0
0.0
0.0
.8
.9
1.4
1.6
96.3
4/23/75
1.13
7.72
183.1
7.2
12.4
14.3
85.0
534,4
0.0
0.0
.7
0.0
1.2
1.2
89.9
5/21/75
1.00
7.71
117.0
8.9
6.5
20.9
85.0
514.8
0.0
0.0
.3
1.0
8.1
8.3
102.3
6/10/75
1.09
7.65
110.5
7.6
75.0
23.3
90.0
475.8
0.0
0.0
.5
2.0
1.1
1.6
283.3
7/ 3/75
0.00
0.00
100.0
5.5
63.0
20.1
0.0
0.0
0.0
0.0
.5
0.0
1.3
1.3
240.1

1/ 7/77
.97
7.57
98.0
2.8
72.6
19.8
88.0
434.3
0.0
24.0
1.0
0.0
2.0
2.0
262.9
1/14/77
.98
7.50
93.0
2.8
78.7
16.8
92.0
449.0
0.0
29.0
1.1
.4
2.0
2.1
274.0
1/26/77
.80
8.05
92.0
3.6
31.5
16.0
95.0
346.5
0.0
13.0
1.3
.4
1.9
2.0
144.6
2/ 4/77
.72
8.36
106.5
5.5
31.5
15.3
82.0
280.6
U.0
13.0
1.4
.4
2.5
2.6
141.7
2/10/77
.68
8.50
93.2
4.2
14.5
14.5
79.0
224.5
89.4
7.5
1.2
O.Ó
2.2
2.2
95.9
2/18/77
.67
8.64
96.8
4.0
16.9
14.5
82.0
214.7
7.2
6.0
1.1
5.8
1.5
2.9
101.9
3/ 4/77
.70
9.01
98.0
5.8
26.6
14.3
84.0
161.0
13.2
7.0
.8
.4
1.5
1.6
125.3
3/11/77
.67
8.06
99.2
4.5
38.7
18.0
82.0
251.3
.1
0.0
1.1
0.0
2.1
2.1
170.8
r*t
14/15/77
.67
8.44
95.6
1.3
12.1
12.3
82.0
213.7
8.6
5.0
1.3
.4
2.5
2.7
80.9
V N5/16/77
.80
8.20
98.0
4.2
35.1
18.2
76.0
360.0
0.0
24.0
1.5
0.0
2.1
2.1
162.6
6/ 1/77
.94
7.90
110.7
5.1
50.8
24.8
75.0
412.4
0.0
15.0
1.7
0.0
2.2
2.2
229.0
6/13/77
1.02
7.62
125.8
6.1
73.2
34.6
76.0
505.1
0.0
12.0
1.3
0.0
2.1
2.1
325.3
6/27/77
1.01
7.60
117.0
5.3
39.5
26.7
80.0
466.0
0.0
18.0
1.5
1.8
2.9
3.3
208.6
8/19/77
1.25
7.90
123.0
15.3
52.0
24.3
86.0
389.0
0.0
22.0
1.5
0.0
13.7
13.7
230.0

(DOMESTIC)
T135 R12E SEC. 1BAB
DATE
EC
PH
NA
KCA
MG
CL
HCO3
CO3
SO4
NH3
NO2/3
KJN
TOTN
HARE
----
--
--
--
---
--
--
----
---
---
---
---
----
----
9/16/77
.95
7.50
82.5
2.9
49.0
9.1
22.5
166.2
0.0
117.5
0.0
7.5
0.0
1.7
159.9

LI I ON
a 1
A 1 CO
x 1 4'N
Z 1 CO
H IO 1 ON
H 1
Z 1 07 19G I O
f1 1 O1zl O
rn I OU I
w U I O
Oco .
rn a 1 rU I tfl
H
6 1U I
Ln
N
O4 I
.. I O+
UHH :C I Oen n, 1 oE rOO
rP.1 I rE, I N4 1 CTA 1
\Q+

V.VALLES
(DOMESTIC)
PIMA COUNTY ANALYSIS
T13S 812E SEC.
1BBB
DATE
EC
PH
NA
KCA
MG
CL
HCO3
CO3
SO4
NH3
NO2/3
KJN
TOTN
HARD
- - --
--
--
--
---
--
--
-- --
- --
- --
- --
---
- - --
- - --
1/12/77
.90
7.10
121.0
0.0
159.7
26.6
95.0
140.3
0.0
150.0
0.0
51.8
0.0
11.7
508.4
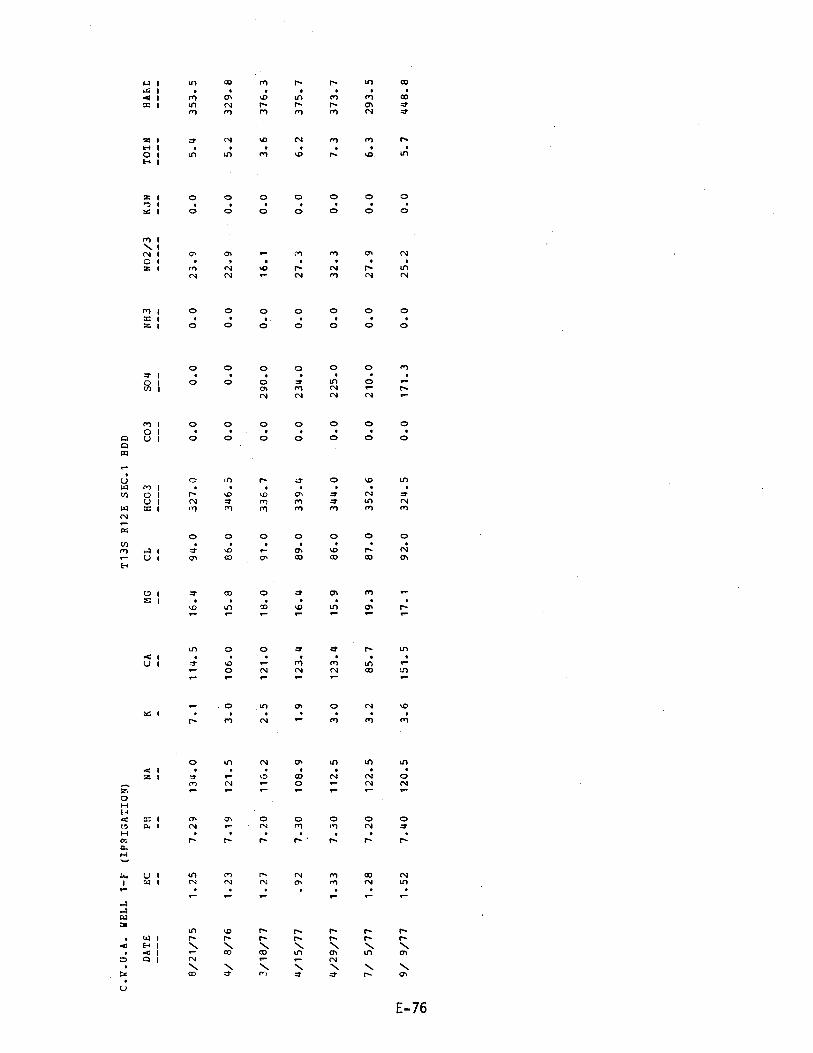
C.G.U.A.
DATE
-- --
WELL 1-F
EC--
(IPRIGATION)
PH
NA
--
--
K -CA
--
MG--
T13S
CL
--
R12E SEC.1
HCO3
- - --
BDD CO3
- --
SO4
---
NH3
---
NO2/3
KJN
- --
TUN
- ---
HARE
- ---
8/21/75
1.25
7.29
134.0
7.1
114.5
16.4
94.0
327.0
0.0
0.0
0.0
23.9
0.0
5.4
353.5
4/ 8/76
1.23
7.19
121.5
3.0
106.0
15.8
86.0
346.5
0.0
0.0
0.0
22.9
.
0.0
5.2
329.8
3/18/77
1.27
7.20
116.2
2.5
121.0
18.0
91.0
336.7
0.0
290.0
0.0
16.1
0.0
3.6
376.3
4/15/77
.92
7.30
108.9
1.9
123.4
16.4
89.0
339.4
0.0
234.0
0.0
27.3
0.0
6.2
375.7
4/29/77
1.33
7.30
112.5
3.0
123.4
15.9
86.0
344.0
0.0
225.0
0.0
32.3
0.0
7.3
373.7
7/ 5/77
1.28
7.20
122.5
3.2
85.7
19.3
87.0
352.6
0.0
210.0
0.0
27.9
0.0
6.3
293.5
¡'n
9/ 9/77
1.52
7.40
120.5
3.6
151.5
17.1
92.0
324.5
0.0
171.3
0.0
25.2
0.0
5.7
448.8
v on
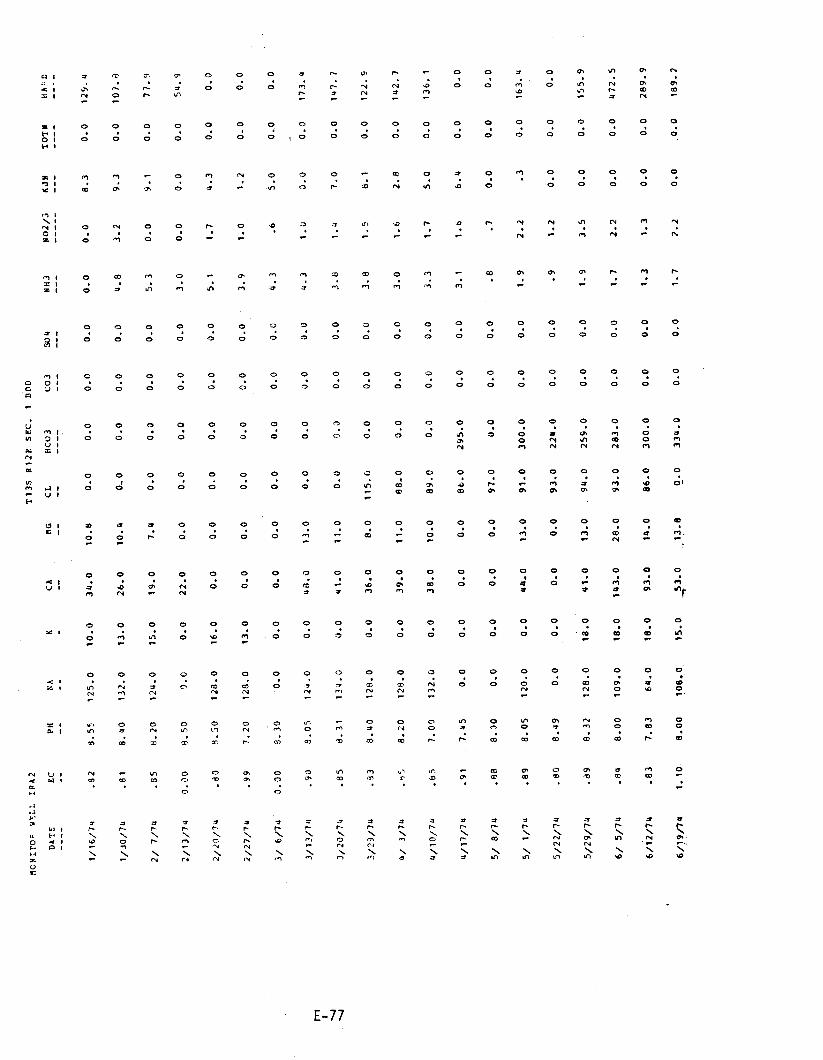
Z'681.
O'0'
0'0
Z't
L'L
0'0
0'0
0'nEf
0'0
vit-
0'E-
0-St
0''90i
00'e
Ot-t
11L/6i/9
6'68Z
0'0
0'0
f't
E't
0'0
0'0
0'00E
0'98
0'171
0'E6
O'81.
0'179
E8'L
E8'
nL/Zt/9
S'ZLn
0'0
0'0
Z'Z
L't
0'0
O'0
0'E9Z
0'E6
0'9Z
0-Ent
0'8I
0'601
00'8
n8'
nL/S /9
6'SSl
0'0
0'0
S'E
6'1
0'0
0'0
O'SSZ
0'116
O'Et
0'ln
0'81
0'9ZL
Z£'8
6P'
hL/6Z/S
0'0
0'0
0'0
Z't
6'
0'0
0'0
0'nZZ
0'E6
0'0
0'0
0'0
0'0
6n'8
OP'
nL/ZZ/S
n'E9t
O'0
E'
Z'Z
6't
0'0
0'0
0'00f
0't6
0'£I
0-nn
0'0
0'OZl
S0'8
68'
nL/l /S
0'0
0'0
0'0
L.
9'
0'0
0'0
0'0
0'L6
0'0
0'0
0'0
0'0
00'8
88'
we /S
0'0
0'0
n'9
9'L
t'E
0'0
0'0
O'S6Z
0'08
0'0
0'0
0'0
O'0
Sn'L
16'
nL/LI/n
l'9Et
0'0
0'S
L't
E'E
0'0
O'0
0'0
0'68
0'01
0'8E
0'0
O'ZEL
OO'L
S9'
nL/Ot/n
L'Znl
0'0
8'Z
9't
0'E
0'0
0'0
0'0
0"98
0'1.1
0'6E
O'0
0'8Z1
OZ'8
;u'
nL/£ /n
6'ZZl
O'0
l'8
S't
8'E
0'0
0'0
0'0
O'Stl
0'8
0'9£
0'0
O'8Zt
On'8
EE'
nL/6Z/E
L'011
0'0
O'L
n't
8'E
0'0
0'0
C'0
O'0
O't1
0'Ih
O'0
0'nEt
tE'P
S8'
nL/OZ/E
r`r`
n'ELt
0'0
O'C
n't
E'n
0'0
0'0
0'0
0'0
0'Et
0'8n
O'0
0'nZt
SO'8
OF
hL/Et/E
W
0'0
.
0'0
0'S
9'
E'h
0'0
0'0
0'0
0'0
0'0
0'0
0'0
0'0
OE'S
OO'C
rL/9 /E
0'0
0'0
Z't
0't
6'E
0'0
0'0
0'0
0'0
0'0
0'0
0'Et
0'8Z1
OZ'L
66'
nL/LZ/Z
0'0
O'0
Un
L't
t'S
0'0
0'0
0'0
0'0
0'0
0'0
O'9t
0'8Z1
0S'6
OP'
nL/OZ/Z
6'nS
0'0
0'0
0'0
0'E
0'0
0'0
0'0
0'0
O'0
0'ZZ
0'0
0'0
OS'8
OC'0
nL/Et/Z
6'LL
0'0
t'6
0'0
£'S
0'0
0'0
0'0
0'0
n'L
0'61
0'St
0'nZt
OZ'9
S9'
nL/L /Z
@'LOI
0'0
£'6
Z'E
8'n
0'0
0'0
0'0
0`0
n'Ol
O'9Z
0'£t
0'ZEt
one
t8'
PL/0£/1
n'6Zl
O'0
E'8
0'0
0'0
0'0
0'0
0'0
0'0
8'Ol
0'h£
O'OL
O'SZt
SS'P
Z8'
hL/9l/t
0,V8
MZOS
MCM
E/ZON
ERN
hOS
EOD
EOJH
ID
9W
YJ
MYN
Nd
J1
äYYO
008
l'J3S âZIM
SEIZ
net 1136 aOi:NOW
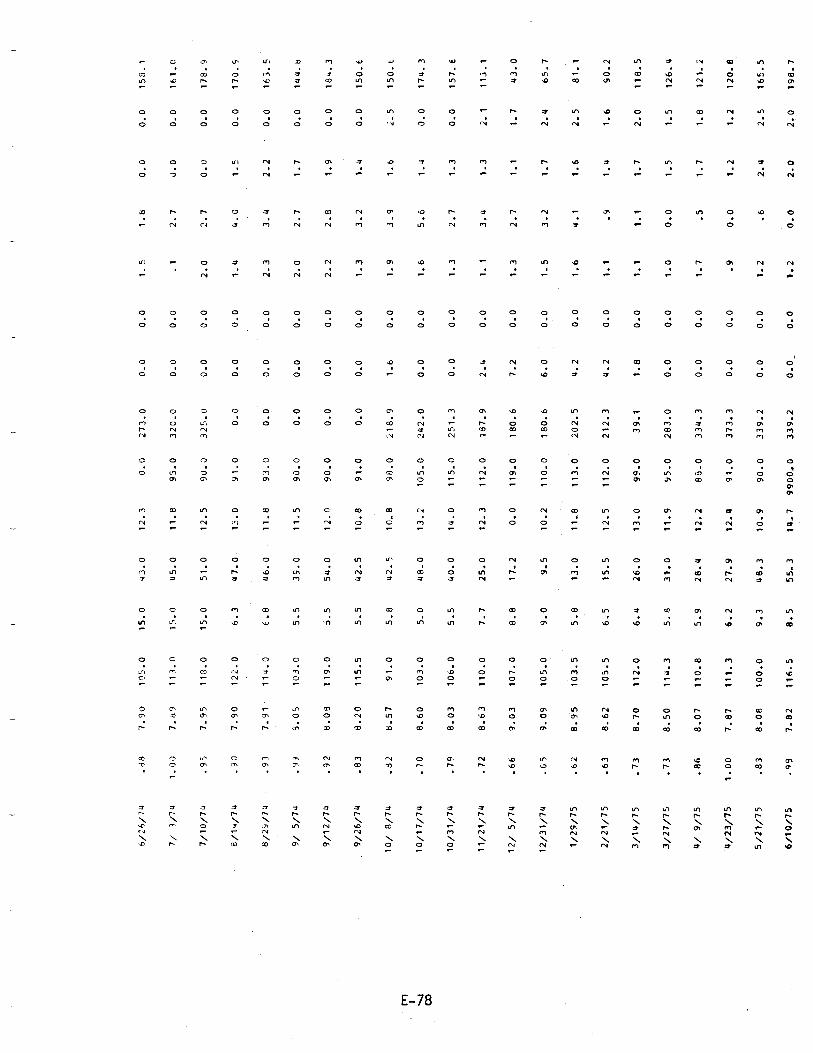
L'861
0'Z
0'Z
0'0
Z't
0'0
-0'0
Z'6EE
0'0066
L'hl
("SS
S'8
S'9tl
Z8'L
66'
SL/Ot/9
5'591
S'Z
h'Z
9'
Z'1
0'0
0'0
Z'6EE
0'06
6'Ot
E'8h
£'6
0'00t
90'9
£8'
SL/LZ/S
8'0ZL
Z't
Z't
0'0
6'
0'0
0'0
CELE
0't6
h'Zl
6'LZ
Z'9
E'llt
LPL
00'L
SL/EZ/h
ZtZL
9't
L'L
S'
L'1
0'0
0'0
E'hEE
O'98
Z'Zl
h'8Z
6'S
8'0L1.
L0'8
98'
SL/6 /h
n'9Zl
S't
S'l
0'0
0'l
0'0
0'0
0'E8Z
0'S6
6'll
0'1E
9'S
E'htl
0S'8
EL'
SL/LZ/E
S'811
0'Z
L't
l't
l'l
0'0
9't
L'6E
0'66
0'EL
O'9Z
15'9
O'Zll
OL'8
EL'
SL/ht/1
Z'05
9'L
h'L
5'
l't
0'0
Z'h
E'ZLZ
0'Ztl
S'ZL
S'SL
S'9
S'601
Z9'8
£9'
SL/tZ/Z
L'18
S'Z
9't
l'h
9't
0'0
Z'h
S'ZOZ
O'Elt
8'11
0'E1
8'S
S'E01
568
E9'
SL/6Z/L
L'S9
h'Z
L'L
Z'E
S'L
0'0
0'9
9'081
0'011
Z'OL
S'6
0'6
0'SOt
60'6
59'
4L/t1/Zt
0'En
L't
l't
L'Z
E't
0'0
Z'L
9'081
0'6L1
O'0
Z'LL
8'8
0'L01
10'6
99'
nL/S /ZL
l'111
l'Z
E't
h'E
L'L
0'0
h'Z
6'L91.
0'Ztt
E'ZL
O'SZ
L'L
0'011
£9'8
ZL'
hL/iZ/LL
9'LS1
0'0
E't
L'Z
1'L
0'0
0'0
E'LSZ
0'Sll
O'hL
0'Oh
S'S
0'901
10'8
6L'
hL/lE/OL
CO
E'nLl
0'0
n't
9'S
9'L
0'0
0'0
0'Zhl
0'5ot
Z'EL
0'8h
O'S
0'E0L
09'8
OL'
hL/Lt/OL
1,...
L
W9'OSL
S'7
9't
6'1
6't
0'0
9't
6'8LZ
O'06
8'0L
S'Zh
8'S
0't6
LS'8
Z8'
1L/8 /OL
9'0SL
0'0
h't
Z'E
E'L
0'0
0'0
0'0
0'16
8'01
S'Zh
S'S
S'Slt
OUP
E8'
hL/9Z/6
E'h8t
0'0
6't
8'Z
Z'Z
0'0
0'0
0'0
0'06
071
0'hS
S'S
0'61.1
60'8
Z6'
nL/ZL/6
a'nht
O'0
L'l
L'Z
0'Z
0'0
0'0
0'0
0'06
S'Ll
0'6E
S'S
0'101
SO'8
EG'
hL/S /6
S'E9L
0'0
.
Z'Z
h'E
1'Z
0'0
0'0
0'0
0'E6
8'tt
0'9n
8'3
0'nll
L6'L
E6'
nL/6Z/9
6'0LL
0'0
S'l
O'h
h'L
0'0
0'0
0'0
0'L6
O'Et
0'Lh
E'9
O'ZZL
06'L
06'
nL/nt/8
6'8L1
0'0
0'0
L'Z
0'Z
0'0
0'0
O'SZE
0'06
S'ZL
0'15
O'SL
0'8LL
S6'L
S6'
nL/Ol/L
0'191
0'0
Of
L'Z
L0'0
0'0
0'OZE
0"56
8'1L
O'Sn
O'SL
O'Ell
GQ'L
00'.
nL/E IL
l'851
0'0
0'0
8'1
S'L
0'0
0'0
0'ELZ
0'0
E'ZL
0'1h
0'51
0SOl
06'L
8F'
ht/9Z/9
.

Z'OOt
l'Z
t'Z
0'0
E'
0'89
0'0
L'8S£
0'Z8
9'LL
0'LZ
9'E
0'LLL
Oh'L
96'
LL/LZ/9
L'9SZ
O'1
0'l
0'0
h'
O"SL
0'0
0'99£
0'6L
0"9L
Z'LL
S'h
8'LEt
9hL
86'
LL/L1./9
6'99Z
8'
L'
0'0
tr'
0'56
0'0
9'08£
O'LL
6'hL
E"Z8
S'il
5'Zll
09'L
ZO't
LL/L /9
ñ'EhZ
0'L
0'1
0'0
L'
O'1.9
0'0
9'08£
0"8L
L"SL
9'ZL
9'E
67O1.
hl'L
S6'
LL/91/5
t'SLZ
Z'Z
Z'Z
0'0
9'
0'8S
0'0
h'OhE
0'LL
LMLL
8'L9
6`Z
S'901.
6t'L
68'
LL/ZZ/h
S'96t
S'L
h'L
h'8'
0'S8
0'0
S'9hE
0'08
Z"E1.
6'99
9'S
E'S01
£8"L
£6'
LL/1.L/Z
0'hZZ
E"t
£'t
0'0
8'0'001.
0'0
Z"95£
0'88
0'hL
9'99
h'h
8'611
6h'L
L6'
LL/OL/Z
9'£61
L'L
S'1
b"
L'
0'98
0'0
0"hEE
0'98
S"ZL
6'9S
6'E
£'111
69'L
ZE'
LL/h /Z
9'891
S'1
h'L
h'
9'
0'S8
0'0
"L'6EE
O'Z6
E'Zt
Z'Lh
6'£
£'lLl
66'L
06'
LL/9Z/1
9'90Z
L't
S't
h'
0'L
0'68
0'0
0'hEE
0'06
8'ZL
L'L9
h'E
l'Ott
OLL
Z6'
LL/hl/L
Z'6EL
1'Z
t"Z
0'0
L'L
0'OLL
0'0
O'hhE
O'L8
5'Zt
l'SE
O'h
.S'ZLL
?LL
h6'
LL/L /1
9'SSL
S'91
L'SL
ZE
Z'£t
0'0
0'0
0'0
0'0
E'ZL
0'Zh
h'OL
0'L01
00'0
00'0
SLIC IL

INA FOAL' OXIDATION POND DISCHARGE NO.
1T13S R12E SEC.
1 DBA
DA".E
EC
PH
NA
KCA
MG
CL
HCO3
CO3
SO4
NH3
NO2/3
KJN
TCTN
HA
E
1/ 7/77
1.00
7.20
101.6
7.6
48.4
5.6
101.0
414.8
0.0
12.0
28.6
2.7
38.1
38.6
143.9
1/14/77
.99
7.16
98.0
8.7
47.2
5.5.
93.0
427.0
0.0
3.0
28.6
3.1
36.8
37.5
140.5
1/26/77
1.00
7.48
106.5
9.1
49.6
5.7
405.0
0.0
0.0
17.0
28.6
3.1
39.0
39.7
147.4
2/ 4/77
.98
7.30
99.2
8.5
48.4
5.3
101.0
434.3
0.0
4.0
27.6
4.9
36.4
37.4
142.7
2/10/77
.99
7.17
93.2
11.6
44.8
5.8
93,.0
424.6
0.0
9.0
28.3
2.2
35.2
35.7
135.8
2/18/77
.98
7.33
9u.4
11.6
44.8
5.5
78.0
422.1
0.0
24.0
28.2
2.7
35.4
36.1
134.5
m p0
3/ 4/77
.94
7.30
104.1
11.1
47.2
5.5
90.0
412.3
0.0
25.0
38.6
2.7
36.7
37.3
140.5
CJ
3/18/77
1.00
7.30
105.3
12.1
48.4
5.6
101.0
429.4
0.0
8.0
29.1
2.7
33.5
34.1
143.9
4/29/77
1.05
7.42
95.6
12.1
50.8
4.6
84.0
422.1
0.0
7.0
27.0
3.1
33.3
34.0
145.8
5/ 4/77
1.06
7.39
96.8
9.7
50.8
4.6
80.0
358.7
0.0
69.0
25.5
3.5
37.2
38.1
145.8
5/16/77
.95
7.40
100.4
12.1
47.2
4.7
77.0
348.9
0.0
52.0
21.3
3.1
33.8
34.5
137.2
6/ 1/77
1.02
7.43
105.9
15.3
48.4
5.3
82.0
363.6
0.0
41.0
24.1
3.5
41.7
42.5
142.7
6/13/77
.99
7.29
131.7
14.9
50.6
5.3
87.0
336.7
0.0
60.0
21.3
1.8
32.1
32.5
148.2
6/27/77
.98
7.40
117.0
11.1
34.0
5.6
87.0
324.5
0.0
58.0
22.1
3.1
27.3
28.0
106.0

INA ROAD OXIDATION POND DISCHARGE NO.
2T13S 1112E SEC.
1 DBD
DATE
EC
PH
NA
KCA
MG
CL
hCO3
CO3
SO4
NH3
NO2/3
KJN
10TN
HARD
----
--
--
--
---
--
--
----
---
---
---
---
----
----
1/ 7/77
1.00
7.30
101.6
8.0
46.0
5.7
90.0
381.9
0.0
48.0
30.2
1.8
38.6
39.1
138.4
1/14/77
.99
7.33
99.2
7.6
47.2
5.5
98.0
392.8
0..0
53.0
31.4
3.1
39.7
40.4
140.5
1/26/77
1.00
7.65
102.9
11.7
48.4
5.8
95.0
380.6
0.0
47.0
30.7
2.7
40.6
41.2
144.8
2/ 4/77
1.00
7.32
102.9
7.5
64.1
5.9
89.0
400.2
0.0
45.0
28.7
1.3
36.4
36.7
184.4
2/10/77
1.01
7.33
105.3
12.1
47.2
5.7
80.0
397.7
0.0
48.0
29.7
1.8
37.8
37.7
141.4
2/18/77
1.01
7.33
101.6
11.9
48.4
5.5
78.0
402.6
0.0
54.0
31.5
2.7
37.8
38.5
143.5
m 1 Co
3/ 4/77
.97
7.45
95.6
12.6
43.6
5.3
85.0
383.0
0.0
54.0
30.1
3.5
37.2
38.0
130.7
3/18/77
1.05
7.37
107.7
12.1
46.0
6.3
97.0
417..2
0.0
48.0
27.2
3.5
33.0
33.8
140.8
4/29/77
1.07
7.38
99.2
13.3
49.6
5.1
79.0
366.0
0.0
66.0
26.2
3.5
35.8
36.6
144.9
5/16/77
1.01
7.44
107.7
12.1
47.2
5.3
85.0
361.1
0.0
56.0
27.7
1.8
38.4
38.8
139.7
6/ 1/77
1.02
7.55
107.1
15.7
49.6
5.3
82.0
361.1
0.0
70.0
26.3
4.4
36.4
38.4
145.7
6/13/77
1.03
7.40
129.8
14.9
49.2
6.1
82.0
353.8
0.0
70.0
24.2
3.1
35.0
35.7
148.0
6/27/77
1.02
7.30
145.5
11.2
31.0
5.3
77.0
351.4
0.0
65.0
24.8
3.5
30.9
31.7
99.3

SAMPLE N0.4
FOR NITROGEN ISOTOPE STUDY (IRRIGATION WELL)
T135 R12E SEC.2
AAb
DATE
EC
PH
NA
KCA
MG
CL
HCO3
CO3
SO4
NH3
NO2/3
KJN
TOTN
HARD
4/ 1/77
1.10
7.30
100.4
2.3
93.2
16.2
70.0
318.4
0.0
210.0
0.0
12.4
0.0
2.8
299.5
6/13/77
1.07
7.37
129.8
2.7
97.2
21.3
68.0
323.3
0.0
200.0
0.0
10.2
0.0
2.3
330.5
7/11/77
1.13
7.30
114.0
3.0
17.8
18.8
67.0
266.0
0.0
200.0
0.0
12.4
0.0
2.8
121.9
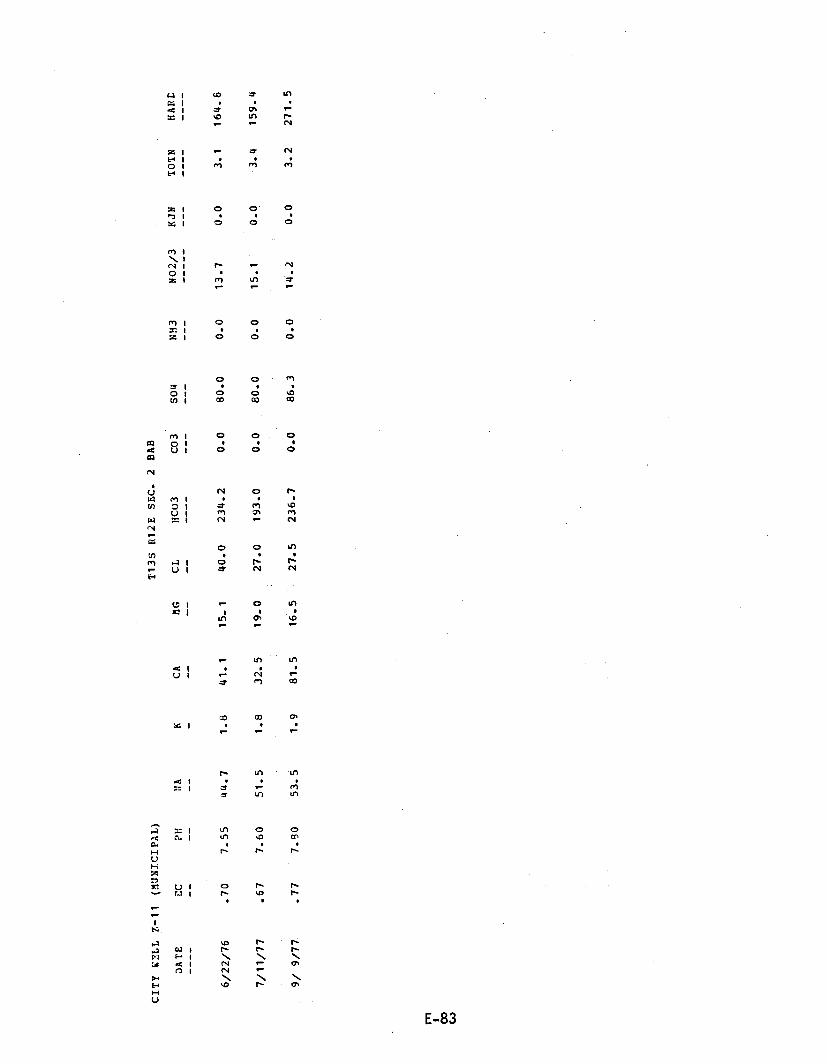
CITY WELL Z-11 (MUNICIPAL)
T13S R12E SEC. 2 BAB
DATE
CC
PH
BA
KCA
MG
CL
HCO3
CO3
SO4
NH3
NO2/3
KJN
TOTN
HARE
6/22/76
.70
7.55
44.7
1.8
41.1
15.1
40.0
234.2
0.0
80.0
0.0
13.7
0.0
3.1
164.8
7/11/77
.67
7.60
51.5
1.8
32.5
19.0
27.0
193.0
0.0
80.0
0.0
15.1
0.0
3.4
159.4
9/ 9/77
.77
7.90
53.5
1.9
81.5
16.5
27.5
236.7
0.0
86.3
0.0
14.2
0.0
3.2
271.5
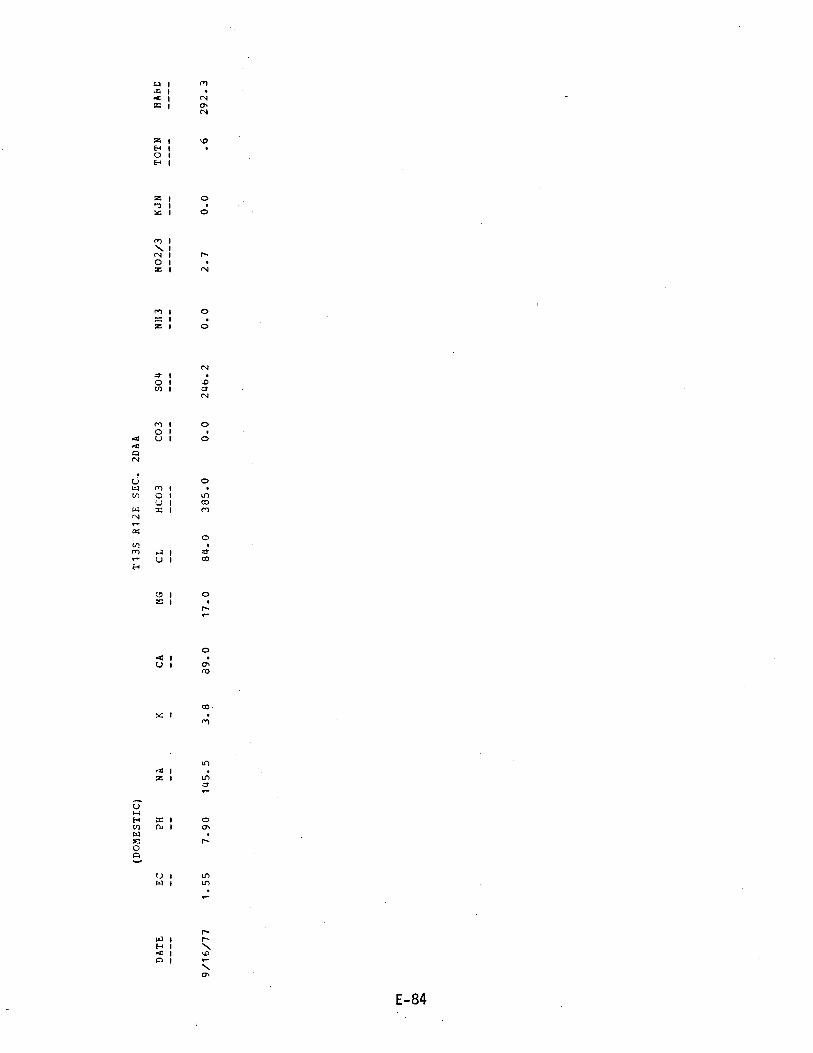
MNrnN
o

(DOMESTIC)
T13S R12E SEC. 2DDC
DATE
EC
PH
NA
KCA
MG
CL
HCO3
CO3
SO4
NH3
NO2/3
KJN
TOTN
HAND
9/16/77
1.30
8.00
96.0
2.9
78.0
19.6
39.0
360.0
0.0
193.7
0.0
11.1
0.0
2.5
275.5

SAMPLE NO.11 FOR NITROGEN ISOTOPE STUDY (IRRIGATION WELL)
T13S R12E SEC-12 AAB
DATE
0C
PH
NA
KCA
MG
CL
HCO3
CO3
SO4
NH3
NO2/3
KJN
TOTN
HARD
4/ 5/77
1.23
7.40
123.4
2.2
111.3
15.0
84.0
339.2
0.0
260.0
0.0
21.7
0.0
4.9
339.8
9/26/77
1.90
7.70
145.5
4.1
106.5
16.3
135.5
338.7
0.0
249.8
0.0
5.8
0.0
1.3
333.1
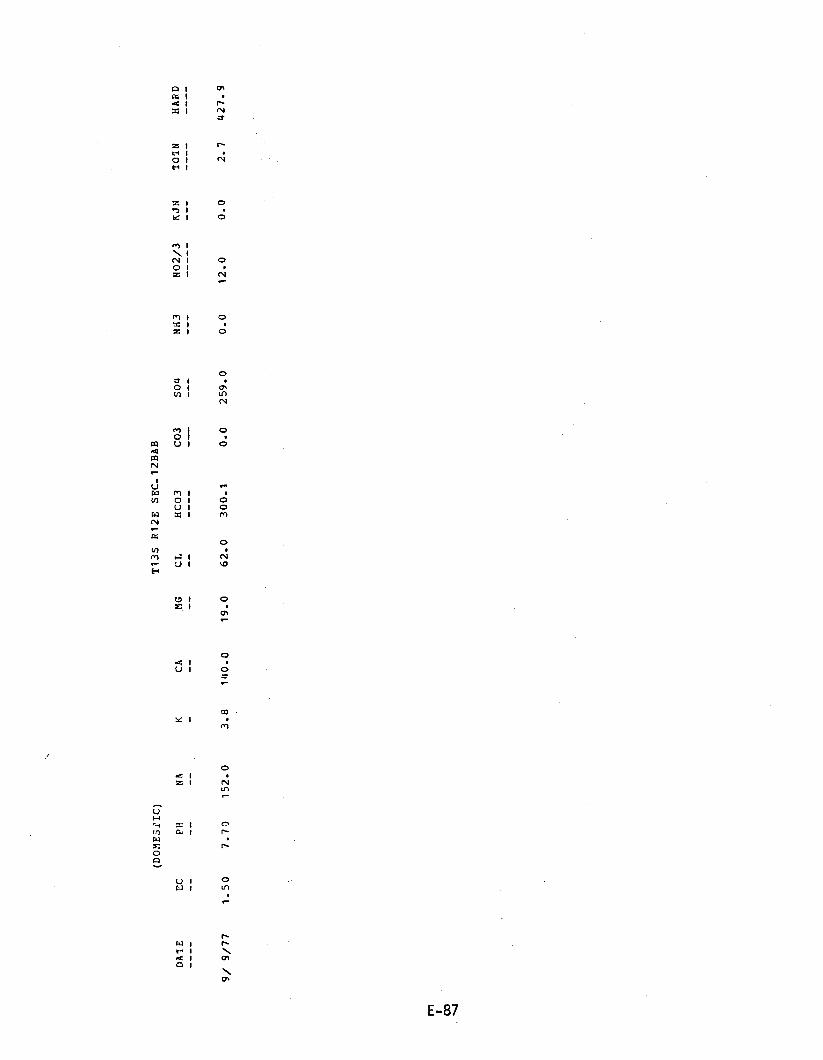
(DOMESPIC)
T13S R12E SEC.12BAB
DATE
EC
PH
NA
KCA
MG
CL
HCO3
CO3
SO4
NH3
NO2/3
KJN
TOTN
HARD
----
--
--
--
---
--
--
----
---
--
---
---
----
----
9/ 9/77
1.50
7.70
152.0
3.8
140.0
19.0
62.0
300.1
0.0
259.0
0.0
12.0
0.0
2.7
427.9
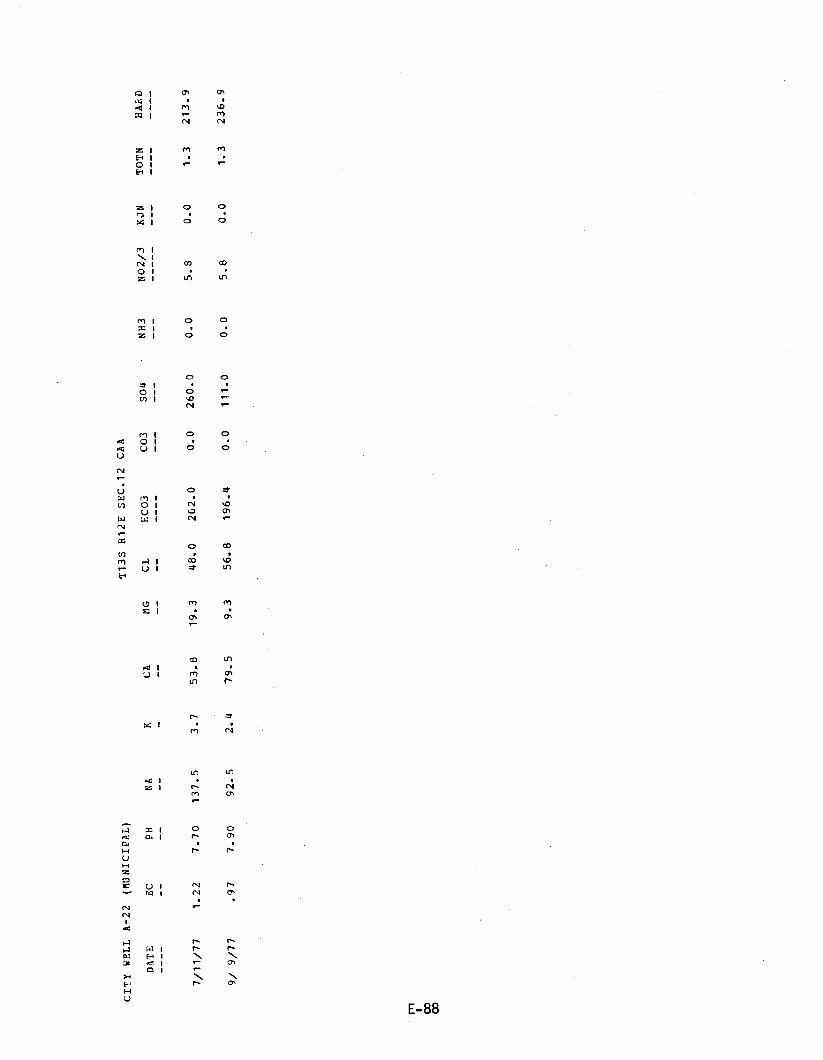
CITY WELL A-22 (MUNICIPAL)
113S R12E SEC.12 CAA
DATE
EC
PH
NA
KCA
MG
CL
HCO3
CO3
SO4
NH3
NO2/3
KJN
TOTN
HARD
7/11/77
1.22
7.70
137.5
3.7
53.8
19.3
48.0
262.0
0.0
260.0
0.0
5.8
0.0
1.3
213.9
9/ 9/77
.97
7.90
92.5
2.4
79.5
9.3
56.8
196.4
0.0
111.0
0.0
5.8
0.0
1.3
236.9

CITY WELL A -22 (MUNICIPAL)
PIMA COUNTY ANALYSIS
T13S 1112E SEC.12 CAA
DATE
EC
PH
NA
KCA
MG
CL
HCO3
CO3
SO4
NH3
NO2/3
KJN
TOTN
HARD
-- --
--
--
--
---
--
--
- ---
- --
- --
---
- --
- ---
- - --
4/ 7/77
.63
7.70
64.1
0.0
87.1
27.8
62.0
112..9
0.0
93.0
0.0
8.9
0.0
2.0
332.1
5/18/77
1.18
7.30
173.0
0.0
134.3
19.4
53.0
173.2
0.0
250.0
0.0
2.7
0.0
.6
415.3

(DOMESTIC)
713S R12E SEC.12CAC
DATE
°C
PH
NA
KCA
MG
CL
HCO3
CO3
SO4
NH3
NO2/3
KJN
TOTN
HARD
9/ 9/77
.85
9.00
84.0
2.3
64.5
5.9
58.0
166.4
0.0
100.0
0.0
6.2
0.0
1.4
185.4
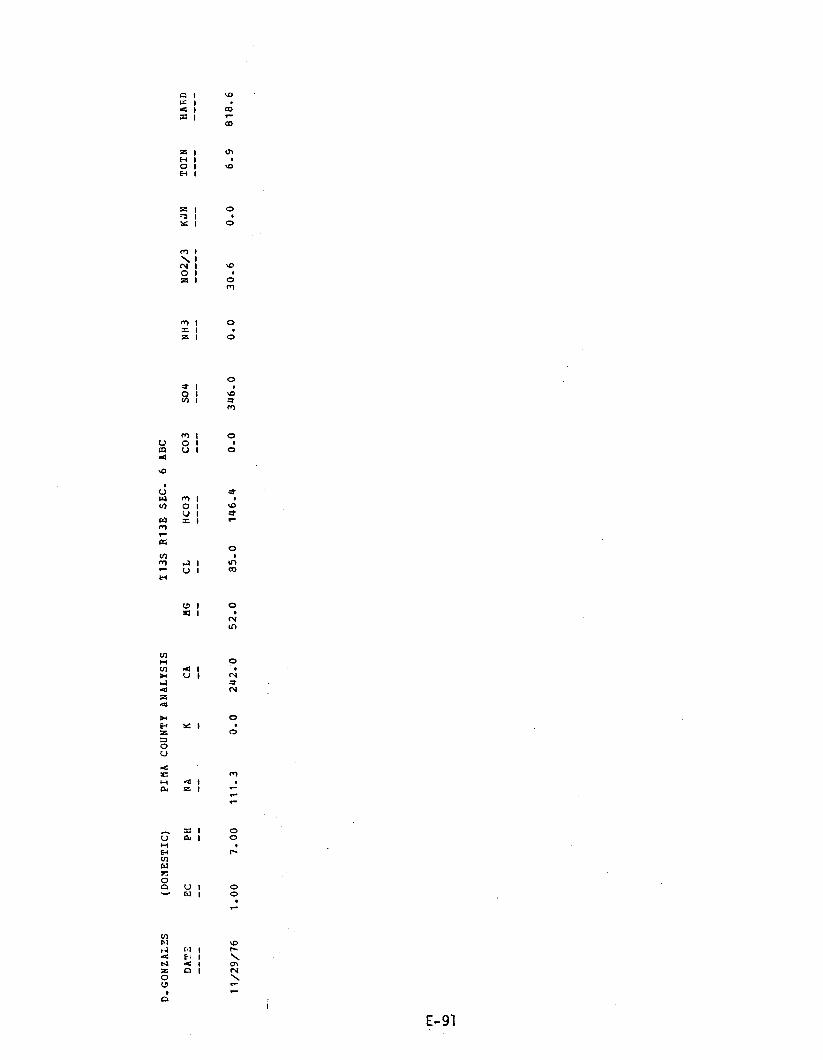
q 1iZ
I CO
Ri 1.-O
zI
oH 1O i OH 1
`y7 i
SC I O
M 1 O= 1Z 1 O
O1
O I oVI 1
M
M 1 OU O Iat U I O
so
CD 1 O= 1 N
Ls-)
U 1
0 1
ONN
OO
M
x I OV W I OHE-4InWOGI U 1 O.. W 1 O
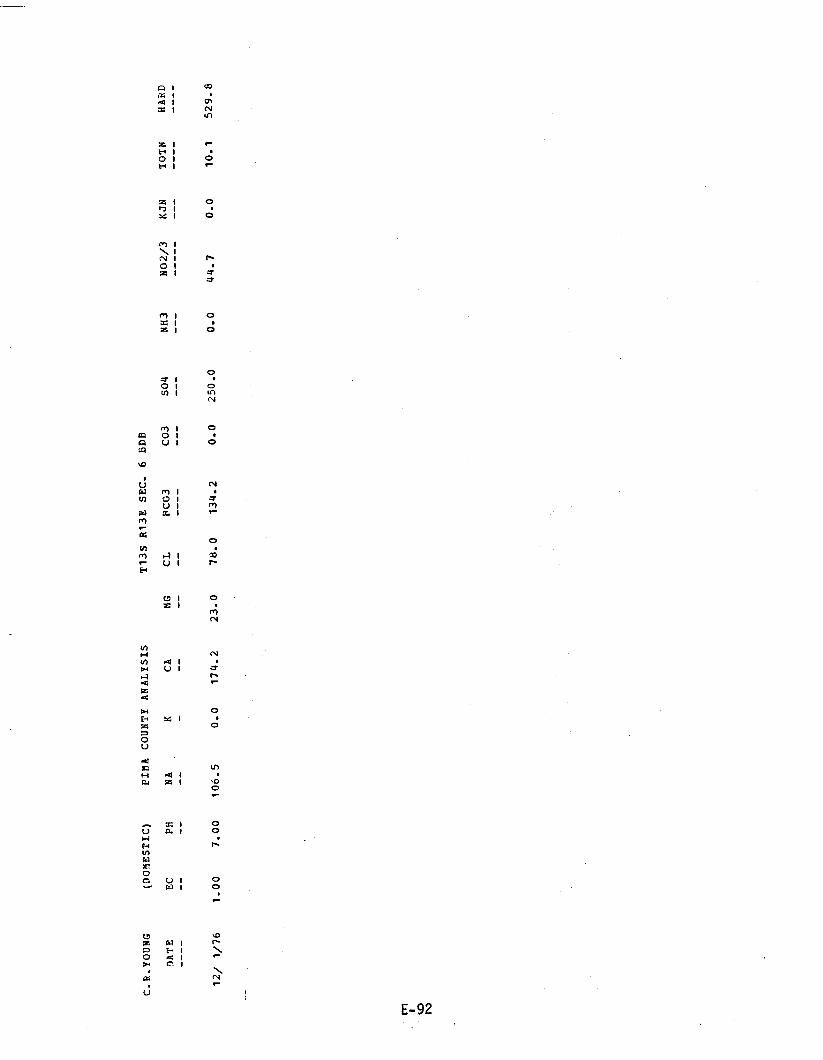
C.R.YOUNG
(DOMESTIC)
PIMA COUNTY ANALYSIS
T13S R13E SEC. 6 EDP
DATE
EC
PH
NA
KCA
MG
CL
PCO3
CO3
SO4
NH3
NO2/3
KJN
TOTH
HARD
- - --
--
--
--
---
--
--
--
- --
- --
---
---
-- --
----
12/ 1/76
1.00
7.00
106.5
0.0
174.2
23.0
78.0
134.2
0.0
250.0
0.0
44.7
0.0
10.1
529.8
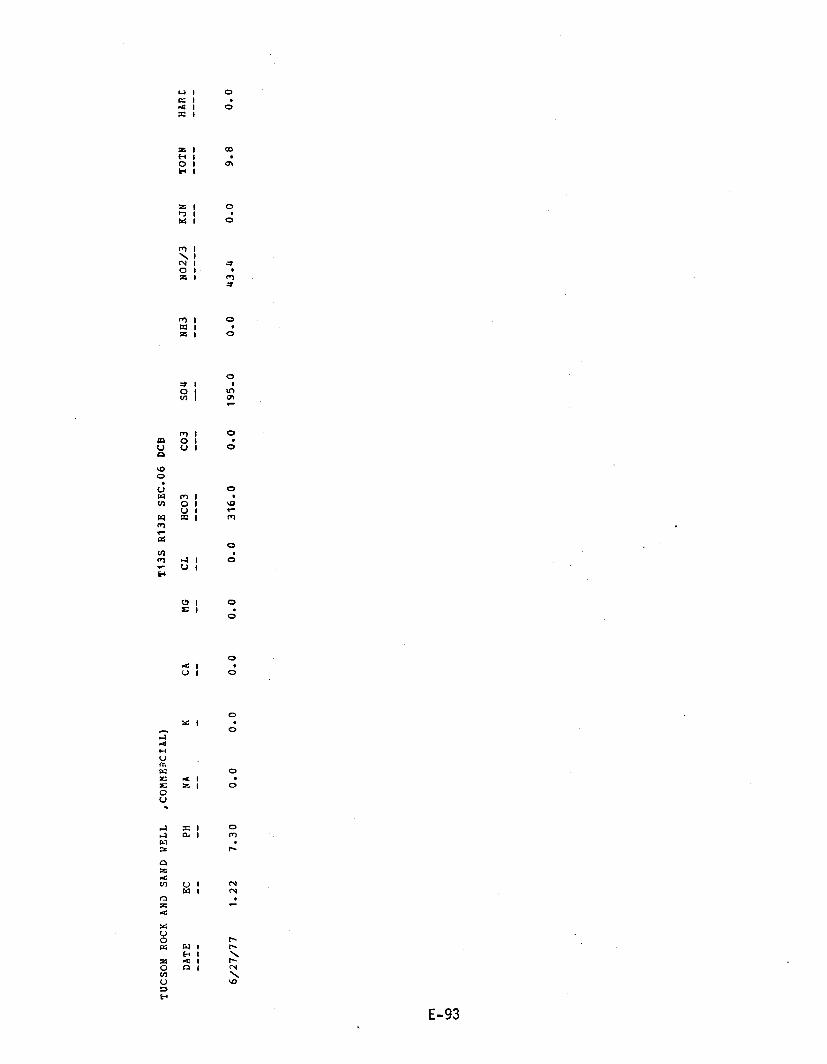
TUCSON ROCK ANS SAND WELL
,COMMERCIAL)
T13S R13E SEC.06 DCH
DATE
EC
PH
NA
KCA
MG
CL
HCO3
CO3
SO4
NH3
NO2/3
KJN
TOTH
HARE
----
--
--
--
---
--
--
----
---
---
---
---
----
----
6/27/77
1.22
7.30
0.0
0.0
0.0
0.0
0.0
316.0
0.0
195.0
0.0
43.4
0.0
9.8
0.0

DATE
----
EC
--
(IRRIGATION)
PH
NA
--
--
K -CA--
MG--
T13S R13E SEC.
CL
HCO3
--
°°
6CBA CO3
---
SO4
---
NH3
---
NO2/3
XJN
---
TOTN
----
7/15/77
1.09
7.60
53.0
2.1
101.3
11.8
34.0
316.0
0.0
130.0
0.0
4.9
0.0
1.1
301
9/ 9/77
1.27
7.50
106.5
2.3
158.0
10.4
76.4
313.0
0..0
104.3
0.0
8.0
0.0
1.8
437.
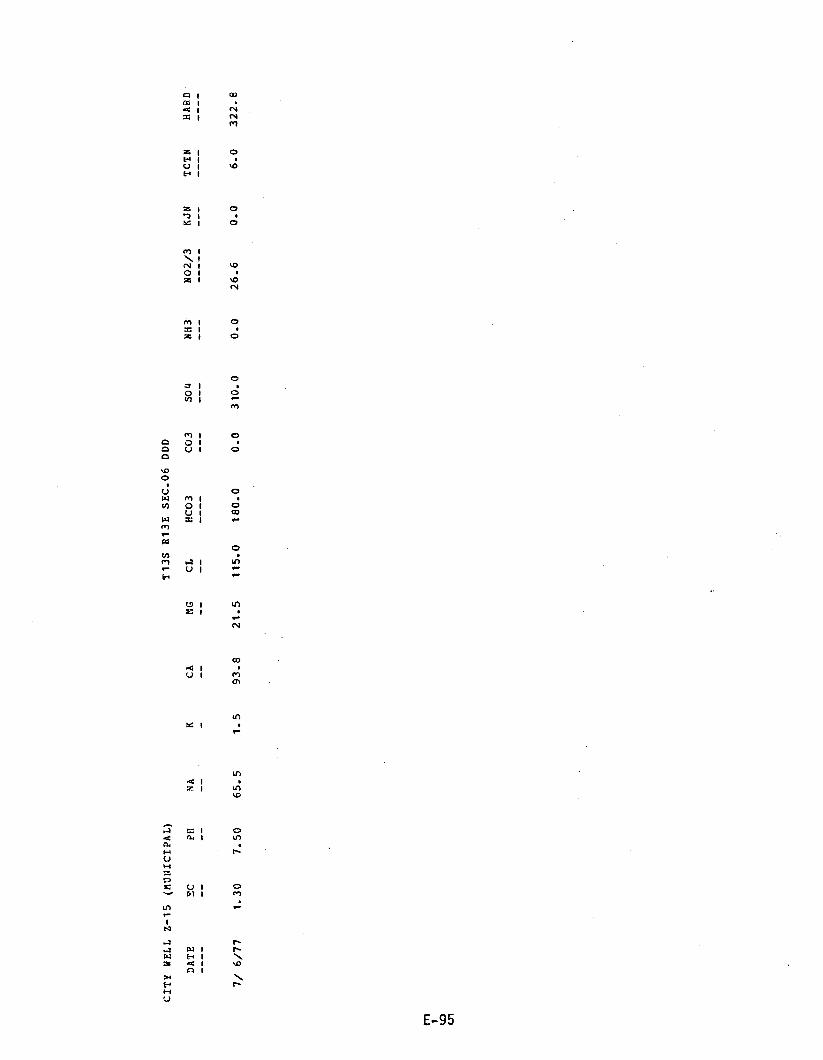
CITY WELL Z-15 (MUNICIPAL)
T13S R13E SEC.06 DDD
DATE
7/ 6/77
EC
PH
NA
KCA
MG
CL
HCO3
CO3
SO4
NH3
NO2/3
KJN
TCTN
HARD
_-
--
--
---
--
--
----
---
---
---
---
----
----
1.30
7.50
65.5
1.5
93.8
21.5
115.0
180.0
0.0
310.0
0.0
26.6
0.0
6.0
322.8
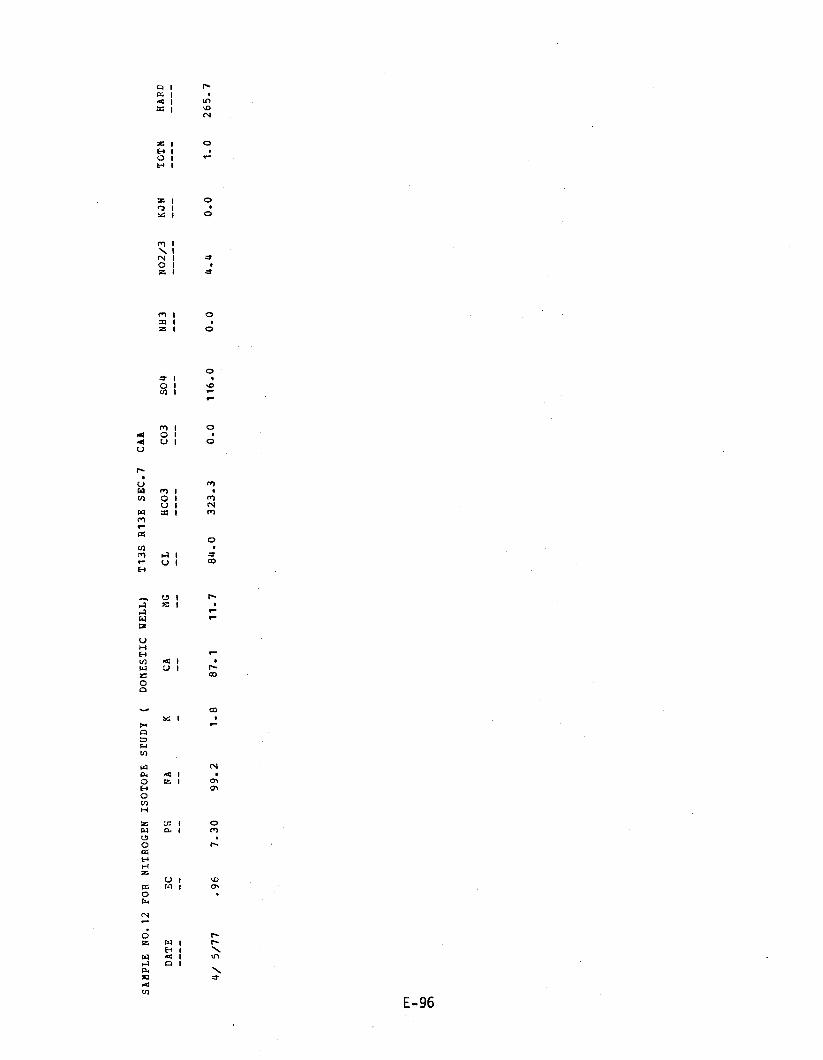
SAMPLE NO.12 FOR NITROGEN ISOTOPE SFUDY
(DOMESTIC WELL)
T13S R13E SEC.7
CAA
DATE
EC
PH
NA
KCA
MG
CL
HCO3
CO3
SO4
NH3
NO2/3
KJN
TOTN
HARD
4/ 5/77
.96
7.30
99.2
1.8
87.1
11.7
84.0
323.3
0.0
116.0
0.0
4.4
0.0
1.0
265.7

CITY WELL Z- 7
(NUNICIPAL)
T13S R13E SEC.08 BAA
DATE
EC
PH
NA
KCA
MG
CL
HCO3
CO3
SO4
NH3
NO2/3
KJN
TOTN
HARD
7/ 6/77
.52
7.70
50.0
1.3
114.4
5.5
31.5
165.9
0.0
70.0
0.0
6.2
0.0
1.4
308,11
8/ 1/77
.71
7.60
65.4.
1.4
101.3
10.8
36.0
201.0
0.0
150.0
0.0
7.5
0.0
1.7
297.5

SUNSET DAIRY WELL (COMMEP.CIAL)
T13S R13S SEC.8 CCC
DATE
EC
PH
NA
KCA
MG
CL
HCO3
CO3
SO4
NH3
NO2/3
KJN
TOTN
HAI'
----
--
--
--
---
--
--
----
---
---
---
---
----
----
5/ 9/77
1.17
7.50
84.7
1.2
159.7
10.7
111.0
128.1
0.0
314.0
0.0
31.0
0.0
7..0
442.9
9/ 9/77
1.68
7.70
102.0
3.3
182.0
11.0
108.8
127.7
0.0
220.5
.3
27.5
.6
6.8
499.9

(IRRIGATION)
T13S R13E SEC. 9DCB
DATE
EC
PH
NA
KCA
MG
CL
HCO3
CO3
SO4
NH3
NO2/3
KJN
TOTN
HPRD
----
--
--
--
---
--
--
----
---
---
---
---
----
-
7/15/77
.35
7.50
21.5
.8
43.3
4.5
10.0
151.0
0.0
20.0
0.0
8.9
0.0
2.0
126.Ì
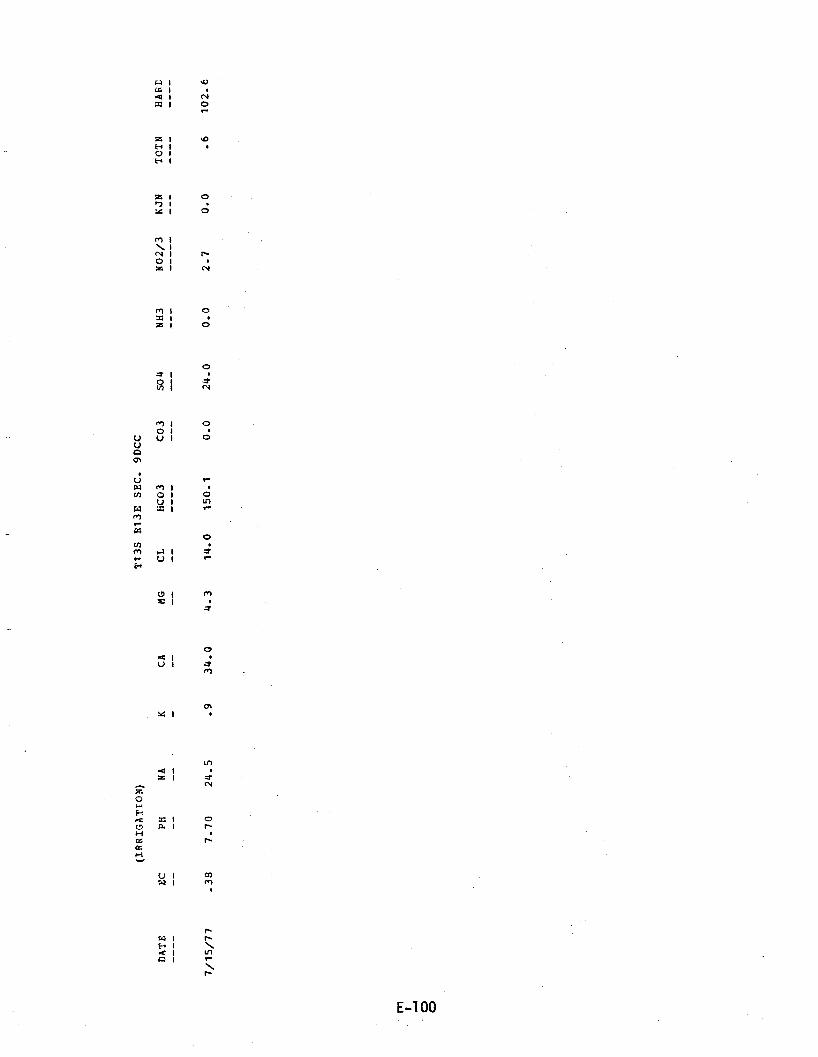
(IRRIGATION)
T13S R13E SEC. 9DCC
DATE
EC
PH
NA
KCA
HG
CL
HCO3
CO3
SO4
NH3
NO2/3
KJN
TCTN
HARD
----
--
--
--
---
--
--
----
---
---
---
---
----
----
7/15/77
.38
7.70
24.5
.9
34.0
4.3
14.0
150.1
0.0
24.0
0.0
2.7
0.0
.6
102.6

CITY WELL A -55 (MUNICIPAL)
T13S R13E SEC.14 CAD
DATE
EC
PH
NA
KCA
MG
CL
HCO3
CO3
SO4
NH3
NO2/3
KJN
TCTN
HPRD
----
--
--
--
---
--
--
----
---
---
-,-
---
----
----
8/ 1/77
.34
7.50
16.0
.9
46.0
2.8
10.0
119.8
0.0
25.0
0.0
15.9
0.0
3.6
126.1f
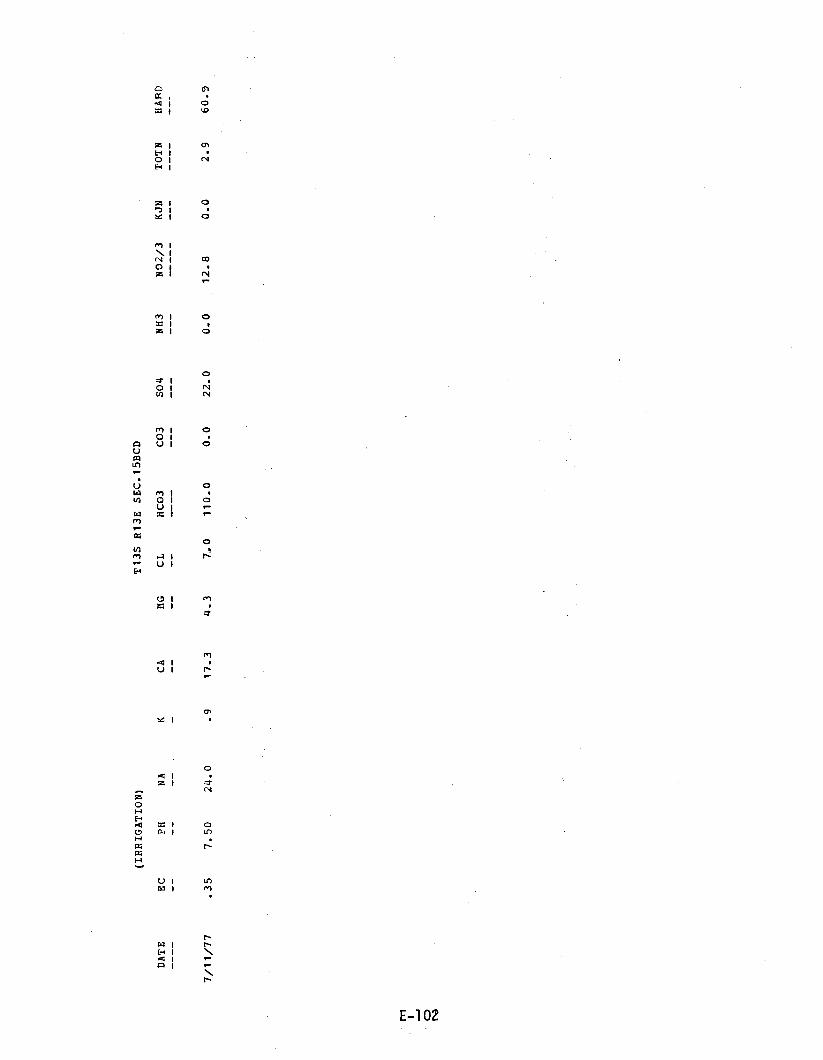
(IRRIGATION)
T13S R13E SEC.15BCD
DATE
EC
PH
NA
KCA
MG
CL
HCO3
CO3
SO4
NH3
NO2/3
KJN
TOTN
HARD
7/11/77
.35
7.50
24.0
.9
17.3
4.3
7..0
110.0
0.0
22.0
0.0
12.8
0.0
2.9
60.5

CITY WELL
A -52 (MUNICIPAL)
T13S R13E SEC.15 DAA
DATE
EC
PH
NA
KCA
MG
CL
HCO3
CO3
SO4
NH3
NO2/3
KJN
207N
HARF.
----
--
--
--
---
--
--
----
---
---
---
---
----
----
7/15/77
.40
7.60
25.0
.9
44.2
3.3
18.0
134.2
0.0
30.0
0.0
13.7
0.0
3.1
124.0
8/ 1/77
.30
7.40
16.0
.8
a8..8
2.8
6.0
109.8
0.0
17.0
0.0
18.6
.1
4.3
108.4
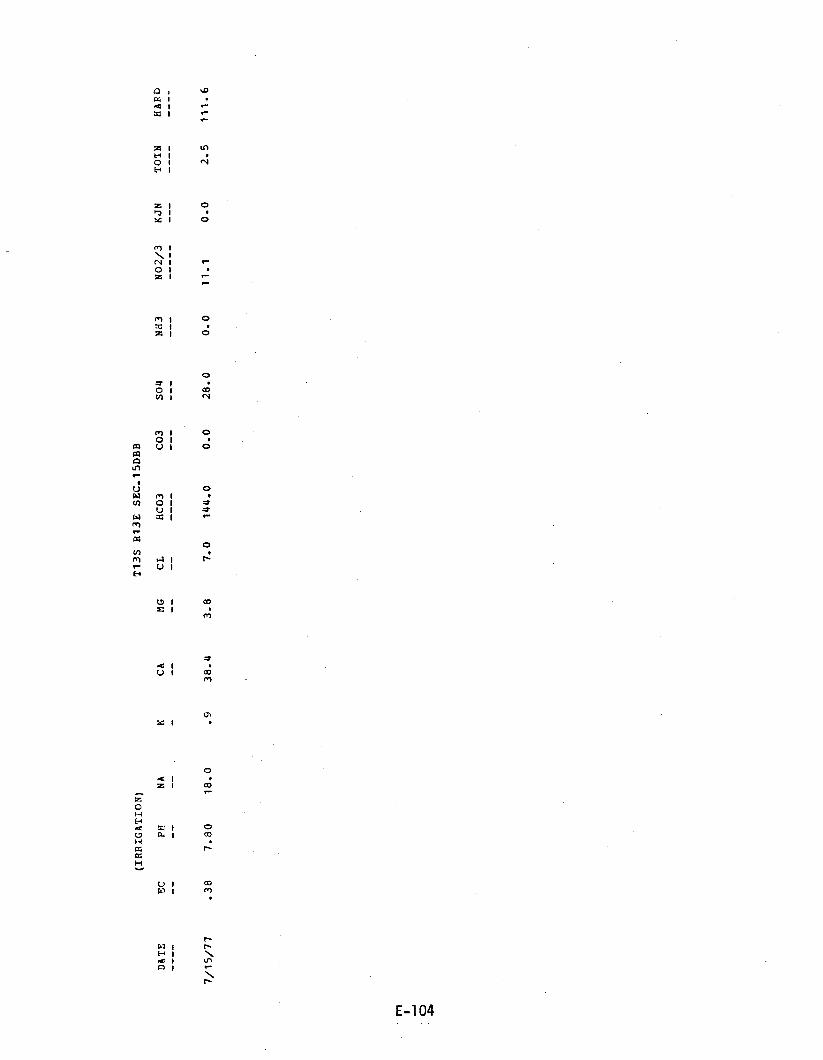
(IRRIGATION)
T13S R13E SEC.15DBB
DATE
EC
PH
NA
KCA
MG
CL
HCO3
CO3
SO4
NH3
NO2/3
KJN
TOTN
HAND
7/15/77
.38
7.80
18.0
.9
38.4
3.8
7.0
144.0
0.0
28.0
0.0
11.1
0.0
2.5
111.6
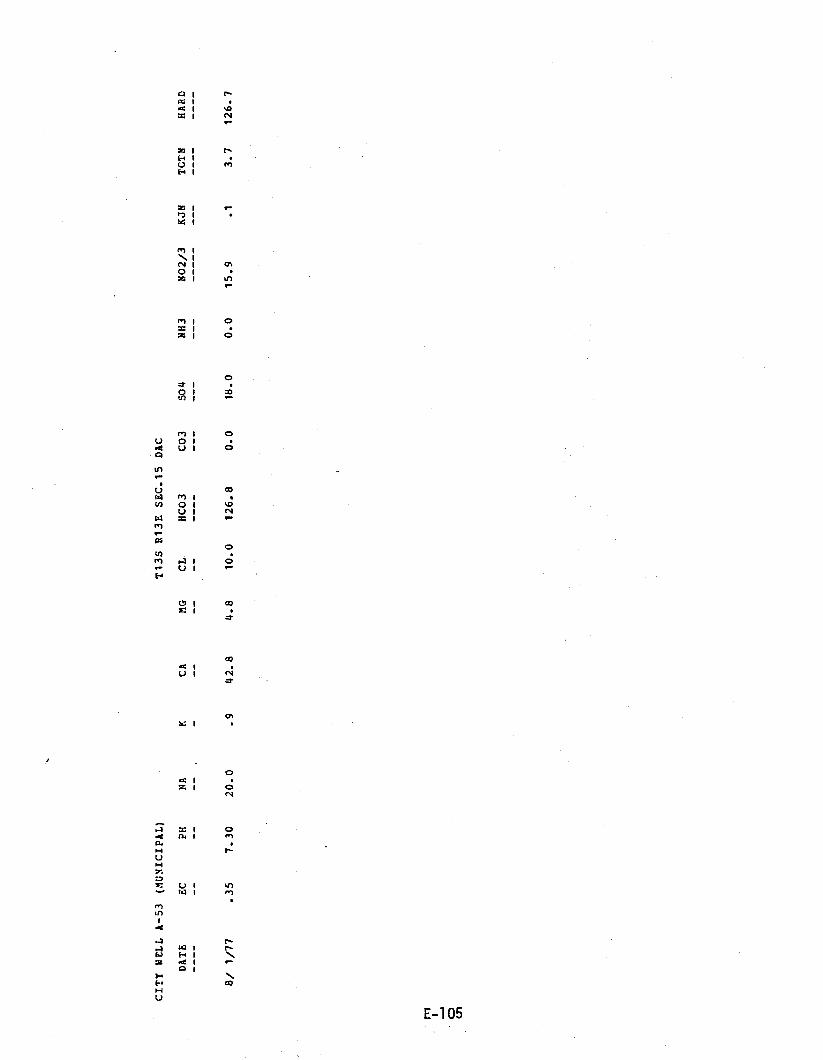
G 1 la lR 1 1/4Ç
M 1 N
z 1 NH i1 f...
F 1
x 1
h 1k
("1 1\ 1N 1 Q+O73 1 N
ry 1 Ox 1.Z 1 O
o? 1O i aD1n I
c1 1 oO 1U I O
CO
n 1 1O i 1/4D
U 1 Nx 1
1
O 1 coE 1
CO
iU 1 N
(7.1
O
r
U 1 u)w1 ,f)
E-105

(IRRIGATION)
T13S R13E SEC.16AAA
DATE
EC
PH
NA
KCA
MG
CL
HCO3
CO3
SO4
NH3
NO2/3
KJN
TOTN
HARD
----
--
--
--
---
--
--
----
---
---
---
---
----
----
7/11/77
.36
7.10
19.0
.9
20.3
4_8
8.0
114.0
0.0
21.0
0.0
18.2
0.0
4.1
70.5

CITY WEIL Z-5
(YUNICIPAL)
T13S 1113E SEC.16 BDB
DAT_F
EC
Ph
NA
KCA
MG
CL
HCO3
CO3
SO4
NH3
NO2/3
KJN
TOTN
HARC
----
--
--
--
---
--
--
----
_--
---
---
---
----
----
6/22/76
.62
7.48
41.1
1.2
61.7
6.4
41.0
193.9
0.0
76.0
0.0
7.5
0.0
1.7
180.5
7/ 6/77
.54
7.50
41.5
1.4
28.0
7.0
26.0
147.0
0.0
65.0
0.0
4.9
0.0
1.1
98.8
8/ 1/77
.60
7.60
45.0
1.5
26.3
6,.3
22.0
163.0
0.0
75.0
0.0
6.7
0.0
1.5
91.6

I
1
H 1O 1
N 1
mm
o

(IR?IGATIC4)
113S R13E SEC.16ADD
DATE
SC
PE
NA
KCA
MG
CL
HCO3
CO3
SO4
NH3
NO2/3
KJN
TOTN
HARD
----
--
--
--
---
--
--
----
---
---
---
---
----
----
7/11/77
.59
7.20
55.0
1.2
34.3
8.0
24.0
168.0
0.0
75.0
0.0
15.9
0.0
3.6
118.6

CITY FELL Z -3
(MUNICIPAL)
T13S R13E SEC.16 CCD
DATE
EC
PH
NA
KCA
MG
CL
HCO3
CO3
SO4
NH3
NO2/3
KJN
TCTN
HARE
6/22/76
.98
7.68
49.6
1.8
99.2
8.7
133.0
131.7
0.0
25.0
0.0
6.6
0.0
1.5
283.6
7/ 6/77
.53
7.90
39.5
1.6
114.0
5.3
30.0
139.0
0.0
63.0
0.0
7.5
0.0
1.7
306.5
8/ 1/77
1.08
7.70
53.0
2.4
101.3
10.8
111.0
151.3
0.0
105.0
0.0
6.6
0.0
1.5
297.5

CITY NELL Z-2
(:1üNICIPAL)
T13S R13E SEC.16 DMA
DATE,
EC
PH
NA
KCA
MG
CL
HCO3
CO3
SO4
NH3
NO2/3
KJN
TOTN
HARE
6/22/76
.50
7.55
33.8
.6
49.6
3.8
35.0
169.6
0.0
46.0
0.0
6.6
0.0
1.5
139.5
7/ 6/77
.47
7.70
39.0
1.4
59.2
8.8
33.0
139.0
0.0
47.0
0.0
7.5
0.0
1.7
184.1
8/ 1/77
.49
7.70
34.5
1.3
51.5
2.4
19.0
163.5
0.0
13.0
0.0
4.9
0.0
1.1
138.5

CITY REM, Z-6
(MUivICIPAL)
T13S R13E SEC.17 AAA
DAT°
EC
PH
NA
hCA
MG
CL
HCO3
CO3
SO4
NH3
NO2/3
KJN
ICIN
HARD
6/22/76
.31
7.42
64.1
.6
62.9
8.6
49.0
146.4
0.0
150.0
0.0
12.4
0.0
2.8
192.5
7/ 6/77
.60
7.50
51.5
1.5
75.9
7.8
29.0.
151.0
0.0
100.0
0.0
8.9
0.0
2.0
221.7
8/ 1/77
.87
7.50
55.0
1.7
70.5
9.8
36.0
195.0
0.0
115.0
0.0
9.8
0.0
2.2
216.4
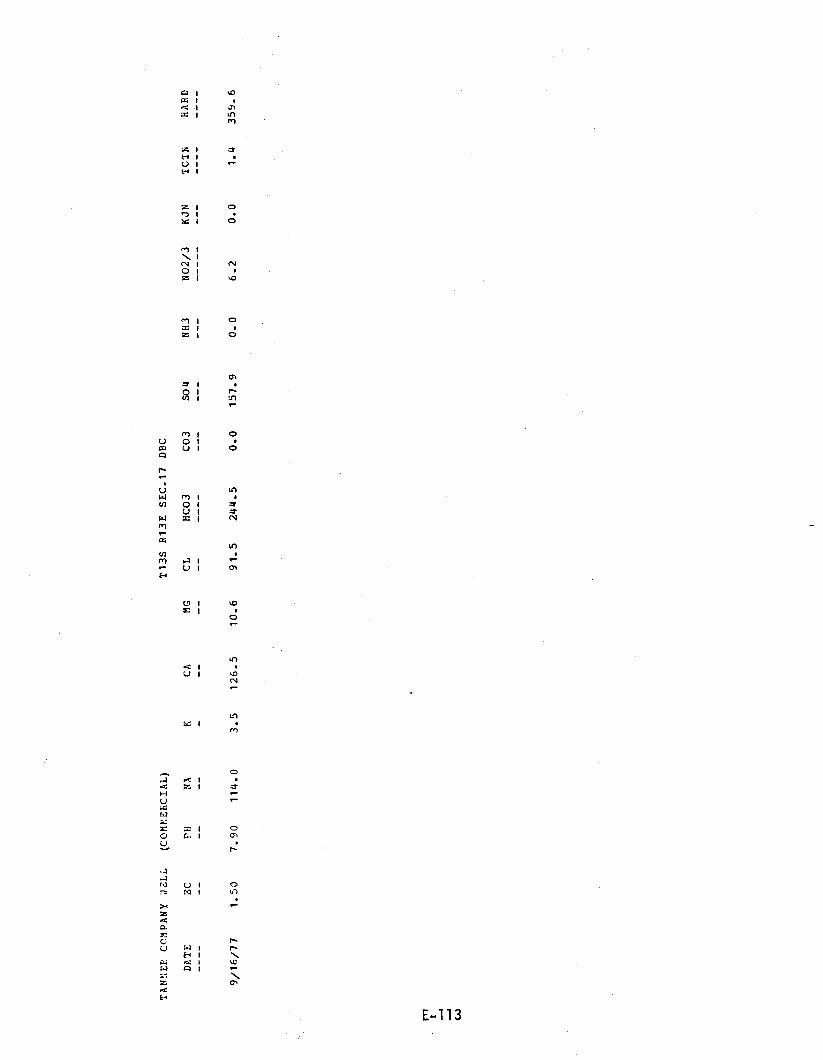
TAN!IEE COMPANY JELL
(COMMERCIAL)
T13S R13E SEC.17 DBC
DATE
EC
PH
NA
KCA
MG
CL
HCO3
CO3
SO4
NH3
NO2/3
KJN
TCTN
HARD
9/16/77
1.50
7.90
114.0
3.5
126.5
10.6
91.5
244.5
0.0
157.9
0.0
6.2
0.0
1.4
355.6
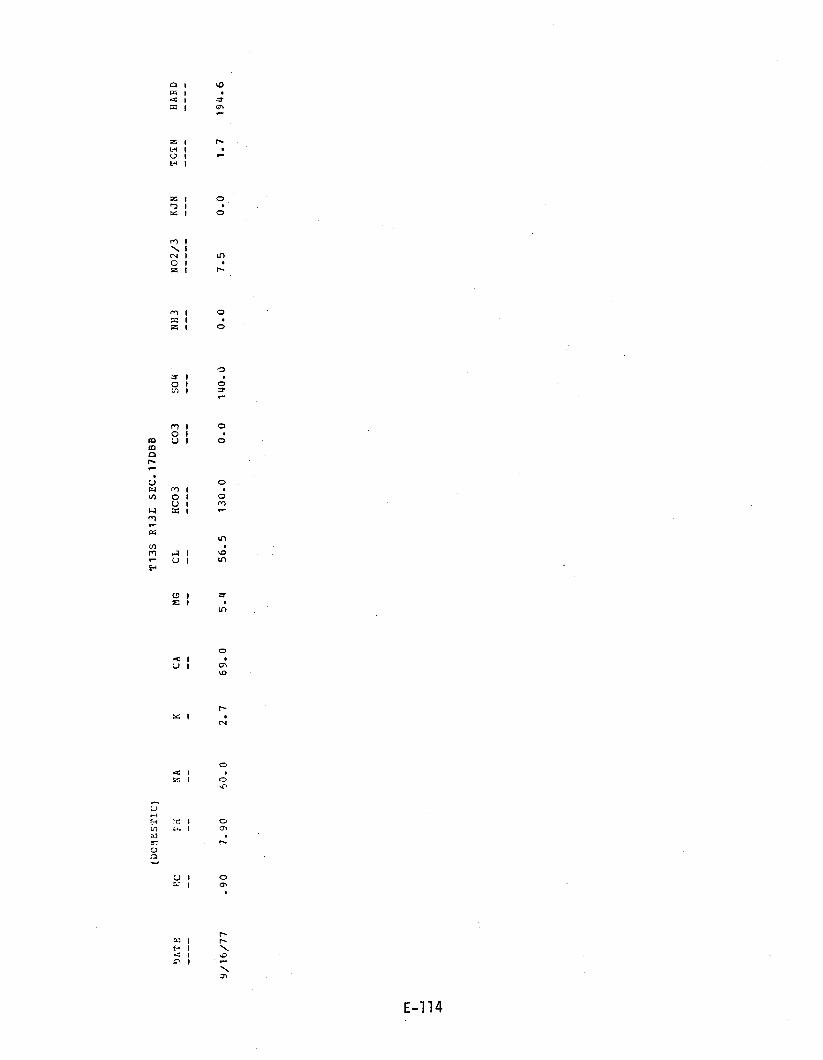
(DO!1ESTIC)
T13S R13E SEC.17DBB
DATE
EC
Fri
NA
KCA
MG
CL
HCO3
CO3
SO4
NH3
NO2/3
KJN
TCIN
HARD
9/16/77
.90
7.90
60.0
2.7
69.0
5.4
56.5
130.0
0.0
140.0
0.0
7.5
0.0
1.7
194.6
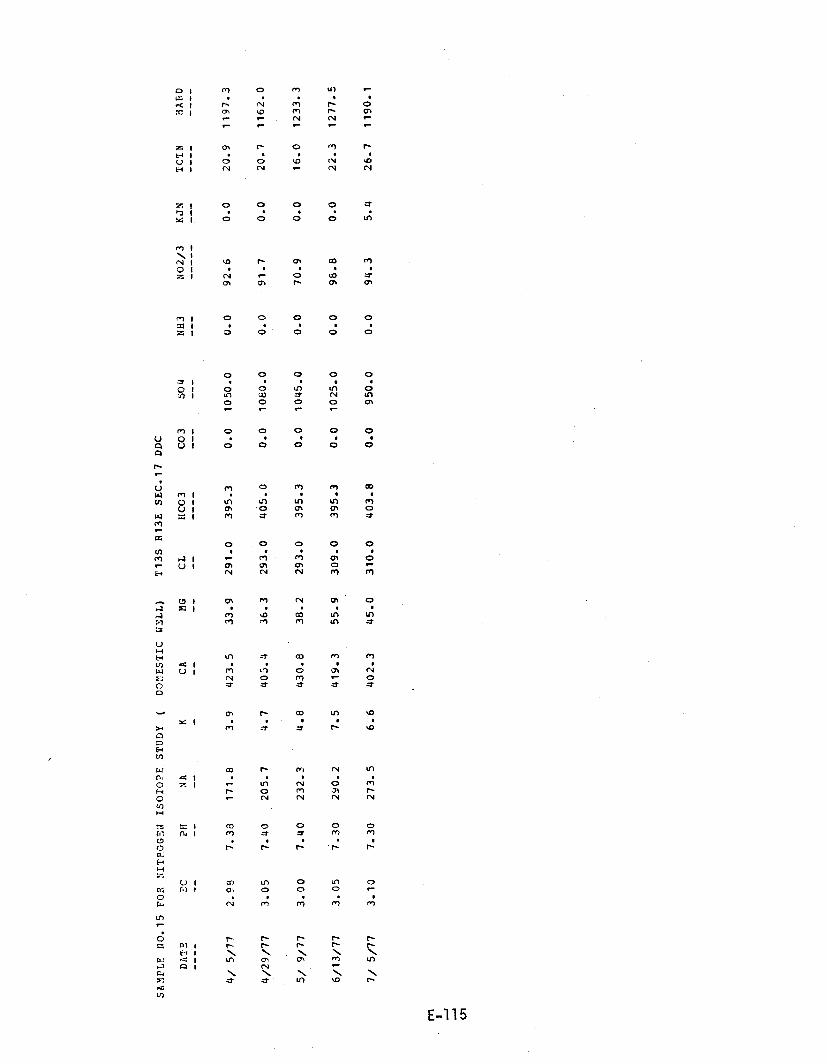
SAMPLE NO.15
DATE
--^-
FOR EC
--
NITPOGEN
?H--
ISOTOPE
NA
-^
STUDY
(
K
DOMESTIC
CA
--
DELL) MG
--
T135
CL
--
R13E SEC.17 DDC
HCO3
CO3
----
--^
SO4
---
NH3
---
NO2/3
KJN
---
TCZN
----
HAM)
----
4/ 5/77
2.99
7.38
171.8
3.9
423.5
33.9
291.0
395.3
0.0
1050.0
0.0
92.6
0.0
20.9
1197.3
4/29/77
3.05
7.40
205.7
4.7
405.4
36.3
293.0
405.0
0.0
1080.0
0.0
91.7
0.0
20.7
1162.0
5/ 9/77
3.00
7.40
232.3
4.8
430.8
38.2
293.0
395.3
0.0
1045.0
0.0
70.9
0.0
16.0
1233.3
6/13/77
3.05
7.30
290.2
7.5
419.3
55.9
309.0
395.3
0.0
1025.0
0.0
98.8
0.0
22.3
1277.5
7/ 5/77
3.10
7.30
273.5
6.6
402.3
45.0
310.0
403.8
0.0
950.0
0.0
94.3
5.4
26.7
1190.1

1 0rZ I
r4 I
:C I ON
Z I DN 1
O 1 7N 1
r1 1
iN 1O 1
Z 1 ON
r11 O
= 1Z I O
1
O 1 cotn
IO
O
rn I
O 1U I
OO
V:,
1.
O
.-i 1 47)
U I t+
4 1U I
1
O
O
r1.t 1.. 1 r
n
U I
W 1
,C/N 1 nF' 1 \e:
1r1
ca1
\N
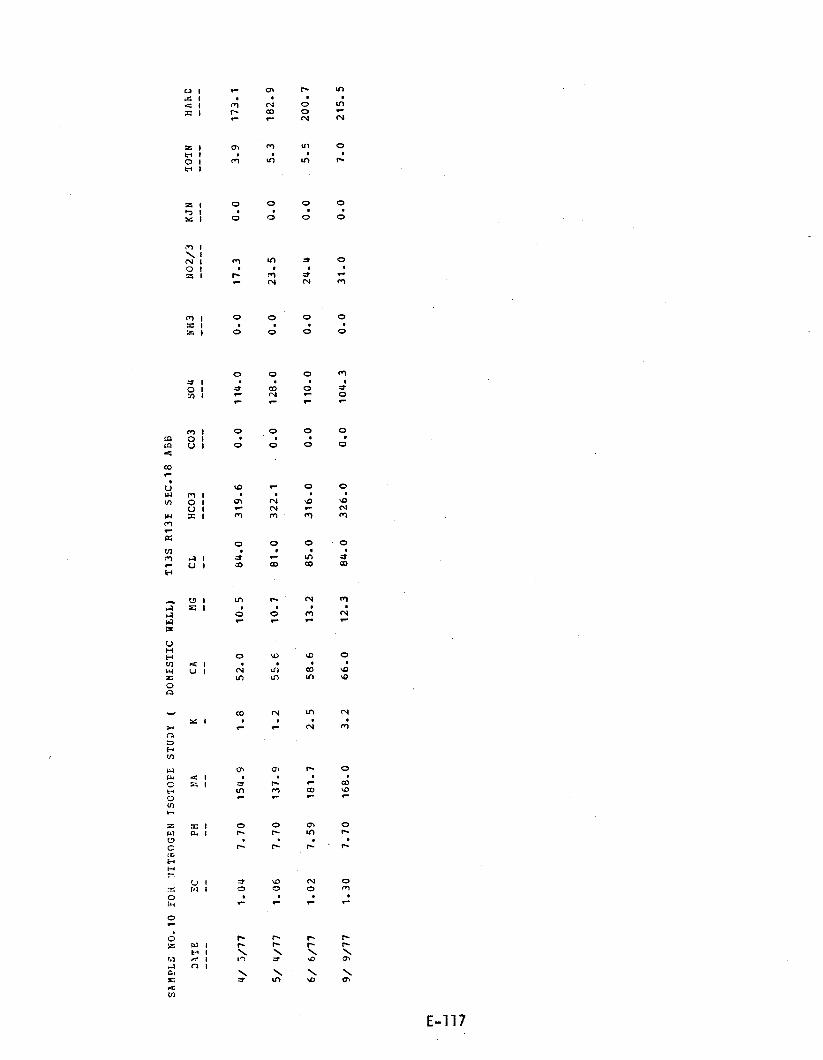
SAMPLE NO.10 FOR
DATE
EC
----
--
:IIT&OGEN
PH--
ISOTOPE STUDY
(
NA
K--
-
DOMESTIC
CA
--
WELL) MG--
713S R13E SEC.18 ABB
CL
HCO3
CO3
--
----
---
SO4
---
NH3
---
NO2/3
KJN
---
TWIN
----
HARE
----
4/ 5/77
1.04
7.70
154.9
1.8
52.0
10.5
84.0
319.6
0.0
114.0
0.0
17.3
0.0
3.9
173.1
5/ 4/77
1.06
7.70
137.9
1.2
55.6
10.7
81.0
322.1
0.0
128.0
0.0
23.5
0.0
5.3
182.9
6/ 6/77
1.02
7.59
181.7
2.5
58.6
13.2
85_0
316.0
0.0
110.0
0.0
24.4
0.0
5.5
200.7
9/ 9/77
1.30
7.70
168.0
3.2
66.0
12.3
84.0
326.0
0.0
104.3
0.0
31.0
0.0
7.0
215.5

(DOMESTIC)
T13S R13E SEC.18ACA
DATE
EC
PH
NA
KCA
MG
CL
HCO3
CO3
SO4
NH3
NO2/3
KJN
TOTN
HARD
----
--
--
--
---
--
--
----
---
---
---
---
----
----
9/10/77
1.25
7.60
120.0
4.0
73.5
17.6
91.3
322.1
0.0
163.8
0.0
19.0
0.0
4.3
256.1

(DOMESTIC)
T13S R13E SEC.18ADB
DATE
EC
PH
NA
KCA
MG
CL
HCO3
CO3
SO4
NH3
NO2/3
KJN
TOTN
HARE
9/10/77
1.29
7.60
122.5
3.6
66.0
15.3
85.0
347.7
0.0
147.5
0.0
8.9
0.3
3.2
227.S
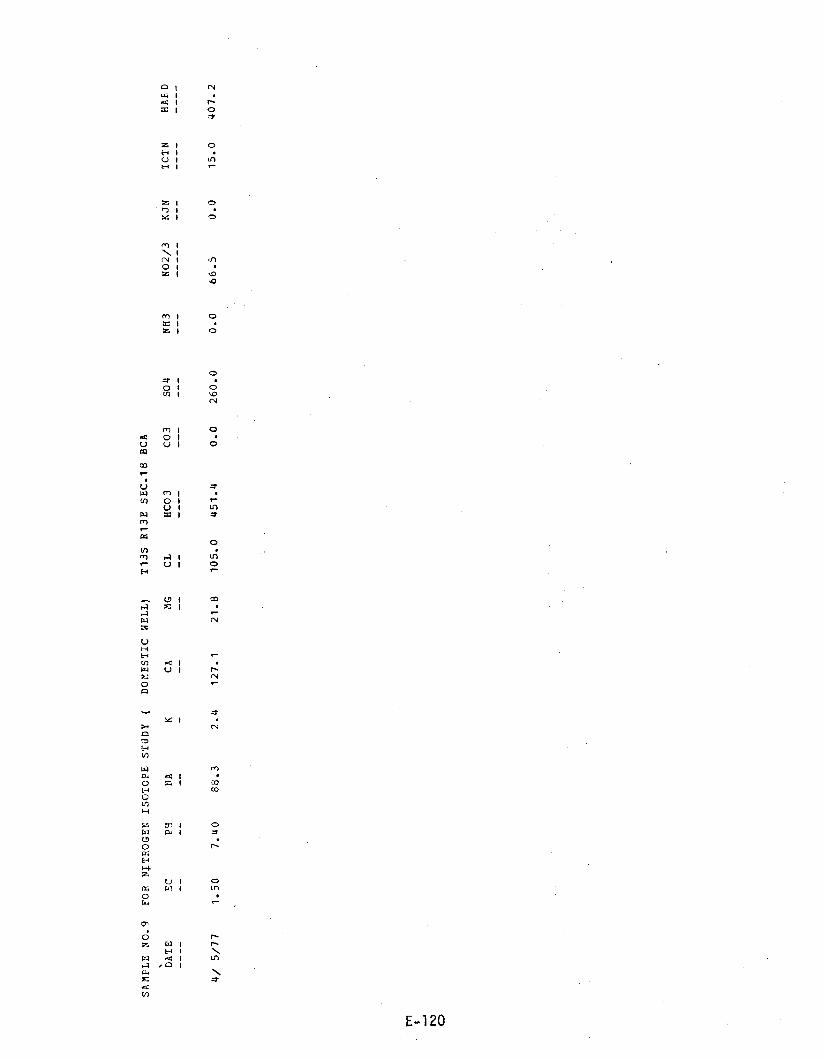
SAMPLE NO.9
FOP NITROGEN ISOTOPE STUDY
(DOMESTIC WELL)
T13S R13E SEC.18 BCA
DATE
EC
PH
1A
KCA
MG
CL
HCO3
CO3
SO4
NH3
NO2/3
KJN
ZCTN
HAFD
4/ 5/77
1.50
7.40
88.3
2.4
127.1
21.8
105.0
451.4
0.0
260.0
0.0
66.5
0.0
15.0
407.2

(DOMESTIC)
T13S R13E SEC.18BCH
DATE
EC
PH
NA
KCA
MG
CL
HCO3
CO3
SO4
NH3
NO2/3
KJN
TCTN
HAfiL
----
--
--
--
---
--
--
----
---
---
---
-°
----
----
9/10/77
1.95
7.50
177.5
4.0
128.0
29.7
104.3
420.0
0.0
317.3
0.0
58.9
0.0
13.3
442. C
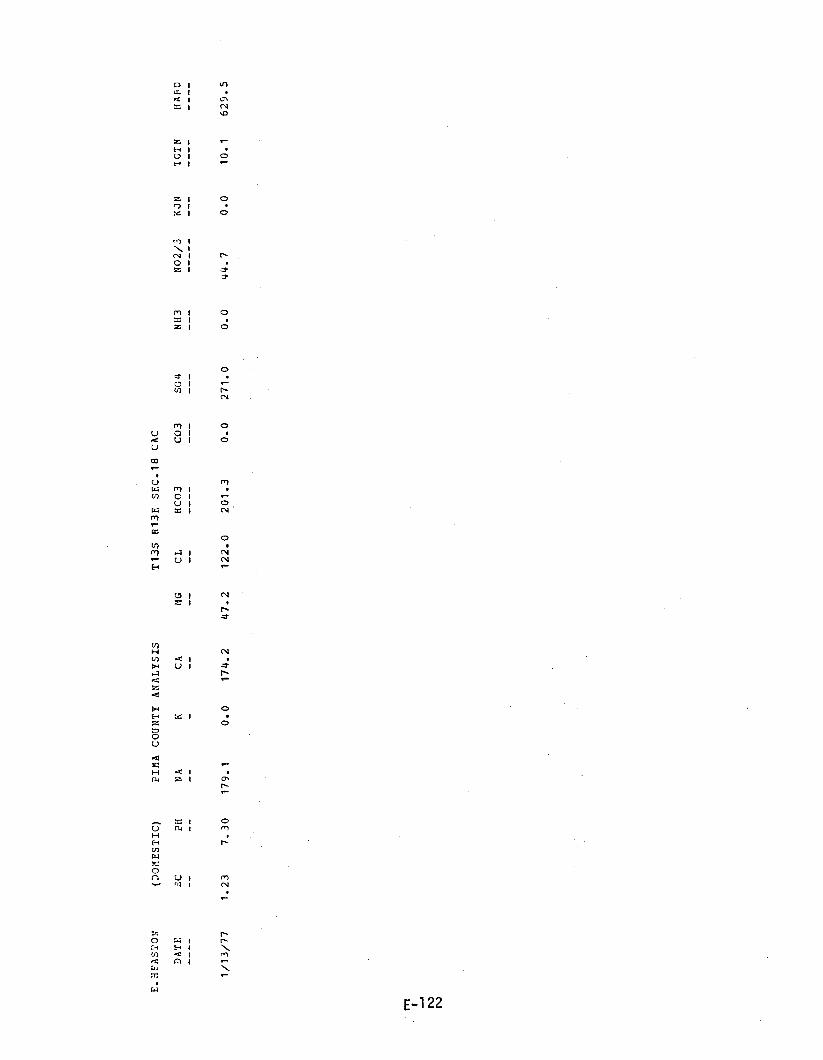
A 1 u'1w id
Ix 1 N
zlH 1O 1N i
o
t`'1 1 Ox 1
1 O
O7 1O 1N 1 t`
N
M 1 OO 1
U 1 O
N1 1
U 1
M
O
ONNr
c9 ¡ N- 1 n
R IU
N
r-
U 1 rnr] I N
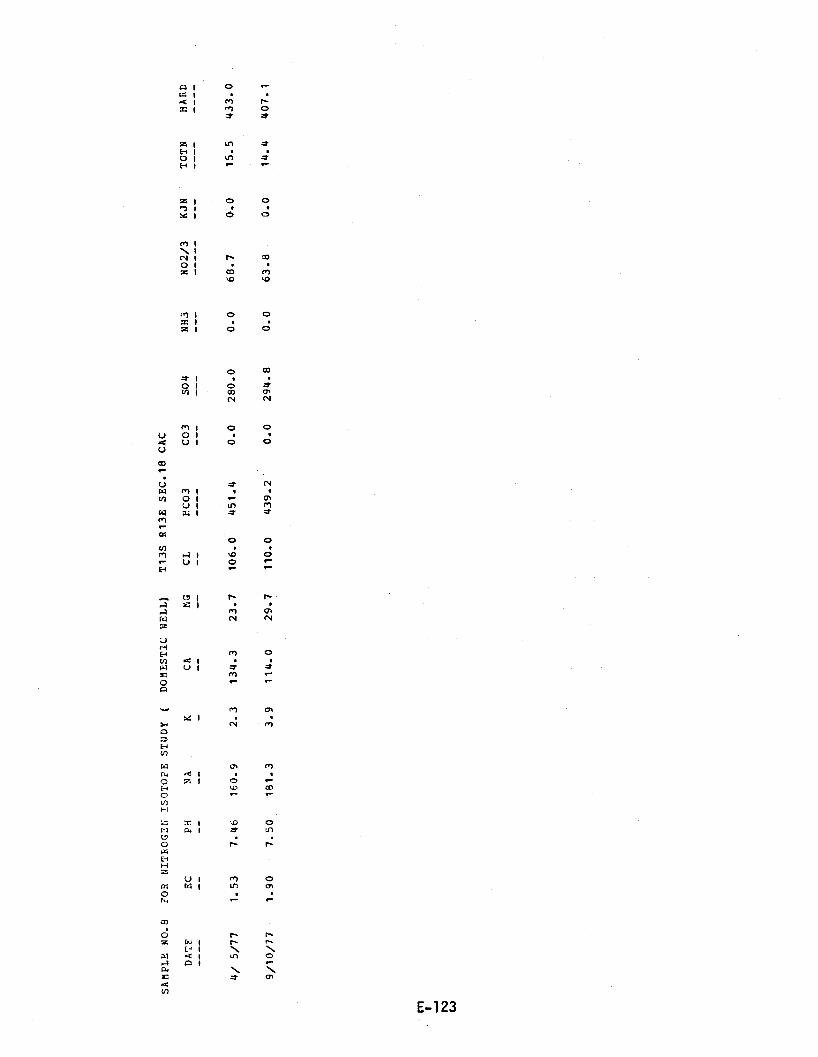
SAMPLE NO.8
FOR NIT&OGzl ISOTOPE STUDY
(DOMESTIC WELL)
T13S R13E SEC.18 CAC
DATE
EC
PH
NA
KCA
MG
CL
HCO3
CO3
SO4
NH3
NO2/3
KJN
TOTN
HARD
4/ 5/77
1.53
7.46
160.9
2.3
134.3
23.7
106.0
451.4
0.0
280.0
0.0
68.7
0.0
15.5
433.0
9/10/77
1.90
7.50
181.3
3.9
114.0
29.7
110.0
439.2
0.0
294.8
0.0
63.8
.
0.0
14.4
407.1

(DOMESTIC)
T13S R13E SEC.18CAD
DATr
?C
PH
NA
KCA
MG
CL
HCO3
CO3
SO4
NH3
NO2/3
KJN
TOTN
HARD
----
--
--
--
---
--
--
----
---
---
---
---
----
----
9/10/77
1.85
7.50
191.4
3.9
90.5
26.9
112.3
419.7
0.0
247.5
0.0
68.6
0.0
15.5
336.8
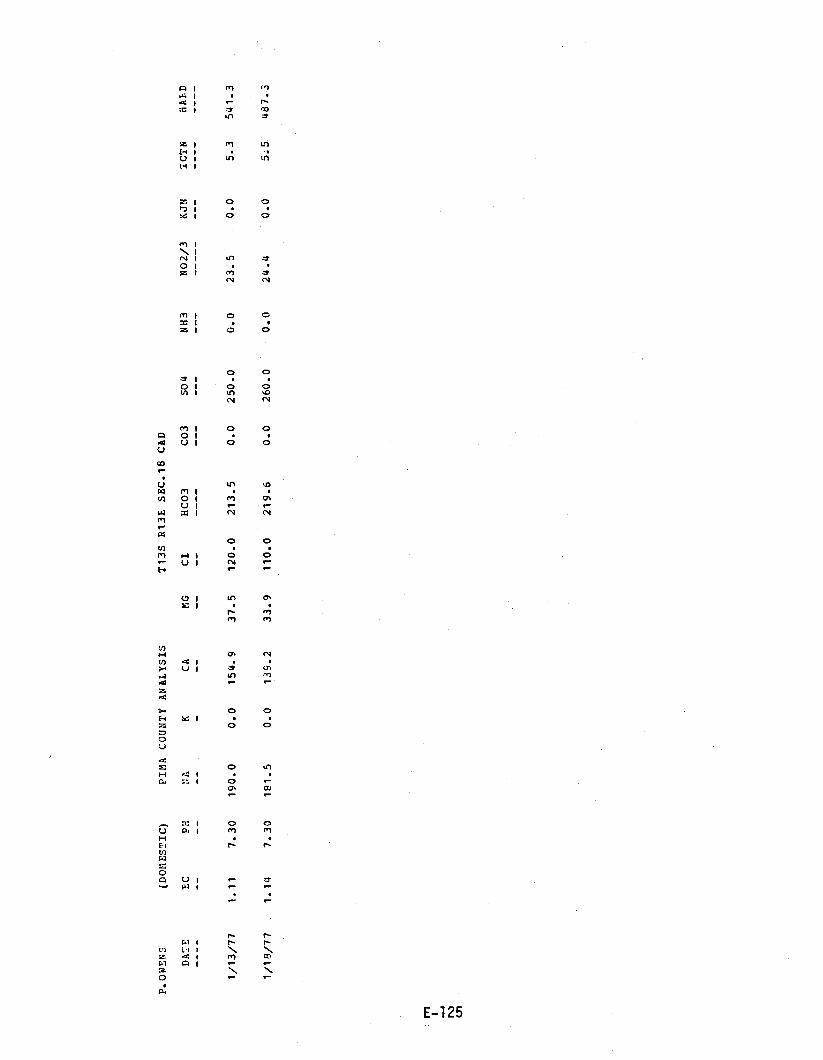
E'L8h
S'S
0'0
h'trZ
0'0
0'09Z
0'0
9-6LZ
0"011
6'EE
Z'6El
0'0
S'l8L
OE'L
ht'L
LL/8L/l
E'LAS
E'S
0'0
S'EZ
0'0
O'OSZ
0'0
S'£lZ
0'OZl
S'LE
6'hSL
0'0
0'06l
OE'L
tt'L
LL/EL/L
----
----
---
---
---
---
----
--
--
--
---
--
--
----
Q3VK
RIO/
NPy
E/Z0N
EHR
hOS
E00
E0011
ID
9W
V0
xVN
Ed
03
SLVQ
OV0 9L'03S 3£Lä SELL
SISxIVRV xZN000 VWId
I0IIS3sOQI
S4âH0'd
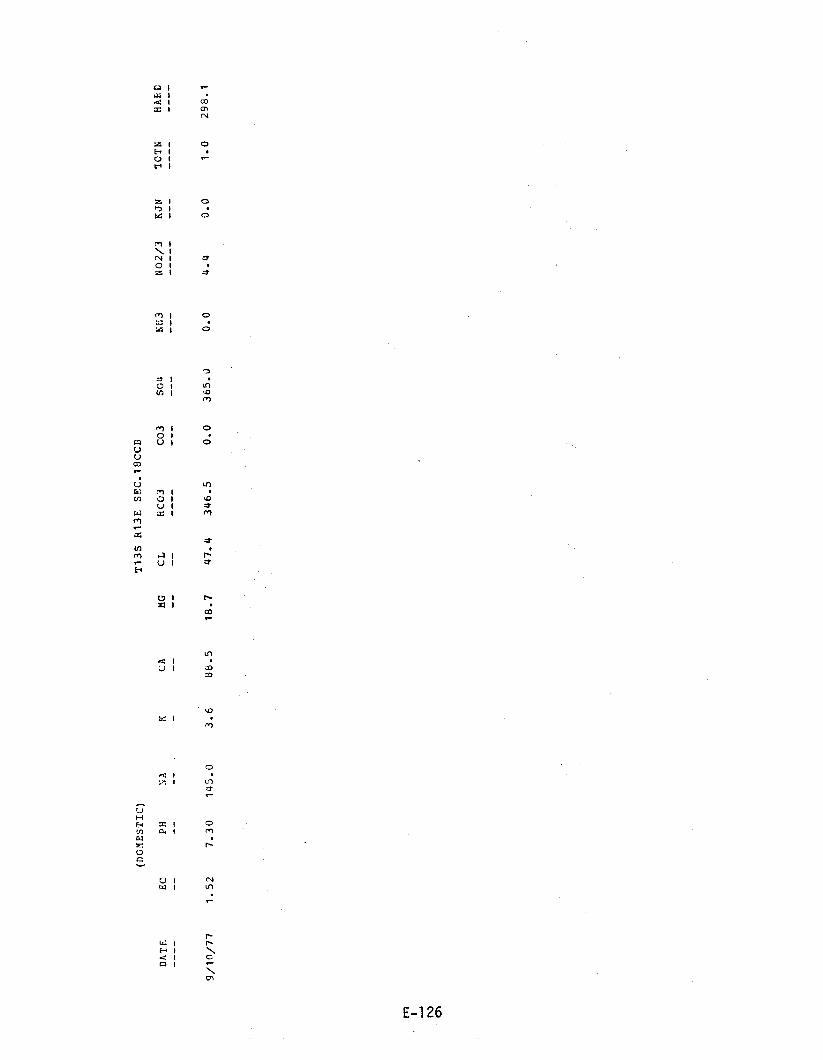
(DOMESTIC)
T13S 813E SEC.18CCB
DATE
EC
PH
NA
KCA
MG
CL
HCO3
CO3
SO4
NH3
NO2/3
KJN
TOTN
HA&D
9/10/77
1.52
7.30
145.0
3.6
88.5
18.7
47.4
346.5
0.0
365.0
0.0
4.4
0.0
1.0
298.1

(DO"ESiIC)
2135 R13F SEC.18CCB
DATE
EC
?H
NA
KCA
MG
CL
HCO3
CO3
SO4
NH3
NO2/3
KJN
40TN
HARE
9/10/77
1.63
7.40
60.0
3.7
122.5
17.0
47.5
357.5
0.0
206.5
0.0
.4
J.0
.1
376.0

(DOMESTIC)
T13S R13E SEC.18CDD
DATE
°C
PH
NA
KCA
MG
CL
HCO3
CO3
SO4
NH3
NO2/3
KJN
TCTN
RAFE
----
--
--
--
---
--
--
----
---
---
---
---
----
----
9/10/77
1.60
7.40
142.0
3.3
73.5
19.8
48.0
297.7
0.0
287.0
0.0
8.0
0.0
1.8
265.1
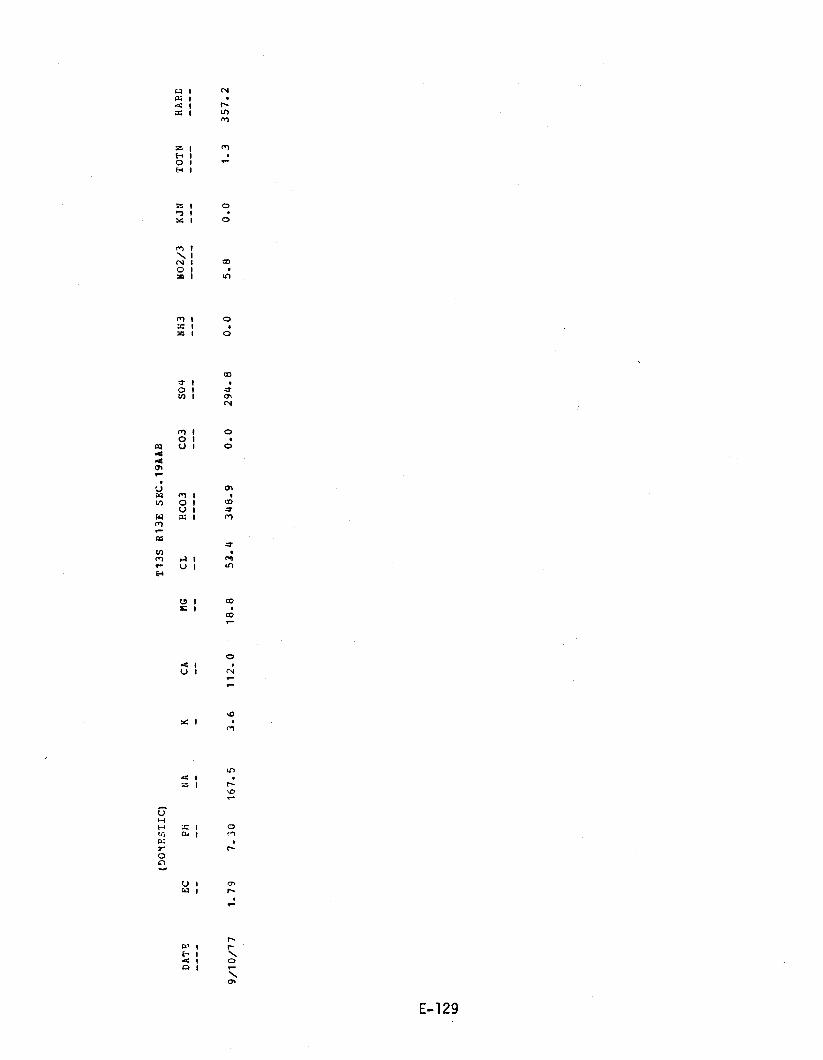
(DOyESTSC)
T13S R13E SEC.19AAB
DATE
EC
PH
NA
KCA
HG
CL
HCO3
CO3
SO4
NH3
NO2/3
KJN
TCTN
HARD
9/10/77
1.79
7.30
167.5
3.6
112.0
18.8
53.4
348.9
0.0
294.8
0.0
5.8
0.0
1.3
357.2

CITY WELL A -43 (MUNICIPAL)
T135 813E SEC.19 CDC
DATE
EC
PH
NA
KCA
HG
CL
HCO3
CO3
SO4
NH3
NO2/3
KJN
TOTN
HAED
----
--
--
--
---
--
--
----
---
---
---
---
----
----
7/15/77
.70
7.80
26.5
1.7
51.5
25.8
74.0
217.2
0.0
90.0
0.0
17.3
0.0
3.9
234.9
9/10/77
.98
7.70
82.0
1.7
51.0
24.0.
67.5
220.8
0.0
135.0
0.0
18.2
0.0
4.1
226.2

CITY WELL A -43 (MUNICIPAL)
PIMA COUNTY ANALYSIS
T13S P13E SEC.19 CDC
DATE
EC
PH
NA
KCA
MG
CL
HCO3
CO3
SO4
NH3
NO2/3
KJN
TOSN
HARD
4/ 7/77
.67
7.30
56.9
0.0
96.8
29.0
63.0
122.0
0.0
96.0
0.0
14.2
0.0
3.2
361.2
5/18/77
.66
7.20
50.8
0.0
99.2
18.2
75.0
104.9
0.0
100.0
0.0
15.1
0.0
3.4
322.7

(DOMESTIC)
1135 &13E SEC.19DCb
DATE
EC
PH
NA
KCA
HG
CL
HCO3
CO3
SO4
NH3
NO2/3
KJN
ZOZN
HALL
----
--
--
--
---
--
--
----
---
---
---
---
----
----
9/10/77
1.35
7.30
128.8
3.6
73.5
18.2
71.1
274.5
0.0
238.5
0.0
36.8
0.0
8.3
258.5
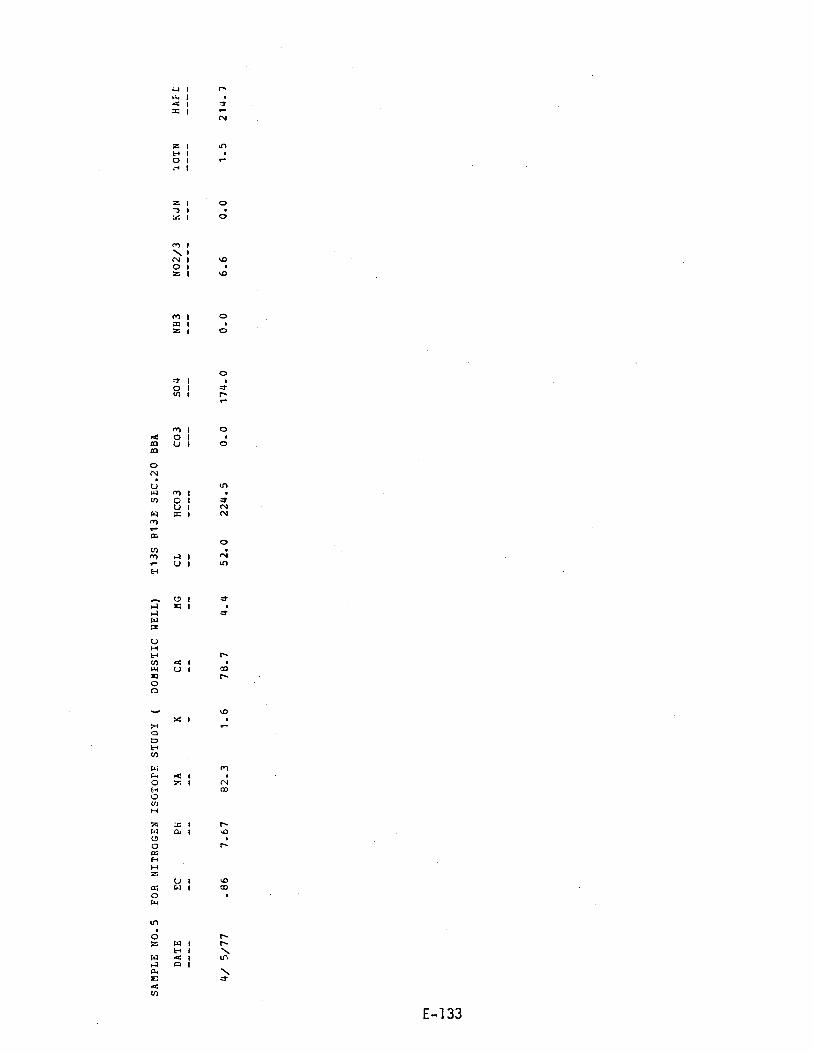
z 1 II)H 1O 1
1
z 1 o7 1Y. 1 O
m 1\N 1 DO IZ 1 O
m 1 oSz 1 0
oO' 1
O 1 7tel 1 n
r1 r
H 1 \4 1O 1
\
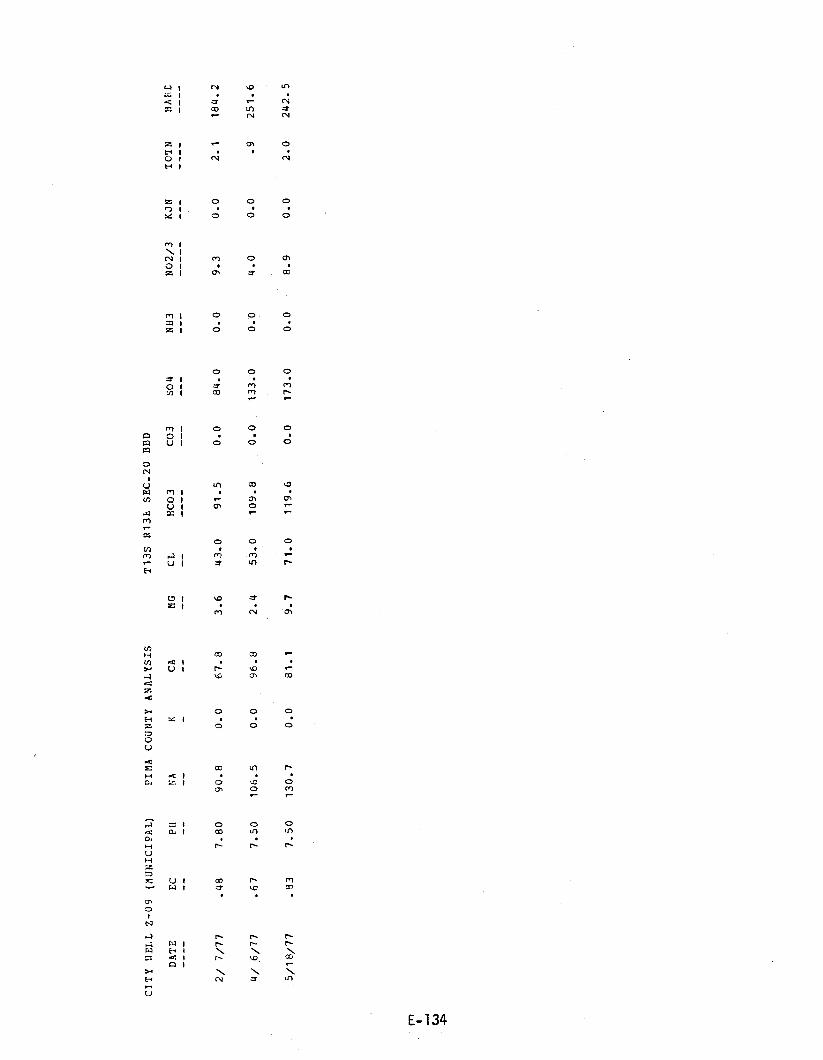
CITY :TELL Z -09 (MUNICIPAL)
PIMA COUNTY ANALYSIS
T13S 813E SEC.20 BBD
DATE
EC
PH
NA
KCA
MG
CL
HCO3
CO3
SO4
NH3
NO2/3
ICON
TCTN
HABT
2/ 7/77
.48
7.80
90.8
0.0
67.8
3.6
43.0
91.5
0.0
84.0
0.0
9.3
0.0
2.1
184.2
4/ 6/77
.67
7.50
106.5
0.0
96.8
2.4
53.0
109.8
0.0
133.0
0.0
4.0
0.0
.9
251.6
5/18/77
.93
7.50
130.7
0.0
81.1
9.7
71.0
119.6
0.0
173.0
0.0
8.9
0.0
2.0
242.5
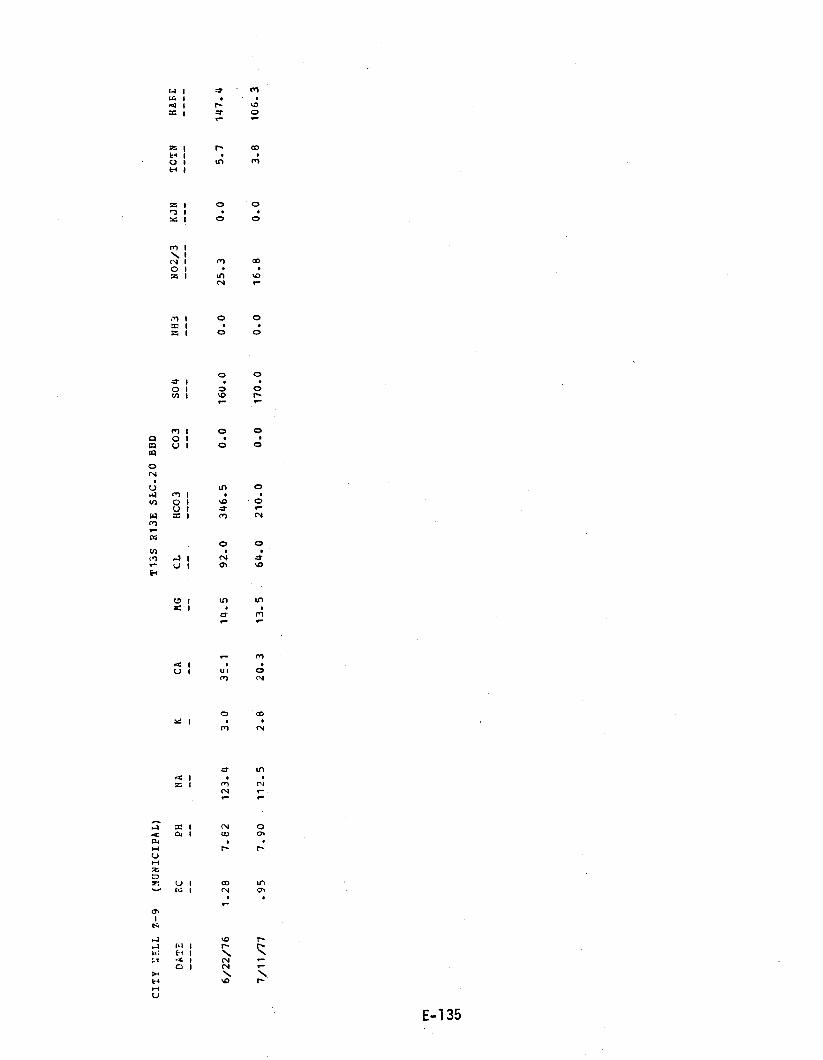
CITY :ELL
Z -9
(MUNICIPAL)
T135 R13E SLC.20 BBD
DATE
EC
PH
NA
KCA
MG
CL
HCO3
CO3
504
NH3
NO2/3
KJN
TCTN
HAFL
6/22/76
1.28
7.82
123.4
3.0
35.1
14.5
92.0
346.5
0.0
160.0
0.0
25.3
0.0
5.7
147.4
7/11/77
.95
7.90
112.5
2.8
20.3
13.5
.
64.0
210.0
0.0
170.0
0.0
16.8
0.0
3.8
106.3
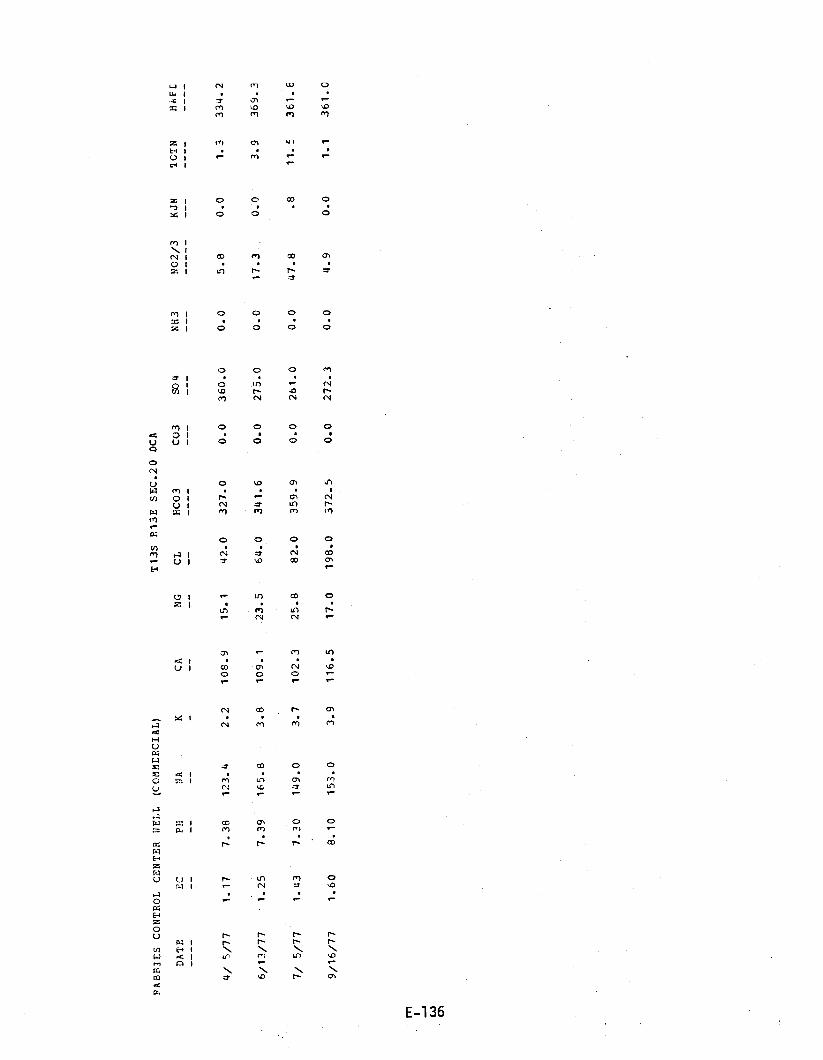
RARRIES CONTROL CENTER AELL
DATE
EC
PH
----
--
--
(COMMERCIAL)
NA
K--
-CA --
NG
--
T13S
CL--
R13E SEC.20 DCA
HCO3
CO3
----
---
SO4--
NH3
---
NO2/3
KJN
---
ICTN
----
HARE
----
4/ 5/77
1.17
7.38
123.4
2.2
108.9
15.1
42.0
327.0
0.0
360.0
0.0
5.8
0.0
1.3
334.2
6/13/77
1.25
7.39
165.8
3.8
109.1
23.5
64.0
341.6
0.0
275.0
0.0
17.3
.0.0
3.9
369.3
7/ 5/77
1.43
7.30
149.0
3.7
102.3
25.8
82.0
359.9
0.0
261.0
0.0
47.8
.8
11.5
361.E
9/16/77
1.60
8.10
153.0
3.9
116.5
17.0
198.0
372.5
0.0
272.3
0.0
4.9
0.0
1.1
361.0

CITY .'ELL Z-1
(MUNICIPAL)
113S R13£ SEC.21 BAA
DATE
EC
PH
NA
KCA
MG
CL
HCO3
CO3
SO4
NH3
NO2/3
KJN
TOTN
HARE
6/22/76
1.10
7.55
56.9
2.4
123.4
3.4
132.0
152.5
0.0
165.0
0.0
14.2
0.0
3.2
322.2
7/ 6/77
.78
7.70
54.5
2.1
134.0
8.0
81.0
131.0
0.0
120.0
0.0
12.4
0.0
2.8
367.6
8/ 1/77
1.10
7.70
61.0
2.6
131.3
9.9
120.0
146.4
0.0
70.0
0.0
15.1
0.0
3.4
368.7

ca ! aL4 1R I
1
z 1 In
H 1
O 1H I
M 1N. 1
N 1 0O 1Z 1 (.71r
M 1 o2» 1
o4 1
O 1 LnVi I fT1
N
s'Y I oQ O 1GO U 1 owrN
If)M .a I ?
U I InH 1-
rW 1 nH 1 \Q I oA 1
o

SAMPLE NO.13 FOR NITROGEN ISOTOPE STUDY (COMMERCIAL FULL)
113S R13E SEC-21 DCC
DATE
EC
PH
NA
KCA
MG
CL
HCO3
CO3
SO4
NH3
NO2/3
KJN
ICTN
HARE
- ---
--
--
--
---
--
--
-- --
- --
---
- --
- --
- - --
- - --
4/ 5/77
2.00
7.68
174.2
2.9
140.4
23.0
146.0
353.8
0.0
650.0
0.0
52.3
0.0
11.8
445.4
9/16/77
1.70
8.00
150.0
3.8
126.0
16.3
106 »5
300.0
0.0
186.4
0.0
43.0
0.0
9.7
381.8
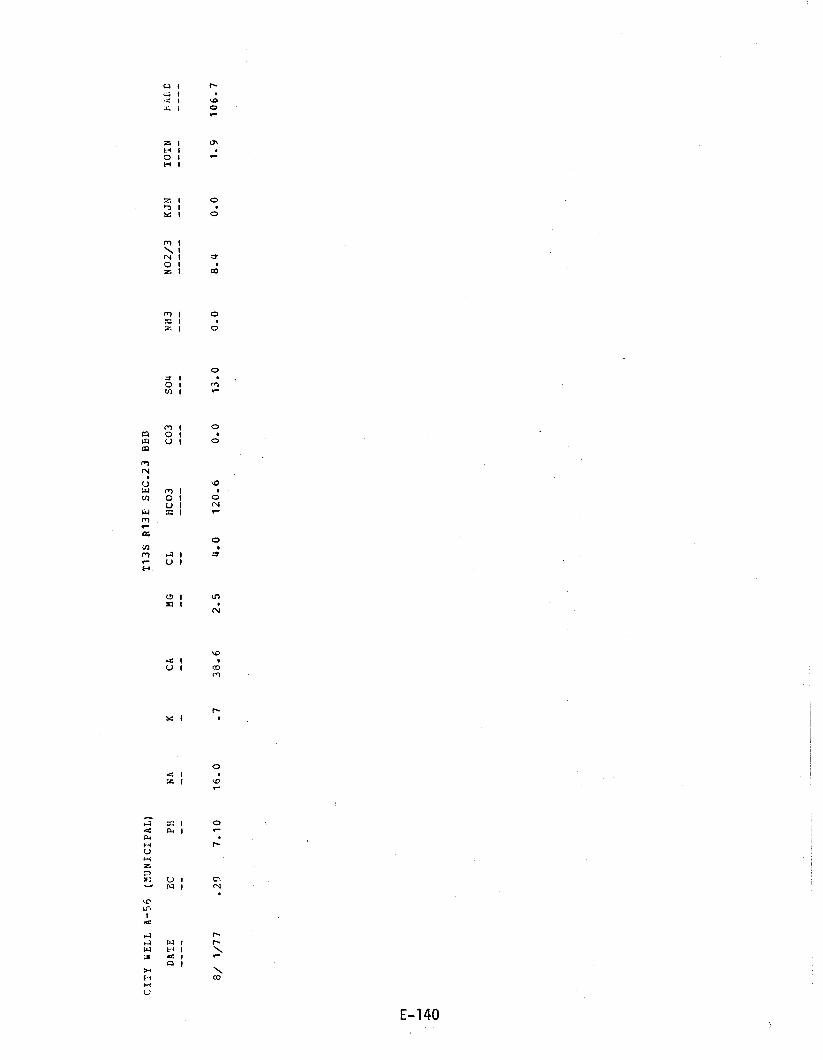
CITY WELL A-56 (MUNICIPAL)
T13S 813E SEC.23 BBB
DATE
EC
PH
NA
KCA
MG
CL
HCO3
CO3
SO4
NH3
NO2/3
KJN
TOTN
FbED
8/ 1/77
.29
7.10
16.0
.7
38.6
2.5
4.0
120.6
0.0
13.0
0.0
8.4
0.0
1.9
106.7
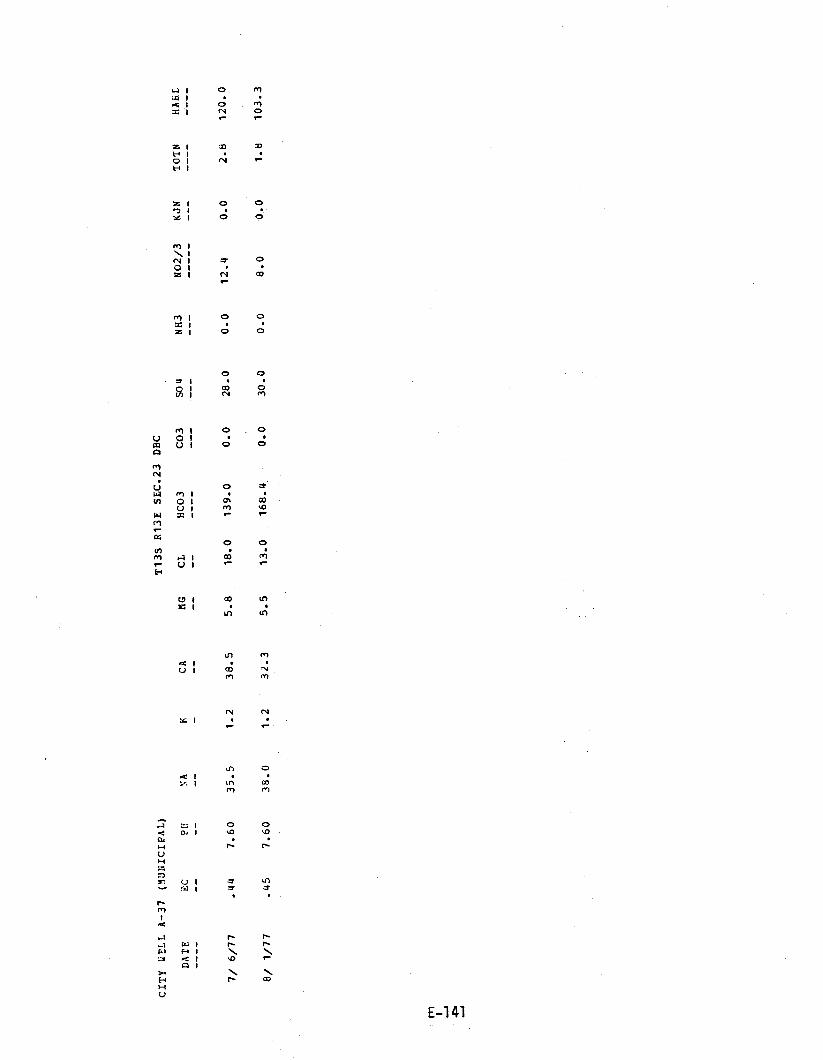
CITY GELL A -37 (MUNICIPAL)
T13S 813E SEC.23 DBC
DATE
EC
PH
NA
KCA
MG
CL
HCO3
CO3
SO4
NH3
NO2/3
KJN
TOTN
HARE
7/ 6/77
.44
7.60
35.5
1.2
38.5
5.8
18.0
139.0
0.0
28.0
0.0
12.4
0.0
2.8
120.0
8/ 1/77
.45
7.60
38.0
1.2
32.3
5.5
13.0
168.4
0.0
30.0
0.0
8.0
0.0
1.8
103.3

CITY NELL A -32 (MUNICIPAL)
T13S R13E SEC.26 CAA
DATE
EC
PH
NA
KCA
MG
CL
HCO3
CO3
SO4
NH3
NO2/3
KJN
ICTN
HAFt
7/ 6/77
.76
8.10
106.0
2.1
51.0
1.8
97.0
83.0
0.0
120.0
0.0
4.4
0.0
1.0
134.8

(DOMESTIC)
T13S R13E SEC.27CCB
DATE
EC
PH
NA
KCA
MG
CL
HCC3
CO3
SO4
NH3
NO2/3
KJN
TOTN
HARD
9/16/77
1.60
7.80
150.0
3.8
94.5
15.2
63.0
415.0
0.0
258.8
0.0
24.4
0.0
5.5
298.6
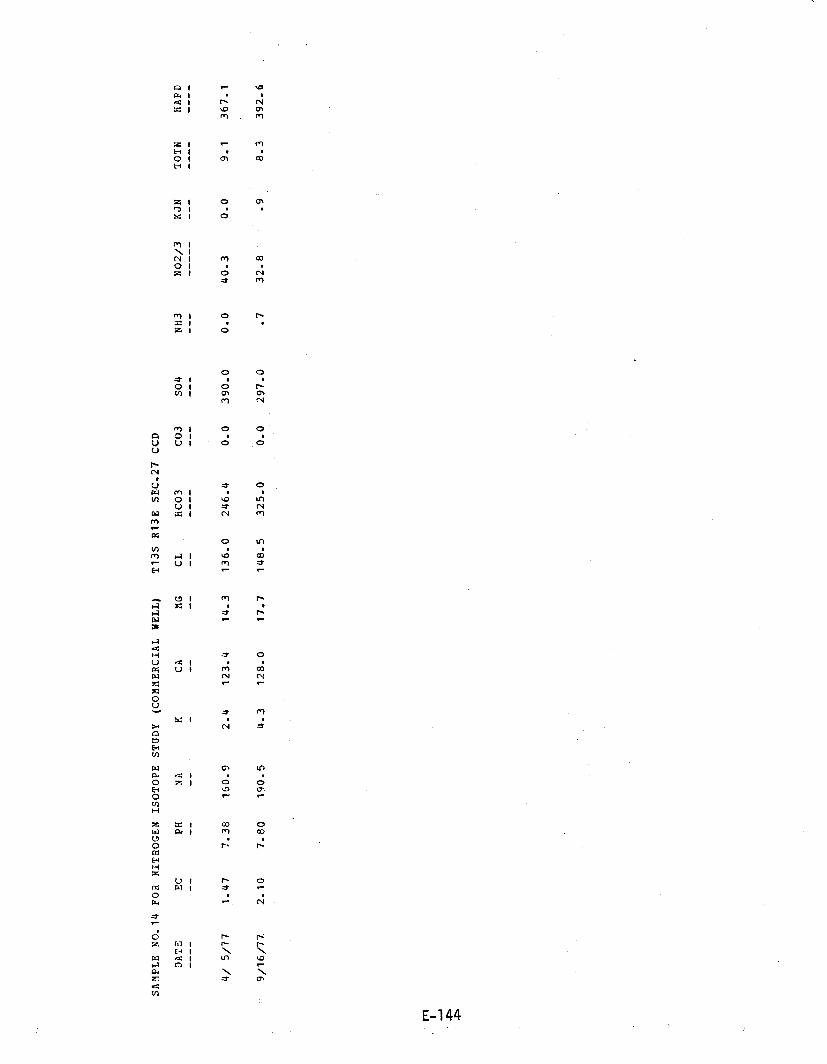
SAMPLE NO.14 FOR NITROGEN ISOTOPE STUDY (COMíMERCIAL WELL)
T13S R13E SEC.27 CCD
DATE
EC
PH
NA
KCA
DG
CL
HCO3
CO3
SO4
NH3
NO2/3
KJN
TOTN
HARD
4/ 5/77
1.47
7.38
160.9
2.4
123.4
14.3
136.0
246.4
0.0
390.0
0.0
40.3
0.0
9.1
367.1
9/16/77.
2.10
7.80
190.5
4.3
128.0
17.7
148.5
325.0
0.0
297.0
.7
32.8
.9
8.3
392.6
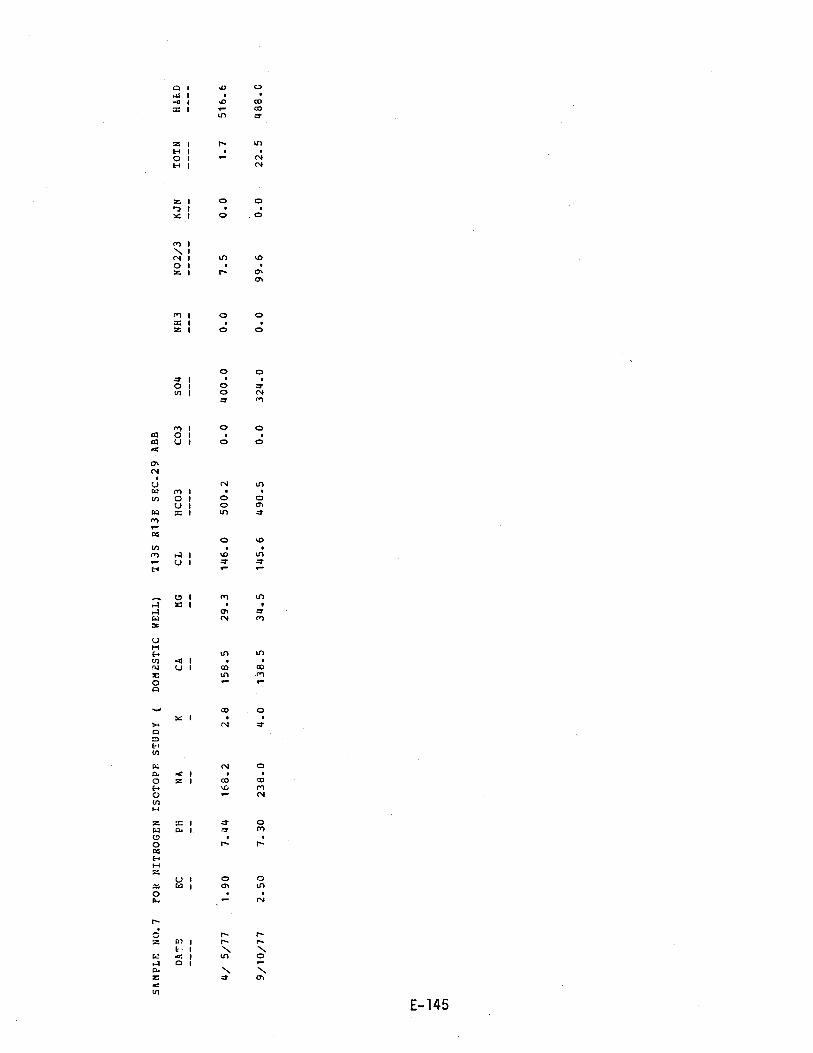
SAMPLE NO.7
FOR NITROGEN ISOTOPE STUDY
(DOMESTIC WELL)
T13S R13E SEC.29 ABB
DATE
EC
PH
NA
KCA
MG
CL
HCO3
CO3
SO4
NH3
NO2/3
KJN
TOTN
HAM)
4/ 5/77
1.90
7.44
168.2
2.8
158.5
29.3
146.0
500.2
0.0
400.0
0.0
7.5
0.0
1.7
516.6
9/10/77
2.50
7.30
238.0
4.0
138.5
34.5
145.6
490.5
0.0
324.0
0.0
99.6
0.0
22.5
488.0
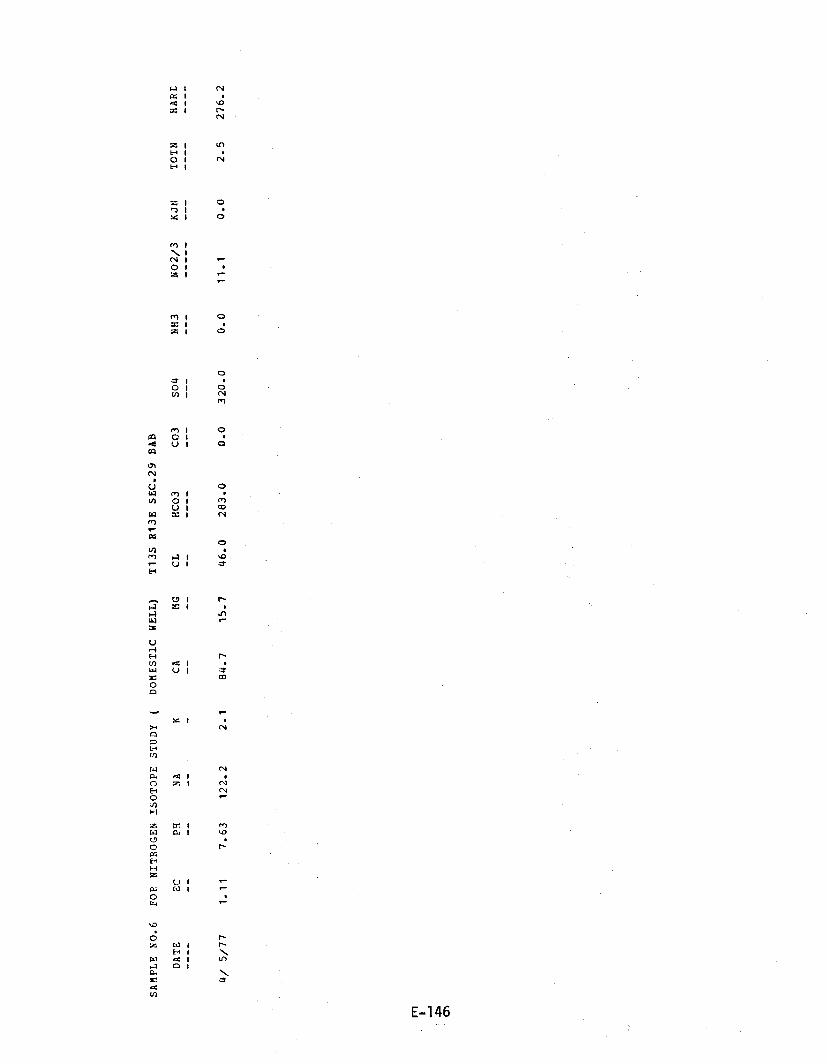
1..1 i NCG 1
tC i ID= 1 lN
z 11
O 1H I
z 1 o7aG I o
m
m 1 OO 1U 1 O
om 1O 1 mU 1 CO
x 1
oa 1
O 1 rz I
rm IU I
CO
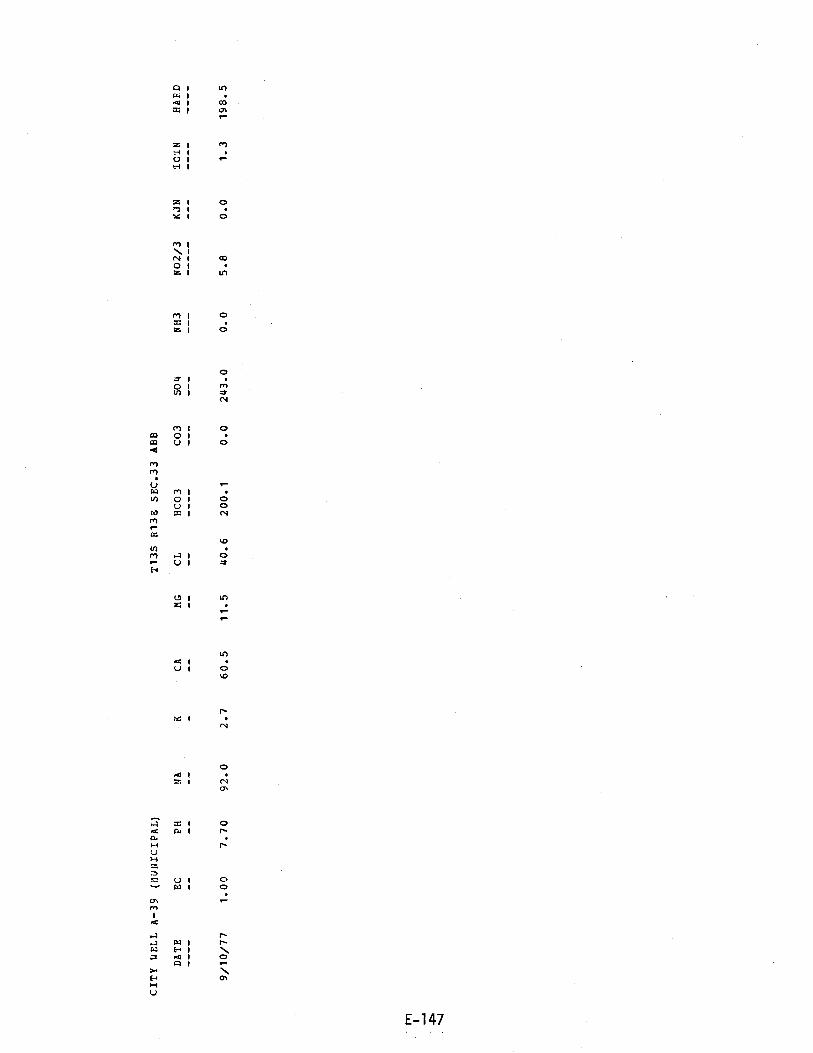
q 1 LnIz Ia I CO
Ie-
z 1 mH IU 1
tH 1
Z 1 O7 1?G 1
m 1N.N I CO
OZ 1 u1
1'1 1 OIz
Li)N_m a l óUIF
N
O04 IZ. I N
m
= 1 0P. 1
Ir

(DOMESTIC)
T13S R13E SEC.33ACC
DATE
EC
PH
VA
KCA
MG
CL
HCO3
CO3
SO4
NH3
NO2/3
KJN
TCTN
HAIìL
----
--
--
--
---
--
--
----
---
---
---
---
----
----
9/16/77
1.90
8.00
168.0
4.3
47.0
23.4
160.0
436.0
0.0
158.8
0.0
7.5
.3
2.0
213.8
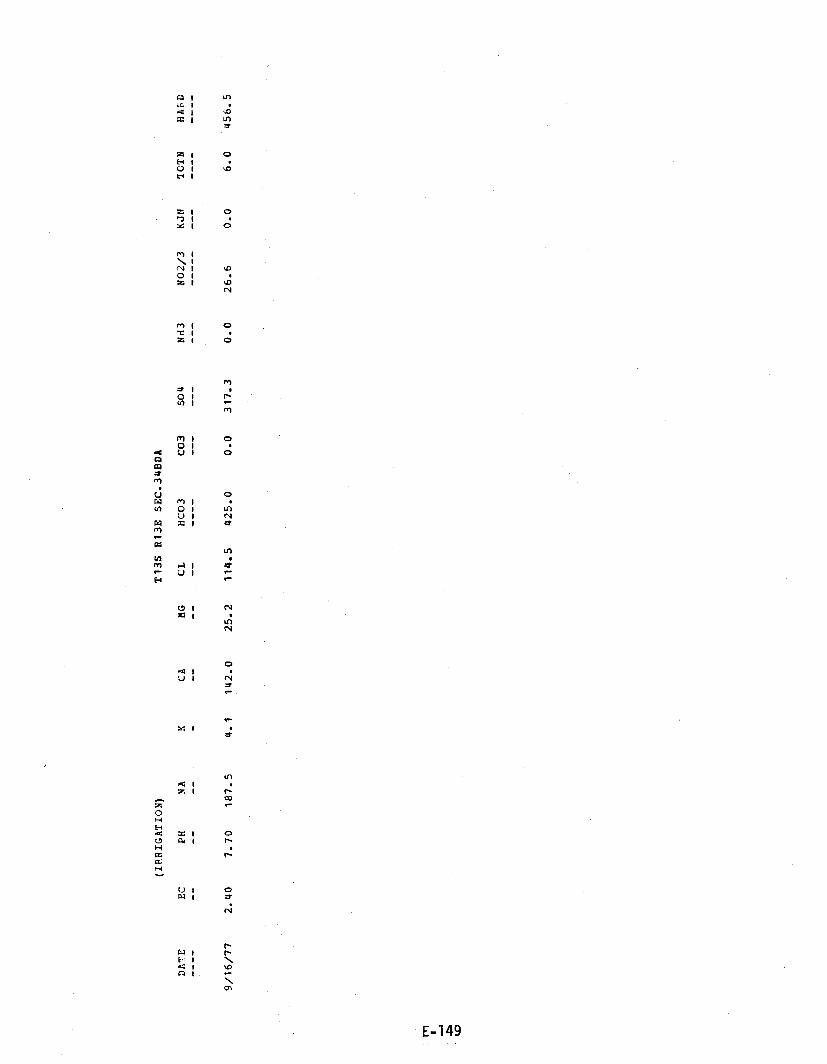
ca 1 ut._1a 1= 1
Lrlx
z 1 oH 1 r
O 1 DN 1
Z 11
Y 1

CITY WELL A -24 (MJNICIPAL)
T13S R13E SEC.34 CDC
DATE
EC
PH
NA
KCA
17G
CL
HCO3
CO3
SO4
NH3
NO2/3
KJN
IOTN
HARE
7/15/77
1.10
7.50
136.5
3.6
133.5
19.5
34.0
286.7
0.0
240.0
0.0
6.2
0.0
1.4
413.7
8/ 1/77
1.33
7.40
106.0
3.5
138.0
20.0
81.0
287.8
0.0
70.0
0.0
6.2
.2
1.6
427.0

CITY WELL A -24 (MUNICIPAL)
PIMA COUNTY ANALYSIS
T13S 813E SEC.34 CDC
DATE
EC
PH
NA
KCA
MG
CL
HCO3
CO3
SO4
NH3
NO2/3
KJN
TOTN
HARD
4/ 7/77
1.03
7.20
142.8
0.0
125.8
26.6
77.0
152.5
0.0
321.0
0.0
4.0
0.0
.9
423.8
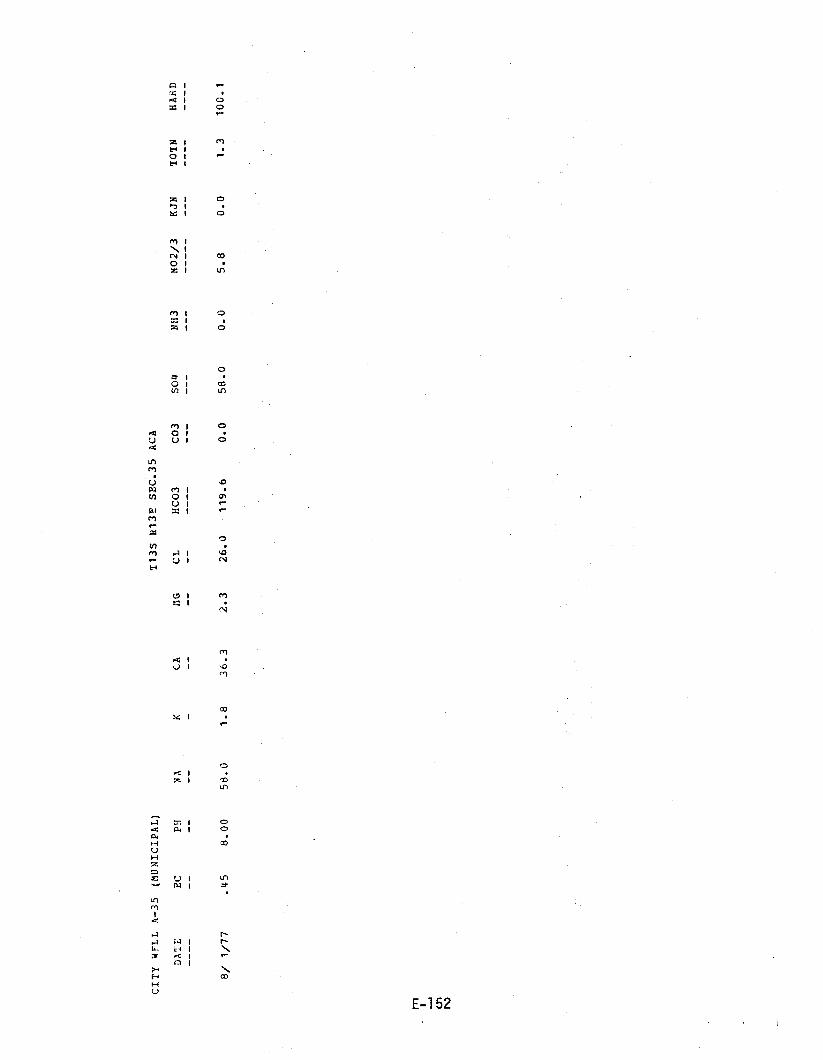
q Ix l
4I I ox I 0
M IN IO 1EI I
z I o] ISC I O
rn I
N. I
N 1 CO
O 1z 1 tn
Ih 1 OT. Iz I O
7 1omIn
M I Co lU I o
N
iI
coo
O
U 1
ra 1
rH I \
1-
ra I
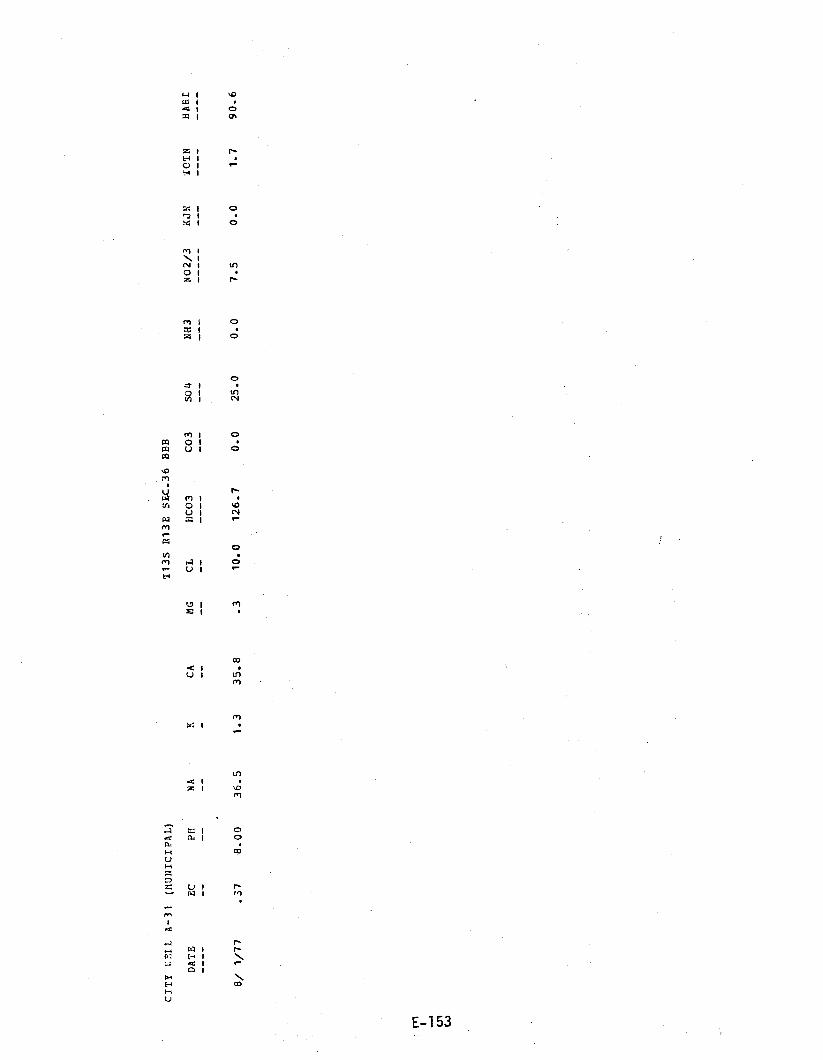
CITY
I: °LL A -31
(PIUNICIPAL)
T135 R13E SEC.36 EBB
DATE
EC
PH
NA
KCA
NG
CL
HCO3
CO3
SO4
NH3
NO2/3
NON
ICTN
HARL
8/ 1/77
.37
8.00
36.5
1.3
35.8
.3
10.0
126.7
0.0
25.0
0.0
7.5
0.0
1.7
90.6