
Evaluation of Fuel Tank Drop Tests and ASTM Tensile Tests ...
49
Evaluation of Fuel Tank Drop Tests and ASTM Tensile Tests conducted by Southwest Research Institute Final Report December 13, 2004 Submitted to: Dr. Kennerly H. Digges Mr. R. Rhoads Stephenson Motor Vehicle Fire Research Institute 1334 Pendleton Court Charlottesville, Virginia 22901 By: Dr. Nabih E. Bedewi 12834 Tournament Drive Reston, VA 20191
Transcript of Evaluation of Fuel Tank Drop Tests and ASTM Tensile Tests ...

Evaluation of Fuel Tank Drop Tests and ASTM Tensile Tests conducted by Southwest Research Institute
Final Report
December 13, 2004
Submitted to:
Dr. Kennerly H. Digges Mr. R. Rhoads Stephenson
Motor Vehicle Fire Research Institute 1334 Pendleton Court
Charlottesville, Virginia 22901
By:
Dr. Nabih E. Bedewi 12834 Tournament Drive
Reston, VA 20191
TABLE OF CONTENTS
1.0 Introduction and Research Objectives 1 2.0 Review of SwRI Tests 3
2.1 Types of Fuel Tanks Tested 3 2.2 Drop Tests 4 2.3 Material Coupon Testing 5
3.0 Nonlinear Finite Element Simulations 7
3.1 Initial Tank Analysis 7 3.2 Model Development 11
3.2.1 Shell Modeling of Grand Voyager Tank 11 3.2.2 Fluid Modeling 15 3.2.3 Fluid-Structure Interface 15 3.2.4 Model General Information 15 3.2.5 Simulation Setup 17
4.0 Simulation of Plymouth Grand Voyager Tank 18
4.1 Simulation Results and Comparison to SwRI Test 18 4.2 Summary of Simulation Results 23
5.0 Comparison of Generic Shape Tanks 24
5.1 Rectangular Tank Simulation Results and Comparison to SwRI Test 24 5.2 Rectangular Tank with a Neck 27 5.3 Small Rectangular Tank 29 5.4 Summary of Simulation Results 31
6.0 Simulation of Different Coupon Tests 33
6.1 SwRI Simple Tensile Test 33 6.2 Hydrostatic Pressure on a Curved Coupon 35 6.3 Combined Loading on a Curved Coupon 36 6.4 Summary of Simulation Results 38
7.0 Simulation of Voyager Tank with Gasoline Properties 39
7.1 Drop Test Simulation 39 7.2 Side Impact Simulation 39 7.3 Summary of Simulation Results 43
8.0 Conclusions and Proposed Future Research 44
8.1 Conclusions 44 8.2 Further Simulation Studies 45 8.3 Proposed Testing Program 45
9.0 References 47

Page 1 of 47
1.0 INTRODUCTION AND RESEARCH OBJECTIVES A series of fuel tank drop tests were conducted by Southwest Research Institute (SwRI) in 2003 in accordance with the US Department of Transportation 49 CFR 393.67, Section E, as well as a series of tensile tests in accordance with ASTM D 638-00 [1]. The tests included new and conditioned tanks for each of the Saturn Twin Cam four door sedan, Jeep Grand Cherokee SUV, and Plymouth Grand Voyager mini van. Results of the drop tests, based on the minimum acceptable flow rate of the leaking fluid after the test, indicated that the conditioned tanks from the Grand Cherokee and Plymouth Voyager failed under the subjected drop tests. Leaks were observed to occur due to pinch off separation. However, only one tank of each of the scenarios was tested therefore statistical significance was not verified. Tensile tests were then carried out to compare the pinch off strength of the new versus conditioned tanks. The results were not conclusive in that the failures of all the tensile specimens occurred due to the plastic elongation and not the pinch-off separation. The following questions still remain unanswered:
1. Is there an aging effect on the structural integrity of the plastic fuel tanks? 2. If so, do the geometry of the tank, type of plastic, and pinch off strength have
an influence on the structural integrity? 3. Are the tensile tests that were conducted by SwRI adequate to replicate the
loads seen in the drop tests to assess the strength of the pinch off? 4. What additional tests, if any, should be carried out to complete the evaluation
and make final conclusions? The objective of the research reported here is to utilize advanced nonlinear finite element modeling for simulating the tests performed by SwRI to understand the complex loading behavior and to analyze the parameters that influence the failure of the tanks. Results of this analysis are aimed at providing answers to the aforementioned questions. The research was carried out in four stages. The first stage encompassed the development and verification of the finite element model for the Plymouth Grand Voyager tank which is one of the tanks tested by SwRI. Given the complexity and difficulty of modeling the fluid-structure interaction, this task also involved researching the various ways that this problem could be modeled effectively and it included modeling different types of tanks for comparison. The results of the Plymouth tank were then compared to the limited test data available in the SwRI report. The second stage focused on analyzing tanks of various geometries to evaluate their effect on the pinch-off area loads. The tank geometries selected represent the three tanks tested by SwRI. The third stage of the research addressed the tensile tests by modeling various test configurations to

Page 2 of 47
attempt to find a simple test specimen that can load the pinch-off area to failure. The fourth and final stage dealt with the comparison of the behavior of the Plymouth tank using the physical properties of gasoline versus water to determine if the substitution with water in the drop tests is representative of gasoline filled tanks. Several sources were used to obtain information for this study on plastic and metal fuel tanks in particular the blow molding construction process and pinch-off design considerations and strength, plastic material properties including strain rate effects and failure properties, and advanced nonlinear finite element analysis. The most relevant sources are listed in the Reference section 9.0.

Page 3 of 47
2.0 REVIEW OF SWRI TESTS 2.1 TYPES OF FUEL TANKS TESTED Figure 1 shows the Jeep Grand Cherokee tank which is of the rectangular shape. This is typical of some SUV tanks mounted behind the rear axle. The Saturn tank tested is also rectangular but smaller and with thinner profile.
Figure 1 – Jeep Grand Cherokee plastic fuel tank Figure 2 shows the Plymouth Grand Voyager tank which is long and rectangular with a neck. This is typical of tanks with a narrow shape mounted inside the frame rail and in front of the rear axle or rear suspension
Figure 2 – Plymouth Grand Voyager plastic fuel tank
Page 4 of 47
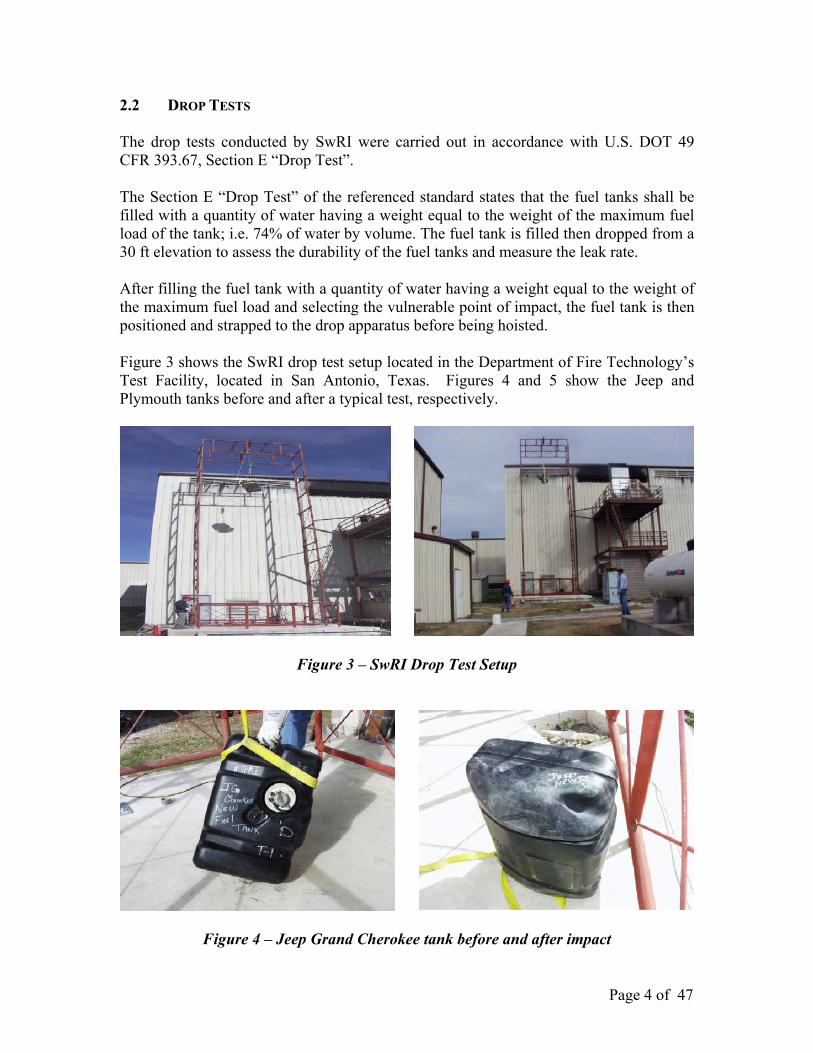
2.2 DROP TESTS The drop tests conducted by SwRI were carried out in accordance with U.S. DOT 49 CFR 393.67, Section E “Drop Test”. The Section E “Drop Test” of the referenced standard states that the fuel tanks shall be filled with a quantity of water having a weight equal to the weight of the maximum fuel load of the tank; i.e. 74% of water by volume. The fuel tank is filled then dropped from a 30 ft elevation to assess the durability of the fuel tanks and measure the leak rate. After filling the fuel tank with a quantity of water having a weight equal to the weight of the maximum fuel load and selecting the vulnerable point of impact, the fuel tank is then positioned and strapped to the drop apparatus before being hoisted. Figure 3 shows the SwRI drop test setup located in the Department of Fire Technology’s Test Facility, located in San Antonio, Texas. Figures 4 and 5 show the Jeep and Plymouth tanks before and after a typical test, respectively.
Figure 3 – SwRI Drop Test Setup
Figure 4 – Jeep Grand Cherokee tank before and after impact

Page 5 of 47
Figure 5 – Plymouth Grand Voyager tank before and after impact 2.3 MATERIAL COUPON TESTING The tensile tests were conducted at SwRI in accordance with ASTM D 638-00, “Standard Test Method for Tensile Properties of Plastics”. Material coupons were extracted from the plastic tanks of the Plymouth Grand Voyager (top of figures) and Jeep Grand Cherokee (bottom of figures) as shown in Figure 6. Note the smaller thickness of the Jeep specimen profile and the white inner layer of plastic.
Figure 6 – Material coupons extracted for the tensile testing As these coupons were extracted from the fuel tanks, the pinch-off location in each was perpendicular to the long-axis of the specimen parent material. The overall length of the specimen coupons depended on the location of extraction and ranged from 6 in. to 9 in. in length. The thickness of the specimen coupons varied as well, ranging from 0.2 in. to 0.5 in. For all specimen coupons, the thickest region was at the pinch-off location. Figure 7 shows a typical tensile test, and Figure 8 shows the output data from the test.

Page 6 of 47
Figure 7 – Typical tensile test conducted at SwRI
Figure 8 – Output data from tensile test

Page 7 of 47
3.0 NONLINEAR FINITE ELEMENT SIMULATIONS The Finite Element program used in the analysis is LS-DYNA [2,3]. This program is developed by Livermore Software Technology Corporation (LSTC) [4]. The following summary of code features is extracted directly from the manuals. LS-DYNA uses an explicit Lagrangian numerical method to solve nonlinear, three dimensional, dynamic, large displacement problems. The time integration in the code is based on the central difference method. In recent versions of the code, implicit, arbitrary Lagrangian-Eulerian, Smoothed Particle Hydrodynamics, and 2D analyses capabilities have been added to the code. The code's initial focus was in military related studies. Over the past 15 years, LS-DYNA has gained new grounds in automotive analysis such as crashworthiness, metal forming, and occupant safety. The most advantageous capability of LS-DYNA over other finite element codes is its advanced contact algorithm. Over twenty contact interfaces are available in the code. Some of these contacts include: Nodes to Surface, Surface To Surface, Single Surface, Automatic General, etc. These allow for solving a diverse type of impact problems. LS-DYNA has numerous features that allow for the analysis of several nonlinear dynamic engineering problems. It has a large selection of finite element types which include: i- one node lumped mass, ii- two node discrete elements such as spring, damper and beam elements, iii- three and four node shell elements, and iv- eight node solid and thick shell elements, and v- smoothed particle hydrodynamics elements. For each of these element types, a number of element formulations are implemented in the code. As an example, more than 16 different shell formulations are available. These include reduced, fully, and membrane formulations. The code has a library of over eighty constitutive material models. The majority of these models can be used with all element formulations mentioned above. These models cover a wide range of material behaviors including elasticity, plasticity, thermal effects, and rate dependency. These constitutive models have been successfully used to model several materials including metals, plastics, rubber, soil, concrete, ceramics, composites, foams, and fluids. LS-DYNA has over 20 options for modeling connections with failure capabilities. Some of these include welds, rivets, joints, etc. It also has over 50 different methods for modeling initial conditions, boundary conditions, and loadings, including initial velocity, initial stress, nodal forces, pressure, prescribed accelerations, fixed nodes, etc. The code has no inherent limits on the size of the models that can be created and run. The storage is dynamic within the code, and it is fully vectorized. LS-DYNA is available on almost all computer platforms including SGI, IBM, HP, PCs, etc. and has two parallel versions for the SMP and MPP architectures. 3.1 INITIAL TANK ANALYSIS Several finite element models were initially analyzed for different geometry tanks of both plastic and steel composition to understand the behavior and assess the importance of the
Page 8 of 47
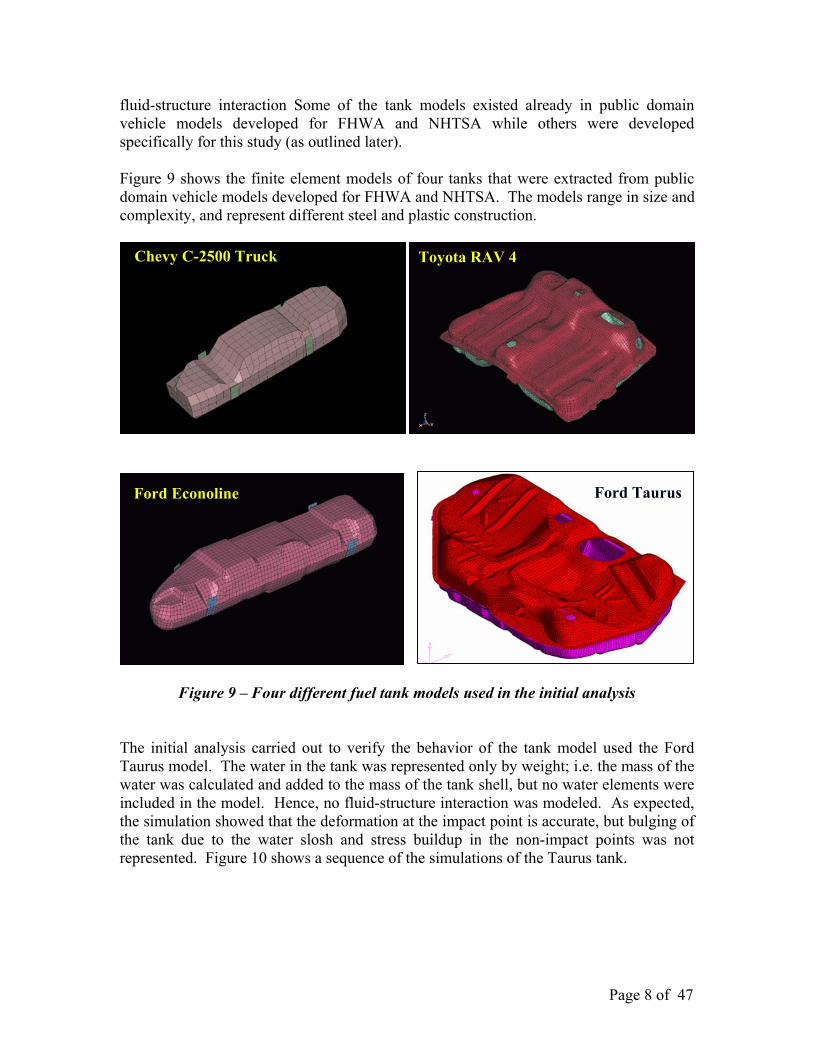
fluid-structure interaction Some of the tank models existed already in public domain vehicle models developed for FHWA and NHTSA while others were developed specifically for this study (as outlined later). Figure 9 shows the finite element models of four tanks that were extracted from public domain vehicle models developed for FHWA and NHTSA. The models range in size and complexity, and represent different steel and plastic construction.
Figure 9 – Four different fuel tank models used in the initial analysis The initial analysis carried out to verify the behavior of the tank model used the Ford Taurus model. The water in the tank was represented only by weight; i.e. the mass of the water was calculated and added to the mass of the tank shell, but no water elements were included in the model. Hence, no fluid-structure interaction was modeled. As expected, the simulation showed that the deformation at the impact point is accurate, but bulging of the tank due to the water slosh and stress buildup in the non-impact points was not represented. Figure 10 shows a sequence of the simulations of the Taurus tank.
Chevy C-2500 Truck Toyota RAV 4
Ford Econoline Ford Taurus

Page 9 of 47
Figure 10 – Sequence of simulation of the Ford Taurus tank with no water effects The results of the analysis clearly indicated that the fluid-structure interaction is key to the proper representation of the physics of the problem and that a more sophisticated approach should be utilized to model the tank. One of the more recent advances in LS-DYNA is the addition of the smoothed particle hydrodynamics (SPH) algorithm which allows the efficient and accurate modeling of fluid-structure problems. SPH is a Lagrangian technique developed initially to simulate astrophysical problems having the potential to be efficient and accurate at modeling material deformation as well as flexible in terms of the inclusion of specific material models. In addition, SPH is a

Page 10 of 47
meshless or gridless technique such that it does not suffer from the normal problems of grid tangling in large deformation problems. Presently many large deformation problems are calculated using Eulerian techniques that do not suffer from grid tangling but have some limitations in terms of modeling material interfaces, the inclusion of specific material models, and associated high computational expense. The main potential advantages of the SPH technique are in not requiring a numerical grid, hence no grid tangling. SPH is Lagrangian in nature thus allowing efficient tracking of material deformations and history dependent behavior. Compared with Euler, it is more efficient in that one only need to model regions where materials exist, not all regions where material might exist as a void. Being meshless, phenomenon such as fracture and fragmentation may be modeled. Fracture can occur arbitrarily without the a priori structures of a numerical mesh. With all of its promise, however, SPH technology is relatively immature compared with standard grid based Lagrangian and Eulerian techniques. Several problems need to be solved before the technique becomes a fully developed computational continuum dynamics technique. There are remaining known problems in the areas of stability, consistency, and conservation. The SPH particles describe the Lagrangian motion of mass points that are really interpolation points. Particles are approximated by cubic B-spline functions. Figure 11 shows a close up of the Taurus tank with the SPH particles. Figure 12 shows a sequence of the simulations with the SPH feature. The images clearly show the fluid slosh inside the tank and the bulging of the tank.
Figure 11 – Ford Taurus tank with SPH particles

Page 11 of 47
Figure 12 – Sequence of simulation of the Ford Taurus tank with the SPH feature 3.2 MODEL DEVELOPMENT The finite element model of the gas tank consists of two main components: the tank shell and the fluid (water) inside the tank. The tank shell is modeled using shell elements and the fluid is represented using Smoothed Particle Hydrodynamics (SPH) elements. 3.2.1 SHELL MODELING OF GRAND VOYAGER TANK The tank shell is subdivided into three components to represent the top, bottom, and pinch-off regions. The geometry of the tank is extracted from an actual Grand Voyager

Page 12 of 47
(Dodge Caravan) tank as shown in Figure 13. The three dimensional geometric data of the tank is obtained by using a passive six degree of freedom digitizing arm connected to a desktop computer. The surface patches generated from the digitized data were stored in IGES format. These IGES files were then imported into a pre-processor (HyperMesh) for mesh generation. A fine mesh (10 mm average size) was used for the tank to ensure accurate geometric representation.
Figure 13 – Geometry digitizing of Grand Voyager tank Upon completing the mesh, appropriate cross-sectional and material properties were assigned to the tank components. For the cross-sectional properties, a uniform thickness, of 10 mm was assumed for the top and bottom components. The thickness in the pinch-off region is not uniform and a special technique was used to represent it. Since the pinch-off region played an important role in the behavior of the fuel tank, extra attention was given to model this area. Figure 14 shows the cross-section at the pinch-off region. This section is represented in the model using beam elements. The dimension and locations of the beam elements are chosen such that they would represent the pinch-off section in terms of stiffness and amount of plastic material (11.684 mm and 13.208 mm radii). A total of five sets of beam parts are used in the model to represent the pinch of cross-sectional area (Figures 15 and 16). Three beam parts are parallel to the pinch-off region and form three loops around the tank. One of these beam parts is located at the center of the pinch-off region and has the largest diameter. The other two lie above and below the first part and have a smaller diameter. This setup captures the variation in thickness at the pinch-off region. Two additional beam parts are perpendicular to the pinch-off section and are tying the first three beam parts together. In addition to representing the pinch-off cross-section, the beam parts allow for monitoring the forces at the pinch-off. The parallel beams give the forces along the axial direction of the pinch-off section and the perpendicular beams give the forces normal to it.

Page 13 of 47
Figure 14 - Pinch-off Cross-section
Figure 15 – Detailed pinch-off region

Page 14 of 47
(a) Three rows of beam elements (b) Two rows of beam elements parallel to pinch-off joint perpendicular to pinch-off joint
Figure 16 – Direction of beam element measurements in pinch-off region The constitutive model used for the plastic is the “Mat_Piecewise_Linear_Plasticity” in LS-DYNA. This was assigned to both the shell and beam elements defining the tank. Initial simulation results using the material data extracted from the coupon tests performed by SwRI showed significantly more deformation compared with the drop test results. After a literature survey on High Density Poly-Ethylene fuel tank material properties a more accurate material data set was used which gave closer results to the drop tests [5]. The properties used in the model are listed below.
• Piecewise Linear Plasticity Constitutive Model • Density: 0.95 x 10⁻⁹ tons/mm3 • Elastic Modulus: 1,200 MPa • Poisson’s Ratio: 0.3 • Yield Stress: 30 MPa • Tangent Modulus: 12 MPa • Cowper and Symonds strain rate effects with C = 90 and P = 4.5
Force measurement
direction
Force measurement
direction

Page 15 of 47
3.2.2 FLUID MODELING The fluid inside the tank is simulated using SPH elements attached to nodes inside the tanks. The nodes for the SPH elements have to be uniformly spaced in the three dimensional space. Because this approach is relatively new, no software exists to automatically generate the mesh. The mesh in this model is generated manually. A box that includes the entire fuel tank was created and meshed with solid elements. The nodes from these solid elements are used to generate the fluid mesh. All nodes outside the tank were deleted and only the nodes inside the tank were assigned SPH elements. Furthermore, a portion of this mesh was deleted such that only 74% of the tank was filled with fluid. To simulate the fluid behavior, the SPH elements were assigned the “Elastic_Fluid” material model in LS-DYNA. The properties needed from this material model are the bulk modulus and mass density. The properties used in the model are listed below.
• Elastic Fluid Constitutive Model (using SPH) • Density: 0.996 x 10⁻⁹ Tons/mm3 • Poisson’s Ratio: 0.5 • Bulk Modulus: 2,250 MPa
3.2.3 FLUID-STRUCTURE INTERFACE To represent the interface between the fluid and the tank, a “Nodes_To_Surface” contact interface is used. In this contact, a group of nodes are defined as the slave side and master segments (shell elements) are defined for the master side. The nodes are checked against the segments and if penetration is detected, equal and opposite forces are applied to the slave and master sides to overcome these penetrations. In the model, all fluid nodes are used as the slave side and the shell elements from the tank are used as the master side. This contact works best if the master side forms a closed surface. To achieve this, null elements (elements with null material properties) are used to cover the gap between the top and bottom fuel tank parts at the pinch-off region. These elements are attached to the nodes of the beams representing the pinch-off section. The null elements do not contribute to the stiffness of the tank and are used only for contact purposes. The top and bottom parts of the tank along with the null elements form a closed surface and are used as the master side of the contact. 3.2.4 MODEL GENERAL INFORMATION The total weight of the model is 73 kg of which 56 kg is the weight of the water. The model consists of 11 parts, 16,572 nodes, 16,876 shell elements, 1,717 beam elements, and 124,198 SPH elements (Figure 17). The initial time step for the model is 2.0 x 10⁻⁶ sec. Typically the runs were performed for 0.1 sec of simulation time and required about 26 hours on two processors of an SGI Origin 3800 parallel machine, or 15 hrs on four

Page 16 of 47
processors. The majority of the computation time (80% of CPU time) was used for processing the SPH elements. This is summarized in the table below.
Number of Parts 11
Number of Shell Elements 16,876
Number of Beam Elements 1,717
Number of Nodes 16,572
Number of SPH Particles 124,198
Final Simulation Time 0.1 sec.
Number of Processors 4
Computation Time 15 hrs
Figure 17 – Grand Voyager Fuel Tank Model

Page 17 of 47
3.2.5 SIMULATION SETUP All simulations were setup in a similar manner to the drop tests performed at Southwest Research Institute (SwRI) [1]. First the model was rotated and positioned to match the test. Only the impact duration was simulated. The tank was positioned right above ground and given an initial velocity that reflects a free fall form 30ft (9.144m) height. The initial velocity applied to the model was 13.4 m/s. Gravity loading of 9.8 m/s2 was imposed on all components of the model. This was imposed throughout the duration of the simulation. The ground in the model was assumed rigid and was represented with the “rigid wall” option in LS-DYNA. This ground was set as the master and all nodes of the tank set as the slave. With this setup the nodes are prevented from penetrating the ground. Each simulation was performed in two stages. The first stage consists of a dynamic relaxation analysis to bring the fluid to equilibrium prior to impact. During this phase, all nodes of the tank shell were fixed and gravity loading is applied to the fluid. The initial velocities, during this stage, are set to zero. The simulation is then performed for a period of 1 second. By the end of the simulation, the system is at equilibrium. In addition to bringing the system to equilibrium, this stage also fills all the gaps between the SPH nodes and the tank surface which are inherent in the fluid mesh generation. For the second stage, the final state from the dynamic relaxation stage is used as the initial state for the transient (impact) simulation. During this stage, the tank nodes are freed and the initial velocities and gravity loadings are applied to the whole tank. The simulation is then performed for 0.1 second, which in all cases, was sufficient to capture the full impact duration. Several initial simulations were conducted to improve and optimize the robustness, efficiency and accuracy of the model. Some of the parameters that were investigated included: particle density, smoothing length, viscosity coefficient, and material parameters Several output parameters are generated from the simulations at different time intervals. Some of the key outputs include: the kinetic and internal energies for all model components; the accelerations, velocities, and displacements of each node in the model; the stresses, strains, and strain rates of all elements; and the forces on all the beams. This data is examined to study and compare the performance of the different fuel tank geometries and impact scenarios as described in later sections.

Page 18 of 47
4.0 SIMULATION OF PLYMOUTH GRAND VOYAGER TANK 4.1 SIMULATION RESULTS AND COMPARISON TO SWRI TEST The Plymouth Grand Voyager tank drop test was simulated as described in the previous section. Figure 18 shows the sequence of the simulation of the Voyager tank.
(a) Front View (b) Side View (c) Surface Pressure
Figure 18 – Sequence of simulation of the Voyager drop test

Page 19 of 47
Figure 19 shows the impact reaction force on the ground at the point of impact, and Figure 20 shows the internal wall pressure in the tank at a selected element.
Figure 19 - Impact reaction force on the ground
Figure 20 - internal wall pressure in the tank Of particular interest in the analysis is the area where the maximum stresses occur and the maximum force measured in that area. This is obtained from the beam element measurements located in the pinch-off regions in both the parallel and perpendicular directions. This is shown clearly in the next series of figures.

Page 20 of 47
Figure 21 – Force in neck area measured with Beam Element Set I
Figure 22 – Force in neck area measured with Beam Element Set II
Region with maximum force

Page 21 of 47
Figure 23 – Force in neck area measured with Beam Element Set III
Figure 24 – Force in neck area measured with Beam Element Set IV

Page 22 of 47
Figure 25 – Force in neck area measured with Beam Element Set V Figure 26 shows the forces measured by all five beam sets. The results indicate that the maximum force occurring in the tank neck pinch-off area is 3,500 N (780 LB) and is in the perpendicular direction. It should be noted that all the maximum forces measured by the beam elements occurred in the neck area, which correlates with the SwRI drop test results, as shown in Figure 27.
Figure 26 – Maximum axial forces in different beam elements at the pinch-off region
Peak force in perpendicular direction approx. 3,500 N (780 LB)

Page 23 of 47
Figure 27 – Failure in the neck area observed in the SwRI Voyager drop test 4.2 SUMMARY OF SIMULATION RESULTS The following is a summary of the Plymouth Grand Voyager drop test simulation: 1. The FE analysis predicted the maximum loads at the same location where the pinch-
off region ruptured in the test. 2. As expected, the maximum force occurred in the tank neck area since the cross
section of the tank is narrower leading to increased water pressure and larger buckling loads.
3. The maximum force predicted is perpendicular to the pinch off joint and is
approximately 780 LB (this is 40% higher than the force that failed the specimens in the tensile tests performed by SwRI).
4. The peak force occurred at about 0.02 sec hence the strain rate effect is important
(SwRI tensile test peaked in 1.2 min).
Page 24 of 47
5.0 COMPARISON OF GENERIC SHAPE TANKS The purpose of this set of simulations is to investigate the effect of tank geometry on the forces generated at the joint. The following three tanks were modeled:
1. Rectangular tank of similar size as the Voyager tank without neck (this represents the class of tanks such as the Jeep Grand Cherokee). The weight of this model is 75 kg of which 56 kg is the weight of the water.
2. Same size as above tank but with a neck section (this represents the class of tanks such as the Plymouth Grand Voyager). The weight of this model is 75 kg of which 56 kg is the weight of the water.
3. Rectangular tank with smaller dimensions than first tank (this represents the class of tanks such as the Saturn). The weight of this model is 48 kg of which 33 kg is the weight of the water.
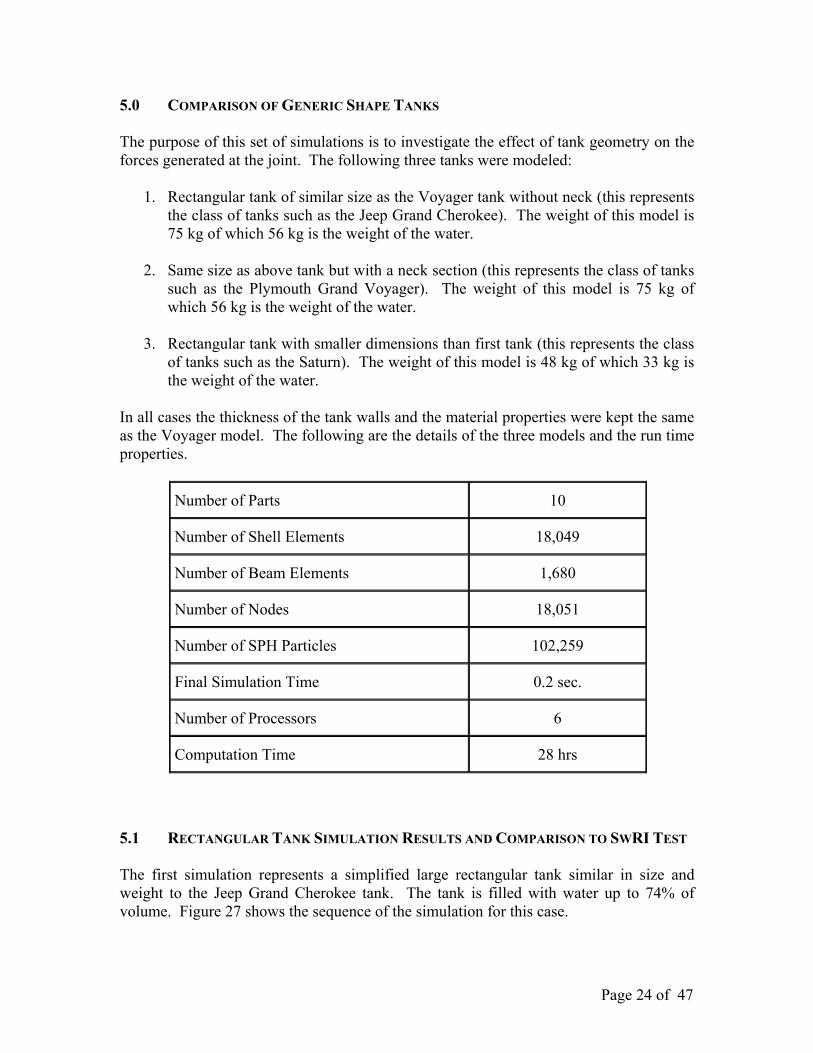
In all cases the thickness of the tank walls and the material properties were kept the same as the Voyager model. The following are the details of the three models and the run time properties.
Number of Parts 10
Number of Shell Elements 18,049
Number of Beam Elements 1,680
Number of Nodes 18,051
Number of SPH Particles 102,259
Final Simulation Time 0.2 sec.
Number of Processors 6
Computation Time 28 hrs
5.1 RECTANGULAR TANK SIMULATION RESULTS AND COMPARISON TO SWRI TEST The first simulation represents a simplified large rectangular tank similar in size and weight to the Jeep Grand Cherokee tank. The tank is filled with water up to 74% of volume. Figure 27 shows the sequence of the simulation for this case.

Page 25 of 47
Figure 27 – Sequence of simulation of the large rectangular tank drop test The maximum tensile forces in the parallel and perpendicular directions are measured by the five sets of beam elements along the pinch-off edge as described earlier. Images of

Page 26 of 47
the maximum states for the five beam sets are represented in Figure 28. The red area indicates the maximum tensile force for the respective state. Comparing these images to the photos of the tested Cherokee tank in Figure 4 it can be seen that the simulation predicted the maximum loads in the region of failure. Plots of the data for this case and the next two cases are shown in section 5.4.
(a) Beam set I (b) Beam set II
(c) Beam set III (d) Beam set IV
(e) Beam set V Figure 28 – Maximum forces measured by the beam sets for the large rectangular tank

Page 27 of 47
5.2 RECTANGULAR TANK WITH A NECK The second simulation represents a simplified large rectangular tank with a neck similar in size and weight to the Plymouth Grand Voyager tank. The tank is filled with water up to 74% of volume. Figure 29 shows the sequence of the simulation for this case.
Figure 29 – Sequence of simulation of the large rectangular tank with neck drop test

Page 28 of 47
The maximum tensile forces in the parallel and perpendicular directions are measured by the five sets of beam elements along the pinch-off edge as described earlier. Images of the maximum states for the five beam sets are represented in Figure 30. The red area indicates the maximum tensile force for the respective state. Plots of the data for this case are shown in section 5.4.
(a) Beam set I (b) Beam set II
(c) Beam set III (d) Beam set IV
(e) Beam set V
Figure 30 – Maximum forces measured by the beam sets for the large tank with neck

Page 29 of 47
5.3 SMALL RECTANGULAR TANK The third simulation represents a simplified small rectangular tank similar in size and weight to the Saturn tank tested by SwRI. The tank is filled with water up to 74% of volume. Figure 31 shows the sequence of the simulation for this case.
Figure 31 – Sequence of simulation of the small rectangular tank drop test

Page 30 of 47
The maximum tensile forces in the parallel and perpendicular directions are measured by the five sets of beam elements along the pinch-off edge as described earlier. Images of the maximum states for the five beam sets are represented in Figure 32. The red area indicates the maximum tensile force for the respective state. Plots of the data for this case are shown in section 5.4.
(a) Beam set I (b) Beam set II
(c) Beam set III (d) Beam set IV
(e) Beam set V Figure 32 – Maximum forces measured by the beam sets for the small rectangular tank

Page 31 of 47
5.4 SUMMARY OF SIMULATION RESULTS The maximum forces predicted with the simulation for the three cases are plotted in Figure 33. The maximum force for the Voyager (red line) occurred in the neck section, while the maximum forces for the Cherokee (green line) and Saturn (blue line) occurred at the bottom of the tank near the impact point.
Figure 33 – Maximum force comparisons for the three generic tank cases
The following is a summary of the generic shape tank simulations:
1. The FE analysis predicted the maximum loads near the same location where the pinch-off region ruptured in both the rectangular tank (Cherokee) and tank with neck (Voyager) tests.
2. The addition of a neck section in a rectangular tank, keeping everything else similar, increases the forces in the pinch-off region by 50%.
3. Reducing the rectangular tank overall dimensions and mass by 30%, keeping everything else similar, reduces the forces in the pinch-off region by 10%.
4. Based on the estimates in Figure 34, the Cherokee pinch-off contact area is 30%
of the Voyager pinch-off contact area, therefore for the same amount of force:
a) the stress in the Cherokee joint would be three times higher b) the strength of the Cherokee joint would be a third of the Voyager’s
Tank with
Baselin
Smaller
Tank with neck (Grand Voyager type) Baseline rectangular tank (Jeep Cherokee type) Small rectangular tank (Saturn type)

Page 32 of 47
5. Since the SwRI tested tanks were not made available during this research, similar
conclusions could not be made about the Saturn tank. However, if the contact patch area is somewhere in between the Cherokee and Voyager’s, then from the results of the generic tank simulations, the stress in the Saturn joint would be 20% lower than the Cherokee’s.
Figure 34 – Estimated pinch-off region patch for the Voyager and Cherokee tanks
Voyager pinch-off contact patch
Cherokee pinch-off contact patch

Page 33 of 47
6.0 SIMULATION OF DIFFERENT COUPON TESTS The next series of simulations show results of three cases for different coupon tests that were developed to try and test the failure strength of the pinch-off area. 6.1 SWRI SIMPLE TENSILE TEST In the first case, the tensile test performed by SwRI was modeled and simulated using LS-DYNA. The model of the specimen is shown in Figure 35. This model is based on the Grand Voyager tank properties. Tensile forces are applied as shown in Figure 36 and increased until the material reaches the failure stress. The effective stress and plastic strain fringe diagrams are shown in Figure 37. The results clearly show that the maximum stress and strain occur in the parent material and not the pinch-off region.
Figure 35 – FE model of SwRI tensile test specimen
Figure 36 – Simulated simple tensile test
TOP VIEW
Applied Force
Applied Force

Page 34 of 47
(a) Effective Stress (b) Plastic Strain
Figure 37 – Effective stress and plastic strain fringe diagrams for simple tensile test

Page 35 of 47
6.2 HYDROSTATIC PRESSURE ON A CURVED COUPON In the second case, the specimen used in the previous test is bent into a curved shape then fixed at both ends (not constrained perpendicular to the specimen), and a hydrostatic pressure is applied along the inside of the specimen. This pressure is increased until the material reaches the failure stress. To achieve the bend in the specimen, the process is dynamically simulated whereby the specimen is wrapped around a cylinder as shown in Figure 38. The final state of this simulation is then used as the initial state for the hydrostatic load test. The test condition is shown in Figure 39, and the effective plastic strain fringe diagrams are shown in Figure 40. Again the results show that the maximum stress and strain occur in the parent material and not the pinch-off region.
Figure 38 – Creation of curved specimen for hydrostatic pressure tensile test
Figure 39 – Hydrostatic pressure tensile test
uniform pressure
Reaction force
Reaction force

Page 36 of 47
Figure 40 – Plastic strain fringe diagrams for hydrostatic pressure tensile test 6.3 COMBINED LOADING ON A CURVED COUPON In the third case, the curved specimen used in the previous test is placed on a frictionless cylinder and pulled in tension on both ends, as shown in Figure 41. The concept here is to devise a test that resembles the drop test loading conditions in that the material is pulled in tension while a hydrostatic normal pressure is applied by the fluid on the inside, but unlike the previous test, it can be physically performed. The effective plastic strain
1
3
5
2
4
6

Page 37 of 47
fringe diagrams are shown in Figure 42. Despite the increased normal loads at the pinch-off area which have the effect of forcing a wedge into the joint, the results show that the maximum stress and strain still occur in the parent material and not the pinch-off region.
Figure 41 – Simple pipe tension test
Figure 42 – Plastic strain fringe diagrams of simple pipe tension test
Fixed Pipe with
frictionless surface
Applied force Applied force

Page 38 of 47
6.4 SUMMARY OF SIMULATION RESULTS The following is a summary of the coupon test simulations: 1. A simple tensile test such as the one performed by SwRI is not representative because
in the drop test the pinch-off joint is subjected to a bidirectional force along, and perpendicular to, the joint.
2. Applying a hydrostatic force on a curved specimen is more representative of the drop
test scenario because the primary loads are generated by the water pressure.
3. This is not a simple test to perform and therefore an alternative is to place the specimen on a curved low friction device (cylinder or pipe) and applying a tensile force at the ends.
4. The results of the simulations clearly show that the latter provides the same type of
load distribution as the hydrostatic case and the stress builds up more at the joint. 5. However, all three cases were not able to generate a higher stress at the joint than the
parent material. 6. It is not clear at this point that there exists a simple coupon test that can generate the
load conditions to fail the pinch-off joints. 7. The models have a limitation in that they do not represent any micro-cracks in the
joint which would initiate an early failure when tested.

Page 39 of 47
7.0 SIMULATION OF VOYAGER TANK WITH GASOLINE PROPERTIES The purpose of this set of simulations is to investigate the effect of the gasoline properties on the behavior of the tanks as compared to the water properties. This is necessary since the loads that lead to the failure of the tanks are generated by the fluid slosh inside the tanks, and since water is used as a surrogate for the flammable gasoline during physical testing, it is imperative that the effect of the density and amount of volume fill are investigated. Furthermore, since in a crash the tank is situated horizontally whereas in the drop test it is situated vertically, the effect of the gravity direction versus direction of fluid flow needed to be investigated. 7.1 DROP TEST SIMULATION In this first simulation the Plymouth Grand Voyager Tank is filled up to 100% by volume with gasoline and dropped from a height of 30 feet, similar to the SwRI drop tests. In this case the density of the fluid in the simulation is reduced to match that of gasoline. The sequence of the simulation is shown in Figure 43. 7.2 SIDE IMPACT SIMULATION In this second simulation the same tank and fuel are modeled as above except the tank is positioned horizontally and is impacted by a rigid wall traveling at 13.4 m/s (same speed as the impacting tank in a free fall from 30 feet); i.e. gravity is perpendicular to the impact direction. Again the density of the fluid in the simulation is matched to that of gasoline. The sequence of the simulation is shown in Figure 44. The plots comparing the maximum forces parallel and perpendicular to the joint, respectively, for the water filled tank in a drop test, the gasoline filled tank in a drop test, and the gasoline filled tank in a side impact test, are shown in Figures 45 and 46. The conclusions drawn from these plots are discussed in section 7.3 next.

Page 40 of 47
Figure 43 – Sequence of simulation for the gasoline filled Voyager tank in drop test

Page 41 of 47
Figure 44 – Sequence of simulation for the gasoline filled tank in side impact test

Page 42 of 47
Figure 45 – Comparison of maximum forces parallel to the joint for the three cases
Figure 46 – Comparison of maximum forces perpendicular to the joint
Tank filled with water (74% full) Vertical Drop
Tank filled with gasoline (100% full) Vertical Drop
Tank filled with gasoline (100% full) Side Impact
Tank filled with water (74% full) Vertical Drop
Tank filled with gasoline (100% full) Vertical Drop
Tank filled with gasoline (100% full) Side Impact

Page 43 of 47
7.3 SUMMARY OF SIMULATION RESULTS The following is a summary of the simulations comparing the water versus gasoline filled tanks in vertical drop and side impact tests: 1. The behavior of the tanks when filled with gasoline and dropped from 30 feet or
impacted horizontally did not show any difference in the crush behavior or the maximum measured loads (this is perhaps only the case when the tank is filled up to 100% of volume since the effect of gravity on the initial state of the fluid and void does not play a role).
2. The behavior of the tanks when filled with gasoline and dropped from 30 feet did not
show any change in terms of the overall tank deformation and the location of the maximum pinch-off area forces when compared to the water filled tanks dropped from 30 feet.
3. However, the force-time history comparison shows an increase for the gasoline tanks
of 10% in the maximum force (the second force peak increased by about 30%) and an increase in the total pulse duration by about 36%. Since the crush behavior is the same in both cases then this implies an increase in energy; viz. the area under the force-deflection curve, of 36% as well.

Page 44 of 47
10.0 CONCLUSIONS AND PROPOSED FUTURE RESEARCH 10.1 CONCLUSIONS
1. At impact the dynamics of the water sloshing causes the water to continue to move down, and since it is an incompressible fluid the tank has to expand.
2. The FE analysis predicted the maximum loads at the same location where the
pinch-off region ruptured in both tests (neck area in the Voyager and lower edge in Cherokee).
3. A tank with a thin stiff neck, such as the Voyager tank, cannot expand in the neck
area leading to increased water pressure and therefore large stresses develop at the joints.
4. The addition of a neck section in a rectangular tank, keeping everything else
similar, increases the forces in the pinch-off region by 50%. 5. The maximum force predicted in the Voyager simulation is perpendicular to the
pinch off joint and is approximately 780 LB (this is 40% higher than the force that failed the specimens in the tensile tests performed by SwRI).
6. The Jeep Cherokee carries the most amount of fuel of all tanks tested, yet the
pinch-off area has the thinnest cross-section (i.e. higher dynamic loads due to water weight and higher stresses due to smaller cross section area).
7. The stress in the Saturn joint is estimated to be 20% lower than the Cherokee’s. 8. The pinch-off contact area is very important and has a significant effect on the
ability of the joint to withstand the impact loads (the size of the Cherokee pinch-off contact area is estimated to be 30% of the Voyager pinch-off contact area).
9. In all cases the peak force occurred at about 0.02 sec hence the strain rate effect is
important (the SwRI tensile test peaked in 1.2 min). 10. A simple tensile test such as the one performed by SwRI is not representative
because in the drop test the pinch-off joint is subjected to a bidirectional force along, and perpendicular to, the joint.
11. It is not clear at this point that there exists a simple coupon test that can generate
the load conditions to fail the pinch-off joints. 12. The models have a limitation in that they do not represent any micro-cracks in the
joint which would initiate an early failure when tested.
Page 45 of 47
13. While a tank filled with water up to 74% volume does represent the general crush behavior of the tank when compared to a tank filled with gasoline up to 100% volume, the maximum forces generated at the pinch-off area could be as much as 10% lower and the total pulse duration as much as 36% less.
10.2 FURTHER SIMULATION STUDIES The following two questions may need to be addressed with further simulation studies:
1. The drop test carried out by SwRI is certainly representative of a vehicle impact condition, however, given that the loads that were generated with a gasoline filled tank are more aggressive than those generated by the water filled tank, should the drop height or the amount of water be modified to reflect these changes for a possible future standard test?
2. Is there some other combination of coupon samples and test configurations that could place the right amount and direction of load on the joint to fail it such that a standard test could exist for testing tank joints?
10.3 PROPOSED TESTING PROGRAM The simulation study clearly shows that there are unique features in each of the tanks tested that some broad conclusions about tank design and testing could be drawn. While the analysis could explain why certain tank designs have higher loads, and therefore would require thicker tank walls and larger pinch-off contact patch sizes, it did not answer the question as to why the conditioned tanks failed while the new ones did not. It is obvious that exposure to fuel may have some degrading effect on the structural strength of joints. However, the results of the simulations also showed that there are some design considerations which could be addressed to reduce the loads and to strengthen the joints. It is believed from the analysis that the tanks tested were subjected to loads at the borderline of the joint strengths. Therefore, more statistically significant tests should be performed. It is proposed to run a set of drop tests to:
(a) provide the necessary validation of the FE models, (b) include sufficient statistical significance to get meaningful results, and (c) understand the contribution of fuel exposure in the pinch off area by testing new
tanks that have been exposed to fuel for a period of at least 72 hours.

Page 46 of 47
The latter is a requirement in a number of fuel tank compliance tests including ECE and military test procedures. The proposed program would include the following 46 drop tests: Test 1: Custom made clear tank to visualize water slosh and tank bulging effects Tests 2-6: 1998 Saturn Twin Cam 4 Dr New tanks (not exposed to fuel) Tests 7-11: 1998 Saturn Twin Cam 4 Dr New tanks (filled w/ fuel for 72 hrs) Tests 12-16: 1998 Saturn Twin Cam 4 Dr Reconditioned tanks Tests 17-21: 1998 Plymouth Grand Voyager New tanks (not exposed to fuel) Tests 22-26: 1998 Plymouth Grand Voyager New tanks (filled w/ fuel for 72 hrs) Tests 27-31: 1998 Plymouth Grand Voyager Reconditioned tanks Tests 32-36: 1998 Jeep Grand Cherokee New tanks (not exposed to fuel) Tests 37-41: 1998 Jeep Grand Cherokee New tanks (filled w/ fuel for 72 hrs) Tests 42-46: 1998 Jeep Grand Cherokee Reconditioned tanks Test 1 is aimed specifically at validating the FE model fluid/structure interaction component which has proven to be critical to the understanding of the loading conditions in all the tested/analyzed tanks. Through the use of digital high-speed cameras, the behavior of the “colored” fluid inside the clear tank would be observed and compared to the simulated tank. In addition, accelerometers, load cells, and pressure sensors would be utilized as needed to extract numerical data for the quantitative validation. The tank should be designed not to fail since the primary objective is to visualize the fluid behavior and its interaction with the walls of the tank. Tests 2 to 46 are aimed at demonstrating, with sufficient statistical significance, the difference in behavior between the tanks of different geometry, thickness, age, and fuel exposure. The same type of high-speed video and instrumentation should be utilized in these tests. FE analysis of the three tanks, namely, the 1998 Saturn Twin Cam 4 Dr, the 1998 Plymouth Grand Voyager, and the 1998 Jeep Grand Cherokee has already provided insight into the differences in behavior. It is anticipated that the combination of the analysis and testing will provide conclusive evidence of the behavior of fuel tanks when subjected to this test condition, and will allow the extrapolation of these results to encompass a wide range of tank designs.

Page 47 of 47
9.0 REFERENCES 1. Machado, C.R., “Automotive Fuel Tank Evaluation”, South West Research Institute,
SwRI Project No. 01.06081.01.001, August 2003. 2. Hallquist, J.O., “LS-DYNA Theoretical Manual”, Livermore Software Technology
Corporation, 1998. 3. Hallquist, J.O., “LS-DYNA Keyword User's Manual”, Livermore Software
Technology Corporation, 2001. 4. http://www.lstc.com, Livermore Software Technology Corporation. 5. http://www.matweb.com, High Density Poly-Ethylene material properties. 6. Fournier, E. and Keown, M, “Survey of State-of-the-art in Fuel System Fire Safety:
Phase I”, Biokinetics and Assoc. Ltd., April 19, 2002, Report No. R02-04. 7. Fournier, E., Bayne, T., and Kot, J., “Survey of State-of-the-art in Fuel System Fire
Safety: Phase II”, Biokinetics and Assoc. Ltd., May 12, 2003, Report No. R03-01. 8. Fournier, E. and Kot, J., “Expansion of the Vehicle Fuel System Database and
Overview of Pickup Truck History”, Biokinetics and Assoc. Ltd., February 9, 2004, Report No. R04-02.
9. Smith, H.D., “Crash-Resistant Fuel Tanks for Helicopters and General Aviation
Aircraft”, SAE740358, 1974. 10. Fukuhara, K., Hara, M., Matasuura, N., and Watanabe, H., “Development of Plastic
Fuel Tanks Using Modified Multi-Layer Blow Molding”, SAE 900636, 1990. 11. Pisciolaro, O. and Comparini, F.H., “Development of High Capacity Plastic Fuel
Tanks for Trucks”, SAE921513, 1992. 12. Stephens, R.D., Williams, R., Keoleian, G.A., Spatari, S., and Beal, R.,
“Comparative Life Cycle Assessment of Plastic and Steel Vehicle Fuel Tanks”, SAE982224, 1998.
13. Kamiya, K., Yamaguchi, Y., and Vries, E., “Simulation Studies of Sloshing in a
Fuel Tank”, SAE2002-01-0574, 2002. 14. Ellis, T., “Structural and Material Features that Influence Emissions from
Thermoplastic Multilayer Fuel Tanks”, SAE2003-01-1121, 2003. 15. Tachi, T., Goto, T., Kato, H., and Takashima, T., “Low Permeation Technologies
for Plastic Fuel Tanks”, SAE2003-01-0790, 2003.


![Specification...Original Properties Tensile Strength, psi (MPa) ASTM D638 1,500 (10.34) Min. (after conditioning Tensile Stress, psi (MPa) ASTM D638 500 (3.45) Min. at 100ºF [37ºC]](https://static.fdocuments.net/doc/165x107/612910692aee8938e12dd1fe/specification-original-properties-tensile-strength-psi-mpa-astm-d638-1500.jpg)

