Studi Alternatif Perencanaan Fishway Pada Bendung Welulang di ...

EVALUATION OF FISHWAY FENCES (1991-1998) AND SPILL FORADULT SALMON AND STEELHEAD PASSAGE (1994) AT SNAKERIVER DAMS
Part VI of final report for:
Migration of Adult Chinook Salmon and Steelhead Past Dams and ThroughReservoirs in the Lower Snake River and into Tributaries
T. C. Bjornn, C. A. Peery, J. P. Hunt, K. R. Tolotti, P. J. Keniry, and R. R. Ringe
U.S. Geological SurveyIdaho Cooperative Fish and Wildlife Research UnitUniversity of Idaho, Moscow, ID 83844-1141
1999

EVALUATION OF FISHWAY FENCES (1991-1998) AND SPILL FOR ADULT SALMON AND STEELHEAD PASSAGE (1994)
AT SNAKE RIVER DAMS
Part VI of Final Report for
MIGRATION OF ADULT CHINOOK SALMON AND STEELHEAD
PAST DAMS AND THROUGH RESERVOIRS IN THE LOWER SNAKE
RIVER AND INTO TRIBUTARIES
by
T. C. Bjornn, C. A. Peery, J. P. Hunt, K. R. Tolotti, P. J. Keniry, and R. R. Ringe
U.S. Geological Survey, Idaho Cooperative Fish and Wildlife Research UnitUniversity of Idaho, Moscow, ID 83844-1141
for
U.S. Army Corps of EngineersWalla Walla District
and
Bonneville Power AdministrationPortland, Oregon
1999

Preface
A study of adult salmon and steelhead migrations past dams, through reservoirs,and into tributaries of the Snake River began in 1990 with planning, purchase, andinstallation of radio telemetry equipment. Adult spring and summer chinook salmonwere outfitted with transmitters in 1991-1993, and adult steelhead were outfitted in1991-1994. Progress reports have been issued periodically (Bjornn et al. 1992; 1994;1995) and final reports as listed below. Part I of the final report includes a generalintroduction, methods that apply to all segments of the work, and information onpassage of chinook salmon. Other parts of the final report include an introduction andmethods section specific to the topic covered.
Part I - Passage of chinook salmon through the lower Snake River and distribution intotributaries - 1991-1993.
Part II - Passage of steelhead through the lower Snake River and distribution into tributaries - 1991-1994.
Part III - Entrances used and passage through fishways for adult chinook salmon and steelhead at Snake River dams.
Part IV - Turbine priority and its effects on passage of steelhead at Snake River dams.
Part V - Movements of steelhead in fishways in relation to transition pools.
Part VI - Evaluation of fishway fences and spill for adult salmon and steelhead passage at Snake River dams.
Part VII - Effects of zero versus normal flow at night on passage of steelhead in summer and fall.
Acknowledgments
Many people assisted with this project and its successful completion was madepossible by Teri Barila, the Corps of Engineers project officer. Michelle Feeley, Brian
Hastings, Jay Nance, and Matthew Keefer assisted in data collection and analysis.
Page i

Table of Contents - Part VI of Final ReportPreface . . . . . . . . . . . . . . . . . . . . . . . . . . . . . . . . . . . . . . . . . . . . . . . . . . . . . . . . . . . . . . . . . . . iAbstract . . . . . . . . . . . . . . . . . . . . . . . . . . . . . . . . . . . . . . . . . . . . . . . . . . . . . . . . . . . . . . . . . . iiiIntroduction . . . . . . . . . . . . . . . . . . . . . . . . . . . . . . . . . . . . . . . . . . . . . . . . . . . . . . . . . . . . . . . 1Study Sites . . . . . . . . . . . . . . . . . . . . . . . . . . . . . . . . . . . . . . . . . . . . . . . . . . . . . . . . . . . . . . . 2Methods . . . . . . . . . . . . . . . . . . . . . . . . . . . . . . . . . . . . . . . . . . . . . . . . . . . . . . . . . . . . . . . . . . 2
Fishway Fence Evaluation . . . . . . . . . . . . . . . . . . . . . . . . . . . . . . . . . . . . . . . . . . . . . . . 2Spill for Adult Passage . . . . . . . . . . . . . . . . . . . . . . . . . . . . . . . . . . . . . . . . . . . . . . . . . . 9
Fishway Fence Results . . . . . . . . . . . . . . . . . . . . . . . . . . . . . . . . . . . . . . . . . . . . . . . . . . . 10Net Entry Rates . . . . . . . . . . . . . . . . . . . . . . . . . . . . . . . . . . . . . . . . . . . . . . . . . . . . . . . 10
Little Goose Dam . . . . . . . . . . . . . . . . . . . . . . . . . . . . . . . . . . . . . . . . . . . . . . . . . . . 10Lower Granite Dam . . . . . . . . . . . . . . . . . . . . . . . . . . . . . . . . . . . . . . . . . . . . . . . . . 12
Entries Per Fish . . . . . . . . . . . . . . . . . . . . . . . . . . . . . . . . . . . . . . . . . . . . . . . . . . . . . . . 14Spill for Adult Passage . . . . . . . . . . . . . . . . . . . . . . . . . . . . . . . . . . . . . . . . . . . . . . . . . . . . 14
Dam Counts . . . . . . . . . . . . . . . . . . . . . . . . . . . . . . . . . . . . . . . . . . . . . . . . . . . . . . . . . . 14Telemetry Data . . . . . . . . . . . . . . . . . . . . . . . . . . . . . . . . . . . . . . . . . . . . . . . . . . . . . . . 17
Discussion . . . . . . . . . . . . . . . . . . . . . . . . . . . . . . . . . . . . . . . . . . . . . . . . . . . . . . . . . . . . . . . 18Fishway Fence Evaluation . . . . . . . . . . . . . . . . . . . . . . . . . . . . . . . . . . . . . . . . . . . . . . 18Spill for Adult Passage . . . . . . . . . . . . . . . . . . . . . . . . . . . . . . . . . . . . . . . . . . . . . . . . . 21
References . . . . . . . . . . . . . . . . . . . . . . . . . . . . . . . . . . . . . . . . . . . . . . . . . . . . . . . . . . . . . . 23Appendix A . . . . . . . . . . . . . . . . . . . . . . . . . . . . . . . . . . . . . . . . . . . . . . . . . . . . . . . . . . . . . . 25Appendix B . . . . . . . . . . . . . . . . . . . . . . . . . . . . . . . . . . . . . . . . . . . . . . . . . . . . . . . . . . . . . . 31Appendix C . . . . . . . . . . . . . . . . . . . . . . . . . . . . . . . . . . . . . . . . . . . . . . . . . . . . . . . . . . . . . . 32
Page ii

Abstract
From 1991 to 1998, studies were conducted, first using electronic count tunnels andthen radio telemetry, to evaluate the effectiveness of fishway fences to reduce thenumber of chinook salmon Oncorhynchus tshawytscha and steelhead O. mykiss thatexited at north-powerhouse entrances (NPEs) at Little Goose and Lower Granite dams.Earlier researchers judged data from tunnel counts to be unreliable because of falsecounts and counts of non-salmonid species, and so evaluations of the fishway fenceswere predominately based on results from telemetry studies. The original fishwaydesign, tested in 1991-1993, resulted in more exits by chinook salmon and steelhead atthe NPEs, as compared to when no fence was in place. A subsequent modification tothe fence design in 1994 reduced the number of exits made by chinook salmon andsteelhead at NPEs at the dams.
In a separate study, tests were conducted to evaluate the use of low levels of spill toimprove passage over fish ladders adjacent to spillways at Ice Harbor (north-shoreladder) and Lower Monumental (south-shore ladder) dams in fall 1994. Fall chinooksalmon and steelhead counts at the north and south ladders were compared duringalternating periods with and without spill in bays nearest spillway ladders. With spill,counts of chinook salmon were significantly higher at the north-shore ladder at IceHarbor Dam, and counts of chinook salmon and steelhead were significantly higher forthe south-shore ladder at Lower Monumental Dam, as compared to counts on dayswithout spill. Median times for steelhead with transmitters to pass the two dams werenot significantly different with and without spill during the test period. Spill levelsaveraged about 5% of river flow on days water was spilled for the tests.
Page iii

Introduction
We now know that adult chinooksalmon Oncorhynchus tshawytscha andsteelhead O. mykiss can enter and exitfishways numerous times prior toeventually passing dams in the SnakeRiver (Bjornn et al. 1998b). We also knowthat fish use some fishway entrancesmore than others, for both entries to, andexits from, fishways (Bjornn et al. 1998b).In 1981, Turner et al. (1983) estimatedthat the number of times fish entered andexited at the north-powerhouse entrances(NPEs) at Little Goose and Lower Granitedams were similar, resulting in low or nonet entries at those openings. During theSnake River adult passage project, weconsistently saw high entry and exit ratesfor salmon and steelhead at the north (orsouth, in the case of Lower MonumentalDam) powerhouse entrances, many timesresulting in negative net entries for thoseopenings (Bjornn et al. 1998b). Turner etal. (1983) recommended that northpowerhouse entrances be closed ormodified to reduce the number of fish thatmoved from the collection channel backinto the tailrace, to reduce the time forsalmon and steelhead to pass the dams.
The modification chosen for evaluationat Little Goose and Lower Granite damswas a fence made of chain-link materialthat would allow fish to enter the collectionchannel at the NPEs but, once inside,would inhibit fish from exiting through theopenings again. Initially it was thoughtthat the majority of fish exiting the NPEshad entered the fishway at the north-shoreentrances, moved upstream through thespillway channel, and approached theNPEs from downstream. The originalfishway fence was designed to divertupstream migrating fish from the spillwaychannel away from the NPEs. Later itbecame evident that salmon and
steelhead also moved downstream in thecollection channel, and that the originalfishway fence guided some of those fish tothe NPEs and out into the tailrace.Fishway fences were later modified todivert fish moving in both directions in thecollection channels away from the NPEs(see Methods).
In this report we summarize resultsfrom studies with electronic count tunnelsconducted in 1981 (Turner et al. 1983),1991, and 1992 (Knutsen and Knapp1992; Knapp and Knutsen 1994), andfrom our studies using radio telemetryduring 1992-1998 at Little Goose andLower Granite dams. We comparednumbers of entries and exits by chinooksalmon and steelhead at fishwayentrances over the years to evaluate theeffectiveness of the fishway fences toreduce the number of fish that movedback through the NPEs.
Also in this report, we discuss theresults of a separate study to determine ifsmall volumes of spill during summer andfall would attract fish moving up the riverto the spillway ladders to cross Ice Harbor(north-shore ladder) and LowerMonumental (south-shore ladder) dams in 1994. The purpose of the study was todetermine if fish could be attracted to thespillway ladders during summer whenmost or all of river flow is passed throughthe powerhouse. Salmon and steelheadmigrating along the shore adjacent to thespillway would thus be attracted to theopposite shore and pass the dam usingthe powerhouse fishway rather than themore direct route up the spillway ladder.Counts of steelhead and fall chinooksalmon at the spillway ladder countingwindows were compared for alternatingperiods of time with and without spill. Wealso looked at time for steelhead with
Page 1
transmitters to pass Ice Harbor and LowerMonumental dams with and without spillduring the 1994 study period.
Study Sites
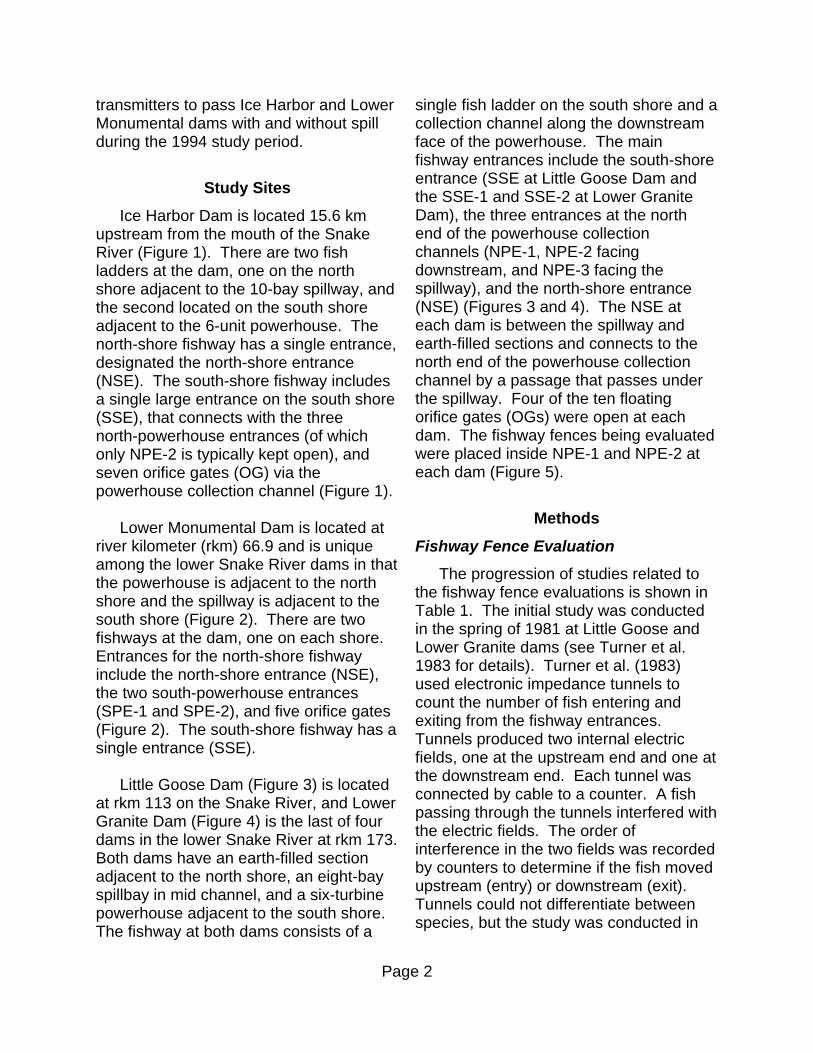
Ice Harbor Dam is located 15.6 kmupstream from the mouth of the SnakeRiver (Figure 1). There are two fishladders at the dam, one on the northshore adjacent to the 10-bay spillway, andthe second located on the south shoreadjacent to the 6-unit powerhouse. Thenorth-shore fishway has a single entrance,designated the north-shore entrance(NSE). The south-shore fishway includesa single large entrance on the south shore(SSE), that connects with the threenorth-powerhouse entrances (of whichonly NPE-2 is typically kept open), andseven orifice gates (OG) via thepowerhouse collection channel (Figure 1).
Lower Monumental Dam is located atriver kilometer (rkm) 66.9 and is uniqueamong the lower Snake River dams in thatthe powerhouse is adjacent to the northshore and the spillway is adjacent to thesouth shore (Figure 2). There are twofishways at the dam, one on each shore.Entrances for the north-shore fishwayinclude the north-shore entrance (NSE),the two south-powerhouse entrances(SPE-1 and SPE-2), and five orifice gates(Figure 2). The south-shore fishway has asingle entrance (SSE).
Little Goose Dam (Figure 3) is locatedat rkm 113 on the Snake River, and LowerGranite Dam (Figure 4) is the last of fourdams in the lower Snake River at rkm 173.Both dams have an earth-filled sectionadjacent to the north shore, an eight-bayspillbay in mid channel, and a six-turbinepowerhouse adjacent to the south shore.The fishway at both dams consists of a
single fish ladder on the south shore and acollection channel along the downstreamface of the powerhouse. The mainfishway entrances include the south-shoreentrance (SSE at Little Goose Dam andthe SSE-1 and SSE-2 at Lower GraniteDam), the three entrances at the northend of the powerhouse collectionchannels (NPE-1, NPE-2 facingdownstream, and NPE-3 facing thespillway), and the north-shore entrance(NSE) (Figures 3 and 4). The NSE ateach dam is between the spillway andearth-filled sections and connects to thenorth end of the powerhouse collectionchannel by a passage that passes underthe spillway. Four of the ten floatingorifice gates (OGs) were open at eachdam. The fishway fences being evaluatedwere placed inside NPE-1 and NPE-2 ateach dam (Figure 5).
Methods
Fishway Fence Evaluation
The progression of studies related tothe fishway fence evaluations is shown inTable 1. The initial study was conductedin the spring of 1981 at Little Goose andLower Granite dams (see Turner et al.1983 for details). Turner et al. (1983)used electronic impedance tunnels tocount the number of fish entering andexiting from the fishway entrances.Tunnels produced two internal electricfields, one at the upstream end and one atthe downstream end. Each tunnel wasconnected by cable to a counter. A fishpassing through the tunnels interfered withthe electric fields. The order ofinterference in the two fields was recordedby counters to determine if the fish movedupstream (entry) or downstream (exit).Tunnels could not differentiate betweenspecies, but the study was conducted in
Page 2

Page 3
Spillway
N
NPE-2
OG-12
������������������
����
NSE
OG-10
OG-8
OG-6
OG-4
OG-2
OG-1SSE-1��������
��������
Ice Harbor DamColumbia River
Snake River
North-shore fish ladder
Pow
erh
ouse
col
lect
ion
chan
nel
South-shore fish ladder
Pow
erhouse
Flow
Figure 1. Diagram of Ice Harbor Dam with location of fishway entrances. NSEdesignates the north-shore entrance, NPEs are north-powerhouse entrances, OGsare orifice gates, and SSE is the south-shore entrance.

Page 4
Figure 2. Diagram of Lower Monumental Dam with location of fishway entrances.NSE designates the north-shore entrance, SPEs are south-powerhouse entrances,OGs are orifice gates, and SSE is the south-shore entrance.
Spillway
N
SSE
SPE-2
SPE-1
OG-9
OG-7
OG-5
OG-3
OG-1
NSE
Lower Monumental Dam
Columbia River
Snake River
Flow
North-shore fish ladder
South-shore fish ladder
Po
wer
hous
e co
llect
ion
chan
nel
Pow
erh
ouse

Page 5
Figure 3. Diagram of Little Goose Dam with location of telemetry receiverantennas and fishway entrances. NSE designates the north-shore entrance, NPEsare north-powerhouse entrances, OGs are orifice gates, and SSE is the south-shoreentrance. Dashed line represents location of fishway fence.
Little Goose Dam
N
Yagi antennasdownstream of dam
Spillway
NSE
NPE-3
NPE-2
NPE-1
OG-10
OG-6
OG-4
OG-1
SSE
Columbia River
Snake River
Underwater antennas used1996 and 1997
Underwater antennas used 1992 - 1994
Flow
South-shore fish ladder
Po
wer
hous
e c
olle
ctio
n ch
anne
l
Pow
erh
ouse

Page 6
Spillway
N
Yagi antennasdownstream of dam
Underwater antennas used1997
NSE
NPE-3
NPE-2
NPE-1
OG-10
OG-7
OG-4
OG-1
SSE-2SSE-1
Lower Granite Dam
Columbia RiverSnake River
Underwater antennas used 1992 - 1996
Flow
South-shore fish ladder
Pow
erh
ous
e co
llect
ion
cha
nne
l
Po
wer
hou
se
Figure 4. Diagram of Lower Granite Dam with location of telemetry receiverantennas and fishway entrances. NSE designates the north-shore entrance, NPEsare north-powerhouse entrances, OGs are orifice gates, and SSEs are thesouth-shore entrances. Dashed line represents location of fishway fence.

the spring so most fish counted wereassumed to be spring chinook salmon.Tunnels were adjusted to count only largefish, but this did not eliminate counts oflarge non-salmonid species during thestudies, such as carp, suckers, and shad.
In 1991, the first fishway fences wereinstalled at Little Goose and Lower Granitedams. The fishway fences wereconstructed of PVC-coated chain-link
fence supported by 7.6 cm diameter metalpipe, 4.9 m tall (Figure 5). Each fishwayfence was attached inside of the down-stream wall of the collection channel northof NPE-1 and had an opening south ofNPE-2 (Figure 5). Entries and exits atboth dams were evaluated during spring,summer, and fall 1991 by personnel fromOregon Department of Fish and Wildlifeusing electronic count tunnels
Page 7
NPE-3 Flow
Powerhouse
Turbine 5Turbine 6
NPE-2 NPE-1
Spillway channel
49.5'
10.0'
5.0'
3.5' Opening
NPE-3 Flow
Powerhouse
Turbine 5Turbine 6
NPE-2 NPE-1
Spillway channel
Figure 5. Design of the original fishway fence (top) and modified fishway fenceused at Lower Granite and Little Goose dams during tests.

(see Knutsen and Knapp 1992, fordetails).
In 1992, a study was conducted toevaluate the original fishway fence atLower Granite Dam, but not at LittleGoose Dam. Electronic tunnels wereused again during spring, summer, and fall1992 to count entries and exits at allfishway entrances (see Knapp andKnutsen 1994, for details). In addition,Knapp and Knutsen (1994) usedunderwater video to verify the reliability ofthe tunnel counts. During fall 1992,steelhead outfitted with radio transmitterswere also migrating in the Snake River,and we used the opportunity to test the
effectiveness of the new SRX/DSP radioreceivers to monitor entrances at LowerGranite Dam. SRX/DSP receiversmonitored all transmitter frequenciessimultaneously, and thus were able torecord fish during the relatively shortperiods of time required to pass throughfishway entrances. Because of thesuccess of the 1992 trials, all laterevaluations of fishway fences were madeusing radio telemetry.
In 1993, the original fishway fence wasremoved from Lower Granite Dam butmaintained at Little Goose Dam to providea comparison of passage with and withoutthe original fence present. Chinook
Page 8
Table 1. Year, type of fishway fence installed, and type of data collected duringpassage of chinook salmon and steelhead at Little Goose and Lower Granite dams,1981-1998.Year Fishway fence Chinook salmon Steelhead
Little Goose Dam
1981 None Electronic tunnels No data1991 Original Electronic tunnels Electronic tunnels1992 Original No data No data1993 Original Radio telemetry Radio telemetry1994 Modified No data Radio telemetry1995 Modified No data No data1996 Modified No data No data1997 Modified Radio telemetry Radio telemetry1998 Modified No entrance data No data
Lower Granite Dam
1981 None Electronic tunnels No data1991 Original Electronic tunnels Electronic tunnels1992 Original Tunnels & video Radio telemetry1993 None Radio telemetry Radio telemetry1994 None No data Radio telemetry1995 None No data No data1996 None Radio telemetry Radio telemetry1997 Modified Radio telemetry Radio telemetry1998 Modified Radio telemetry No data

salmon and steelhead with transmitterswere monitored at both dams.
In 1994, a modification was made tothe fishway fence at Little Goose Dam withthe addition of a triangular section of fencejust south of the fence opening (Figure 5).The modification was meant to divert fishmoving downstream in the collectionchannel away from the NPEs. There wasno fence at Lower Granite dam in 1994.Steelhead were again outfitted withtransmitters and monitored at both dams,but chinook salmon were not taggedbecause of the small run size in 1994.
No fish were tagged in 1995. In 1996,the fence at Little Goose Dam was thesame as that used in 1994, and there wasno fishway fence at Lower Granite Dam;passage was monitored only at LowerGranite Dam. Both chinook salmon andsteelhead with transmitters weremonitored at Lower Granite Dam. In1997, a modified fishway fence, such asthat at Little Goose Dam, was installed inthe collection channel at Lower GraniteDam, and chinook salmon and steelheadwith transmitters were monitored at bothdams. Spring/summer and fall chinooksalmon were also monitored at both damsin 1998.
The index we used to compare entryand exit rates between dams and yearswas calculated as,
REi = (Ei - Xi) / Ei [1]
where REi was the net entry rate forentrance i, Ei was the total number ofentries at entrance i, and Xi was the totalnumber of exits at entrance i. REi was thusthe net entries at entrance i as aproportion of total entries that occurred atthat entrance for the migration season. IfREi was negative, there were more exits
than entries at entrance i. If REi waspositive, there were more entries thanexits at entrance i, and if REi was zero,exits equaled entries. The magnitude of REi represents the relative effectiveness ofan entrance as a route for entry (or exit) tofishways. In prior years, when entranceswere monitored with electronic tunnels,up-counts and down-counts were used inplace of entries and exits in equation [1].For convenience, REi will be referred to asthe net entry rate for the remainder of thisreport. Entries and exits for NPE-1 andNPE-2 were combined (referred to asNPE1+2) for analysis. Separate entry andexit data for NPE-1 and NPE-2 arepresented in Appendix A.
When possible, we also reported theaverage number of entries per fish todetermine if the fishway fences effectivelyreduced the total number of times a fishexited and re-entered the fishways beforeeventually passing the two Snake Riverdams. Entries per fish were calculated bydividing the total number of entries at thedam by the total number of fish thatentered the fishway at least once.
Spill for Adult Passage
Spill tests were conducted from 16September until 31 October 1994 at IceHarbor Dam and from 19 September until31 October 1994 at Lower MonumentalDam. During the study, periods of no spillwere alternated almost daily with periodsof daytime spill (Appendix B). Spill wasconcentrated at the north end of thespillway at Ice Harbor Dam and at thesouth end of the spillway at LowerMonumental Dam. Daily counts ofchinook salmon and steelhead thatpassed through the north and south-shoreladders at both dams were comparedduring periods with and without spill.
Page 9

Count data were obtained from the U.S.Army Corps of Engineers. Analyses werealso performed on data from steelheadwith transmitters that passed Ice Harborand Lower Monumental dams during thetest period in 1994.
With count data, we used a blockedanalysis of variance (ANOVA, Proc GLM,SAS Institutes Inc. 1990) to compare theproportional use of the spillway ladders bychinook salmon and steelhead (testedseparately) during periods with andwithout spill. At least ten fish had to becounted passing the dam during each oftwo successive spill treatments for a blockto be included in analysis. A typicalreplicate block lasted two days, one daywith spill and one day without spill(Appendix B).
Time for steelhead with transmitters topass the two dams were compared duringperiods with and without spill using ablocked ANOVA analysis, similar to thatused for counts. Replicate units foranalysis were the median times forsteelhead to pass dams during each blockof spill and no-spill periods. Because afew fish took significantly longer to passthe dams than the majority of fish(producing a positively skeweddistribution), median times were a morerepresentative measure of passage rates,and had a more normal sampledistribution, than mean times. At leastfour steelhead had to have firstapproached and first entered an entranceat the dam during each consecutive periodof spill and no-spill (eight fish total) for thatblock to be used in analysis, resulting inten replicates for Ice Harbor Dam andeight replicates for Lower MonumentalDam. We also compared passage timesfor steelhead that used only the northfishway at Ice Harbor Dam and the south
fishway at Lower Monumental Dam topass the dams. Because of the lownumber of fish that passed the dams usingonly those ladders, replicate blockanalysis could not be performed, so2-sample (spill versus no spill) tests ofmedians (Proc NPAR1WAY, SASInstitutes Inc. 1990) were used. In thisprocedure, individual data points werescored as a “1” if they were above theoverall median, or “0” if they were belowthe overall median. Scores were thentotaled for each treatment and comparedusing a normalized Z test.
Fishway Fence Results
Net Entry Rates
Little Goose Dam.--Prior to installationof a fishway fence at Little Goose Dam,Turner et al. (1983) reported that meanhourly tunnel counts for chinook salmon atNPE1+2 were 6.76/h upstream and 5.34/hdownstream, for a net difference of 1.42/hupstream, and a net entry rate of 0.21upstream (Figure 6, Appendix A). No datawere collected for NPE-3 in 1981, and nodata were collected for steelhead prior toinstallation of the fishway fence at LittleGoose Dam.
Net entry rates in 1991, with theoriginal fishway fence, were below zero atNPE1+2 for chinook salmon (-0.195) andsteelhead (-0.323) (Figures 6 and 7), asdetermined from tunnel counts. With theoriginal fence in place in 1993, resultswere similar to those from 1991. Forchinook salmon, there were 153 entriesand 304 exits at NPE1+2, for a net entryrate of -0.987 (Figure 6, Table 2). Therewere 152 entries and 187 exits bysteelhead at NPE1+2 for a net entry rateof -0.230 (Figure 7, Table 2).
Page 10

Page 11
SSE OG-1 OG-4 OG-6 OG-10 NPE1+2 NPE-3 NSE UNK-1
-0.5
0
0.5
1 1996 - Modified FenceNo Data Collected
(Ent
rie
s -
exits
) / E
ntri
es
��������������������������������������������������
���������������������������������������������������
��������������������������������������������������������������������������������
���������������������������������������������������������������������������� �����������������
�����������������
����������������������������������������
SSE OG-1 OG-4 OG-6 OG-10 NPE1+2 NPE-3 NSE-0.5
0
0.5
1
1.5Spring 1991 - Original Fence
Electronic Count Tunnels
SSE OG-1 OG-4 OG-6 OG-10 NPE1+2 NPE-3 NSE-0.5
0
0.5
1
1.5
Spring 1981 - No FenceElectronic Count tunnels
Mea
n ho
urly
(u
p c
oun
ts -
dow
n co
unts
) /
Up
co
unts
ND
SSE OG-1 OG-4 OG-6 OG-10 NPE1+2 NPE-3 NSE UNK-0.5
0
0.5
1
1.5 1997 - Modified FenceRadio telemetry
ND ND ND ND Closed
(Ent
rie
s -
exits
) / E
ntri
es������������
No fishway fence
Original fishway fence
Modified fishway fence
��������������������������������
������������������������������������������������������
���������������������������������������������������
������������������������������������������������������������������������������ ����������������
����������������������������������������������������������������
��������������������������������������
��������������������������������������������������� ����������������
SSE OG-1 OG-4 OG-6 OG-10 NPE1+2 NPE-3 NSE UNK-1
-0.5
0
0.5
1
1993 - Original FenceRadio Telemetry
297 fish
329 fish
Figure 6. Net entry rates for chinook salmon at Little Goose Dam for four separatetests. SSEs are south-shore entrances, OGs are orifice gates, NPEs arenorth-powerhouse entrances, NSEs are north-shore entrances, UNK are unknown,and ND indicates no data were collected for an entrance that year.

Page 12
Figure 7. Net entry rates for steelhead at Little Goose Dam for four separate tests.SSEs are south-shore entrances, OGs are orifice gates, NPEs are north-powerhouseentrances, NSEs are north-shore entrances, UNK are unknown, and ND indicates nodata were collected for an entrance that year.
������������������������������������������������������
���������������������������������������������������������
����������������������������������������
��������������������������������������������������������������� ������������������ ������������������
������������������
��������������������������������������������������������� ��������������������
��������������������������������������������������������������������������������
���������������������������������������������������������������
SSE OG-1 OG-4 OG-6 OG-10 NPE1+2 NPE-3 NSE UNK-1
-0.5
0
0.5
1
SSE OG-1 OG-4 OG-6 OG-10 NPE1+2 NPE-3 NSE UNK-1
-0.5
0
0.5
1
(Entr
ies
- exi
ts)
/ En
trie
s
������������������������������������������������������
����������������������������������������������������������������������������
������������������������������������������������������������
���������������������������������������������������������������
������������������������������������������������������ ������������������
������������������
���������������������������������������������������������������������������� ��������������������
������������������������������������������������������������
SSE OG-1 OG-4 OG-6 OG-10 NPE1+2 NPE-3 NSE-1
-0.5
0
0.5
1 Summer 1991 - Original FenceElectronic Count Tunnels
-1
-0.5
0
0.5
1Spring 1981 - No Fence
No Data Collected
Me
an h
ourl
y (u
p c
ou
nts
- d
ow
n c
ou
nts)
/ U
p c
ounts
1993 - Original FenceRadio Telemetry
1994 - Modified FenceRadio Telemetry
SSE OG-1 OG-4 OG-6 OG-10 NPE1+2 NPE-3 NSE UNK-1
-0.5
0
0.5
11997 - Modified Fence
Radio Telemetry
ND ND ND ND Closed
(Entr
ies
- exi
ts)
/ En
trie
s����������������
No fishway fence
Original fishway fence
Modified fishway fence
-1.795
-3.133
292 fish
253 fish
-1.85
351 fish

With the modified fishway fence inplace in 1994, there were 148 entries bysteelhead at NPE1+2 and 23 exits, for anet entry rate of 0.845 (Figure 7, Table 2).In 1997, there were a total of 113 entriesand 66 exits by chinook salmon atNPE1+2, for a net entry rate of 0.410 withthe modified fishway fence (Figure 6,
Table 2). Steelhead had 176 entries, 63exits, and a net entry rate of 0.642 at theNPEs (Table 2, Figure 7).
Lower Granite Dam.--With no fishwayfence in place at Lower Granite Dam,chinook salmon were monitored withcounting tunnels during 1981 and salmon
Page 13
Table 2. Counts of chinook salmon and steelhead with transmitters as they enteredand exited the fishways through the north-powerhouse entrances (NPE) at Snake Riverdams with or without fishway fences during 1992-1998. Net entries = entries - exits, netentry rate = net entries/entries, and nd = no data. Dam Fishway Chinook salmon Steelhead Year fence Entries Exits Net Net entry Entries Exits Net Net entry entries rate entries rate Lower Granite
1992 Original nd nd nd nd 50 68 -18 -0.3601993 None 448 425 23 0.051 195 160 35 0.1791994 None nd nd nd nd 159 90 69 0.4341996 None 78 116 -38 -0.487 221 121 100 0.4521997 Modified 137 63 74 0.540 156 52 104 0.6671998 Modified 136 73 63 0.463 nd nd nd nd
Little Goose1993 Original 153 304 -151 -0.987 152 187 -35 -0.2301994 Modified nd nd nd nd 148 23 125 0.8451997 Modified 113 66 47 0.410 176 63 113 0.6421998 Modified nd nd nd nd nd nd nd nd
Lower Monumental1993 None 544 618 -74 -0.136 509 529 -20 -0.0391994 None nd nd nd nd 371 350 21 0.0571996 None nd nd nd nd nd nd nd nd1997 None 170 161 9 0.053 229 157 72 0.3141998 None nd nd nd nd nd nd nd nd
Ice Harbor1993 None 259 386 -127 -0.490 369 625 -256 -0.6941994 None nd nd nd nd 126 149 -23 -0.1831996 None 42* 34 8 0.190 nd nd nd nd199 None 67 90 -23 -0.343 94 161 -67 -0.713
1998 None 35 116 -81 -2.314 nd nd nd nd *Entrances not monitored after 12 July 1996

with transmitters were monitored during1993, 1996, 1997, and 1998 (Figure 8).Steelhead with transmitters weremonitored at Lower Granite Dam during1993, 1994, and 1996 (Figure 9).
In 1981, hourly up and down countsaveraged 8.65/h and 8.46/h for a net entryrate of 0.022 (Figure 8). Net entry ratesfor chinook salmon at NPE1+2 were 0.051in 1993, (448 entries, 425 exits) and-0.487 in 1996 (78 entries, 116 exits)(Figure 8, Table 2). For steelhead, netentry rates at NPE1+2 without a fishwayfence were 0.179 in 1993 (195 entries,160 exits), 0.434 in 1994 (159 entries and90 exits), and 0.452 in 1996 (221 entriesand 121 exits) (Figure 9, Table 2).
With the original fishway fence in placein 1991 and 1992, net entry rates werenegative at NPE1+2 for both chinooksalmon (-0.461 and -29.0) and steelhead(-0.647 and -0.360) (Figures 8 and 9,Table 2).
With the modified fishway fence inplace in 1997, chinook salmon withtransmitters had a net entry rate of 0.540at NPE1+2 (137 entries and 63 exits)(Table 2, Figure 8). Steelhead withtransmitters had a net entry rate of 0.667at the two entrances combined (156entries and 52 exits) (Table 2, Figure 9).
Entries Per Fish
We determined the number of entriesand exits made by each salmon andsteelhead with transmitters as they passedthe Snake River dams. In this section wereport the number of entries made per fishwith respect to fishway fence treatment.In general, most fish that entered afishway eventually passed the respectivedam, so the average number of exits per
fish was one less than the number ofentries.
Without the fishway fence in place atLower Granite Dam, 306 chinook salmonmade 1,324 entries to the fishway, or 4.3entries per fish in 1993, and 105 chinooksalmon made 568 entries, or 5.4 entriesper fish in 1996 (Table 3, Appendix A).For steelhead, entries per fish without thefishway fence in place were 2.6 in 1993(734 entries by 284 fish), 2.2 in 1994 (513entries by 239 fish), and 2.6 in 1996 (675entries by 257 fish).
With the original fence in place at LittleGoose Dam, there were 3.4 entries perfish (297 salmon) in 1993. With themodified fishway fence in place in 1997,there were 2.04 entries per fish by 329salmon. With the original fence in place in1993, there were 3.1 entries per fish madeby 292 steelhead, similar to the 3.3 entriesper fish made by 253 steelhead in 1994with the modified fishway fence in place(Table 3). Only NPEs were monitored atLower Granite Dam in 1997 with themodified fishway in place, so the totalnumber of entries could not bedetermined.
Spill for Adult Passage
Dam Counts
With spill, 27.2% of fall chinook salmonwere counted at Ice Harbor Dam at thenorth-shore ladder, as compared to 17.8%that were counted at the north-shoreladder on days without spill in 1994(ANOVA P = 0.0153) (Table 4). Duringthe 15 replicate blocks used in analysis(Appendix B), spill averaged 0.7 kcfs,about 5% of river flow on days with spill(Table 4).
Page 14

Page 15
��������������������������������
���������������������������
���������������������������������������� �������� ���������
���������������������������
����������
������������������������������
���������������������� ��������
������������������
������������������������������ �������
���������������������
������������������������������������
SSE1+2 OG-1 OG-4 OG-7 OG-10 NPE1+2 NPE-3 NSE-1
-0.5
0
0.5
1
SSE-1 SSE-2 OG-1 OG-4 OG-7 OG-10 NPE1+2 NPE-3 NSE UNK-1
-0.5
0
0.5
1
SSE-1 SSE-2 OG-1 OG-4 OG-7 OG-10 NPE1+2 NPE-3 NSE UNK-1
-0.5
0
0.5
1
������������������������������
��������������������������������
���������������������������������������������������
������������������������������������������������������������������������
������������������������������������������������������������������������ ���������������
���������������
������������������������������������������������
����������������������������������
SSE1+2 OG-1 OG-4 OG-7 OG-10 NPE1+2 NPE-3 NSE-0.5
0
0.5
1
1.5 SSE1+2 OG-1 OG-4 OG-7 OG-10 NPE1+2 NPE-3 NSE
-0.5
0
0.5
1
1.5
ND ND
ND
NPE1+2 NPE-3 UNK-0.5
0
0.5
1
1.5
1996 - No FenceRadio Telemetry
Spring 1991 - Original FenceElectronic Count Tunnels
Spring 1981 - No FenceElectronic Count Tunnels
1992 - Original FenceElectronic Tunnels and Video Counts
1993 - No FenceRadio Telemetry
1997 - Modified FenceRadio Telemetry
(Ent
rie
s -
exi
ts)
/ E
ntri
es
Me
an h
our
ly
(Up
co
unts
- d
own
cou
nts)
/ U
p co
unts
ND
ND
ND
-1.134
Me
dia
n da
ily
(Up
co
unts
- d
own
cou
nts)
/ U
p co
unts
Closed
0.563
��������������������
No fishway fence
Original fishway fence
Modified fishway fence
-13.7 -29.0
306 fish
105 fish
357 fish
NPE1+2 NPE-3 UNK
239 fish
1998 - Modified FenceRadio Telemetry
Closed
Figure 8. Net entry rates for chinook salmon at Lower Granite Dam for sevenseparate tests. SSEs are south-shore entrances, OGs are orifice gates, NPEs arenorth-powerhouse entrances, NSEs are north-shore entrances, UNK are unknown, andND indicates no data were collected for an entrance that year. Only NPEs weremonitored during 1997 and 1998.

Page 16
Figure 9. Net entry rates for steelhead at Lower Granite Dam for six separate tests. SSEs are south-shore entrances, OGs are orifice gates, NPEs are north-powerhouseentrances, NSEs are north-shore entrances, UNK are unknown, and ND indicates nodata were collected for an entrance that year.
SSE-1 SSE-2 OG-1 OG-4 OG-7 OG-10 NPE1+2 NPE-3 NSE UNK-1
-0.5
0
0.5
1
SSE-1 SSE-2 OG-1 OG-4 OG-7 OG-10 NPE1+2 NPE-3 NSE UNK-1
-0.5
0
0.5
1
SSE-1 SSE-2 OG-1 OG-4 OG-7 OG-10 NPE1+2 NPE-3 NSE UNK-1
-0.5
0
0.5
1
������������������������������������������������������������������������
������������������������������������������������������������
����������������������������������������������������������������
���������������������������������������������������
������������������������������������������������������
��������������������������������������������� �����������������
�����������������
��������������������������������������������������������������������
������������������������������������������ ����������������
SSE-1 SSE-2 OG-1 OG-4 OG-7 OG-10 NPE1+2 NPE-3 NSE UNK-1
-0.5
0
0.5
1
������������������������������
���������������������������������������������������
���������������������������������������������������������
������������������������������������������������
��������������������������������������������������� ���������������
������������������������������
���������������������������������������������������
������������������������������������
SSE1+2 OG-1 OG-4 OG-7 OG-10 NPE1+2 NPE-3 NSE
-0.5
0
0.5
1
SSE-1 SSE-2 OG-1 OG-4 OG-7 OG-10 NPE1+2 NPE-3 NSE UNK-0.5
0
0.5
1
1.5
1996 - No FenceRadio Telemetry
Fall 1992 - Original FenceRadio Telemetry
Fall 1991 - Original FenceElectric Count Tunnels
1993 - No FenceRadio Telemetry
1994 - No FenceRadio Telemetry
1997 - Modified FenceRadio Telemetry
(Ent
ries
- e
xits
) / E
ntri
esM
ean
hour
ly
(Up
coun
ts -
dow
n co
unts
) /
Up
coun
ts
ND
-0.304
ND ND ND ND ClosedND ND ND
0.433
Closed
��������������
No fishway fence
Original fishway fence
Modified fishway fence
-1.74
-1.22 -3.0
319 fish
284 fish
239 fish
257 fish
273 fish

For steelhead at Ice Harbor Dam, 9.8%were counted at the north-shore ladder ondays with spill and 8.2% without spill (P =0.0918). Spill levels averaged 0.7 kcfsduring 22 replicate blocks used in thesteelhead analysis (Table 4).
At Lower Monumental Dam, chinooksalmon counts were analyzed for 16replicate blocks with spill averaging 0.8kcfs, or about 5% of river flow on the dayswater was spilled. With spill, 24.0% of thechinook salmon at Lower MonumentalDam were counted at the south-shoreladder as compared to 17.7% that werecounted at the south-shore ladder on dayswithout spill (ANOVA P = 0.0449, Table4).
At Lower Monumental Dam, 31.5% ofthe steelhead were counted at thesouth-shore ladder on days with spill and23.2% were counted on days without spill(P = 0.0015). Spill averaged 0.8 kcfsduring 18 replicate blocks.
Telemetry Data
A total of 243 steelhead withtransmitters were recorded at Ice HarborDam during the spill test in 1994, 191 ofwhich we could determine total time topass the dam. Of those 191 fish, 139were included in analysis of time to passthe dam, 62 with spill and 77 without spillduring 10 replicate blocks (Appendix C).
Page 17
Table 3. Entries per fish for adult spring/summer chinook and steelhead withtransmitters at the Snake River dams that had full antenna coverage of the fishwayentrances in 1992-1998. No data = nd. Dam Fishway Spring/summer chinook Steelhead Year fence Fish Entries/fish Fish Entries/fishLower Granite
1992 Original nd nd 319 2.01993 None 306 4.3 284 2.61994 None nd nd 239 2.21996 None 105 5.4 257 2.6
Little Goose1993 Original 297 3.4 292 3.11994 Modified nd nd 253 3.31997 Modified 329 2.04 nd nd
Lower Monumental1993 None 310 5.0 337 3.71994 None nd nd 272 3.4
Ice Harbor1993 None 340 3.4 366 5.81994 None nd nd 287 3.21996 None nd nd nd nd1997 None 308 2.1 389 2.3
1998 None 247 1.9 nd nd

Median times for steelhead withtransmitters to pass Ice Harbor Dam were13.3 h with spill and 11.5 h without spill(ANOVA, P = 0.4373). Twenty-twosteelhead passed the dam using thenorth-shore ladder in median times of 28.4h with spill (n = 4 fish) and 10.5 h withoutspill (n = 18 fish) (Test of medians, P =0.2801). Of the 191 steelhead thatpassed the dam, 34 first approached atNSE, of which 6 eventually passed thedam using the north-shore ladder, 2 withspill and 4 without spill.
Of 221 steelhead with transmittersrecorded at Lower Monumental Damduring the spill test, we could determinetotal time to pass the dam for 148 fish. Ofthose 148 fish, 105 were included inanalysis of total time to pass the dam, 61with spill and 44 without spill during eightreplicate blocks (Appendix C). Mediantimes for steelhead with transmitters to
pass Lower Monumental Dam were 11.5 hwith spill and 16.7 h without spill (P =0.0774). Forty-six steelhead used thesouth-shore ladder to pass the dam inmedian times of 7.3 h with spill (24 fish)and 13.6 h without spill (22 fish) (Test ofmedians, P = 0.0798). Of the 148steelhead that passed the dam, 30 firstapproached at SSE and 18 of thosepassed the dam using the south-shoreladder, 8 with spill and 10 without spill.
Discussion
Fishway Fence Evaluation
Contrary to expectations, installation offishway fences in 1991 at Lower Graniteand Little Goose dams did not decreasethe number of fish (presumably salmon)that exited the fishways in the spring atNPE-1 and NPE-2 (north-powerhouseentrance), based on data from electronic
Page 18
Table 4. Number of replicate blocks, mean spill levels, and mean percent use ofspillway ladder and standard deviation (sd) for counts of fall chinook salmon andsteelhead at Ice Harbor and Lower Monumental dams during periods with and withoutspill during 1994.
Spill (kcfs) Spillway ladder useSpecies Blocks Treatment Mean sd Mean % sd
Ice Harbor Dam
Chinook 15 Spill 0.69 0.135 27.2* 16.1salmon No spill 0.0 - 17.8 13.9
Steelhead 22 Spill 0.68 0.049 9.8 4.6No spill 0.0 - 8.2 5.3
Lower Monumental Dam
Chinook 16 Spill 0.79 0.024 24.0* 12.8salmon No spill 0.0 - 17.7 7.8
Steelhead 18 Spill 0.80 0.033 31.5* 8.6No spill 0.0 - 23.2 7.3
*Denotes significant difference from no spill condition.

tunnels and video cameras (Knutsen andKnapp 1992; Knapp and Knutsen 1994).In 1991, exits from the fishways aboutequaled entries at the NPEs of both dams,the same as in 1981 when Turner et al.(1983) also used electronic tunnels toassess entries and exits of fish at theentrances of the fishways. In 1992, therewere 2.6 times more exits than entries inthe spring at the NPEs at Lower GraniteDam.
The original fishway fence installed in1991 did not reduce the number of falloutsfrom the NPEs as intended, but we werenot sure why until the fall of 1992. Afterwe installed the newly developed digitalspectrum processors (DSP) andunderwater antennas at the fishwayentrances of Lower Granite Dam in thesummer of 1992, we were able toefficiently monitor entries and exits ofsteelhead with transmitters for the firsttime. We found that more than half thesteelhead in the fall were moving bothupstream and downstream in the power-house collection channel. Fish movingdownstream were guided by the fence intothe NPE openings, the opposite of whatwas intended. In the fall of 1992, with theoriginal fishway fence in place at LowerGranite Dam, exits of steelhead withtransmitters exceeded entries (68 to 50) atNPE-1 and NPE-2.
Because the fishway fence did notseem to be effective at preventing fallouts,the fence was removed from the LowerGranite fishway during the wintermaintenance period of 1992-1993, but thefence at Little Goose Dam was left inplace. All of the dams were outfitted withDSP/SRX receivers for 1993 to monitormovements of fish with transmitters in thefishways. Because the fishways at LittleGoose and Lower Granite dams were
similar, we decided to compare falloutrates of salmon at the NPEs with andwithout a fence present. With the newtelemetry setups, we could obtain morereliable data than was available from theelectronic tunnels.
In 1993 with no fence in the LowerGranite Dam fishway, there were a fewmore entries than exits (448 to 425) bychinook salmon in the spring and summer,and by steelhead in the fall (195 to 160).At Little Goose Dam where the originalfence was still in the fishway, exits out-numbered entries 304 to 153 by chinooksalmon, and 187 to 152 by steelhead.
During the winter of 1993-1994, thefishway fence at Little Goose Dam wasmodified; a deflector was added at theupstream end. The modified fenceappeared to reduce the number of exits bysteelhead in the fall significantly at NPE-1and NPE-2 (23 exits versus 148 entries).Entries versus exits at NPE-3 were aboutthe same as in previous years (about 2 to1 more entries than exits). At NSE, thenorth-shore entrance, however, the falloutrate appeared to increase relative to 1993.At Lower Granite Dam, where no fencewas in place, entries by steelhead atNPE-1 and NPE-2 outnumbered exits 159to 90, a reversal of observation in previousyears. We did not put transmitters inchinook salmon in 1994, and in neitherchinook salmon or steelhead in 1995.
In 1996 we tagged chinook salmon andsteelhead at Bonneville Dam andmonitored passage of fish withtransmitters at Lower Granite Dam, whereno fence was in the fishway. For chinooksalmon, exits at NPE-1 and NPE-2 out-numbered entries 116 to 78. Entries out-numbered exits for steelhead (221 to 121)as they did in 1994.
Page 19

In 1997 both chinook salmon andsteelhead were tagged at Bonneville Dam,and fish with transmitters were monitoredat both Little Goose and Lower Granitedams. A modified fence was placed in thefishway at Lower Granite Dam prior to themigration season, so both dams hadmodified fences. At Little Goose Dam,only chinook salmon were monitored inthe spring at fishway entrances; entriesexceeded exits 113 to 66 at NPE-1 andNPE-2. At Lower Granite Dam in 1997,the first year with a modified fence in thefishway, entries outnumbered exits 137 to63 at NPE-1 and NPE-2 for chinooksalmon, and 156 to 52 for steelhead.Results were similar in 1998 with themodified fence in place, 136 entries and73 exits made at NPE-1 and NPE-2 bychinook salmon. Little Goose Dam wasnot monitored in 1998.
The pattern of more exits than entriesfrom NPEs when no fence was present tothe fishway was also observed at IceHarbor and Lower Monumental dams in1993 and 1994 (Bjornn et al. 1998b). AtIce Harbor Dam only one NPE was open,and steelhead had about 250 more exitsthan entries in 1993 but only about 20more in 1994. Chinook salmon had about120 more exits than entries at the NPE in1993. At Lower Monumental Dam twosouth-powerhouse entrances were openand exits slightly outnumbered entries forsteelhead in 1993, but the reverseoccurred in 1994. Exits by chinooksalmon exceeded entries by more than 70at the SPE (south-powerhouse entrances)in 1993.
Many of the fish that exited at theNPEs had initially reached the transitionpool at the base of the fish ladders, thenturned around and moved downstreamthrough the collection channels before
they exited into the tailrace. Of 50randomly selected salmon that exited atNPE-1 or NPE-2 at Lower Granite Dam in1993 (no fishway fence), 22 (44%) hadentered the transition pool area prior toexiting at the NPEs. Of the remaining 28fallouts, 22 had entered the collectionchannel, and then exited at NPE-1 orNPE-2 without leaving the collectionchannel. One of the 50 salmon exited at aNPE opening after entering at thenorth-shore entrance.
Steelhead usually had lower falloutrates, for unknow reasons, than chinooksalmon at all of the dams. Fallout rateswere reduced, however, for both salmonand steelhead when the modified fishwayfence was in place. Use of the modifiedfence to divert salmon and steelheadaway from the NPEs did not appear toincrease fallout rates at the otherentrances, with the possible exception ofsteelhead at Little Goose Dam in 1993(NSE fallouts were high).
Modified fishway fences at LowerGranite and Little Goose dams reducedthe number of fishway fallouts by salmonand steelhead at the north powerhouseentrances, but did the reduction in falloutsimprove passage at the dams? Thisquestion is more difficult to answerbecause of a lack of comparable databetween years at both dams. Forexample, chinook salmon made anaverage of 4.3 entries per fish at allentrances in 1993 and 5.4 entries in 1996before eventually passing Lower GraniteDam when there was no fishway fence. In1997 when a modified fence was presentat Lower Granite Dam, we did not haveenough receivers to monitor all entrancesso we could not calculate the total numberof entries per fish.
Page 20

Entries-per-fish data for Little GooseDam were an indication that the modifiedfence may have improved passage forchinook salmon. Chinook salmon madean average of 3.4 entries per fish in 1993with the original fishway fence, and 2.0entries per fish in 1997 with the modifiedfishway fence. However, orifice gates atLittle Goose Dam were not monitored in1997, so the total number of entries madecan only be estimated.
Steelhead, on the other hand,averaged 2.0 to 3.3 entries per fish at bothdams with original, modified, or no fences.In 1994 at Little Goose Dam, the first yearwith the modified fishway fence, we foundthat exits were reduced at NPE-1 andNPE-2, but there was a higher rate offallout at NSE, when compared to whatwas observed in 1993 with the originalfence. Perhaps some fish that would haveexited at NPE-1 and NPE-2 continuedmoving downstream in the fishway toNSE, an explanation for the lack ofchange in entries per fish between the twoyears.
But do fewer fallouts from the fishwaysequate to faster passage times forsalmon? Median passage times forchinook salmon at Little Goose Dam were14.4 h in 1993 with the original fence, and23.0 h in 1997 with the modified fence.Flows in the Snake River were muchhigher in 1997 than in 1993 and that mayaccount for some of the increasedpassage time in 1997. At Lower GraniteDam, however, median passage time forchinook salmon in 1997 was 24.7 h, lowerthan both 1993 (27.6 h) and 1996 (38.1 h)despite the flows in 1997 that were higherthan either of the two prior years.
The final test of the effects of falloutson the passage of adult salmon and
steelhead is the cumulative effects offallouts at all of the dams the fish mustpass on their survival and time to passthrough the reach of interest. In otherstudies (Bjornn et al. 1998a), chinooksalmon that took longer than the mediantime to migrate past the Snake River damswere less likely to reach spawninggrounds, but it was not clear why. Also,steelhead that turned around in transitionpools at the base of fish ladders andexited the fishways took longer to pass anindividual dam, but that delay was notevident in time to pass all four dams(Bjornn et al. 1998c).
Peery et al. (1998) evaluated theeffectiveness of a fishway fence at thedownstream end of the powerhousecollection channel at Priest Rapids Dam in1997. They found that the fence did notreduce the number of fallouts by chinooksalmon at the main entrance at the end ofthe collection channel. Size of thecollection channel, length of the fence,and design of the diversion section werepossible factors in the poor performanceof the fence.
Additional data has been collected in1996-1998 and will be available toevaluate further the efficacy of fishwayfences and the effects of fallout at thedams on passage time and survival.However, definitive information will not beavailable until adequate numbers of adultsof known origin (through identifying markssuch as PIT tags) can be tagged andmonitored as they migrate upstream.
Spill for Adult Passage
Spills of about 5% of late summer flowthrough the spillbays near the north-shorefishway at Ice Harbor Dam or south-shorefishway at Lower Monumental Dam were
Page 21

sufficient to attract some salmon andsteelhead to those fishways that otherwisewould have passed over the dam via theopposite sides of the river, based onanalysis of count data. In three of the fourtests performed, chinook salmon at IceHarbor Dam and chinook salmon andsteelhead at Lower Monumental Dam,counts in the fishway adjacent to thespillway in the fall increased when about5% of river flow was spilled through baysnext to the fishway. For steelhead at IceHarbor Dam, counts in the north-shoreladder were higher on days with spill, butthe increase was not significant (P > 0.09).
There was no clear evidence that lowlevels of spill effected passage times.Median times for steelhead withtransmitters to pass the dams were higherat Ice Harbor Dam and lower at LowerMonumental Dam during periods with spill,and in either case the differences were notsignificant. This was probably becauserelatively few fish passed the dams usingthe spillway fishways during periods whenspill occurred. Only 4 (2%) of 191steelhead with complete times to pass IceHarbor Dam used the north-shore fishwayduring periods with spill, and 22 (15%) of148 fish with times to pass LowerMonumental Dam used the south-shorefishway during spill periods.
Page 22

References
Bjornn, T. C., R. R. Ringe, K. R. Tolotti, P. J. Keniry, and J. P. Hunt. 1992. Migration ofadult chinook salmon and steelhead past dams and through reservoirs in thelower Snake River and into tributaries - 1991. Idaho Cooperative Fish andWildlife Research Unit, University of Idaho, Moscow, for U.S. Army Corps ofEngineers, Walla Walla District, Walla Walla, Washington, and Bonneville PowerAdministration, Portland, Oregon.
Bjornn, T. C., J. P. Hunt, K. R. Tolotti, P. J. Keniry, and R. R. Ringe. 1994. Migration ofadult chinook salmon and steelhead past dams and through reservoirs in thelower Snake River and into tributaries - 1992. Idaho Cooperative Fish andWildlife Research Unit, University of Idaho, Moscow, for U.S. Army Corps ofEngineers, Walla Walla District, Walla Walla, Washington, and Bonneville PowerAdministration, Portland, Oregon.
Bjornn, T. C., J. P. Hunt, K. R. Tolotti, P. J. Keniry, and R. R. Ringe. 1995. Migration ofadult chinook salmon and steelhead past dams and through reservoirs in thelower Snake River and into tributaries - 1993. Idaho Cooperative Fish andWildlife Research Unit, University of Idaho, Moscow, for U.S. Army Corps ofEngineers, Walla Walla District, Walla Walla, Washington, and Bonneville PowerAdministration, Portland, Oregon.
Bjornn, T. C., K. R. Tolotti, J. P. Hunt, P. J. Keniry, R. R. Ringe, and C.A. Peery.1998a. Passage of chinook salmon through the lower Snake River anddistribution into the tributaries, 1991-1993. Part I of final report for: Migration ofadult chinook salmon and steelhead past dams and through reservoirs in thelower Snake River and into tributaries. Idaho Cooperative Fish and WildlifeResearch Unit, University of Idaho, Moscow, for U.S. Army Corps of Engineers,Walla Walla District, Walla Walla, Washington, and Bonneville PowerAdministration, Portland, Oregon.
Bjornn, T. C., J. P. Hunt, K. R. Tolotti, P. J. Keniry, and R. R. Ringe. 1998b. Entrancesused and passage through fishways for adult chinook salmon and steelhead,Part III of final report for: Migration of adult chinook salmon and steelhead pastdams and through reservoirs in the lower Snake River and into tributaries. IdahoCooperative Fish and Wildlife Research Unit, University of Idaho, Moscow, forU.S. Army Corps of Engineers, Walla Walla District, Walla Walla, Washington,and Bonneville Power Administration, Portland, Oregon.
Page 23

Bjornn, T. C., J. P. Hunt, K. R. Tolotti, P. J. Keniry, and R. R. Ringe. 1998c.Movements of steelhead in fishways in relation to transition pools. Part V of finalreport for: Migration of adult chinook salmon and steelhead past dams andthrough reservoirs in the lower Snake River and into tributaries. IdahoCooperative Fish and Wildlife Research Unit, University of Idaho, Moscow, forU.S. Army Corps of Engineers, Walla Walla District, Walla Walla, Washington,and Bonneville Power Administration, Portland, Oregon.
Knapp, S. M., and C. J. Knutsen. 1994. Evaluation of passage of adult salmon andsteelhead at Lower Granite Dam and of electronic and underwater videotechnologies as passage evaluation methods. Oregon Department of Fish andWildlife for U.S. Army corps of Engineers, Walla Walla District, Walla Walla,Washington, and Bonneville Power Administration, Portland, Oregon.
Knutsen, C. J., and S. M. Knapp. 1992. Adult salmon use at fishway entrances basedon electronic tunnels and evaluation of the fishway fences at Little Goose andLower Granite dams - 1991. Oregon Department of Fish and Wildlife for U.S.Army Corps of Engineers, Walla Walla District, Walla Walla, Washington, andBonneville Power Administration, Portland, Oregon.
Peery, C. A., T. C. Bjornn, and K. R. Tolotti. 1998. Evaluation of adult chinook andsockeye salmon passage at Priest Rapids and Wanapum dams - 1997. IdahoCooperative Fish and Wildlife Research Unit, University of Idaho, Moscow, forThe Public Utility District of Grant County, Ephrata, Washington.
Turner, A. R., Jr., J. R. Kuskie, Jr., and K. E. Kostow. 1983. Evaluation of adult fishpassage at Little Goose and Lower Granite dams - 1981. U.S. Army Corps ofEngineers, Portland District, Portland, Oregon.
Page 24

Appendix A
Summary of chinook salmon and steelhead entrance-use data used for
evaluation of fishway fences at Little Goose and Lower Granite dams,
1981-1998.
Page 25

Page 26
1997 - Modified fishw ay fence - Radio telemetryNumber of fish w ith entries = 329
Net Net Entry RateEntrance Entries Exits (Ent. - Ex.) (Net/Entries)NSE 271 90 181 0.668NPE-3 closedNPE-2 60 21 39 0.650NPE-1 53 45 8 0.151NPE-1+2 113.00 66.00 47.00 0.416OG-10 ndOG-6 ndOG-4 ndOG-1 ndSSE 174 84 90 0.517Unknow n 114 84 30 0.263TOTAL 672 324 348 0.518PER FISH 2.04 0.98 1.06
Little Goose Dam - Chinook Salm on Little Goose Dam - Steelhead
1981 - No fishw ay fence - Mean hourly tunnel counts 1991 - Original fishw ay fence - Mean hourly tunnel counts
Up Dow n Net Net Entry Rate Up Dow n Net Net Entry RateEntrance counts counts (Up - Dow n) (Net/Up) Entrance counts counts (Up - Dow n) (Net/Up)NSE 3.75 0.47 3.28 0.875 NSE 10.23 22.10 -11.87 -1.160NPE-3 nd NPE-3 24.11 6.37 17.74 0.736NPE-2 2.72 2.70 0.02 0.007 NPE-2 7.08 7.96 -0.88 -0.124NPE-1 4.04 2.64 1.40 0.347 NPE-1 3.76 6.38 -2.62 -0.697NPE-1+2 6.76 5.34 1.42 0.210 NPE-1+2 10.84 14.34 -3.50 -0.323OG-10 2.08 0.29 1.79 0.861 OG-10 2.79 1.25 1.54 0.552OG-6 1.16 0.14 1.02 0.879 OG-6 2.77 1.32 1.45 0.523OG-4 0.80 0.29 0.51 0.638 OG-4 3.60 1.87 1.73 0.481OG-1 3.08 0.26 2.82 0.916 OG-1 5.69 1.39 4.30 0.756SSE 9.04 5.66 3.38 0.374 SSE 70.34 32.70 37.64 0.535TOTAL 26.67 12.45 15.64 0.586 TOTAL 130.37 81.34 49.03 0.376
1991 - Original fishw ay fence - Mean hourly tunnel counts 1993 - Original fishw ay fence - Radio telemetryNumber of fish w ith entries = 292
Up Dow n Net Net Entry Rate Net Net Entry RateEntrance counts counts (Up - Dow n) (Net/Up) Entrance Entries Exits (Ent. - Ex.) (Net/Up)NSE 5.61 5.63 -0.02 -0.004 NSE 39 109 -70 -1.795NPE-3 2.52 1.82 0.70 0.278 NPE-3 100 42 58 0.580NPE-2 1.39 2.37 -0.98 -0.705 NPE-2 93 115 -22 -0.237NPE-1 2.96 2.83 0.13 0.044 NPE-1 59 72 -13 -0.220NPE-1+2 4.35 5.20 -0.85 -0.195 NPE-1+2 152.00 187.00 -35.00 -0.230OG-10 3.29 0.41 2.88 0.875 OG-10 50 45 5 0.100OG-6 1.94 0.33 1.61 0.830 OG-6 68 19 49 0.721OG-4 1.74 0.46 1.28 0.736 OG-4 41 23 18 0.439OG-1 2.54 2.86 -0.32 -0.126 OG-1 80 28 52 0.650SSE 16.92 11.89 5.03 0.297 SSE 329 134 195 0.593TOTAL 38.91 28.60 10.31 0.265 Unknow n 35 13 22 0.629
TOTAL 894 600 294 0.329PER FISH 3.06 2.05 1.01
1993 - Original fishw ay fence - Radio telemetry 1994 - Modified fishw ay fence - Radio telemetryNumber of fish w ith entries = 297 Number of fish w ith entries = 253
Net Net Entry Rate Net Net Entry RateEntrance Entries Exits (Ent. - Ex.) (Net/Entries) Entrance Entries Exits (Ent. - Ex.) (Net/Entries)NSE 214 64 150 0.701 NSE 30 124 -94 -3.133NPE-3 10 6 4 0.400 NPE-3 122 66 56 0.459NPE-2 78 146 -68 -0.872 NPE-2 80 10 70 0.875NPE-1 75 158 -83 -1.107 NPE-1 68 13 55 0.809
NPE-1+2 153.00 304.00 -151.00 -0.987 NPE-1+2 148.00 23.00 125.00 0.845OG-10 19 15 4 0.211 OG-10 26 31 -5 -0.192OG-6 21 5 16 0.762 OG-6 44 22 22 0.500OG-4 9 2 7 0.778 OG-4 23 13 10 0.435OG-1 60 8 52 0.867 OG-1 30 8 22 0.733SSE 443 240 203 0.458 SSE 386 256 130 0.337Unknow n 79 60 19 0.241 Unknow n 26 39 -13 -0.500TOTAL 1008 704 304 0.302 TOTAL 835 582 253 0.303PER FISH 3.39 2.37 1.02 PER FISH 3.30 2.30 1.00

Page 27
1996 - No fishw ay fence - Radio telemetryNumber of fish w ith entries = 105
Net Net Entry RateEntrance Entries Exits (Ent.-Ex.) (Net/Entries)NSE 118 38 80 0.678NPE-3 2 1 1 0.500NPE-2 35 31 4 0.114NPE-1 43 85 -42 -0.977NPE-1+2 78.00 116.00 -38.00 -0.487OG-10 15 19 -4 -0.267OG-7 13 2 11 0.846OG-4 11 2 9 0.818OG-1 50 11 39 0.780SSE-2 132 89 43 0.326SSE-1 45 77 -32 -0.711Unknow n 104 114 -10 -0.096TOTAL 568 469 99 0.174PER FISH 5.41 4.47 0.94
1997 - Modified fishw ay fence - Radio telemetryNumber of fish w ith entries = 357
Net Net Entry RateEntrance Entries Exits (Ent.-Ex.) (Net/Entries)NSE ndNPE-3 closedNPE-2 74 32 42 0.568NPE-1 63 31 32 0.508NPE-1+2 137.00 63.00 74.00 0.540OG's ndSSE's ndUnknow n 366 83 283 0.773TOTAL 503 146 357 0.710PER FISH 1.41 0.41 1.00
Low er Granite Dam - Chinook Salm onLow er Granite Dam - Chinook Salm on
1981 - No fishw ay fence - Mean hourly tunnel counts
Up Dow n Net Net Entry RateEntrance counts counts (Up - Dow n) (Net/Up)NSE 16.42 8.00 8.42 0.513NPE-3 ndNPE-2 4.95 4.75 0.20 0.040NPE-1 3.70 3.71 -0.01 -0.003NPE-1+2 8.65 8.46 0.19 0.022OG-10 2.63 1.02 1.61 0.612OG-7 1.09 0.29 0.80 0.734OG-4 1.22 0.59 0.63 0.516OG-1 1.74 0.87 0.87 0.500SSE1 + 2 20.07 12.93 7.14 0.356TOTAL 51.82 32.16 19.66 0.379
1991 - Original fishw ay fence-Mean hourly tunnel counts
Up Dow n Net Net Entry RateEntrance counts counts (Up - Dow n) (Net/Up)NSE 23.18 14.59 8.59 0.371NPE-3 3.73 1.38 2.35 0.630NPE-2 3.73 5.19 -1.46 -0.391NPE-1 1.97 3.14 -1.17 -0.594NPE-1+2 5.70 8.33 -2.63 -0.461OG-10 4.79 0.97 3.82 0.797OG-7 3.99 0.65 3.34 0.837OG-4 3.11 1.58 1.53 0.492OG-1 1.93 2.45 -0.52 -0.269SSE1+2 7.91 9.96 -2.05 -0.259TOTAL 54.34 39.91 14.43 0.266
1992 - Original fishw ay fence - Mean daily video counts
Up Dow n Net Net Entry RateEntrance counts counts (Up - Dow n) (Net/Up)NSE 167.24 23.50 143.74 0.859NPE-3 ndNPE-2 2.00 92.00 -90.00 -45.000NPE-1 2.00 28.00 -26.00 -13.000NPE-1+2 4.00 120.00 -116.00 -29.000OG-10 ndOG-7 17.50 9.17 8.33 0.476OG-4 5.25 4.50 0.75 0.143OG-1 32.17 36.33 -4.16 -0.129SSE1+2 42.96 28.00 14.96 0.348TOTAL 269.12 221.50 47.62 0.177
1993 - No fishw ay fence - Radio telemetryNumber of fish w ith entries = 306
Net Net Entry RateEntrance Entries Exits (Ent.-Ex.) (Net/Entries)NSE 128 87 41 0.320NPE-3 18 7 11 0.611NPE-2 273 197 76 0.278NPE-1 175 228 -53 -0.303NPE-1+2 448.00 425.00 23.00 0.051OG-10 45 31 14 0.311OG-7 29 5 24 0.828OG-4 35 8 27 0.771OG-1 108 15 93 0.861SSE-2 277 102 175 0.632SSE-1 137 273 -136 -0.993Unknow n 99 60 39 0.394TOTAL 1324 1013 311 0.235PER FISH 4.33 3.31 1.02

Page 28
Low er Granite Dam - Steelhead Low er Granite Dam - Steelhead
1991 - Original fishw ay fence - Mean hourly tunnel counts 1994 - No fishw ay fence - Radio telemetryNumber of fish w ith entries = 239
Up Dow n Net Net Entry Rate Net Net Entry RateEntrance counts counts (Up - Dow n) (Net/Up) Entrance Entries Exits (Ent.-Ex.) (Net/Entries)NSE 30.73 24.05 6.68 0.217 NSE 4 16 -12 -3.000NPE-3 13.82 4.75 9.07 0.656 NPE-3 50 19 31 0.620NPE-2 6.51 8.86 -2.35 -0.361 NPE-2 89 61 28 0.315NPE-1 3.10 6.97 -3.87 -1.248 NPE-1 70 29 41 0.586NPE-1+2 9.61 15.83 -6.22 -0.647 NPE-1+2 159.00 90.00 69.00 0.434OG-10 3.43 1.40 2.03 0.592 OG-10 16 16 0 0.000OG-7 3.75 1.21 2.54 0.677 OG-7 11 5 6 0.545OG-4 10.91 2.72 8.19 0.751 OG-4 34 8 26 0.765OG-1 4.38 1.37 3.01 0.687 OG-1 27 5 22 0.815SSE1+2 25.43 14.20 11.23 0.442 SSE-2 80 20 60 0.750TOTAL 102.06 65.53 36.53 0.358 SSE-1 18 40 -22 -1.222
Unknow n 114 60 54 0.4741992 - Original fishw ay fence - Radio telemetry TOTAL 513 279 234 0.456Number of fish w ith entries = 319 PER FISH 2.15 1.17 0.98
Net Net Entry RateEntrance Entries Exits (Ent.-Ex.) (Net/Entries) 1996 - No fishw ay fence - Radio telemetryNSE 83 25 58 0.699 Number of fish w ith entries = 257NPE-3 85 4 81 0.953 Net Net Entry RateNPE-2 13 20 -7 -0.538 Entrance Entries Exits (Ent.-Ex.) (Net/Entries)NPE-1 37 48 -11 -0.297 NSE 7 11 -4 -0.571NPE-1+2 50.00 68.00 -18.00 -0.360 NPE-3 closedOG-10 11 3 8 0.727 NPE-2 106 45 61 0.575OG-7 14 6 8 0.571 NPE-1 115 76 39 0.339OG-4 11 5 6 0.545 NPE-1+2 221.00 121.00 100.00 0.452OG-1 45 8 37 0.822 OG-10 12 2 10 0.833SSE-2 190 17 173 0.911 OG-7 4 3 1 0.250SSE-1 14 38 -24 -1.714 OG-4 18 4 14 0.778Unknow n 126 105 21 0.167 OG-1 18 2 16 0.889TOTAL 629 279 350 0.556 SSE-2 234 29 205 0.876PER FISH 1.97 0.87 1.10 SSE-1 64 86 -22 -0.344
Unknow n 97 154 -57 -0.5881993 - No fishw ay fence - Radio telemetry TOTAL 675 412 263 0.390Number of fish w ith entries = 284 PER FISH 2.63 1.60 1.02
Net Net Entry RateEntrance Entries Exits (Ent.-Ex.) (Net/Entries) 1997 - Modified fishw ay fence - Radio telemetryNSE 24 39 -15 -0.625 Number of fish w ith entries = 273NPE-3 122 36 0.000 Net Net Entry RateNPE-2 105 93 12 0.114 Entrance Entries Exits (Ent.-Ex.) (Net/Entries)NPE-1 90 67 23 0.256 NSE ndNPE-1+2 195.00 160.00 35.00 0.179 NPE-3 closedOG-10 29 31 -2 -0.069 NPE-2 77 27 50 0.649OG-7 26 11 15 0.577 NPE-1 79 25 54 0.684OG-4 28 7 21 0.750 NPE-1+2 156.00 52.00 104.00 0.667OG-1 44 14 30 0.682 OG-10 ndSSE-2 191 51 140 0.733 OG-7 ndSSE-1 66 97 -31 -0.470 OG-4 ndUnknow n 9 6 3 0.333 OG-1 ndTOTAL 734 452 282 0.384 SSE-2 ndPER FISH 2.58 1.59 0.99 SSE-1 nd
Unknow n 225 60 165 0.733TOTAL 381 112 269 0.706PER FISH 1.40 0.41 0.99

Appendix B
Summary of daily flow, spill, and chinook salmon and steelhead ladder counts used
for spill-for-adult-passage tests at Ice Harbor and Lower Monumental dams,
fall 1994.
Page 29

Page 30
Ice Harbor Dam 1994 Fall chinook salm on SteelheadFlow Spill Ladder counts Ladder counts
Date (kcfs) (kcfs)% SpillTreatm ent Block South North Total % North Treatm ent Block South North Total % North16-Sep-94 12.52 0 0 No spill . 44 6 50 0.12 0 1 592 56 648 0.086417-Sep-94 12.71 0 0 No spill 1 24 25 49 0.5102 0 1 781 66 847 0.077918-Sep-94 13.27 0.67 5.049 Spill 1 22 32 54 0.5926 Spill 1 604 59 663 0.08919-Sep-94 13.15 0.68 5.171 Spill 2 17 32 49 0.6531 Spill 2 400 59 459 0.128520-Sep-94 13.41 0 0 No spill 2 20 13 33 0.3939 0 2 800 109 909 0.119921-Sep-94 10.59 0 0 No spill . . . . 0 3 547 158 705 0.224122-Sep-94 15.09 0.69 4.573 Spill 3 42 13 55 0.2364 Spill 3 456 91 547 0.166423-Sep-94 17.89 0 0 No spill 3 48 13 61 0.2131 0 4 830 58 888 0.065324-Sep-94 13.86 0.71 5.123 Spill 4 66 16 82 0.1951 Spill 4 587 84 671 0.125225-Sep-94 11.97 0.68 5.681 Spill 4 48 13 61 0.2131 Spill 5 737 65 802 0.08126-Sep-94 13.23 0 0 No spill 4 78 10 88 0.1136 0 5 624 44 668 0.065927-Sep-94 14.13 0.68 4.812 Spill 5 28 6 34 0.1765 Spill 6 420 60 480 0.12528-Sep-94 13.22 0 0 No spill 5 47 10 57 0.1754 0 6 559 98 657 0.149229-Sep-94 12.33 0.66 5.353 Spill 6 24 11 35 0.3143 Spill 7 796 98 894 0.109630-Sep-94 10.35 0 0 No spill 6 59 8 67 0.1194 0 7 911 94 1005 0.093501-Oct-94 11.8 0 0 No spill 7 32 10 42 0.2381 0 8 556 120 676 0.177502-Oct-94 11.3 0.7 6.195 Spill 7 62 17 79 0.2152 Spill 8 816 64 880 0.072703-Oct-94 10.5 0 0 No spill 8 35 11 46 0.2391 0 9 810 80 890 0.089904-Oct-94 11.4 0.7 6.14 Spill 8 24 8 32 0.25 Spill 9 500 131 631 0.207605-Oct-94 11.6 0 0 No spill 9 25 6 31 0.1935 0 10 752 151 903 0.167206-Oct-94 12.6 0.7 5.556 Spill 9 29 6 35 0.1714 Spill 10 654 155 809 0.191607-Oct-94 15.1 0 0 No spill 10 22 1 23 0.0435 0 11 655 48 703 0.068308-Oct-94 15.5 0.7 4.516 Spill 10 37 31 68 0.4559 Spill 11 536 82 618 0.132709-Oct-94 12.9 0 0 No spill 11 24 7 31 0.2258 0 12 673 28 701 0.039910-Oct-94 12.9 0.7 5.426 Spill 11 25 7 32 0.2188 Spill 12 952 71 1023 0.069411-Oct-94 17.1 0 0 No spill 12 14 2 16 0.125 0 13 1130 49 1179 0.041612-Oct-94 16.4 0.7 4.268 Spill 12 25 6 31 0.1935 Spill 13 1036 53 1089 0.048713-Oct-94 19.7 0 0 No spill . 18 1 19 0.0526 0 14 977 101 1078 0.093714-Oct-94 18.4 0.7 3.804 Spill . . . 0 Spill 14 863 97 960 0.10115-Oct-94 20.5 0 0 No spill . 8 . 8 0 0 15 1246 40 1286 0.031116-Oct-94 29 0.7 2.414 Spill 13 17 1 18 0.0556 Spill 15 838 61 899 0.067917-Oct-94 22.7 0.7 3.084 Spill 13 10 5 15 0.3333 Spill 16 800 61 861 0.070818-Oct-94 26.4 0 0 No spill 13 11 1 12 0.0833 0 16 1006 43 1049 0.04119-Oct-94 21.8 0 0 No spill 14 13 . 13 0 0 17 815 26 841 0.030920-Oct-94 13 0.7 5.385 Spill 14 11 1 12 0.0833 Spill 17 1072 54 1126 0.04821-Oct-94 25.4 0 0 No spill 15 16 . 16 0 0 18 853 25 878 0.028522-Oct-94 19.9 0.7 3.518 Spill 15 11 4 15 0.2667 Spill 18 865 77 942 0.081723-Oct-94 13.7 0.7 5.109 Spill . 8 . 8 0 Spill 19 1054 79 1133 0.069724-Oct-94 14.9 0 0 No spill . 8 1 9 0.1111 0 19 462 20 482 0.041525-Oct-94 15.2 0 0 No spill . 11 . 11 0 0 20 425 16 441 0.036326-Oct-94 15.5 0.5 3.226 Spill . 1 5 6 0.8333 Spill 20 612 29 641 0.045227-Oct-94 14.9 0 0 No spill . 6 . 6 0 0 21 380 23 403 0.057128-Oct-94 18.1 0.6 3.315 Spill . 4 . 4 0 Spill 21 582 43 625 0.068829-Oct-94 14.7 0 0 No spill . 5 2 7 0.2857 0 22 427 26 453 0.057430-Oct-94 17.3 0.6 3.468 Spill . 8 . 8 0 Spill 22 388 20 408 0.04931-Oct-94 21.4 0 0 No spill . 5 . 5 0 0 . 347 30 377 0.0796

Appendix C
Summary of daily flow, spill, mean, standard deviation (sd), and median times for
adult steelhead with transmitters to pass Ice Harbor and Lower Monumental dams,
fall 1994.
Page 31

Page 32
Low er M onum ental Dam 1994 Fall chinook salm on SteelheadFlow Spill Ladder counts Ladder counts
Date (kcfs) (kcfs) % Spill Treatm ent Block South North Total % South Treatm ent Block South North Total % South19-Sep-94 13 0 0.000 No spill 1 5 26 31 0.161 0 1 66 502 568 0.11620-Sep-94 12.3 0.8 0.065 Spill 1 2 17 19 0.105 Spill 1 121 491 612 0.19821-Sep-94 11.5 0.7 0.061 Spill 2 2 13 15 0.133 Spill 2 155 328 483 0.32122-Sep-94 14.4 0 0.000 No spill 2 5 31 36 0.139 0 2 146 652 798 0.18323-Sep-94 17.3 0 0.000 No spill 3 6 17 23 0.261 0 3 150 589 739 0.20324-Sep-94 13.8 0.8 0.058 Spill 3 22 31 53 0.415 Spill 3 292 511 803 0.36425-Sep-94 11.2 0 0.000 No spill 4 8 41 49 0.163 0 4 101 659 760 0.13326-Sep-94 13 0.8 0.062 Spill 4 12 47 59 0.203 Spill 4 215 553 768 0.28027-Sep-94 12.8 0.8 0.063 Spill 5 20 38 58 0.345 Spill 5 278 533 811 0.34328-Sep-94 14.6 0 0.000 No spill 5 13 40 53 0.245 0 5 160 635 795 0.20129-Sep-94 13.4 0.8 0.060 Spill 6 12 24 36 0.333 Spill 6 131 412 543 0.24130-Sep-94 11.1 0 0.000 No spill 6 7 56 63 0.111 0 6 161 492 653 0.24701-Oct-94 13.1 0.8 0.061 Spill 7 18 46 64 0.281 Spill 7 230 706 936 0.24602-Oct-94 12.3 0 0.000 No spill 7 6 23 29 0.207 0 7 172 268 440 0.39103-Oct-94 11.3 0 0.000 No spill 8 11 46 57 0.193 0 8 286 646 932 0.30704-Oct-94 12.7 0.8 0.063 Spill 8 5 28 33 0.152 Spill 8 392 647 1039 0.37705-Oct-94 12.8 0 0.000 No spill . 4 19 23 0.174 . . 102 413 515 0.19806-Oct-94 13.4 0 0.000 No spill . 11 22 33 0.333 . . 256 704 960 0.26707-Oct-94 16 0 0.000 No spill . 11 26 37 0.297 . . 277 679 956 0.29008-Oct-94 . . . . 11 5 16 0.688 . . 334 439 773 0.43209-Oct-94 14.7 0 0.000 No spill . 0 0 0 . . 0 0 0 ERR10-Oct-94 14.3 0.8 0.056 Spill 9 17 22 39 0.436 Spill 9 208 396 604 0.34411-Oct-94 18 0 0.000 No spill 9 12 25 37 0.324 0 9 190 761 951 0.20012-Oct-94 17.2 0.8 0.047 Spill 10 4 28 32 0.125 Spill 10 290 731 1021 0.28413-Oct-94 20.4 0 0.000 No spill 10 2 12 14 0.143 0 10 222 878 1100 0.20214-Oct-94 20.1 0.8 0.040 Spill 11 5 12 17 0.294 Spill 11 311 877 1188 0.26215-Oct-94 21.7 0 0.000 No spill 11 1 11 12 0.083 0 11 224 704 928 0.24116-Oct-94 29.1 0.8 0.027 Spill 12 4 11 15 0.267 Spill 12 352 592 944 0.37317-Oct-94 23.5 0 0.000 No spill 12 5 12 17 0.294 0 12 332 763 1095 0.30318-Oct-94 27.1 0.8 0.030 Spill . 2 5 7 0.286 Spill 13 346 642 988 0.35019-Oct-94 22.1 0.8 0.036 Spill 13 5 8 13 0.385 Spill 13 191 543 734 0.26020-Oct-94 14.2 0 0.000 No spill 13 1 14 15 0.067 0 13 218 973 1191 0.18321-Oct-94 25.4 0 0.000 No spill 14 2 14 16 0.125 0 14 204 966 1170 0.17422-Oct-94 21.9 0.8 0.037 Spill 14 1 13 14 0.071 Spill 14 160 696 856 0.18723-Oct-94 15.4 0 0.000 No spill 15 5 17 22 0.227 0 15 217 456 673 0.32224-Oct-94 16.6 0.8 0.048 Spill 15 2 8 10 0.200 Spill 15 491 516 1007 0.48825-Oct-94 16.1 0.8 0.050 Spill 15 1 2 3 0.333 Spill 16 354 341 695 0.50926-Oct-94 15.8 0 0.000 No spill . 1 6 7 0.143 0 16 140 437 577 0.24327-Oct-94 16.9 0 0.000 No spill . . 8 8 0.000 0 17 109 442 551 0.19828-Oct-94 18.3 0.9 0.049 Spill . . 5 5 0.000 Spill 17 146 356 502 0.29129-Oct-94 16.5 0 0.000 No spill . 0 7 7 0.000 0 18 236 484 720 0.32830-Oct-94 18.3 0.8 0.044 Spill 16 0 11 11 0.000 Spill 18 104 295 399 0.26131-Oct-94 21.5 0 0.000 No spill 16 1 11 12 0.083 . . 107 437 544 0.197