Tandem Extraction/Liquid Chromatography-Mass Spectrometry ...
UNLV Theses, Dissertations, Professional Papers, and Capstones
2009
Evaluation of extraction chromatography resins for rapid actinide Evaluation of extraction chromatography resins for rapid actinide
analysis analysis
Julie Marisa Gostic University of Nevada Las Vegas
Follow this and additional works at: https://digitalscholarship.unlv.edu/thesesdissertations
Part of the Nuclear Commons, and the Radiochemistry Commons
Repository Citation Repository Citation Gostic, Julie Marisa, "Evaluation of extraction chromatography resins for rapid actinide analysis" (2009). UNLV Theses, Dissertations, Professional Papers, and Capstones. 93. http://dx.doi.org/10.34870/1380716
This Dissertation is protected by copyright and/or related rights. It has been brought to you by Digital Scholarship@UNLV with permission from the rights-holder(s). You are free to use this Dissertation in any way that is permitted by the copyright and related rights legislation that applies to your use. For other uses you need to obtain permission from the rights-holder(s) directly, unless additional rights are indicated by a Creative Commons license in the record and/or on the work itself. This Dissertation has been accepted for inclusion in UNLV Theses, Dissertations, Professional Papers, and Capstones by an authorized administrator of Digital Scholarship@UNLV. For more information, please contact [email protected].
EVALUATION OF EXTRACTION CHROMATOGRAPHY RESINS FOR RAPID
ACTINIDE ANALYSIS
By
Julie Marisa Gostic
Bachelor of Arts College of Charleston
2000
Masters of Science University of Massachusetts, Lowell
2004
A dissertation submitted in partial fulfillment of the requirements for the
Doctor of Philosophy Degree in Radiochemistry Department of Chemistry
College of Science
Graduate College University of Nevada, Las Vegas
December 2009
ii
THE GRADUATE COLLEGE We recommend that the dissertation prepared under our supervision by Julie Marisa Gostic entitled Evaluation of Extraction Chromatography Resins for Rapid Actinide Analysis be accepted in partial fulfillment of the requirements for the degree of Doctor of Philosophy Radiochemistry Kenneth Czerwinski, Committee Chair Kenton Moody, Committee Member Gary Cerefice, Committee Member Ralf Sudowe, Graduate Faculty Representative Ronald Smith, Ph. D., Vice President for Research and Graduate Studies and Dean of the Graduate College December 2009
iii
ABSTRACT
Evaluation of Extraction Chromatography Resins for Rapid Actinide Analysis
by
Julie M. Gostic
Dr. Kenneth R. Czerwinski, Examination Committee Chair Professor of Chemistry
Chair of the Department of Radiochemistry University of Nevada, Las Vegas
In this work, physical and chemical parameters associated with extraction
chromatography separation procedures were investigated for rapid actinide
analysis. A vacuum box system was designed in-house and was characterized in
terms of flow rate reproducibility, matrix effects on flow rate for sequential elution,
and actinide separation efficiency using different types of resin (TEVA, DGA and
TRU). Results indicated that the columnar kinetics of the resins were sufficiently
rapid to run high purity samples through the unit over a wide range of flow rates
for all resin types. Single matrix interferences at a metal ion ratio of 1:106 relative
to the actinide of interest affected separation efficiency with some resins and a
flow rate dependency was observed. After parameter optimization, the system
was used to isolate Pu for isotopic analysis from dissolved particles from a
nuclear warhead that was destroyed in a fire 50 years ago. Isotopic analysis was
obtained by a combination of radiometric and mass-based methods using cerium
fluoride (CeF3) micro-precipitation for sample preparation. The results of these
experiments were compared to historical record surrounding the source of the
particles.

iv
ACKNOWLEDGEMENTS
I would like to take this opportunity to express my sincerest gratitude to those
individuals that helped me reach this milestone in my educational career. First, I
would like to thank my thesis advisor, Ken Czerwinski for having the foresight
and tenacity to build a multi-disciplinary radiochemistry program at UNLV. I have
benefited from his hard work and dedication to the program and would like to
thank him in particular for his efforts. I would also like to thank the members of
my thesis committee for their patience and support throughout my research and
writing. In particular, I would like to thank Ken Moody for his thoughtful
commentary and hours of time spent reviewing this body of work. Gary Cerefice
and Ralf Sudowe have also been very influential in my professional growth and
development and I thank them for their guidance and support throughout my
graduate career at UNLV.
I could not have accomplished this without the love and support of friends and
family. To my husband, I am eternally grateful for your unwavering support and
willingness to complete our PhDs together. I would like to dedicate this work to
those on whose shoulders I stand, Linda Jones, Mike Ryan, Nancy Carder, Sy
Baron, David Borsook, Jeanette Cohan, Lino Becerra, Clay French, Mark Tries,
Jim Eagan, and Dave Medich.
v
TABLE OF CONTENTS
ABSTRACT .......................................................................................................... iii ACKNOWLEDGEMENTS .....................................................................................iv
LIST OF TABLES ............................................................................................... viii LIST OF FIGURES ............................................................................................... x
CHAPTER 1 INTRODUCTION .................................................................. 1
1.1 Background ............................................................................................... 1
1.2 Bulk Sample Processing Through Automation .......................................... 3
1.3 Method Selection ...................................................................................... 3
1.4 Source Preparation and Analysis .............................................................. 5
1.5 Thesis Organization .................................................................................. 6
CHAPTER 2 INSTRUMENTATION AND METHODS................................ 9
2.1 Introduction ............................................................................................... 9
2.2 Chemical Separations ............................................................................... 9
2.3 Radionuclide Standards .......................................................................... 12
2.3.1 Americium ................................................................................... 12 2.3.2 Plutonium .................................................................................... 12
2.4 Cerium Fluoride Precipitation Sample Preparation ................................. 17
2.5 Alpha Spectrometry ................................................................................. 18
2.5.1 Detector Calibration .................................................................... 19 2.5.2 Data Analysis .............................................................................. 23
2.6 Gamma Spectrometry ............................................................................. 23
2.6.1 Detector Calibration .................................................................... 24 2.6.2 Data Analysis .............................................................................. 26
2.7 Liquid Scintillation Counting .................................................................... 27
2.7.1 LSC Sample Preparation ............................................................ 27 2.7.2 LSC Counting Method ................................................................. 28 2.7.3 LSC Efficiency Calibration: Mineral Acid Affects ......................... 29 2.7.4 LSC Analysis .............................................................................. 33
2.8 Inductively Coupled Plasma-Atomic Emission Spectrometry .................. 33
2.8.1 Sample Preparation .................................................................... 34 2.8.2 Instrument Settings ..................................................................... 35 2.8.3 Analyte Analysis ......................................................................... 37
2.9 Inductively Coupled Mass Spectrometry ................................................. 39
2.9.1 Sample Preparation .................................................................... 40 2.9.2 Instrument Settings ..................................................................... 40 2.9.3 Analyte Parameters .................................................................... 41 2.9.4 Analyte Interferences .................................................................. 42
vi
CHAPTER 3 EXTRACTION CHROMATOGRAPHY PERFORMANCE AMERICIUM SEPARATIONS ............................................ 43
3.1 Abstract ................................................................................................... 43
3.2 Introduction ............................................................................................. 44
3.3 Materials and Methods ............................................................................ 47
3.3.1 Vacuum Extraction System ......................................................... 47 3.3.2 Reagents .................................................................................... 48 3.3.3 Radionuclide Standards .............................................................. 49 3.3.4 Flow Rate Characterization ......................................................... 50 3.3.5 Americium Separation ................................................................. 50 3.3.6 Elemental Matrix Interference Effects ......................................... 51
3.4 Results and Discussions ......................................................................... 53
3.4.1 Vacuum Extraction System Characterization .............................. 53 3.4.2 Effects of Flow Rate on Americium Extractions .......................... 60 3.4.3 Sorption of Elemental Matrix Interferences ................................. 62 3.4.4 TRU Resin Capacity of Selected Metal Ions ............................... 65 3.4.5 DGA Resin Capacity for Selected Metal Ions ............................. 67 3.4.6 Effects of Elemental Matrix Interferences on 241Am Separation
Efficiency .................................................................................... 69 3.5 Concluding Remarks ............................................................................... 72
CHAPTER 4 EXTRACTION CHROMATOGRAPHY PERFORMANCE -
PLUTONIUM SEPARATIONS ............................................ 73
4.1 Abstract ................................................................................................... 73
4.2 Introduction ............................................................................................. 73
4.3 Materials and Methods ............................................................................ 77
4.3.1 Vacuum Extraction System ......................................................... 77 4.3.2 Reagents .................................................................................... 77 4.3.3 Radionuclide Standards .............................................................. 78 4.3.4 Flow Rate Characterization ......................................................... 79 4.3.5 Plutonium Separation .................................................................. 79 4.3.6 Elemental Matrix Interference Effects ......................................... 81
4.4 Results and Discussions ......................................................................... 83
4.4.1 Vacuum Extraction System Characterization .............................. 83 4.4.2 Effects of Flow Rate on Plutonium Extractions ........................... 84 4.4.3 Optimization of Redox Reagent Addition .................................... 86 4.4.4 Sorption of Elemental Matrix Interferences ................................. 88 4.4.5 Effects of Elemental Matrix Interferences on 239Pu Separation Efficiency ............................................................................................. 90
4.5 Concluding Remarks ............................................................................... 94
CHAPTER 5 HOT PARTICLE DISSOLUTION AND PLUTONIUM
ISOTOPIC ANALYSIS ........................................................ 96
5.1 Abstract ................................................................................................... 96
5.2 Introduction ............................................................................................. 96
5.3 Materials and Methods .......................................................................... 100
vii
5.3.1 Reagents .................................................................................. 100 5.3.2 Particle Dissolution ................................................................... 101 5.3.3 Chemical Separations ............................................................... 102 5.3.4 Sample Preparation for Plutonium Isotopic Analysis ................ 104 5.3.5 Plutonium Isotopic Analysis – Gamma and Alpha Spectrometry ........................................................................................................... 105 5.3.6 Elemental Analysis .................................................................... 110
5.4 Results and Discussion ......................................................................... 112
5.4.1 Plutonium Isotopic Composition – Historical Record................. 112 5.4.2 Particle Dissolution ................................................................... 113 5.4.3 Bulk Activity Ratios ................................................................... 117 5.4.4 Chemical Separations ............................................................... 118
5.5 Plutonium Isotopic Composition ............................................................ 121
5.5.1 Relative Abundance of 240Pu .................................................... 121 5.5.2 Relative Abundance of 238Pu .................................................... 123 5.5.3 Relative Abundance of 241Pu .................................................... 123 5.5.4 Elemental Analysis .................................................................... 126
5.6 Concluding Remarks ............................................................................. 129
CHAPTER 6 PLUTONIUM ISOTOPIC STANDARD DEVELOPMENT FOR
GAMMA, ALPHA AND MASS SPECTROMETRY ............ 132
6.1 Abstract ................................................................................................. 132
6.2 Introduction ........................................................................................... 133
6.3 Materials and Methods .......................................................................... 136
6.3.1 Reagents .................................................................................. 136 6.3.2 Radionuclide Standard .............................................................. 136 6.3.3 Sample Preparation .................................................................. 139 6.3.4 Cerium Fluoride Co-Precipitation .............................................. 141 6.3.5 Analysis by ICP-MS .................................................................. 142 6.3.6 Plutonium Isotopic Analysis – Gamma Spectrometry ............... 149 6.3.7 Plutonium Isotopic Analysis – Alpha Spectrometry ................... 151
6.4 Results and Discussion ......................................................................... 154
6.4.1 Alpha Analysis .......................................................................... 154 6.4.2 Gamma Analysis ....................................................................... 161 6.4.3 Mass Analysis – Aqueous Solution ........................................... 164 6.4.4 Mass Analysis – CeF3 Filter ...................................................... 169
6.5 Concluding Remarks ............................................................................. 178
CHAPTER 7 CONCLUDING REMARKS AND REFLECTIONS ON
FUTURE RESEARCH ...................................................... 179
BIBLIOGRAPHY ............................................................................................... 187
VITA ................................................................................................................. 202
viii
LIST OF TABLES
Table 1 Extraction chromatography resins used for actinide separations ..... 10
Table 2 Plutonium isotopic content of aqueous standard (Isotope Products, 1198-16-1) ....................................................................................... 14
Table 3 Efficiency calibration source information .......................................... 20
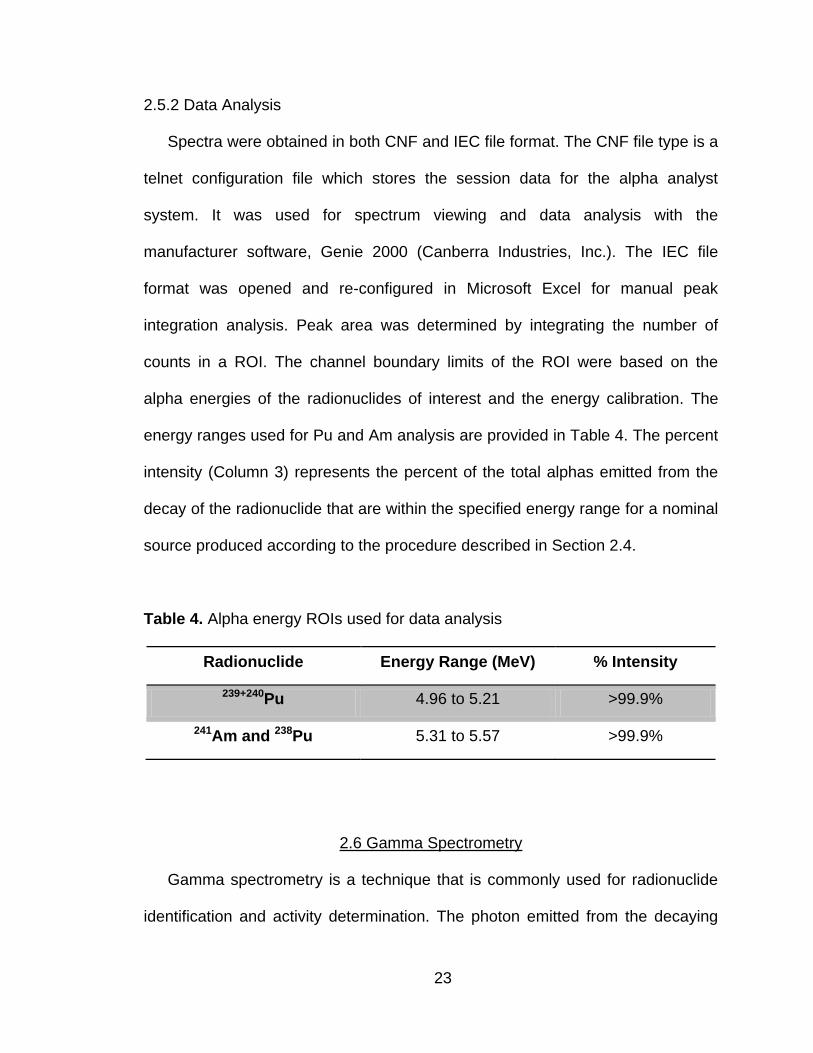
Table 4 Alpha energy ROIs used for data analysis ....................................... 23
Table 5 Photon energy and radiative yield information used for determining Pu isotopic ratios and Am separation efficiency by gamma spectrometry. ................................................................................... 25
Table 6 ICP-AES calibration standard preparation ....................................... 36
Table 7 Matrix ion photon wavelengths used to determine signal intensity on the ICP-AES. ................................................................................... 38
Table 8 Plutonium m/z ratios used for ICP-MS analysis for both aqueous and CeF3 co-precipitated samples. ......................................................... 41
Table 9 Method elution matrices used for 241Am separation. ........................ 51
Table 10 Matrix ion photon wavelengths used to determine signal intensity on the ICP-AES. ................................................................................... 53
Table 11 241Am separation efficiency for TRU and DGA resins in the presence of selected ions. ............................................................................... 69
Table 12 Method elution matrices used for 239Pu separation on TEVA resin .. 80
Table 13 Matrix ion photon wavelengths used to determine signal intensity on the ICP-AES. ................................................................................... 82
Table 14 Redox reagent aging effects on Pu efficiency on TEVA resin. ......... 87
Table 15 Plutonium activity percent recovered in each collected method fraction determined by LSC counting in the presence of selected ions ......................................................................................................... 92
Table 16 Plutonium isotopic composition of the nuclear missile in 1958. ....... 99
Table 17 Detection efficiency for selected photons using the broad energy germanium (BEGe) spectrometry system. ..................................... 108
Table 18 Photon wavelengths used to determine signal intensity for the ICP-AES ............................................................................................... 111
Table 19 Activity recovered from hot particle dissolutions vs. estimated activity from non-destructive gamma spectrometry analysis. ..................... 115
Table 20 Sample geometry dependence on high resolution gamma spectrometry detection efficiency. .................................................. 116
Table 21 Decay corrected plutonium isotopic standard information. ............ 138
Table 22 Total activity and mass values based on 239Pu for each sample solution within a set of 7. Four sets of aqueous solutions were prepared, 2 for CeF3 and 2 for ICP-MS. ......................................... 140
Table 23 Plutonium m/z ratios used for ICP-MS analysis for both aqueous and CeF3 co-precipitated samples. ....................................................... 143
Table 24 Operating parameters for the CETAC laser ablation system, LSX500 and ELAN ICP-MS. ........................................................................ 148
ix
Table 25 Detection efficiency for selected photons emitted in the decays of the indicated Pu isotopes using the broad energy germanium (BEGe) spectrometry system. ..................................................................... 150
Table 26 Alpha spectrometry isotopic analysis prior to and after 241Am separation. ..................................................................................... 155
Table 27 Gamma spectrometry isotopic analysis prior to and after 241Am separation. ..................................................................................... 163
Table 28 Aqueous ICP-MS detection limits for the Pu isotopic m/z ratios. ... 165
x
LIST OF FIGURES
Figure 1 Vacuum extraction unit developed in-house and the commercially available automated solid phase extraction unit manufactured by J-Kem Scientific, Inc. ......................................................................... 11
Figure 2 Alpha spectra for 238Pu and 241Am. The spectrum for each radionuclide was acquired separately with an Alpha Analyst system. ....................................................................................................... 16
Figure 3 Mixed alpha spectrum for the electroplated source used for detector energy calibration. Source contained a mixture of 234U, 235U, 238U, 239Pu, and 241Am. ............................................................................ 21
Figure 4 Energy calibration curve for the mixed alpha electroplated source. The equation represents the linear calibration function for energy in terms of the channel number where Energy=1.44 MeV + 0.0067*Channel Number. ............................................................... 22
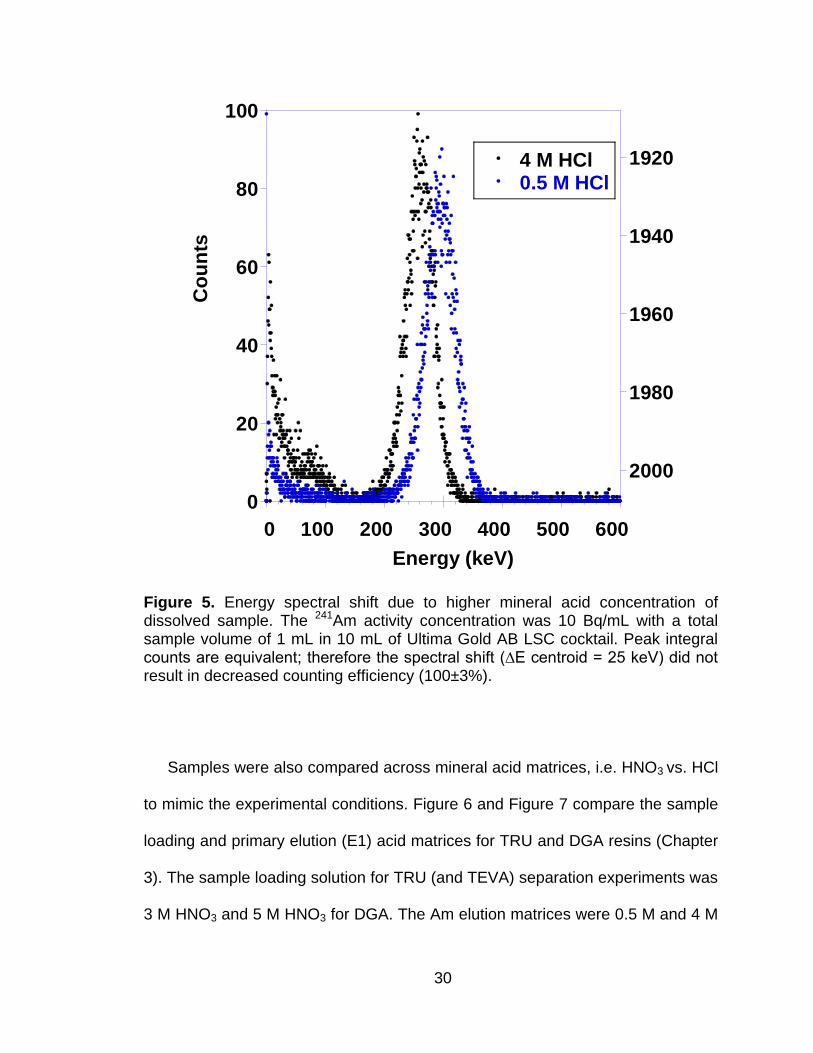
Figure 5 Energy spectral shift due to higher mineral acid concentration of dissolved sample. The 241Am activity concentration was 10 Bq/mL with a total sample volume of 1 mL in 10 mL of Ultima Gold AB LSC cocktail. Peak integral counts are equivalent; therefore the spectral shift (∆E centroid = 25 keV) did not result in decreased counting efficiency (100±3%). ....................................................................... 30
Figure 6 Energy spectral shift from the sample loading acid matrix (3 M HNO3) to the primary elution matrix for Am (4 M HCl). The 241Am activity concentration was 10 Bq/mL with a total sample volume of 1 mL in 10 mL of Ultima Gold AB LSC cocktail. Peak integral counts are equivalent; therefore the spectral shift (∆E centroid = 100 keV) did not result in decreased counting efficiency (100±4%). .............. 31
Figure 7 Energy spectral shift from the DGA sample loading acid matrix (5 M HNO3) to the primary elution matrix for Am (0.5 M HCl). 241Am activity concentration was 10 Bq/mL with a total sample volume of 1 mL in 10 mL of Ultima Gold AB LSC cocktail. Peak integral counts are equivalent; therefore the spectral shift (∆E centroid = 150 keV) did not result in decreased counting efficiency (100±4%). .............. 32
Figure 8 The rate of evacuation of the vacuum system based on ambient pressure conditions and pre-programmed vacuum set points using the 2 mL TRU cartridges and a HNO3 matrix. ................................ 55
Figure 9 The relationship between flow rate and vacuum setting for the 3x5 vacuum box using a 3M HNO3 matrix solution. Each data point represents the average flow rate taken over 5 trials for 5 separate 2 mL pre-packed TRU resin cartridges. ............................................. 56
Figure 10 Elution matrix effects on flow rate for the 2 mL pre-packed TRU resin cartridges at various vacuum settings. Each data point represents the average flow rate over a row of resin cartridges (n=5), for 5 separate trials, with new resin cartridges used for each trial. ................................................................................................. 58
xi
Figure 11 Elution matrix effects on flow rate for the 2 mL pre-packed DGA resin cartridges at various vacuum settings. Each data point represents the average flow rate over a row of resin cartridges (n=5), for 5 separate trials, with new resin cartridges used for each trial. ................................................................................................. 59
Figure 12 Extraction efficiency of 241Am on 2 mL TRU cartridges at various activity concentrations. The average extracted fraction is 0.92 ± 0.04 (±1ζ). Each data point represents the average value for a row of 5 cartridges at a given vacuum setting. ............................................. 60
Figure 13 Extraction efficiency of 241Am on 2 mL DGA cartridges at various activity concentrations. The average extracted fraction is 0.96 ± 0.02 (±1ζ). Each data point represents the average value for a row of 5 cartridges at a given vacuum setting. ............................................. 61
Figure 14 Sorption of interference ions at various vacuum settings using 2 mL TRU resin cartridges (n = 5). Ion concentration is 2.5 mM in a 3M HNO3∙ Al(NO3)3 loading matrix. ...................................................... 63
Figure 15 Sorption of interference ions at various vacuum settings using 2 mL DGA resin cartridges (n = 5). Ion concentration is 2.5 mM in a 5 M HNO3 loading matrix. ...................................................................... 64
Figure 16 Fraction of 241Am present in each method fraction, with original loading matrix containing 2.5 mM Zr in solution. The fraction matrices are defined in Table 9. The fraction labeled Rinse is the rinse fraction immediately following sample loading (total volume = 8 mL). Elution 1 is the primary Am stripping fraction (total volume = 20 mL) and Elution 2 is the second stripping fraction (for residual Am collection). Trials were conducted at 575 and 275 torr vacuum settings with n = 5 cartridges or samples per trial. .......................... 71
Figure 17 Elution matrix (Table 12) effects on flow rate for the 2 mL pre-packed TEVA resin cartridges at various vacuum settings. Each data point represents the average flow rate over a row of resin cartridges (n=5), for three separate trials, with new resin cartridges used for each trial. .......................................................................... 84
Figure 18 Extraction efficiency of 239Pu on 2 mL TEVA cartridges at 2000 Bq/sample activity concentrations. The average extracted fraction is 0.99 ± 0.01 (±1ζ). Each data point represents the average value for three trials (n=5 resin cartridges per trial) at a given vacuum setting. ....................................................................................................... 85
Figure 19 Sorption of interference ions at various vacuum settings using 2 mL TEVA resin cartridges (n = 5). Ion concentration is 2.5 mM in a 3 M HNO3 ∙ 1 M Al(NO3)3 loading matrix. .............................................. 90
Figure 20 Fraction of Pu recovered at various vacuum settings using 2 mL TEVA resin cartridges (n=5 cartridges/ion per vacuum setting). Pu activity concentration was equivalent to 2000 Bq per sample, verified by LSC. Counter ion concentration is 2.5 mM in a 3 M HNO3·1 M Al(NO3)3 loading matrix. Error bars represent the recovery reproducibility at 1ζ. ....................................................................... 91
xii
Figure 21 Fraction of Pu recovered at 275 torr vacuum settings using 2 mL TEVA resin cartridges (n=5 cartridges/ion per vacuum setting) for various sample aging times. Pu activity concentration equivalent to 2000 Bq per sample, verified by LSC. Counter ion concentration is 2.5 mM in a 3M HNO3·1M Al(NO3)3 loading matrix. Error bars represent the recovery reproducibility at 1ζ. .................................. 94
Figure 22 Chemical separation flow sheet for dissolved hot particle solutions. Five aliquots of the filtered dissolved particle matrix solution equivalent to 2000 Bq total activity were taken and total sample volume normalized to 10 mL (7 M HNO3∙ 0.05 M HF∙ 0.05 M Al(NO3)3). ...................................................................................... 104
Figure 23 Gamma spectrum collected for the 239Pu calibration standard prepared in-house by CeF3 precipitation. The 38.9 (239Pu), 43.5 (238Pu), 45.2 (240Pu), 51.9 (239Pu), 59.5 (241Am) and 129 (239Pu) photopeaks were used for determining relative Pu isotopic composition. ................................................................................. 107
Figure 24 Activity characterization (238Pu + 241Am to 239+240Pu) of dissolved hot particle solutions as determined by alpha spectrometry. The red circles represent the bulk activity ratio prior to chemical separation and the blue diamonds represent the Am to 239:240Pu ratio after chemical separation. Each sample was counted for 1000 seconds. Error bars are representative of the reproducibility of the activity ratios at n= 5 samples per hot particle solution at 1 ζ. ................. 118
Figure 25 Bulk activity distribution of dissolved particles (in 7 M HNO3 ∙0.05 M HF∙ 0.05 M Al(NO3)3 sample loading matrix) using TEVA and DGA resins for chemical separations. TEVA E1 and DGA E1 Am correspond to the Pu and Am elution fractions, respectively. The values given for HP-9 were later revised (see text). ..................... 119
Figure 26 High resolution gamma spectrum of an isolated hot particle (prior to dissolution) and after chemical separation. Samples were counted on a BEGE detector for 24 hours. The post separation spectrum (Am Removed) was shifted upward by a constant value (i.e. 10,000 counts were added to the counts in each channel to raise the baseline). ...................................................................................... 121
Figure 27 Collective 240:239Pu activity ratios as determined by gamma spectrometry. Each sample was counted for 24 hours. 239Pu peaks selected for analysis include 38.6 keV (γ yield = 1.04E-4, 239-1), 51.6 keV(γ yield = 2.72E-4, 239-2), and 129 keV(γ yield = 6.31E-5, 239-3). Data are consistent with 0.20 ± 0.01, in reasonable agreement with expectations from the literature. The peak selected for 240Pu analysis was at 45.6 keV (γ yield = 4.474E-4). As expected, the less attenuated line in 239Pu at 129 keV resulted in a lower 240:239 value than did the others. ...................................... 122
Figure 28 238Pu to 239+240Pu activity ratios for the dissolved hot particle solutions after chemical separations. E1-E5 on the x-axis represent the 5 Pu elution fractions collected for n= 5 trials per dissolved hot

xiii
particle. Error bars represent the counting error associated with each activity ratio at 1 ζ. Data are consistent with a value of 0.0151 ± .001, somewhat lower than the value of 0.0161 expected from a decay calculation of the data in the literature (Table 16). ............. 124
Figure 29 Hot particle elemental analysis. Original sample matrix solution (7M HNO3∙ 0.05M HF) was evaporated and samples were reconstituted first in 100 µL of concentrated HNO3 and diluted with 9.9 mL of DI water. Analysis was performed by ICP-AES. ................................ 127
Figure 30 A comparison of the elemental analysis of hot particle (HP-9) with samples evaporated at 90 °C (solid bar) prior to analysis and samples not pre-treated prior to ICP-AES analysis (hatched bar). 128
Figure 31 Aqueous sample preparation schematic for ICP-MS and CeF3 co-precipitation. ................................................................................. 139
Figure 32 CCD generated image of the CeF3 filter in the sample chamber of the CETAC laser ablation unit prior to ablation (A) and after ablation of several areas (the dark lines) (B).............................................. 146
Figure 33 Spectral data collected for both the pre- and post-separation CeF3 filters with approximately 2300 Bq total activity per filter. Total counts are presented on a log scale so that the contribution from the 238Pu and 241Am (higher energy peak) in the Pu solution can be readily seen. The background count rate was 0.0083 counts per second and the full width at half maximum (FWHM) of the 239+240Pu and 238Pu+241Am peaks were 30.8 keV and 27.5 keV, respectively. ... 155
Figure 34 Alpha detector response for the CeF3 prepared from the original Pu stock solution (pre-separation) and the purified Pu stock solution (post-separation). The solid black line represents the expected detector response determined from the efficiency calculations. ... 158
Figure 35 Stopping power for alpha particles in silicon generated by the National Institute of Standards and Technology ASTAR database (67). That portion of the curve due to 5-6 MeV alpha particles is set off by the shaded region. .............................................................. 161
Figure 36 Gamma spectral data collected for both the pre- and post- separation CeF3 filters with approximately 2300 Bq total activity per filter. Peak labels indicate photon energy where (1) 38.7 keV, 239Pu; (2) 43.8 keV, 238Pu; (3) 45.1 keV, 240Pu; (4) 51.6 keV, 239Pu; (5)59.5 keV, 241Am; (6) 129 keV, 239Pu. A 75 channel offset (x-axis shift) was applied to the post-separation spectrum for better peak comparison. ..................................................................................................... 162
Figure 37 ICP-MS analysis of the 239Pu signal intensity vs. mass for the aqueous standard solution prior to and after chemical separation. The curvature of the trend line at high concentration is due to detector saturation. ....................................................................... 166
Figure 38 ICP-MS analysis of the 240Pu signal intensity vs. mass for the aqueous standard solution prior to and after chemical separation. ..................................................................................................... 167
xiv
Figure 39 ICP-MS analysis of the 241Pu + 241Am signal intensity vs. mass for the aqueous standard solution prior to and after chemical separation. .................................................................................... 168
Figure 40 ICP-MS analysis of the 242Pu ignal intensity vs. mass for the aqueous standard solution prior to and after chemical separation. The highest 242Pu signals are near the limit of detection. ............. 169
Figure 41 LA-ICP-MS signal intensity plotted as a function of scan time for the pre-separation CeF3 filter containing 1000 ng of 239Pu. Laser energy level = 100%, spot size = 50 µm, pulse rate = 20 Hz, scan rate = 10 µm/sec, single line scan setting. ................................................... 171
Figure 42 Cerium (m/z=140) signal intensity as a function of time during laser ablation for various line scans taken in the central region of one of the CeF3 filters (Pu mass = 1000 ng). Laser energy level = 100%, spot size = 50 µm, pulse rate = 20 Hz, scan rate = 10 µm/sec, single line scan setting. Red solid lines highlight line scans whose results are depicted in the upper part of the figure. .................................. 173
Figure 43 Cerium (m/z=140) signal intensity as a function of time for various line scans taken along the edge regions of a CeF3 filter (Pu mass = 1000 ng). This is the same image that is the basis for Figure 42. Laser energy level = 100%, spot size = 50 µm, pulse rate = 20 Hz, scan rate = 10 µm/sec, single line scan setting. Yellow solid lines highlight line scans whose results are depicted in the upper part of the figure. ..................................................................................... 174
Figure 44 Mass signal ratio of 239 and 240 (Pu) to 140 (Ce) as a function of time for a filter containing approximately 1000 ng 239Pu. All four line scans from Figure 42 are plotted on the graph for comparison. ... 176
Figure 45 Mass ratios for m/z=239 (red circles) and m/z=240 (blue squares) with respect to m/z=140. The left y-axis and bottom x-axis correspond to the observed and calculated 239:140 ratios for 239Pu masses ranging from 250 to 1000 ng. The right y axis and top x-axis correspond to the 240:140 ratios. Calculated values were determined from LSC activity analysis for Pu and gravimetric addition of Ce to the solution prior to precipitation. For both ratios, the observed Pu/Ce is about twice what is expected from the calculation. ................................................................................... 177
Figure 46 Conceptual schematic of a multiple vacuum system chemistry platform. ....................................................................................... 181
1
CHAPTER 1
INTRODUCTION
1.1 Background
The nation‘s recurrent focus on emergency response and preparedness in the
event of a nuclear or radiological incident has given impetus to develop rapid
forensic analysis methods for radionuclide identification and quantification. The
methods need to be both reliable and accurate in that the information obtained
about the material may be used to prevent future illicit activities or help determine
source origination (1). Analytical response following a nuclear incident will vary
significantly from routine surveillance monitoring procedures and will pose
specific challenges including, large scale sampling and handling of non-standard
environmental and anthropogenic matrices with a wide range of activity from
background to hot particle levels (2-5). As an example, samples collected from a
nuclear incident may consist of various forms of urban rubble, i.e. building
materials, asphalt, concrete, glass, etc., and from a chemistry perspective, are
very complex. Traces of the material of interest are essentially embedded in a
sea of other elements and must be physically or chemically isolated for accurate
analyses. In developing effective rapid response analytical protocols, each of
these challenges must be addressed. This leads to an inherent paradigm shift in
the assessment criteria that are used to determine the suitability of a method.
Nuclear forensic analysis must be approached from a ―360° view‖, meaning
that the sample must be scrutinized from every angle to determine what
information is available and how it relates back to the source term (5). This
2
requires the use of both non-destructive and chemical dissolution techniques.
Non-destructive analyses include high resolution imaging and bulk elemental
distribution using various microscopy and spectroscopy techniques (6-8). The
information obtained can help identify some of the primary constituents without
complete destruction of the original sample material. The utility of non-destructive
characterization is limited in that complete isotopic analysis is not achievable.
The isotopic signature can provide information regarding the fabrication process
and the date of origin of the material (5,9) but usually requires complete
dissolution of the sample, followed by chemical isolation of the radionuclides of
interest.
Classical radioanalytical techniques used for forensic analyses are often very
robust and accurate (1), but require a considerable amount of time from sample
dissolution to final report. For materials obtained prior to an event, the number of
samples collected is limited to the quantity of material intercepted and, in most
cases, the material is intact and true to its origin (5,9). In situations where a
nuclear or radiological incident has occurred, the number of samples acquired
may be in the thousands and the ability to provide accurate data for such a
volume of potentially diverse samples in a short time period is diminished.
Recent research efforts have been directed towards developing actinide
separation methods that optimize chemical yields (10-14) and decrease total
processing time but few of these methods have been evaluated for bulk sampling
processing.
3
1.2 Bulk Sample Processing Through Automation
Bulk sample processing can be accomplished more effectively with
automation and, in recent years, modularized platforms have been developed for
bench scale chemistry applications including sample dissolution, chemical
separations, and sample preparation. However, current forensic radioanalytical
methods have not been adapted for these types of platform automated systems.
Translating manual into automated methods requires a greater understanding of
the physical and chemical parameters that are important from an engineering
standpoint. Each step must be evaluated first on a basic level to determine which
portions of the process are critical for achieving acceptable results. Once the
fundamental chemical reactions are understood, each step can then be
approached from an engineering perspective to optimize the procedure for
automation.
1.3 Method Selection
The primary focus of this work was to evaluate mixed actinide separations
procedures for potential automation. Many techniques have been developed for
radionuclide separations from aqueous solutions including precipitation, solvent
extraction, ion exchange chromatography (IC) and extraction chromatography
(EC). The chemistry used for analyte concentration and separation depends on
the activity concentration in the sample, the degree of separation that is required
due to matrix interferences, and operational time constraints. Most radioanalytical
4
procedures make use of multiple methods to optimize efficiency and minimize
potential interferences.
EC combines the selectivity and versatility of solvent extraction with the
simplicity and columnar fractionation capabilities of IC (15). This is accomplished
by incorporating the organic extractant into the stationary phase which is
supported on an inert polymer or silicate resin. EC methods are well-suited for
automated chemical separations as demonstrated in various continuous flow-
through separation units (16-23). The EC resins have high analyte selectivity,
simplistic elution schemes, rapid kinetics, and they can be stored dry prior to
immediate use (24). The manufacturer, Eichrom Technologies, Inc. packages the
resin into cartridges, which reduces preparation time and minimizes variations
associated with in-house packing. The cartridges are stackable, providing an
efficient way of separating multiple radionuclides based on analyte affinity for
different extractant compounds.
Recent publications (10-12, 25-28) have demonstrated the utility of vacuum-
assisted separations for a wide range of sample matrices. A vacuum box system
was used to accelerate chemical separations and to process multiple samples
simultaneously. This discrete approach to batch sample analysis reduces the risk
of cross-contamination between samples and decreases experimental variability
within a given batch.
In this work, a vacuum box system was designed in-house and was modeled
after a commercially available solid phase synthesis unit. The vacuum box
system was characterized in terms of flow rate reproducibility, matrix effects on
5
flow rate for sequential elution, and actinide separation efficiency using three
different types of resin, TRU, DGA and TEVA. The results of the characterization
studies are presented in Chapters 3 and 4.
1.4 Source Preparation and Analysis
After chemical separation and purification is achieved, samples must be
analyzed to determine the total concentration of each radionuclide. In nuclear
forensic analysis, Pu and U are of particular interest in that they are the primary
components in nuclear materials and their relative isotopic abundance can be
linked to the intended use of the material and the fabrication process (1,5).
Isotopic analysis is accomplished using radiometric techniques, i.e. high
resolution gamma and alpha spectrometry (GS and AS), or high resolution mass
analysis, i.e. mass spectrometry (MS). When used in combination, these
techniques provide a more comprehensive analysis.
In most cases, sample preparation for radiometric and mass analysis is
separate, which further increases processing time. It would be useful to
determine if a single sample preparation technique could be used for both
radiometric and mass based isotopic analyses. In Chapters 5 and 6, cerium
fluoride (CeF3) micro-precipitation used for AS sample preparation was selected
for evaluation as a single source preparation method. Samples were prepared
from stock solutions where the Pu isotopic content was known and from
dissolved particle solutions known to contain WGPu. This method was chosen
based on short preparation time (12 samples/hr), good energy resolution for
6
alpha analysis (~32 keV), and high actinide recovery as scavenged by the
precipitate (29). Additionally, the filters could be used for mass analysis to
confirm the relative isotopic ratios determined from gamma and alpha analysis
(Chapter 6).
1.5 Thesis Organization
In this thesis, preliminary studies (Chapter 3) focused on the characterization
of the EC separation unit using TRU and DGA resins and Am to establish some
of the chemical and engineering boundary conditions associated with the
separation method. Engineering controls, such as flow rate reproducibility,
pressure regulation, and cartridge failure were tested using various acid
matrices. Once the unit was physically characterized, method efficiency was
evaluated in terms of the effects of flow rate on extraction efficiency of Am
present in solution at various concentrations. Americium was selected for
preliminary study based on its tendency to exist in a single trivalent oxidation
state in acid solution and well-characterized extraction behavior on both DGA
and TRU resins under the given matrix conditions (30,31). The effects of matrix
ion contaminants on Am extraction efficiency were also characterized. Matrix
ions contaminants selected for characterization were chosen based on their
abundance in environmental and nuclear material matrices, or due to their use in
sample enrichment steps conducted prior to chemical separations.
Once the Am characterization studies were completed, the EC separation unit
was characterized with TEVA resin for Pu method efficiency (Chapter 4).
7
Plutonium extraction efficiency is more complex in that multiple Pu oxidation
states can be present in solution, and redox agents must be used to force Pu into
the most extractable species. Various parameters affecting Pu separation
efficiency were characterized including, the age of the reagents used, the sample
rest time (i.e. the time from redox agent addition to column loading) along with
those previously mentioned for the Am studies.
Once the EC unit was characterized for Am and Pu, aqueous samples were
prepared from solutions containing dissolved WGPu hot particles (Chapter 5).
The particles were manually isolated from soil cores that were sampled from a
site where a fire involving a missile tipped with a nuclear warhead occurred over
four decades ago. The particles were dissolved in a HNO3/HF/H2O2 solution and
chemistry was performed on the EC unit with TEVA and DGA resins. Plutonium
was selectively removed from other matrix constituents on TEVA and Am and U
were isolated on DGA. The relative Pu isotopic ratios were determined using
CeF3 sample preparation and alpha and gamma spectrometry.
The Pu isotopic analysis of the various hot particle solutions required the
development of a series of CeF3 precipitated Pu standards (Chapter 6). Samples
were prepared with activity concentrations between 0 and 2400 Bq and
instrument response for alpha and gamma spectrometry was characterized.
Additionally, preliminary mass analysis was performed with inductively couple
mass spectrometry (ICP-MS) using a laser ablation sample introduction unit.

8
Each data chapter is presented in manuscript format with a detailed
introduction and materials and methods section. Chapter 2 provides a general
overview of the instrumentation and methods used in this work.

9
CHAPTER 2
INSTRUMENTATION AND METHODS
2.1 Introduction
A short description of the instrumentation and general methods used for
experimentation is presented in this chapter. More detailed descriptions of
methods are provided in Chapters 3 through 6 as related to the specific
experiments in which they were employed.
2.2 Chemical Separations
The focus of this work was to characterize chemical separations of the
actinides using extraction chromatography resins for the development of an
automated radioanalytical platform. Extraction chromatography (EC) combines
the selectivity and versatility of solvent extraction with the simplicity and columnar
fractionation capabilities of ion exchange chromatography (IC) (32). The active
component of the resin is an organic extractant that is affixed to an inert polymer
or silicate resin. The resins are packed into columns, which form the stationary
phase for dynamic, flow-induced chemical exchange. The aqueous sample is
loaded on the column and the metal ions of interest interact with the stationary
phase. The extent of chemical interaction between the metal ion and the
stationary phase is based on the conversion of the hydrated metal ion to the
extractable organophilic species. A more detailed description of EC is provided in
references (15,24,33).
10
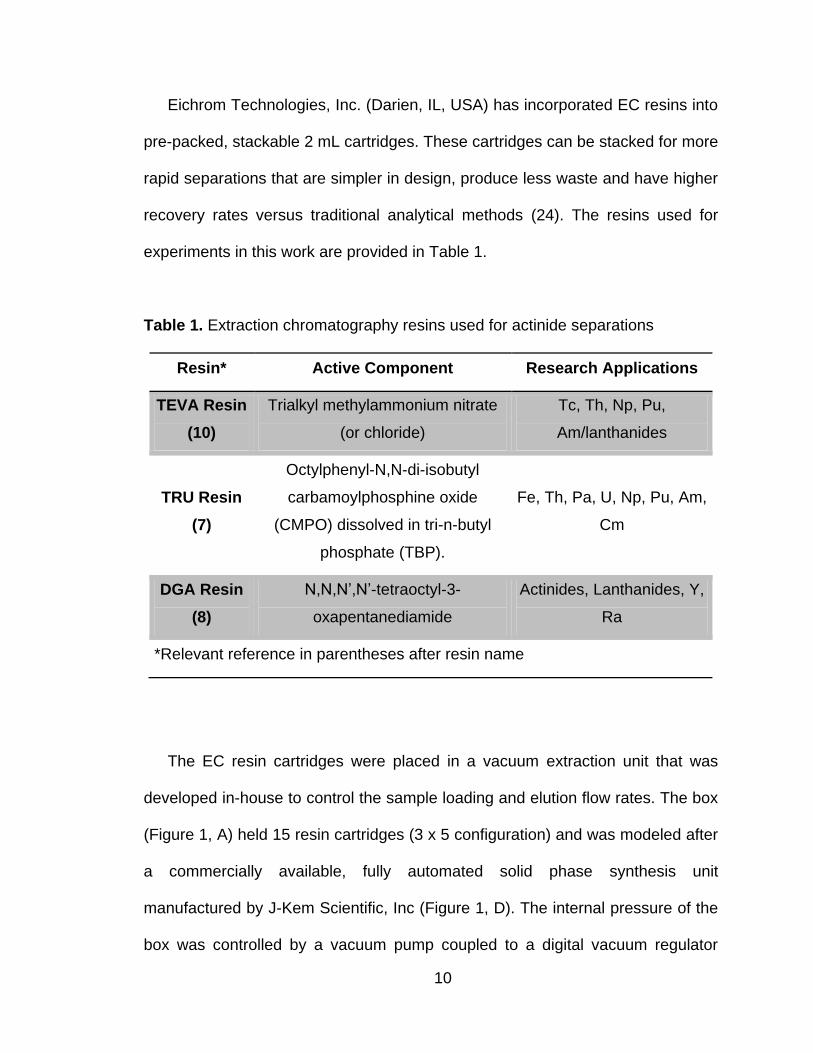
Eichrom Technologies, Inc. (Darien, IL, USA) has incorporated EC resins into
pre-packed, stackable 2 mL cartridges. These cartridges can be stacked for more
rapid separations that are simpler in design, produce less waste and have higher
recovery rates versus traditional analytical methods (24). The resins used for
experiments in this work are provided in Table 1.
Table 1. Extraction chromatography resins used for actinide separations
Resin* Active Component Research Applications
TEVA Resin
(10)
Trialkyl methylammonium nitrate
(or chloride)
Tc, Th, Np, Pu,
Am/lanthanides
TRU Resin
(7)
Octylphenyl-N,N-di-isobutyl
carbamoylphosphine oxide
(CMPO) dissolved in tri-n-butyl
phosphate (TBP).
Fe, Th, Pa, U, Np, Pu, Am,
Cm
DGA Resin
(8)
N,N,N‘,N‘-tetraoctyl-3-
oxapentanediamide
Actinides, Lanthanides, Y,
Ra
*Relevant reference in parentheses after resin name
The EC resin cartridges were placed in a vacuum extraction unit that was
developed in-house to control the sample loading and elution flow rates. The box
(Figure 1, A) held 15 resin cartridges (3 x 5 configuration) and was modeled after
a commercially available, fully automated solid phase synthesis unit
manufactured by J-Kem Scientific, Inc (Figure 1, D). The internal pressure of the
box was controlled by a vacuum pump coupled to a digital vacuum regulator
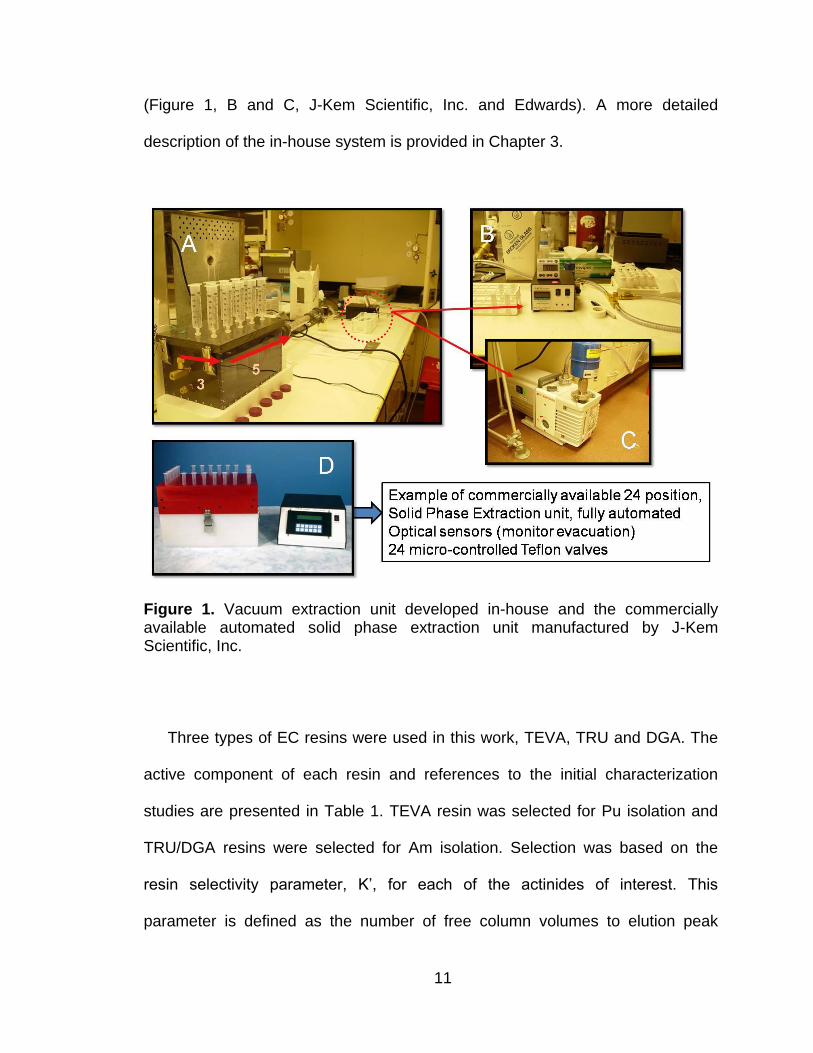
11
(Figure 1, B and C, J-Kem Scientific, Inc. and Edwards). A more detailed
description of the in-house system is provided in Chapter 3.
Figure 1. Vacuum extraction unit developed in-house and the commercially available automated solid phase extraction unit manufactured by J-Kem Scientific, Inc.
Three types of EC resins were used in this work, TEVA, TRU and DGA. The
active component of each resin and references to the initial characterization
studies are presented in Table 1. TEVA resin was selected for Pu isolation and
TRU/DGA resins were selected for Am isolation. Selection was based on the
resin selectivity parameter, K‘, for each of the actinides of interest. This
parameter is defined as the number of free column volumes to elution peak
12
maximum (24) and is a measure of the affinity to the extractant of the metal
species in a given matrix solution. A review of the experimental determination of
the K‘ factor is provided elsewhere (31). As an example, the K‘ for Pu on TEVA
resin is 104 in 3 M HNO3, but only 0.1 and 10 for Am and U, respectively (34).
Under the same loading conditions, Am and U are retained to a greater extent on
either TRU (K‘Am = 102, K‘U = 2 x 10³) or DGA (K‘Am > 104, K‘U = 102) resins (30,
31). These resins can be used in combination to selectively purify each actinide
of interest by manipulating the loading and elution matrices. The chemical
separations procedures used for each experiment are described in detail in
subsequent chapters.
2.3 Radionuclide Standards
2.3.1 Americium
Americium stock solutions were prepared from a traceable standard solution
(1198-21-4, 01-Jul-06, Isotope Products, Valencia, CA, USA). The 241Am stock
solutions were prepared in various HNO3 matrices with activity concentrations
from 5 to 50 Bq/mL of stock solution. Stock solution activity was verified by liquid
scintillation counting (LSC).
2.3.2 Plutonium
Plutonium stock solutions were prepared from traceable standard solutions
(1198-16-1, August-06, Isotope Products, Valencia, CA, USA). The Pu isotopic
content for the original standard solution is provided (Table 2). The presence of
the relatively short-lived 241Pu isotope (t1/2=14.4 years) in the Pu solution,
13
required that the in-growth of the 241Am decay product be determined for
accurate evaluation of the chemical separation efficiency of the TEVA extraction
chromatography method (Chapters 4-6). Information on the amount of 241Am
present in the standard solution was not provided by the manufacturer; however,
an estimate of the Am was determined from the Pu isotopic information provided
with the standard.
The following formula was used to determine the 241Am activity concentration
in the Pu solution:
𝐴𝑐𝑡𝑖𝑣𝑖𝑡𝑦% 𝐴𝑚 = 𝐴𝑜 ,241 ×
𝜆2
𝜆2 − 𝜆1× (𝑒−𝜆1𝑡 − 𝑒−𝜆2𝑡) Equation 1
where Ao,241 is the initial activity percent of 241Pu present in the Pu standard on
the isotope verification date of March-2005, λ1 is the decay constant of 241Pu and
λ2 is the decay constant of 241Am and t is the time elapsed from isotope
verification to the date of solution preparation for experimental purposes,
February- 2008 (35). The estimated 241Am concentration in the Pu solution using
the above equation was 0.038% of the total activity.
The presence of 241Am in the standard solution was verified by alpha
spectrometry using a standard cerium fluoride (CeF3) precipitation method
(29,36,37). A small aliquot of the Pu aqueous standard was added to a 3 M
HNO3 solution with a total activity concentration equivalent to 2200 Bq/g of
solution verified by LSC counting.
14
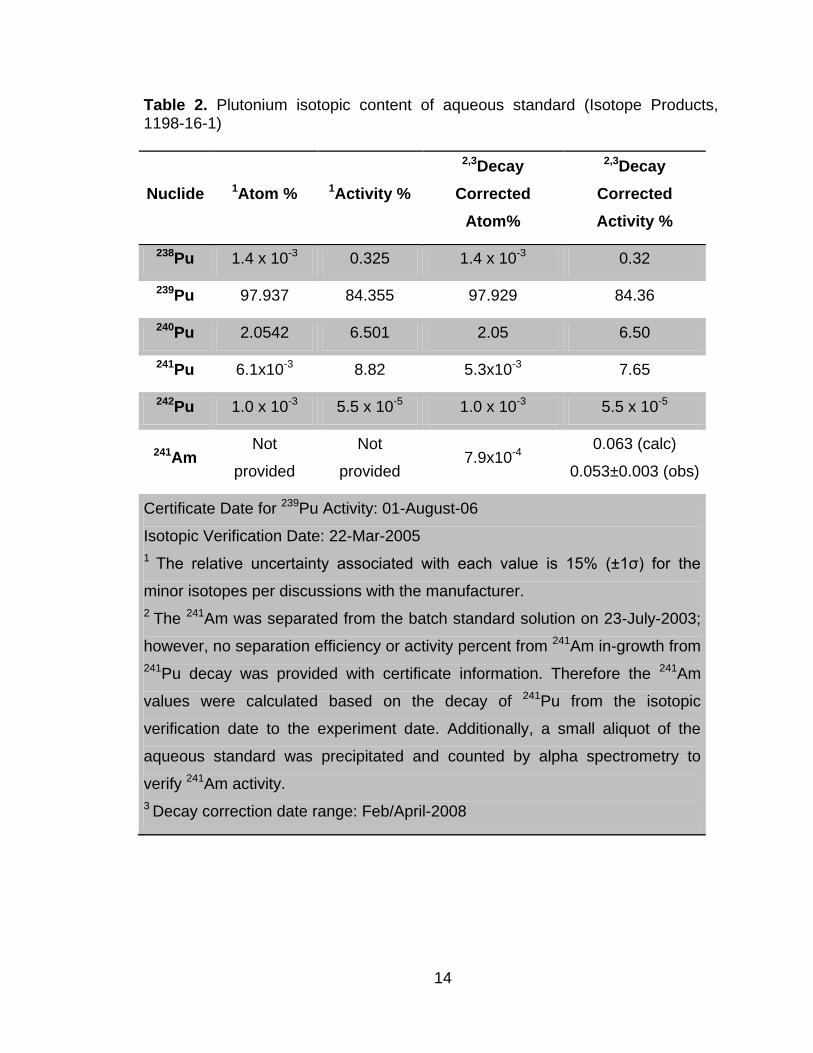
Table 2. Plutonium isotopic content of aqueous standard (Isotope Products, 1198-16-1)
Nuclide 1Atom % 1Activity %
2,3Decay
Corrected
Atom%
2,3Decay
Corrected
Activity %
238Pu 1.4 x 10⁻³ 0.325 1.4 x 10⁻³ 0.32
239Pu 97.937 84.355 97.929 84.36
240Pu 2.0542 6.501 2.05 6.50
241Pu 6.1x10⁻³ 8.82 5.3x10⁻³ 7.65
242Pu 1.0 x 10⁻³ 5.5 x 10⁻⁵ 1.0 x 10⁻³ 5.5 x 10⁻⁵
241Am Not
provided
Not
provided 7.9x10⁻⁴
0.063 (calc)
0.053±0.003 (obs)
Certificate Date for 239Pu Activity: 01-August-06
Isotopic Verification Date: 22-Mar-2005
1 The relative uncertainty associated with each value is 15% (±1ζ) for the
minor isotopes per discussions with the manufacturer.
2 The 241Am was separated from the batch standard solution on 23-July-2003;
however, no separation efficiency or activity percent from 241Am in-growth from
241Pu decay was provided with certificate information. Therefore the 241Am
values were calculated based on the decay of 241Pu from the isotopic
verification date to the experiment date. Additionally, a small aliquot of the
aqueous standard was precipitated and counted by alpha spectrometry to
verify 241Am activity.
3 Decay correction date range: Feb/April-2008
15
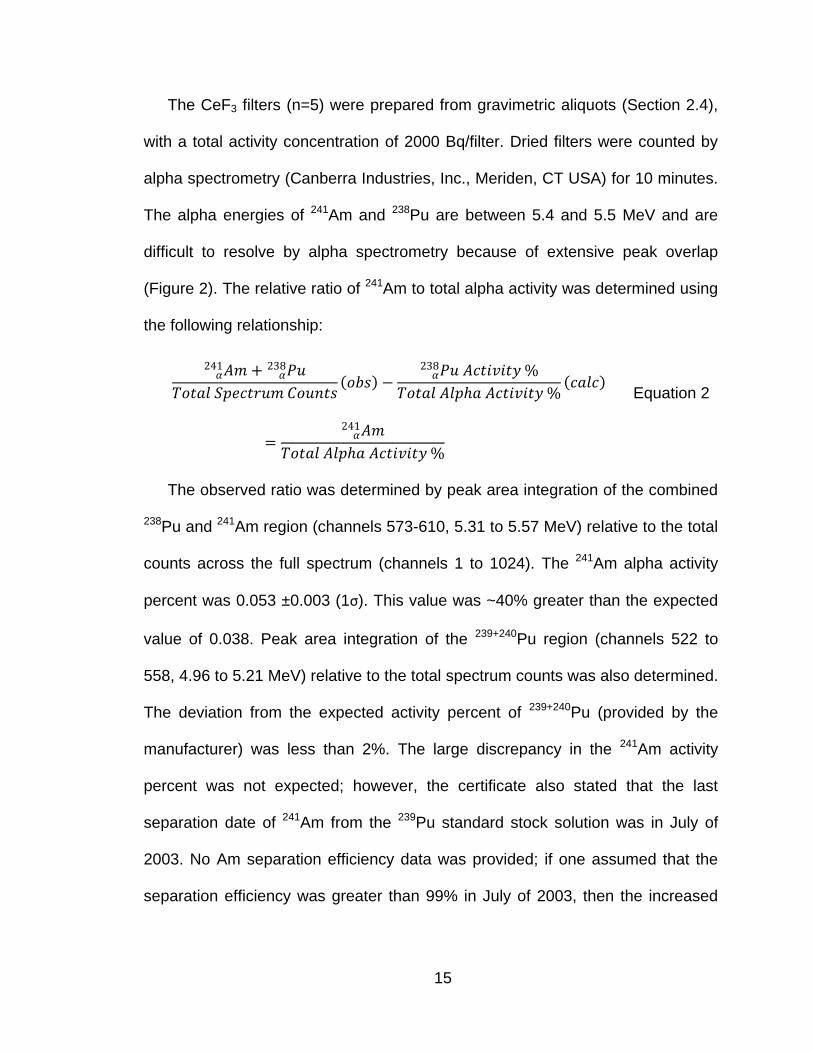
The CeF3 filters (n=5) were prepared from gravimetric aliquots (Section 2.4),
with a total activity concentration of 2000 Bq/filter. Dried filters were counted by
alpha spectrometry (Canberra Industries, Inc., Meriden, CT USA) for 10 minutes.
The alpha energies of 241Am and 238Pu are between 5.4 and 5.5 MeV and are
difficult to resolve by alpha spectrometry because of extensive peak overlap
(Figure 2). The relative ratio of 241Am to total alpha activity was determined using
the following relationship:
𝐴𝑚 + 𝑃𝑢𝛼238
𝛼241
𝑇𝑜𝑡𝑎𝑙 𝑆𝑝𝑒𝑐𝑡𝑟𝑢𝑚 𝐶𝑜𝑢𝑛𝑡𝑠 𝑜𝑏𝑠 −
𝑃𝑢𝛼238 𝐴𝑐𝑡𝑖𝑣𝑖𝑡𝑦 %
𝑇𝑜𝑡𝑎𝑙 𝐴𝑙𝑝𝑎 𝐴𝑐𝑡𝑖𝑣𝑖𝑡𝑦 % 𝑐𝑎𝑙𝑐
=𝐴𝑚𝛼
241
𝑇𝑜𝑡𝑎𝑙 𝐴𝑙𝑝𝑎 𝐴𝑐𝑡𝑖𝑣𝑖𝑡𝑦 %
Equation 2
The observed ratio was determined by peak area integration of the combined
238Pu and 241Am region (channels 573-610, 5.31 to 5.57 MeV) relative to the total
counts across the full spectrum (channels 1 to 1024). The 241Am alpha activity
percent was 0.053 ±0.003 (1σ). This value was ~40% greater than the expected
value of 0.038. Peak area integration of the 239+240Pu region (channels 522 to
558, 4.96 to 5.21 MeV) relative to the total spectrum counts was also determined.
The deviation from the expected activity percent of 239+240Pu (provided by the
manufacturer) was less than 2%. The large discrepancy in the 241Am activity
percent was not expected; however, the certificate also stated that the last
separation date of 241Am from the 239Pu standard stock solution was in July of
2003. No Am separation efficiency data was provided; if one assumed that the
separation efficiency was greater than 99% in July of 2003, then the increased
16
presence of 241Am in solution was from decay of 241Pu from the separation date
to the isotopic verification date.
0
5e+2
1e+3
1.5e+3
2e+3
560 570 580 590 600 610 620
241Am
238Pu
Co
un
ts
Channel
Figure 2. Alpha spectra for 238Pu and 241Am. The spectrum for each radionuclide was acquired separately with an Alpha Analyst system.
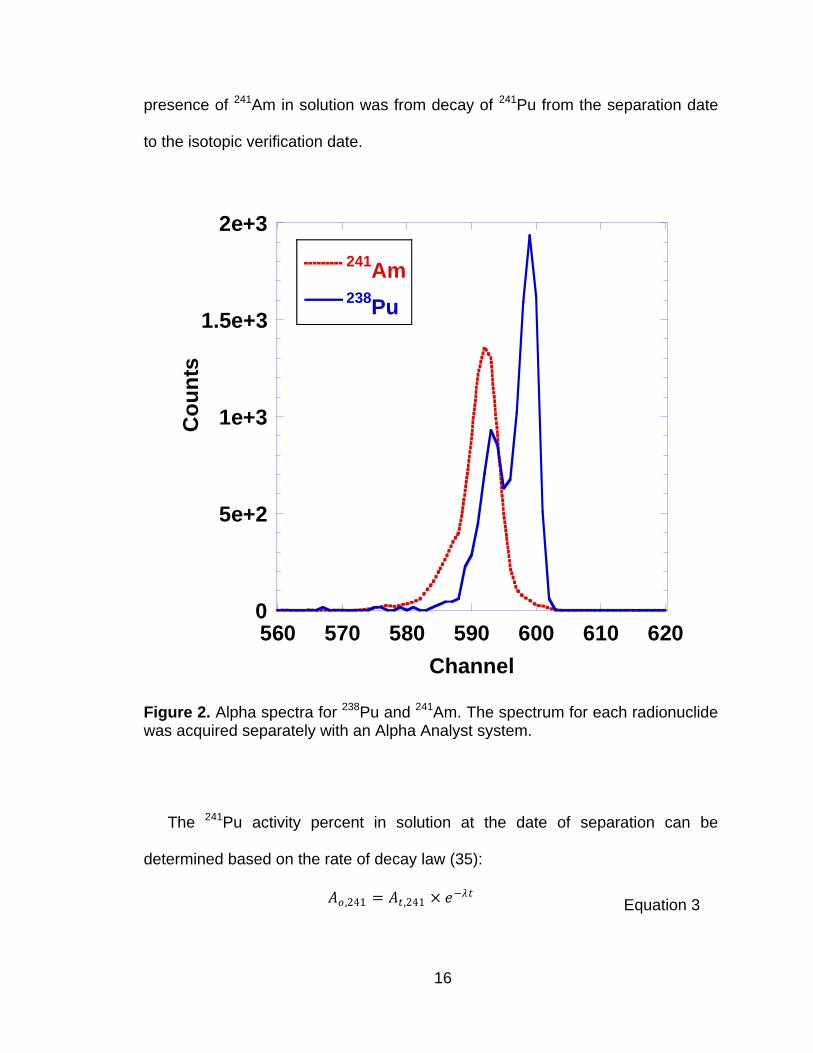
The 241Pu activity percent in solution at the date of separation can be
determined based on the rate of decay law (35):
𝐴𝑜 ,241 = 𝐴𝑡 ,241 × 𝑒−𝜆𝑡 Equation 3
17
where At,241 and Ao,241 are the activity percent of 241Pu present at the time of
isotopic verification and at the time of initial Am separation, respectively. The t in
Equation 3 is the time elapsed from the date of Am separation to the isotopic
verification date, 608 days and λ is the decay constant for 241Pu. The 241Am
percent activity concentration in solution, calculated from the date of the last
chemical separation, was 0.063%. The relative uncertainty associated with each
isotopic mass and activity percent value was ±15%, therefore the value obtained
by alpha spectrometry with the CeF3 precipitated standard was in good
agreement with expectations and was used for all activity corrections for the Pu
separation studies.
2.4 Cerium Fluoride Precipitation Sample Preparation
High resolution alpha spectrometry samples of Am and Pu were prepared by
CeF3 precipitation for isotopic analysis and actinide separation efficiency
determination. This method was chosen based on fast preparation time, high
actinide recovery, good energy resolution, and sample reproducibility (29,36,37).
A cerium nitrate carrier (Ce(NO3)3∙6H2O) was added to the sample solution
containing the actinides of interest along with an excess of concentrated HF. The
sample was set aside for approximately 30 minutes to optimize the formation of
the CeF3 precipitate, Ksp= 8 x 10-16 (38). The relative similarities in size and
charge of Ce (and other lanthanides) to the actinides in the tri- and tetravalent
oxidation states causes the actinides to co-precipitate with the carrier. The
solution containing the precipitate was filtered through a 0.1 µm, 25 mm diameter
18
polypropylene Resolve filter (Eichrom, Darien, IL USA) and rinsed with DI water.
Excess water was driven off with ethanol and the filters were dried prior to alpha
analysis. The method described above is a standard method (29) available from
the filter manufacturer, Eichrom Technologies, Inc. The filters were also counted
by gamma spectrometry and were subjected to mass analysis by inductively
couple plasma mass spectrometry using a laser ablation solid sampling
technique.
2.5 Alpha Spectrometry
Alpha spectrometry is a useful tool to distinguish between various alpha
emitting radionuclides and evaluate isotopic composition. The spectrometer is
made up of a series of vacuum chambers that house solid-state semiconductor
detectors. Under vacuum, the alpha particles emitted from a sample placed in
front of the detector travel the short distance from the filter and deposit their
energy within the active region of the detector. The energy deposited by each
alpha particle is converted to a charge which is collected, amplified, and binned
by a multi-channel analyzer (MCA) which converts the electronic signal to a
digital signal. The resulting spectra can be processed to determine the number of
counts associated with narrow energy ranges across an entire energy spectrum.
A more detailed description of alpha spectrometry can be found in (39).
A 12 chamber alpha spectrometer system (Canberra Industries, Inc.,
Meriden, CT, USA) was used for all alpha analysis experiments. The passivated
implanted planar silicon (PIPS) detectors had an active area of 450 mm2 and the
19
sample position with respect to the detector face was fixed using the
manufacturer provided sample trays and chamber tray steps. The sample tray
was placed in the fourth tray step, which was approximately 16 mm from the
detector face. The CeF3 filters were placed in small polystyrene Petri dishes (30
mm x 10 mm) and covered with an o-ring to prevent filter curling during chamber
evacuation.
2.5.1 Detector Calibration
Background spectra were collected over a 24 hour time period for each
vacuum chamber prior to and after sample analysis to determine the residual
alpha activity in the chamber. The background activity ranged from 0 to 6x10⁻³
cps across all vacuum chambers. Higher activity samples, i.e. greater than 50
Bq/ sample, were counted in the high background chambers. Filters with
expected activity levels less than 50 Bq were counted in the low background
chambers. Each alpha detector was efficiency calibrated using electroplated
241Am and 210Po calibration sources (Table 3). Counting efficiency was
determined using the following formula:
𝑂𝑏𝑠𝑒𝑟𝑣𝑒𝑑 𝐶𝑜𝑢𝑛𝑡𝑠
𝑅𝑒𝑓𝑒𝑟𝑒𝑛𝑐𝑒 𝐴𝑟𝑒𝑎𝑥100% = 𝐷𝑒𝑡𝑒𝑐𝑡𝑜𝑟 𝐸𝑓𝑓𝑖𝑐𝑖𝑒𝑛𝑐𝑦 Equation 4
where observed counts were the counts collected in a user specified region of
interest (ROI) and reference area was the expected number of counts based on
decay corrected activity calculations. Each standard was counted 3 times in a
given chamber for 1000 seconds. Alpha detection efficiency was approximately
16% across all detectors for both calibration standards. The spectrometer was
also efficiency calibrated with CeF3 precipitated standards that were developed
20
in-house. It was important to determine the counting efficiency for a source with
the same geometry and that was prepared in similar fashion to experimental
samples.
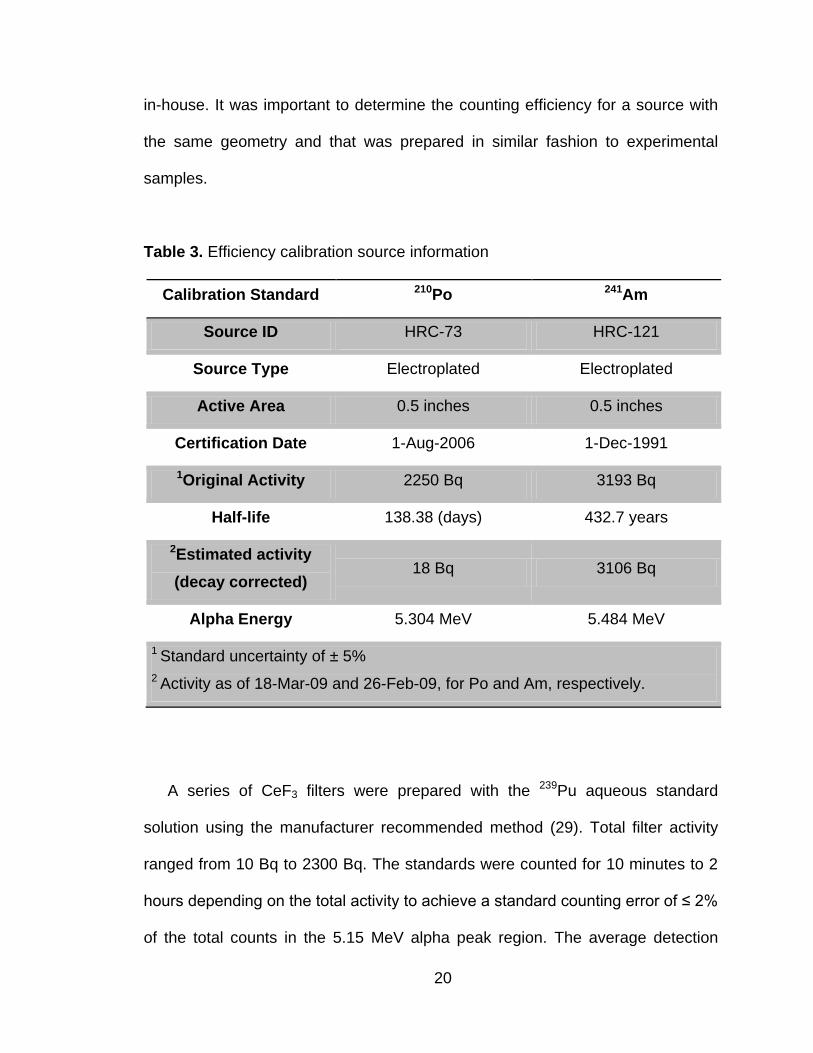
Table 3. Efficiency calibration source information
Calibration Standard 210Po 241Am
Source ID HRC-73 HRC-121
Source Type Electroplated Electroplated
Active Area 0.5 inches 0.5 inches
Certification Date 1-Aug-2006 1-Dec-1991
1Original Activity 2250 Bq 3193 Bq
Half-life 138.38 (days) 432.7 years
2Estimated activity
(decay corrected) 18 Bq 3106 Bq
Alpha Energy 5.304 MeV 5.484 MeV
1 Standard uncertainty of ± 5%
2 Activity as of 18-Mar-09 and 26-Feb-09, for Po and Am, respectively.
A series of CeF3 filters were prepared with the 239Pu aqueous standard
solution using the manufacturer recommended method (29). Total filter activity
ranged from 10 Bq to 2300 Bq. The standards were counted for 10 minutes to 2
hours depending on the total activity to achieve a standard counting error of ≤ 2%
of the total counts in the 5.15 MeV alpha peak region. The average detection
21
efficiency for the CeF3 standard filters, across all activities was 11 ± 1%, which
assumes no losses in source fabrication.
0
2e+2
4e+2
6e+2
8e+2
1e+3
1.2e+3
350 400 450 500 550 600 650
Co
un
ts
Channel
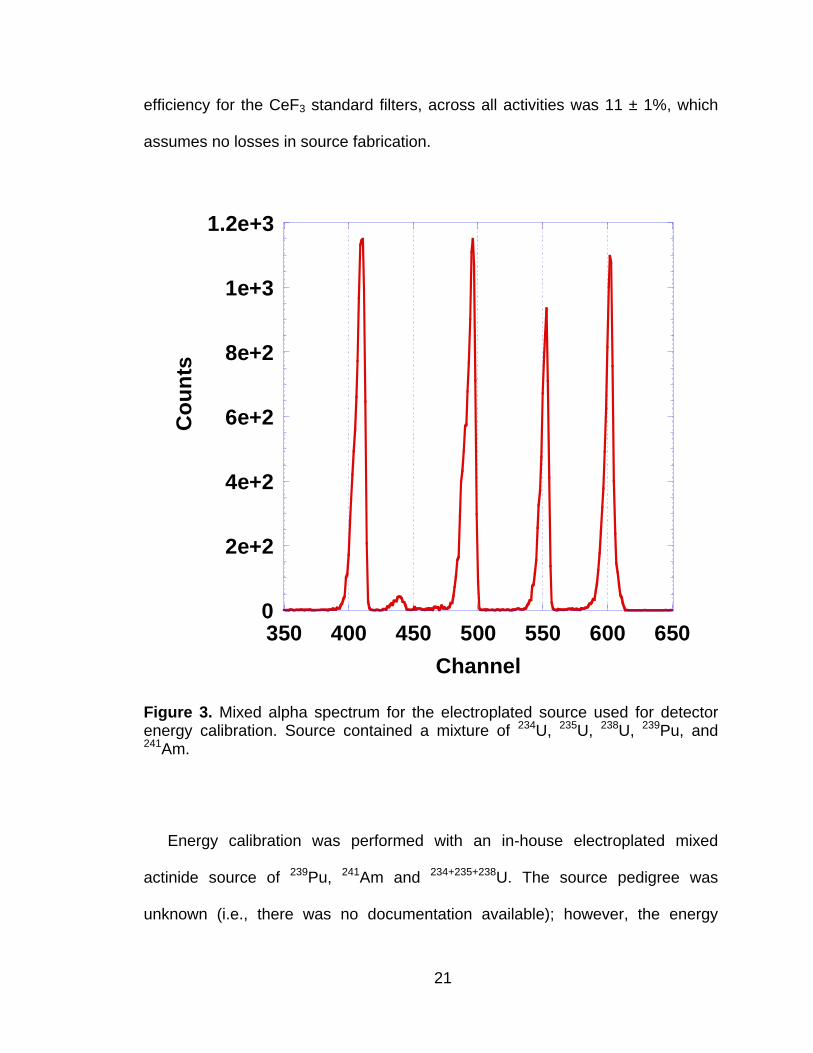
Figure 3. Mixed alpha spectrum for the electroplated source used for detector energy calibration. Source contained a mixture of 234U, 235U, 238U, 239Pu, and 241Am.
Energy calibration was performed with an in-house electroplated mixed
actinide source of 239Pu, 241Am and 234+235+238U. The source pedigree was
unknown (i.e., there was no documentation available); however, the energy
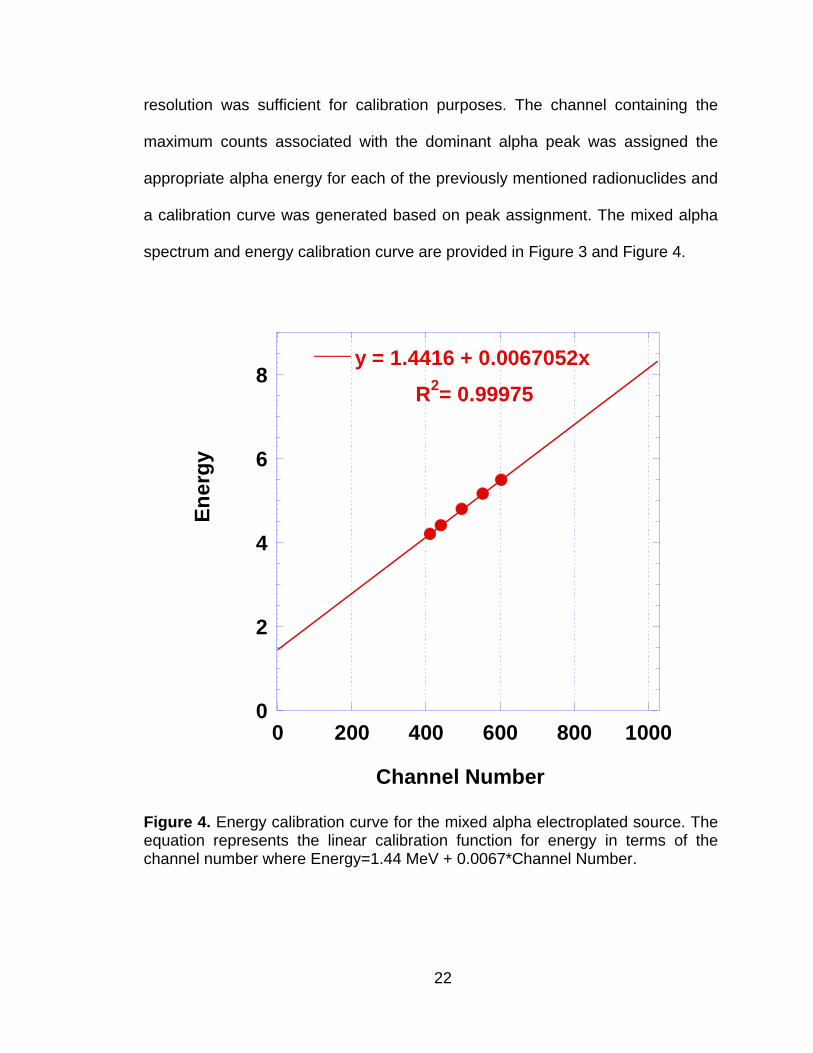
22
resolution was sufficient for calibration purposes. The channel containing the
maximum counts associated with the dominant alpha peak was assigned the
appropriate alpha energy for each of the previously mentioned radionuclides and
a calibration curve was generated based on peak assignment. The mixed alpha
spectrum and energy calibration curve are provided in Figure 3 and Figure 4.
0
2
4
6
8
0 200 400 600 800 1000
y = 1.4416 + 0.0067052x
R2= 0.99975
En
erg
y
Channel Number
Figure 4. Energy calibration curve for the mixed alpha electroplated source. The equation represents the linear calibration function for energy in terms of the channel number where Energy=1.44 MeV + 0.0067*Channel Number.
23
2.5.2 Data Analysis
Spectra were obtained in both CNF and IEC file format. The CNF file type is a
telnet configuration file which stores the session data for the alpha analyst
system. It was used for spectrum viewing and data analysis with the
manufacturer software, Genie 2000 (Canberra Industries, Inc.). The IEC file
format was opened and re-configured in Microsoft Excel for manual peak
integration analysis. Peak area was determined by integrating the number of
counts in a ROI. The channel boundary limits of the ROI were based on the
alpha energies of the radionuclides of interest and the energy calibration. The
energy ranges used for Pu and Am analysis are provided in Table 4. The percent
intensity (Column 3) represents the percent of the total alphas emitted from the
decay of the radionuclide that are within the specified energy range for a nominal
source produced according to the procedure described in Section 2.4.
Table 4. Alpha energy ROIs used for data analysis
Radionuclide Energy Range (MeV) % Intensity
239+240Pu 4.96 to 5.21 >99.9%
241Am and 238Pu 5.31 to 5.57 >99.9%
2.6 Gamma Spectrometry
Gamma spectrometry is a technique that is commonly used for radionuclide
identification and activity determination. The photon emitted from the decaying
24
nucleus interacts within the active volume of the detector. The energy deposited
by the photon produces charge carriers within the active volume that migrate
through an applied electric field and are collected at electrical contacts. The
current generated by charge carrier collection is processed in terms of pulse
height and charge collection time using a preamplifier and an amplifier. For each
photon, the amplifier output was fed into a multichannel analyzer where events
with energies between 0 and 515 keV were stored in 4096 channels. For
quantitative analysis, the spectrometer must be calibrated in terms of photon
energy and photon intensity (or flux density). Sample geometry and placement
with respect to the detector face also affect detection efficiency. A more detailed
review of gamma spectrometry can be found in the literature (39).
2.6.1 Detector Calibration
Separation efficiency and Pu isotopic information were characterized by
gamma spectrometry. A broad energy germanium (BEGe) detector (Canberra
Industries, Inc., Meriden, CT, USA) coupled with GENIE 2000 Gamma
Acquisition and Analysis software (v3.1a) was used for all experiments. Detector
specifications include an active area of 38 cm2, a crystal thickness of 30 mm and
a nominal efficiency (relative to a 2‖ cube of NaI) of 34% with the composite
carbon window. The detector was energy calibrated using a standard CeF3 filter
containing 2000 Bq of 239Pu (Source ID: 1198-16-1) developed in-house. The
standard was counted for 48 hours and peak analysis was conducted with
Interactive Peak Fit (v1.2), which is an add-on component of the GENIE 2000
software. The peaks selected for Pu isotopic identification and Am separation
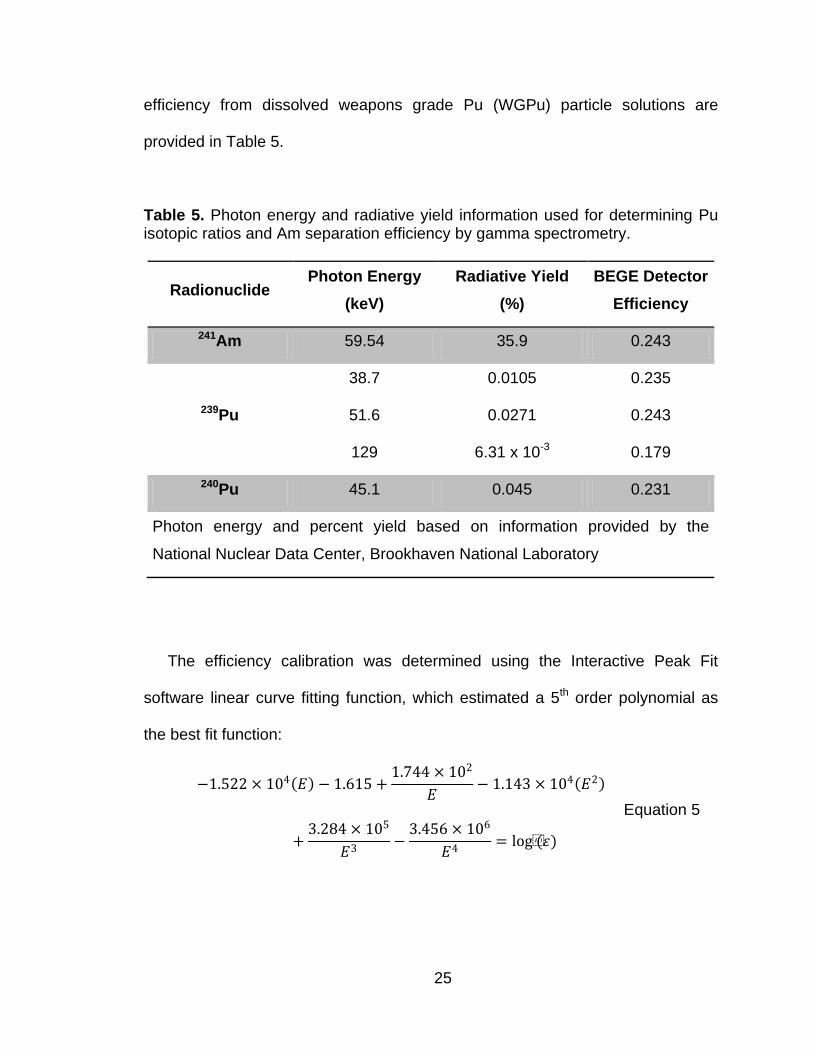
25
efficiency from dissolved weapons grade Pu (WGPu) particle solutions are
provided in Table 5.
Table 5. Photon energy and radiative yield information used for determining Pu isotopic ratios and Am separation efficiency by gamma spectrometry.
Radionuclide Photon Energy
(keV)
Radiative Yield
(%)
BEGE Detector
Efficiency
241Am 59.54 35.9 0.243
239Pu
38.7 0.0105 0.235
51.6 0.0271 0.243
129 6.31 x 10⁻³ 0.179
240Pu 45.1 0.045 0.231
Photon energy and percent yield based on information provided by the
National Nuclear Data Center, Brookhaven National Laboratory
The efficiency calibration was determined using the Interactive Peak Fit
software linear curve fitting function, which estimated a 5th order polynomial as
the best fit function:
−1.522 × 10⁴ 𝐸 − 1.615 +
1.744 × 10²
𝐸− 1.143 × 10⁴ 𝐸2
+3.284 × 10⁵
𝐸3−
3.456 × 10⁶
𝐸4= log(𝜀)
Equation 5
26
where E is the energy in units of keV and ε is the calculated detection efficiency
for a given photon energy. Efficiency values for some of the Pu photons of
interest are listed in Table 5.
2.6.2 Data Analysis
The CeF3 precipitated samples were counted by gamma spectrometry for 24
hours. The total activity of each sample was limited to 2000 Bq to minimize dead
time affects across samples and to achieve good counting statistics for Pu
isotopic ratio determination. Each CeF3 deposit contained roughly the same
amount of material so that attenuation effects on the intensities of the low energy
photons were subsumed into the efficiency function. Three photon energies were
used for determining 239Pu content. These photons were chosen based on the
relative proximity to the single photon energy useful for 240Pu evaluation. The
relative ratio of 239Pu to 240Pu was determined based on the following
relationship:
𝐶𝛾 ,239
𝜀𝛾 ,239 × 𝑌𝑖𝑒𝑙𝑑
𝐶𝛾 ,240
𝜀𝛾 ,240 × 𝑌𝑖𝑒𝑙𝑑
= 𝑅239/240 Equation 6
where C was the net counts in the photopeak, εγ was the BEGe detection
efficiency, and Yield was the radiative yield associated with a given photon
emission line. A more detailed description of the gamma spectrometry is
provided in subsequent chapters.
27
2.7 Liquid Scintillation Counting
LSC is a counting technique that is commonly used for determining gross
alpha and beta activity in an aqueous solution. An aliquot of the sample solution
is dissolved in a scintillation cocktail consisting of an organic solvent, scintillator
and emulsifier. Charged particles emitted from the decay of radioactive nuclei
transfer kinetic energy to the cocktail. The energy transfer ultimately results in the
release of photons by the process of photoluminescence that exit the sample vial
and impinge on the photocathode surface of the photomultiplier tube (PMT). The
sample vial is situated between two PMTs to increase counting geometry, and
the energy deposited is converted to an electrical current. A more complete
review of liquid scintillation counting and liquid organic scintillators can be found
in the literature (39,40).
2.7.1 LSC Sample Preparation
The LSC cocktail chosen for all experiments was Ultima Gold AB (Perkin
Elmer, Waltham, MA USA) because of its stability in the presence of strong
mineral acids, high sample capacity and quench resistance. The cocktail consists
of a diisopropylnaphthalene (DIPN) solvent with a 2,5-Diphenyloxazole (PPO)
fluor. Aliquots for LSC were taken from each sample prior to chemical separation
by EC and from each collected fraction resulting from EC. The type of mineral
acid and concentration varied depending on the separation procedure used and
the type of resin studied, but included HNO3, HCl and/or HF acids. Aliquot
volumes ranged from 0.100 mL to 1 mL depending on the total activity
28
concentration of the sample. This volume range was well below the sample
capacity of the cocktail, i.e. 2.5 mL of 3M HNO3 per 10 mL of cocktail.
Sample aliquots were placed in plastic, 20 mL LSC vials to which 10 mL of
LSC cocktail was added. The sample/cocktail mixture was immediately agitated
with a vortex mixer and counted on a Tri-carb 3100 LSC machine (Perkin Elmer,
Boston, MA, USA). Samples were prepared in batches with sample blanks and
method blanks. The sample blank contained no acid or sample component in the
LSC cocktail. Method blanks were prepared for each sample matrix solution type,
i.e. 3 M HNO3, 5 M HNO3, 4 M HCl, 0.1 M HCl/0.05 M HF/ 0.03 M TiCl3, etc. for
each sample volume used.
2.7.2 LSC Counting Method
The counting protocol was optimized for alpha-energy detection in the normal
counting mode using QuantaSmart, the LSC operating software. The LSC
machine contains a multi-parameter multichannel analyzer (MCA) that has an
operational energy range of 0 to 2000 keV. While most alpha decay energies are
between 4-7 MeV, most of the energy deposited is dissipated in the solvent,
leaving only approximately 1/10 the original alpha energy to interact with the
scintillator molecules (41). The proportional decrease in alpha-energy deposition
does not hinder detector counting efficiency (~100% for alpha detection) but it
does shift the energy spectral output into the beta energy spectrum. The signals
for alpha and beta can be partitioned based on signal response time (39,41),
however, for the experiments performed only total activity concentration per
sample was desired. The peak integration parameters for all actinide studies
29
were between 50 keV and 1000 keV, denoted as the CPMB region. The low-
energy beta particles arising in 241Pu decay fell into the 0 - 50 keV energy region,
which was denoted CPMA. All other counting protocol parameters were set to the
manufacturer recommended settings with one exception. The samples were set
to count for the full count time of one hour or until the counting error reached
2S% (2% of the 2ζ standard deviation of the total counts) in the CPMB energy
window (50-1000 keV). The 2S% is a standard protocol option that serves as a
normalization parameter for the comparison of multiple sample measurements,
i.e. the error reported for each measurement represents 2% of twice the standard
deviation of the counts collected in the CPMB region of the spectrum. The
average background count rate in the CPMB window was 8.83 ± 0.77 (1ζ) cpm
for sample blanks.
2.7.3 LSC Efficiency Calibration: Mineral Acid Affects
Prior to separation experiments, a series of aqueous Am standards with
activity concentrations ranging from 0.5 to 50 Bq 241Am were prepared in 10 mL
of LSC cocktail to characterize acid matrix effects on counting efficiency and
energy spectrum shifts. It was determined that higher acid concentrations
resulted in a 25 to 50 keV energy peak shift. An example of the peak shift due to
mineral acid concentration is shown in Figure 5 for 0.5 and 4 M HCl. Although the
higher mineral acid concentration affected the peak shape and location, there
was no effect on counting efficiency.
30
0
20
40
60
80
100
0 100 200 300 400 500 600
4 M HCl0.5 M HCl
1920
1940
1960
1980
2000
Co
un
ts
Energy (keV)
Figure 5. Energy spectral shift due to higher mineral acid concentration of dissolved sample. The 241Am activity concentration was 10 Bq/mL with a total sample volume of 1 mL in 10 mL of Ultima Gold AB LSC cocktail. Peak integral counts are equivalent; therefore the spectral shift (∆E centroid = 25 keV) did not result in decreased counting efficiency (100±3%).
Samples were also compared across mineral acid matrices, i.e. HNO3 vs. HCl
to mimic the experimental conditions. Figure 6 and Figure 7 compare the sample
loading and primary elution (E1) acid matrices for TRU and DGA resins (Chapter
3). The sample loading solution for TRU (and TEVA) separation experiments was
3 M HNO3 and 5 M HNO3 for DGA. The Am elution matrices were 0.5 M and 4 M
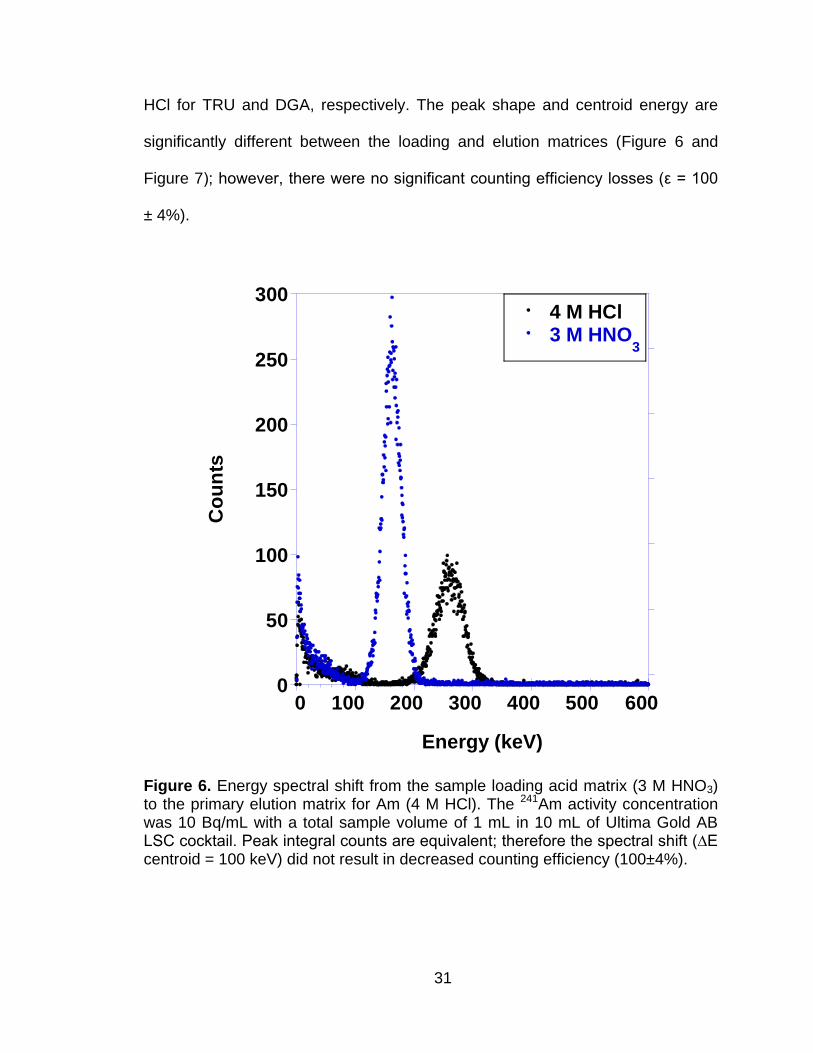
31
HCl for TRU and DGA, respectively. The peak shape and centroid energy are
significantly different between the loading and elution matrices (Figure 6 and
Figure 7); however, there were no significant counting efficiency losses (ε = 100
± 4%).
0
50
100
150
200
250
300
0 100 200 300 400 500 600
4 M HCl3 M HNO
3
Co
un
ts
Energy (keV)
Figure 6. Energy spectral shift from the sample loading acid matrix (3 M HNO3) to the primary elution matrix for Am (4 M HCl). The 241Am activity concentration was 10 Bq/mL with a total sample volume of 1 mL in 10 mL of Ultima Gold AB LSC cocktail. Peak integral counts are equivalent; therefore the spectral shift (∆E centroid = 100 keV) did not result in decreased counting efficiency (100±4%).
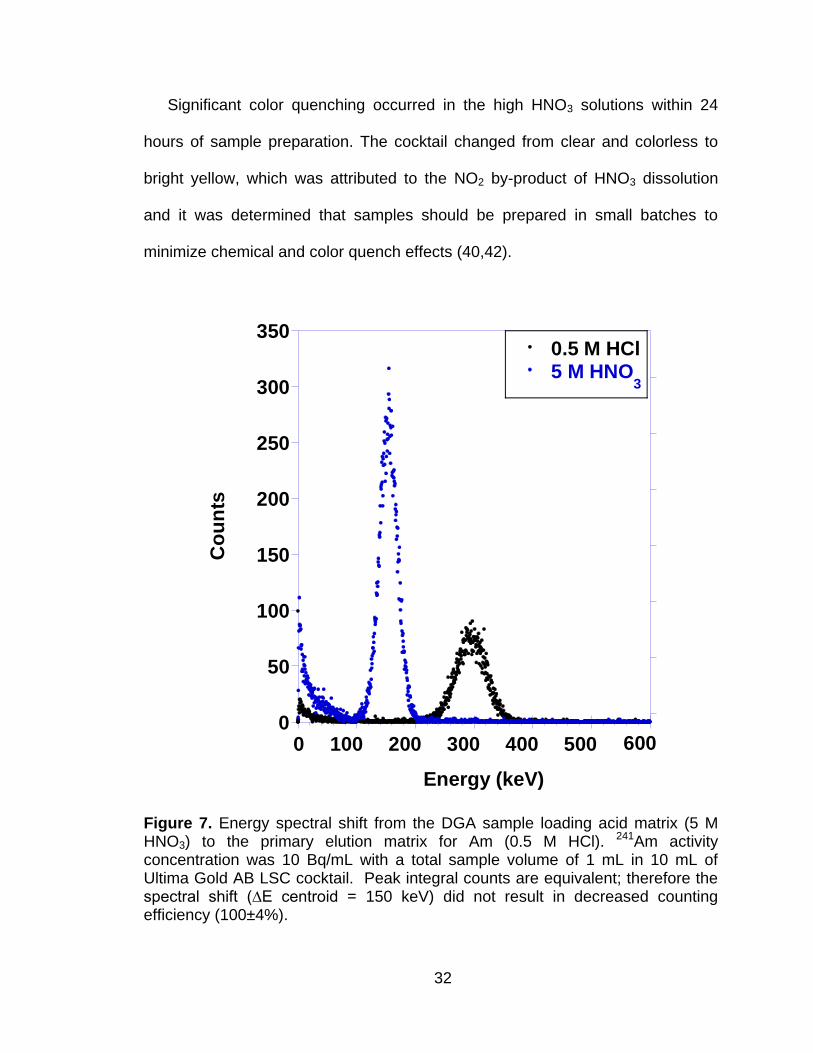
32
Significant color quenching occurred in the high HNO3 solutions within 24
hours of sample preparation. The cocktail changed from clear and colorless to
bright yellow, which was attributed to the NO2 by-product of HNO3 dissolution
and it was determined that samples should be prepared in small batches to
minimize chemical and color quench effects (40,42).
0
50
100
150
200
250
300
350
0 100 200 300 400 500 600
0.5 M HCl5 M HNO
3
Co
un
ts
Energy (keV)
Figure 7. Energy spectral shift from the DGA sample loading acid matrix (5 M HNO3) to the primary elution matrix for Am (0.5 M HCl). 241Am activity concentration was 10 Bq/mL with a total sample volume of 1 mL in 10 mL of Ultima Gold AB LSC cocktail. Peak integral counts are equivalent; therefore the spectral shift (∆E centroid = 150 keV) did not result in decreased counting efficiency (100±4%).
33
2.7.4 LSC Analysis
A batch report was provided by the operating software that contained the
sample number, count rate and standard deviation over the user-established
energy window range, and a quench indication parameter called the transformed
spectral index of the external standard (tSIE). The tSIE value is an estimate of
the degree of sample quenching (chemical or color-related) and is used as an
indicator of sample integrity. The results of LSC counts with tSIE values below
200 were discarded. Most of the LSC samples collected for the experiments had
tSIE values between 300 and 900. The tSIE parameter was used only for
qualitative purposes; no corrections were made to the sample count rate value
determined by the operating software based on the tSIE parameter. The counting
data for each post-separation sample was compared to the pre-separation
counting data to determine chemical recovery and method efficiency.
2.8 Inductively Coupled Plasma-Atomic Emission Spectrometry
Inductively coupled plasma atomic emission spectrometry (ICP-AES) is an
atomic spectrometry technique that makes use of the energy emitted when an
excited electron transitions to the ground state. The electronic properties of each
element produce a unique photon emission spectrum. Under most
circumstances, ICP-AES is conducted on aqueous samples at or near room
temperature. The sample is pumped through a nebulization chamber where it is
converted to an aerosol with compressed argon gas. Droplets are carried by the
argon into a torch assembly chamber and are atomized and the electrons are

34
promoted to an excited state by the intense heat (6000-10,000 K) of the argon
plasma. Photons are emitted as the excited atom returns to its ground state and
are detected by an array of solid state silicon detectors called charge-injection
devices (CID). Photons of a given wavelength are absorbed by a particular pixel
within the CID, and the signal is converted to a charge that is proportional to the
original intensity of photons at that wavelength. For elemental analysis, specific
wavelengths are chosen based on the composition of the original sample and the
relative intensity of the photons at that wavelength. A more detailed explanation
of ICP-AES instrumentation can be found in the literature (43,44).
For elemental analysis experiments (Chapters 3-5), an iCAP 6500 series
(Thermo Scientific, Inc., Cambridge, UK) ICP-AES was used. It is an Echelle-
based spectrometer, meaning that the wavelengths of the photons emitted by the
excited atom are arrayed across an Echelle grating from low to high wavelength.
The CID detector is manufactured to a certain size and shape to match the
Echelle spectrum (i.e. captures light intensity across the entire wavelength
spectrum from 166 to 847 nm). Each bright spot on the CID corresponds to the
intensity of photons at a given wavelength, emitted by a specific element, with a
brighter spot indicating higher concentration of the element in the sample
solution. Additional information about the iCAP 6500 ICP-AES is available from
the manufacturer.
2.8.1 Sample Preparation
Immediately prior to sample analysis, a series of single element calibration
standards was prepared to determine the detector response over a wide range of
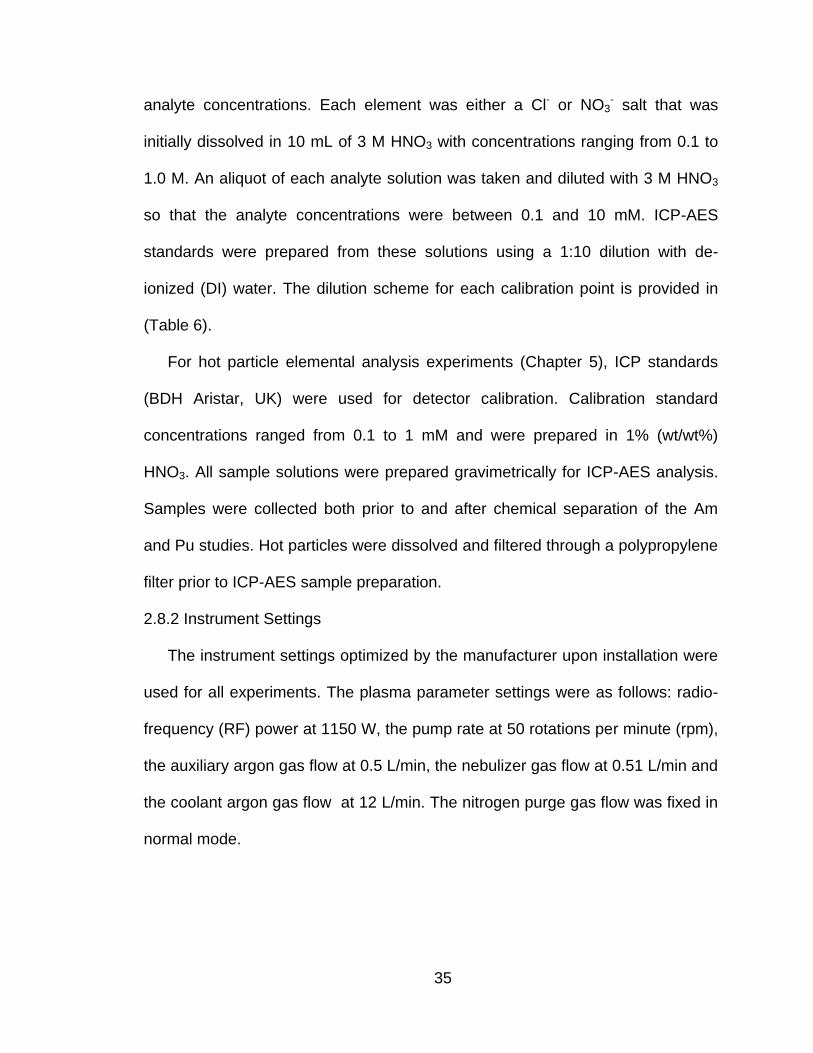
35
analyte concentrations. Each element was either a Cl- or NO3- salt that was
initially dissolved in 10 mL of 3 M HNO3 with concentrations ranging from 0.1 to
1.0 M. An aliquot of each analyte solution was taken and diluted with 3 M HNO3
so that the analyte concentrations were between 0.1 and 10 mM. ICP-AES
standards were prepared from these solutions using a 1:10 dilution with de-
ionized (DI) water. The dilution scheme for each calibration point is provided in
(Table 6).
For hot particle elemental analysis experiments (Chapter 5), ICP standards
(BDH Aristar, UK) were used for detector calibration. Calibration standard
concentrations ranged from 0.1 to 1 mM and were prepared in 1% (wt/wt%)
HNO3. All sample solutions were prepared gravimetrically for ICP-AES analysis.
Samples were collected both prior to and after chemical separation of the Am
and Pu studies. Hot particles were dissolved and filtered through a polypropylene
filter prior to ICP-AES sample preparation.
2.8.2 Instrument Settings
The instrument settings optimized by the manufacturer upon installation were
used for all experiments. The plasma parameter settings were as follows: radio-
frequency (RF) power at 1150 W, the pump rate at 50 rotations per minute (rpm),
the auxiliary argon gas flow at 0.5 L/min, the nebulizer gas flow at 0.51 L/min and
the coolant argon gas flow at 12 L/min. The nitrogen purge gas flow was fixed in
normal mode.
36
Table 6. ICP-AES calibration standard preparation
1Original
Solution
Concentration
(M)
Aliquot
Volume
(mL)
3M
HNO3
Added
(mL)
Adjusted Solution
Concentration
1:10 Dilution
for AES in DI
Water
[HNO3]
M
[M+]
mM
[HNO3]
M
[M]
mM
1 0.1 10 3 10 0.3 1
0.75 0.1 10 3 7.5 0.3 0.75
0.5 0.1 10 3 5 0.3 0.5
0.25 0.1 10 3 2.5 0.3 0.25
0.1 0.1 10 3 1 0.3 0.1
Second Dilution for Lower Concentrations
1 1* 10 3 1 0.3 0.1
0.75 1* 10 3 0.75 0.3 0.075
0.5 1* 10 3 0.5 0.3 0.05
0.25 1* 10 3 0.25 0.3 0.025
0.1 1* 10 3 0.1 0.3 0.01
* Aliquot volumes were taken from the adjusted solution standards.
1 Original solutions and second dilutions were prepared gravimetrically.
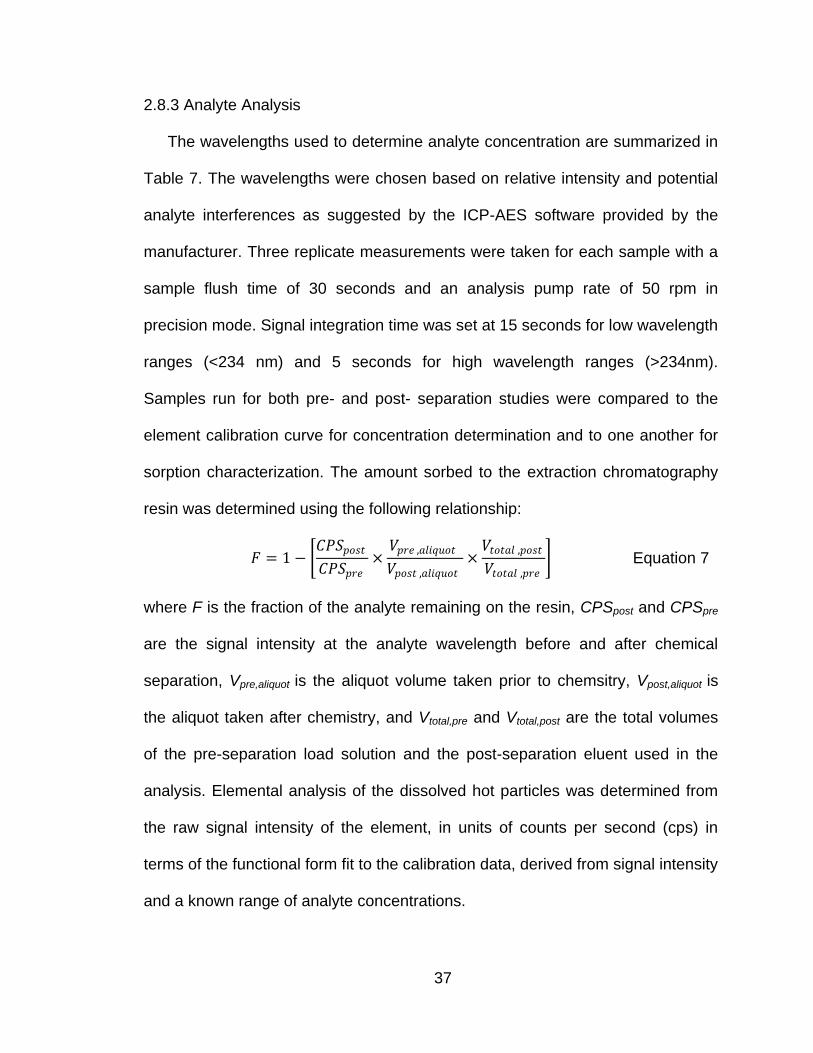
37
2.8.3 Analyte Analysis
The wavelengths used to determine analyte concentration are summarized in
Table 7. The wavelengths were chosen based on relative intensity and potential
analyte interferences as suggested by the ICP-AES software provided by the
manufacturer. Three replicate measurements were taken for each sample with a
sample flush time of 30 seconds and an analysis pump rate of 50 rpm in
precision mode. Signal integration time was set at 15 seconds for low wavelength
ranges (<234 nm) and 5 seconds for high wavelength ranges (>234nm).
Samples run for both pre- and post- separation studies were compared to the
element calibration curve for concentration determination and to one another for
sorption characterization. The amount sorbed to the extraction chromatography
resin was determined using the following relationship:
𝐹 = 1 − 𝐶𝑃𝑆𝑝𝑜𝑠𝑡
𝐶𝑃𝑆𝑝𝑟𝑒×
𝑉𝑝𝑟𝑒 ,𝑎𝑙𝑖𝑞𝑢𝑜𝑡
𝑉𝑝𝑜𝑠𝑡 ,𝑎𝑙𝑖𝑞𝑢𝑜𝑡×
𝑉𝑡𝑜𝑡𝑎𝑙 ,𝑝𝑜𝑠𝑡
𝑉𝑡𝑜𝑡𝑎𝑙 ,𝑝𝑟𝑒 Equation 7
where F is the fraction of the analyte remaining on the resin, CPSpost and CPSpre
are the signal intensity at the analyte wavelength before and after chemical
separation, Vpre,aliquot is the aliquot volume taken prior to chemsitry, Vpost,aliquot is
the aliquot taken after chemistry, and Vtotal,pre and Vtotal,post are the total volumes
of the pre-separation load solution and the post-separation eluent used in the
analysis. Elemental analysis of the dissolved hot particles was determined from
the raw signal intensity of the element, in units of counts per second (cps) in
terms of the functional form fit to the calibration data, derived from signal intensity
and a known range of analyte concentrations.
38
Table 7. Matrix ion photon wavelengths used to determine signal intensity on the ICP-AES.
Counter Ion Photon Wavelength (nm) Relative Intensity
Nitrogen 174.2 1.8 x 10⁴
Calcium 393.3 7.0 x 10⁷
Manganese 257.6 1.0 x 10⁷
Magnesium 279.5 5.0 x 10⁷
Zirconium 339.1 3.5 x 10⁶
Silicon 251.6 6.0 x 10⁵
Phosphorous 177.4 1.5 x 10⁵
Iron 259.9 2.0 x 10⁶
Aluminum 167.0 1.83 x 10⁶
Rubidium 424.4 2.5 x 10⁴
Cadmium 228.8 2.0 x 10⁶
Lead 220.3 1.2 x 10⁵
Gallium 294.3 4.0 x 10⁵
Platinum 214.4 1.5 x 10⁵
Titanium 334.9 5.0 x 10⁶
Uranium 367.0 5.0 x 10⁴
The relative intensity value is based on the detector sensitivity for the
element over other elements with similar photon wavelengths.
39
2.9 Inductively Coupled Mass Spectrometry
Inductively coupled plasma mass spectrometry (ICP-MS) is a technique that
is commonly used for elemental isotopic abundance analysis. This instrument
detects the subtle differences in the mass-to-charge (m/z) ratio of each isotope of
an element based on the principle that all the isotopes of a given element will
have the same nuclear charge (number of protons) and, consequently, the same
probability of having a given ionic charge (electron deficit), but a different atomic
mass due to the differences in neutron number. ICP-MS sample introduction for
aqueous solutions is similar to ICP-AES, in that the sample is converted to an
aerosol with a compressed gas and carried into the plasma torch chamber where
it is atomized and ionized by the intense heat of the plasma and induction in the
torch region. The ions are forced into an interface region where adjustments in
atmospheric pressure and temperature are made (transition into the high vacuum
mass collector). Prior to entering the mass collector, a charged metallic lens is
used to focus the ion beam into the mass filter. Mass filtration and collection is
accomplished by varying the radiofrequency and voltage inside the multipole
collector. Small changes in the current and RF parameters allow certain ions to
pass through to the detection chamber, while others remain in the quadrupole
collector. Ions reaching the detector collide with the dynode, which releases a
cascade of electrons and generates a measurable current. A more detailed
explanation of ICP-MS can be found in (43,44).
In Chapter 6, Pu mass analysis was performed with an ELAN DRC II ICP-MS
system (Perkin Elmer, Inc., Shelton, CT, USA). This system uses a dynamic
40
reaction cell (DRC) that is situated between the ion focusing lens and the mass
collector. The purpose of the DRC is to remove chemical interferences such as
polyatomic species (e.g. 238U-H at mass 239), prior to mass analysis (45).
2.9.1 Sample Preparation
A series of 239Pu mass calibration standards was prepared to determine the
detector response and limit of detection (LOD) for two different sets of samples.
The first set was prepared in 1% (wt/wt%) HNO3 and mass concentrations
ranged from 0 to 100 ng 239Pu/g solution. The second set was prepared for solid
analysis using the CeF3 co-precipitation method previously outlined with the
same mass concentrations 0-1000 ng 239Pu/filter. All sample solutions were
prepared gravimetrically for mass analysis, including the solutions prepared for
filtration. Solution volume was normalized to 10 mL.
2.9.2 Instrument Settings
Instrument settings are discussed in Chapter 6. The operation parameters
were optimized by the manufacturer upon installation. The radio-frequency (RF)
power was set at 1100 Watts, the nebulizer gas flow at 0.90 L/min, the argon
auxiliary gas flow was 1.20 L/min, the plasma gas flow was 15.00 L/min and the
vacuum pressure at < 7x10⁻⁶ torr. Prior to analysis, a daily performance system
check was conducted with a multi-elemental tuning solution and standard
instrument optimization procedures provided by the manufacturer were followed.
The system check ensured that instrument sensitivity, analyte precision, oxide
and doubly charged ratios were at acceptable levels prior to sample analysis.
Aqueous samples were measured consecutively using an autosampler (CETAC
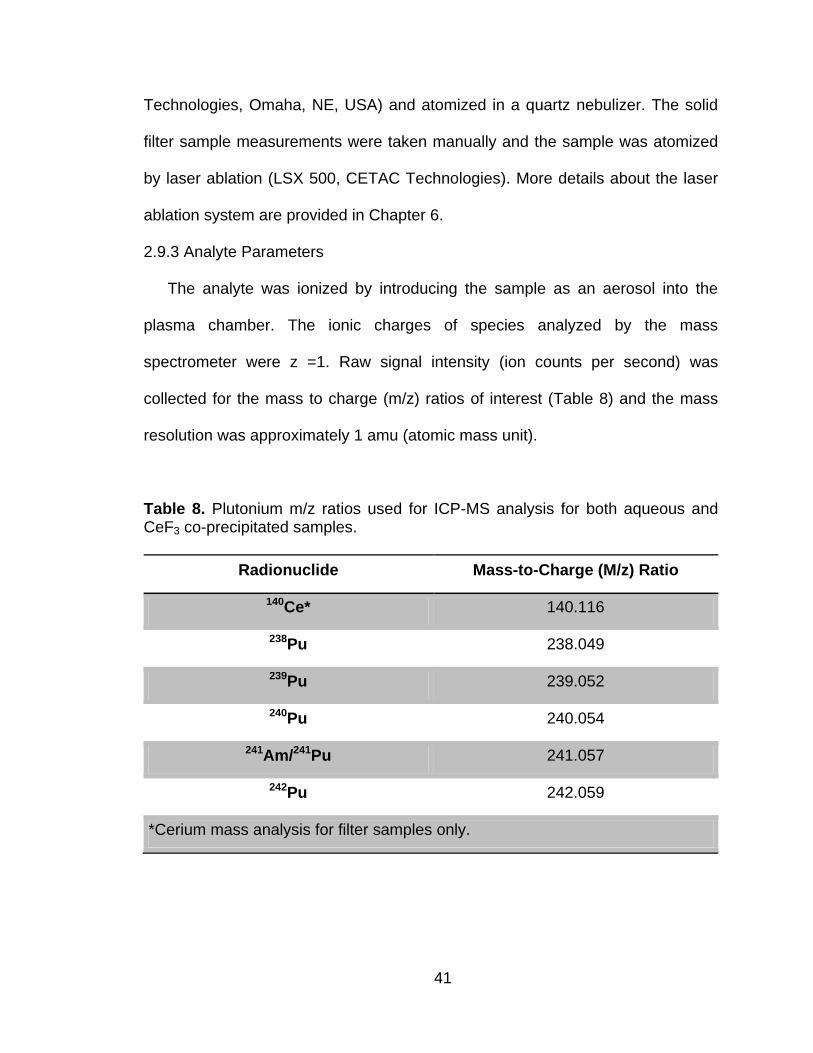
41
Technologies, Omaha, NE, USA) and atomized in a quartz nebulizer. The solid
filter sample measurements were taken manually and the sample was atomized
by laser ablation (LSX 500, CETAC Technologies). More details about the laser
ablation system are provided in Chapter 6.
2.9.3 Analyte Parameters
The analyte was ionized by introducing the sample as an aerosol into the
plasma chamber. The ionic charges of species analyzed by the mass
spectrometer were z =1. Raw signal intensity (ion counts per second) was
collected for the mass to charge (m/z) ratios of interest (Table 8) and the mass
resolution was approximately 1 amu (atomic mass unit).
Table 8. Plutonium m/z ratios used for ICP-MS analysis for both aqueous and CeF3 co-precipitated samples.
Radionuclide Mass-to-Charge (M/z) Ratio
140Ce* 140.116
238Pu 238.049
239Pu 239.052
240Pu 240.054
241Am/241Pu 241.057
242Pu 242.059
*Cerium mass analysis for filter samples only.
42
Peak analysis for each m/z ratio was performed manually for each sample.
Method blanks were prepared in 1% HNO3 to determine background peak signal
for each m/z ratio analyzed and were run between each pair of samples. The
calculations used to determine net signal intensity are described in Chapter 6.
2.9.4 Analyte Interferences
The primary objective of the experiments in Chapter 6 was to determine the
relative isotopic abundance (Table 2) of a Pu standard with respect to the
dominant isotope, 239Pu. Potential spectral interferences include the formation of
the doubly charged actinide (An2+), the actinide-oxide (An-O2+) and the hydride
(An-H+). The first two species result in a decrease in the observed m/z ratio and
the latter results in an increased m/z+1 ratio. The ICP-MS used for these
experiments had a high background signal for the 238 m/z ratio. It was suspected
that the elevated signal was due to the presence of natural or depleted U from
previous sample analyses or from possible U contamination in the nitric acid
used for sample preparation.
43
CHAPTER 3
EXTRACTION CHROMATOGRAPHY PERFORMANCE - AMERICIUM
SEPARATIONS
3.1 Abstract
In this work, physical and chemical parameters associated with extraction
chromatography separation procedures to facilitate the development of an
automated radioanalytical separations platform are investigated. A vacuum box
system was designed in-house, which incorporated a digitally controlled vacuum
regulator, multiple valves for optimum evacuation conditions and a stackable lid
that can accommodate 15 resin cartridges per lid for discrete sample processing.
The vacuum box system was characterized in terms of flow rate reproducibility,
matrix effects on flow rate for sequential elution, and actinide separation
efficiency using two different types of resin, TRU and DGA. Efficiency
characterization included reproducibility at various activity concentrations and in
the presence of common matrix interference ions. Results indicate that the
columnar kinetics of the resins are sufficiently rapid to run high purity Am
samples through the unit over a wide range of flow rates for both resin types.
Single matrix interferences at a metal ion ratio of 1:106 relative to Am have little
effect on separation efficiency at varied flow rate conditions. It was determined
that DGA resin has better sorption/desorption characteristics in terms of Am
recovery but is also more sensitive to the presence of Zr and PO43- matrix
contaminants than the TRU resin. This preliminary data has been used to

44
develop a modularized actinide analysis procedure that can be transferred to an
automated solid phase extraction unit.
3.2 Introduction
A persistent challenge in both the nuclear forensic and environmental
sciences is the accurate and timely determination of isotopic information in
samples containing a mixture of actinides. Many rapid analysis methods have
been developed over the last few years, with most incorporating commercially
available extraction chromatography resins for the chemical separation and
purification of actinides in aqueous samples (14, 46-50). These resins are
preferred by some experimenters over more traditional separations methods
such as co-precipitation, solvent extraction and ion exchange chromatography
because of the high degree of selectivity of the resin for actinides in the presence
of other matrix constituents (15,34,51).
Several automated separation methods have also incorporated these resins
into on-line or continuous process monitoring systems for trace analysis in
bioassay, environmental and medical isotope applications (16-23). These
systems are designed for sequential sample processing, meaning that batch
samples are run through the system one at a time. The major disadvantage of
this type of system is the increased risk of cross-contamination between
samples, especially when non-routine samples are being processed. As an
example, soil samples collected from areas where nuclear testing/accidents have
occurred contain actinide concentrations from trace levels to several milligrams

45
due to the inhomogeneous distribution of debris and radioactive particulates in
the environment (52-56). Under these conditions, it is important to keep each
sample isolated - if cross-contamination occurs within the analysis system,
critical information that can be used for remediation efforts or source term
identification may be compromised. In this respect, many radioanalytical
laboratories continue to develop rapid (less than 8 hours) manual methods for
time-sensitive samples.
Recent publications (10-12, 25-28) have demonstrated the utility of vacuum-
assisted separations for a wide range of sample matrices. A vacuum box system
was used to accelerate chemical separations and to process multiple samples
simultaneously. This discrete approach to batch sample analysis reduces the risk
of cross-contamination between samples and decreases experimental variability
within a given batch. In comparison with pressurized extraction chromatography
systems, vacuum extraction techniques promote more uniform column
performance. Forced flow from a pressurized system can lead to the diminution
of column loading capacity. As an example, an over-pressurized column can lead
to resin compaction or channeling (formation of preferential flow paths) resulting
in a decrease in the number of theoretical plates available for chemical
exchange.
Although vacuum-assisted separations are efficient for batch processing,
sample through-put is limited by the labor force and individual skill sets. It is the
goal of this research to develop automated vacuum-assisted chemical separation
methods. Custom built robotic platforms using off-the-shelf laboratory
46
components are ideal for large scale sample analysis and individual components
already exist for portions of the radioanalytical process. Translating manual
methods into automated methods requires a greater understanding of the
physical and chemical parameters that are important from an engineering
standpoint. Each step must be evaluated first on a basic level to determine which
portions of the process are critical for achieving acceptable results. Once the
fundamental chemical reactions are understood, each step can then be
approached from an engineering perspective to optimize the procedure for
automation.
Two extraction chromatography resins are discussed in this work, TRU and
DGA (Eichrom Industries, Inc.). The extraction properties of these resins are
described (30,31) and are used primarily for the isolation of transuranics from
various acidic matrices. The parameters that govern actinide extraction efficiency
include flow phenomena, diffusion, and extraction kinetics (57). These
chemical/physical properties are influenced by the matrix constituents, the
extractant loading and mobile phase velocities, the column length, bead size and
the operating temperature (24). Each of these factors presents a unique
challenge for developing an automated separations method. Pre-packed, 2 mL
dry resin cartridges manufactured by Eichrom Technologies, Inc. (Darien, Il,
USA) are used in this work. These cartridges reduce column preparation time,
minimize variations associated with in-house column packing, provide an efficient
way of separating multiple radionuclides from matrix interferences with stackable
47
cartridges, and provide a working foundation for a modular vacuum box
automation platform.
This work evaluates a mixed actinide separations procedure for potential
automation. A digitally regulated vacuum box was developed and various
physical/chemical parameters were evaluated to establish method boundary
conditions. These parameters included engineering controls, such as evacuation
rate, pressure regulation, flow rate reproducibility, and cartridge failure. Method
efficiency is characterized in terms of flow rate regulation, yield reproducibility at
various concentrations, and versatility using aqueous samples containing 241Am.
Americium was selected for preliminary study based on its tendency to exist in a
single trivalent oxidation state in acid solution and well-characterized extraction
behavior on both DGA and TRU resins under the given matrix conditions (30,31).
Efficiency characterization studies were performed on high purity 241Am solutions
and solutions containing matrix interferences such as Mg, Mn, Zn, Fe, Al, Zr, Ca,
and PO43-. These interferences are found in natural and anthropogenic matrices
and are problematic for current radioanalysis protocols (30,58).
3.3 Materials and Methods
3.3.1 Vacuum Extraction System
The vacuum extraction unit developed for this project is made from acid-
resistant polyvinyl chloride (PVC) plates, held together with a PVC adhesive and
coated stainless steel screws, (Figure 1, Chapter 2). The box configuration
consists of 3 rows, each accommodating 5 resin cartridges for the ability to
48
process 15 samples simultaneously. The unit is connected to an acid vapor trap
and a digital vacuum regulator (DVR, J-Kem Scientific, Inc.) which controls the
atmospheric pressure within the box. The vacuum line connecting the rotary vane
vacuum pump (Edwards, Model No. EW-79303) to the DVR is split and a ball
valve and precision needle valve have been added with the inlets of each valve
terminating at the DVR outlet. The ball valve allows for rapid evacuation of the
vacuum box with loss of DVR fidelity, the precision needle valve limits the
evacuation rate of the system but improves the fidelity of the DVR. This
combination of valves allows for rapid evacuation of the system and increased
pressure stability over the course of the separation experiment.
3.3.2 Reagents
Nitric and HCl acid solutions were prepared from reagent grade acids (ACS
reagent grade, Merck KGaA, Darmstadt, Germany) and DI water (18 MΩ∙cm,
Millipore, Billerica, MA, USA). Aluminum nitrate nonahydrate crystals (ACS,
reagent grade, Merck KGaA) are added to the sample solution to increase the
NO3- concentration for enhanced Am uptake on the TRU resin (30).
Extraction chromatographic resins were obtained from Eichrom Technologies,
Inc. (Darien, IL, USA) in 2 mL pre-packed polypropylene cartridges. Two resins,
TRU and DGA were chosen for experimental evaluation. TRU resin (50-100 µm),
contains a mixed octylphenyl-N, N-di-isobutyl carbamoylphosphine oxide
(CMPO) and tri-n-butyl phosphate (TBP) stationary phase and is primarily used
for isolating and separating tri-, tetra- and hexavalent actinides (30). DGA is a
diglycolamide-based extraction chromatographic resin (DGA- normal, 50-100 µm,
49
40% w:w) that is also effective for actinide separations (31). Each pre-packed 2
mL cartridge is shipped dry and therefore must be pre-treated with the acid
matrix prior to use. This step serves several purposes – 1) the surfaces of the
beads are wetted, establishing the interface for chemical exchange, 2) it
equilibrates the resin for the nitrate system, 3) it washes the cartridge of any fines
or residual impurities and 4) it allows the NO3- to fill voided or dead space to
maximize the working capacity of the cartridge and provide a more uniform flow.
3.3.3 Radionuclide Standards
Americium stock solutions were prepared from traceable standard solutions.
An 241Am stock solution (1198-21-4, 01-Jul-06, Isotope Products, Valencia, CA,
USA) was prepared in 3 M HNO3∙ 1 M Al(NO3)3 with activity concentrations from
5 to 50 Bq/mL of stock solution. Aliquots of the original sample matrix and each
subsequent fraction were taken and the activity of each was measured by liquid
scintillation counting, LSC (Tri-carb 3100, Perkin Elmer, Boston, MA, USA) with
10 mL of Ultima Gold AB cocktail (Perkin Elmer, USA) as the counting medium.
The LSC samples were counted for 60 minutes or until the counting error
reached 2S% (2% of the 2ζ standard deviation of the total counts) in the CPMB
energy window (200-2000 keV). The 2S% is a standard protocol option that
serves as a normalization parameter for the comparison of multiple sample
measurements, i.e. the error reported for each measurement represents 2% of
twice the standard deviation of the counts collected in the CPMB region of the
spectrum. The average background count rate in the CPMB window was 8.83 ±
0.77 (1ζ) cpm for method blanks.
50
3.3.4 Flow Rate Characterization
The relationship between vacuum setting and flow rate was evaluated in
terms of precision and accuracy using a 3 M HNO3 solution. The vacuum set
point was programmed into the DVR and 10 mL of acid solution was added to
each of the sample reservoirs. The DVR activation switch was set to ―Run
Program‖ which opens the solenoid valve to allow the box to draw down to the
specified vacuum set point. The times required for the vacuum box to reach the
set point and for the sample reservoirs to empty were recorded for each resin
cartridge. Once the reservoirs emptied, the DVR activation switch was returned
to the neutral position and the box was allowed to return to equilibrium with
ambient conditions. The experiment was repeated under the same conditions at
various vacuum settings to determine flow rate vs. vacuum setting relationship
for an average cartridge. Additionally, the matrix effects vs. flow rate were
evaluated for each method fraction, i.e. column preparation, sample loading,
column rinse and elution matrices.
3.3.5 Americium Separation
A sample reservoir (30 mL polypropylene Luer-lock syringe, B-D, NJ, USA)
was connected to the top of the 2 mL resin cartridge. The resin bed was pre-
treated with 5 mL of the HNO3 sample matrix solution prior to sample loading,
followed by 10 mL of the 241Am stock solution. These two eluate solutions were
collected together in a labeled 50 mL centrifuge tube. Sequential column elutions
were performed to rinse the Am in place and/or strip it from the resin bed. The
sample loading and unloading matrices and volumes for the TRU and DGA
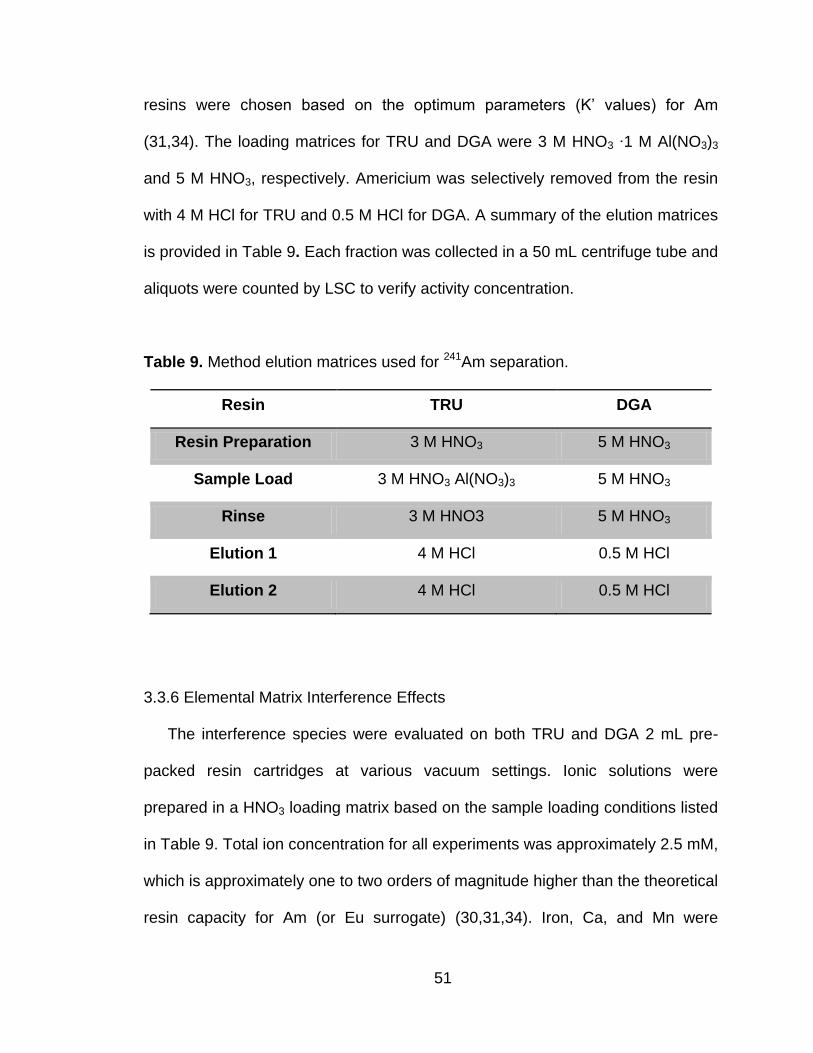
51
resins were chosen based on the optimum parameters (K‘ values) for Am
(31,34). The loading matrices for TRU and DGA were 3 M HNO3 ∙1 M Al(NO3)3
and 5 M HNO3, respectively. Americium was selectively removed from the resin
with 4 M HCl for TRU and 0.5 M HCl for DGA. A summary of the elution matrices
is provided in Table 9. Each fraction was collected in a 50 mL centrifuge tube and
aliquots were counted by LSC to verify activity concentration.
Table 9. Method elution matrices used for 241Am separation.
Resin TRU DGA
Resin Preparation 3 M HNO3 5 M HNO3
Sample Load 3 M HNO3 Al(NO3)3 5 M HNO3
Rinse 3 M HNO3 5 M HNO3
Elution 1 4 M HCl 0.5 M HCl
Elution 2 4 M HCl 0.5 M HCl
3.3.6 Elemental Matrix Interference Effects
The interference species were evaluated on both TRU and DGA 2 mL pre-
packed resin cartridges at various vacuum settings. Ionic solutions were
prepared in a HNO3 loading matrix based on the sample loading conditions listed
in Table 9. Total ion concentration for all experiments was approximately 2.5 mM,
which is approximately one to two orders of magnitude higher than the theoretical
resin capacity for Am (or Eu surrogate) (30,31,34). Iron, Ca, and Mn were
52
chloride salts, and Al and Zr were nitrate salts. Potassium phosphate salt was
used for the PO43- ion studies. Solutions were equilibrated at least 1 week prior to
use. All chemicals and reagents used were of analytical grade or better.
Each single ion matrix solution (10 mL) was run through a row of pre-treated
(wetted) resin cartridges (n = 5) on the 3x5 vacuum box system and collected in
50 mL centrifuge tubes. Total ion concentration was determined by inductively
coupled plasma absorption emission spectrometry, ICP-AES (iCAP 6000 Series
Thermo Scientific, Cambridge, UK). The solutions were diluted by a factor of 10
with DI water prior to analysis. Calibration curves were run for each ion based on
0-10 mM standard solutions gravimetrically prepared in 1 % HNO3 solution. The
wavelengths used for determining signal intensity were chosen from the
instrument software database based on relative signal intensity and minimized
spectral interferences, listed in Table 10. The nitrogen signal was collected for
baseline intensity to monitor the stability of the apparatus during analysis. The
manufacturer-recommended analytical parameters were used. Three replicate
measurements were taken for each sample with a sample flush time of 30
seconds in Precision analysis mode and a sample integration time of 15
seconds.
Americium separation and efficiency experiments (Section 3.3.5) were
repeated with each of the 2.5 mM single ion solutions at two separate vacuum
settings – 275 and 575 torr. Each matrix solution was spiked with 241Am at an
activity concentration of 50 Bq/mL of solution. Aliquots of each sequential elution
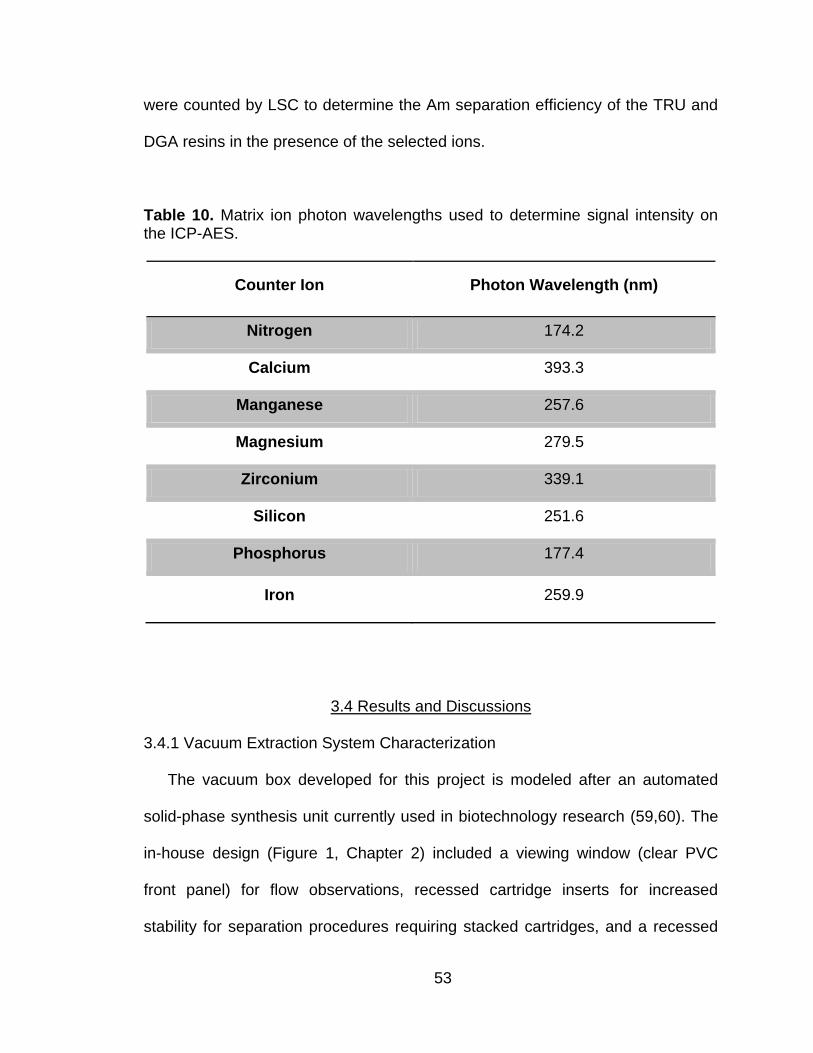
53
were counted by LSC to determine the Am separation efficiency of the TRU and
DGA resins in the presence of the selected ions.
Table 10. Matrix ion photon wavelengths used to determine signal intensity on the ICP-AES.
Counter Ion Photon Wavelength (nm)
Nitrogen 174.2
Calcium 393.3
Manganese 257.6
Magnesium 279.5
Zirconium 339.1
Silicon 251.6
Phosphorus 177.4
Iron 259.9
3.4 Results and Discussions
3.4.1 Vacuum Extraction System Characterization
The vacuum box developed for this project is modeled after an automated
solid-phase synthesis unit currently used in biotechnology research (59,60). The
in-house design (Figure 1, Chapter 2) included a viewing window (clear PVC
front panel) for flow observations, recessed cartridge inserts for increased
stability for separation procedures requiring stacked cartridges, and a recessed
54
channel lid with a low viscosity, self-leveling silicon gasket. The lock-tight lid was
designed for secure, reproducible placement (movement only in the z-axis, up-
down) and contamination control purposes. The box was coupled to a digital
vacuum regulator (DVR) and characterized in terms of control and reproducibility
of the internal pressure of the box, which affects the flow rate of the system. The
time required to reach the pre-selected set-point was dependent on the absolute
difference between the initial/ambient pressure inside the vacuum box and the
evacuation end point. The high degree of reproducibility of the time required to
evacuate the box can be used as a performance indicator for the system.
The evacuation rates for the vacuum system using 15 pre-packed 2 mL TRU
resin cartridges are provided (Figure 8). The error bars represent a 1ζ standard
deviation for the evacuation rate assuming a 5 torr variability in the DVR readout,
a 3 torr variability in the ambient pressure (once the box is in use the ambient
pressure adjusts slightly) and 0.5 second variability in the recorded time. At
vacuum settings close to ambient conditions, i.e. > 625 torr, it is believed that the
DVR read out does not accurately reflect the draw down pressure conditions in
the box. During the initial draw down phase, the large solenoid valve is used to
maximize the volume of air removed from the box. This solenoid valve is
controlled by the digital ―open/close‖ response. This response time (~0.1
seconds) is slow compared to the time required to evacuate a small volume of air
(61). Once the vacuum set-point is established, the variability in the set-point is
controlled via the precision needle valve. In the middle range of vacuum settings,
the mean evacuation rate, 30 ± 2 (1ζ) torr/sec, is fairly constant. As the vacuum
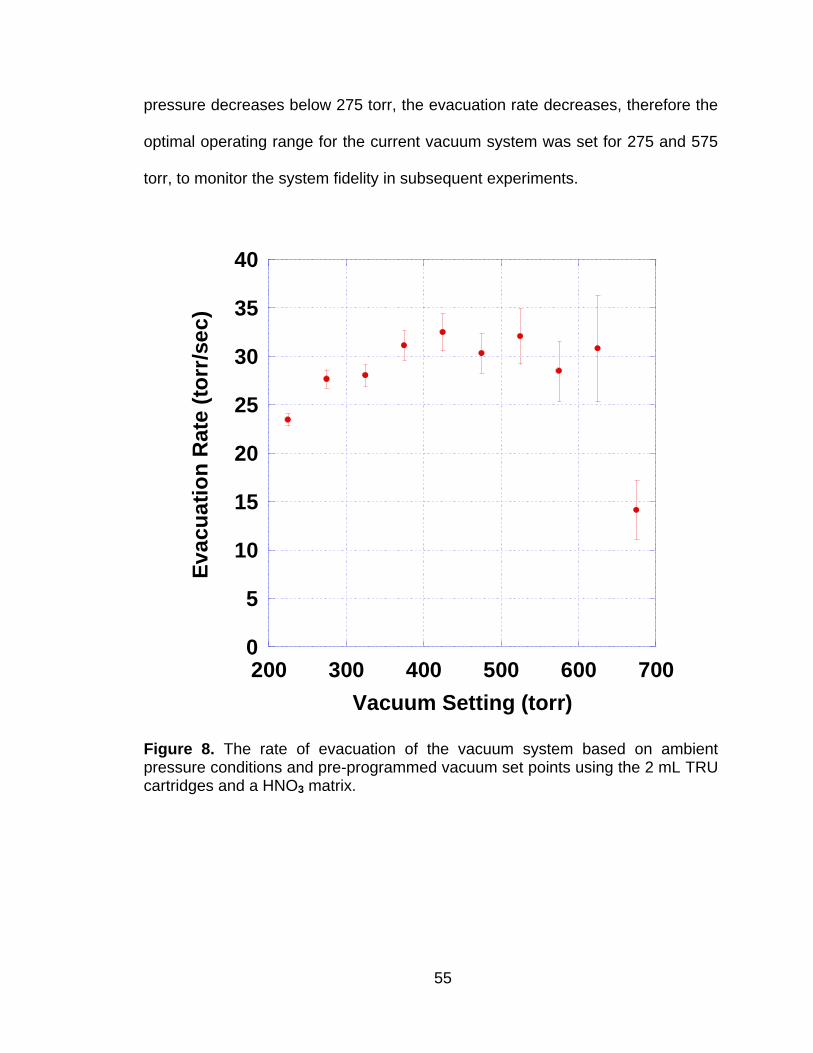
55
pressure decreases below 275 torr, the evacuation rate decreases, therefore the
optimal operating range for the current vacuum system was set for 275 and 575
torr, to monitor the system fidelity in subsequent experiments.
0
5
10
15
20
25
30
35
40
200 300 400 500 600 700
Ev
acu
ati
on
Ra
te (
torr
/se
c)
Vacuum Setting (torr)
Figure 8. The rate of evacuation of the vacuum system based on ambient pressure conditions and pre-programmed vacuum set points using the 2 mL TRU cartridges and a HNO3 matrix.

56
The relationship between flow rate and the DVR pressure settings for the
vacuum system with 3 M HNO3 as the loading matrix system is linear and
reproducible (Figure 9).
0
2
4
6
8
10
200 300 400 500 600 700
R2= 0.98781
Flo
w R
ate
(m
L/m
in)
Vacuum Setting (torr)
Figure 9. The relationship between flow rate and vacuum setting for the 3x5 vacuum box using a 3M HNO3 matrix solution. Each data point represents the average flow rate taken over 5 trials for 5 separate 2 mL pre-packed TRU resin cartridges.
57
Cartridges were tested at various x-y locations in the lid and no positional
dependence associated with preferential flow rate was observed. Slight
variations in the physical packing characteristics of the resin cartridges can also
influence the rate of flow (57).While using pre-packed (batch produced)
cartridges reduces packing variations, there are observable differences in flow
rate (0.4 ≤ 1ζ ≤ 0.9 mL/min) within a given batch of resin cartridges. The cause
of this variation was not studied in detail; however, the end result is that in a
given batch of samples, some resin cartridges run dry during the procedure. In
chromatography experiments, this is considered unfavorable. Data presented
herein indicate that the flow rate variation does not affect the separation
efficiency of Am (see Section 3.4.2).
For a given separation procedure, various matrices are used in sequence to
control the isolation of the actinide(s) of interest from other constituents. The
matrices used for the selective removal and recovery of 241Am for both TRU and
DGA resins (Table 9) and their influence on flow rate are presented (Figure 10
and Figure 11). There is a significant difference in the resin preparation step
between the two resins. In this step, the resin cartridges are wetted with 5 mL of
the nitric acid solution. The wetting characteristics of the resin can have an effect
on the porosity and mobile phase velocity (57). Initial characterization work for
the DGA resin (31) observed that the resin did not readily wet in nitric acid
solutions. In addition to wetting characteristics, viscosity and ionic strength can
have an effect on flow rate. The sample loading solution for the TRU resin
contains 1 M Al(NO3)3, which is added as a salting agent to increase the free
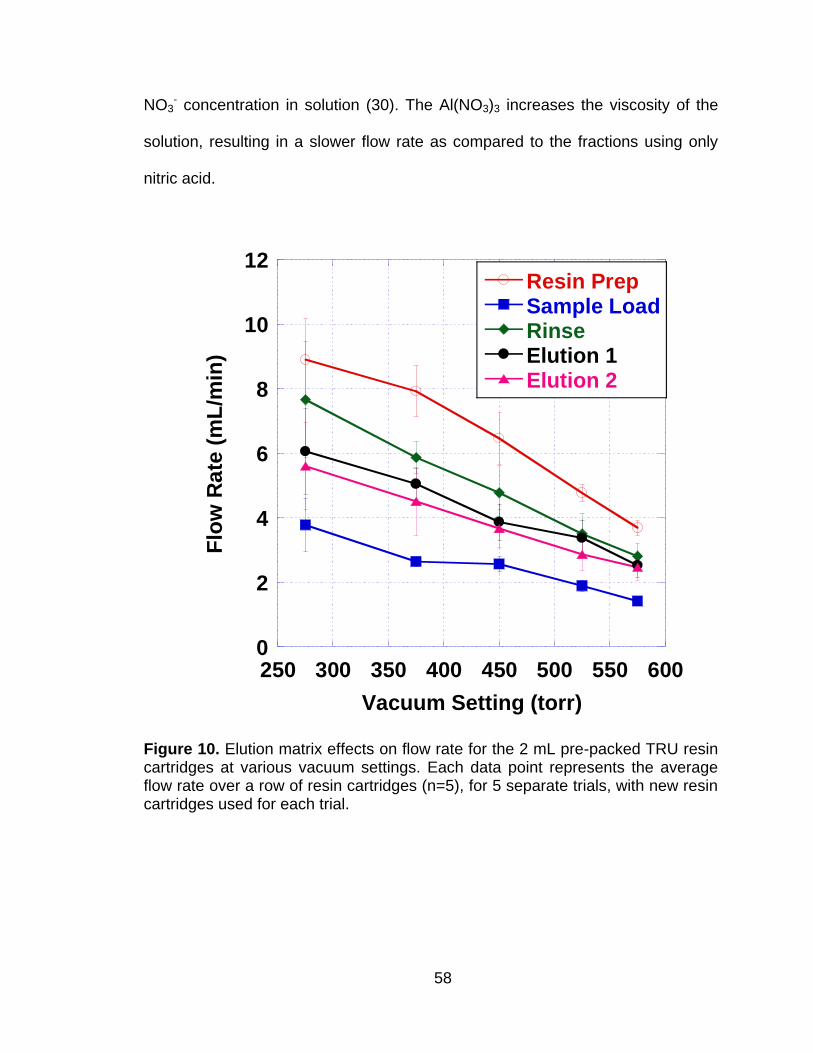
58
NO3- concentration in solution (30). The Al(NO3)3 increases the viscosity of the
solution, resulting in a slower flow rate as compared to the fractions using only
nitric acid.
0
2
4
6
8
10
12
250 300 350 400 450 500 550 600
Resin PrepSample LoadRinseElution 1Elution 2
Flo
w R
ate
(m
L/m
in)
Vacuum Setting (torr)
Figure 10. Elution matrix effects on flow rate for the 2 mL pre-packed TRU resin cartridges at various vacuum settings. Each data point represents the average flow rate over a row of resin cartridges (n=5), for 5 separate trials, with new resin cartridges used for each trial.
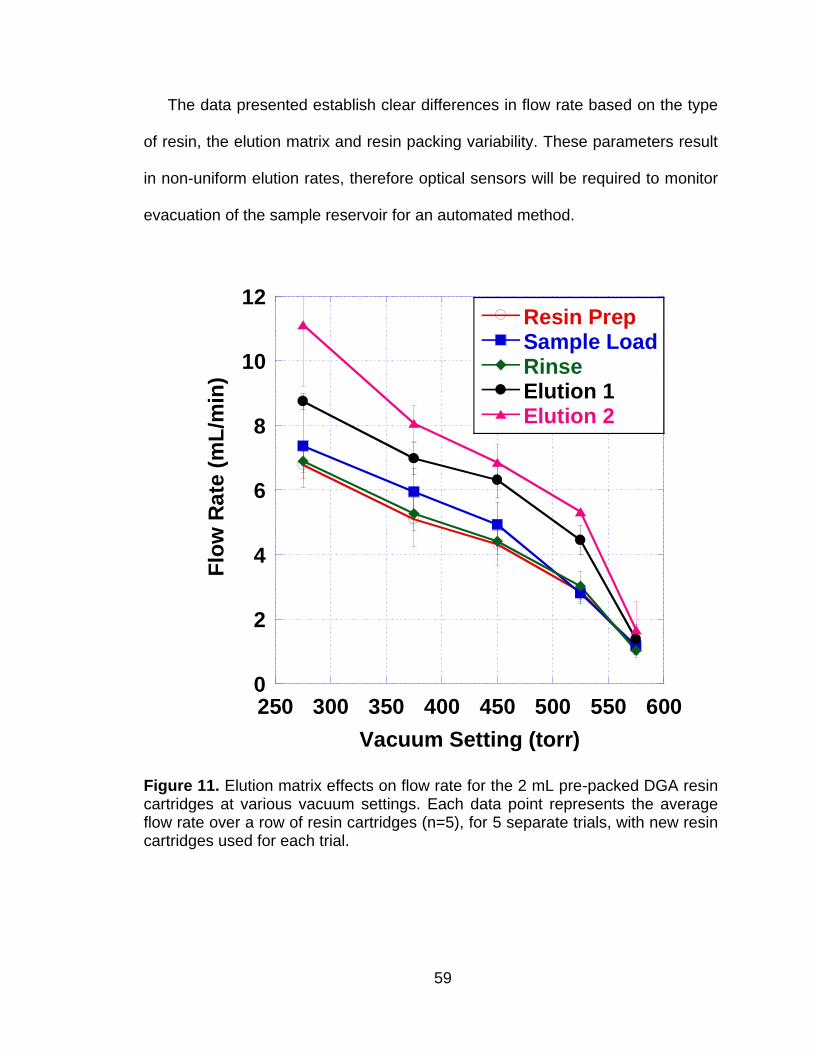
59
The data presented establish clear differences in flow rate based on the type
of resin, the elution matrix and resin packing variability. These parameters result
in non-uniform elution rates, therefore optical sensors will be required to monitor
evacuation of the sample reservoir for an automated method.
0
2
4
6
8
10
12
250 300 350 400 450 500 550 600
Resin PrepSample LoadRinseElution 1Elution 2
Flo
w R
ate
(m
L/m
in)
Vacuum Setting (torr)
Figure 11. Elution matrix effects on flow rate for the 2 mL pre-packed DGA resin cartridges at various vacuum settings. Each data point represents the average flow rate over a row of resin cartridges (n=5), for 5 separate trials, with new resin cartridges used for each trial.
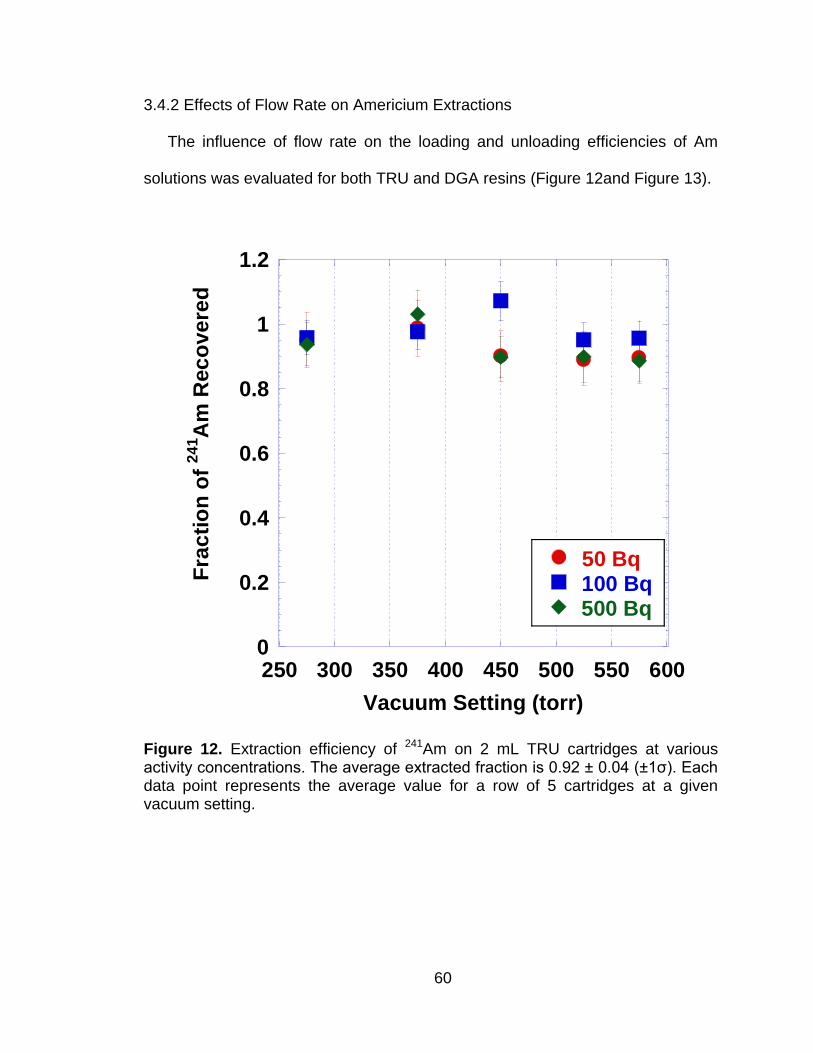
60
3.4.2 Effects of Flow Rate on Americium Extractions
The influence of flow rate on the loading and unloading efficiencies of Am
solutions was evaluated for both TRU and DGA resins (Figure 12and Figure 13).
0
0.2
0.4
0.6
0.8
1
1.2
250 300 350 400 450 500 550 600
50 Bq100 Bq 500 Bq
Fra
cti
on
of
24
1A
m R
ec
ov
ere
d
Vacuum Setting (torr)
Figure 12. Extraction efficiency of 241Am on 2 mL TRU cartridges at various activity concentrations. The average extracted fraction is 0.92 ± 0.04 (±1ζ). Each data point represents the average value for a row of 5 cartridges at a given vacuum setting.
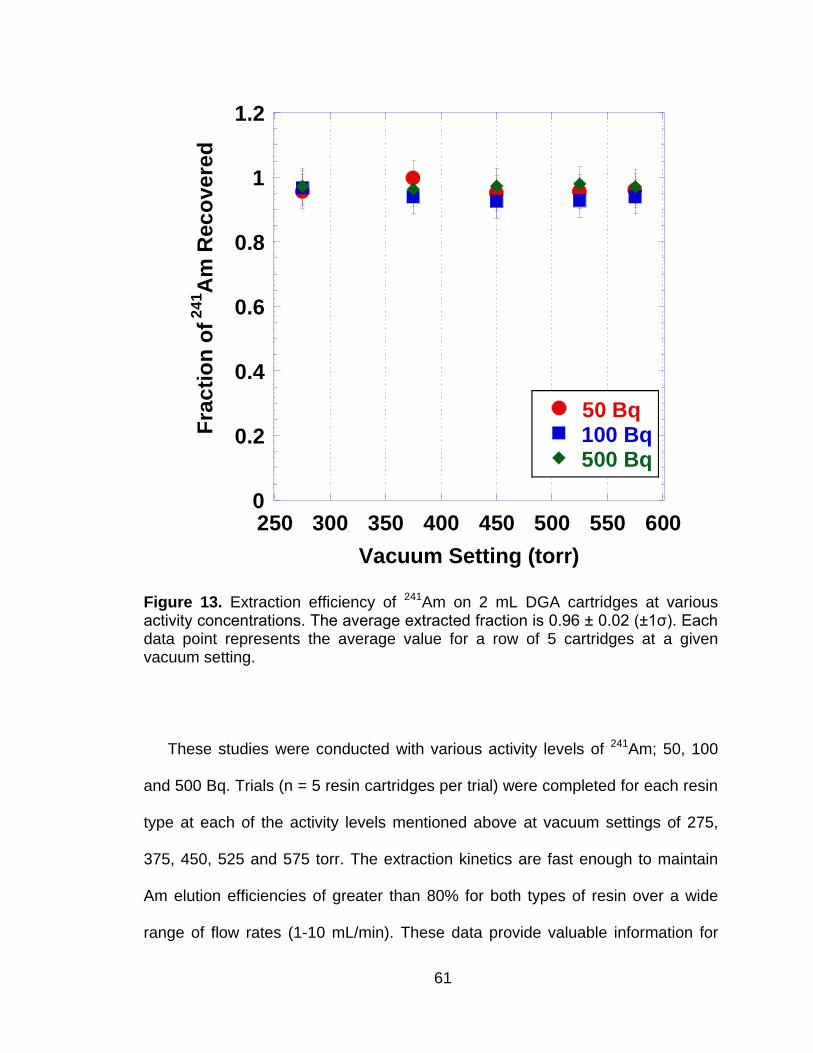
61
0
0.2
0.4
0.6
0.8
1
1.2
250 300 350 400 450 500 550 600
50 Bq100 Bq500 Bq
Fra
cti
on
of 2
41A
m R
ec
ov
ere
d
Vacuum Setting (torr)
Figure 13. Extraction efficiency of 241Am on 2 mL DGA cartridges at various activity concentrations. The average extracted fraction is 0.96 ± 0.02 (±1ζ). Each data point represents the average value for a row of 5 cartridges at a given vacuum setting.
These studies were conducted with various activity levels of 241Am; 50, 100
and 500 Bq. Trials (n = 5 resin cartridges per trial) were completed for each resin
type at each of the activity levels mentioned above at vacuum settings of 275,
375, 450, 525 and 575 torr. The extraction kinetics are fast enough to maintain
Am elution efficiencies of greater than 80% for both types of resin over a wide
range of flow rates (1-10 mL/min). These data provide valuable information for

62
the development of the automated procedure in that fine control or continuous
monitoring of the flow rate is not necessary.
3.4.3 Sorption of Elemental Matrix Interferences
Extraction chromatography efficiency is governed by the electromechanical
properties of the resin, the metal ion species formed in solution, and the
sorption/desorption kinetics of the metal species with the resin (15). The
presence of matrix contaminants in solution can influence actinide speciation
and, at higher concentrations, other metal-ion species can saturate the resin
binding sites. In addition, some of the matrix contaminants may persist
throughout the separations procedure and become problematic for sample
analysis measurements. Actinide analysis is usually preceded by a sample pre-
treatment step to remove potential matrix interferences for optimized separation
efficiency; however, trace levels of contaminants may remain in solution. For high
purity samples, Am sorption/desorption kinetics are rapid for both TRU and DGA
resins, therefore residence time (flow rate) does not need to be closely
monitored. These experiments were conducted to determine how single ion
contaminants interact with the resin at various flow rates and what effect the ion
has on americium separation efficiency. Bulk sorption characteristics of the
matrix contaminant ions on the TRU resin versus vacuum setting are presented
in Figure 14. Each bar represents the mean fraction of matrix ion retained on the
resin (n = 5) after sample loading (total volume = 10 mL). It should be noted that
the error reported is representative of the relative standard deviation for n=5
samples, to highlight reproducibility.
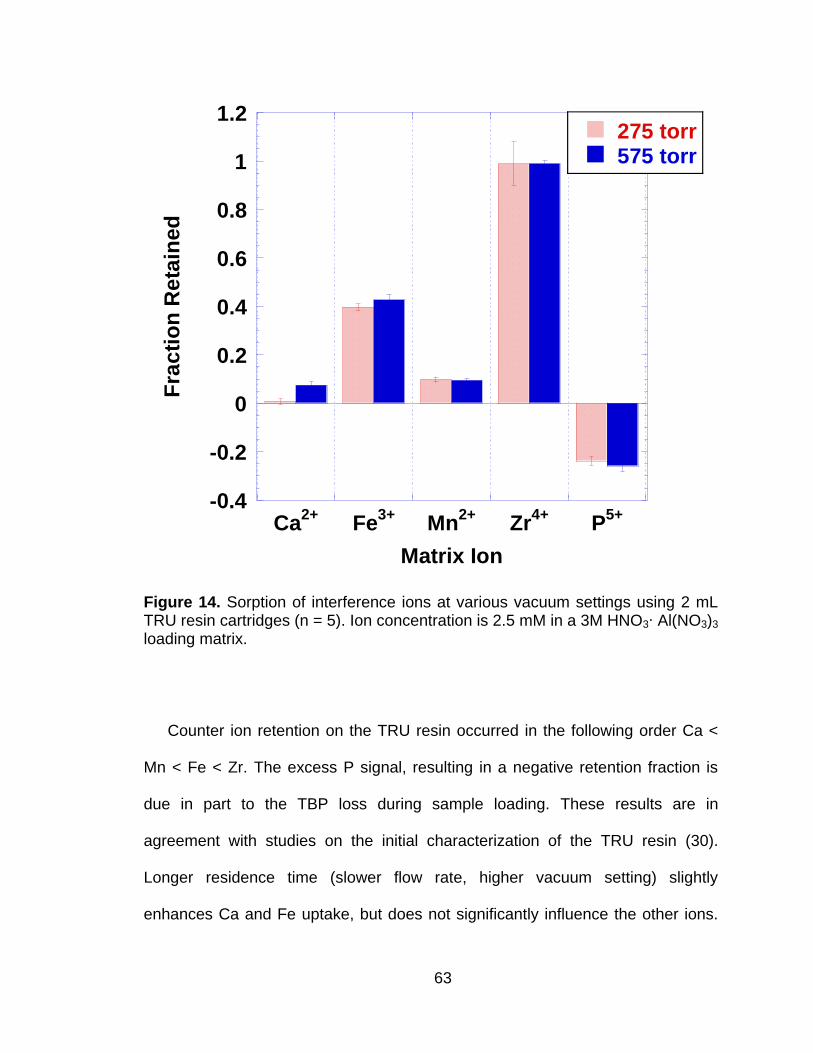
63
-0.4
-0.2
0
0.2
0.4
0.6
0.8
1
1.2
Ca2+
Fe3+
Mn2+
Zr4+
P5+
275 torr575 torr
Fra
cti
on
Re
tain
ed
Matrix Ion
Figure 14. Sorption of interference ions at various vacuum settings using 2 mL TRU resin cartridges (n = 5). Ion concentration is 2.5 mM in a 3M HNO3∙ Al(NO3)3 loading matrix.
Counter ion retention on the TRU resin occurred in the following order Ca <
Mn < Fe < Zr. The excess P signal, resulting in a negative retention fraction is
due in part to the TBP loss during sample loading. These results are in
agreement with studies on the initial characterization of the TRU resin (30).
Longer residence time (slower flow rate, higher vacuum setting) slightly
enhances Ca and Fe uptake, but does not significantly influence the other ions.

64
Ion sorption studies were also conducted with the DGA resin. The sample matrix
contained 2.5 mM of the ion in 5 M HNO3. Calcium and Zr strongly sorb to the
DGA resin, while the rest of the matrix ions show no affinity (Figure 15).
-0.4
-0.2
0
0.2
0.4
0.6
0.8
1
1.2
Ca2+
Fe3+
Mn2+
Zr4+
P5+
275 torr575 torr
Fra
cti
on
Re
tain
ed
Matrix Ion
Figure 15. Sorption of interference ions at various vacuum settings using 2 mL DGA resin cartridges (n = 5). Ion concentration is 2.5 mM in a 5 M HNO3 loading matrix.
Iron and Mn are presented for comparison with the TRU results; however, it
should be noted that the experimental error is greater than the reported fraction
65
values for these ions. An excess of P- in the post-separated sample is observed,
which cannot be accounted for by extractant stability, as with the TRU resin. This
may be attributable to non-spectral chemical or physical interferences (62). The
results agree with the batch uptake experiments (31). In comparing the sorption
characteristics under high and low flow rates, there are no observed differences
in ion uptake.
3.4.4 TRU Resin Capacity of Selected Metal Ions
Initial characterization studies (30) experimentally determined the TRU resin
metal ion capacity using neodymium nitrate (Nd(NO3)3). The resin capacity value
was experimentally determined as 4.1 mg of Nd/mL of resin. This value is less
than the mathematically derived value of 5.49 mg/mL of resin; therefore, the
manufacturer of the resins provides a working capacity value which
conservatively estimates the operational resin capacity to be half the calculated
capacity. The manufacturer also provides the working capacity for Am as
determined from the molar equivalence of Nd and Am in the extraction
equilibrium equations:
Nd3+ + 3NO3− + 3E ↔ Nd(NO3)3 ∙ E3 Equation 8
Am3+ + 3NO3− + 3E ↔ Am(NO3)3 ∙ E3 Equation 9
The extractant molecule (CMPO) is represented by E in equations 1 and 2.
Therefore, the TRU resin capacity of Am can be calculated using the following
formula:
66
mass capcity (Nd)
MW(Nd)× MW Am = mass capacity (Am) Equation 10
For the pre-packed 2 mL resin cartridges, the working capacity (50% of
theoretical capacity) is expected to be approximately 9.2 mg of the Am metal ion.
The early TRU resin characterization studies (30) also evaluated the elution
behavior of selected cations from TRU and determined that the lanthanides and
Zr exhibited a high affinity for the resin. In the current work, the mass loading of
Zr is 2.5 mg/sample. The theoretical capacity of Zr can be derived from the resin
capacity for Nd and the extraction equilibrium equations from literature (63-68):
Zr4+ + 4NO3− + 2E ↔ Zr(NO3)4 ∙ E2 Equation 11
Zr(NO3)22+ + 2NO3
− + 2E ↔ Zr(NO3)4 ∙ E2 Equation 12
The theoretical capacity of the TRU resin for the Zr metal ion is approximately
5.21 mg /mL of resin. This is also the operational working capacity for the 2 mL
resin cartridge (i.e. 50% of 5.21 mg Zr/mL of resin bed * 2 mL of resin per
cartridge). It can be assumed that Zr mass loading in the current work is less
than TRU working capacity; therefore, Am adsorption should not be affected by
the presence of Zr in solution.
Iron is also retained by the TRU resin cartridge under the given experimental
conditions. The resin loading capacity of Fe3+ can be qualitatively determined as
previously described for Am and Zr (65,69,70).
Fe3+ + 3NO3− + 3E ↔ Fe(NO3)3 ∙ E3 Equation 13

67
The theoretical capacity of the TRU resin for the Fe3+ metal ion is
approximately 2.13 mg/mL of resin, and the operational working capacity of the 2
mL TRU resin cartridge is 2.13 mg. The mass loading of Fe in the samples tested
ranged from 5.47 to 7.43 mg. From Figure 14, it is evident that 40% of the Fe
present in the sample sorbed to the TRU resin, which equates to 2.2 to 3.0 mg of
Fe, in agreement with the calculated column capacity. If it is assumed that the
TRU resin is saturated with Fe3+ nitrate species, then adsorbed Am is effectively
out-competing the Fe species for the extractant. This assumption is supported by
the initial characterization studies of the TRU resin (30) where the Am:Fe
capacity (K‘) ratio is approximately 100:1, and by solvent extraction studies of
actinide recovery with CMPO /TBP from high level nuclear waste matrices
(65,69). Increased Fe3+ concentrations of greater than 1 mM affect Am sorption
to the TRU resin and in most procedures, the experimenter reduces the Fe to the
divalent oxidation state prior to running the column.
3.4.5 DGA Resin Capacity for Selected Metal Ions
The extractant and metal ion loading capacity of the DGA resin was
determined (31). The extractant loading capacity was 0.246 mmol of N,N,N‘,N‘-
tetraoctyl-3-oxapentanediamide per mL of resin bed or 0.592 mmol per 2 mL
resin cartridge. Metal ion capacity was evaluated with europium nitrate, Eu(NO3)3
on the DGA resin column and was equivalent to 0.077 millimoles (11.7 mg) of Eu
per mL of resin bed, with the extraction equilibrium equation:
Eu3+ + 3NO3− + 3E ↔ Eu(NO3)3 ∙ E3 Equation 14
where E now represents the diamide extractant molecule.
68
The elemental sorption characteristics of selected ions to the DGA resin is
provided (Figure 15). Both Ca and Zr have a high affinity for the DGA resin.
These data are supported by previous extraction studies with N,N,N',N'-
tetraoctyl-3-oxapentanediamide (TODGA) for both liquid-liquid and
chromatography methods (31, 71-73). In these studies, the ion to extractant
molar ratio is 1:2 and 1:4, for Ca and Zr, respectively. Using this information and
the extractant loading capacity, the metal loading capacities of Zr and Ca on
DGA can be determined using the following equation:
𝐸 𝑐𝑎𝑝𝑎𝑐𝑖𝑡𝑦
𝑚𝐿 𝑜𝑓 𝑟𝑒𝑠𝑖𝑛×
𝑖𝑜𝑛
𝐸 × 𝑀𝑊𝑖𝑜𝑛 = 𝑀𝑎𝑠𝑠 𝐶𝑎𝑝𝑎𝑐𝑖𝑡𝑦 Equation 15
where E capacity is the extractant loading capacity (0.246 mmol), ion/E is the
metal ion to extractant molar ratio (1/4 for Zr and 1/2 for Ca) and MW is the
molecular weight of the Ca or Zr ion. The Zr loading capacity is approximately
5.61 mg Zr/mL of DGA resin, which is also the working capacity for the 2 mL
cartridge (i.e. 50% of 5.61 mg Zr/ mL of resin bed * 2mL of resin per cartridge). In
the current study, approximately 2.45 mg of Zr is loaded onto the column. This
mass value is below the working capacity of the 2 mL DGA resin cartridge. Both
Zr and Am show high affinity for the DGA resin, therefore, decreased Am
extraction efficiency in the presence of Zr may be a result of direct competition
for the coordination of DGA. Calcium mass loading per sample is 1.00 mg and
the working capacity for the 2 mL DGA resin cartridge is approximately 4.93 mg.
Under these mass loading conditions, Am efficiency is not expected to be
influenced by the total adsorption of Ca to the resin.
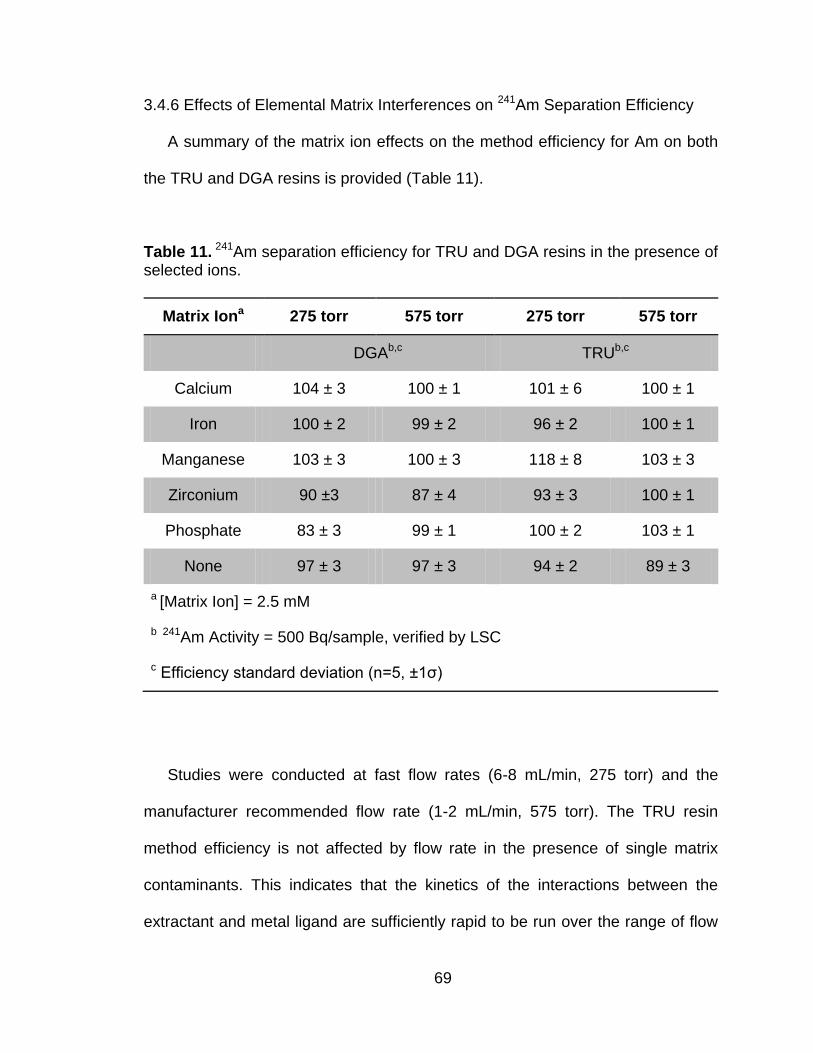
69
3.4.6 Effects of Elemental Matrix Interferences on 241Am Separation Efficiency
A summary of the matrix ion effects on the method efficiency for Am on both
the TRU and DGA resins is provided (Table 11).
Table 11. 241Am separation efficiency for TRU and DGA resins in the presence of selected ions.
Matrix Iona 275 torr 575 torr 275 torr 575 torr
DGAb,c TRUb,c
Calcium 104 ± 3 100 ± 1 101 ± 6 100 ± 1
Iron 100 ± 2 99 ± 2 96 ± 2 100 ± 1
Manganese 103 ± 3 100 ± 3 118 ± 8 103 ± 3
Zirconium 90 ±3 87 ± 4 93 ± 3 100 ± 1
Phosphate 83 ± 3 99 ± 1 100 ± 2 103 ± 1
None 97 ± 3 97 ± 3 94 ± 2 89 ± 3
a [Matrix Ion] = 2.5 mM
b 241Am Activity = 500 Bq/sample, verified by LSC
c Efficiency standard deviation (n=5, ±1ζ)
Studies were conducted at fast flow rates (6-8 mL/min, 275 torr) and the
manufacturer recommended flow rate (1-2 mL/min, 575 torr). The TRU resin
method efficiency is not affected by flow rate in the presence of single matrix
contaminants. This indicates that the kinetics of the interactions between the
extractant and metal ligand are sufficiently rapid to be run over the range of flow
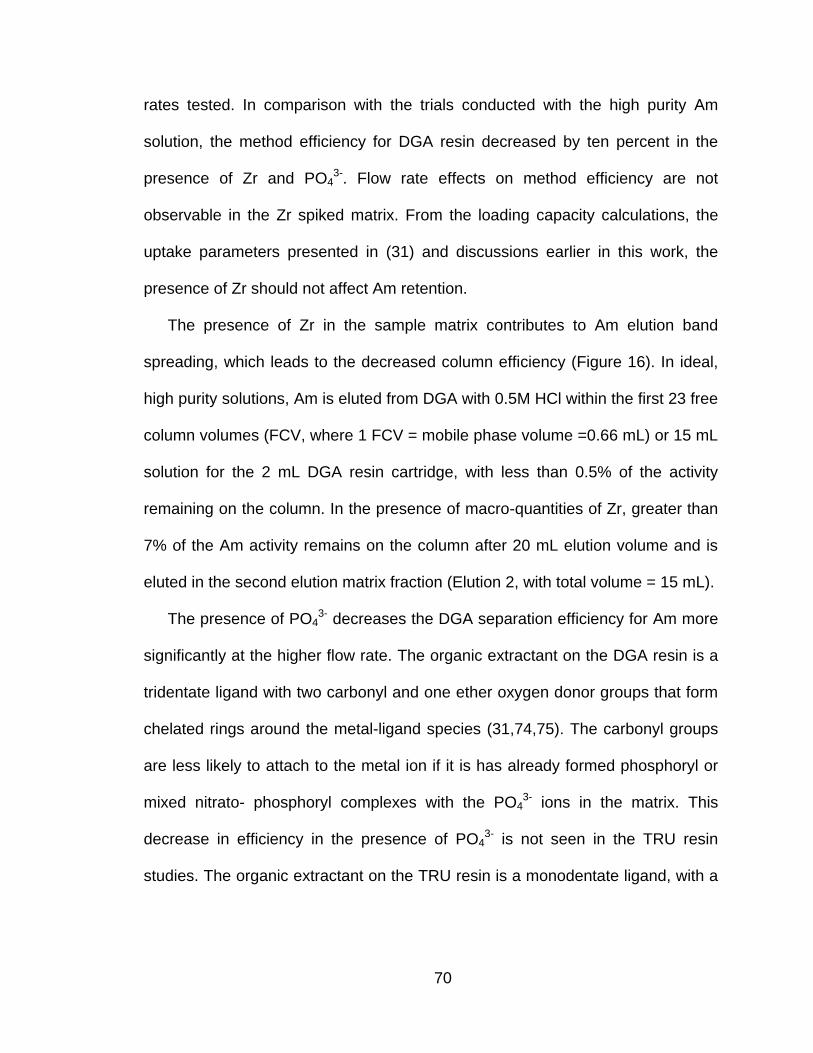
70
rates tested. In comparison with the trials conducted with the high purity Am
solution, the method efficiency for DGA resin decreased by ten percent in the
presence of Zr and PO43-. Flow rate effects on method efficiency are not
observable in the Zr spiked matrix. From the loading capacity calculations, the
uptake parameters presented in (31) and discussions earlier in this work, the
presence of Zr should not affect Am retention.
The presence of Zr in the sample matrix contributes to Am elution band
spreading, which leads to the decreased column efficiency (Figure 16). In ideal,
high purity solutions, Am is eluted from DGA with 0.5M HCl within the first 23 free
column volumes (FCV, where 1 FCV = mobile phase volume =0.66 mL) or 15 mL
solution for the 2 mL DGA resin cartridge, with less than 0.5% of the activity
remaining on the column. In the presence of macro-quantities of Zr, greater than
7% of the Am activity remains on the column after 20 mL elution volume and is
eluted in the second elution matrix fraction (Elution 2, with total volume = 15 mL).
The presence of PO43- decreases the DGA separation efficiency for Am more
significantly at the higher flow rate. The organic extractant on the DGA resin is a
tridentate ligand with two carbonyl and one ether oxygen donor groups that form
chelated rings around the metal-ligand species (31,74,75). The carbonyl groups
are less likely to attach to the metal ion if it is has already formed phosphoryl or
mixed nitrato- phosphoryl complexes with the PO43- ions in the matrix. This
decrease in efficiency in the presence of PO43- is not seen in the TRU resin
studies. The organic extractant on the TRU resin is a monodentate ligand, with a
71
phosphoryl donor group; therefore it should successfully compete with the PO43-
metal species in solution.
0
0.2
0.4
0.6
0.8
1
Rinse Elution 1 Elution 2
275 torr575 torr
Fra
cti
on
of
24
1A
m in
So
luti
on
Method Fraction
Figure 16. Fraction of 241Am present in each method fraction, with original loading matrix containing 2.5 mM Zr in solution. The fraction matrices are defined in Table 9. The fraction labeled Rinse is the rinse fraction immediately following sample loading (total volume = 8 mL). Elution 1 is the primary Am stripping fraction (total volume = 20 mL) and Elution 2 is the second stripping fraction (for residual Am collection). Trials were conducted at 575 and 275 torr vacuum settings with n = 5 cartridges or samples per trial.
72
3.5 Concluding Remarks
Vacuum-assisted extraction chromatography is ideal for discrete,
simultaneous batch processing; however, the methods currently used with this
system require further parameterization to determine which aspects of the
procedure need to be monitored. Establishing boundary conditions with regards
to precision, versatility and reproducibility provide valuable information from both
an economical and engineering standpoint. In this work, we have shown that
precision flow rate is not required for reproducibility using two different separation
procedures and resins for Am isolation from other matrix constituents. Sample
evacuation rates vary between resin cartridges resulting in some resin beds
running dry. This parameter is important from an automation standpoint, in that
each sample reservoir will need to be monitored with optical sensors for total
evacuation. From a chemistry standpoint, this parameter does not affect Am
separation efficiency under the conditions tested. Studies are continuing with
other resins and actinides to develop an automated mixed actinide separations
procedure based on these preliminary data.
73
CHAPTER 4
EXTRACTION CHROMATOGRAPHY PERFORMANCE -PLUTONIUM
SEPARATIONS
4.1 Abstract
The effects of columnar flow rate on the sorption/desorption efficiency of Pu
to TEVA extraction chromatography resin has been characterized in both high
purity aqueous systems and in aqueous systems containing common matrix ion
interferences. This study is part of the continued effort to develop an automated
vacuum extraction chemistry unit that is suitable for rapid actinide separations.
Previous work demonstrated that columnar kinetics in DGA and TRU resins had
little effect on the separation efficiency of americium when present in high purity
solutions and solutions with selected interference ions. In this work, the Pu
system is evaluated in terms of redox reagent addition, sample aging, columnar
kinetics, and the influence of matrix ions on extraction efficiency. The results of
this work showed that Pu extraction with TEVA resin is insensitive to flow rate for
high purity systems; however, in the presence of other common matrix ions,
separation efficiency was greater for those experiments run at lower flow rates.
4.2 Introduction
Automation of radioanalytical procedures can lead to increased productivity,
which becomes of particular importance in emergency response situations where
thousands of samples may need to be analyzed for contamination control and
public health concerns (4, 52-56,76,77). These procedures must provide highly
74
accurate, reproducible results for a wide range of sample matrices and analyte
concentration levels, especially in cases where information can lead to
suppositions about the source term and ultimately affect policy decisions. In the
last decade, there have been several publications demonstrating the use of
continuous flow-through radioanalytical systems, where each sample is
processed consecutively (16-18,22,47). The major disadvantage of a flow-
through automation system is that samples are processed sequentially. If a
sample does not fully dissolve, or has higher than expected analyte
concentration, there is increased risk of contamination or blockage of the flow-
through system. The goal of this project is to develop an automated
radioanalytical platform, where each sample in a given batch is processed
simultaneously, in a discrete, isolated fashion thereby eliminating potential cross
contaminations or process failures.
Radioanalytical methods can be sub-divided into modules for platform
automation development, sample dissolution/pre-treatment, chemical separation,
source preparation, and analysis/data processing. Each of these components
must be evaluated in terms of the physical/chemical parameters to determine the
engineering specifications of the automated system. In this work the chemical
separation module for automated analysis is examined - where the unit consists
of a vacuum box modeled after a commercially available automated solid-phase
synthesis unit.
Extraction chromatography (EC) methods are well-suited for automated
chemical separations as demonstrated in various continuous flow-through
75
separation units (16-23). The EC resins have high analyte selectivity, simplistic
elution schemes, rapid kinetics, and they can be stored dry prior to immediate
use (24). The manufacturer, Eichrom Technologies, Inc. packages the resin into
cartridges, which reduces preparation time and minimizes variations associated
with in-house packing. The cartridges are stackable, providing an efficient way of
separating multiple radionuclides based on analyte affinity for different extractant
compounds. There are manual EC methods available that use vacuum box
technology to accelerate the separation procedure; however, these methods are
not optimized for an automated unit.
In previous work, engineering controls, such as evacuation rate, pressure
regulation, flow rate reproducibility, and cartridge failure were established
(Chapter 3). The method investigated in this communication is the mixed actinide
separation procedure recommended by the manufacturer (78). The mixed
actinide sample is loaded onto two stacked resin cartridges, TEVA and TRU (or
DGA). Actinides in the tetravalent oxidation state (i.e. Pu4+, Np4+, Th4+) are
retained on the TEVA resin. Actinides in the tri- and hexavalent oxidation states
(i.e. Am3+, Cm3+, UO22+) are retained on the TRU (or DGA) resin.
Preliminary studies focused on the characterization of the separations unit
using TRU and DGA resins and Am to establish some of the chemical and
engineering boundary conditions associated with the manual separation method
(Chapter 3). Method efficiency was characterized in terms of flow rate regulation,
yield reproducibility, and versatility using aqueous samples containing various
concentrations of 241Am solutions. Results indicate that the columnar kinetics of
76
the resins are sufficiently rapid to run high purity americium samples through the
unit over a wide range of flow rates for both resin types. Method efficiency was
also evaluated with single matrix interferences present in solution. It was
determined that the matrix interferences (molar ratio of 1:106 for Am:Interference)
have little effect on separation efficiency at varied flow rate conditions. Americium
was selected for initial study based on its single trivalent oxidation state in acid
solution and well-characterized extraction behavior on both DGA and TRU resins
under the given matrix conditions.
The focus of this study is the Pu system. Pu sorption/desorption studies have
a greater degree of complexity due the presence of multiple species in an
aqueous solution. This diversity is based largely on the fact that the various
oxidation states of Pu have similar redox potentials, yet different reaction kinetics
(79-81). For separation procedures utilizing extraction chromatographic resins,
redox agents, such as sulfamic acid, hydroxylamine, ascorbic acid, peroxide,
Fe2+ and sodium nitrite are used to force the Pu into the desired or most
extractable oxidation state (58). The reagents are added sequentially to enhance
separation from matrix contaminants and to control the kinetics of metal complex
formation. From an automation perspective, these reagents introduce parameters
that must be characterized for the automation platform. This work describes the
efficiency characterization studies performed on high purity 239Pu solutions and
solutions containing common matrix interferences on TEVA resin.
77
4.3 Materials and Methods
4.3.1 Vacuum Extraction System
The vacuum extraction unit developed for this project has been described in
detail in Chapter 3. The unit is attached to a digital vacuum regulator (DVR) that
controls the evacuation rate and pressure setting within the unit. The box can
process 15 samples simultaneously. Sample vials with 50 mL volume are placed
in a removable tray within the unit and are replaced after each method fraction is
collected.
4.3.2 Reagents
Nitric and hydrochloric acid solutions were prepared from reagent grade acids
(ACS reagent grade, Merck KGaA, Darmstadt, Germany) and de-ionized water
(18 MΩ∙cm, Millipore, Billerica, MA, USA). Aluminum nitrate nonahydrate crystals
(ACS reagent grade, Merck KGaA) are added to the sample solution to increase
the nitrate concentration. Redox agents added to the sample solution include
sulfamic acid, ascorbic acid and sodium nitrite, each prepared from reagent
grade solids (Mallinckrodt Baker, Phillipsburg, NJ USA) and de-ionized water.
Sodium nitrite was prepared within 30 minutes of use. Ascorbic acid was
prepared and used within two weeks of initial preparation. Pu was selectively
removed from the TEVA resin using a mixture of hydrofluoric/hydrochloric acids,
20% TiCl3 solution (ACS reagent grade, Merck KGaA, Darmstadt, Germany), and
de-ionized water. The TiCl3 solution was added to the HCl/HF mixture within
thirty minutes of use.
78
Extraction chromatographic resins were obtained from Eichrom Technologies,
Inc. (Darien, IL, USA) in 2 mL pre-packed polypropylene cartridges. TEVA resin
(50-100 µm) was chosen for experimental evaluation and contains an aliphatic
quaternary amine as the extractant compound for the stationary phase and is
primarily used for isolating and separating tetra-valent actinides from tri- and
hexa- valent actinides and fission products (34). Each pre-packed 2 mL cartridge
is shipped dry and therefore must be pre-treated with the acid matrix prior to use.
This step reconstitutes and equilibrates the resin, promotes uniform flow and
maximizes the working capacity of the cartridge.
4.3.3 Radionuclide Standards
Plutonium stock solutions were prepared from traceable standard solutions
(Isotope Products, Valencia, CA, USA) in 3M HNO3∙1M Al(NO3)3 with activity
concentrations from 50 to 200 Bq per mL of stock solution. Aliquots of the original
sample matrix and each subsequent fraction were taken and the activity of each
was verified by liquid scintillation counting (LSC) (Tri-carb 3100, Perkin Elmer,
Boston, MA, USA) with 10 mL of Ultima Gold AB cocktail (Perkin Elmer, USA) as
the counting medium. The LSC samples were counted for 60 minutes or until the
counting error reached 2S% (2% of the 2ζ standard deviation of the total counts)
in the CPMB energy window (50-1000 keV). The 2S% is a standard protocol
option that serves as a normalization parameter for the comparison of multiple
sample measurements, i.e. the error reported for each measurement represents
2% of twice the standard deviation of the counts collected in the CPMB region of
79
the spectrum. The average background count rate in the CPMB window was 8.83
± 0.77 (1ζ) cpm for method blanks.
4.3.4 Flow Rate Characterization
Initial flow rate characterizations relating vacuum set point (for the digital
vacuum regulator, DVR) and cartridge flow rates are provided in Chapter 3. The
TEVA resin cartridges were characterized for flow rate in terms of matrix effects
based on each method step, i.e. resin preparation, sample loading, column rinse
and elution matrices. The vacuum set point was programmed into the DVR and
the sample solution (or subsequent elution/rinse solutions) was added to each of
the sample reservoirs. The DVR activation switch was set to ―Run Program‖
which allows the box to draw down to the specified vacuum set point. The times
required for the vacuum box to reach the set point and for the sample reservoirs
to empty were recorded for each TEVA cartridge. Once the reservoirs emptied,
the DVR activation switch was returned to the neutral position and the box was
allowed to return to equilibrium with ambient conditions.
4.3.5 Plutonium Separation
A sample reservoir (30-mL polypropylene Luer-lock syringe, B-D, NJ, USA)
was connected to the top of the 2 mL TEVA resin cartridge. The resin bed was
pre-treated with 5 mL of the 3 M HNO3 matrix solution prior to sample loading,
then 10 mL of the 239Pu stock solution was added. These two eluates were
collected together in a labeled 50 mL centrifuge tube. Sequential elutions were
performed to rinse the resin (removes interferences) and strip Pu from the resin
bed. The sample loading and elution matrices and volumes were chosen based
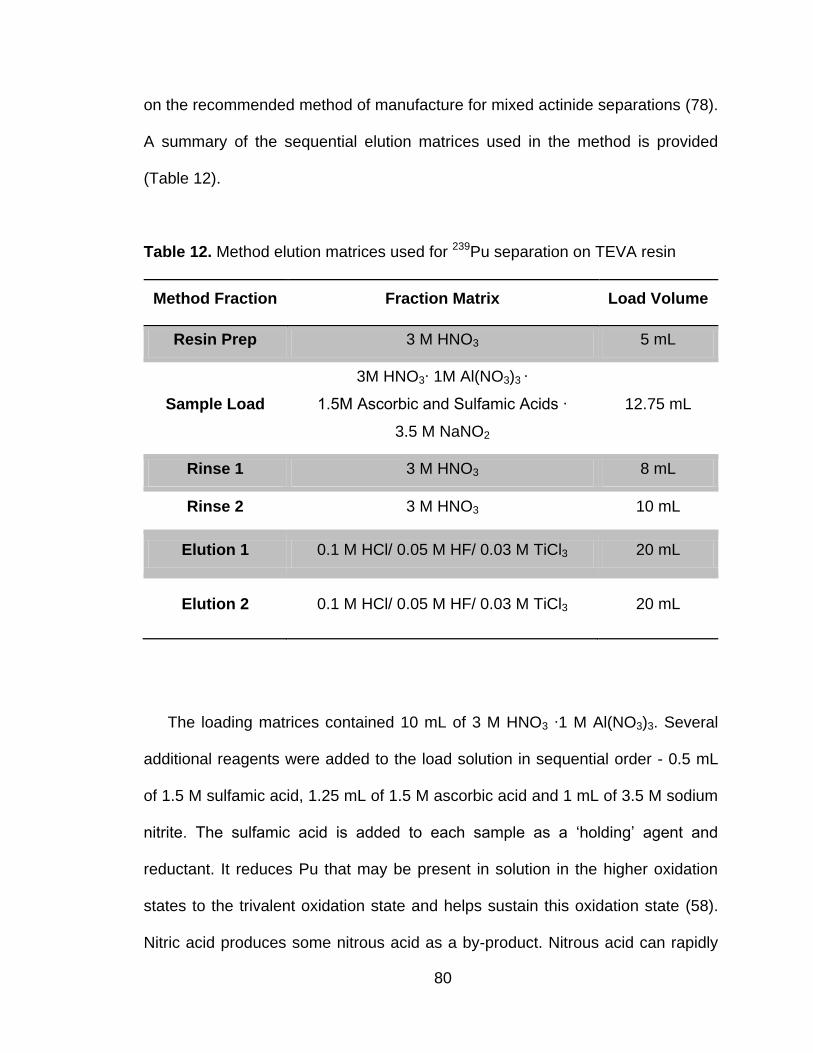
80
on the recommended method of manufacture for mixed actinide separations (78).
A summary of the sequential elution matrices used in the method is provided
(Table 12).
Table 12. Method elution matrices used for 239Pu separation on TEVA resin
Method Fraction Fraction Matrix Load Volume
Resin Prep 3 M HNO3 5 mL
Sample Load
3M HNO3∙ 1M Al(NO3)3 ∙
1.5M Ascorbic and Sulfamic Acids ∙
3.5 M NaNO2
12.75 mL
Rinse 1 3 M HNO3 8 mL
Rinse 2 3 M HNO3 10 mL
Elution 1 0.1 M HCl/ 0.05 M HF/ 0.03 M TiCl3 20 mL
Elution 2 0.1 M HCl/ 0.05 M HF/ 0.03 M TiCl3 20 mL
The loading matrices contained 10 mL of 3 M HNO3 ∙1 M Al(NO3)3. Several
additional reagents were added to the load solution in sequential order - 0.5 mL
of 1.5 M sulfamic acid, 1.25 mL of 1.5 M ascorbic acid and 1 mL of 3.5 M sodium
nitrite. The sulfamic acid is added to each sample as a ‗holding‘ agent and
reductant. It reduces Pu that may be present in solution in the higher oxidation
states to the trivalent oxidation state and helps sustain this oxidation state (58).
Nitric acid produces some nitrous acid as a by-product. Nitrous acid can rapidly
81
oxidize Pu to the tetravalent oxidation state. The sulfamic acid reacts with HNO2
to prevent Pu oxidation. Ascorbic acid is used to reduce Fe and Mn contaminants
that may be present in the sample solution, which are also problematic for Pu
oxidation (58). The final addition of sodium nitrite oxidizes Pu to the tetravalent
state. Plutonium is removed from TEVA with a 0.1 M HCl/ 0.05 M HF/ 0.03 M
TiCl3 solution. Each fraction was collected in a labeled 50 mL centrifuge tube and
aliquots were counted by LSC to verify activity concentration.
4.3.6 Elemental Matrix Interference Effects
The interference species were evaluated on TEVA 2-mL pre-packed resin
cartridges at 2 vacuum settings, 275 and 575 torr, corresponding to the upper
and lower boundaries of the flow rates tested. Ionic solutions were prepared in
the sample loading matrix with the redox agents. The concentration of interfering
ions for all experiments was approximately 2.5 mM, which is 1 to 2 orders of
magnitude higher than the working capacity of Pu for TEVA resin (34). Iron, Ca,
and Mn were chloride salt forms, and Al and Zr were nitrate salts. Potassium
phosphate salt was used for the phosphate ion studies. Solutions were
equilibrated at least one week prior to use. All chemicals and reagents used were
of analytical grade or better. Each matrix solution was 10 mL and was run
through a row of pre-treated resin cartridges and collected in 50 mL centrifuge
tubes. Total ion concentration was determined by inductively coupled plasma
absorption emission spectroscopy, ICP-AES (iCAP 6000 Series Thermo
Scientific, Cambridge, UK). The solutions were diluted by a factor of 10 with de-
ionized water prior to analysis. Calibration curves were run for each ion based on
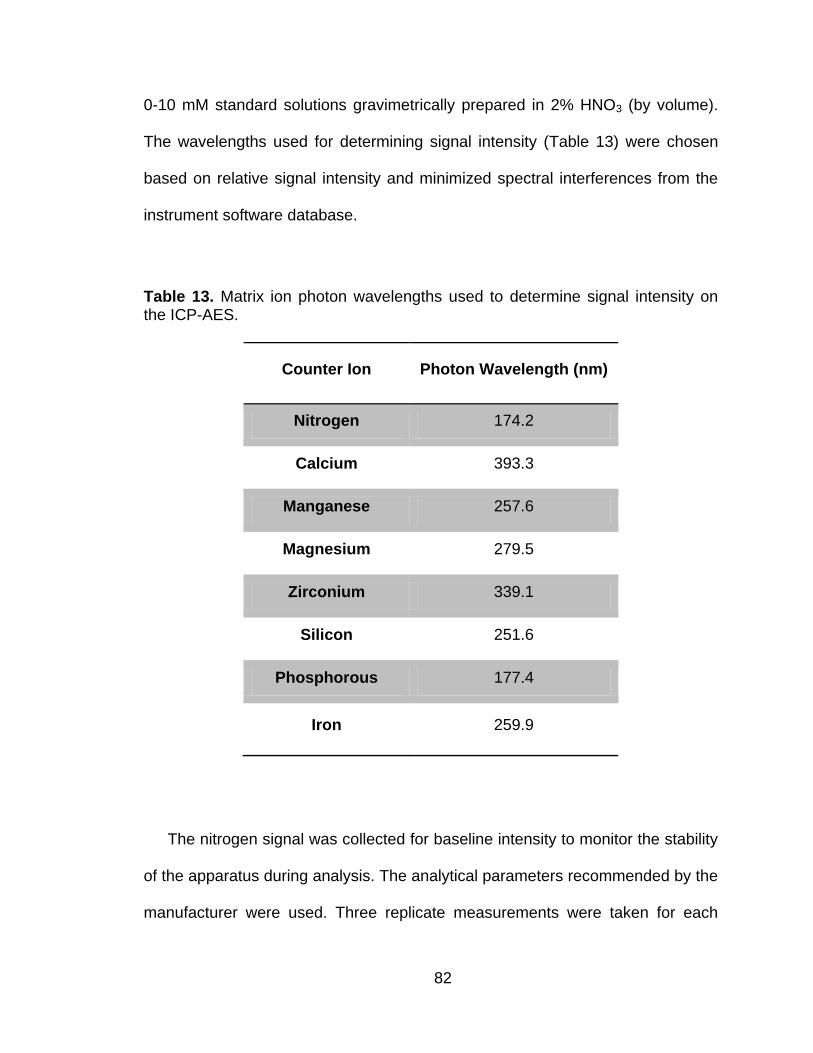
82
0-10 mM standard solutions gravimetrically prepared in 2% HNO3 (by volume).
The wavelengths used for determining signal intensity (Table 13) were chosen
based on relative signal intensity and minimized spectral interferences from the
instrument software database.
Table 13. Matrix ion photon wavelengths used to determine signal intensity on the ICP-AES.
Counter Ion Photon Wavelength (nm)
Nitrogen 174.2
Calcium 393.3
Manganese 257.6
Magnesium 279.5
Zirconium 339.1
Silicon 251.6
Phosphorous 177.4
Iron 259.9
The nitrogen signal was collected for baseline intensity to monitor the stability
of the apparatus during analysis. The analytical parameters recommended by the
manufacturer were used. Three replicate measurements were taken for each
83
sample with a sample flush time of 30 seconds in Precision analysis mode and a
sample integration time of 15 seconds.
Plutonium separation and efficiency experiments (Section 2.5) were repeated
with 2.5 mM solutions of each of the interfering ions. Each matrix solution was
spiked with 239Pu at an activity concentration of 200 Bq/mL of solution. Aliquots of
each sequential elution are counted by LSC to determine the separation
efficiency in the presence of the selected ions.
4.4 Results and Discussions
4.4.1 Vacuum Extraction System Characterization
Vacuum system characterization data from previous work with TRU and DGA
resins showed a linear relationship between flow rate and the DVR set point.
Variations in flow rate for the method matrices at different vacuum settings were
also observed (Chapter 3). These variations are attributed to differences in ionic
strength and viscosity of the elution matrices, and the packing and wetting
characteristics of the resin. Pre-packed TEVA 2 mL resin cartridges were
evaluated for the method matrix affects on flow rate (Figure 17). Three vacuum
settings, 275, 425 and 575 torr, were chosen based on a high, medium and low
flow rates. Resin prep was the first step in the method, where the dried resin
cartridges are wetted with nitric acid. In comparison with studies run on the TRU
resin cartridge, the flow rate versus vacuum setting was equivalent. From an
engineering perspective, this is an indication that, under the same matrix
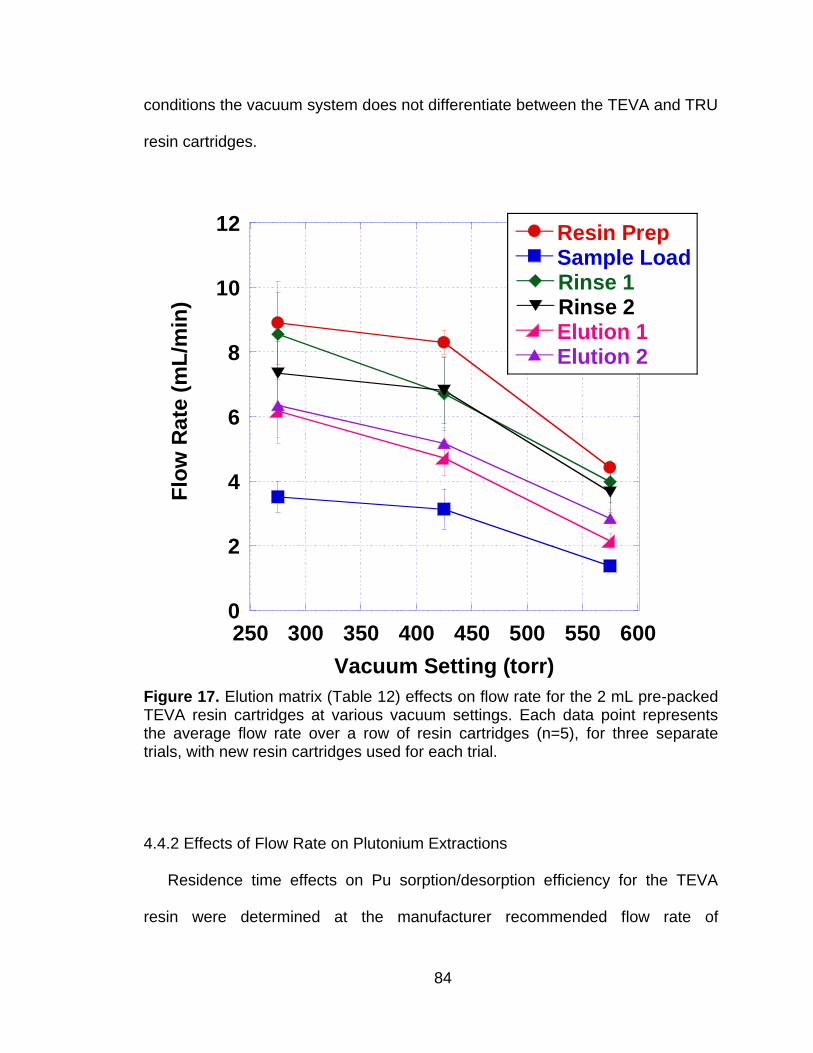
84
conditions the vacuum system does not differentiate between the TEVA and TRU
resin cartridges.
0
2
4
6
8
10
12
250 300 350 400 450 500 550 600
Resin PrepSample LoadRinse 1Rinse 2 Elution 1Elution 2
Flo
w R
ate
(m
L/m
in)
Vacuum Setting (torr)
Figure 17. Elution matrix (Table 12) effects on flow rate for the 2 mL pre-packed TEVA resin cartridges at various vacuum settings. Each data point represents the average flow rate over a row of resin cartridges (n=5), for three separate trials, with new resin cartridges used for each trial.
4.4.2 Effects of Flow Rate on Plutonium Extractions
Residence time effects on Pu sorption/desorption efficiency for the TEVA
resin were determined at the manufacturer recommended flow rate of
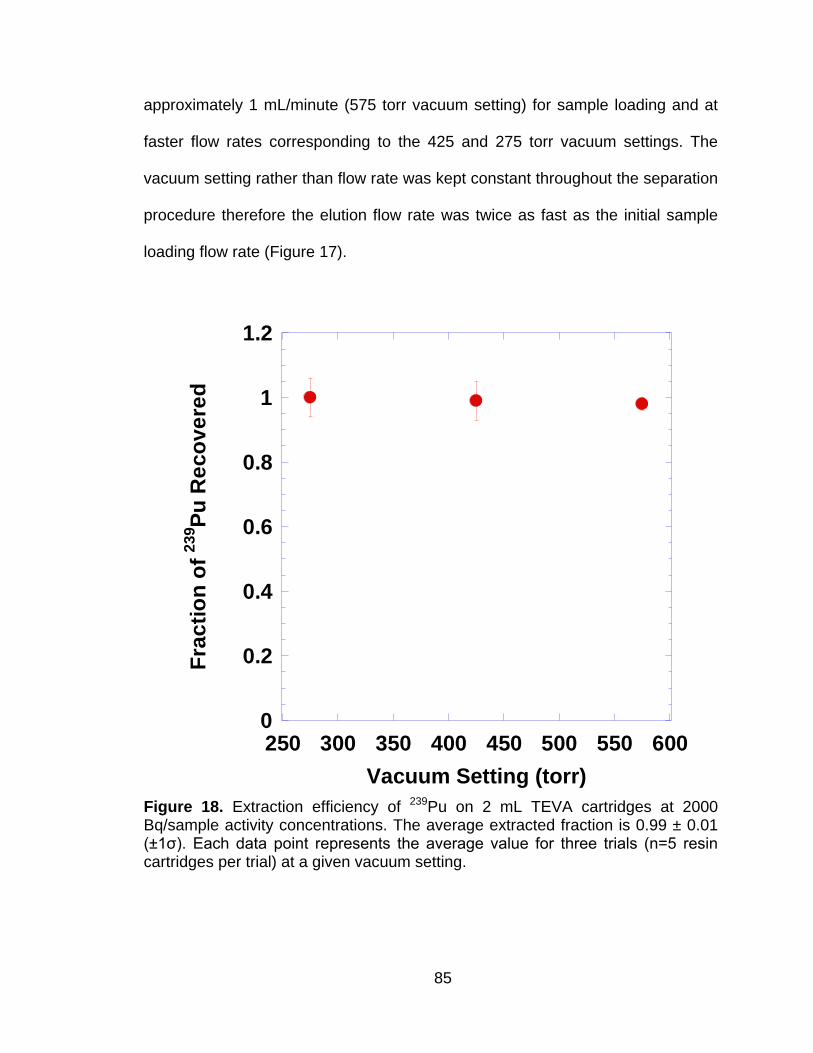
85
approximately 1 mL/minute (575 torr vacuum setting) for sample loading and at
faster flow rates corresponding to the 425 and 275 torr vacuum settings. The
vacuum setting rather than flow rate was kept constant throughout the separation
procedure therefore the elution flow rate was twice as fast as the initial sample
loading flow rate (Figure 17).
0
0.2
0.4
0.6
0.8
1
1.2
250 300 350 400 450 500 550 600
Fra
cti
on
of
23
9P
u R
eco
ve
red
Vacuum Setting (torr)
Figure 18. Extraction efficiency of 239Pu on 2 mL TEVA cartridges at 2000 Bq/sample activity concentrations. The average extracted fraction is 0.99 ± 0.01 (±1ζ). Each data point represents the average value for three trials (n=5 resin cartridges per trial) at a given vacuum setting.

86
These studies were conducted with high purity 239Pu standard solutions with
activity concentrations of 200 Bq/mL of solution, or 2000 Bq per sample. Three
trials were conducted at each vacuum setting with n = 5 samples per trial. The
extraction kinetics were rapid enough under the given conditions that the method
efficiency was not affected by flow rate (Figure 18). Average Pu recovery was 99
± 1% (±1ζ) across the range of vacuum settings tested (Figure 18). These data
were similar to studies conducted with 241Am on the TRU and DGA resin
(Chapter 3), and recent EC optimization studies conducted with TRU resins (47).
From an automation perspective, these data suggest that flow rate monitoring
and precision control during the chemical separations procedure is not critical for
high purity samples.
4.4.3 Optimization of Redox Reagent Addition
Reagent addition for an automation platform must be considered in terms of
preparation requirements, solution equilibration, and sample aging time. Under
the current method, the manufacturer recommends that the ascorbic acid
solution be replaced after two weeks shelf time. Plutonium efficiency experiments
were conducted with aged ascorbic acid (1 week < age ≤ 2 weeks) or with freshly
prepared ascorbic acid. Table 14 provides the Pu recovery yields with the freshly
prepared ascorbic acid and the aged ascorbic acid for the high purity Pu stock
solution with 2000 Bq/sample activity concentration at 575 and 425 torr vacuum
settings. Plutonium recovery decreased by half with the older solution. Ascorbic
acid degradation studies have shown that the oxidation of ascorbic acid to
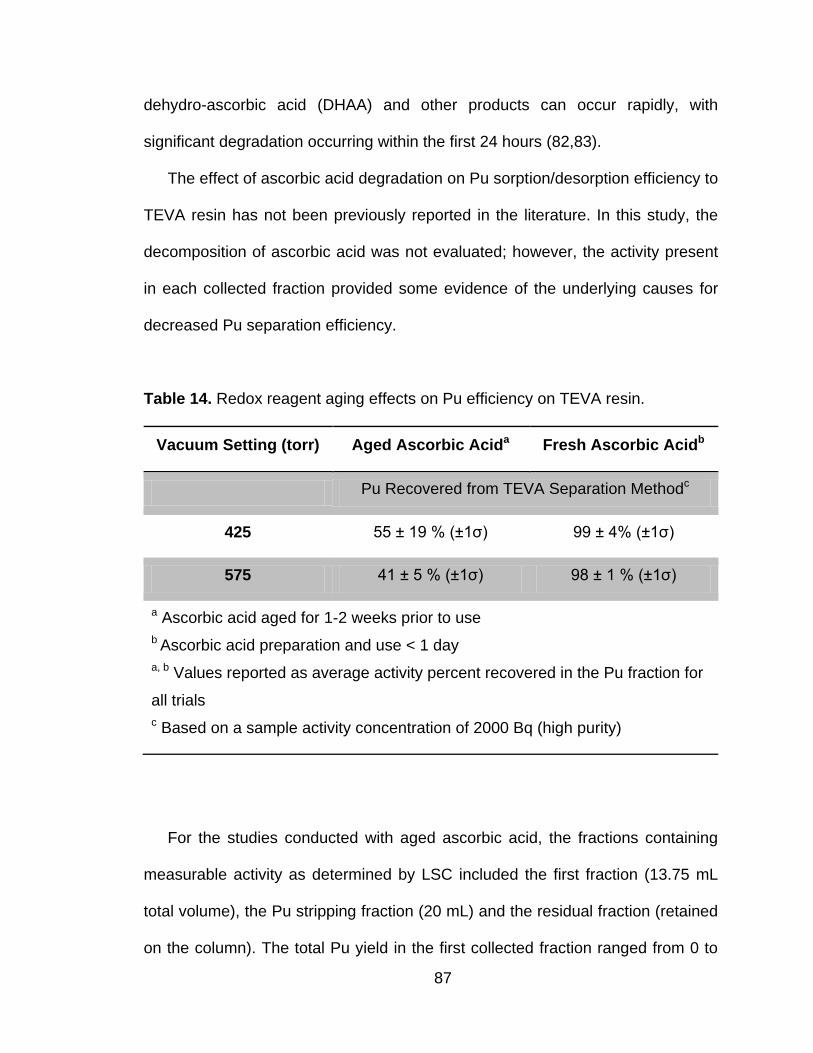
87
dehydro-ascorbic acid (DHAA) and other products can occur rapidly, with
significant degradation occurring within the first 24 hours (82,83).
The effect of ascorbic acid degradation on Pu sorption/desorption efficiency to
TEVA resin has not been previously reported in the literature. In this study, the
decomposition of ascorbic acid was not evaluated; however, the activity present
in each collected fraction provided some evidence of the underlying causes for
decreased Pu separation efficiency.
Table 14. Redox reagent aging effects on Pu efficiency on TEVA resin.
Vacuum Setting (torr) Aged Ascorbic Acida Fresh Ascorbic Acidb
Pu Recovered from TEVA Separation Methodc
425 55 ± 19 % (±1ζ) 99 ± 4% (±1ζ)
575 41 ± 5 % (±1ζ) 98 ± 1 % (±1ζ)
a Ascorbic acid aged for 1-2 weeks prior to use
b Ascorbic acid preparation and use < 1 day
a, b Values reported as average activity percent recovered in the Pu fraction for
all trials
c Based on a sample activity concentration of 2000 Bq (high purity)
For the studies conducted with aged ascorbic acid, the fractions containing
measurable activity as determined by LSC included the first fraction (13.75 mL
total volume), the Pu stripping fraction (20 mL) and the residual fraction (retained
on the column). The total Pu yield in the first collected fraction ranged from 0 to
88
27% and was not consistent across samples in a given trial. Plutonium yield in its
elution fraction ranged from 33 to 70% (average yield reported in Table 14). The
Pu elution fraction was not repeated with these samples; however, the resin was
counted in LSC cocktail to determine the residual activity sorbed to the resin.
This technique was not ideal for estimating the residual activity because the resin
settled to the bottom of the plastic vial during counting. The estimated residual
activity percent sorbed to the TEVA resin was 35 ± 10% (1ζ). Decreased Pu
efficiency with aged ascorbic acid could be the result of incomplete
reduction/oxidation of the Pu to form the doubly charged anionic species,
Pu(NO3)62-, Pu complexation with the ascorbic acid by-products, and/or affinity of
the by-products to the active resin sites. Further studies must be conducted to
determine how ascorbic acid degradation affects Pu yield recovery.
Based on this information and the low recovery yield of Pu from high purity
solutions, it is recommended that ascorbic acid be prepared fresh daily for
optimal recovery. Aging of sulfamic acid solutions did not influence method
efficiency. As NaNO2 is prepared immediately prior to use, solution aging was not
evaluated.
4.4.4 Sorption of Elemental Matrix Interferences
The overall performance of the EC resin cartridge is governed by the
selectivity of the extractant compound to the species of interest, the extraction
kinetics, diffusion/ flow phenomena and the extractant capacity (32,33). The
presence of other ions in the sample solution can enhance or diminish uptake of
the actinides by the resin. As an example, aluminum (hydrated nitrate salt) is
89
added to the initial sample loading solution to increase the free nitrate anion
concentration and to scavenge potential interferences such as fluoride and
phosphate anions. In this particular case, the aluminum is added to enhance the
formation of the Pu(NO3)62- species in solution for higher sorption on the TEVA
resin (34).
Several common matrix ion contaminants were selected for characterization
on TEVA resin based on their abundance in environmental matrices and nuclear
material. Additionally, actinide enrichment for aqueous samples is often
performed by precipitation with Fe(OH)3, Ca3(PO4)2, or MnO2. Calcium, Fe, Zr
and Mn were only slightly retained by the TEVA resin under the given testing
conditions (Figure 19). These results were similar to those obtained during the
initial TEVA resin characterization studies (34).
In our previous work, it was determined that Zr showed a high affinity for both
the TRU and DGA resins (Chapter 3). The sample loading conditions used in this
study for the TEVA resin were equivalent to those used in the TRU studies. The
Zr present in solution exists as the Zr(NO3)4 charge neutral species (84,85) which
is not extractable by the TEVA resin. In samples where Pu is present with high
(or unknown) Zr concentrations, it may be beneficial to use TEVA resin versus
TRU resin for separation and purification. This is of particular importance for
samples originating from the nuclear fuel cycle as Zr is likely to be present as a
fission product or a component of the cladding material.
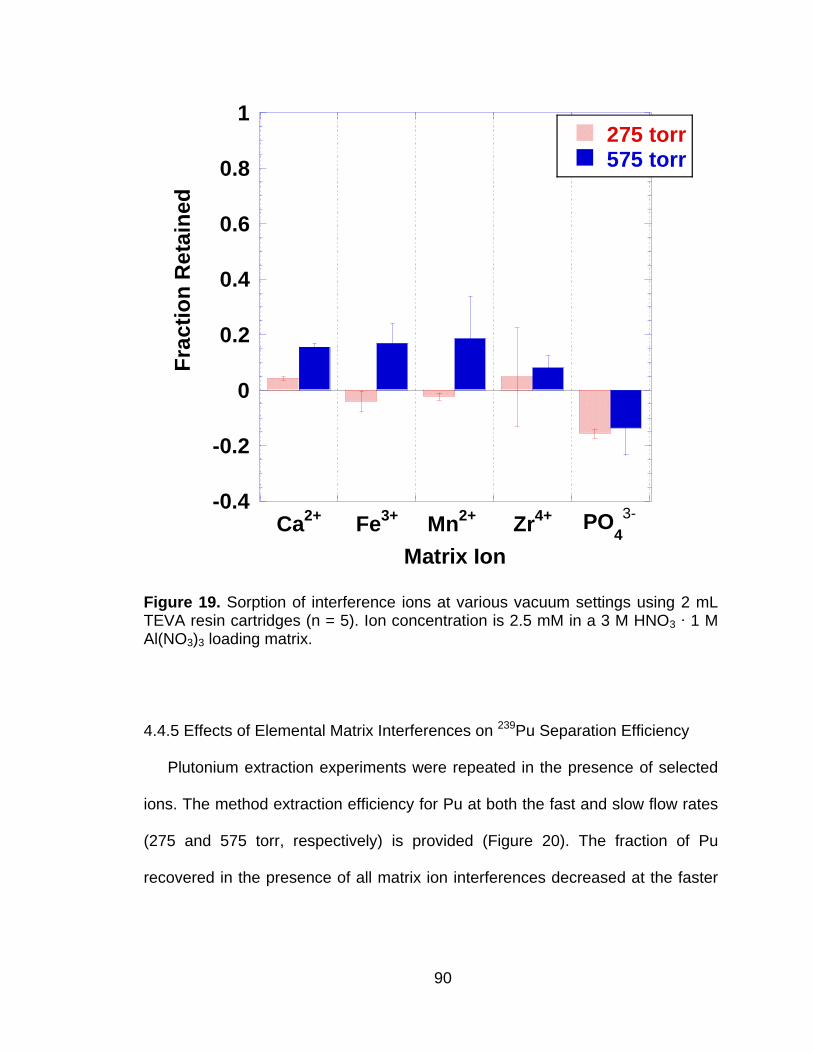
90
-0.4
-0.2
0
0.2
0.4
0.6
0.8
1
Ca2+
Fe3+
Mn2+
Zr4+ PO
4
3-
275 torr575 torr
Fra
cti
on
Re
tain
ed
Matrix Ion
Figure 19. Sorption of interference ions at various vacuum settings using 2 mL TEVA resin cartridges (n = 5). Ion concentration is 2.5 mM in a 3 M HNO3 ∙ 1 M Al(NO3)3 loading matrix.
4.4.5 Effects of Elemental Matrix Interferences on 239Pu Separation Efficiency
Plutonium extraction experiments were repeated in the presence of selected
ions. The method extraction efficiency for Pu at both the fast and slow flow rates
(275 and 575 torr, respectively) is provided (Figure 20). The fraction of Pu
recovered in the presence of all matrix ion interferences decreased at the faster
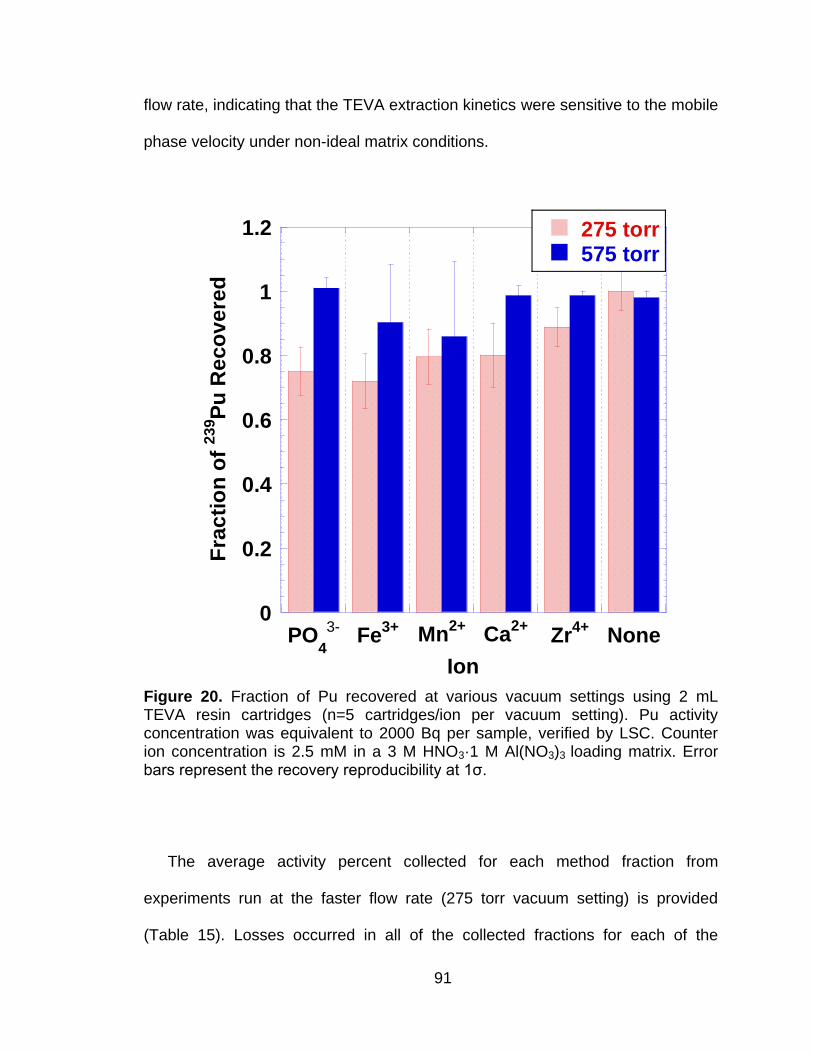
91
flow rate, indicating that the TEVA extraction kinetics were sensitive to the mobile
phase velocity under non-ideal matrix conditions.
0
0.2
0.4
0.6
0.8
1
1.2
PO4
3-Fe
3+ Mn2+
Ca2+
Zr4+
None
275 torr575 torr
Fra
cti
on
of
239P
u R
eco
ve
red
Ion
Figure 20. Fraction of Pu recovered at various vacuum settings using 2 mL TEVA resin cartridges (n=5 cartridges/ion per vacuum setting). Pu activity concentration was equivalent to 2000 Bq per sample, verified by LSC. Counter ion concentration is 2.5 mM in a 3 M HNO3·1 M Al(NO3)3 loading matrix. Error bars represent the recovery reproducibility at 1ζ.
The average activity percent collected for each method fraction from
experiments run at the faster flow rate (275 torr vacuum setting) is provided
(Table 15). Losses occurred in all of the collected fractions for each of the
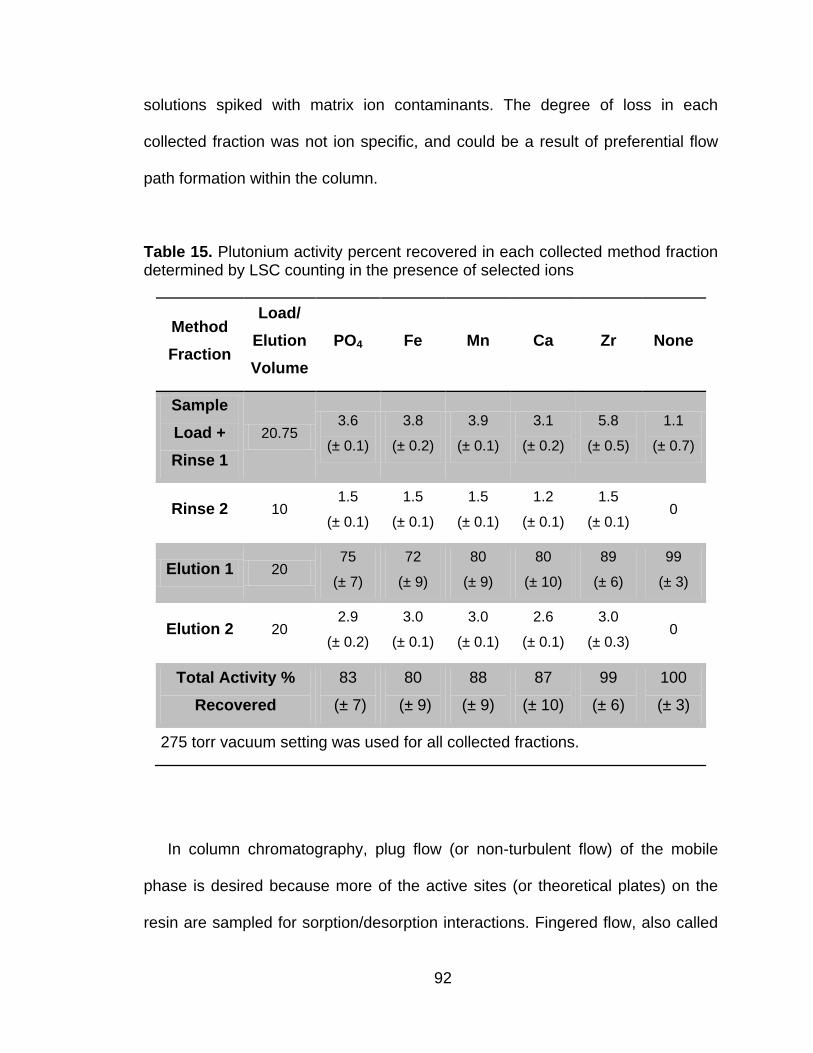
92
solutions spiked with matrix ion contaminants. The degree of loss in each
collected fraction was not ion specific, and could be a result of preferential flow
path formation within the column.
Table 15. Plutonium activity percent recovered in each collected method fraction determined by LSC counting in the presence of selected ions
Method
Fraction
Load/
Elution
Volume
PO4 Fe Mn Ca Zr None
Sample
Load +
Rinse 1
20.75 3.6
(± 0.1)
3.8
(± 0.2)
3.9
(± 0.1)
3.1
(± 0.2)
5.8
(± 0.5)
1.1
(± 0.7)
Rinse 2 10 1.5
(± 0.1)
1.5
(± 0.1)
1.5
(± 0.1)
1.2
(± 0.1)
1.5
(± 0.1) 0
Elution 1 20 75
(± 7)
72
(± 9)
80
(± 9)
80
(± 10)
89
(± 6)
99
(± 3)
Elution 2 20 2.9
(± 0.2)
3.0
(± 0.1)
3.0
(± 0.1)
2.6
(± 0.1)
3.0
(± 0.3) 0
Total Activity %
Recovered
83
(± 7)
80
(± 9)
88
(± 9)
87
(± 10)
99
(± 6)
100
(± 3)
275 torr vacuum setting was used for all collected fractions.
In column chromatography, plug flow (or non-turbulent flow) of the mobile
phase is desired because more of the active sites (or theoretical plates) on the
resin are sampled for sorption/desorption interactions. Fingered flow, also called
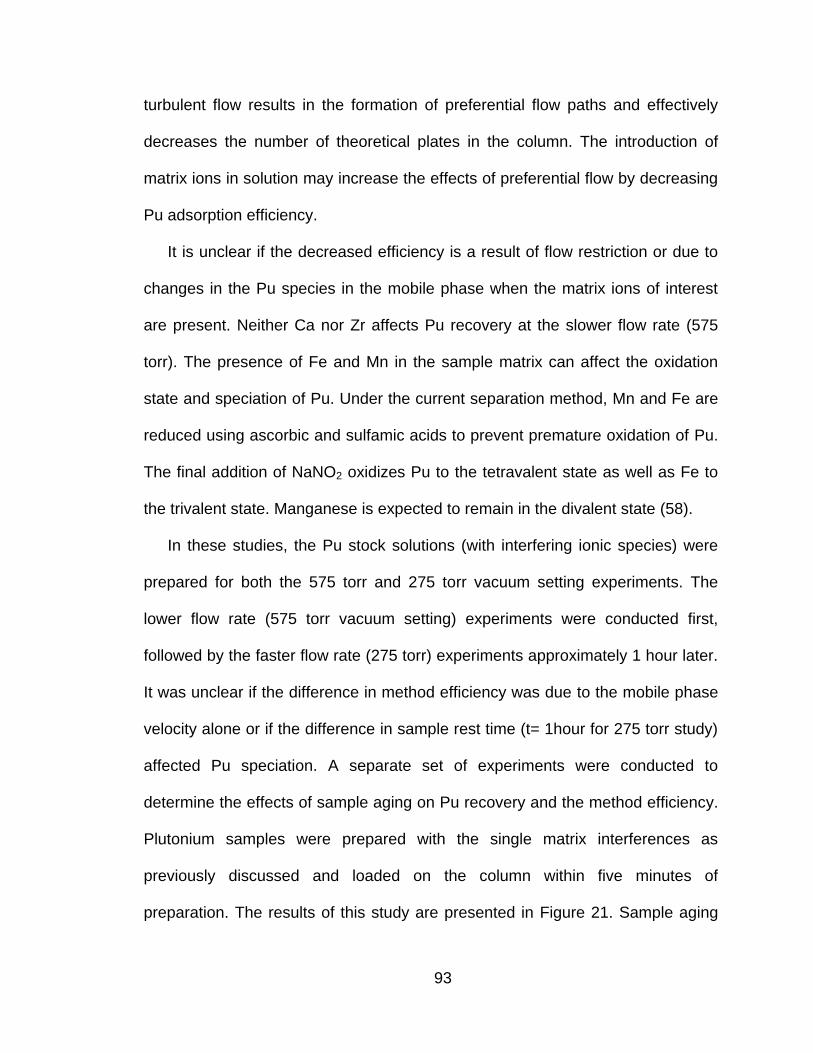
93
turbulent flow results in the formation of preferential flow paths and effectively
decreases the number of theoretical plates in the column. The introduction of
matrix ions in solution may increase the effects of preferential flow by decreasing
Pu adsorption efficiency.
It is unclear if the decreased efficiency is a result of flow restriction or due to
changes in the Pu species in the mobile phase when the matrix ions of interest
are present. Neither Ca nor Zr affects Pu recovery at the slower flow rate (575
torr). The presence of Fe and Mn in the sample matrix can affect the oxidation
state and speciation of Pu. Under the current separation method, Mn and Fe are
reduced using ascorbic and sulfamic acids to prevent premature oxidation of Pu.
The final addition of NaNO2 oxidizes Pu to the tetravalent state as well as Fe to
the trivalent state. Manganese is expected to remain in the divalent state (58).
In these studies, the Pu stock solutions (with interfering ionic species) were
prepared for both the 575 torr and 275 torr vacuum setting experiments. The
lower flow rate (575 torr vacuum setting) experiments were conducted first,
followed by the faster flow rate (275 torr) experiments approximately 1 hour later.
It was unclear if the difference in method efficiency was due to the mobile phase
velocity alone or if the difference in sample rest time (t= 1hour for 275 torr study)
affected Pu speciation. A separate set of experiments were conducted to
determine the effects of sample aging on Pu recovery and the method efficiency.
Plutonium samples were prepared with the single matrix interferences as
previously discussed and loaded on the column within five minutes of
preparation. The results of this study are presented in Figure 21. Sample aging
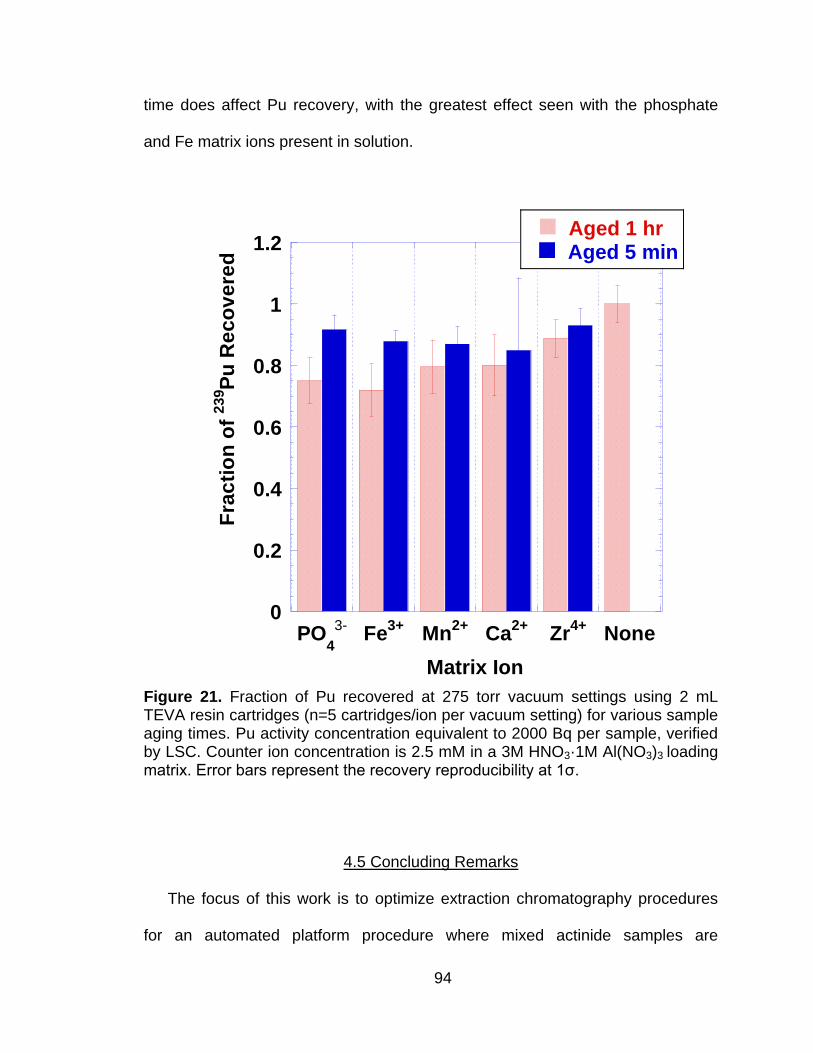
94
time does affect Pu recovery, with the greatest effect seen with the phosphate
and Fe matrix ions present in solution.
0
0.2
0.4
0.6
0.8
1
1.2
PO4
3-Fe
3+Mn
2+Ca
2+Zr
4+None
Aged 1 hrAged 5 min
Fra
cti
on
of
23
9P
u R
eco
ve
red
Matrix Ion
Figure 21. Fraction of Pu recovered at 275 torr vacuum settings using 2 mL TEVA resin cartridges (n=5 cartridges/ion per vacuum setting) for various sample aging times. Pu activity concentration equivalent to 2000 Bq per sample, verified by LSC. Counter ion concentration is 2.5 mM in a 3M HNO3·1M Al(NO3)3 loading matrix. Error bars represent the recovery reproducibility at 1ζ.
4.5 Concluding Remarks
The focus of this work is to optimize extraction chromatography procedures
for an automated platform procedure where mixed actinide samples are
95
processed in a discrete, simultaneous fashion. Our previous work focused on the
development of a prototype vacuum extraction system that is based on a
commercially available automated solid-phase extraction unit. Initial
characterization studies were completed with americium and two types of EC
resins, TRU and DGA. The results of this initial study concluded that flow rate
monitoring is not critical for reproducible method extraction efficiency and that
specific vacuum settings can be used throughout the separation procedure. In
this study, it was determined that Pu extraction is affected by the mobile phase
velocity in the presence of isolated matrix interferences such as phosphates,
calcium, manganese and iron. From an automation standpoint, these data
suggest that maintaining a lower flow rate, or fixed vacuum setting equivalent to
1-2 mL/min is favored if TEVA resin cartridges are used for Pu separations. We
are continuing this work with mixed matrix ions solutions for both americium and
Pu.
96
CHAPTER 5
HOT PARTICLE DISSOLUTION AND PLUTONIUM ISOTOPIC ANALYSIS
5.1 Abstract
A persistent challenge in both the nuclear forensics and environmental
sciences is the rapid and accurate determination of isotopic ratios of Pu in
samples containing a mixture of actinides. This process of determining Pu
isotopic ratios can be enhanced by its chemical separation from an actinide
matrix using a simplified sequential extraction chromatography method. This
work focuses on the dissolution of weapons grade Pu particles using HNO3/HF
acid digestion, vacuum assisted sequential extraction chromatography for
chemical separation and alpha spectrometry sample preparation using CeF3
micro-precipitation. Isotopic analysis was obtained by a combination of
radiometric methods (e.g. alpha/gamma spectrometry). The results of these
experiments were compared to both the historical record surrounding the source
of the particles as well as the non-destructive techniques used during the
preliminary characterization of the particles.
5.2 Introduction
Historical incidents that have resulted in the release of radioactive materials
from different sources into the environment are well documented (86-92). Once
the material is incorporated into the surrounding environment, understanding the
link between source term and nuclide speciation is of fundamental importance for
remediation efforts, dose modeling and attribution science. Particles created
97
during the release incident containing elevated levels of radioactivity are referred
to as ‗hot particles‘ (3). The United States Defense Threat Reduction Agency
(DTRA) further specifies that hot particles are ―discrete point sources‖ with a
diameter greater than or equal to 45 µm and an activity concentration greater
than 5000 Bq per particle (93). These particles have been collected from event
sites around the world and characterized in terms of surface morphology and
elemental composition using various non-destructive imaging techniques. This
information has been used to predict environmental impact in terms of
bioavailability and mobility.
Recent studies have shown that the size, oxidation state, and crystalline
structure of the particle are dependent on the type of release scenario
(2,7,8,88,94,95). While advancements in technology have given scientists the
tools to study the surface and structural characteristics of these hot particles, the
interpretation of the data remains the most challenging part. Non-destructive
techniques mainly provide qualitative characterization of hot particles. To
substantiate the effect of the hot particle on an environmental system and link the
material back to a particular source, total dissolution studies are required.
Dissolution studies provide more detailed isotopic information about the
radionuclide content of the sample. This information can be used to determine
the relationship between the sample matrix constituents and the radionuclides of
interest from a speciation perspective and also provides substantive forensic
evidence with regards to source term identification (95). As an example, the
relative abundance of Pu and U in a hot particle can be determined using non-
98
destructive imaging techniques; however, the isotopic content cannot be fully
determined. The relative isotopic abundance of Pu and U can help determine if
the material of interest originated from defense or civilian based sources (5,96).
In this work, particles with elevated gamma-ray activity were manually
isolated from soil cores obtained from a military base where a fire involving a
Boeing Michigan Aeronautical Research Center (BOMARC) surface-to-air missile
occurred over forty years ago. In this incident, the high explosive warhead caught
fire and burned uncontrollably. The pit assembly containing weapons grade Pu,
WGPu (239Pu enrichment ≥ 93% by mass), 238U and 235U burned, causing the
release of these materials into the environment during initial fire suppression and
subsequent decontamination and site remediation efforts. A detailed summary of
the incident is provided in (97) and (98), and references therein. Isolated hot
particles (n = 20) were characterized, in terms of size, morphology and depth
distribution, and elemental composition by non-destructive means (6). The
results obtained from these studies provided evidence of particle heterogeneity in
terms of elemental composition and surface morphology.
As part of the non-destructive analysis, gamma spectrometry data was also
collected for intact particles and small soil core sections with elevated gamma
activity. The spectral results provided some isotopic information based on the
photons associated with the decay of 241Am, a daughter product of 241Pu decay;
however, its presence is not particularly useful in terms of source term
characterization and material dating (5). A better understanding of the material
can be gained from the relative ratios of the minor Pu isotopes in WGPu to the
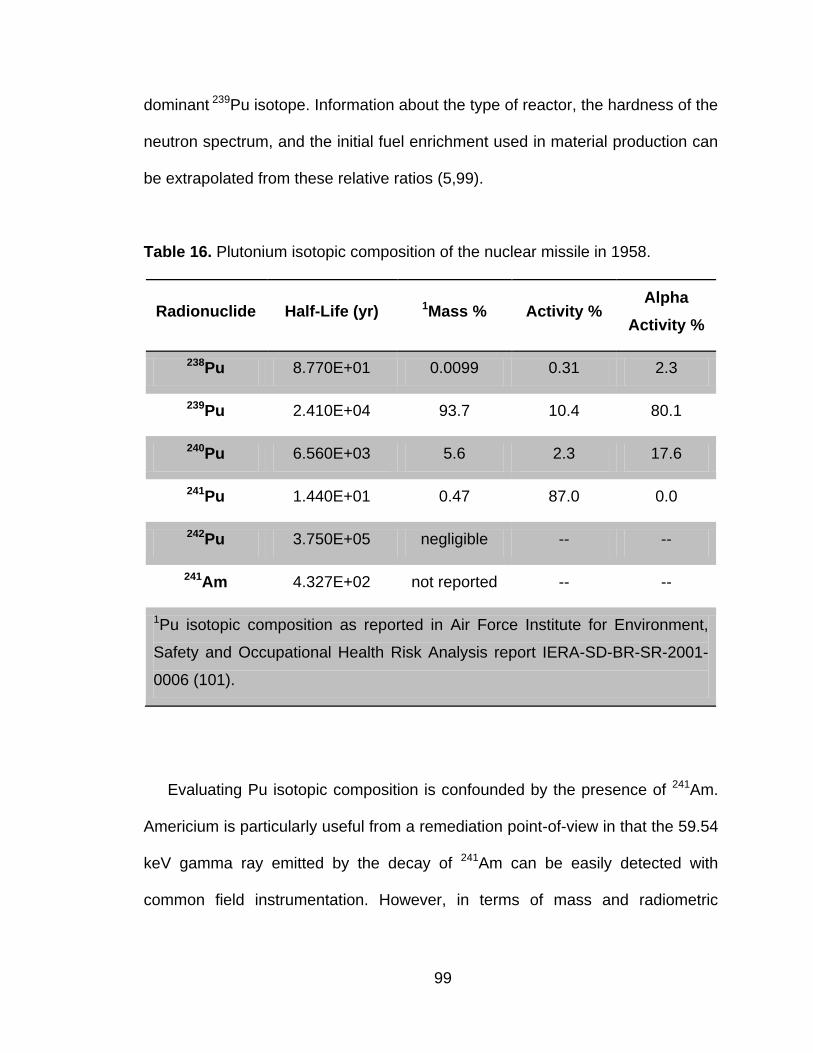
99
dominant 239Pu isotope. Information about the type of reactor, the hardness of the
neutron spectrum, and the initial fuel enrichment used in material production can
be extrapolated from these relative ratios (5,99).
Table 16. Plutonium isotopic composition of the nuclear missile in 1958.
Radionuclide Half-Life (yr) 1Mass % Activity % Alpha
Activity %
238Pu 8.770E+01 0.0099 0.31 2.3
239Pu 2.410E+04 93.7 10.4 80.1
240Pu 6.560E+03 5.6 2.3 17.6
241Pu 1.440E+01 0.47 87.0 0.0
242Pu 3.750E+05 negligible -- --
241Am 4.327E+02 not reported -- --
1Pu isotopic composition as reported in Air Force Institute for Environment,
Safety and Occupational Health Risk Analysis report IERA-SD-BR-SR-2001-
0006 (101).
Evaluating Pu isotopic composition is confounded by the presence of 241Am.
Americium is particularly useful from a remediation point-of-view in that the 59.54
keV gamma ray emitted by the decay of 241Am can be easily detected with
common field instrumentation. However, in terms of mass and radiometric
100
analysis, 241Am is a spectral interference for 241Pu (m/z ratio), 238Pu (alpha
energy analysis) and 240Pu (gamma energy analysis).
The focus of this work was to chemically isolate Pu from other matrix
constituents to determine the isotopic composition of each dissolved particle.
Seven particles were dissolved individually in nitric/hydrofluoric acid and the Pu
was purified using extraction chromatography resins. Plutonium was isolated on
TEVA resin (Eichrom Technologies, Inc., Darien, Il, USA) and isotopic analysis
was performed with gamma and alpha spectrometry using a cerium fluoride
sample preparation method. The observed isotopic ratios were compared to
those provided in the site remediation reports (92,100,101). The reported Pu
isotopic composition of the weapon is provided in Table 16. Elemental analysis of
each hot particle solution was also performed to determine the variances in
particle composition.
5.3 Materials and Methods
5.3.1 Reagents
Nitric, hydrochloric and hydrofluoric acid solutions were prepared from
reagent grade acids (ACS reagent grade, Merck KGaA, Darmstadt, Germany)
and de-ionized (DI) water (18 MΩ∙cm, Millipore, Billerica, MA, USA). Hydrogen
peroxide (30.0-32.0%, ACS reagent grade, Mallinckrodt Baker, Inc., Phillipsburg,
NJ, USA) was added to the nitric/hydrofluoric acid solution during particle
digestion. Aliquots of each dissolved hot particle solution were diluted with the
nitric/hydrofluoric acid and aluminum nitrate nonahydrate crystals
101
(Al(NO3)3∙9H2O, ACS grade, Merck KGaA) were added to each sample to
remove excess fluoride ions. Plutonium was selectively extracted using a mixture
of hydrofluoric/hydrochloric acids, 20% TiCl3 solution (p.a. grade, Merck KGaA,
Darmstadt, Germany), and de-ionized water. The TiCl3 solution was added to the
HCl/HF mixture within thirty minutes of preparation.
TEVA and DGA extraction chromatography resins (Eichrom Technologies,
Inc., Darien, Il, USA) were used for Pu, U and Am isolation from other matrix
constituents and radionuclide purification. The active component of the TEVA
resin (50-100 µm particle diameter) is an aliphatic quaternary amine that is
selective for tetra-valent actinides over tri- and hexa- valent actinides and fission
products (34). DGA is a diglycolamide-based extraction chromatographic resin
(DGA- normal, 50-100 µm, 40% w:w) that is also effective for actinide
separations (31). When used in combination, TEVA extracts the tetra- valent
actinides and the tri- and hexa-valent actinides are retained by DGA. Each resin
type is self-contained in a pre-packed polypropylene cartridge that contains
approximately 2 mL of resin. The resin cartridges are stackable, allowing for
sequential isolation of the actinides of interest during sample loading. The
cartridges are then separated and subsequent elutions are carried out for each
resin type for actinide purification.
5.3.2 Particle Dissolution
Isolated particles were placed in labeled 50 mL wide mouth Teflon bottles
(Sigma-Aldrich, St. Louis, MO, USA), covered with 5 mL of 7 M HNO3-0.05 M HF
and approximately 0.5 mL of H2O2. Teflon stir bars were added to each vial for
102
continuous mixing (lowest setting) and the solutions were heated to 120-160 °C
until complete evaporation of the acid solution was observed. The dissolution
process was repeated twice with a total dissolution time of approximately 2
hours. Each dissolved particle solution was filtered through a 0.45 µm
polytetrafluoroethylene (PTFE) filter and collected in a 50 mL centrifuge tube.
The PTFE filter was washed three times with 5 mL of nitric/hydrofluoric acid, with
each wash collected in separate vials. After the final wash, each filter was placed
on a sodium iodide (NaI) detector to determine if any residual gamma activity
remained on the filter.
Aliquots of each dissolved particle solution and filter wash were taken for total
activity verification by liquid scintillation counting, (LSC, Tri-carb 3100, Perkin
Elmer, Boston, MA, USA) with 10 mL of Ultima Gold AB cocktail (Perkin Elmer,
USA) as the counting medium. The LSC samples were counted for 60 minutes or
until the counting error reached 2S% (2% of the 2ζ standard deviation of the total
counts) in the energy window (50-1000 keV) labeled CPMB. The 2S% is a
standard protocol option that serves as a normalization parameter for the
comparison of multiple sample measurements, i.e. the error reported for each
measurement represents 2% of twice the standard deviation of the counts
collected in the CPMB region of the spectrum. The average background count
rate in the CPMB energy window was 8.83 ± 0.77 (1ζ) cpm for method blanks.
5.3.3 Chemical Separations
An aliquot of the dissolved particle solution equivalent to 2000 Bq of total
activity was placed in a labeled 50 mL centrifuge tube. The volume was adjusted
103
to 10 mL with 7 M HNO3- 0.05 M HF. Aluminum nitrate (0.05 M) was added to
remove excess fluoride anions from solution and the sample was allowed to rest
for at least 1 hour before performing separations. Plutonium, U and Am were
chemically isolated from other matrix constituents using stacked TEVA/DGA
extraction chromatography resin cartridges. Five samples solutions were
prepared for sequential extraction from each filtered hot particle solution.
Samples were transferred to holding reservoirs that were attached to the stacked
resin cartridges. The lower cartridge (DGA) was secured in the lid of a vacuum
extraction unit that was developed in-house. Sample loading and average elution
flow rate were controlled by a digital vacuum regulator (J-Kem Scientific, Inc., St.
Louis, MO, USA). For each elution step, the vacuum box was maintained at a
constant pressure of 575 torr, resulting in an average flow rate of 1 to 3 mL/min
(per 2 mL resin cartridge). All experiments were performed at room temperature
(20.2 ± 1.8 °C). Prior to sample loading, the resin cartridges were wetted and
equilibrated with 5 mL of 7 M HNO3. The sample loading solution was added
immediately after the pre-treatment of the resin. Tetravalent Pu was sorbed to
the TEVA resin and Am3+ and UO22+ were sorbed to the DGA resin (31,34). Both
pre-treatment and sample loading solution volumes were collected in a centrifuge
tube (total volume ~15 mL). After sample loading, the vacuum on the extraction
unit was released, the TEVA and DGA cartridges were unstacked and the
collection tubes were exchanged for the next extraction step. Each subsequent
elution fraction was collected and reserved for liquid scintillation counting and
cerium fluoride precipitation sample preparation. Plutonium was eluted from the
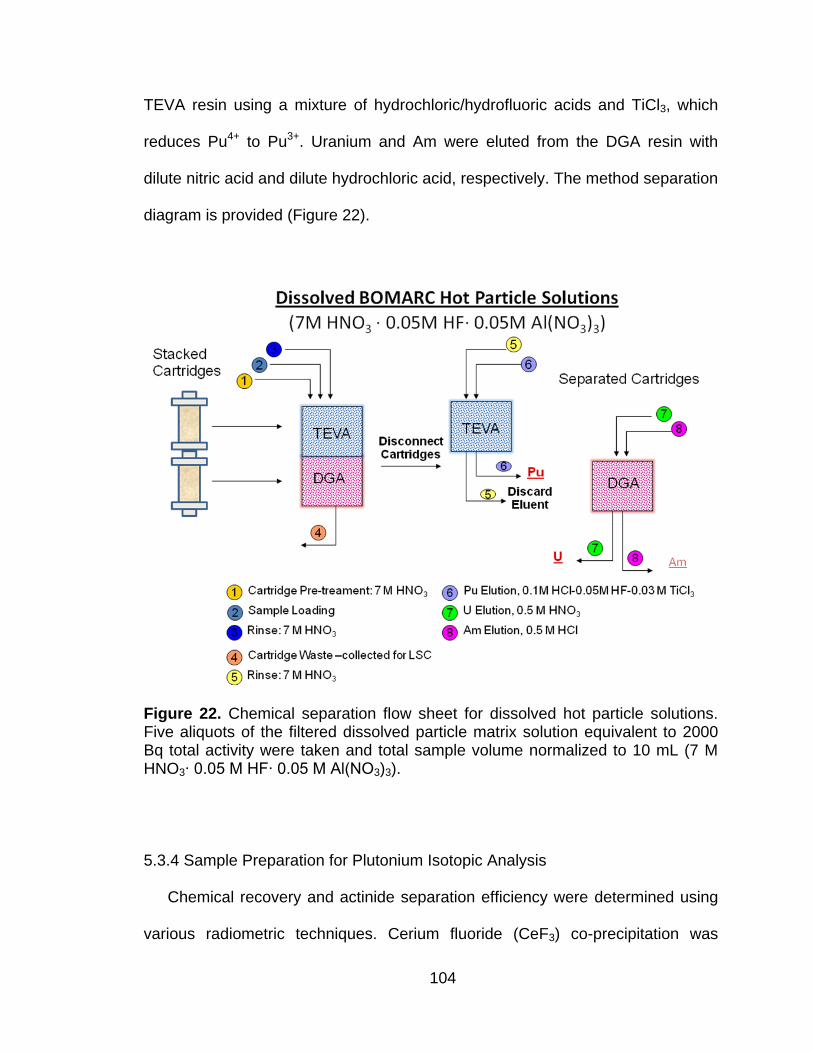
104
TEVA resin using a mixture of hydrochloric/hydrofluoric acids and TiCl3, which
reduces Pu4+ to Pu3+. Uranium and Am were eluted from the DGA resin with
dilute nitric acid and dilute hydrochloric acid, respectively. The method separation
diagram is provided (Figure 22).
Figure 22. Chemical separation flow sheet for dissolved hot particle solutions. Five aliquots of the filtered dissolved particle matrix solution equivalent to 2000 Bq total activity were taken and total sample volume normalized to 10 mL (7 M HNO3∙ 0.05 M HF∙ 0.05 M Al(NO3)3).
5.3.4 Sample Preparation for Plutonium Isotopic Analysis
Chemical recovery and actinide separation efficiency were determined using
various radiometric techniques. Cerium fluoride (CeF3) co-precipitation was
105
chosen for sample preparation based on its utility for both radiometric and mass
analysis methods. A Ce carrier was added to the sample solution followed by an
excess of concentrated HF to force precipitate formation. The sample was
allowed to rest for 30 minutes and was then filtered through a Resolve filter
(polypropylene, 0.1 µm pore size, 25 mm diameter, Eichrom Technologies, Inc.).
The precipitate was collected on the filter and air dried for approximately 20
minutes. A more detailed explanation of the CeF3 precipitation procedure is
available from the filter manufacturer (29).
5.3.5 Plutonium Isotopic Analysis – Gamma and Alpha Spectrometry
The detection methods used for hot particle isotopic analysis were primarily
alpha and gamma spectrometry. The CeF3 filters were counted for 24 hours on a
broad energy spectrum germanium detector (BEGe, Canberra Industries, Inc.,
Meriden, CT, USA) to collect the gamma spectrum for the Pu fraction. Three
photon energies were used for determining 239Pu content, 38.7 keV (0.0105%
yield), 51.6 keV (0.0271% yield) and 129 keV (6.31 x10⁻³% yield). The lower
energy photons were chosen based on the relative proximity to the photon
energies chosen for 240Pu and 238Pu evaluation, 45.1 keV (0.045% yield) and
43.8 keV (0.0392% yield), respectively. The 129 keV photon associated with
239Pu decay, whose attenuation caused by the intervening sample matrix is
considerably less than that of the lower-energy photons, was used as a third
reference point for determining the absolute amount of 239Pu in each sample. The
relative ratios of 239Pu to 240Pu and 238Pu were determined based on the following
relationship:
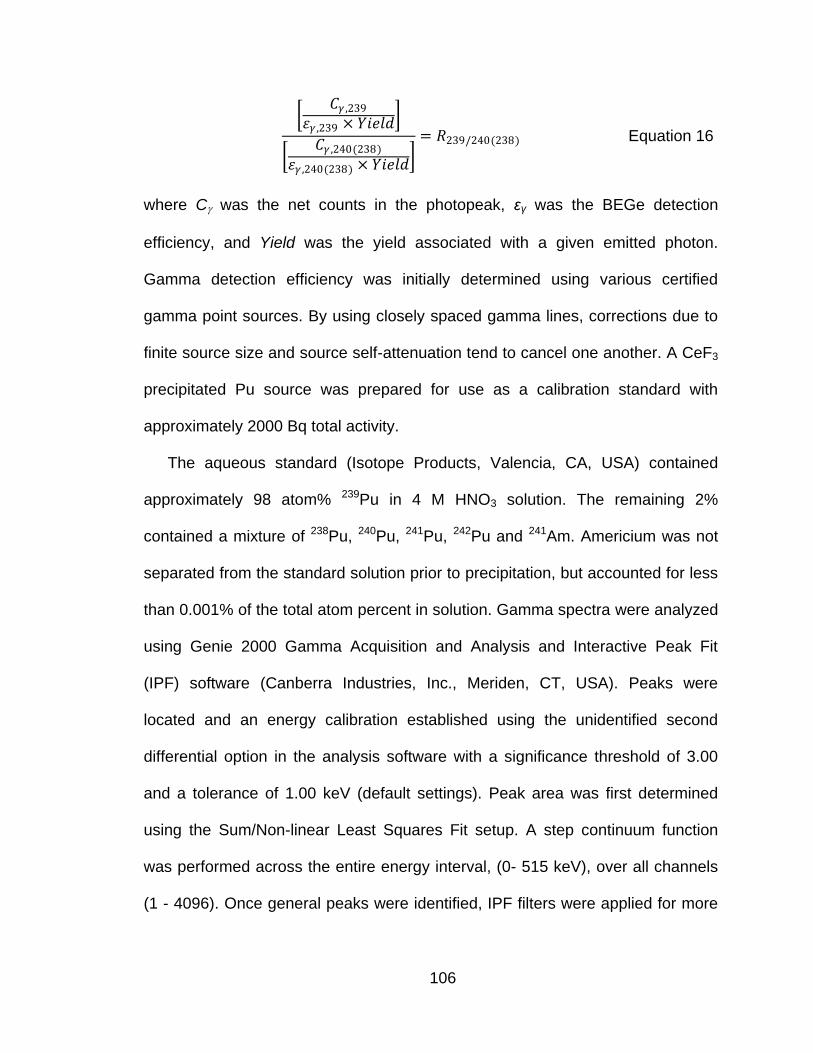
106
𝐶𝛾 ,239
𝜀𝛾 ,239 × 𝑌𝑖𝑒𝑙𝑑
𝐶𝛾 ,240(238)
𝜀𝛾 ,240(238) × 𝑌𝑖𝑒𝑙𝑑
= 𝑅239/240(238) Equation 16
where C was the net counts in the photopeak, εγ was the BEGe detection
efficiency, and Yield was the yield associated with a given emitted photon.
Gamma detection efficiency was initially determined using various certified
gamma point sources. By using closely spaced gamma lines, corrections due to
finite source size and source self-attenuation tend to cancel one another. A CeF3
precipitated Pu source was prepared for use as a calibration standard with
approximately 2000 Bq total activity.
The aqueous standard (Isotope Products, Valencia, CA, USA) contained
approximately 98 atom% 239Pu in 4 M HNO3 solution. The remaining 2%
contained a mixture of 238Pu, 240Pu, 241Pu, 242Pu and 241Am. Americium was not
separated from the standard solution prior to precipitation, but accounted for less
than 0.001% of the total atom percent in solution. Gamma spectra were analyzed
using Genie 2000 Gamma Acquisition and Analysis and Interactive Peak Fit
(IPF) software (Canberra Industries, Inc., Meriden, CT, USA). Peaks were
located and an energy calibration established using the unidentified second
differential option in the analysis software with a significance threshold of 3.00
and a tolerance of 1.00 keV (default settings). Peak area was first determined
using the Sum/Non-linear Least Squares Fit setup. A step continuum function
was performed across the entire energy interval, (0- 515 keV), over all channels
(1 - 4096). Once general peaks were identified, IPF filters were applied for more
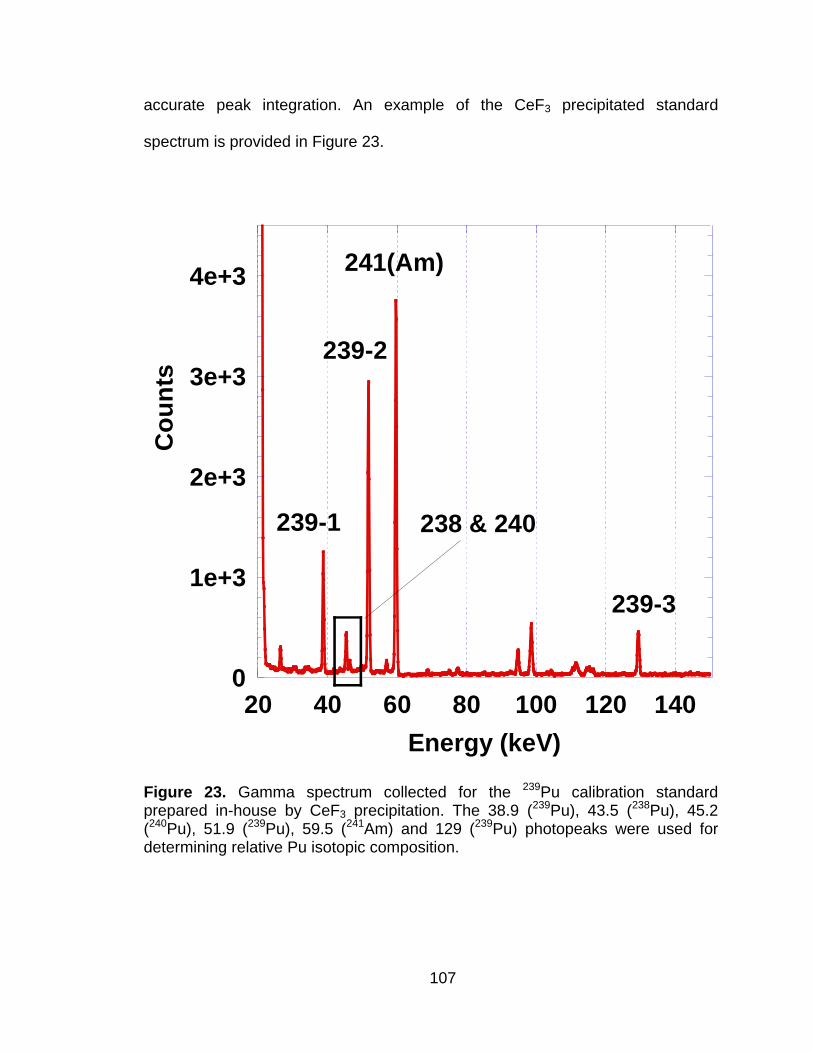
107
accurate peak integration. An example of the CeF3 precipitated standard
spectrum is provided in Figure 23.
0
1e+3
2e+3
3e+3
4e+3
20 40 60 80 100 120 140
Co
un
ts
Energy (keV)
239-1
239-2
241(Am)
239-3
238 & 240
Figure 23. Gamma spectrum collected for the 239Pu calibration standard prepared in-house by CeF3 precipitation. The 38.9 (239Pu), 43.5 (238Pu), 45.2 (240Pu), 51.9 (239Pu), 59.5 (241Am) and 129 (239Pu) photopeaks were used for determining relative Pu isotopic composition.
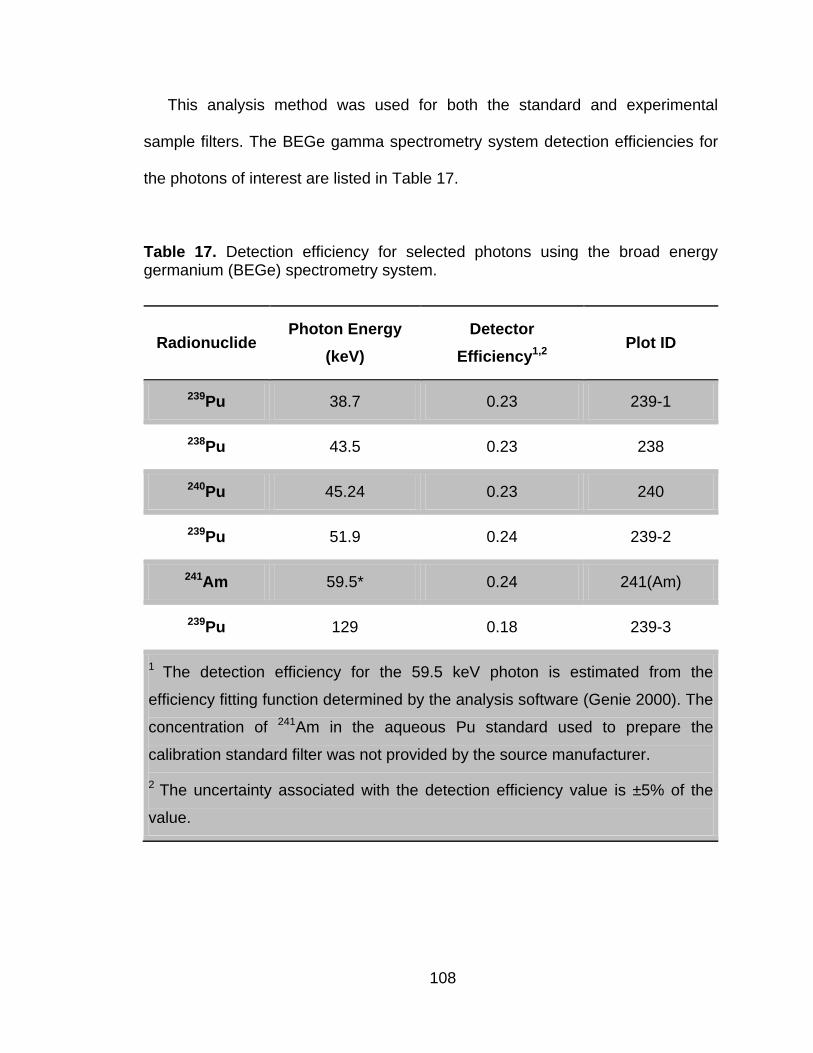
108
This analysis method was used for both the standard and experimental
sample filters. The BEGe gamma spectrometry system detection efficiencies for
the photons of interest are listed in Table 17.
Table 17. Detection efficiency for selected photons using the broad energy germanium (BEGe) spectrometry system.
Radionuclide Photon Energy
(keV)
Detector
Efficiency1,2 Plot ID
239Pu 38.7 0.23 239-1
238Pu 43.5 0.23 238
240Pu 45.24 0.23 240
239Pu 51.9 0.24 239-2
241Am 59.5* 0.24 241(Am)
239Pu 129 0.18 239-3
1 The detection efficiency for the 59.5 keV photon is estimated from the
efficiency fitting function determined by the analysis software (Genie 2000). The
concentration of 241Am in the aqueous Pu standard used to prepare the
calibration standard filter was not provided by the source manufacturer.
2 The uncertainty associated with the detection efficiency value is ±5% of the
value.
109
Alpha spectra were collected on an Alpha Analyst spectrometer (Canberra
Industries, Inc., Meriden, CT, USA). The solid state detectors used for all
experiments had an active area of 450 mm2 and the sample position was fixed at
16 mm from the detector face. A 24 hour background count was obtained for
each chamber prior to sample analysis and a 1000 second background count
was taken prior to and immediately after sample counting.
The activity of each filter was first assessed with a hand-held analog
alpha/beta count rate meter (Model 2360, Ludlum Measurements, Inc.,
Sweetwater, TX, USA). Filters containing less than 50 Bq total activity were
counted in low background chambers and those with activity greater than 50 Bq
per filter were counted in ―high activity‖ designated chambers to minimize cross-
contamination effects. Filters were counted for 1000 seconds to 24 hours on the
alpha spectrometry system, depending on the activity concentration. Filters that
were prepared from the minor elution fractions collected (i.e. sample load and
rinse fractions) were counted for 24 hours to determine if any residual alpha
activity was present. The CeF3 filters that contained the isolated Pu and Am were
counted for 1000 seconds. Each Pu and Am filter was counted three times.
Alpha spectrum analysis was performed with Genie 2000 and Alpha Analyst
software (Canberra Industries, Inc.). Alpha detection efficiency for the CeF3 filters
was approximately 9.2 ± 1.1%, independent of alpha-decay energy. Peak
integration was performed by manually defining the alpha peak region of interest
(ROI). The combined 240+239Pu alpha peak ROI was set between 4.96 MeV and
5.21 MeV. The 238Pu/241Am peak ROI was set between 5.31 MeV and 5.57 MeV.
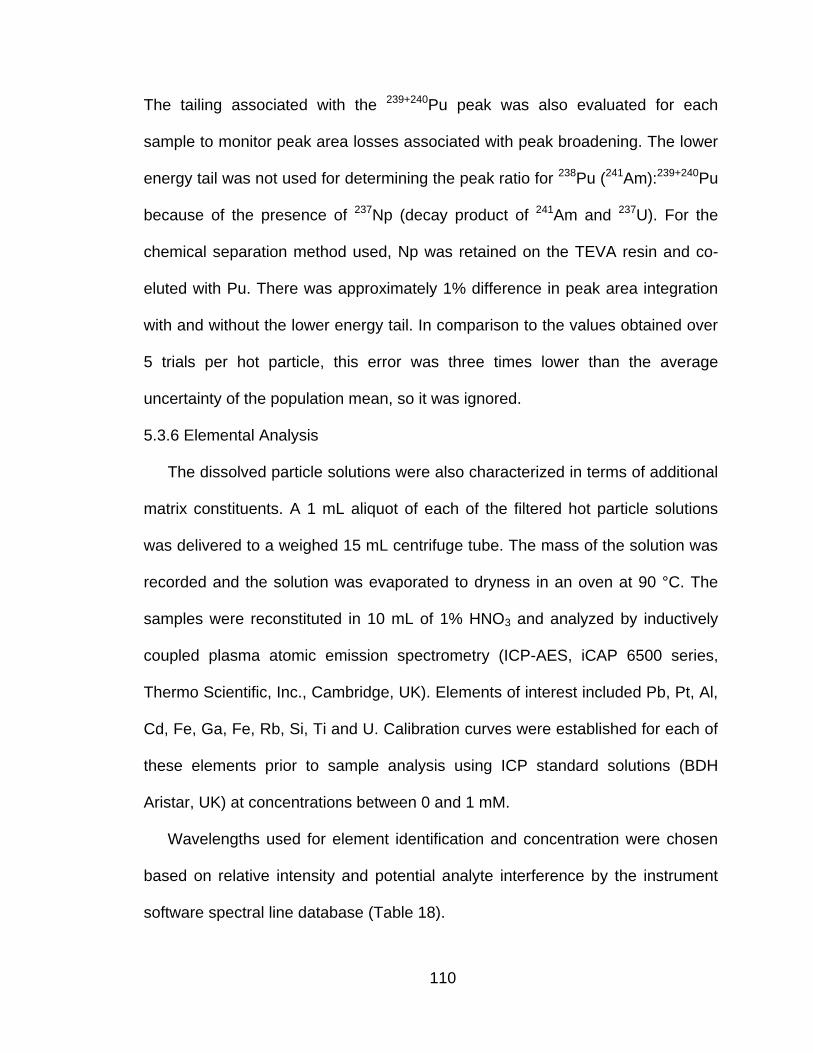
110
The tailing associated with the 239+240Pu peak was also evaluated for each
sample to monitor peak area losses associated with peak broadening. The lower
energy tail was not used for determining the peak ratio for 238Pu (241Am):239+240Pu
because of the presence of 237Np (decay product of 241Am and 237U). For the
chemical separation method used, Np was retained on the TEVA resin and co-
eluted with Pu. There was approximately 1% difference in peak area integration
with and without the lower energy tail. In comparison to the values obtained over
5 trials per hot particle, this error was three times lower than the average
uncertainty of the population mean, so it was ignored.
5.3.6 Elemental Analysis
The dissolved particle solutions were also characterized in terms of additional
matrix constituents. A 1 mL aliquot of each of the filtered hot particle solutions
was delivered to a weighed 15 mL centrifuge tube. The mass of the solution was
recorded and the solution was evaporated to dryness in an oven at 90 °C. The
samples were reconstituted in 10 mL of 1% HNO3 and analyzed by inductively
coupled plasma atomic emission spectrometry (ICP-AES, iCAP 6500 series,
Thermo Scientific, Inc., Cambridge, UK). Elements of interest included Pb, Pt, Al,
Cd, Fe, Ga, Fe, Rb, Si, Ti and U. Calibration curves were established for each of
these elements prior to sample analysis using ICP standard solutions (BDH
Aristar, UK) at concentrations between 0 and 1 mM.
Wavelengths used for element identification and concentration were chosen
based on relative intensity and potential analyte interference by the instrument
software spectral line database (Table 18).

111
Table 18. Photon wavelengths used to determine signal intensity for the ICP-AES
Counter Ion Photon Wavelength (nm) Relative Intensity
Nitrogen 174.2 1.8 x 10⁴
Silicon 251.6 6.0 x 10⁵
Iron 259.9 2.0 x 10⁶
Aluminum 167.0 1.83 x 10⁶
Rubidium 424.4 2.5 x 10⁴
Cadmium 228.8 2.0 x 10⁶
Lead 220.3 1.2 x 10⁵
Gallium 294.3 4.0 x 10⁵
Platinum 214.4 1.5 x 10⁵
Titanium 334.9 5.0 x 10⁶
Uranium 367.0 5.0 x 10⁴
The relative intensity value is based on the detector sensitivity for the
element over other elements with similar photon wavelengths.
112
5.4 Results and Discussion
5.4.1 Plutonium Isotopic Composition – Historical Record
Several unclassified reports have been published on the incident that
occurred on 7 June 1960 involving the BOMARC weapon (97,98,101,102)
regarding site monitoring and remediation efforts. Following the incident,
explosive ordinance disposal personnel filled containers with the warhead debris
at which time it was shipped to various secure storage facilities (92,102).
Analysts from the Los Alamos National Laboratory (LANL) performed nuclear
measurements on the containers and determined that most of the WGPu was
recovered.
The exact amount of Pu and U present during the fire was not provided;
however, it was estimated that approximately 60-300 g of WGPu was released
into the environment as a result of fire suppression, response activities and
routine activities that occurred post-accident (92). It was also assumed that most
of the Pu released into the environment was in the dioxide form, PuO2. This
assumption was supported by site remediation efforts, where in-situ survey
measurements and soil core analysis suggested that activity was not uniformly
distributed, but isolated in ‗hot-spots‘ around the site (92). Data from the United
States Air Force (USAF) remediation efforts and the characterization studies
conducted at LANL collectively provide information regarding the estimated
isotopic composition of the WGPu used in the BOMARC missile, listed in Table
16.
113
5.4.2 Particle Dissolution
All that was known about particle composition was based on the historical
record and the information obtained from non-destructive analysis studies. Data
collected by extended x-ray absorption fine structure (EXAFS) and x-ray
absorption near edge spectroscopy (XANES) indicated that the particle matrix
was in a mixed oxide form (6). Elemental mapping using micro x-ray
fluorescence (µ-XRF) and energy dispersive spectroscopy (EDS) indicated that
Pb, Fe, Ga, Al and Si were also present on the surfaces of the particles (6). In
addition to the particle matrix components, mounting adhesives that were used
for non-destructive particle characterization were also present, which included
organic polymers and gold coating. In terms of isotopic analysis and relative
radionuclide abundance, total dissolution is critical. The 7 M HNO3/0.05 M HF
acid digestion procedure with H2O2 added as a catalyst was chosen based on
preliminary work described in (103) regarding Pu recovery from WGPu
disposition for incorporation into mixed oxide fuel (MOX). In this method, Pu
metal is converted to PuO2, which is then dissolved for the chemical separation
of Ga by ion exchange prior to production of the purified Pu dioxide needed for
the MOX fuel.
The particles used for the dissolution experiments varied in size, shape and
morphology, but all were within a 50 to 500 µm size range and could be seen
with the naked eye prior to dissolution. After the first acid treatment, smaller
particles were noticed in the Teflon vial. These particles varied in color and size
and it was unclear if they were from the breakdown of the particle or from the

114
digestion of the mounting adhesives. After the third acid treatment, light brown
flakes floated on the surface. These flakes were only observed in particles that
were gold coated. A flake was isolated, rinsed with DI water and placed under a
lead-shielded NaI detector that was attached to a count rate meter. No counts
were distinguished over background, indicating the sample did not contain
gamma emitting isotopes. After the dissolved sample was evaporated, a total of 5
to 10 mL of 7 M HNO3/0.05 M HF was added to the vial in 0.5 mL increments.
Each addition was transferred to a polypropylene syringe that was fitted with a
0.45 µm PTFE filter.
The Teflon container used for dissolution was checked for activity with the NaI
detector after each 0.5 mL rinse. The rinse process was repeated until the
residual activity in the container was less than 1% of the total count rate
observed prior to rinsing. Initial particle mass was not measureable with the
instrumentation available in the laboratory, therefore, a quantitative assessment
of the total dissolved solids was not possible. The total activity in solution was
determined by LSC and these data were qualitatively compared to the original
activity estimates determined by non-destructive gamma spectrometry analysis
(Table 19). The non-destructive analysis consisted of peak integration of selected
photons associated with the decay of 239Pu, 241Am, and 235U. Total activity was
extrapolated from relative peak ratios and the information provided in Table 16.
The particle activity estimates from both non-destructive and dissolution
experiments were within a factor of 2 for most of the hot particles. The exceptions
were the two highest activity particles, labeled HP-10 and HP-18. The LSC data
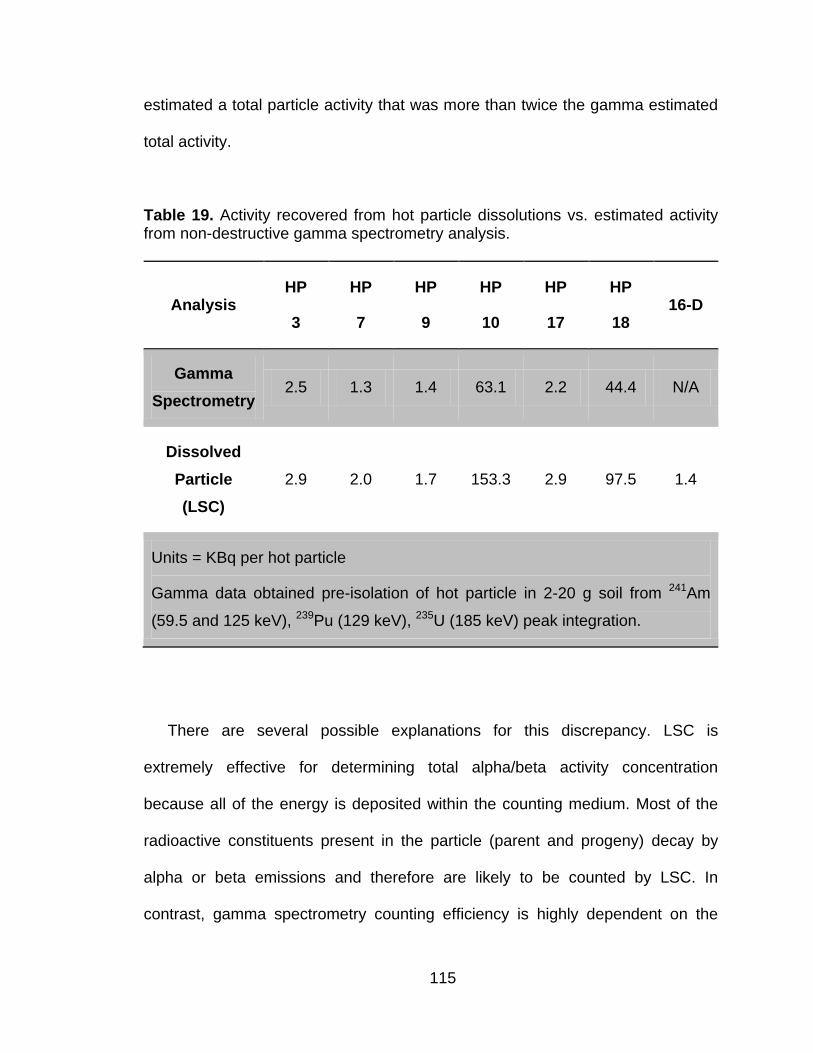
115
estimated a total particle activity that was more than twice the gamma estimated
total activity.
Table 19. Activity recovered from hot particle dissolutions vs. estimated activity from non-destructive gamma spectrometry analysis.
Analysis HP
3
HP
7
HP
9
HP
10
HP
17
HP
18 16-D
Gamma
Spectrometry 2.5 1.3 1.4 63.1 2.2 44.4 N/A
Dissolved
Particle
(LSC)
2.9 2.0 1.7 153.3 2.9 97.5 1.4
Units = KBq per hot particle
Gamma data obtained pre-isolation of hot particle in 2-20 g soil from 241Am
(59.5 and 125 keV), 239Pu (129 keV), 235U (185 keV) peak integration.
There are several possible explanations for this discrepancy. LSC is
extremely effective for determining total alpha/beta activity concentration
because all of the energy is deposited within the counting medium. Most of the
radioactive constituents present in the particle (parent and progeny) decay by
alpha or beta emissions and therefore are likely to be counted by LSC. In
contrast, gamma spectrometry counting efficiency is highly dependent on the
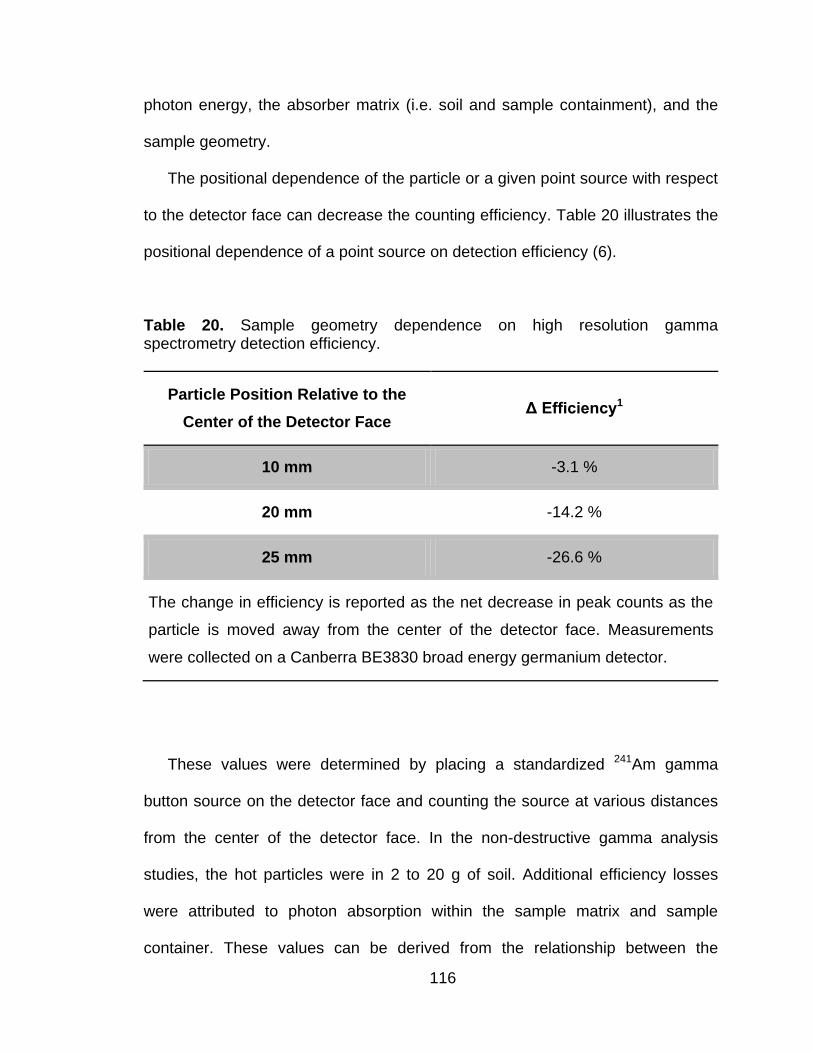
116
photon energy, the absorber matrix (i.e. soil and sample containment), and the
sample geometry.
The positional dependence of the particle or a given point source with respect
to the detector face can decrease the counting efficiency. Table 20 illustrates the
positional dependence of a point source on detection efficiency (6).
Table 20. Sample geometry dependence on high resolution gamma spectrometry detection efficiency.
Particle Position Relative to the
Center of the Detector Face Δ Efficiency1
10 mm -3.1 %
20 mm -14.2 %
25 mm -26.6 %
The change in efficiency is reported as the net decrease in peak counts as the
particle is moved away from the center of the detector face. Measurements
were collected on a Canberra BE3830 broad energy germanium detector.
These values were determined by placing a standardized 241Am gamma
button source on the detector face and counting the source at various distances
from the center of the detector face. In the non-destructive gamma analysis
studies, the hot particles were in 2 to 20 g of soil. Additional efficiency losses
were attributed to photon absorption within the sample matrix and sample
container. These values can be derived from the relationship between the
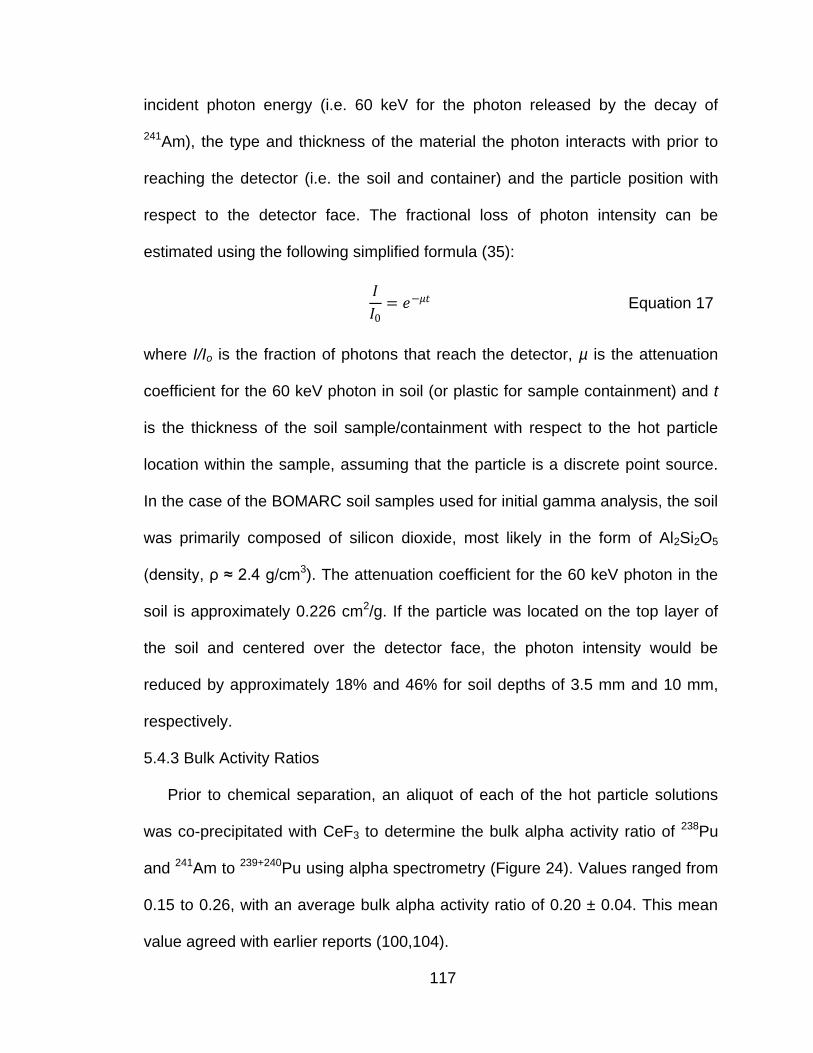
117
incident photon energy (i.e. 60 keV for the photon released by the decay of
241Am), the type and thickness of the material the photon interacts with prior to
reaching the detector (i.e. the soil and container) and the particle position with
respect to the detector face. The fractional loss of photon intensity can be
estimated using the following simplified formula (35):
𝐼
𝐼0= 𝑒−𝜇𝑡 Equation 17
where I/Io is the fraction of photons that reach the detector, µ is the attenuation
coefficient for the 60 keV photon in soil (or plastic for sample containment) and t
is the thickness of the soil sample/containment with respect to the hot particle
location within the sample, assuming that the particle is a discrete point source.
In the case of the BOMARC soil samples used for initial gamma analysis, the soil
was primarily composed of silicon dioxide, most likely in the form of Al2Si2O5
(density, ρ ≈ 2.4 g/cm3). The attenuation coefficient for the 60 keV photon in the
soil is approximately 0.226 cm2/g. If the particle was located on the top layer of
the soil and centered over the detector face, the photon intensity would be
reduced by approximately 18% and 46% for soil depths of 3.5 mm and 10 mm,
respectively.
5.4.3 Bulk Activity Ratios
Prior to chemical separation, an aliquot of each of the hot particle solutions
was co-precipitated with CeF3 to determine the bulk alpha activity ratio of 238Pu
and 241Am to 239+240Pu using alpha spectrometry (Figure 24). Values ranged from
0.15 to 0.26, with an average bulk alpha activity ratio of 0.20 ± 0.04. This mean
value agreed with earlier reports (100,104).
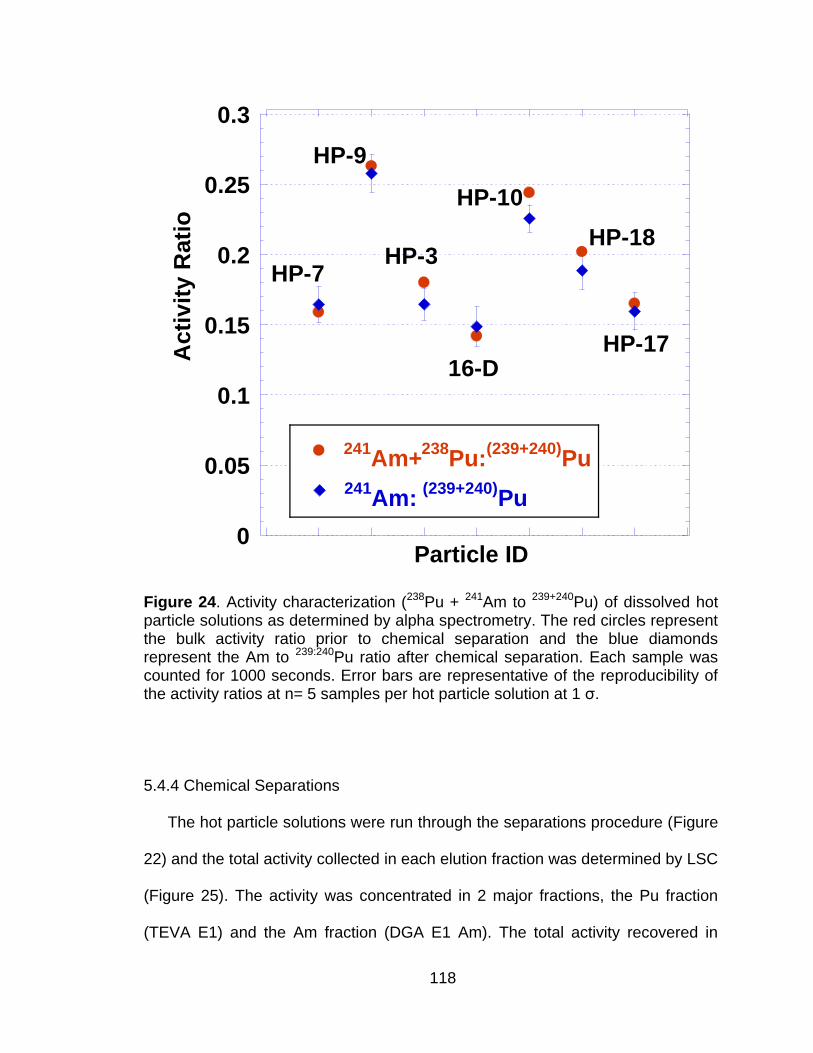
118
0
0.05
0.1
0.15
0.2
0.25
0.3
HP-7
HP-9
HP-3
16-D
HP-10
HP-18
HP-17
241Am+
238Pu:
(239+240)Pu
241Am:
(239+240)Pu
Acti
vit
y R
ati
o
Particle ID
Figure 24. Activity characterization (238Pu + 241Am to 239+240Pu) of dissolved hot particle solutions as determined by alpha spectrometry. The red circles represent the bulk activity ratio prior to chemical separation and the blue diamonds represent the Am to 239:240Pu ratio after chemical separation. Each sample was counted for 1000 seconds. Error bars are representative of the reproducibility of the activity ratios at n= 5 samples per hot particle solution at 1 ζ.
5.4.4 Chemical Separations
The hot particle solutions were run through the separations procedure (Figure
22) and the total activity collected in each elution fraction was determined by LSC
(Figure 25). The activity was concentrated in 2 major fractions, the Pu fraction
(TEVA E1) and the Am fraction (DGA E1 Am). The total activity recovered in
119
these two fractions was 98±3%, indicating that the separation procedure
successfully isolated the bulk of the activity from solution.
0
0.2
0.4
0.6
0.8
1
Lo
ad
Rin
se
1
TE
VA
R2
TEVA E1
TE
VA
E2
DG
A R
2
DG
A E
UDGA E1 Am
DG
A E
2
HP-9HP-7 HP-17HP-3HP 16-DHP-10HP-18
Fra
cti
on
of
Ac
tivit
y R
ec
ov
ere
d
Method Fraction
Figure 25. Bulk activity distribution of dissolved particles (in 7 M HNO3 ∙0.05 M HF∙ 0.05 M Al(NO3)3 sample loading matrix) using TEVA and DGA resins for chemical separations. TEVA E1 and DGA E1 Am correspond to the Pu and Am elution fractions, respectively. The values given for HP-9 were later revised (see text).
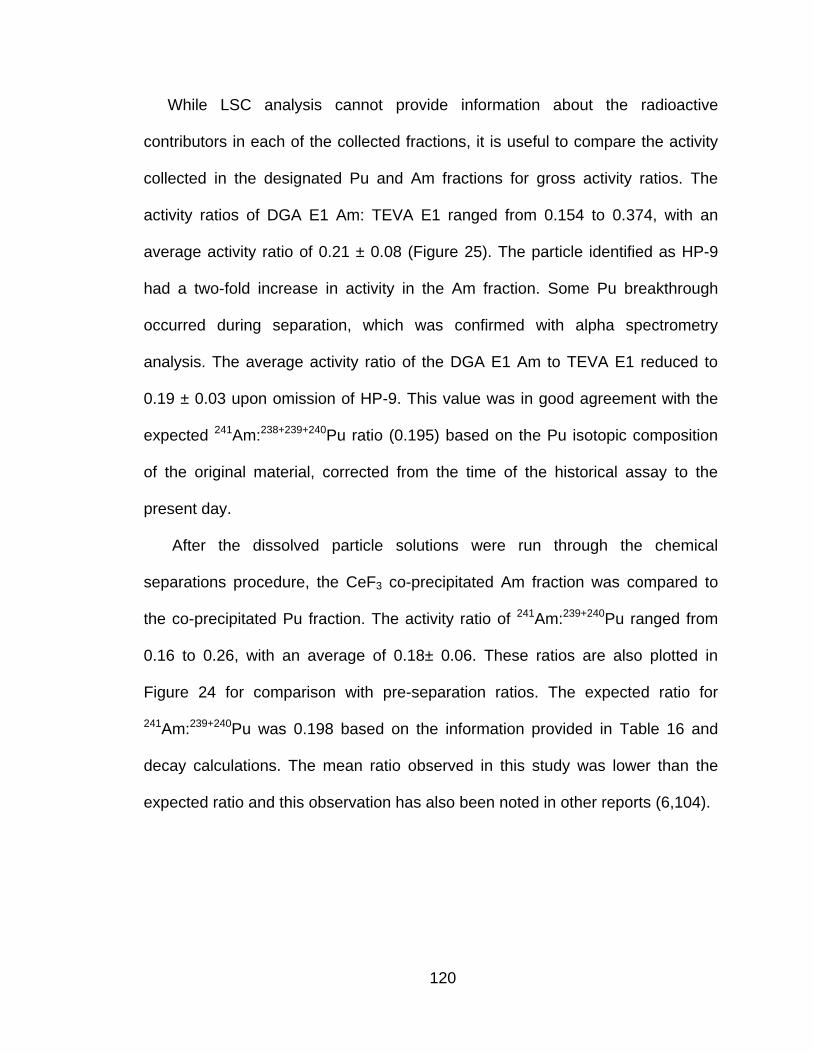
120
While LSC analysis cannot provide information about the radioactive
contributors in each of the collected fractions, it is useful to compare the activity
collected in the designated Pu and Am fractions for gross activity ratios. The
activity ratios of DGA E1 Am: TEVA E1 ranged from 0.154 to 0.374, with an
average activity ratio of 0.21 ± 0.08 (Figure 25). The particle identified as HP-9
had a two-fold increase in activity in the Am fraction. Some Pu breakthrough
occurred during separation, which was confirmed with alpha spectrometry
analysis. The average activity ratio of the DGA E1 Am to TEVA E1 reduced to
0.19 ± 0.03 upon omission of HP-9. This value was in good agreement with the
expected 241Am:238+239+240Pu ratio (0.195) based on the Pu isotopic composition
of the original material, corrected from the time of the historical assay to the
present day.
After the dissolved particle solutions were run through the chemical
separations procedure, the CeF3 co-precipitated Am fraction was compared to
the co-precipitated Pu fraction. The activity ratio of 241Am:239+240Pu ranged from
0.16 to 0.26, with an average of 0.18± 0.06. These ratios are also plotted in
Figure 24 for comparison with pre-separation ratios. The expected ratio for
241Am:239+240Pu was 0.198 based on the information provided in Table 16 and
decay calculations. The mean ratio observed in this study was lower than the
expected ratio and this observation has also been noted in other reports (6,104).
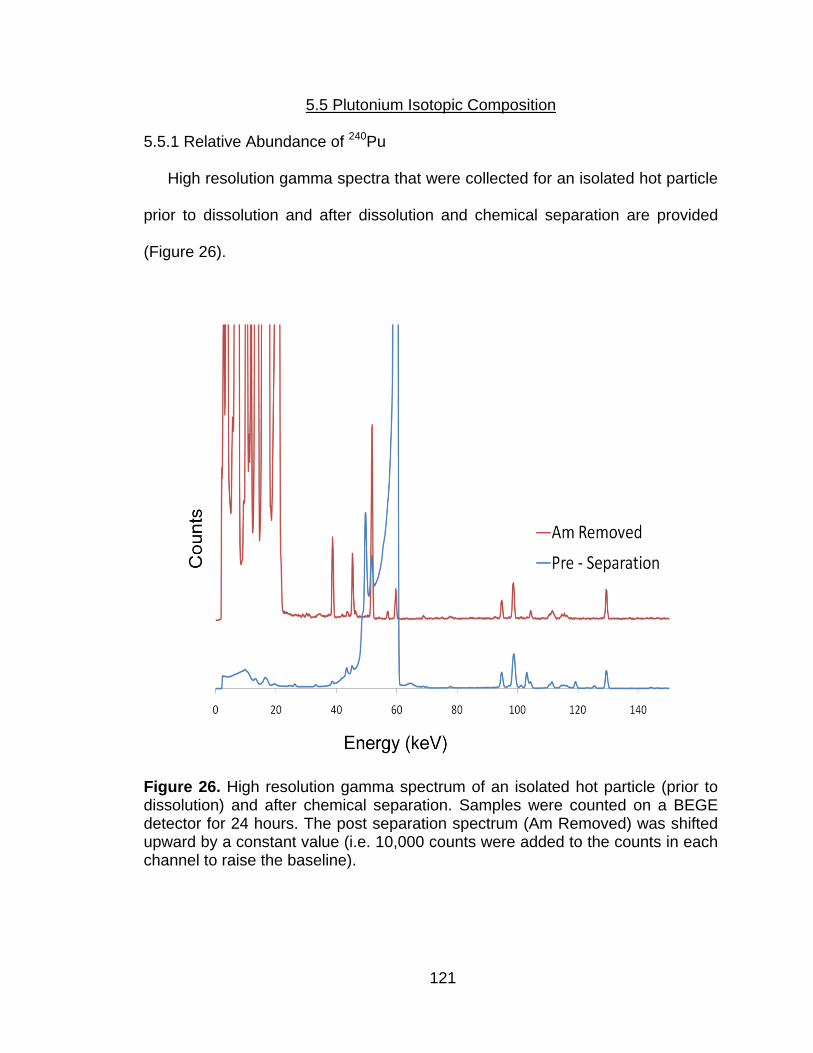
121
5.5 Plutonium Isotopic Composition
5.5.1 Relative Abundance of 240Pu
High resolution gamma spectra that were collected for an isolated hot particle
prior to dissolution and after dissolution and chemical separation are provided
(Figure 26).
Figure 26. High resolution gamma spectrum of an isolated hot particle (prior to dissolution) and after chemical separation. Samples were counted on a BEGE detector for 24 hours. The post separation spectrum (Am Removed) was shifted upward by a constant value (i.e. 10,000 counts were added to the counts in each channel to raise the baseline).
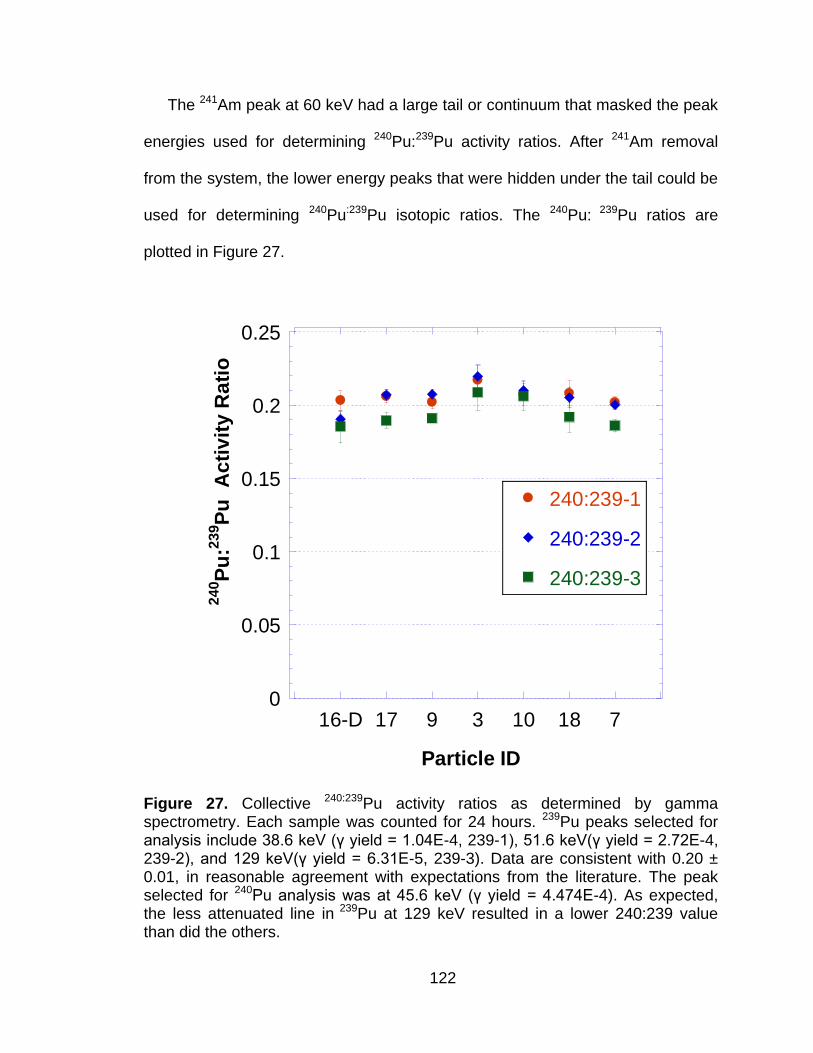
122
The 241Am peak at 60 keV had a large tail or continuum that masked the peak
energies used for determining 240Pu:239Pu activity ratios. After 241Am removal
from the system, the lower energy peaks that were hidden under the tail could be
used for determining 240Pu:239Pu isotopic ratios. The 240Pu: 239Pu ratios are
plotted in Figure 27.
0
0.05
0.1
0.15
0.2
0.25
16-D 17 9 3 10 18 7
240:239-1
240:239-2
240:239-3
24
0P
u:2
39P
u
Ac
tiv
ity
Ra
tio
Particle ID
Figure 27. Collective 240:239Pu activity ratios as determined by gamma spectrometry. Each sample was counted for 24 hours. 239Pu peaks selected for analysis include 38.6 keV (γ yield = 1.04E-4, 239-1), 51.6 keV(γ yield = 2.72E-4, 239-2), and 129 keV(γ yield = 6.31E-5, 239-3). Data are consistent with 0.20 ± 0.01, in reasonable agreement with expectations from the literature. The peak selected for 240Pu analysis was at 45.6 keV (γ yield = 4.474E-4). As expected, the less attenuated line in 239Pu at 129 keV resulted in a lower 240:239 value than did the others.
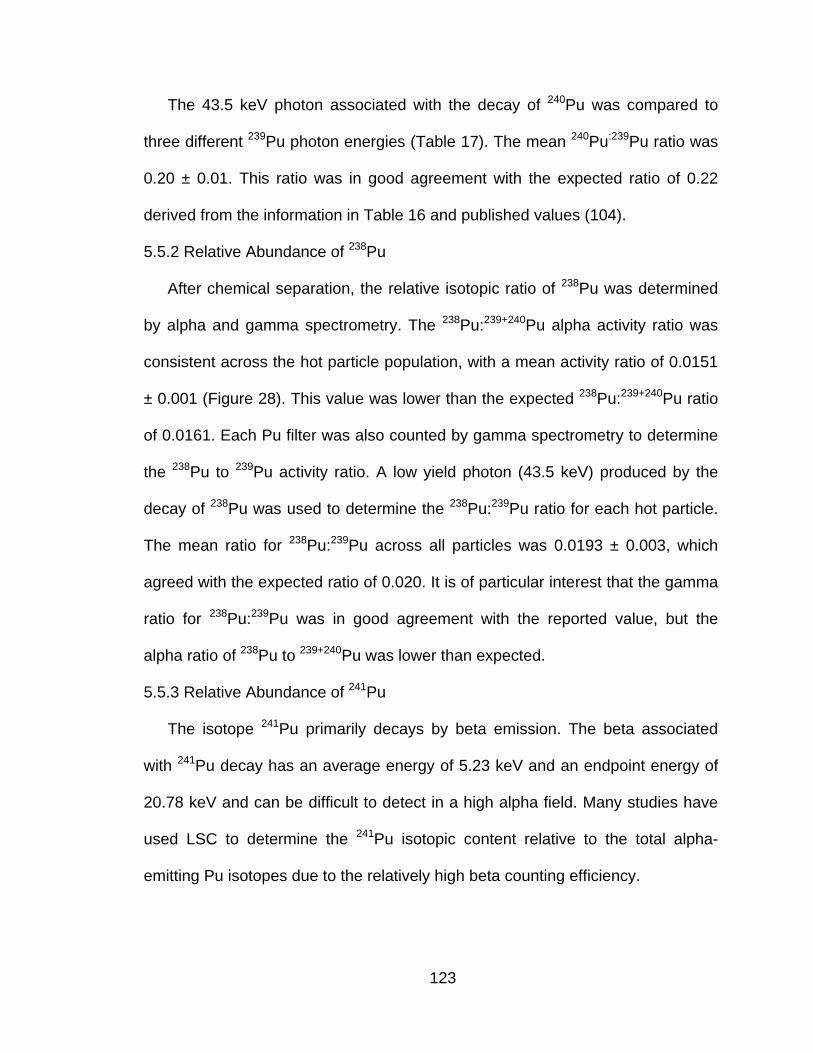
123
The 43.5 keV photon associated with the decay of 240Pu was compared to
three different 239Pu photon energies (Table 17). The mean 240Pu:239Pu ratio was
0.20 ± 0.01. This ratio was in good agreement with the expected ratio of 0.22
derived from the information in Table 16 and published values (104).
5.5.2 Relative Abundance of 238Pu
After chemical separation, the relative isotopic ratio of 238Pu was determined
by alpha and gamma spectrometry. The 238Pu:239+240Pu alpha activity ratio was
consistent across the hot particle population, with a mean activity ratio of 0.0151
± 0.001 (Figure 28). This value was lower than the expected 238Pu:239+240Pu ratio
of 0.0161. Each Pu filter was also counted by gamma spectrometry to determine
the 238Pu to 239Pu activity ratio. A low yield photon (43.5 keV) produced by the
decay of 238Pu was used to determine the 238Pu:239Pu ratio for each hot particle.
The mean ratio for 238Pu:239Pu across all particles was 0.0193 ± 0.003, which
agreed with the expected ratio of 0.020. It is of particular interest that the gamma
ratio for 238Pu:239Pu was in good agreement with the reported value, but the
alpha ratio of 238Pu to 239+240Pu was lower than expected.
5.5.3 Relative Abundance of 241Pu
The isotope 241Pu primarily decays by beta emission. The beta associated
with 241Pu decay has an average energy of 5.23 keV and an endpoint energy of
20.78 keV and can be difficult to detect in a high alpha field. Many studies have
used LSC to determine the 241Pu isotopic content relative to the total alpha-
emitting Pu isotopes due to the relatively high beta counting efficiency.

124
0
0.005
0.01
0.015
0.02
E1 E2 E3 E4 E5
HP-3HP-7HP-9HP-10HP-17HP-1816-D
Acti
vit
y R
ati
o
TEVA Sample ID
Figure 28. 238Pu to 239+240Pu activity ratios for the dissolved hot particle solutions after chemical separations. E1-E5 on the x-axis represent the 5 Pu elution fractions collected for n= 5 trials per dissolved hot particle. Error bars represent the counting error associated with each activity ratio at 1 ζ. Data are consistent with a value of 0.0151 ± .001, somewhat lower than the value of 0.0161 expected from a decay calculation of the data in the literature (Table 16).
In this study, energy discriminator settings were used to separate the low
energy region of the LSC spectrum from the high energy spectrum. The 241Pu
energy region (CPMA) was set between 0-50 keV and the alpha energy region
(CPMB) was set between 50-1000 keV. Average alpha decay energies are
between 4 and 6 MeV; however, all but approximately 1/10 of the energy is lost
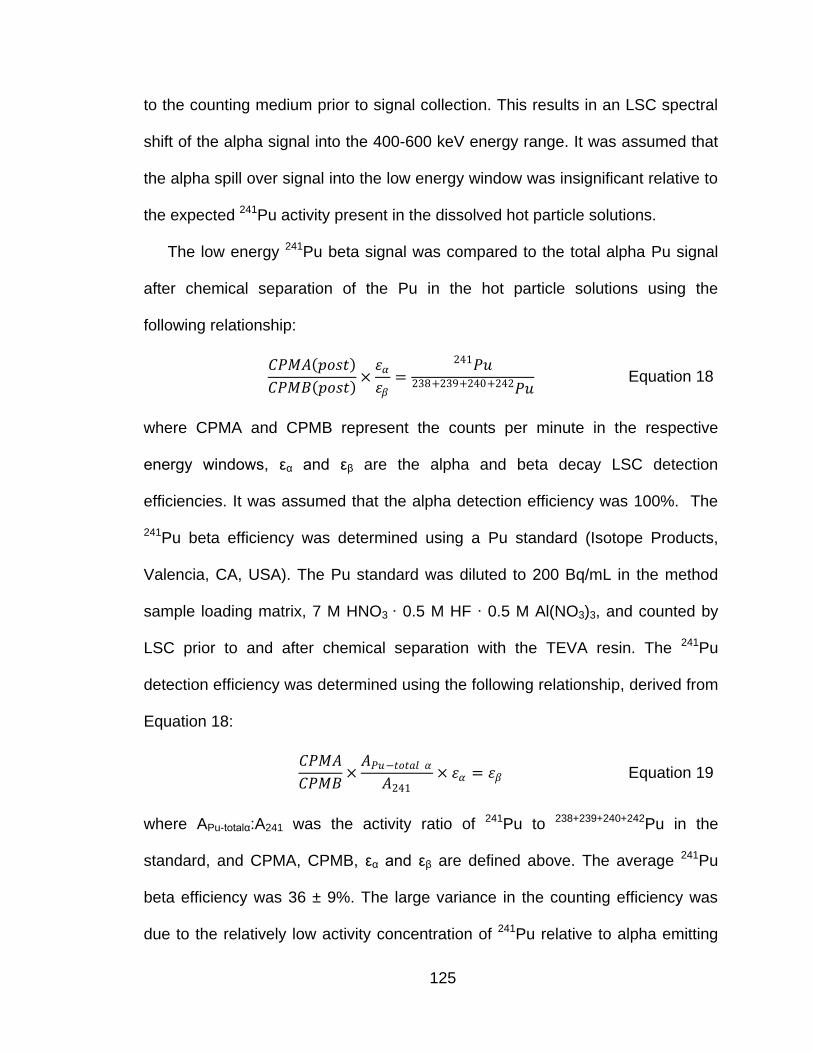
125
to the counting medium prior to signal collection. This results in an LSC spectral
shift of the alpha signal into the 400-600 keV energy range. It was assumed that
the alpha spill over signal into the low energy window was insignificant relative to
the expected 241Pu activity present in the dissolved hot particle solutions.
The low energy 241Pu beta signal was compared to the total alpha Pu signal
after chemical separation of the Pu in the hot particle solutions using the
following relationship:
𝐶𝑃𝑀𝐴 𝑝𝑜𝑠𝑡
𝐶𝑃𝑀𝐵 𝑝𝑜𝑠𝑡 ×
𝜀𝛼𝜀𝛽
=𝑃𝑢241
𝑃𝑢238+239+240+242 Equation 18
where CPMA and CPMB represent the counts per minute in the respective
energy windows, εα and εβ are the alpha and beta decay LSC detection
efficiencies. It was assumed that the alpha detection efficiency was 100%. The
241Pu beta efficiency was determined using a Pu standard (Isotope Products,
Valencia, CA, USA). The Pu standard was diluted to 200 Bq/mL in the method
sample loading matrix, 7 M HNO3 ∙ 0.5 M HF ∙ 0.5 M Al(NO3)3, and counted by
LSC prior to and after chemical separation with the TEVA resin. The 241Pu
detection efficiency was determined using the following relationship, derived from
Equation 18:
𝐶𝑃𝑀𝐴
𝐶𝑃𝑀𝐵×
𝐴𝑃𝑢−𝑡𝑜𝑡𝑎𝑙 𝛼
𝐴241× 𝜀𝛼 = 𝜀𝛽 Equation 19
where APu-totalα:A241 was the activity ratio of 241Pu to 238+239+240+242Pu in the
standard, and CPMA, CPMB, εα and εβ are defined above. The average 241Pu
beta efficiency was 36 ± 9%. The large variance in the counting efficiency was
due to the relatively low activity concentration of 241Pu relative to alpha emitting
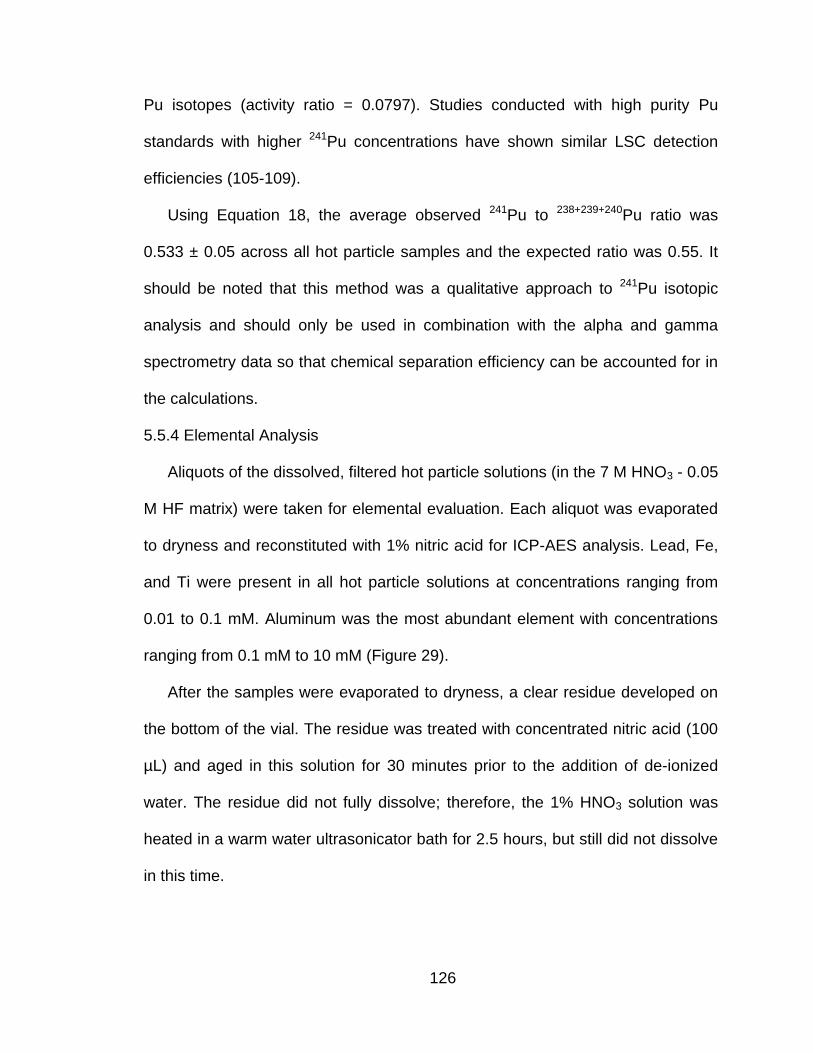
126
Pu isotopes (activity ratio = 0.0797). Studies conducted with high purity Pu
standards with higher 241Pu concentrations have shown similar LSC detection
efficiencies (105-109).
Using Equation 18, the average observed 241Pu to 238+239+240Pu ratio was
0.533 ± 0.05 across all hot particle samples and the expected ratio was 0.55. It
should be noted that this method was a qualitative approach to 241Pu isotopic
analysis and should only be used in combination with the alpha and gamma
spectrometry data so that chemical separation efficiency can be accounted for in
the calculations.
5.5.4 Elemental Analysis
Aliquots of the dissolved, filtered hot particle solutions (in the 7 M HNO3 - 0.05
M HF matrix) were taken for elemental evaluation. Each aliquot was evaporated
to dryness and reconstituted with 1% nitric acid for ICP-AES analysis. Lead, Fe,
and Ti were present in all hot particle solutions at concentrations ranging from
0.01 to 0.1 mM. Aluminum was the most abundant element with concentrations
ranging from 0.1 mM to 10 mM (Figure 29).
After the samples were evaporated to dryness, a clear residue developed on
the bottom of the vial. The residue was treated with concentrated nitric acid (100
µL) and aged in this solution for 30 minutes prior to the addition of de-ionized
water. The residue did not fully dissolve; therefore, the 1% HNO3 solution was
heated in a warm water ultrasonicator bath for 2.5 hours, but still did not dissolve
in this time.
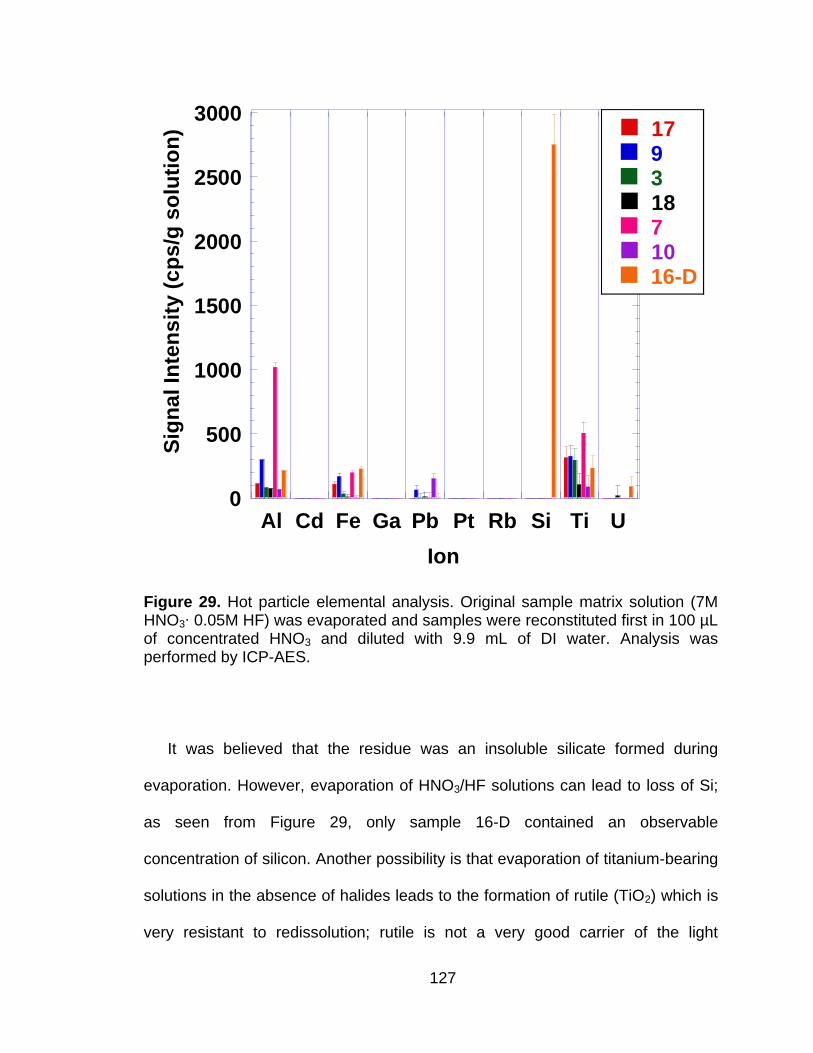
127
0
500
1000
1500
2000
2500
3000
Al Cd Fe Ga Pb Pt Rb Si Ti U
17931871016-D
Sig
na
l In
ten
sit
y (
cp
s/g
so
luti
on
)
Ion
Figure 29. Hot particle elemental analysis. Original sample matrix solution (7M HNO3∙ 0.05M HF) was evaporated and samples were reconstituted first in 100 µL of concentrated HNO3 and diluted with 9.9 mL of DI water. Analysis was performed by ICP-AES.
It was believed that the residue was an insoluble silicate formed during
evaporation. However, evaporation of HNO3/HF solutions can lead to loss of Si;
as seen from Figure 29, only sample 16-D contained an observable
concentration of silicon. Another possibility is that evaporation of titanium-bearing
solutions in the absence of halides leads to the formation of rutile (TiO2) which is
very resistant to redissolution; rutile is not a very good carrier of the light
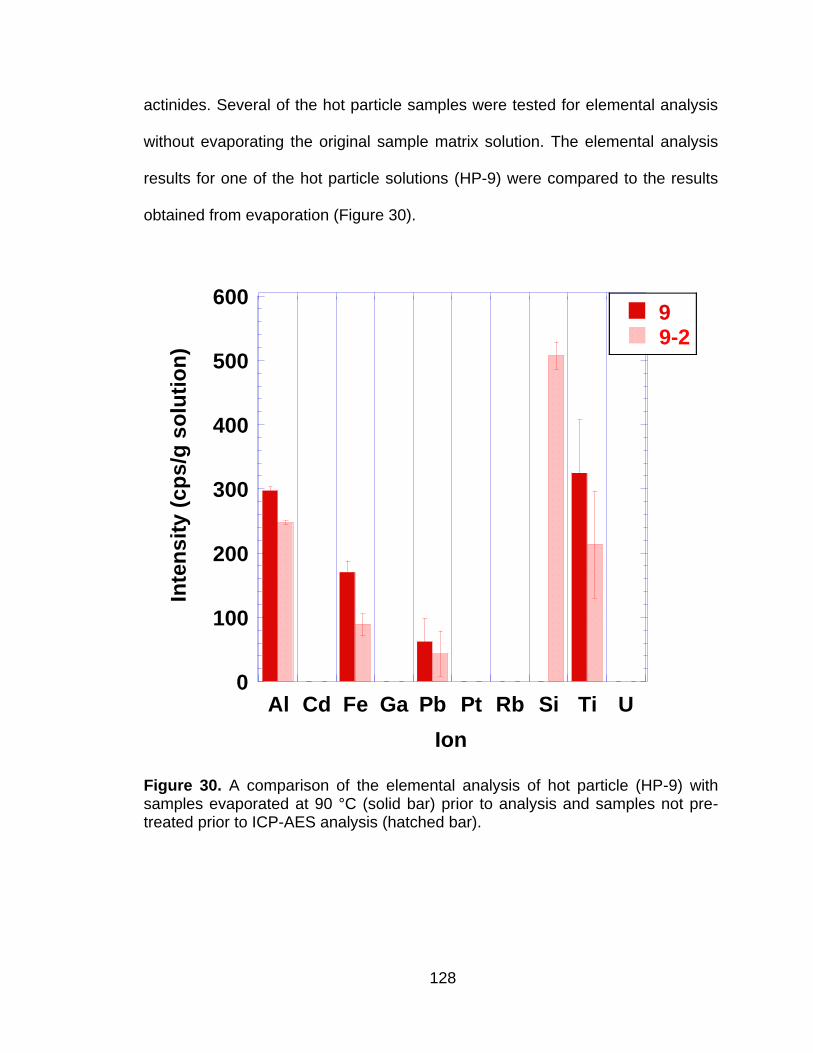
128
actinides. Several of the hot particle samples were tested for elemental analysis
without evaporating the original sample matrix solution. The elemental analysis
results for one of the hot particle solutions (HP-9) were compared to the results
obtained from evaporation (Figure 30).
0
100
200
300
400
500
600
Al Cd Fe Ga Pb Pt Rb Si Ti U
99-2
Inte
ns
ity
(c
ps
/g s
olu
tio
n)
Ion
Figure 30. A comparison of the elemental analysis of hot particle (HP-9) with samples evaporated at 90 °C (solid bar) prior to analysis and samples not pre-treated prior to ICP-AES analysis (hatched bar).
129
Aluminum, Si and Fe were the elements most affected by sample evaporation
pre-treatment when compared to no pre-treatment. Silicon was present in
samples that did not undergo evaporation, but not detectable in the samples that
were evaporated. This supports the assumption that the insoluble residue that
was observed after evaporation was most likely silicate based, but could also
contain rutile. Iron and Al concentrations were higher in the evaporated samples.
5.6 Concluding Remarks
High-fired WGPu particles that have been in the environment for the last 4
decades were characterized by both non-destructive and dissolution techniques.
The non-destructive imaging and soil profile characterization studies showed that
the Am was heterogeneously dispersed in the soil and that morphology and
surface composition were unique for each hot particle (6). Dissolution studies
showed that the elemental matrix of each hot particle was unique, but that
several key elements were present throughout the particle population.
Preferential Am leaching from the particle matrix was supported by the
dissolution data, but cannot be confirmed under the confines of this work. Further
investigations will be required to determine how particle chemistry in terms of
size, source term and microchemistry govern actinide speciation.
From a forensic perspective, the method used in this work was sufficient for
separating Pu from other particle matrix constituents for determining relative
isotopic ratios. The isotopic abundance for 238Pu, 240Pu and 241Pu relative to
239Pu obtained from LSC and gamma analysis experimentally placed the material
130
production date between 51 and 54 years ago (assuming the relative Pu isotopic
abundance information in Table 16 is accurate). Alpha spectrometry analysis
placed the production date at 60 years ago. The discrepancy in the relative
abundance of 238Pu from alpha and gamma analysis is of particular interest and
has also been observed in previous work (104) which attributed the difference to
a satellite accident that occurred in 1964. In this work, hot particles were isolated
from the surrounding soil prior to dissolution; therefore, atmospheric fallout was
not expected to influence the particle composition. Alpha spectrometry and LSC
analysis should provide more accurate isotopic abundance values based on
higher radiative yield and detection efficiency compared to gamma spectrometry.
If it is assumed that the 238Pu:239+240Pu ratio determined by alpha analysis is
accurate, it is possible that the original 238Pu abundance was lower than what is
reported in Table 16. From historical documents relating to the production of
WGPu (110) around the estimated time of production (52 years), the amount of
238Pu in the production stream varied. If the data presented in Table 16 is from
stream analysis, which was based on the isotopic content of the Pu coming out of
the plant around the time of part manufacture and the weight of the part, and not
from a direct assay of the material recovered from the accident site, then the
isotopic abundance of the material may have a higher degree of uncertainty.
Future work will need to focus on the minor actinide constituents. High
resolution gamma spectrometry analysis of hot particles prior to dissolution
showed that the 235U and 238U content varied across the population of particles
that were isolated from the soil (6). In the current work, a designated U fraction
131
was collected from the DGA resin. At this time, U isotopic analysis has not been
performed on the U fraction. The U isotopic content of the particle includes 234U,
235U, 236U, 237U (in equilibrium with 241Pu decay) and 238U and the relative ratios
of each could provide further insight into the source term of the particles.
132
CHAPTER 6
PLUTONIUM ISOTOPIC STANDARD DEVELOPMENT FOR GAMMA, ALPHA
AND MASS SPECTROMETRY
6.1 Abstract
After chemical separation and radionuclide purification, Pu samples are
usually divided and prepared separately for mass and radiometric analysis. This
work focuses on a singular sample preparation method for determining the
isotopic abundance of Pu in a NIST-traceable 239Pu standard with a 98% mass
purity. Cerium fluoride (CeF3) co-precipitation was chosen as the sample
preparation technique based on quick preparation time, high actinide recovery,
and good energy resolution for alpha spectrometry analysis. Precipitated
samples were prepared from the standard Pu stock solution with activity
concentrations ranging from 0 to 2400 Bq (0 - 1000 ng 239Pu). Samples were
analyzed by alpha and gamma spectrometry for radiometric determination of
isotopic abundance. Inductively coupled plasma mass spectrometry (ICP-MS)
coupled to a laser ablation sample introduction unit was used for mass analysis.
Results indicated that CeF3 sample preparation is well suited for all three types of
analysis techniques. The 238Pu to 239/240Pu ratios determined by alpha and
gamma spectrometry were higher than the reported values, indicating that the
trace 238Pu concentration in the standard solution was inaccurate. Mass analysis
of 238Pu was not possible for these samples due to low relative abundance and
the presence of a high background signal in the 238 mass region, which was
suspected to be a result of 238U contamination in the acid used for initial sample
133
preparation. The 240Pu to 239Pu isotopic ratio was consistent for all three
techniques. The isotopic abundance of 241Pu and 242Pu were insufficient for mass
analysis and alpha energy resolution was not adequate for resolving 242Pu from
239+240Pu. These preliminary data are presented as a proof-of-concept. The end
goal is to develop a rapid, reliable and reproducible method for sample analysis
that can be fitted onto a radioanalytical platform for automated analysis that can
exploit gamma, alpha, or mass spectroscopy.
6.2 Introduction
The focus of this work up to now has been to characterize the performance of
chemical separations of actinides with the intent of developing rapid, reliable
methods that are amenable to platform automation. After separation and
purification, each sample and many side samples were analyzed in terms of
separation efficiency, isotopic identification and total activity. It would be useful to
have one preparation method to produce samples that can be used for multiple
analysis techniques. Many studies have combined radiometric and mass-based
analysis methods for determining isotopic information on samples containing low
concentrations of both long- and short-lived actinides, i.e. global fallout, source
term and age determination of Pu, and U in the environment (13,111-117). In
most of these studies, sample preparation for alpha spectrometry and mass
spectrometry has remained separate. Chemical separation procedures have
been streamlined so that the resulting actinide elution fractions are suitable for
both types of sample preparation methods (118), reducing the total analysis time.
134
Aqueous samples are prepared for mass analysis and small aliquots of the
sample solution are typically electrodeposited on steel planchets for alpha
analysis. Recent studies have explored the use of mass spectrometry on the
leachate from electrodeposited Pu and U alpha sources (115,119). In these
studies, one sample was produced for multiple analysis techniques; however,
after alpha counting, the deposited source was converted to an aqueous source
for mass analysis.
Several other actinide studies have been conducted with laser ablation
inductively coupled mass spectrometry (LA-ICP-MS) on solid surfaces, such as
accelerator target material, metal oxides, ceramics and soil particulates
(120,121). The clear advantage of LA-ICP-MS analysis is that only a small
portion of sample is consumed, while the rest of the sample remains intact, and
can be preserved for future analyses. The limitations of LA-ICP-MS analysis are
that the results are semi-qualitative, difficult to interpret for materials of unknown
origin, and require isotope concentrations in sufficient concentration be evaluated
by mass spectroscopy LA-ICP-MS has been successfully coupled with isotope
dilution techniques to provide more quantitative results for environmental soil
sample characterization (111,120). While direct mass analysis of solids is
advantageous for many sample matrices, it is not adequate for isotopic
identification in complex actinide samples that contain isobaric interferences.
These samples still require sample dissolution and chemical separation for
accurate isotopic identification and quantification. Few studies have focused on
direct mass analysis from a prepared alpha sample. One recently published
135
study (122) characterized electroplated samples containing 239,240,241Pu isotopes
using high resolution ICP-MS with laser ablation sample introduction. This study
isolated Pu from other radionuclides using acid leaching, extraction
chromatography and electrodeposition prior to ICP-MS analysis. In their study,
the authors looked at samples containing very dilute concentrations or activity
levels of Pu that were chemically isolated prior to analysis.
In our previous work, WGPu hot particles were dissolved in a HNO3/HF acid
solution, and the Pu was chemically separated from other matrix constituents
using TEVA and DGA extraction chromatography resins. Each sequential elution
fraction was collected and prepared for analysis using a CeF3 co-precipitation
method (29). This method was chosen based on short preparation time (12
samples/hr), good energy resolution for alpha analysis (~32 keV), and high
actinide recovery as scavenged by the precipitate. Additionally, the filters could
be used for mass analysis with the LA-ICP-MS system to confirm the relative
isotopic ratios determined from gamma and alpha analysis. The initial focus of
this work was to develop CeF3 co-precipitated 239Pu calibration standards for
optimizing gamma and alpha spectrometry measurements. From an analysis
perspective, sample matrix, analyte concentration and geometry should be
mimicked in the calibration standards.
The aqueous Pu standard used for these experiments contained minor Pu
isotopes in concentrations similar to those found in WGPu and, therefore,
isotopic analysis could be performed with the calibrations standards produced in-
house. This preliminary work demonstrates the utility of CeF3 precipitation as a
136
single source sample preparation method for both radiometric and mass-based
Pu isotopic analyses.
6.3 Materials and Methods
6.3.1 Reagents
Nitric acid solutions were prepared from reagent grade acid (ACS reagent
grade, Merck KGaA, Darmstadt, Germany) and de-ionized water (18 MΩ∙cm,
Millipore, Billerica, MA, USA). Plutonium was selectively removed from decay
products using TEVA extraction chromatographic resin obtained from Eichrom
Technologies, Inc. (Darien, IL, USA) in 2 mL pre-packed polypropylene
cartridges. TEVA resin (50-100 µm) contains an aliphatic quaternary amine as
the extractant compound for the stationary phase and is primarily used for
isolating and separating tetra-valent actinides from tri- and hexa-valent actinides
and fission products (34).
6.3.2 Radionuclide Standard
Plutonium stock solutions were prepared from a NIST-traceable 239Pu
standard solution (Isotope Products, Valencia, CA, USA) in 3 M HNO3. The total
activity of the stock solution was determined by LSC (Tri-carb 3100, Perkin
Elmer, Boston, MA, USA) with 10 mL of Ultima Gold AB cocktail (Perkin Elmer,
USA) as the counting medium. The LSC samples were counted for 60 minutes or
until the counting error reached 2S% (2% of the 2ζ standard deviation of the total
counts) in the CPMC energy window (0-2000 keV). The 2S% is a standard
protocol option that serves as a normalization parameter for the comparison of
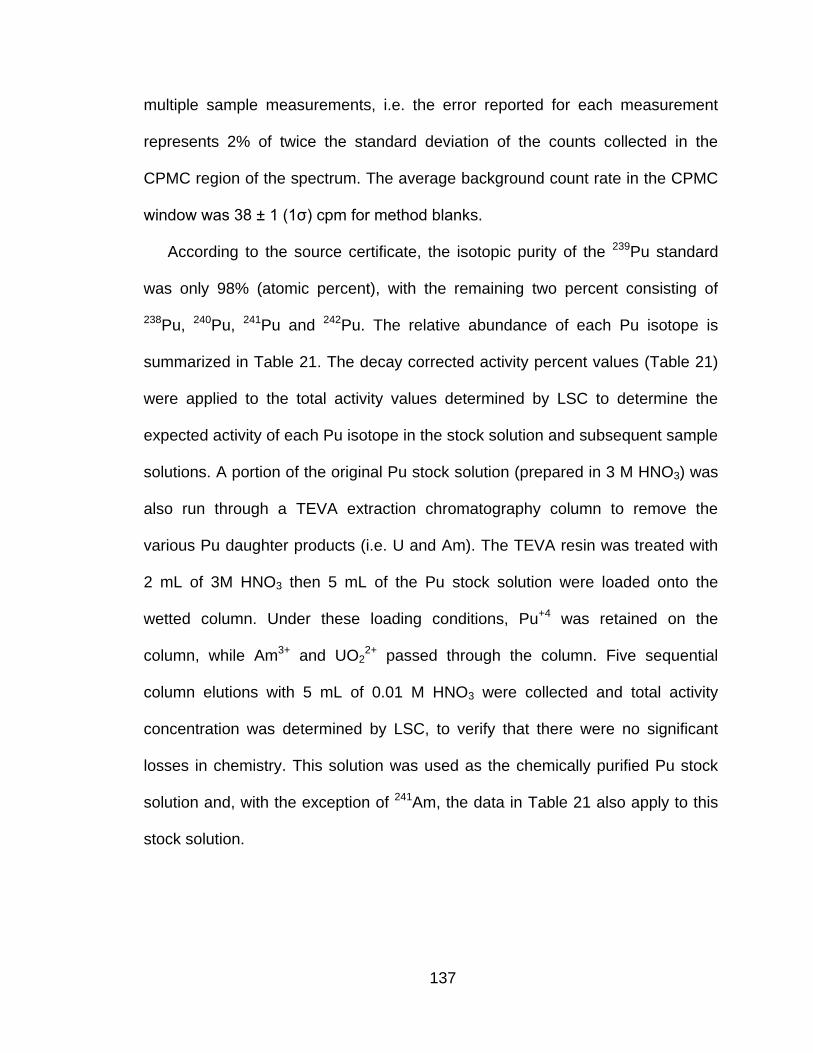
137
multiple sample measurements, i.e. the error reported for each measurement
represents 2% of twice the standard deviation of the counts collected in the
CPMC region of the spectrum. The average background count rate in the CPMC
window was 38 ± 1 (1ζ) cpm for method blanks.
According to the source certificate, the isotopic purity of the 239Pu standard
was only 98% (atomic percent), with the remaining two percent consisting of
238Pu, 240Pu, 241Pu and 242Pu. The relative abundance of each Pu isotope is
summarized in Table 21. The decay corrected activity percent values (Table 21)
were applied to the total activity values determined by LSC to determine the
expected activity of each Pu isotope in the stock solution and subsequent sample
solutions. A portion of the original Pu stock solution (prepared in 3 M HNO3) was
also run through a TEVA extraction chromatography column to remove the
various Pu daughter products (i.e. U and Am). The TEVA resin was treated with
2 mL of 3M HNO3 then 5 mL of the Pu stock solution were loaded onto the
wetted column. Under these loading conditions, Pu+4 was retained on the
column, while Am3+ and UO22+ passed through the column. Five sequential
column elutions with 5 mL of 0.01 M HNO3 were collected and total activity
concentration was determined by LSC, to verify that there were no significant
losses in chemistry. This solution was used as the chemically purified Pu stock
solution and, with the exception of 241Am, the data in Table 21 also apply to this
stock solution.
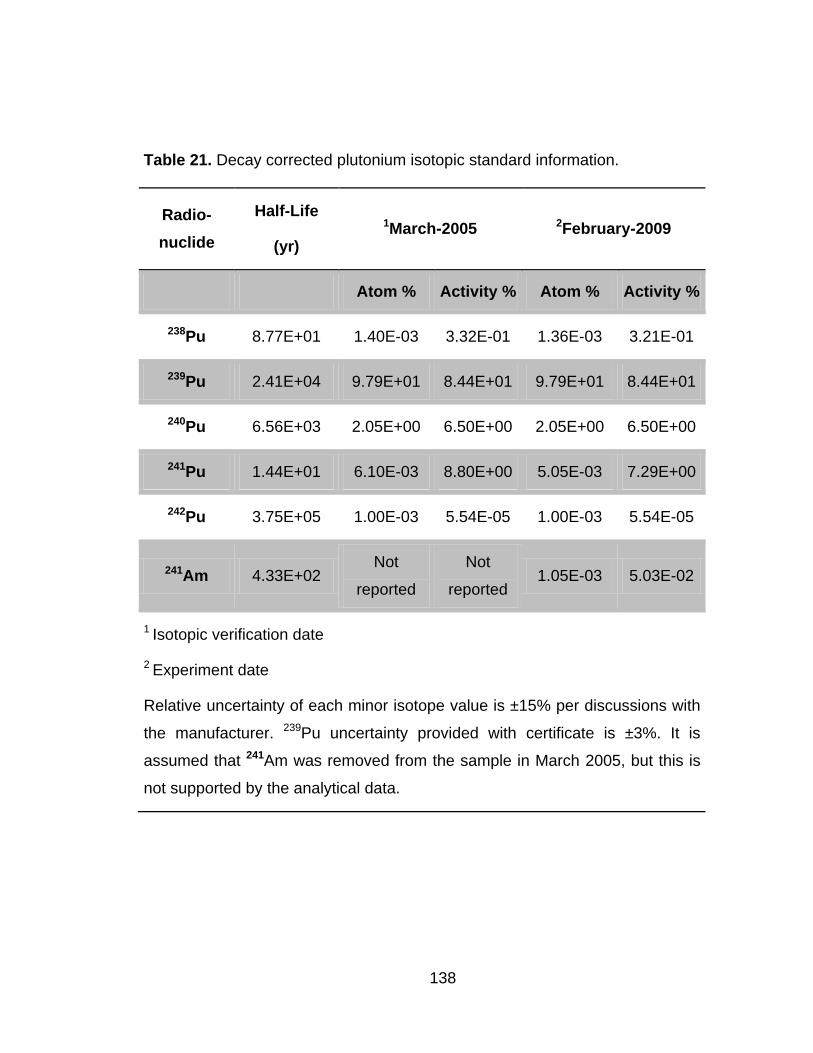
138
Table 21. Decay corrected plutonium isotopic standard information.
Radio-
nuclide
Half-Life
(yr)
1March-2005 2February-2009
Atom % Activity % Atom % Activity %
238Pu 8.77E+01 1.40E-03 3.32E-01 1.36E-03 3.21E-01
239Pu 2.41E+04 9.79E+01 8.44E+01 9.79E+01 8.44E+01
240Pu 6.56E+03 2.05E+00 6.50E+00 2.05E+00 6.50E+00
241Pu 1.44E+01 6.10E-03 8.80E+00 5.05E-03 7.29E+00
242Pu 3.75E+05 1.00E-03 5.54E-05 1.00E-03 5.54E-05
241Am 4.33E+02 Not
reported
Not
reported 1.05E-03 5.03E-02
1 Isotopic verification date
2 Experiment date
Relative uncertainty of each minor isotope value is ±15% per discussions with
the manufacturer. 239Pu uncertainty provided with certificate is ±3%. It is
assumed that 241Am was removed from the sample in March 2005, but this is
not supported by the analytical data.
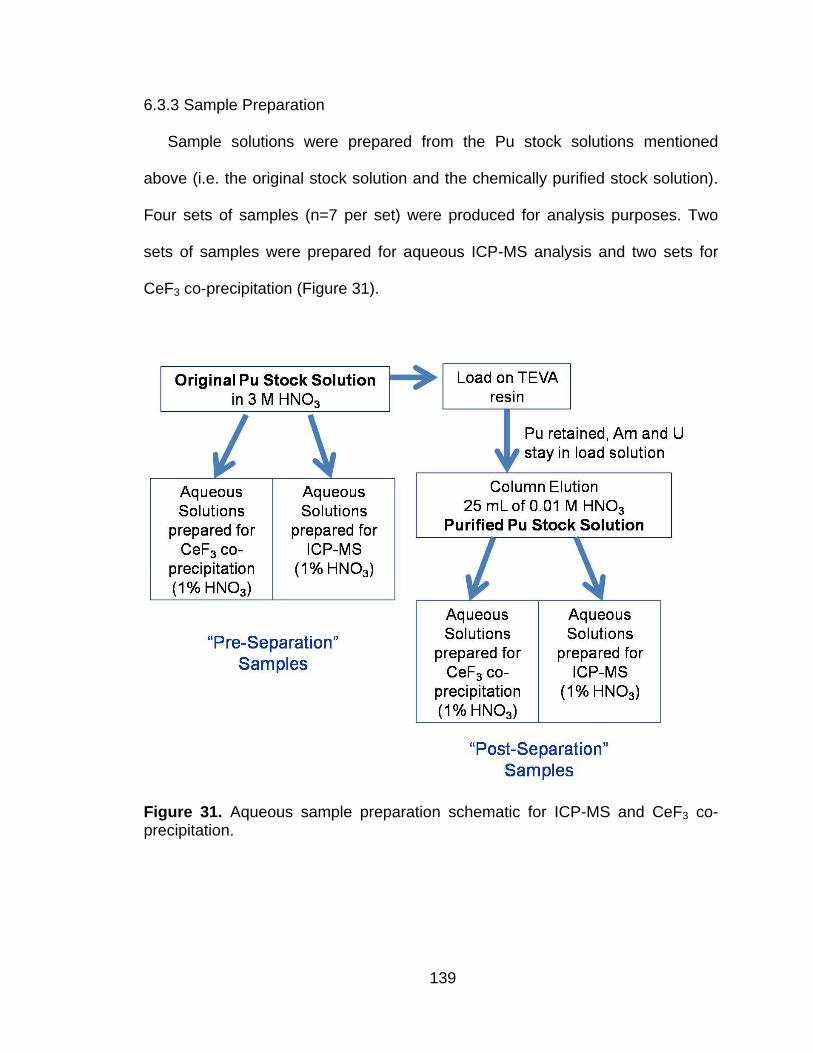
139
6.3.3 Sample Preparation
Sample solutions were prepared from the Pu stock solutions mentioned
above (i.e. the original stock solution and the chemically purified stock solution).
Four sets of samples (n=7 per set) were produced for analysis purposes. Two
sets of samples were prepared for aqueous ICP-MS analysis and two sets for
CeF3 co-precipitation (Figure 31).
Figure 31. Aqueous sample preparation schematic for ICP-MS and CeF3 co-precipitation.
140
Aliquots of the respective Pu stock solutions were taken gravimetrically and
diluted with 1% HNO3 to a normalized solution mass of 10 g for aqueous ICP-MS
analysis and 5 g for co-precipitation. The 239Pu mass equivalence and activity
concentration of each sample in a set of 7 is provided in (Table 22).
Table 22. Total activity and mass values based on 239Pu for each sample solution within a set of 7. Four sets of aqueous solutions were prepared, 2 for CeF3 and 2 for ICP-MS.
Sample ID 239Pu Activity (Bq)1 Mass (ng of 239Pu)2
Method Blank 0 0
1 12 5
2 23 10
3 114 50
4 239 100
5 577 250
6 1168 500
7 2316 1000
1 Activity per sample prior to co-precipitation.
2 Total Pu mass in solution. For ICP-MS analysis solutions ranged from 0.5 to
100 ppb (ng 239Pu per g solution, total solution volume = 10 mL)

141
The net activity in each sample solution (for both ICP-MS and CeF3 samples)
was determined using the following equation:
𝐴𝑃𝑢 𝑠𝑡𝑜𝑐𝑘 𝑠𝑜𝑙𝑛
𝑔 𝑠𝑡𝑜𝑐𝑘 𝑠𝑜𝑙𝑢𝑡𝑖𝑜𝑛× 𝑚𝑎𝑙𝑖𝑞𝑢𝑜𝑡 = 𝐴𝑛𝑒𝑡
Equation20
where A is the activity of the Pu stock solution, in Bq/g, determined by LSC and
maliquot is the mass of the stock solution used in each sample.
6.3.4 Cerium Fluoride Co-Precipitation
A Ce carrier aliquot was added to each of the sample solutions from which
precipitates were prepared, followed by an excess of concentrated HF to force
precipitate formation. The samples were allowed to sit for 30 minutes and were
then filtered through a Resolve filter (polypropylene, 0.1 µm pore size, 25 mm
diameter, Eichrom Technologies, Inc.). The precipitate was collected on the filter,
rinsed with DI water and treated with ethanol for faster drying. Each filter was
placed in a protective plastic sample holder and allowed to air dry for
approximately 20 minutes before sealing.
A more detailed explanation of the CeF3 precipitation procedure is available
from the filter manufacturer (29). Residual activity in the supernate was assessed
to determine co-precipitation efficiency. The supernate for each sample was
evaporated to dryness in a 70°C drying oven and reconstituted in 1 mL of 1%
HNO3. The reconstituted solution was placed in a 20 mL plastic vial with 10 mL of
Ultima Gold AB cocktail and counted by LSC as described earlier.
142
6.3.5 Analysis by ICP-MS
6.3.5.1 Aqueous Analysis
Inductively coupled plasma mass spectrometry (ICP-MS) was performed with
an ELAN DRC II ICP-MS system (Perkin Elmer, Inc., Shelton, CT, USA) and the
ELAN Version 2.4 software provided by the manufacturer. Peak acquisition mode
settings included a dwell time of 50 msec, with 15 sweeps per reading, 1 reading
per replicate and three replicates per sample. The operation parameters were
optimized by the manufacturer upon installation with the radio-frequency power
set at 1100 Watts, the plasma gas flow at 15 L/min, the nebulizer gas flow at 0.90
L/min, the argon auxiliary gas flow at 1.2 L/min and the sample uptake rate of 1
mL/min. Prior to analysis, standard instrument optimization procedures provided
by the manufacturer were followed.
Aqueous samples were placed in an autosampler (Perkin Elmer, Inc.) with a
method blank (1%HNO3) between each pair of samples. Pre- and post-
separation samples were analyzed during the same analysis session with ten
method blanks processed between the two sample sets. The analyte was ionized
by introducing the sample as an aerosol into the ion source of the instrument.
The ionic charges of species analyzed by the mass spectrometer were z=1. Raw
signal intensity (ions per second) was collected for the mass to charge (m/z)
ratios presented in Table 23. Integrating over the collection period resulted in a
spectrum in m/z. Note that the resolution of the spectrometer (1 atomic mass
unit, amu) was not sufficient to separate peaks due to isobars (e.g. 238Pu at
238.049 and 238U at 238.051) but little isobaric interference was expected due to
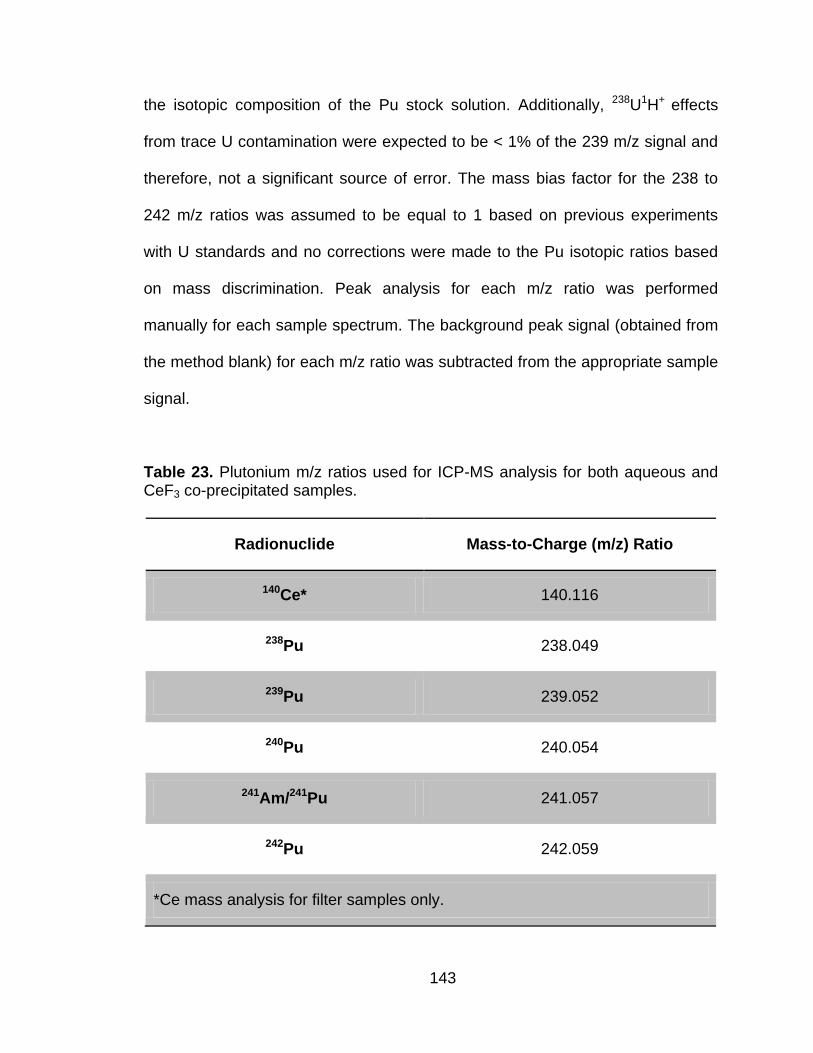
143
the isotopic composition of the Pu stock solution. Additionally, 238U1H+ effects
from trace U contamination were expected to be < 1% of the 239 m/z signal and
therefore, not a significant source of error. The mass bias factor for the 238 to
242 m/z ratios was assumed to be equal to 1 based on previous experiments
with U standards and no corrections were made to the Pu isotopic ratios based
on mass discrimination. Peak analysis for each m/z ratio was performed
manually for each sample spectrum. The background peak signal (obtained from
the method blank) for each m/z ratio was subtracted from the appropriate sample
signal.
Table 23. Plutonium m/z ratios used for ICP-MS analysis for both aqueous and CeF3 co-precipitated samples.
Radionuclide Mass-to-Charge (m/z) Ratio
140Ce* 140.116
238Pu 238.049
239Pu 239.052
240Pu 240.054
241Am/241Pu 241.057
242Pu 242.059
*Ce mass analysis for filter samples only.

144
A mass spectrometric measurement results in a set of isotope ratios; to
convert these ratios into an absolute number of analyte atoms, a reference
concentration must be supplied. The LSC data was utilized for this purpose.
Expected mass values for each sample were calculated using the following
formulas:
𝐶𝑃𝑀𝐶 − 𝐶𝑃𝑀𝐶𝐵𝐺
𝑚𝑎𝑙𝑖𝑞𝑢𝑜𝑡 =
𝐴𝑛𝑒𝑡
𝑔 𝑠𝑜𝑙𝑛 Equation 21
where CPMC and CPMCBG were the counts per minute collected in the CPMC
energy window (LSC analysis) for the stock solution and background, maliquot was
the mass of the Pu stock solution used for activity verification and Anet/g soln was
the net activity per gram of the stock solution; and
𝐴𝑛𝑒𝑡
𝑔𝑠𝑜𝑙𝑛×
𝑚𝑎 ,2
𝑚𝐼𝐶𝑃−𝑀𝑆=
𝐴𝑡𝑜𝑡𝑎𝑙
𝑔 𝑠𝑜𝑙𝑛𝐼𝐶𝑃−𝑀𝑆 Equation 22
where ma,2 was the aliquot mass of the stock solution used to make the aqueous
ICP-MS solution, mICP-MS was the mass of the ICP-MS solution (sum of 1% HNO3
aliquot and stock solution aliquot) and Atotal/g solnICP-MS was the total activity per
gram of the ICP-MS sample solution. Units of radioactivity were then converted
to units of mass:
𝐴𝑡𝑜𝑡𝑎𝑙
𝑔 𝑠𝑜𝑙𝑛𝐼𝐶𝑃−𝑀𝑆 ×
𝑃𝑢 𝐴𝑐𝑡𝑖𝑣𝑖𝑡𝑦%
100×
𝑀𝑊𝑃𝑢
𝜆𝑃𝑢× 𝐶𝐹 =
𝑛𝑔 𝑃𝑋 𝑢
𝑔 𝑠𝑜𝑙𝑛𝐼𝐶𝑃−𝑀𝑆 Equation 23
where Pu Activity% was the percent activity of the Pu isotope compared with the
activity of the solution as a whole (Table 1), MW was the molecular weight of the
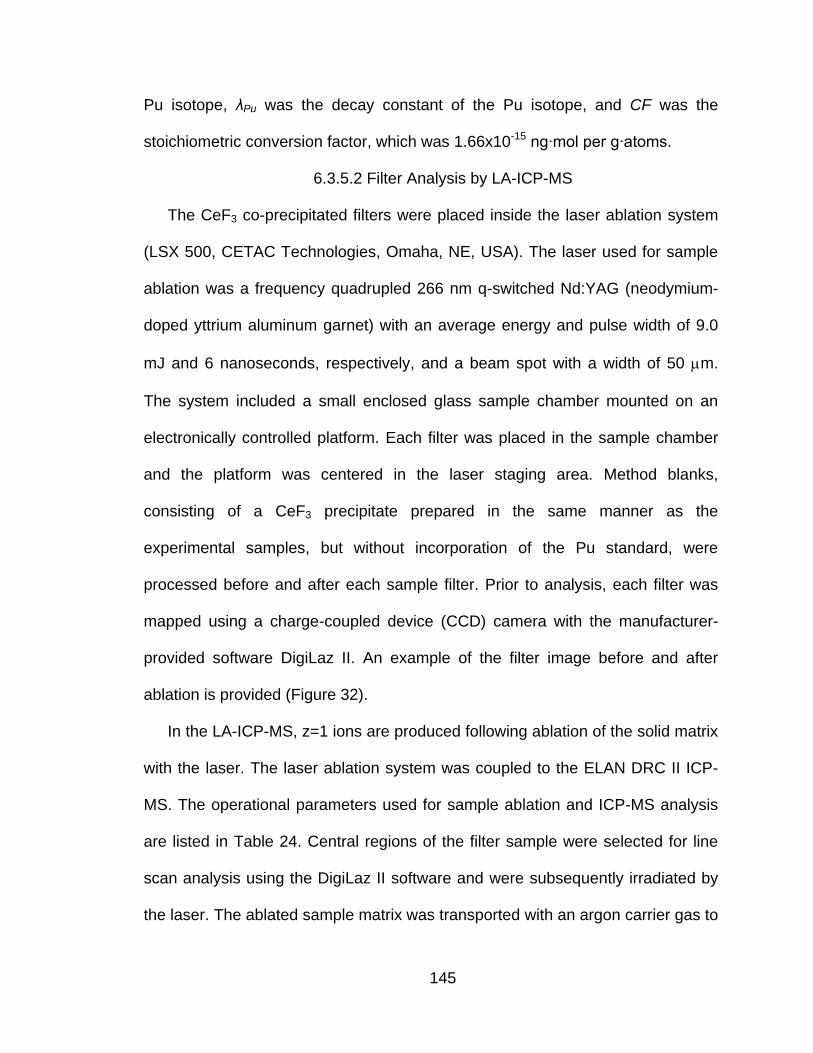
145
Pu isotope, λPu was the decay constant of the Pu isotope, and CF was the
stoichiometric conversion factor, which was 1.66x10⁻¹⁵ ng∙mol per g∙atoms.
6.3.5.2 Filter Analysis by LA-ICP-MS
The CeF3 co-precipitated filters were placed inside the laser ablation system
(LSX 500, CETAC Technologies, Omaha, NE, USA). The laser used for sample
ablation was a frequency quadrupled 266 nm q-switched Nd:YAG (neodymium-
doped yttrium aluminum garnet) with an average energy and pulse width of 9.0
mJ and 6 nanoseconds, respectively, and a beam spot with a width of 50 m.
The system included a small enclosed glass sample chamber mounted on an
electronically controlled platform. Each filter was placed in the sample chamber
and the platform was centered in the laser staging area. Method blanks,
consisting of a CeF3 precipitate prepared in the same manner as the
experimental samples, but without incorporation of the Pu standard, were
processed before and after each sample filter. Prior to analysis, each filter was
mapped using a charge-coupled device (CCD) camera with the manufacturer-
provided software DigiLaz II. An example of the filter image before and after
ablation is provided (Figure 32).
In the LA-ICP-MS, z=1 ions are produced following ablation of the solid matrix
with the laser. The laser ablation system was coupled to the ELAN DRC II ICP-
MS. The operational parameters used for sample ablation and ICP-MS analysis
are listed in Table 24. Central regions of the filter sample were selected for line
scan analysis using the DigiLaz II software and were subsequently irradiated by
the laser. The ablated sample matrix was transported with an argon carrier gas to
146
the plasma ionization chamber where the sample vapor and particulates were
atomized and ionized before passing into the reaction cell and mass analyzer.
Four sequential line scan analyses were performed for each filter sample.
Figure 32. CCD generated image of the CeF3 filter in the sample chamber of the CETAC laser ablation unit prior to ablation (A) and after ablation of several areas (the dark lines) (B).
Signal integration analysis was performed with GeoPro™ software Version
1.00 (CETAC Technologies) which runs on the Microsoft Excel platform. The
m/z ratios analyzed are listed in Table 23. Signal intensity for each m/z ratio was
integrated over time from 75 to 150 seconds. The relative m/z peak ratios for
238:239, 240:239, 241:239, and 242:239 were determined using the following
equation:
𝐶𝑥 − 𝐶𝑥 ,𝑏𝑙𝑎𝑛𝑘
𝐶239 − 𝐶239,𝑏𝑙𝑎𝑛𝑘 =
𝐶𝑥
𝐶239 Equation 24
where Cx and C239 represented the integral counts for the m/z ratio of interest
147
and x = 238, 240, 241 or 242. Cblank was the number of counts collected for each
respective m/z ratio in the appropriate method blank. Instrument performance at
each m/z was determined using the background equivalent concentration (BEC)
calculation (123):
𝐼𝐵𝐺
𝐼𝐴 − 𝐼𝐵𝐺× 𝐶𝐴 = 𝐵𝐸𝐶 Equation 25
where I is the signal intensity for the background and analyte and C is the true
analyte mass concentration at the analyte m/z ratio. The BEC is considered a
more realistic assessment of the background signal within a given sample set
than the instrument limit of detection (LOD), which only represents the
background noise. As an example, if the background signal intensity (IBG) in the
140 m/z channel region was 1000 ± 50 cps (1ζ) and the analyte signal (IA)
intensity was 3 x10⁴ cps for CA = 20 ng Ce (material ablated during the line scan
analysis), the BEC would 0.69 ng of Ce/ line scan.
The LOD would be equal to 3ζ*CA/(IA-IBG), or 0.10 ng of Ce/ line scan. The Ce
signal (m/z=140) was used qualitatively to determine the precipitate homogeneity
across each filter. Cerium mass 140 constitutes 88% of the isotopic composition
of natural Ce, and was the dominant signal in each mass spectrum. It was
assumed that differences in the Ce signal across a given filter would be attributed
to inhomogeneous deposition. Mass sensitivity analysis for Ce was not
conducted for this preliminary investigation.
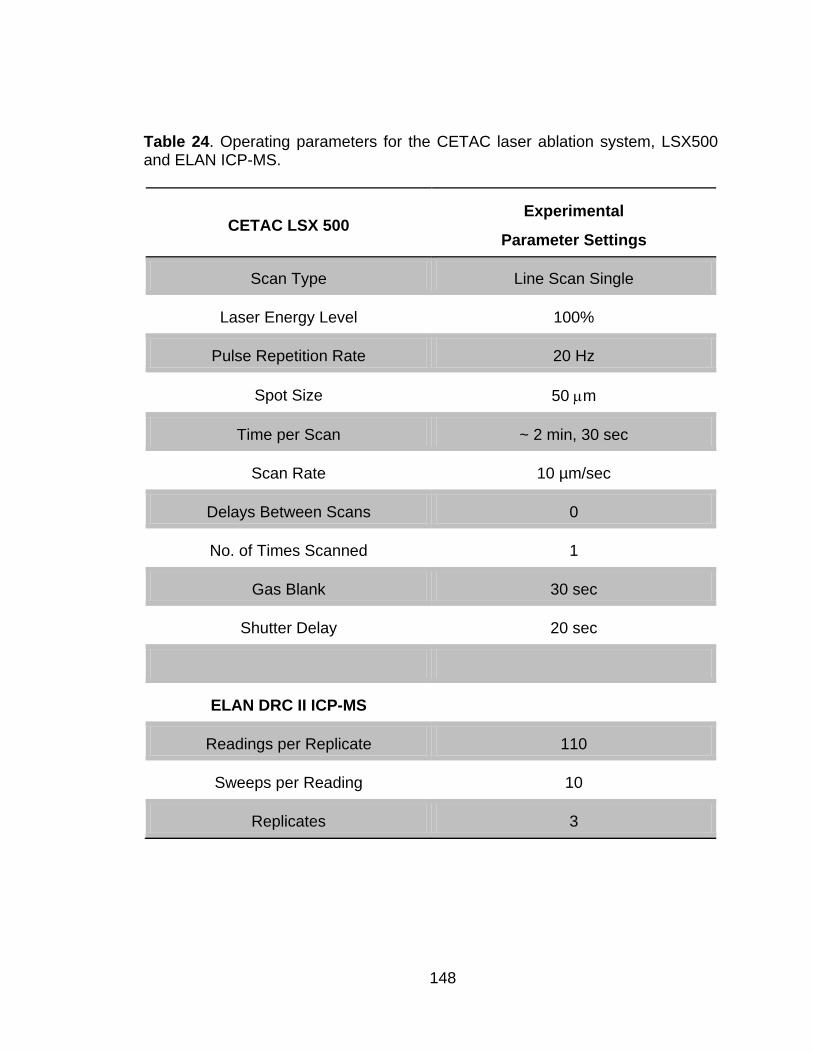
148
Table 24. Operating parameters for the CETAC laser ablation system, LSX500 and ELAN ICP-MS.
CETAC LSX 500 Experimental
Parameter Settings
Scan Type Line Scan Single
Laser Energy Level 100%
Pulse Repetition Rate 20 Hz
Spot Size 50 m
Time per Scan ~ 2 min, 30 sec
Scan Rate 10 µm/sec
Delays Between Scans 0
No. of Times Scanned 1
Gas Blank 30 sec
Shutter Delay 20 sec
ELAN DRC II ICP-MS
Readings per Replicate 110
Sweeps per Reading 10
Replicates 3
149
6.3.6 Plutonium Isotopic Analysis – Gamma Spectrometry
The CeF3 filters with activity concentrations > 100 Bq were counted for 50-
140 hours on a broad energy spectrum germanium detector (BEGe, Canberra
Industries, Inc., Meriden, CT, USA). Three photon energies were used for
determining 239Pu content, 38.7 keV (0.0105% yield), 51.6 keV (0.0271% yield)
and 129 keV (6.31 x10⁻³% yield). The lower-energy photons were chosen based
on their relative proximity to the photon energies chosen for 240Pu and 238Pu
evaluation, 45.1 keV (0.045% yield) and 43.8 keV (0.0392% yield), respectively.
The 59.5 keV (35.9 % yield) photon was used for 241Am evaluation. The 129 keV
photon associated with 239Pu decay, whose attenuation caused by the
intervening sample matrix is considerably less than that of the lower-energy
photons, was used as a third reference point for determining the absolute amount
of 239Pu in each sample. The relative ratios of 239Pu to 240Pu and 238Pu were
determined based on the following relationship:
𝐶𝛾 ,239
𝜀𝛾 ,239 × 𝑌𝑖𝑒𝑙𝑑
𝐶𝛾 ,240(𝑜𝑟 238)
𝜀𝛾 ,240(𝑜𝑟 238) × 𝑌𝑖𝑒𝑙𝑑
= 𝑅239/240(𝑜𝑟 238) Equation 26
where C was the net counts in the photopeak, εγ was the BEGe detection
efficiency, and Yield was the radiative yield associated with a given emitted
photon. Gamma detection efficiency was initially determined using various
certified gamma-ray point sources. By using closely spaced gamma lines,
corrections due to finite source size and source self-attenuation tend to cancel
one another. Gamma spectra were analyzed using Genie 2000 Gamma
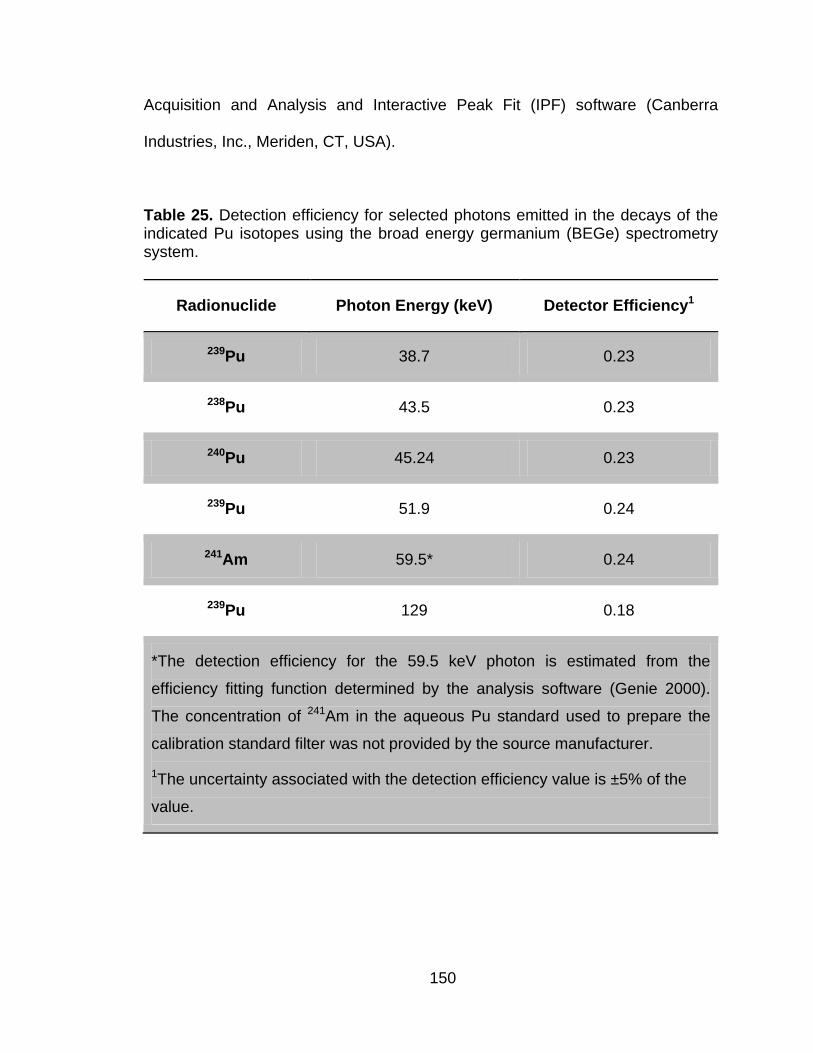
150
Acquisition and Analysis and Interactive Peak Fit (IPF) software (Canberra
Industries, Inc., Meriden, CT, USA).
Table 25. Detection efficiency for selected photons emitted in the decays of the indicated Pu isotopes using the broad energy germanium (BEGe) spectrometry system.
Radionuclide Photon Energy (keV) Detector Efficiency1
239Pu 38.7 0.23
238Pu 43.5 0.23
240Pu 45.24 0.23
239Pu 51.9 0.24
241Am 59.5* 0.24
239Pu 129 0.18
*The detection efficiency for the 59.5 keV photon is estimated from the
efficiency fitting function determined by the analysis software (Genie 2000).
The concentration of 241Am in the aqueous Pu standard used to prepare the
calibration standard filter was not provided by the source manufacturer.
1The uncertainty associated with the detection efficiency value is ±5% of the
value.

151
Peaks were located and an energy calibration established using the
unidentified second differential option in the analysis software with a significance
threshold of 3.00 and a tolerance of 1.00 keV (default settings). Peak area was
first determined using the Sum/Non-linear Least Squares Fit setup. A step
continuum function was performed across the entire energy interval (0- 515 keV)
and over all channels (1 - 4096). Once the relevant peaks were identified, IPF
filters were applied for more accurate peak integration. This analysis method was
used for both pre- and post-separation sample filters. The BEGe gamma
spectrometry system detection efficiencies for the photons of interest are listed in
Table 25.
6.3.7 Plutonium Isotopic Analysis – Alpha Spectrometry
Alpha spectra were collected on an Alpha Analyst spectrometer (Canberra
Industries, Inc., Meriden, CT, USA). The solid state detectors used for all
experiments had an active area of 450 mm2 and the sample position was fixed at
16 mm from the detector face. A 24 hour background count was obtained for
each chamber prior to sample analysis. Filters were counted for 10 minutes to 2
hours on the alpha spectrometry system, depending on the activity of the sample.
Additionally, each filter was counted twice, in two different alpha chambers for
improved statistical analysis and to help eliminate any detector-related
systematic errors. The detector background count rate was sufficiently low
0.0083 cps) that no background correction was performed.
Alpha spectrum analysis was performed with Genie 2000 and Alpha Analyst
software (Canberra Industries, Inc.). Peak integration was performed by manually
152
defining the alpha peak region of interest (ROI). Activity ratios for 238Pu+241Am
and 239+240Pu relative to the total alpha activity of the sample, and the detector
counting efficiency were determined using two different methods. The first
method assumed that the low energy tail associated with the 239Pu+240Pu peak
was due to lower yield alpha decays and therefore the 239+240Pu contribution the
total alpha energy spectrum was equivalent to:
𝐶𝑡𝑜𝑡𝑎𝑙 − 𝐶𝐸>5.2 𝑀𝑒𝑉 = 𝐶239+240 Equation 27
where Ctotal was the total number of counts collected across the entire energy
spectrum (Emax = 5.6 MeV), CE>5.2 MeV was the number of counts collected in the
5.3 to 5.6 MeV energy range (associated with decays of 241Am and 238Pu), and
C239+240 was the number of counts associated with the decay of 239Pu and 240Pu.
The 238Pu+241Am to 239+240Pu ratio was determined using the following formula:
𝐶𝐸>5.2 𝑀𝑒𝑉
𝐶𝑡𝑜𝑡𝑎𝑙 − 𝐶𝐸>5.2 𝑀𝑒𝑉= 𝑅𝑃𝑢−238,𝐴𝑚−241 Equation 28
This approach is not very accurate, in that there is no way to verify that the
low energy tail only contains 239Pu and 240Pu. No information was provided with
the standard source regarding the separation efficiency of the daughter products
(i.e. 234U, 235U, 237Np and 241Am), most of which have alpha decay energies in the
4-5 MeV energy region of the spectrum. Additionally, an ideal alpha source is a
uniformly deposited thin layer of material. As the thickness of the source
increases, the alpha particles are attenuated and therefore the energy reaching
the active region of the detector may not be representative of the original alpha
energy. The uniformity of the CeF3 deposit on the filter was not evaluated and
153
therefore, it was possible that lower energy alpha particles were attenuated to a
somewhat greater extent than were higher-energy alpha particles. Similarly, the
approach assumes that the contribution of degraded-energy alpha particles
(associated with the upper energy peak) did not make a significant contribution to
the events in the lower energy peak. This approach is supported by the spectra
(Figure 33), where the peak separation is complete.
The second method used to determine the isotopic activity ratio set the
239+240Pu alpha peak ROI between 4.96 MeV and 5.21 MeV, which represented
approximately 99.99% of the alpha energies associated with the decay of 239Pu
and 240Pu. The 238Pu and 241Am peak ROI was set between 5.31 MeV and 5.57
MeV, which represented approximately 99.99% of the alpha energies produced
from the decay of 238Pu and 241Am and includes those higher-energy events
caused by summing of conversion-electrons with the main alpha peak of 241Am.
Using this method, the low energy tail of the 239+240Pu peak was neglected, as
was any contribution of the tail from the 238Pu+241Am peak to the lower energy
peak. This method assumed that > 99% of the 239+240Pu and 238Pu+241Am decays
would fall within the respective ROIs and that the isotopic ratio of 238Pu+241Am to
239+240Pu would be:
𝐶𝑅𝑂𝐼 ,𝑃𝑢−238+𝐴𝑚−241
𝐶𝑅𝑂𝐼 ,𝑃𝑢−239+240= 𝑅𝑃𝑢−238,𝐴𝑚−241 Equation 29
where CROI was the number of counts in the low (239+240) and high (238+241)
energy ROIs.
The first method potentially under-estimates the isotopic ratio by assigning
too many counts to the decay of 239Pu and 240Pu.The second method should lead
154
to a more accurate isotopic ratio unless there is significant peak broadening. For
this work, both analysis methods should yield similar results (i.e. the daughter
product contribution to total activity is small). For experiments where the
elemental and isotopic composition is unknown, (i.e. Chapter 5) the second
method is expected to be more accurate. Detector efficiency was determined
from the following relationship:
𝐶239+240
𝐴239+240= 𝜀𝛼 Equation 30
where C239+240 is the number of counts per second in the low energy ROI relative
to the 239+240Pu activity of the sample (based on the information provided in Table
21).
6.4 Results and Discussion
6.4.1 Alpha Analysis
Isotopic analysis of the CeF3 filters was first determined by alpha
spectrometry. An example of the spectral data output for the 2316 Bq CeF3 filter
for both pre- and post-separation samples is provided (Figure 33). The observed
difference between the spectra was small, indicating that the amount of Am (and
other daughter products) in the initial standard solution was small and the
samples were of reproducible or negligible thickness.
The isotopic ratios for 239+240Pu to total alpha activity are presented (Table
26). These values represent the average activity ratio across the two sample sets
(n= 7 filters, 10 Bq < Activity <2400Bq, pre- and post-separation). The average
239+240Pu: total alpha activity ratios for both pre- and post- separation sample
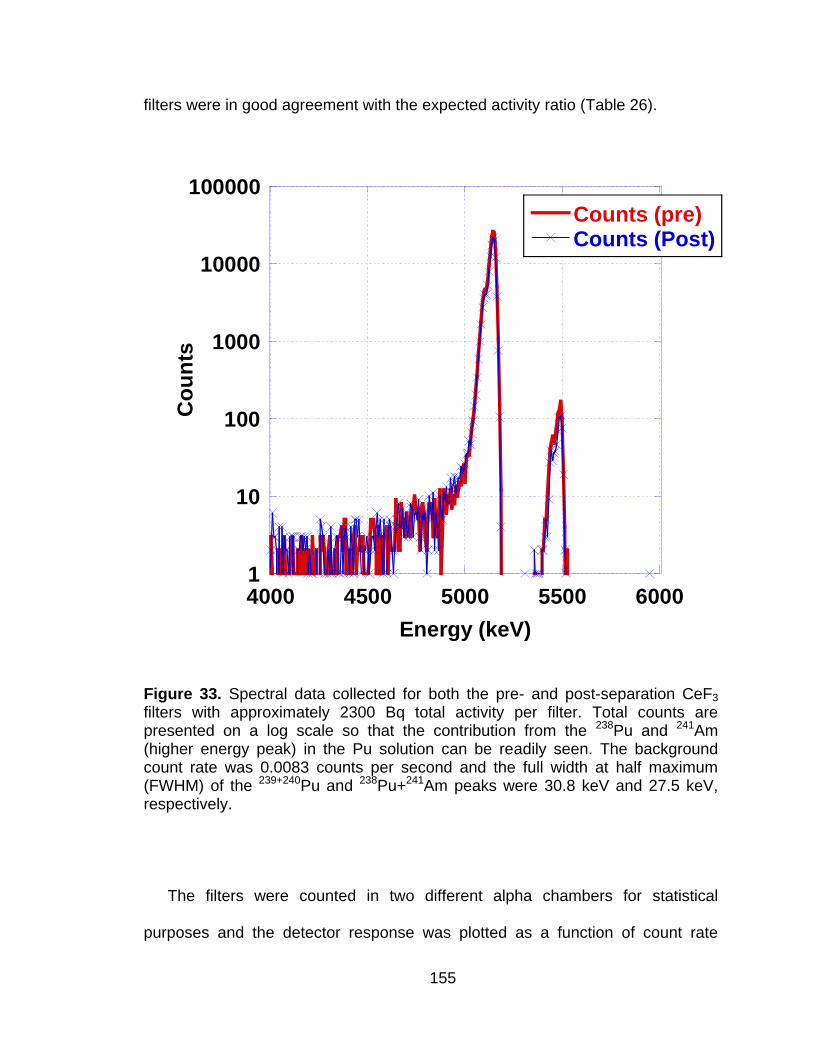
155
filters were in good agreement with the expected activity ratio (Table 26).
1
10
100
1000
10000
100000
4000 4500 5000 5500 6000
Counts (pre)Counts (Post)
Co
un
ts
Energy (keV)
Figure 33. Spectral data collected for both the pre- and post-separation CeF3 filters with approximately 2300 Bq total activity per filter. Total counts are presented on a log scale so that the contribution from the 238Pu and 241Am (higher energy peak) in the Pu solution can be readily seen. The background count rate was 0.0083 counts per second and the full width at half maximum (FWHM) of the 239+240Pu and 238Pu+241Am peaks were 30.8 keV and 27.5 keV, respectively.
The filters were counted in two different alpha chambers for statistical
purposes and the detector response was plotted as a function of count rate
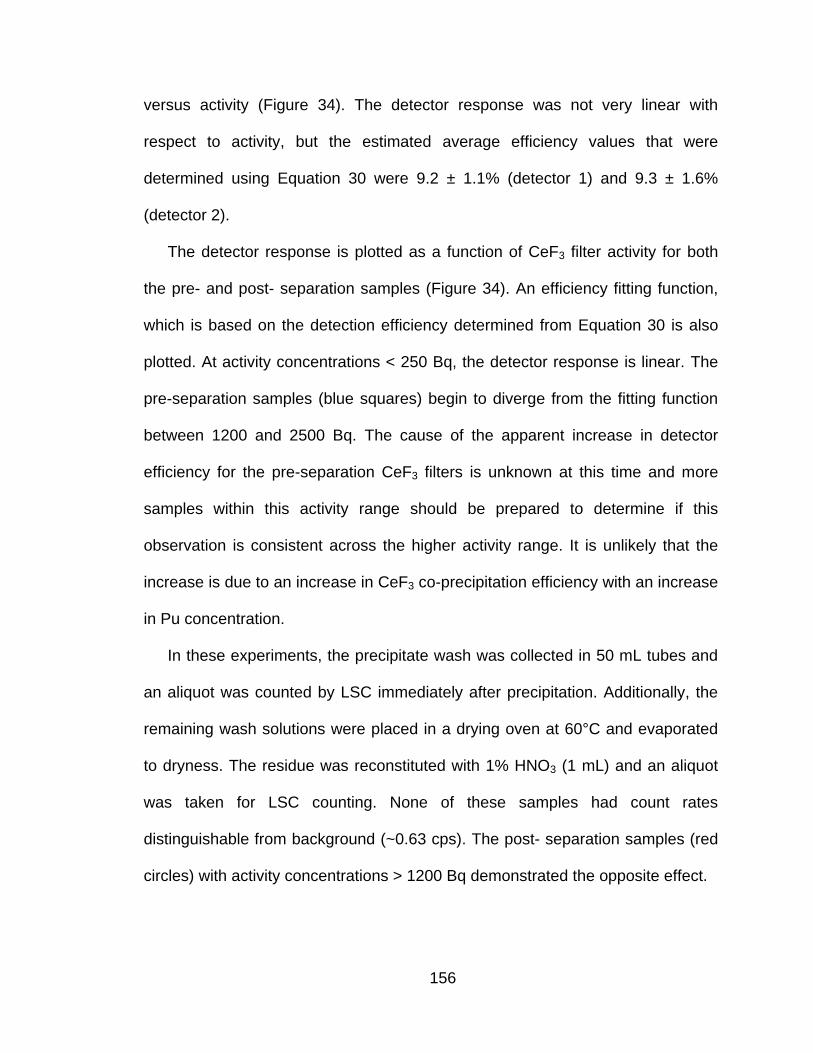
156
versus activity (Figure 34). The detector response was not very linear with
respect to activity, but the estimated average efficiency values that were
determined using Equation 30 were 9.2 ± 1.1% (detector 1) and 9.3 ± 1.6%
(detector 2).
The detector response is plotted as a function of CeF3 filter activity for both
the pre- and post- separation samples (Figure 34). An efficiency fitting function,
which is based on the detection efficiency determined from Equation 30 is also
plotted. At activity concentrations < 250 Bq, the detector response is linear. The
pre-separation samples (blue squares) begin to diverge from the fitting function
between 1200 and 2500 Bq. The cause of the apparent increase in detector
efficiency for the pre-separation CeF3 filters is unknown at this time and more
samples within this activity range should be prepared to determine if this
observation is consistent across the higher activity range. It is unlikely that the
increase is due to an increase in CeF3 co-precipitation efficiency with an increase
in Pu concentration.
In these experiments, the precipitate wash was collected in 50 mL tubes and
an aliquot was counted by LSC immediately after precipitation. Additionally, the
remaining wash solutions were placed in a drying oven at 60°C and evaporated
to dryness. The residue was reconstituted with 1% HNO3 (1 mL) and an aliquot
was taken for LSC counting. None of these samples had count rates
distinguishable from background (~0.63 cps). The post- separation samples (red
circles) with activity concentrations > 1200 Bq demonstrated the opposite effect.
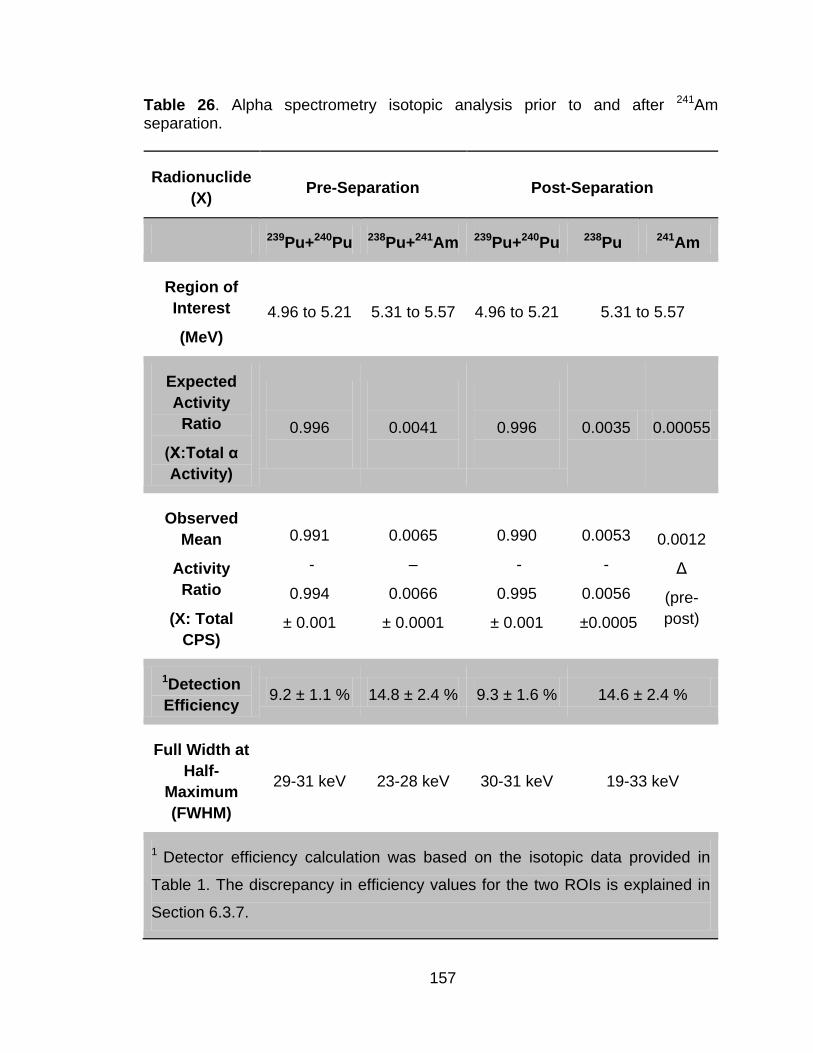
157
Table 26. Alpha spectrometry isotopic analysis prior to and after 241Am separation.
Radionuclide
(X) Pre-Separation Post-Separation
239Pu+240Pu 238Pu+241Am 239Pu+240Pu 238Pu 241Am
Region of
Interest
(MeV)
4.96 to 5.21 5.31 to 5.57 4.96 to 5.21 5.31 to 5.57
Expected
Activity
Ratio
(X:Total α
Activity)
0.996
0.0041
0.996
0.0035 0.00055
Observed
Mean
Activity
Ratio
(X: Total
CPS)
0.991
-
0.994
± 0.001
0.0065
–
0.0066
± 0.0001
0.990
-
0.995
± 0.001
0.0053
-
0.0056
±0.0005
0.0012
Δ
(pre-
post)
1Detection
Efficiency 9.2 ± 1.1 % 14.8 ± 2.4 % 9.3 ± 1.6 % 14.6 ± 2.4 %
Full Width at
Half-
Maximum
(FWHM)
29-31 keV 23-28 keV 30-31 keV 19-33 keV
1 Detector efficiency calculation was based on the isotopic data provided in
Table 1. The discrepancy in efficiency values for the two ROIs is explained in
Section 6.3.7.
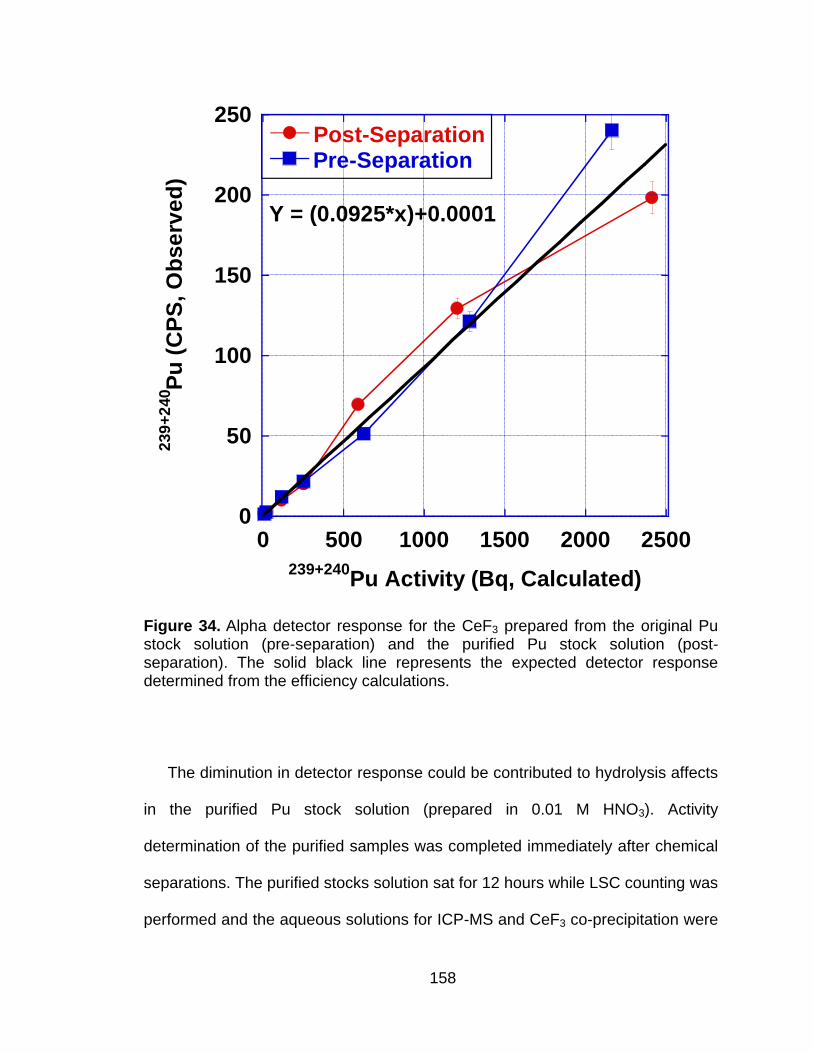
158
Post-SeparationPre-Separation
239
+2
40P
u (
CP
S, O
bs
erv
ed
)
239+240Pu Activity (Bq, Calculated)
Y = (0.0925*x)+0.0001
0
50
100
150
200
250
0 500 1000 1500 2000 2500
Figure 34. Alpha detector response for the CeF3 prepared from the original Pu stock solution (pre-separation) and the purified Pu stock solution (post-separation). The solid black line represents the expected detector response determined from the efficiency calculations.
The diminution in detector response could be contributed to hydrolysis affects
in the purified Pu stock solution (prepared in 0.01 M HNO3). Activity
determination of the purified samples was completed immediately after chemical
separations. The purified stocks solution sat for 12 hours while LSC counting was
performed and the aqueous solutions for ICP-MS and CeF3 co-precipitation were
159
prepared after the activity concentration was verified (approximately 14 hours
after chemical separation). It is well known that Pu can undergo hydrolysis in
[HNO3] < 0.5 M (66). Hydrolysis and subsequent polymerization of Pu in solution
can significantly decrease the net concentration of Pu in solution. This affect
should be observed in all filters prepared with the purified Pu stock solution.
Once the purified solution was prepared for CeF3 precipitation, the excess
fluoride should quickly reverse the affects of hydrolysis. The supernate for each
CeF3 filter prepared with the purified stock solution was checked for residual
activity as described above and none was detected above background. Sample
vials were not checked for activity once the sample solutions were precipitated.
Further work is needed to explain the analogous behavior of the higher activity
filters with respect to detector response.
The 238Pu+241Am to total alpha activity ratios for the pre- and post-separation
CeF3 filters are provided in Table 26. The observed ratios were significantly
higher than the expected values. As previously mentioned, the 241Am content of
the original Pu standard was not provided by the manufacturer; therefore, the
higher ratio for the filters prepared from the original stock solution could be
attributed to an Am excess. The observed 238Pu to total Pu activity ratio was 1.5
times greater than the expected value for the filters prepared from the purified Pu
stock solution. The original Pu stock solution was chemically purified using TEVA
extraction chromatography resin. According to the initial resin characterization
studies, (34), Pu4+ in the 3M HNO3 loading matrix solution should strongly sorb to
the resin, while Am3+, NpO2+ + and UO2
2+ remain in solution and pass
160
unhindered through the column.If it is assumed that most of the Am was removed
from solution prior to CeF3 co-precipitation and that the Pu isotopic activity
percent values in Table 21 are correct, then the detector efficiency for the higher
energy ROI (5.31 to 5.7 MeV) was 14.8 ± 2.4% (detector 1) and 14.6 ± 2.4%
(detector 2).
Efficiency calibrations as a function of energy are usually not required for
alpha spectrometry. The initial detector material encountered by the incident
alpha particles is the detector dead layer. This layer is typically thin and is
expected to have no impact on detector efficiency as a function of energy. The
energy associated with the incident alpha particle is deposited within the active
area of the Si detector, which is flush with the dead layer. This is because of the
linear stopping power of the alpha particle within the silicon matrix of the
detector. Stopping power is defined as the amount of energy lost per unit length
of a given material (35). The stopping power of a wide range of alpha energies in
silicon is provided in Figure 35 (124). For the 5.15 MeV and 5.5 MeV alpha
particles in Si, the stopping power is 605.0 and 580.2 MeV cm2/g, respectively.
This translates to an alpha particle range of approximately 25.3 – 27.8 µm.
The active thickness of the silicon detector is approximately 140 µm, therefore
all of the alpha energy is deposited in the detector. If it is assumed that the
detector efficiency for both ROIs was equivalent, then the increased 238Pu to the
total Pu alpha activity observed in these samples was probably due to excess
238Pu in solution beyond what is claimed in the data sheet accompanying the
original Pu stock solution, and incomplete removal of 241Am from the stock
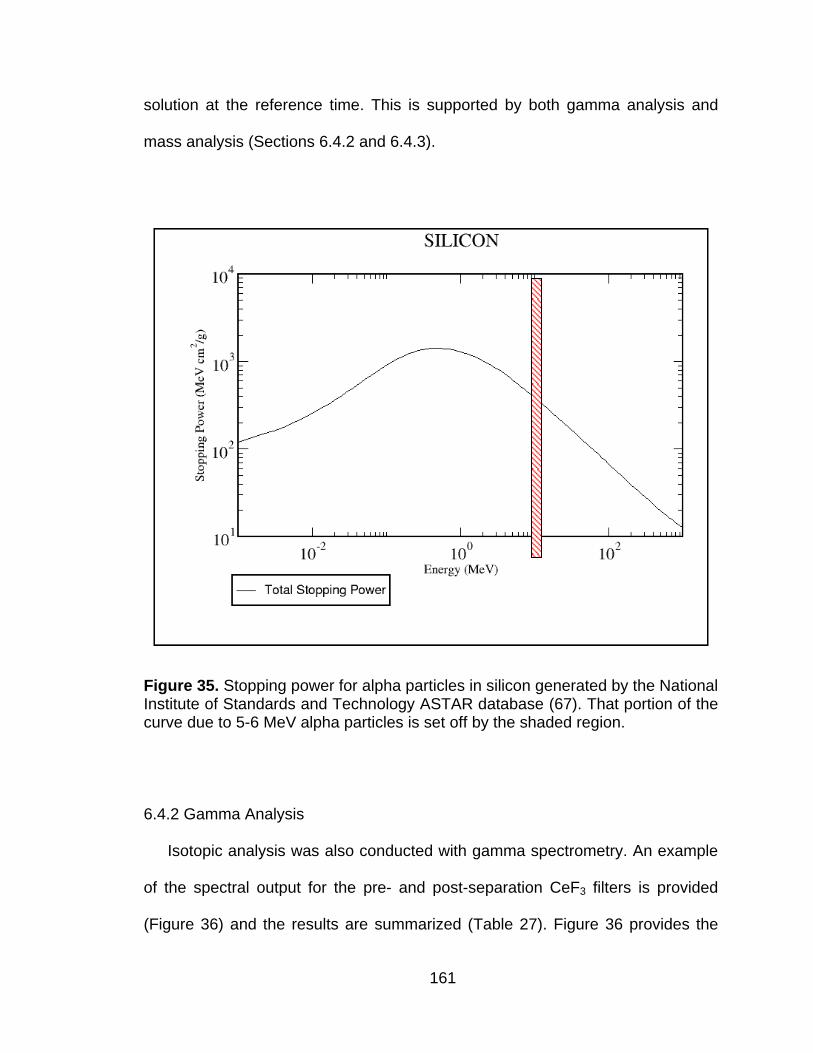
161
solution at the reference time. This is supported by both gamma analysis and
mass analysis (Sections 6.4.2 and 6.4.3).
Figure 35. Stopping power for alpha particles in silicon generated by the National Institute of Standards and Technology ASTAR database (67). That portion of the curve due to 5-6 MeV alpha particles is set off by the shaded region.
6.4.2 Gamma Analysis
Isotopic analysis was also conducted with gamma spectrometry. An example
of the spectral output for the pre- and post-separation CeF3 filters is provided
(Figure 36) and the results are summarized (Table 27). Figure 36 provides the
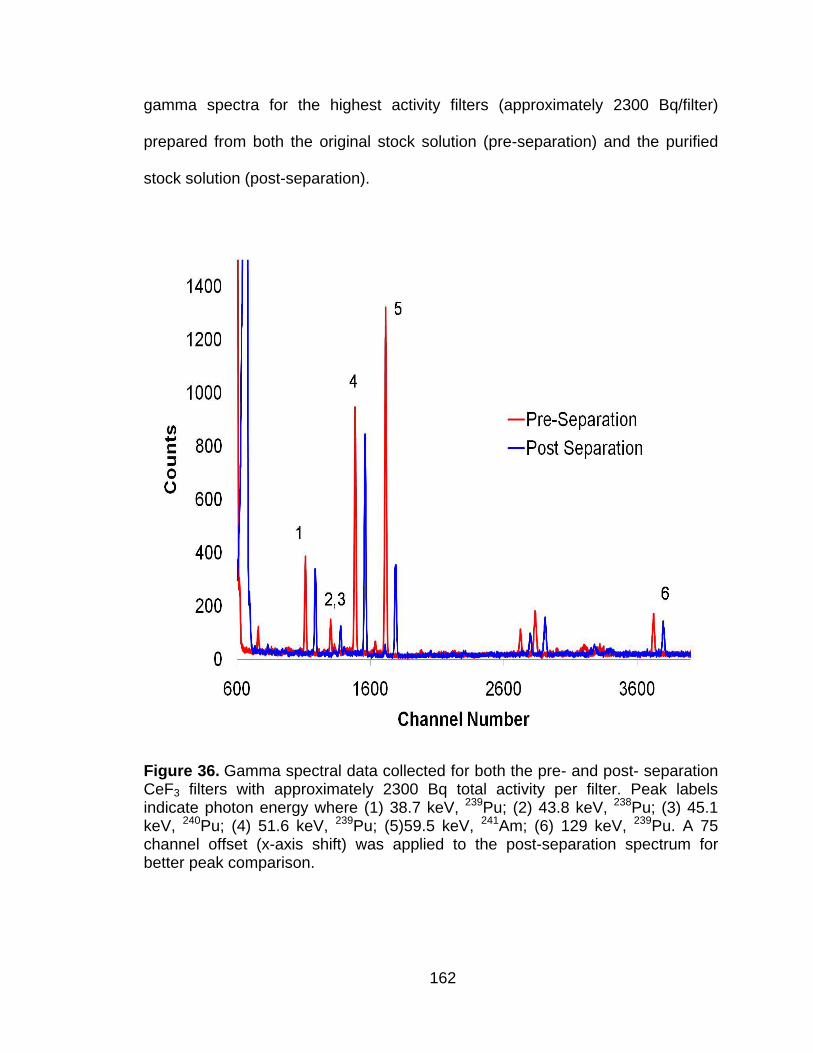
162
gamma spectra for the highest activity filters (approximately 2300 Bq/filter)
prepared from both the original stock solution (pre-separation) and the purified
stock solution (post-separation).
Figure 36. Gamma spectral data collected for both the pre- and post- separation CeF3 filters with approximately 2300 Bq total activity per filter. Peak labels indicate photon energy where (1) 38.7 keV, 239Pu; (2) 43.8 keV, 238Pu; (3) 45.1 keV, 240Pu; (4) 51.6 keV, 239Pu; (5)59.5 keV, 241Am; (6) 129 keV, 239Pu. A 75 channel offset (x-axis shift) was applied to the post-separation spectrum for better peak comparison.
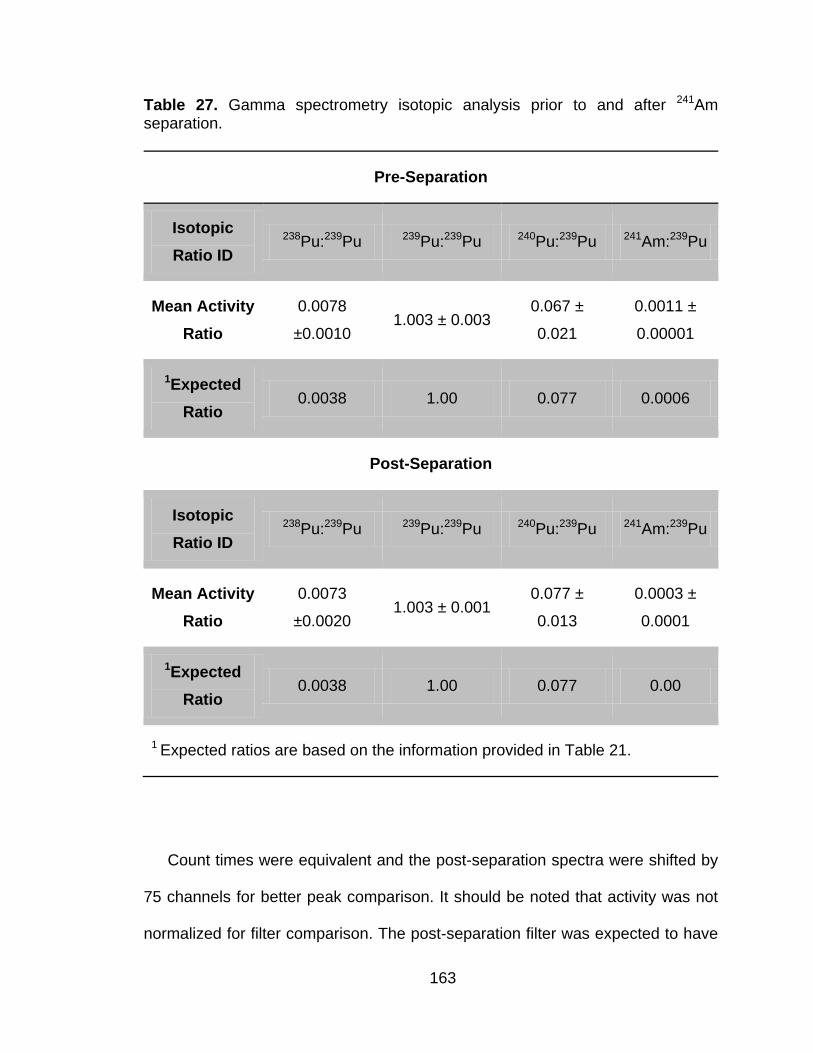
163
Table 27. Gamma spectrometry isotopic analysis prior to and after 241Am separation.
Pre-Separation
Isotopic
Ratio ID
238Pu:239Pu 239Pu:239Pu 240Pu:239Pu 241Am:239Pu
Mean Activity
Ratio
0.0078
±0.0010 1.003 ± 0.003
0.067 ±
0.021
0.0011 ±
0.00001
1Expected
Ratio 0.0038 1.00 0.077 0.0006
Post-Separation
Isotopic
Ratio ID
238Pu:239Pu 239Pu:239Pu 240Pu:239Pu 241Am:239Pu
Mean Activity
Ratio
0.0073
±0.0020 1.003 ± 0.001
0.077 ±
0.013
0.0003 ±
0.0001
1Expected
Ratio 0.0038 1.00 0.077 0.00
1 Expected ratios are based on the information provided in Table 21.
Count times were equivalent and the post-separation spectra were shifted by
75 channels for better peak comparison. It should be noted that activity was not
normalized for filter comparison. The post-separation filter was expected to have
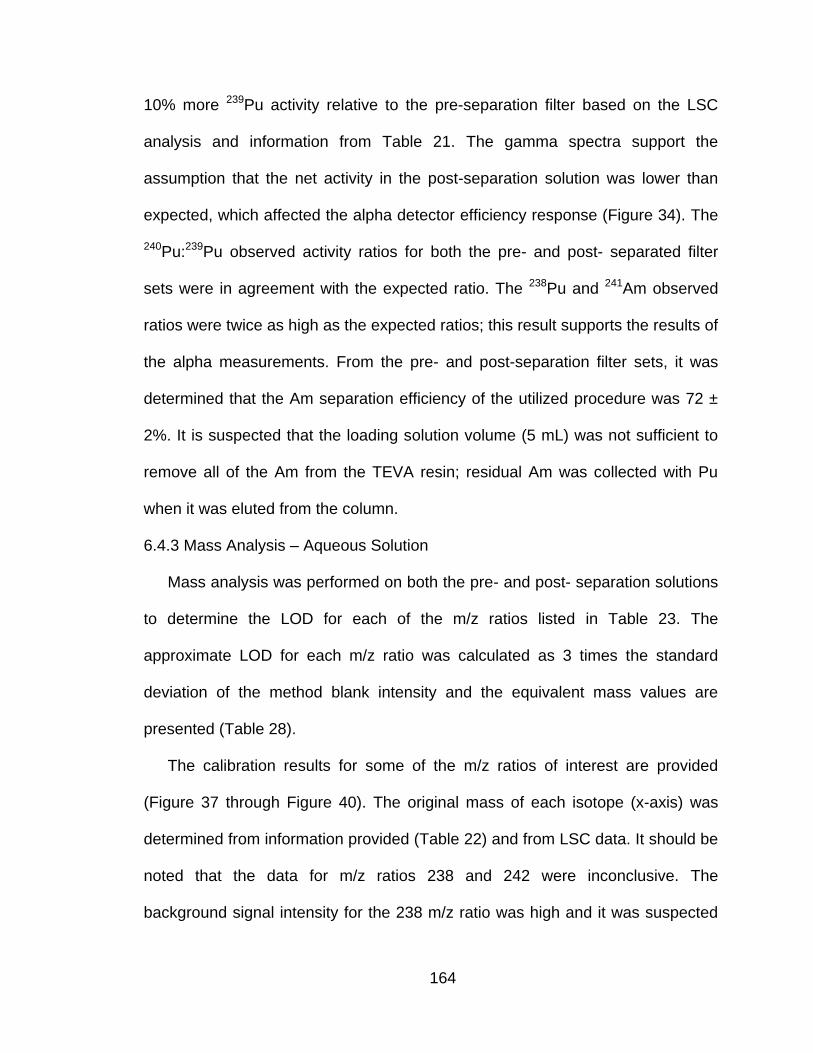
164
10% more 239Pu activity relative to the pre-separation filter based on the LSC
analysis and information from Table 21. The gamma spectra support the
assumption that the net activity in the post-separation solution was lower than
expected, which affected the alpha detector efficiency response (Figure 34). The
240Pu:239Pu observed activity ratios for both the pre- and post- separated filter
sets were in agreement with the expected ratio. The 238Pu and 241Am observed
ratios were twice as high as the expected ratios; this result supports the results of
the alpha measurements. From the pre- and post-separation filter sets, it was
determined that the Am separation efficiency of the utilized procedure was 72 ±
2%. It is suspected that the loading solution volume (5 mL) was not sufficient to
remove all of the Am from the TEVA resin; residual Am was collected with Pu
when it was eluted from the column.
6.4.3 Mass Analysis – Aqueous Solution
Mass analysis was performed on both the pre- and post- separation solutions
to determine the LOD for each of the m/z ratios listed in Table 23. The
approximate LOD for each m/z ratio was calculated as 3 times the standard
deviation of the method blank intensity and the equivalent mass values are
presented (Table 28).
The calibration results for some of the m/z ratios of interest are provided
(Figure 37 through Figure 40). The original mass of each isotope (x-axis) was
determined from information provided (Table 22) and from LSC data. It should be
noted that the data for m/z ratios 238 and 242 were inconclusive. The
background signal intensity for the 238 m/z ratio was high and it was suspected
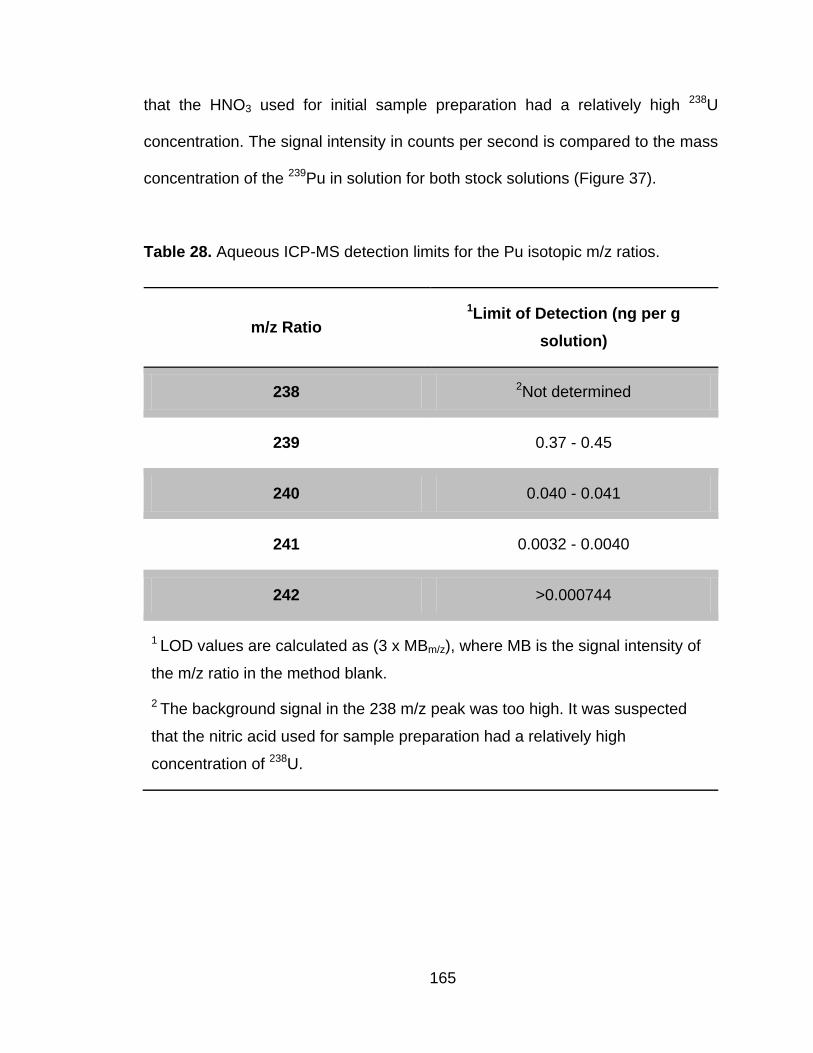
165
that the HNO3 used for initial sample preparation had a relatively high 238U
concentration. The signal intensity in counts per second is compared to the mass
concentration of the 239Pu in solution for both stock solutions (Figure 37).
Table 28. Aqueous ICP-MS detection limits for the Pu isotopic m/z ratios.
m/z Ratio
1Limit of Detection (ng per g
solution)
238 2Not determined
239 0.37 - 0.45
240 0.040 - 0.041
241 0.0032 - 0.0040
242 >0.000744
1 LOD values are calculated as (3 x MBm/z), where MB is the signal intensity of
the m/z ratio in the method blank.
2 The background signal in the 238 m/z peak was too high. It was suspected
that the nitric acid used for sample preparation had a relatively high
concentration of 238U.
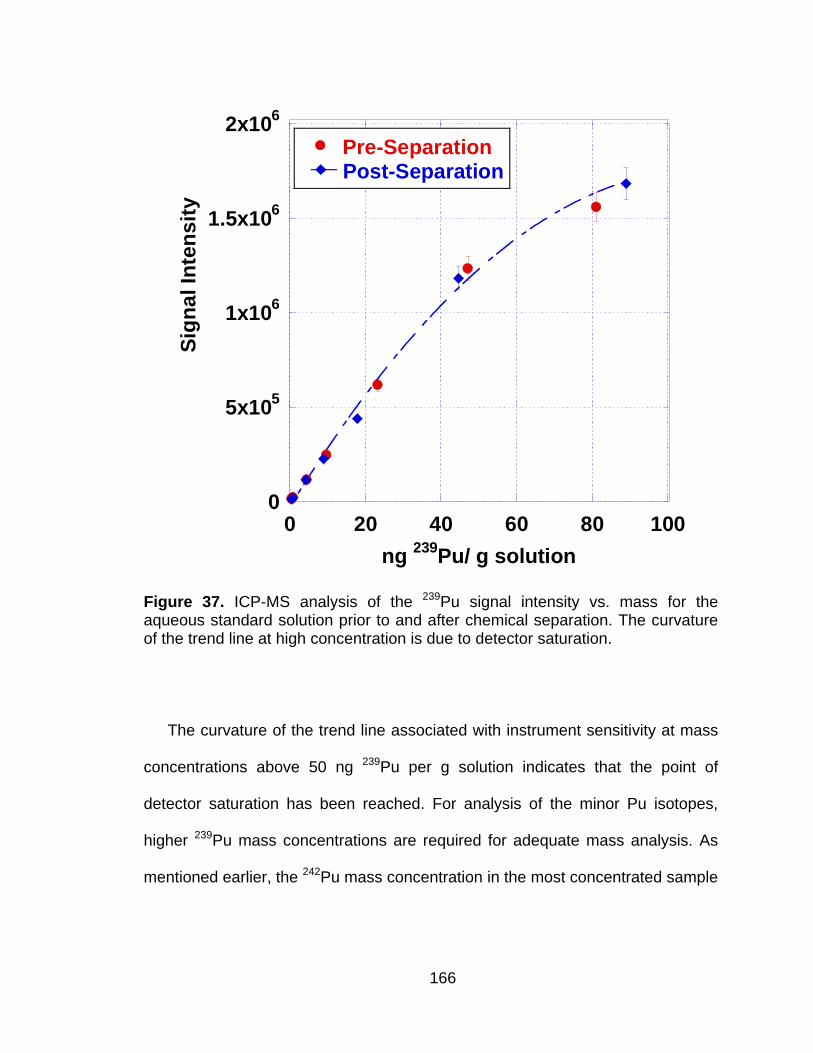
166
0
5x10⁵
1x10⁶
1.5x10⁶
2x10⁶
0 20 40 60 80 100
Pre-SeparationPost-Separation
Sig
na
l In
ten
sit
y
ng 239
Pu/ g solution
Figure 37. ICP-MS analysis of the 239Pu signal intensity vs. mass for the aqueous standard solution prior to and after chemical separation. The curvature of the trend line at high concentration is due to detector saturation.
The curvature of the trend line associated with instrument sensitivity at mass
concentrations above 50 ng 239Pu per g solution indicates that the point of
detector saturation has been reached. For analysis of the minor Pu isotopes,
higher 239Pu mass concentrations are required for adequate mass analysis. As
mentioned earlier, the 242Pu mass concentration in the most concentrated sample

167
is not sufficiently above the LOD for accurate determination of the 242 m/z ratio
(Table 28).
0
10000
20000
30000
40000
50000
60000
0 0.5 1 1.5 2
Pre-SeparationPost-Separation
Sig
na
l In
ten
sit
y
ng 240
Pu/ g solution
Figure 38. ICP-MS analysis of the 240Pu signal intensity vs. mass for the aqueous standard solution prior to and after chemical separation.
The highest mass value for the 242Pu in solution was close to the LOD,
therefore the data (Figure 40) was not considered reliable for isotopic ratio
determination. The observed mass ratio for 240Pu:239Pu was 0.021 ± 0.001 (both
pre- and post- separation) and matched the expected mass ratio of 0.021.
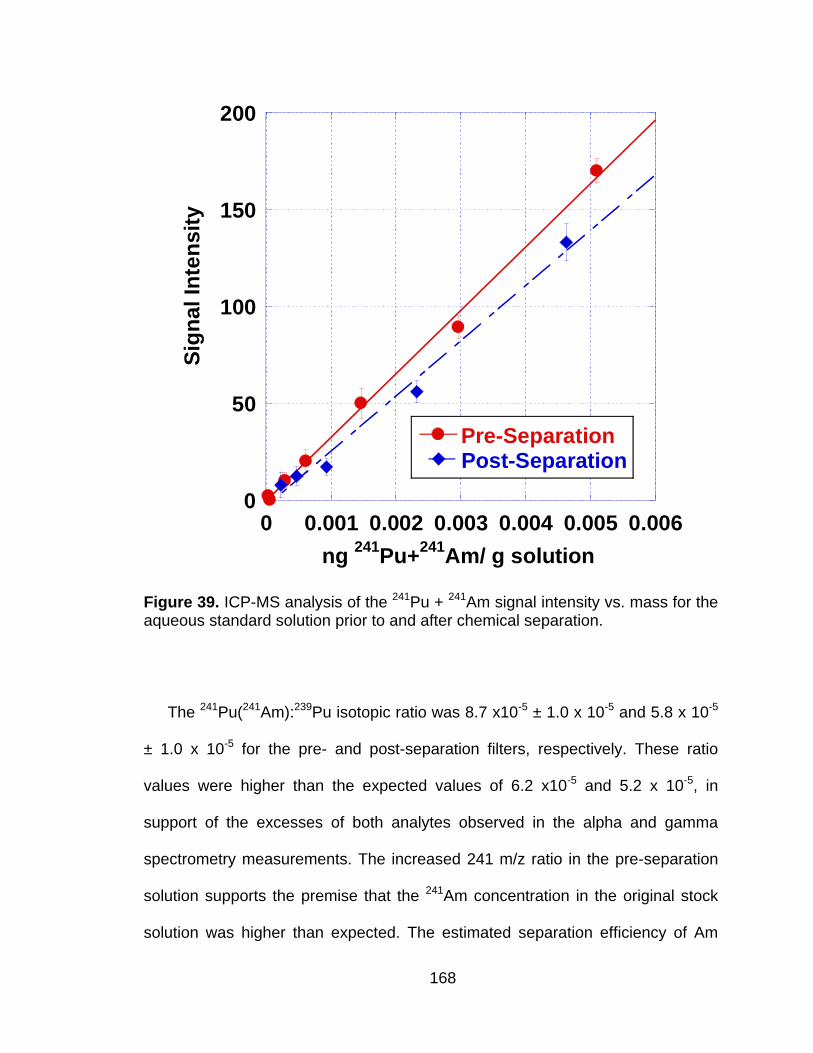
168
0
50
100
150
200
0 0.001 0.002 0.003 0.004 0.005 0.006
Pre-SeparationPost-Separation
Sig
na
l In
ten
sit
y
ng 241
Pu+241
Am/ g solution
Figure 39. ICP-MS analysis of the 241Pu + 241Am signal intensity vs. mass for the aqueous standard solution prior to and after chemical separation.
The 241Pu(241Am):239Pu isotopic ratio was 8.7 x10⁻⁵ ± 1.0 x 10⁻⁵ and 5.8 x 10⁻⁵
± 1.0 x 10⁻⁵ for the pre- and post-separation filters, respectively. These ratio
values were higher than the expected values of 6.2 x10⁻⁵ and 5.2 x 10⁻⁵, in
support of the excesses of both analytes observed in the alpha and gamma
spectrometry measurements. The increased 241 m/z ratio in the pre-separation
solution supports the premise that the 241Am concentration in the original stock
solution was higher than expected. The estimated separation efficiency of Am
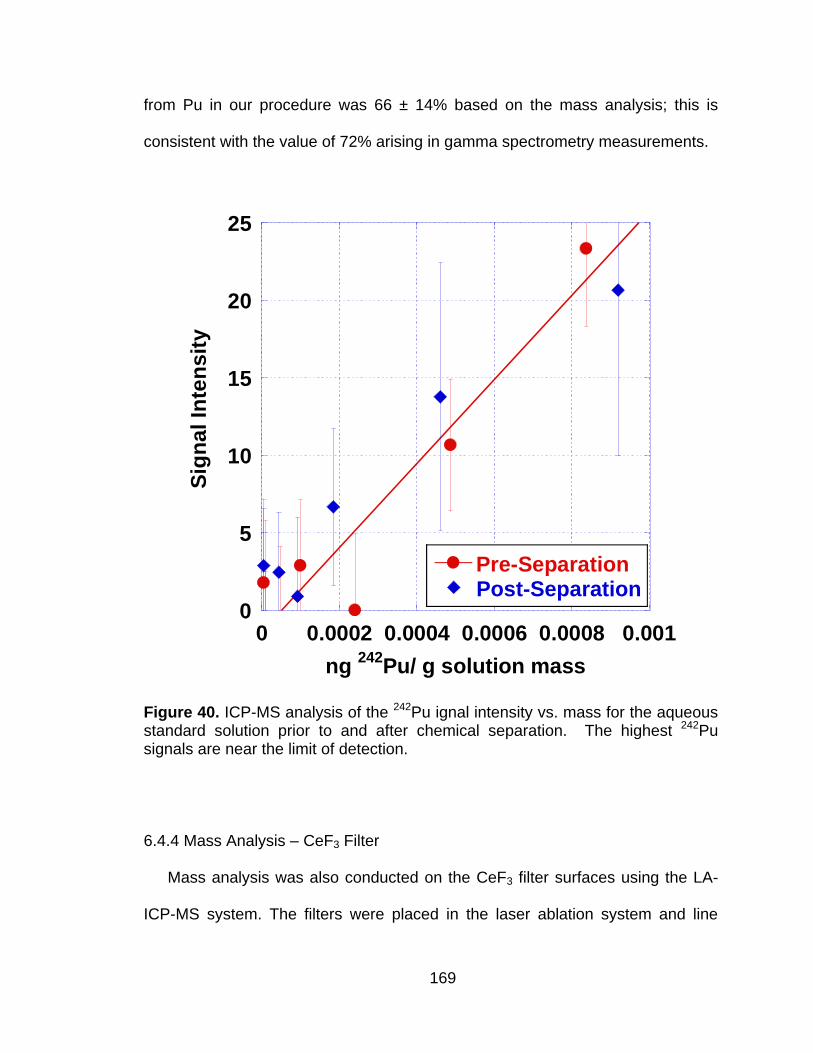
169
from Pu in our procedure was 66 ± 14% based on the mass analysis; this is
consistent with the value of 72% arising in gamma spectrometry measurements.
0
5
10
15
20
25
0 0.0002 0.0004 0.0006 0.0008 0.001
Pre-SeparationPost-Separation
Sig
na
l In
ten
sit
y
ng 242
Pu/ g solution mass
Figure 40. ICP-MS analysis of the 242Pu ignal intensity vs. mass for the aqueous standard solution prior to and after chemical separation. The highest 242Pu signals are near the limit of detection.
6.4.4 Mass Analysis – CeF3 Filter
Mass analysis was also conducted on the CeF3 filter surfaces using the LA-
ICP-MS system. The filters were placed in the laser ablation system and line
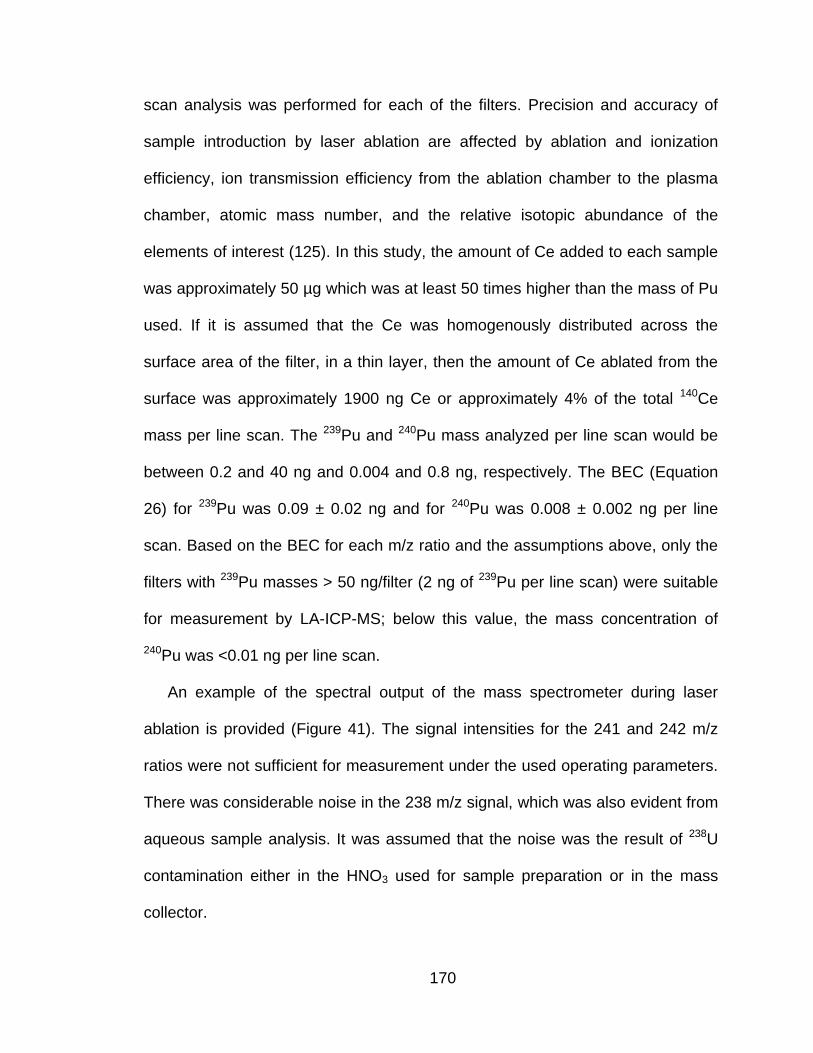
170
scan analysis was performed for each of the filters. Precision and accuracy of
sample introduction by laser ablation are affected by ablation and ionization
efficiency, ion transmission efficiency from the ablation chamber to the plasma
chamber, atomic mass number, and the relative isotopic abundance of the
elements of interest (125). In this study, the amount of Ce added to each sample
was approximately 50 µg which was at least 50 times higher than the mass of Pu
used. If it is assumed that the Ce was homogenously distributed across the
surface area of the filter, in a thin layer, then the amount of Ce ablated from the
surface was approximately 1900 ng Ce or approximately 4% of the total 140Ce
mass per line scan. The 239Pu and 240Pu mass analyzed per line scan would be
between 0.2 and 40 ng and 0.004 and 0.8 ng, respectively. The BEC (Equation
26) for 239Pu was 0.09 ± 0.02 ng and for 240Pu was 0.008 ± 0.002 ng per line
scan. Based on the BEC for each m/z ratio and the assumptions above, only the
filters with 239Pu masses > 50 ng/filter (2 ng of 239Pu per line scan) were suitable
for measurement by LA-ICP-MS; below this value, the mass concentration of
240Pu was <0.01 ng per line scan.
An example of the spectral output of the mass spectrometer during laser
ablation is provided (Figure 41). The signal intensities for the 241 and 242 m/z
ratios were not sufficient for measurement under the used operating parameters.
There was considerable noise in the 238 m/z signal, which was also evident from
aqueous sample analysis. It was assumed that the noise was the result of 238U
contamination either in the HNO3 used for sample preparation or in the mass
collector.
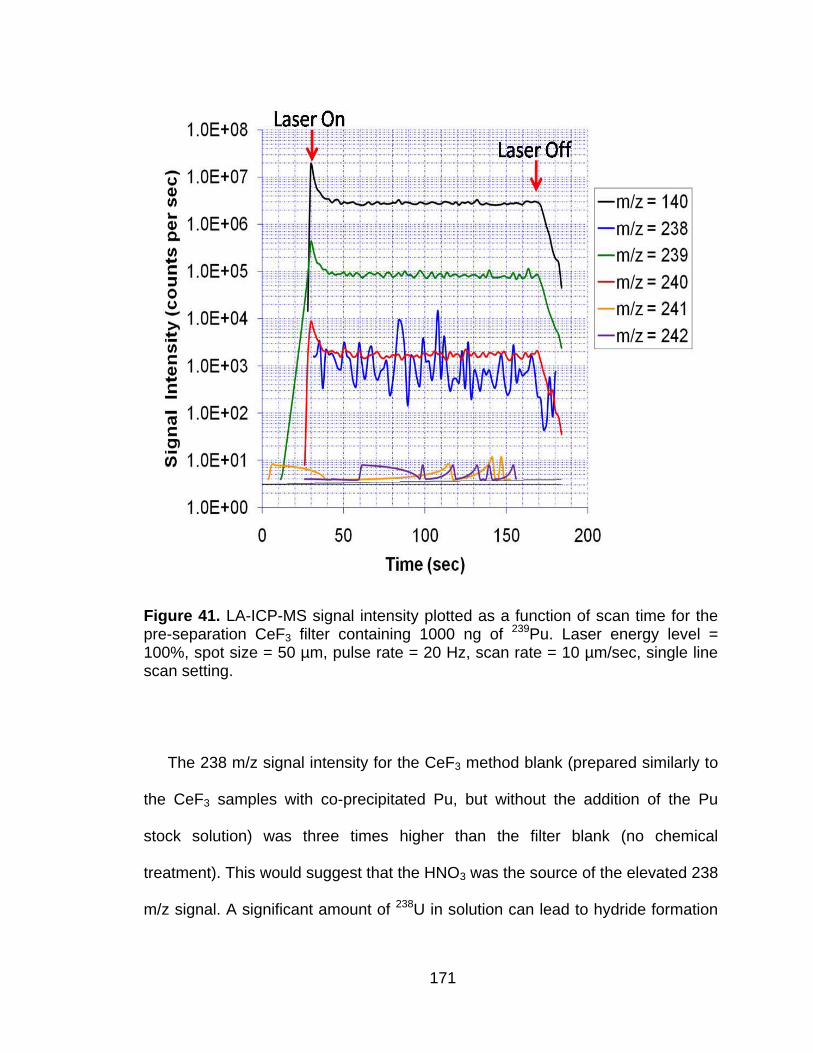
171
Figure 41. LA-ICP-MS signal intensity plotted as a function of scan time for the pre-separation CeF3 filter containing 1000 ng of 239Pu. Laser energy level = 100%, spot size = 50 µm, pulse rate = 20 Hz, scan rate = 10 µm/sec, single line scan setting.
The 238 m/z signal intensity for the CeF3 method blank (prepared similarly to
the CeF3 samples with co-precipitated Pu, but without the addition of the Pu
stock solution) was three times higher than the filter blank (no chemical
treatment). This would suggest that the HNO3 was the source of the elevated 238
m/z signal. A significant amount of 238U in solution can lead to hydride formation
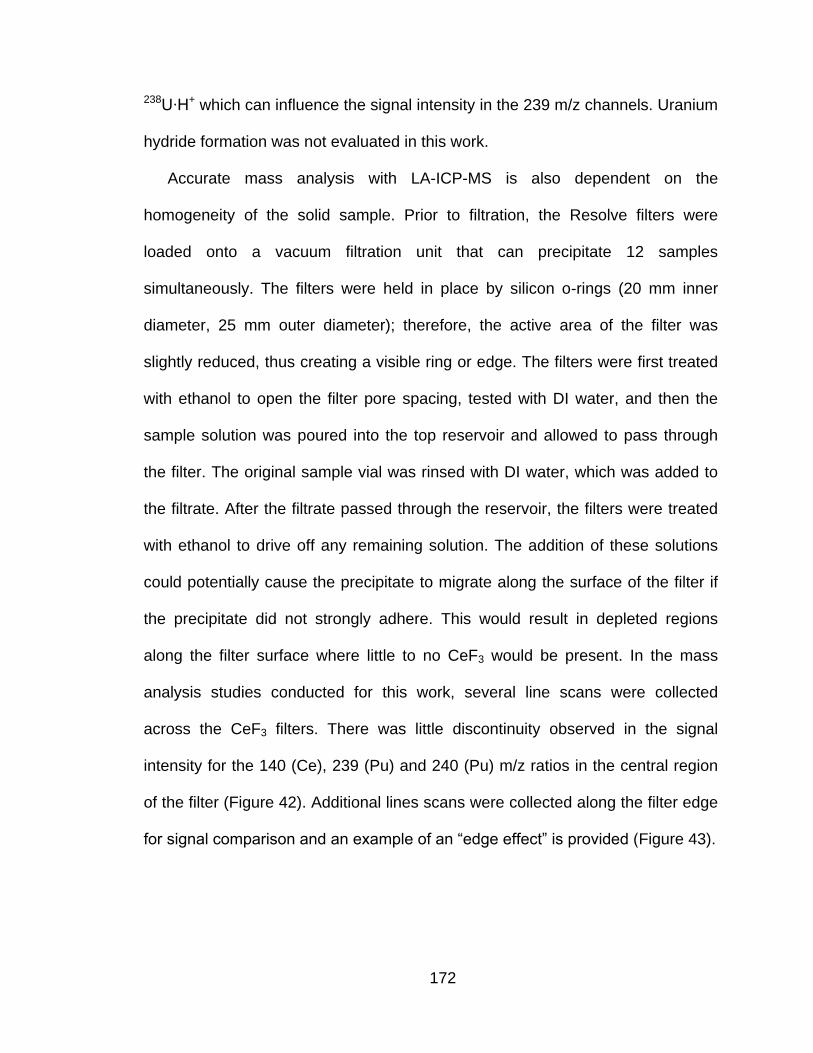
172
238U∙H+ which can influence the signal intensity in the 239 m/z channels. Uranium
hydride formation was not evaluated in this work.
Accurate mass analysis with LA-ICP-MS is also dependent on the
homogeneity of the solid sample. Prior to filtration, the Resolve filters were
loaded onto a vacuum filtration unit that can precipitate 12 samples
simultaneously. The filters were held in place by silicon o-rings (20 mm inner
diameter, 25 mm outer diameter); therefore, the active area of the filter was
slightly reduced, thus creating a visible ring or edge. The filters were first treated
with ethanol to open the filter pore spacing, tested with DI water, and then the
sample solution was poured into the top reservoir and allowed to pass through
the filter. The original sample vial was rinsed with DI water, which was added to
the filtrate. After the filtrate passed through the reservoir, the filters were treated
with ethanol to drive off any remaining solution. The addition of these solutions
could potentially cause the precipitate to migrate along the surface of the filter if
the precipitate did not strongly adhere. This would result in depleted regions
along the filter surface where little to no CeF3 would be present. In the mass
analysis studies conducted for this work, several line scans were collected
across the CeF3 filters. There was little discontinuity observed in the signal
intensity for the 140 (Ce), 239 (Pu) and 240 (Pu) m/z ratios in the central region
of the filter (Figure 42). Additional lines scans were collected along the filter edge
for signal comparison and an example of an ―edge effect‖ is provided (Figure 43).
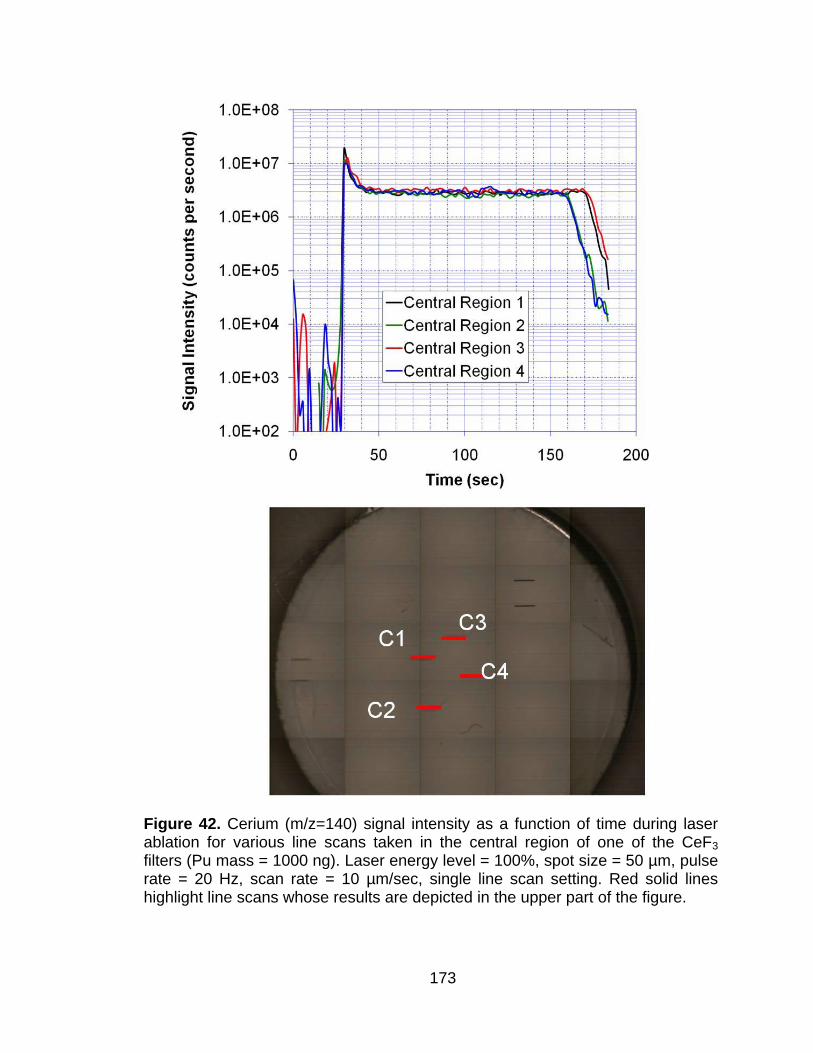
173
Figure 42. Cerium (m/z=140) signal intensity as a function of time during laser ablation for various line scans taken in the central region of one of the CeF3 filters (Pu mass = 1000 ng). Laser energy level = 100%, spot size = 50 µm, pulse rate = 20 Hz, scan rate = 10 µm/sec, single line scan setting. Red solid lines highlight line scans whose results are depicted in the upper part of the figure.
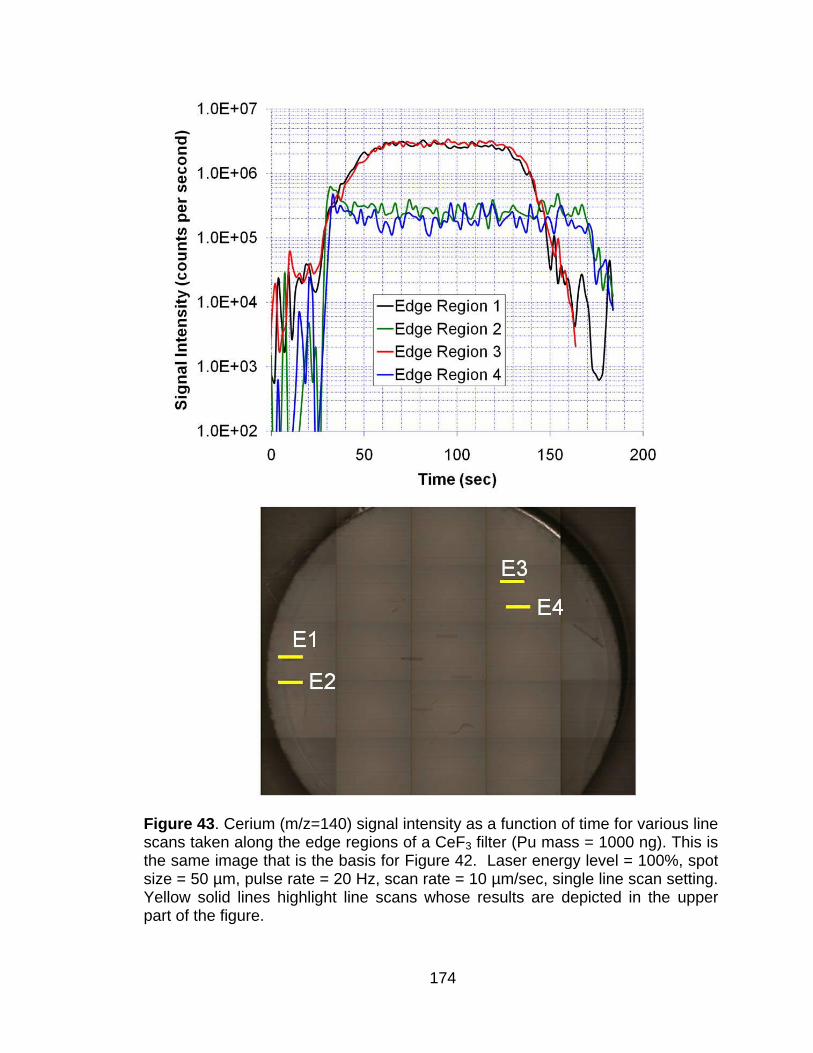
174
Figure 43. Cerium (m/z=140) signal intensity as a function of time for various line scans taken along the edge regions of a CeF3 filter (Pu mass = 1000 ng). This is the same image that is the basis for Figure 42. Laser energy level = 100%, spot size = 50 µm, pulse rate = 20 Hz, scan rate = 10 µm/sec, single line scan setting. Yellow solid lines highlight line scans whose results are depicted in the upper part of the figure.
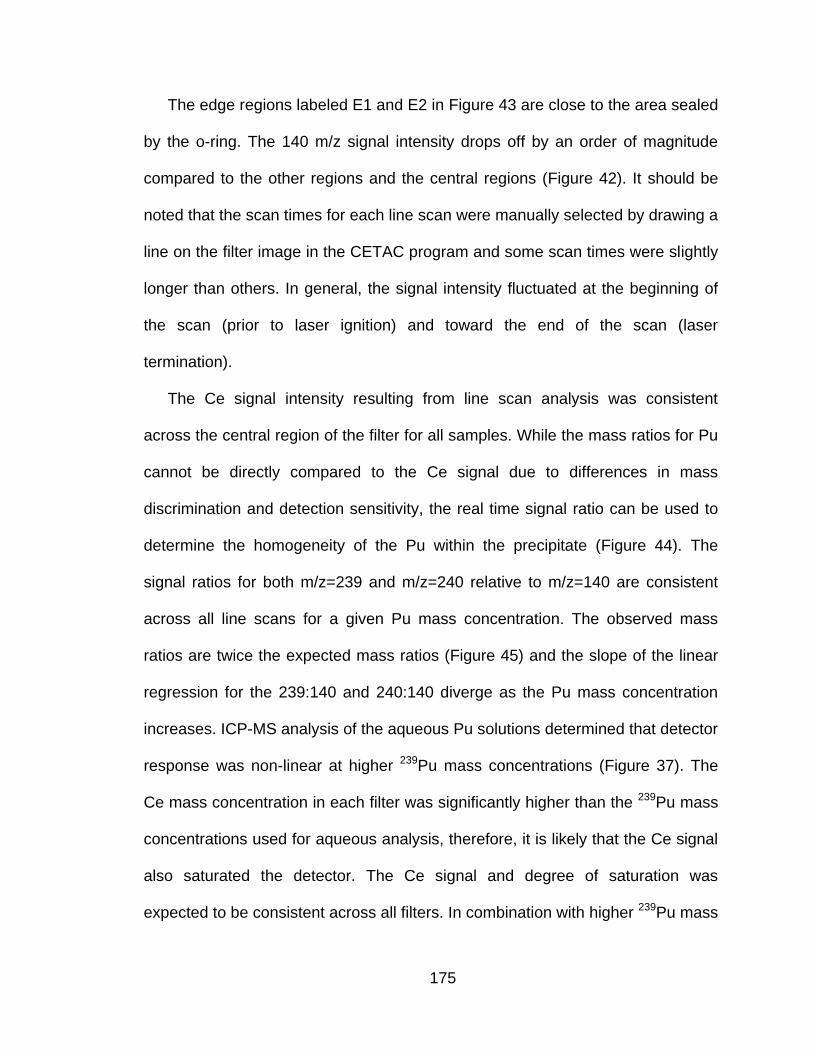
175
The edge regions labeled E1 and E2 in Figure 43 are close to the area sealed
by the o-ring. The 140 m/z signal intensity drops off by an order of magnitude
compared to the other regions and the central regions (Figure 42). It should be
noted that the scan times for each line scan were manually selected by drawing a
line on the filter image in the CETAC program and some scan times were slightly
longer than others. In general, the signal intensity fluctuated at the beginning of
the scan (prior to laser ignition) and toward the end of the scan (laser
termination).
The Ce signal intensity resulting from line scan analysis was consistent
across the central region of the filter for all samples. While the mass ratios for Pu
cannot be directly compared to the Ce signal due to differences in mass
discrimination and detection sensitivity, the real time signal ratio can be used to
determine the homogeneity of the Pu within the precipitate (Figure 44). The
signal ratios for both m/z=239 and m/z=240 relative to m/z=140 are consistent
across all line scans for a given Pu mass concentration. The observed mass
ratios are twice the expected mass ratios (Figure 45) and the slope of the linear
regression for the 239:140 and 240:140 diverge as the Pu mass concentration
increases. ICP-MS analysis of the aqueous Pu solutions determined that detector
response was non-linear at higher 239Pu mass concentrations (Figure 37). The
Ce mass concentration in each filter was significantly higher than the 239Pu mass
concentrations used for aqueous analysis, therefore, it is likely that the Ce signal
also saturated the detector. The Ce signal and degree of saturation was
expected to be consistent across all filters. In combination with higher 239Pu mass
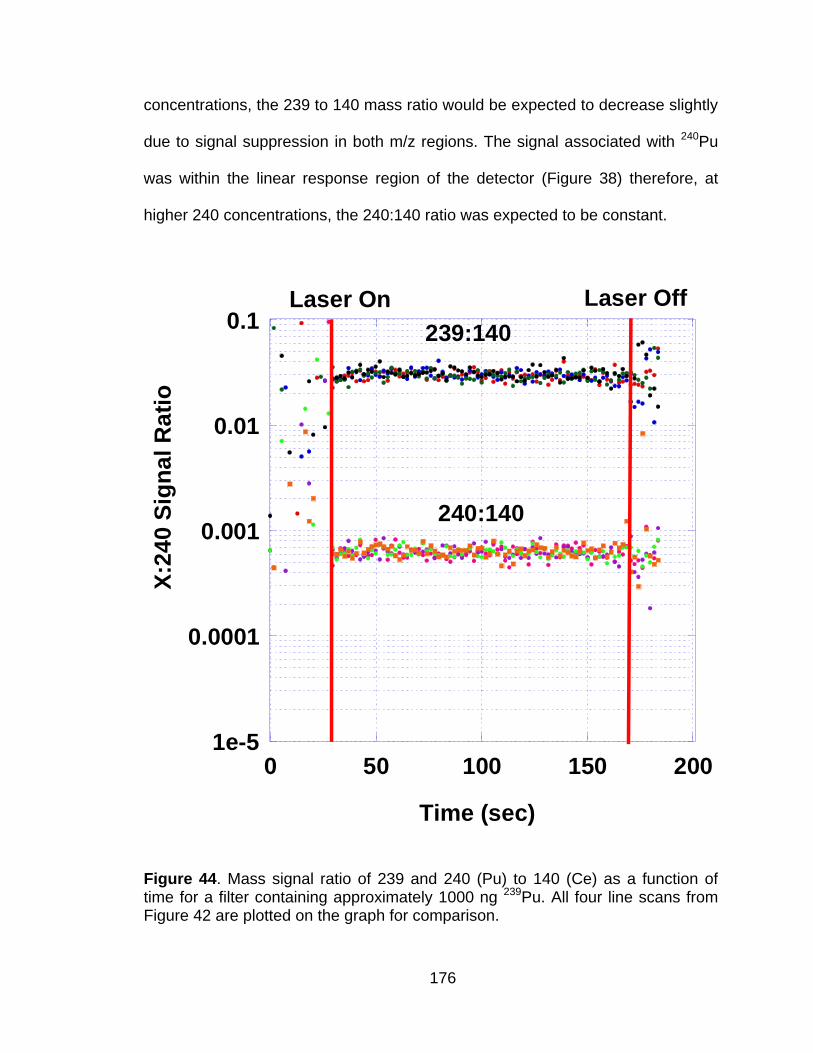
176
concentrations, the 239 to 140 mass ratio would be expected to decrease slightly
due to signal suppression in both m/z regions. The signal associated with 240Pu
was within the linear response region of the detector (Figure 38) therefore, at
higher 240 concentrations, the 240:140 ratio was expected to be constant.
1e-5
0.0001
0.001
0.01
0.1
0 50 100 150 200
X:2
40
Sig
na
l R
ati
o
Time (sec)
239:140
240:140
Laser On Laser Off
Figure 44. Mass signal ratio of 239 and 240 (Pu) to 140 (Ce) as a function of time for a filter containing approximately 1000 ng 239Pu. All four line scans from Figure 42 are plotted on the graph for comparison.
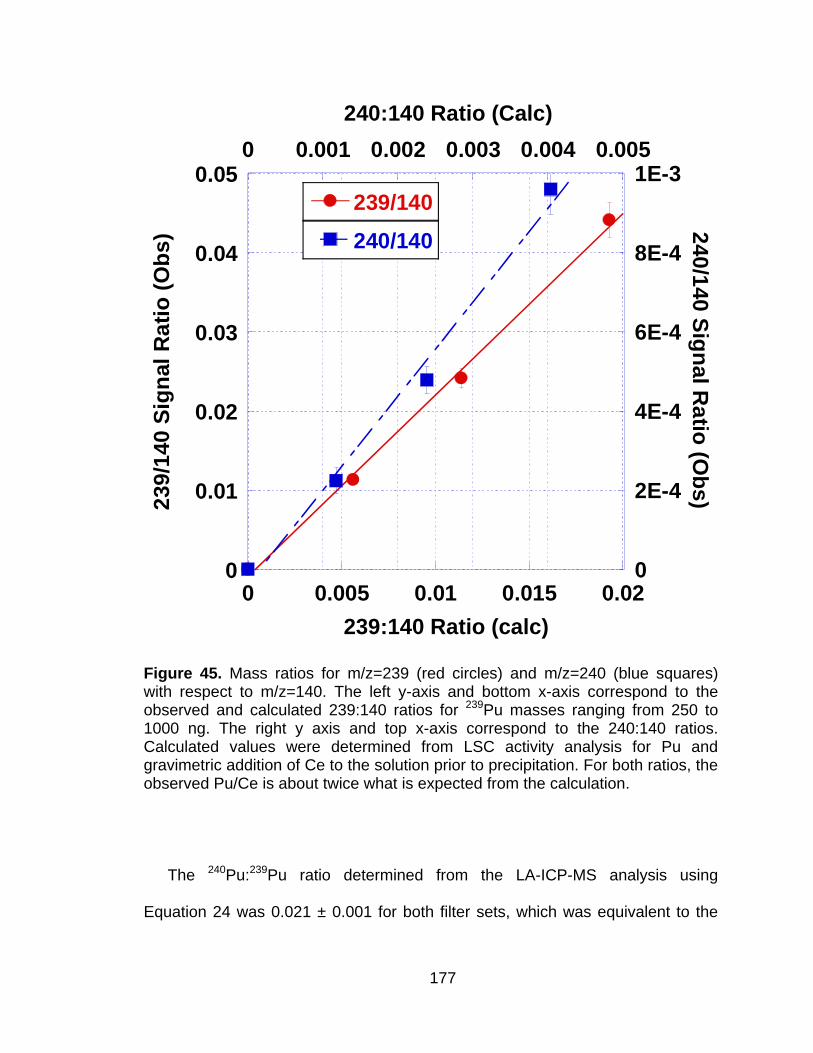
177
0
0.01
0.02
0.03
0.04
0.05
0
2E-4
4E-4
6E-4
8E-4
1E-3
0 0.005 0.01 0.015 0.02
0 0.001 0.002 0.003 0.004 0.005
239/140
240/140
239
/140
Sig
nal
Ra
tio
(O
bs
) 240
/140
Sig
nal R
atio
(Ob
s)
239:140 Ratio (calc)
240:140 Ratio (Calc)
Figure 45. Mass ratios for m/z=239 (red circles) and m/z=240 (blue squares) with respect to m/z=140. The left y-axis and bottom x-axis correspond to the observed and calculated 239:140 ratios for 239Pu masses ranging from 250 to 1000 ng. The right y axis and top x-axis correspond to the 240:140 ratios. Calculated values were determined from LSC activity analysis for Pu and gravimetric addition of Ce to the solution prior to precipitation. For both ratios, the observed Pu/Ce is about twice what is expected from the calculation.
The 240Pu:239Pu ratio determined from the LA-ICP-MS analysis using
Equation 24 was 0.021 ± 0.001 for both filter sets, which was equivalent to the
178
results of aqueous mass analysis, radiation counting, and expected values. Other
isotopic ratios were indeterminate under the current experimental conditions.
6.5 Concluding Remarks
Three methods were chosen for Pu isotopic ratio analysis of samples
prepared by CeF3 co-precipitation. The observed 238Pu activity concentration was
higher than expected using both radiometric analysis techniques and unresolved
by mass analysis under the current experimental conditions. It is possible that the
isotopic information provided with the Pu standard was incorrect for 238Pu and it
should be mentioned again that the Pu source used for this work was a NIST-
traceable 239Pu source and was not labeled as an isotopic Pu standard. Isotopic
ratios for 240:239, 238:239, 241(Am):239 were determined for the filter samples
using the combined analysis methods; when measured in duplicate by different
means, the results were in good agreement with one another except for 238:239
by mass analysis, which indicates a U contamination in the reagents. It is
suggested that in future work, these experiments be repeated with Pu isotopic
standards and ultra-pure reagents to see if the 238, 241 and 242 mass signals
can be resolved. Additionally, the preliminary data from LA-ICP-MS analysis has
shown proof-of-concept for potential mass analysis from CeF3 precipitated
samples. The homogeneity of the CeF3 precipitate across the central region of
the filter makes it a prime candidate for laser ablation analysis. The major
presence of Ce in the precipitate does not appear to affect Pu isotopic analysis,
but more studies will be required to confirm this for the minor Pu isotopes.

179
CHAPTER 7
CONCLUDING REMARKS AND REFLECTIONS ON FUTURE RESEARCH
Some of the physical and chemical parameters associated with extraction
chromatography (EC) separation procedures were investigated to facilitate the
development of an automated chemistry platform. Physical characterization
studies determined that the flow rate at a given vacuum setting was reproducible
but was affected by ionic strength and viscosity of the various load and elution
matrices. However, chemical characterization studies determined that a precisely
known flow rate was not required for high purity Pu and Am solutions using
TEVA, TRU and DGA resins. Studies conducted with solutions containing single
matrix ion contaminants at a metal ion ratio of 1(Pu or Am):106 determined that
the separation efficiency for Pu and Am was enhanced at lower flow rates on
TEVA and DGA resins, while Am separation efficiency remained insensitive to
flow rate on TRU. It was also established that variation in sample evacuation
rate, which resulted in the resin bed running dry between elution steps, had no
effect on separation efficiency. Methods that incorporate EC resins for chemistry
often recommend two separate flow rates for sample loading/elution and column
rinse, with slower flow rates for the former. In this work, it was determined that a
constant vacuum pressure setting was sufficient for Pu and Am separation.
From a platform automation perspective, the EC vacuum system is amenable
to automation. Flow rate can be reliably controlled by a digital vacuum regulator,
and precise monitoring of flow rate during chemistry is not necessary. Sample
evacuation can be monitored by an optical sensor implanted in the lid of the
180
vacuum box system. For mixed actinide samples requiring stacked resin
cartridges, the following box modifications are suggested:
Each resin type is placed in a separate cartridge tray and stacked on
the sample loading box
Each cartridge position on the resin-specific tray is permanently
numbered which would allow tracking of the sample chemistry without
having to label each individual cartridge
Each cartridge tray is removed from the sample loading box and
placed on a separate box for chemistry
Collection vials should be placed in interchangeable tray holders that
can be removed and replaced easily (in the current setup, vials are
removed individually)
Multiple vacuum box systems can be controlled by a multi-vacuum
digital regulator and single vacuum pump
A conceptual schematic of the chemistry automation platform is provided
(Figure 46). Aqueous sample and reagent delivery can be accomplished with a
robotic arm that is positioned above the platform. This initial design is not fully
automated but can increase sample throughput without risk of cross
contamination and is versatile in terms of EC method selection. The foot print of
the chemistry system (number of boxes) can be minimized with use of
interchangeable cartridge and collection vial trays so that other sample pre-
treatment steps can be added to the platform. Continued research efforts should
focus on other actinides of interest, in particular U, and fission products. It would
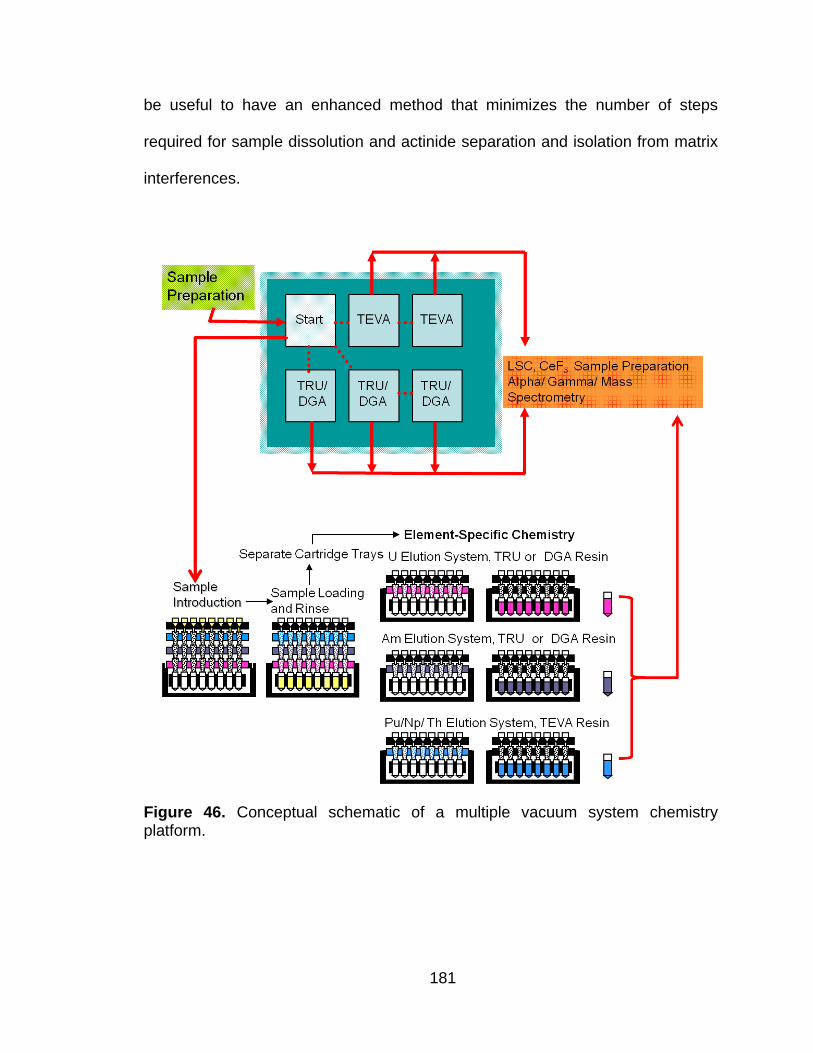
181
be useful to have an enhanced method that minimizes the number of steps
required for sample dissolution and actinide separation and isolation from matrix
interferences.
Figure 46. Conceptual schematic of a multiple vacuum system chemistry platform.
182
The EC methods evaluated were initially tested on laboratory simulated
samples of Pu and Am. While this work was important for characterizing method
efficiency, the simulated samples were not representative of real-world samples
in that several matrix ions may be present in solution along with the Pu and Am
and the concentrations of these ions may vary significantly across the samples
selected for study. In this work, real-world samples containing both Pu and Am
were obtained and chemistry was performed to determine the utility of EC
vacuum system.
The samples consisted of weapons grade Pu (WGPu) hot particles (93) that
were from an accident that occurred in 1960 involving a missile armed with a
nuclear warhead. The missile caught fire and was completed destroyed. As a
result, some of the missile debris was released into the environment where it
persisted for several decades. The original weapon composition in terms of the
relative Pu isotopic abundance was known (100,104) and this work compared the
particle composition to the source term information. Hot particle dissolution
studies along with non-destructive and minimally destructive techniques (6)
confirmed that the source term was from WGPu and the Pu isotopic abundance
agreed with the original weapon composition data. The utility of the EC system
for rapid actinide analysis of real world samples was demonstrated with this
work. Total sample analysis time from particle dissolution to sample preparation
for analysis was accomplished in less than 4 hours and analysis time was limited
by the detection method chosen and the availability of analytical instrumentation.
183
If an EC platform (Figure 46) was developed for this type of work, the sample
throughput could be increased significantly.
Additional analyses will be required to determine the U isotopic content of the
dissolved hot particles. Gamma spectrometry analysis of the intact hot particles
determined that 235U concentrations were variable in each hot particle relative to
Pu, indicating that enriched U was also present in the original source term. From
a forensic analysis perspective, the non-radioactive components of the particle
matrix are also of interest. Several key elements including Fe, Al, Pb, Ti and U
were present in the dissolved particle matrix. Many of these elements are present
in the surrounding soil matrix and therefore, it is important to determine the
environmental contribution factor. Dissolution studies should be conducted with
soils in close proximity to the isolated hot particle to determine the background
levels of the elements of interest. From analysis obtained by minimally
destructive techniques, Ga was observed in several of the hot particles (6) but
the concentration varied throughout the hot particle population. The presence of
Ga from the elemental analysis studies performed on a small subset of hot
particles in this work were inconclusive and therefore further study will be
required. Gallium is used as a stabilizer for the δ-phase Pu and is expected to be
present at 1-3 wt% in WGPu (126). It would be useful to compare the Ga
distribution throughout the particle population to determine how the release
scenario and environmental influences affect the minor constituents of the
weapon material.
184
A current accepted method for Ga analysis from Pu metal samples is to
isolate Ga from the Pu matrix by anion exchange chromatography, where
yielding is determined by isotope dilution with 69Ga. It would be useful to
determine if an additional EC resin could be added to the separation procedure
for Ga isolation and subsequent analysis. Gallium chemistry has not been
characterized with EC resins discussed in this work. The LN resin (Eichrom
Technologies, Inc.) contains the extractant bis-(2-ethylhexyl) phosphoric acid
(HDEHP). From a literature review, HDEHP has been successfully used to
isolate Ga and other activation products of interest including Co, Cu, Zn, As and
Se using liquid-liquid extraction separation techniques (127). The utility of LN
resin for nuclear forensic analysis should be explored in future work.
Preferential Am leaching from the particle matrix was supported by the hot
particle dissolution data, but cannot be confirmed under the confines of this
current work. Actinide analysis of the segmented soil cores using chemical
dissolution could further support this observation by determining the 241Am to
239Pu activity ratio in the soil surrounding the hot particle.
The acid digestion method used for hot particle dissolution (HNO3/HF/H2O2)
should be further characterized in terms of complete dissolution. Work conducted
with simulated inert matrix fuels containing various concentrations of Zr, Mg, Er,
and Pu as oxides showed that 50 to 80 wt % of the Pu was dissolved with this
method after 5 consecutive wet ashing steps (128). It would be useful to quantify
the dissolution kinetics of the hot particles to optimize the acid digestion
procedure.
185
In Chapter 6, mass and radiometric analysis methods were used to determine
Pu isotopic composition. It would be useful to continue this work with standards
produced with varied Pu isotopic compositions to determine the limitations of the
analysis procedure. Additionally, isotope dilution methods are commonly used to
determine method efficiency. It may be of interest to compare the relative isotopic
ratios determined by alpha, gamma and mass spectrometry determined in the
presence and absence of Pu tracer. The CeF3 filter samples should also be
characterized more fully in terms of Ce concentration and its affect on isotopic
analysis. Once the method is fully characterized, the Pu fractions collected during
chemistry on the dissolved hot particles should be characterized for complete
mass analysis. This sample preparation method should also be optimized for U
isotopic analysis.
In conclusion, this work has established the suitability of EC methods for the
development of an automated chemistry platform. Future work should focus on
characterizing U and other mixed actinide systems of interest for method
automation. Both laboratory simulated samples and standards, and real-world
samples (i.e. hot particles from various nuclear or radiological incidents) should
be used for EC method optimization. Laboratory simulated samples and
standards help establish the physical and chemical boundary conditions of the
method and particles establish the utility and versatility of the method for a
variety of sample matrices. Additionally, non-actinide elemental analysis should
also be optimized for forensic analysis and eventually incorporated into the
automated chemistry platform. The main focus of this work was to optimize the
186
aqueous chemistry component of the radioanalytical process. Continued
research efforts should focus on optimizing sample dissolution for automation
and how each component of the radioanalytical method (i.e. sample dissolution,
separation chemistry and sample preparation for analysis) can be interconnected
for automation.
This work was funded in part by the University of Nevada Radiochemistry
Education and Research Center and the Department of Energy under the
contract number UNLVRF-DOE-DE-FG02-05ER64123. The author would like to
acknowledge the contributions of the Radiation Safety Director and Laboratory
Manger at the Harry Reid Center for Environmental Studies, Tom O‘Dou and
Trevor Low for their due diligence in safety and laboratory management.
187
BIBLIOGRAPHY
1. Moody, K. J.; Hutcheon, I. D.; Grant, P. M. Nuclear Forensic Analysis;
CRC Press, Taylor and Francis Group: Boca Raton, FL, USA, 2005.
2. Zheltonozhskya, V.; Mück, K.; Bondarkova, M. Classification of Hot
Particles from the Chernobyl Accident and Nuclear Weapons Detonations
by Non-destructive Methods. Journal of Environmental Radioactivity 2001,
57 (No. 2), 151-166.
3. Salbu, B. Hot Particles — A Challenge within Radioecology. Journal of
Environmental Radioactivity 2001, 53, 267-268.
4. Musolino, S. V.; Harper, F. T. Emergency Response Guidance for the First
48 Hours After the Outdoor Detonation of An Explosive Radiological
Dispersal Device. Health Physics 2006, 377-385.
5. American Physical Society and the American Association for the
Advancement of Science. Nuclear Forensics - Role, State of the Art, and
Program Needs; AAAS Center for Science Technology and Security
Policy, 2008.
6. Gostic, R. C. Non-Destructive Characterization of Hot Particles from the
BOMARC Accident Site; University of Nevada Las Vegas, 2009.
7. Eriksson, M.; Osán, J.; Jernström, J.; Wegrzynek, D.; Simon, R.; Chinea-
Cano, E.; Markowicz, A.; Bamford, S.; Tamborini, G.; Török, S.;
Falkenberg, G.; Alsecz, A.; Dahlgaard, H.; Wobrauschek, P.; Streli, C.;
Zoeger, N.; Betti, M. Source Term Identification of Environmental
Radioactive Pu/U Particles by their Characterization with Non-destructive
Spectrochemical Analytical Techniques. 2005, 60 (No. 4), 455-469.
8. Jernstrom, J.; Eriksson, M.; Simon, R.; Tamborini, G.; Bildstein, O.;
Marquez, R. C.; Kehl, S. R.; Hamilton, T. F.; Ranebo, Y.; Betti, M.
Characterization and Source Term Assessments of Radioactive Particles
from Marshall Islands Using Non-destructive Analytical Techniques.
Spectrochimica Acta Part B: Atomic Spectroscopy 2006, 61 (No. 8), 971-
979.
188
9. Mayer, K.; Wallenius, M.; Fanghänel, T. Nuclear Forensic Science - From
Cradle to Maturity. Journal of Alloy and Compounds 2007, 444-445, 50-
56.
10. Maxwell III, S. L. Rapid Column Extraction Method for Actinides and 89/90Sr
in Water Samples. Journal of Radioanalytical and Nuclear Chemistry
2006, 267 (No.3), 537-543.
11. Maxwell, S. L. I. Rapid Method for Determination of Plutonium, Americium
and Curium in large soil samples. Journal of Radioanalytical and Nuclear
Chemistry 2008, 275 (No. 2), 395-402.
12. Maxwell, S. L. I. Rapid Separation Method for Emergency Water and
Urine Samples. Journal of Radioanalytical and Nuclear Chemistry 2009,
279 (No. 3), 901-907.
13. Miura, T.; Oikawa, S.; Kishimoto, T.; Banba, S.; Morimoto, T. Rapid
Separation of Plutonium in Environmental Samples Using an Anion
Exchange Resin Disk. Journal of Radioanalytical and Nuclear Chemistry
2001, 250 (No. 3).
14. Varga, Z.; Surányi, G.; Vajda, N.; Stefánka, Z. Rapid Sequential
Determination of Americium and Plutonium in Sediment and Soil Samples
by ICP-SFMS and Alpha Spectrometry. Radiochimica Acta 2007, 95, 81-
87.
15. Horwitz, E. P.; McAlister, D. R. Extraction Chromatography Versus
Solvent Extraction: How Similar are They? Separation Science and
Technology 2006, 41, 2163-2182.
16. Dimova, N.; Burnett, W. C.; Horwitz, E. P.; Lane-Smith, D. Automated
Measurement of 224Ra and 226Ra in Water. Applied Radiation and Isotopes
2007, 65, 428-434.
17. Egorov, O. B.; O'Hara, M. J.; Grate, J. W. Automated Radiochemical
Analysis of Total 99Tc in Aged Nuclear Waste Processing Streams.
Journal of Radioanalytical and Nuclear Chemistry 2005, 263 (No. 3), 629-
633.
189
18. Egorov, O. B.; O'Hara, M. J.; Grate, J. W. Microwave-Assisted Sample
Treatment in a Fully Automated Flow-Based Instrument: Oxidation of
Reduced Technetium Species in the Analysis of Total 99Tc in Caustic
Aged Nuclear Waste Samples. Analytical Chemistry 2004, 76 (No. 14),
3869-3877.
19. Horwitz, E. P.; McAlister, D. R.; Bond, A. H.; Barrans, R. E.; Williamson, J.
M. A Process for the Separation of 177Lu from Neutron Irradiated 176Yb
Targets. Applied Radiation and Isotopes 2005, 63, 23-36.
20. O‘Hara, M. J.; Burge, S. R.; Grate, J. W. Automated Radioanalytical
System for the Determination of 90Sr in Environmental Water Samples by
90Y Cherenkov Radiation Counting. 2008, 81 (No. 3), 1228-1237.
21. Hang, W.; Zhu, L.; Zhong, W.; Mahan, C. Separation of Actinides at Ultra-
trace Level from Urine Matrix Using Extraction Chromatography-
Inductively Coupled Plasma Mass Spectrometry. Journal of Analytical
Atomic Spectroscopy 2004, 19, 966-972.
22. Bond, A. H.; Horwitz, E. P.; Hines, J. J.; Young, J. E. A Compact
Automated Radionuclide Separation System for Nuclear Medical
Applications. Czechoslovak Journal of Physics 2003, 53 (Supplement 1),
A717-A723.
23. Nevissi, A. E.; Strebin, R. S. Automated Radiochemical Procedure for
Plutonium and Americium Measurement. Journal of Radioanalytical and
Nuclear Chemistry 1995, 197 (No. 2), 211-218.
24. Horwitz, E. P. Extraction Chromatography of Actinides and Selected
Fission Products: Principles and Achievement of Selectivity, 2008.
Eichrom. http://www.eichrom.com/products/extraction.cfm (accessed May
14, 2009).
25. Maxwell, S. L. I. Rapid Actinide Separation Methods. Radioactivity and
Radiochemistry 1997, 8 (No. 4), 36-44.
26. Tagami, K.; Uchida, U. Rapid Uranium Pre-concentration and Separation
Method from Fresh Water Samples for Total U and 235U/238U Isotope Ratio
190
Measurements by ICP-MS. Analytica Chimica Acta 2007, 592 (No. 1),
101-105.
27. Taylor, V. F.; Evans, R. D.; Cornett, R. J. Determination of 90Sr in
Contaminated Environmental Samples by Tuneable Bandpass Dynamic
Reaction Cell ICP–MS. Analytical and Bioanalytical Chemistry 2007, 387
(No. 1), 343-350.
28. Ayranov, M.; Krähenbühl, U.; Sahli, H.; Röllin, S.; Burger, M.
Radiochemical Separation of Actinides from Environmental Samples for
Determination with DF-ICP-MS and Alpha Spectrometry. Radiochimica
Acta 2005, 93 (No. 5), 249-257.
29. Eichrom Technologies, Inc. Cerium Fluoride Microprecipitation for Alpha
Spectrometry Source Preparation of Actinides. Eichrom Methods
Compendium, SPA01, Rev 1.1.
30. Horwitz, E. P.; Chiarizia, R.; Dietz, M. L.; Diamond, H.; Nelson, D.
Separation and Pre-concentration of Actinides from Acidic Media by
Extraction Chromatography. Analytica Chemica Acta 1993, 537-543.
31. Horwitz, E. P.; McAlister, D. R.; Bond, A. H.; Barrans, R. E. Novel
Extraction of Chromatographic Resins Based on Tetraalkyldiglycolamides:
Characterization and Potential Applications. Solvent Extraction and Ion
Exchange 2005, 23 (No. 3), 319-344.
32. Mark L. Dietz, E. P. H. a. A. H. B. Extraction Chromatography: Progress
and Opportunities. Symposium Proceedings: Progress in Metal Ion
Separation and Pre-concentration, 1997.
33. Braun, T.; Ghersini, G.; Katykhin, G. S. Extraction Chromatography;
Elsevier, 1975; Vol. No. 2.
34. Horwitz, E. P.; Dietz, M. L.; Chiarizia, R.; Diamond, H.; Maxell, I. S. L.;
Nelson, M. R. Separation and Pre-concentration of Actinides by Extraction
Chromatography Using a Supported Liquid Anion Exchanger: Application
to the Characterization of High-Level Nuclear Waste Solutions. Analytica
Chimica Acta 1995, 310, 63-78.
191
35. Krane, K. S. Introductory Nuclear Physics; John Wiley and Sons, Inc.,
1998.
36. Sill, C. W.; Williams, R. L. Preparation of Actinides for Alpha Spectrometry
without Electrodeposition. Analytical Chemistry 1981, 53, 412-415.
37. Sill, C. W. Precipitation of Actinides as Fluorides or Hydroxides for High-
Resolution Alpha Spectrometry. Nuclear and Chemical Waste
Management 1987, 7, 201-215.
38. Molycorp, Inc. Cerium: A Guide to its Role in Chemical Technology;
Molycorp, Inc.: Mountain Pass, CA, 1992.
39. Knoll, G. F. Radiation Detection and Measurement, 3rd Edition; John Wiley
and Sons: New York, NY, 2000.
40. L'Annunziata, M. F. Handbook of Radioactivity Analysis; Academic Press:
San Diego, 2003.
41. Floeckher, J. High Throughput Screening of Samples Containing Alpha
and Beta Radionuclides: An Overview of Methods. Packard Instrument
Company, 1992. Alpha Beta Application Note.
42. Thomson, J. Quench and Quench Curves. Karlsruhe, Germany, 2001; pp
65-73.
43. Robinson, J. W.; Frame, G. M.; Skelly-Frame, E. M. Undergraduate
Instrumental Analysis; CRC, 2004.
44. Skoog, D. A.; Holler, F. J.; Crouch, S. R. Principles of Instrumental
Analysis; Brooks Cole, 2006.
45. Tanner, S. D.; Baranov, V. I. Theory, Design, and Operation of a Dynamic
Reaction Cell for ICP-MS. Atomic Spectroscopy 1999, 20 (No. 2), 45-52.
46. Stricklin, D. L.; Tjärnhage, Å.; Nygren, U. Application of Low Energy
Gamma-Spectrometry in Rapid Actinide Analysis for Emergency
Preparedness. Journal of Radioanalytical and Nuclear Chemistry 2002,
251 (No. 1), 69–74.
47. Peterson, D. S.; Plionis, A. A.; Gonzales, E. R. Optimization of Extraction
Chromatography Separations of Trace Levels of Actinides with ICP-MS
Detection. Journal of Separation Science 2007, 30, 1575-1582.

192
48. Varga, Z.; Surányi, G.; Vajda, N.; Stefánka, Z. Improved Sample
Preparation Method for Environmental Plutonium Analysis by ICP-SFMS
and Alpha Spectrometry. 2007, 274 (No. 1), 87–94.
49. Tavčar, P.; Jakopič, R.; Benedik, L. Sequential Determination of 241Am,
237Np, Pu Radioisotopes and 90Sr in Soil and Sediment Samples. Acta
Chimica Slovenica 2005, 52, 60-66.
50. Spry, N.; Parry, S.; Jerome, S. The Development of a Sequential Method
for the Determination of Actinides and 90Sr in Power Station Effluent Using
Extraction Chromatography. Applied Radiation and Isotopes 2000, 163-
171.
51. Horwitz, E. P.; Delphin, W. H.; Bloomquist, C. A. A.; Vandegrift, G. F.
Radiochemical and Isotope Separations by High-Efficiency Liquid-Liquid
Chromatography. Journal of Chromatography 1976, 125, 203-218.
52. Jiménez-Ramos, M. C.; García-Tenorio, R.; Vioque, I.; Manjón, G.;
García-León, M. Presence of Plutonium Contamination in Soils from
Palomares (Spain). Environmental Pollution 2006, 142 (No. 3), 487-492.
53. Boulyga, S. F.; Becker, J. S. Determination of Uranium Isotopic
Composition and 236U Content of Soil Samples and Hot Particles Using
Inductively Coupled Plasma Mass Spectrometry. Fresenius' Journal of
Analytical Chemistry 2001, 370 (No. 5), 612-617.
54. Sandalls, F. J.; Segal, M. G.; Victorova, N. Hot Particles from Chernobyl:
A Review. Journal of Environmental Activity 1993, 18 (No. 1), 5-22.
55. Salbu, B.; Krekling, T. Characterization of Radioactive Particles in the
Environment. Analyst 1998, 123, 843-850.
56. Salbu, B.; Lind, O. C.; Skipperud, L. Radionuclide Speciation and its
Relevance in Environmental Impact Assessments. Journal of
Environmental Radioactivity 2004, 74 (No. 1-3), 233-242.
57. Horwitz, E. P.; Bloomquist, C. A. A. Preparation, Performance , and
Factors Affecting Band Spreading of High-Efficiency Extraction
Chromatographic Columns for Actinide Separations. Journal of Inorganic
and Nuclear Chemistry 1972, 34 (No.12), 3851-3871.
193
58. Burnett, W. C.; Corbett, D. R.; Schultz, M.; Horwitz, E. P.; Chiarizia, R.;
Dietz, M.; Thakkar, A.; Fern, M. Pre-concentration of Actinide Elements
from Soils and Large Volume Water Samples Using Extraction
Chromatography. Journal of Radioanalytical and Nuclear Chemistry 1997,
226 (No. 1 and 2), 121-127.
59. Youngman, M. A.; Dax, S. L. Solid-Phase Mannich Condensation of
Amines, Aldehydes, and Alkynes: Investigation of Diverse Aldehyde
Inputs. Journal of Combinatorial Chemistry 2001, 3 (No. 5), 469-472.
60. Vaccaro, H. A.; Zhao, Z.; Clader, J.; Song, L.; Terracina, G.; Zhang, L.;
Pissarnitski, D. Solution-Phase Parallel Synthesis of Carbamates as γ-
Secretase Inhibitors. Journal of Combinatorial Chemsitry 2008, 10 (No. 1),
56-62.
61. J-Kem Scientific, Inc. Digital Vacuum Regulator User's Manual Model 200.
62. Hill, S. J. Inductively coupled plasma spectrometry and its applications;
CRC Press, 1999.
63. McIsaac, L. D.; Baker, J. D. The Extraction of Zirconium from Nitric Acid
by Di-hexyl N, N-Diethylcarbamoylphosphonate. Solvent Extraction and
Ion Exchange 1983, 1 (No. 1), 27-41.
64. Alcock, K.; Bedford, F. C.; Hardwick, W. H.; McKay, H. A. C. Tri-N-Butyl
Phosphate as an Extracting Solvent for Inorganic Nitrates: Zirconium
nitrate. Journal of Inorganic and Nuclear Chemistry 1957, 4 (No. 2), 100-
105.
65. Mathur, J. N.; Murali, M. S.; Natarajan, P. R.; Badheka, L. P.; Banerji, A.
Extraction of Actinides and Fission Products by Octyl(phenyl)-N,N-
Diisobutylcarbamoylmethyl-Phosphine Oxide from Nitric Acid Media.
Talanta 1992, 39 (No. 5), 493-496.
66. Zhang, A.; Wei, Y.; Kumagai, M. Properties and Mechanism of
Molybdenum and Zirconium Adsorption by a Macroporous Silica-Based
Extraction Resin in the MAREC Process. Solvent Extraction and Ion
Exchange, 2003, 21 (No. 4), 591-611.
194
67. Fujii, T.; Yamana, H.; Watanabe, M.; Moriyama, H. Extraction Study for
TRUEX Process Using Short-Lived Radionuclides Prodcued by Neutorn
Irradiation of Uranium. Solvent Extraction and Ion Exchange 2002, 20
(No.2), 151-175.
68. Brewer, K. N.; Herbst, R. S.; Todd, T. A.; Christian, J. D. Zirconium
Extraction into Octyl(phenyl)-N,N-Diisobutylcarbamoylmethylphosphine
Oxide and Tributyl Phosphate. Solvent Extraction and Ion Exchange 1998,
16 (No. 4), 1047-1066.
69. Horwitz, E. P.; Kalina, D. C.; Diamond, H.; Vandegrift, G. F.; Schulz, W.
W. The TRUEX Process- A Process for the Extraction of the Transuranic
Elements from Nitric Acid Wastes Utilizing Modified PUREX Solvent.
Solvent Extraction and Ion Exchange 1985, 3 (No. 1), 75-109.
70. Horwitz, E. P.; Kalina, D. G.; Kaplan, L.; Mason, G. W.; Diamond, H.
Selected Alkyl(phenyl)-N,N-Dialkylcarbamoylmethylphosphine Oxides as
Extractants for Am(III) from Nitric Acid. Separation Science and
Technology 1982, 17 (No. 10), 1261-1279.
71. Van Hecke, K.; Modolo, G. Separation of Actinides from Low Level Liquid
Wastes (LLLW) by Extraction Chromatography Using Novel DMDOHEMA
and TODGA Impregnated Resins. Journal of Radioanalytical and Nuclear
Chemistry 2004, 261 (No. 2), 269-275.
72. Yaita, T.; Herlinger, A. W.; Thiyagarajan, P.; Jensen, M. P. Influence of
Extractant Aggregation on the Extraction of Trivalent f-Element Cations by
a Tetraalkyldiglycolamide. Solvent Extraction and Ion Exchange 2004, 22
(No. 4), 553-571.
73. Zhu, Z.; Sasaki, Y.; Suzuki, H.; Suzuki, S.; Kimura, T. Cumulative Study
on Solvent Extraction of Elements by N,N,N',N'-Tetraoctyl-3-
oxapentanediamide (TODGA) from Nitric Acid into N-Dodecane. Analytica
Chimica Acta 2004, 527, 163-168.
74. Sasaki, Y.; Sugo, Y.; Suzuki, S.; Tachimori, S. The Novel Extractants,
Diglycolamides, for the Extraction of Lanthanides and Actinides in HNO3-
195
n-Dodecane System. Solvent Extraction and Ion Exchange 2001, 19 (No.
1), 91-103.
75. Sasaki, Y.; Choppin, G. Extraction and Mutual Separation of Actinide(III),
(IV), (V) and (VI) Ions by N,N′-Dimethyl-N,N′-Dihexyl-3-
Oxapentanediamide and Thenoyltrifluoroacetone. Journal of
Radioanalytical and Nuclear Chemistry 2000, 246 (No. 2), 267-273.
76. Elcock, D.; Klemix, G. A.; Taboas, A. L. Establishing Remediation Levels
in Response to a Radiological Dispersal Event (or ―Dirty Bomb‖).
Environmental Science and Technology 2004, 38, 2505-2513.
77. Inn, K. G. W.; Outola, I.; Nour, S.; Kurosaki, H.; Albin, L.; Berne, A.
Radioanalytical Emergency Response Exercise. Journal of
Radioanalytical and Nuclear Chemistry 2006, 269 (No. 2), 351-360.
78. Eichrom Technologies, Inc. Americium, Neptunium, Plutonium, Thorium,
Curium, Uranium and Strontium in Water (with Vacuum Box System).
Eichrom Analytical Procedures. ACW17-VBS, Rev 1.0.
79. Clark, D. L.; Hecker, S. S.; Jarvinen, G. D.; Neu, M. P. The Chemistry of
the Actinide and Transactinide Elements, 3rd ed.; Springer: Netherlands,
2006; Vol. 2, pp 813-1264.
80. Haschke, J. M. Disproportionation of Pu (IV): A Reassessment of Kinetic
and Equilibrium Properties. Journal of Nuclear Materials 2007, 362, 60-74.
81. Coleman, G. H. The Radiochemistry of Plutonium; National Academy of
Sciences and National Research Council (U.S.), 1965.
82. Margolis, S. A.; Park, E. Stability of Ascorbic Acid in Solutions Stored in
Autosampler Vials. Clinical Chemistry 2001, 47, 1463-1464.
83. Golubitskii, G. B.; Budko, E. V.; Basova, E. M.; Kostarnoi, A. V.; Ivanov, V.
M. Stability of ascorbic acid in aqueous and aqueous-organic solutions for
quantitative determination. Journal of Analytical Chemistry 2007, 62 (No.
8), 742-747.
84. Siczek, A. A.; Steindler, M. J. Atomic Energy Review 1978, 16 (575-618).
85. Chiarizia, R.; Jensen, M. P.; Rickert, P. G.; Kolarik, Z.; Borkowski, M.;
Thiyagarajan, P. Extraction of Zirconium Nitrate by TBP in N-Octane:
196
Influence of Cation Type on Third Phase Formation According to the
―Sticky Spheres‖ Model. Langmuir 2004, 20, 10798-10808.
86. Salbu, B.; Krekling, T.; Oughton, D. H.; Østby, G.; Kashparov, V. A.;
Brand, T. L.; Day, J. P. Hot Particles in Accidental Releases from
Chernobyl and Windscale Nuclear Installations. Analyst 1994, 119 (No. 1),
125-130.
87. Sandalls, F. J.; Segal, M. G.; Victorova, N. Hot particles from Chernobyl: A
review. Journal of Environmental Radioactivity 1993, 18 (No. 1), 5-22.
88. López, J. G.; Jiménez-Ramos, M. C.; García-León, M.; García-Tenorio, R.
Characterization of Hot Particles Remaining in Soils from Palomares
(Spain) Using a Nuclear Microprobe. 2007, 260 (No. 1), 343-348.
89. Ikäheimonen, T. K.; Ilus, E.; Klemola, S.; Dahlgaard, H.; Ryan, T.;
Eriksson, M. Plutonium and Americium in the Sediments off the Thule Air
Base, Greenland. Journal of Radioanalytical and Nuclear Chemistry 2002,
252 (No. 2), 339-344.
90. Wolf, S. F.; Bates, J. K.; Buck, E. C.; Dietz, N. L.; Fortner, J. A.; Brown, N.
R. Physical and Chemical Characterization of Actinides in Soil from
Johnston Atoll. Environmental Science and Technology 1997, 31 (No. 2),
467 - 471.
91. Hu, Q. H.; Weng, J. Q.; Wang, J. S. Sources of Anthropogenic
Radionuclides in the Environment: A Review. Journal of Environmental
Radioactivity 2008 (corrected proof), 1-12.
92. Rademacher, S. E.; Hubbell, J. L. BOMARC Missile Shelters and Bunkers
Scoping Survey Workplan; United States Air Force AFIOH, 2007.
93. Defense Threat Reduction Agency (DTRA). Corrective Measures
Study/Feasibility Study for the Disposition of Metal/Concrete Debris
Radioactive Coral (above 13.5 pCi/g) Located in the Radiological Control
Area of Johnston Atoll; DTRA, 2002.
94. Jernström, J.; Eriksson, M.; Osán, J.; Tamborini, G.; Török, S.; Simon, R.;
Falkenberg, G.; Alsecz, A.; Betti, M. Non-destructive Characterization of
Low Radioactive Particles from Irish Sea Sediment by Micro X-ray
197
Synchrotron Radiation Techniques: Micro X-ray Fluorescence (µ-XRF)
and Micro X-ray Absorption Near Edge Structure (µ-XANES)
Spectroscopy. Journal of Analytical Atomic Spectrometry 2004, 19, 1428-
1433.
95. Salbu, B. Radioactive Particles Released from Different Nuclear Sources:
With Focus on Nuclear Weapons Tests. In Nuclear Risks in Central Asia;
Springer Netherlands, 2008; pp 7-17.
96. Tandon, L.; Hastings, E.; Banar, J.; Beddingfield, D.; Decker, D.; Dyke, J.;
Farr, D.; FitzPatrick, J.; Gallimore, D.; Garner, S.; Gritzo, R.; Hahn, T.;
Havrilla, G.; Johnson, B.; Kuhn, K.; LaMont, S.; Langner, D.; Lewis, C.;
Majidi, V.; Martinez, P.; McCabe, R.; Mecklenburg, S.; Mercer, D.; Meyers,
S.; Montoya, V.; Patterson, B.; Pereyra, R. A.; Porterfield, D.; Poths, J.;
Rademacher, D.; Ruggiero, C.; Schwartz, D.; Scott, M.; Spencer, K.;
Steiner, R.; Villarreal, R.; Volz, H.; Walker, L.; Wong, A.; Worley, C.
Nuclear, Chemical and Physical Characterization of Nuclear Materials.
Journal of Radioanalytical and Nuclear Chemistry 2008, 267 (No. 2), 467-
473.
97. USAF. US Air Force Nuclear Weapons Accident/Incident Report
Airmunitions Letter No. 136-11-56C; United States Air Force, 1960.
98. McCulla, W. H.; Rea, K. H.; Plannerer, H. N.; Farley, P. D. . B. W. R.;
Wenzel, W. J. BOMARC Missile Accident Site Mitigation Review; Los
Alamos National Laboratory, 1996.
99. Wallenius, M.; Lutzenkirchen, K.; Mayer, K.; Ray, I.; Aldave de las Heras,
L.; Betti, M.; Cromboom, O.; Hild, M.; Lynch, B.; Nicholl, A.; Ottmar, H.;
Rasmussen, G.; Schubert, A.; Tamborini, G.; Thiele, H.; Wagner, W.;
Walker, C.; Zuleger, E. Nuclear Forensic Investigations with a Focus on
Plutonium. Journal of Alloys and Compounds 2007, 444-445, 57-62.
100. Rademacher, S. E.; Hubbell, J. L. BOMARC Missile Shelters and Bunkers
Scoping Survey Report (Volume 1); USAF, 2008.
101. Rademacher, S. E. The Influence of Heterogeneity in Gamma
Spectroscopy Analysis of Contaminated with Weapons Grade Plutonium
198
at the BOMARC Missile Accident Site, McGuire AFB NJ; Air Force
Institute for Environment, Safety and Occupation Health Risk Analysis,
Brooks AFB, TX, 2001.
102. Hastings, T.; McKenzie-Carter, M.; Ryan, D.; Smith, J. Environmental
Impact Statement for BOMARC Missile Site, McGuire AFB, New Jersey;
Headquarters Military Airlift Command and Environmental Technology
Group, 1992.
103. Demuth, S. Pre-conceptual Design for Separation of Plutonium and
Gallium by Ion Exchange; Los Alamos National Laboratory, 1997.
104. Lee, M. H.; Clark, S. B. Activities of Pu and Am Isotopes and Isotopic
Ratios in a Soil Contaminated by Weapons-Grade Plutonium.
Environmental Science and Technology 2005, 39 (No. 15), 5512-5516.
105. Alamelu, C.; Aggarwal, S. K. Determination of 241Pu/239Pu Atom Ratio in
Pressurized Heavy Water Reactor (PHWR)-Pu Samples Using Liquid
Scintillation Counting. Journal of Alloys and Compounds 2007, 444-445,
652-655.
106. A New Approach to Quench Correction When Measuring 241Pu in the
Presence of Pu-alpha by Supported-Disc Liquid Scintillation Spectrometry.
Applied Radiation and Isotopes 1996, 47 (No. 9-10), 875-878.
107. Hrnecek, E.; Aldave de las Heras, L.; Betti, M. Application of
Microprecipitation on Membrane Filters for Alpha Spectrometry, Liquid
Scintillation Counting and Mass Spectrometric Determination of Plutonium
Isotopes. Radiochimica Acta 2002, 90, 721-725.
108. Paatero, J.; Jaakola, T.; Reponen, A. Determination of the 241Pu
Deposition in Finland After the Chernobyl Accident. Radiochimica Acta
1994, 64, 139-144.
109. Payne, R. F.; Clark, S. B.; Elliston, J. T. Radioanalytical Approach to
Determine 238Pu, 239+240Pu, 241Pu and 241Am in Soils. Journal of
Radioanalytical and Nuclear Chemistry 2008, 277 (No. 1), 269-274.
199
110. PNNL. History of the Plutonium Production Facilities at the Hanford Site
Historic District, 1943-1990; U.S. Department of Energy: Richland, WA,
2002, Pacific Northwest National Laboratory.
111. Boulyga, S. F.; Desideri, D.; Assunta Meli, M.; Testa, C.; Becker, S.
Plutonium and Americium Determination in Mosses by Laser Ablation ICP-
MS Combined with Isotope Dilution Technique. International Journal of
Mass Spectrometry 2003, 226, 329-339.
112. Aggarwal, S. K.; Shah, P. M.; Saxena, M. K. Preparation and
Characterization of 234U for Mass Spectrometry and Alpha Spectrometry.
Journal of Radioanalytical and Nuclear Chemistry 1998, 230 (No. 1-2),
307-309.
113. Ayranov, M.; Krähenbühl, U.; Sahli, H.; Röllin, S.; Burger, M.
Radiochemical Separation of Actinides from Environmental Samples for
Determination with DF-ICP-MS and Alpha Spectrometry. Radiochimica
Acta 2005, 93, 249-257.
114. Ramebäck, H.; Skĺlberg, M. Separation of Neptunium, Plutonium,
Americium and Curium from Uranium with Di-(2-ethylhexyl)-Phosphoric
Acid (HDEHP) for Radiometric and ICP-MS Analysis. Journal of
Radioanalytical and Nuclear Chemistry 1998, 235 (No. 1-2), 229-234.
115. Cizdziel, J.; Farmer, D.; Hodge, V.; Lindley, K.; Stezenback, K. 234U/238U
Isotope Ratios in Groundwater from Southern Nevada: A Comparison of
Alpha Counting and Magnetic Sector ICP-MS. Science of The Total
Environment 2005, 350 (No. 1-3), 248-260.
116. Wallenius, M.; Morgenstern, A.; Apostolidis, C.; Mayer, K. Determination
of the Age of Highly Enriched Uranium. Analytical and Bioanalytical
Chemistry 2002, 374 (No. 3), 379-384.
117. Nygren, U.; Ramebäck, H.; Nilsson, C. Age Determination of Plutonium
Using Inductively Coupled Plasma Mass Spectrometry. Journal of
Radioanalytical and Nuclear Chemistry 2007, 272 (No. 1), 45-51.
118. Varga, Z.; Suranyi, G.; Vajda, N.; Stefanka, Z. Rapid Sequential
Determination of Americium and Plutonium in Sediment and Soil Samples
200
by ICP-SFMS and Alpha Spectrometry. Radiochimica Acta 2007, 95, 81-
87.
119. Michel, H.; Ketter, M. E.; Barci-Funel, G. ICP-MS Analysis of Plutonium
Activities and 240Pu/239Pu Ratio in Alpha Spectrometry Planchet Deposits.
Journal of Radioanalytical and Nuclear Chemistry 2007, 273 (No. 2), 485-
490.
120. Becker, J. S. Inductively Coupled Plasma Mass Spectrometry (ICP-MS)
and Laser Ablation ICP-MS for Isotope Analysis of Long-Lived
Radionuclides. International Journal of Mass Spectrometry 2005, 242 (No.
2-3) 183-195.
121. Becker, J. S.; Sela, H.; Dobrowolska, J.; Zoriy, M.; Becker, J. S. Recent
Applications on Isotope Ratio Measurements by ICP-MS and LA-ICP-MS
on Biological Samples and Single Particles. International Journal of Mass
Spectrometry 2008, 270, 1-7.
122. Cizdziel, J. V.; Ketter, M. E.; Farmer, D.; Faller, S. H.; Hodge, V. F.
239,240,241Pu Fingerprinting of Plutonium in Western US Soils Using ICPMS:
Solution and Laser Ablation Measurements. Analytical and Bioanalytical
Chemistry 2008, 390 (No. 2), 521-530.
123. Thomas, R. Practical Guide to ICP-MS; Marcel Dekker, Inc.: New York,
NY, 2004.
124. Berger, M. J.; Coursey, J. S.; Zucker, M. A.; Chang, J. ESTAR, PSTAR,
and ASTAR: Computer Programs for Calculating Stopping-Power and
Range Tables for Electrons, Protons, and Helium Ions.
http://physics.nist.gov/Star (accessed Septemeber 09, 2009).
125. D'Oriano, C.; Da Pelo, S.; Poda, F.; Cioni, R. Laser-Ablation Inductively
Coupled Plasma Mass Spectrometry (LA-ICP-MS): Setting Operating
Conditions and Instrumental Performance. Periodico di Mineralogia 2008,
77 (No. 3), 65-74.
126. Conradson, S. D. Where is the Gallium? Searching the Plutonium Lattice
with XAFS. Los Alamos Science 2000, 26, 356-363.
201
127. Nayak, D.; Lahiri, S. Sequential Separation of 61Cu, 62,63Zn, 66,67,68Ga,
71,72As, and 73Se Produced by Heavy Ion Activation on Cobalt Target.
Journal of Nuclear and Radiochemical Sciences 2003, 4 (No. 1), 1-3.
128. Holliday, K. S. Zirconia-Magnesia Inert Matrix Fuel and Waste Form:
Synthesis, Characterization and Chemical Performance in an Advanced
Fuel Cycle; University of Nevada Las Vegas, 2009.
202
VITA
Graduate College University of Nevada, Las Vegas
Julie Marisa Gostic
Degrees: Bachelor of Arts, Physics, 2000 Bachelor of Arts, Biology, 2000 College of Charleston Master‘s of Science, Radiological Sciences and Protection, 2004 University of Massachusetts, Lowell Dissertation Title: Evaluation of Extraction Chromatography Resins for Rapid Actinide Analysis
Special Honors and Awards: Glenn T. Seaborg Institute, Lawrence Livermore National Laboratory,
Nuclear Forensics Summer Internship, 2008
Dissertation Examination Committee: Chairperson, Kenneth R. Czerwinski, Ph.D. Committee Member, Kenton J. Moody, Ph. D. Committee Member, Gary Cerefice, Ph. D. Graduate Faculty Representative, Ralf Sudowe, Ph. D.


![Ion-Exchange Chromatography and Its Applications...ion-exchange chromatography [1]. However ion-exchange resins used in modern chromatog‐ raphy have lower capacity than older resins](https://static.fdocuments.net/doc/165x107/5e26119c3e4346564d223bda/ion-exchange-chromatography-and-its-applications-ion-exchange-chromatography.jpg)