evaluation of electrochemical impedance techniques for detec
93
• SHRP-ID/UFR-91-524 Evaluation of Electrochemical Impedance Techniques for Detecting Corrosion on Rebar in Reinforced Concrete D.D. Macdonald, Y.A. E1-Tantawy, R.C. Rocha-Filho, M. Urquidi-Macdonald SRI Intemational Menlo Park, California Strategic Highway Research Program National Research Council Washington, DC 1994
Transcript of evaluation of electrochemical impedance techniques for detec

• SHRP-ID/UFR-91-524
Evaluation of Electrochemical ImpedanceTechniques for Detecting Corrosion on
Rebar in Reinforced Concrete
D.D. Macdonald, Y.A. E1-Tantawy,R.C. Rocha-Filho, M. Urquidi-Macdonald
SRI Intemational
Menlo Park, California
Strategic Highway Research ProgramNational Research Council
Washington, DC 1994

-¢
SHRP-ID/UFR-91-524Contract ID008Product No.: 4003
Program Manager: K. ThirumalaiProject Managers: Ataur Bacchus and Marty LaylorProduction Editor: Marsha Barrett
September 1991Reprint March 1994
key words:concrete
corrosionelectrode
impedancerebarULFACISZSCAN
Strategic Highway Research ProgramNational Academy of Sciences2101 Constitution Avenue N.W.
Washington, DC 20418
(202) 334-3774
The publication of this report does not necessarily indicate approval or endorsement of the fmdings, opinions,conclusions, or recommendations either inferred or specifically expressed herein by the National Academy ofSciences, the United States Government, or the American Association of State Highway and TransportationOfficials or its member states.
© 1994 National Academy of Sciences
50,_A.P/394
• Acknowledgments
The research described herein was supported by the Strategic Highway ResearchProgram (SHRP). SHRP is a unit of the National Research Council that was authorizedby section 128 of the Surface Transportation and Uniform Relocation Assistance Act of1987.
°°°
111

" Contents
Abstract ....................................................... xiii
Executive Summary ................................................ xv
Introduction ...................................................... 1
Experimental Studies ............................................... 7Preparation and Specification of Concrete Slabs ....................... 8Impedance Measurements ....................................... 8Counter Electrode ........................................... 11Reference Electrode .......................................... 13Concrete Conductivity Probe .................................... 13Measurement ............................................... 13
Experimental Results ......................................... 16The Impedance Function .................................. 16Impedance Characteristics of Noncorroding Rebar ............... 17Impedance Characteristics of Corroding Rebar .................. 21
Discussion ................................................. 46
Transmission Line Modeling ......................................... 53Description of the Model Used .................................. 54Model Fitting and Results Obtained ............................... 60
Measurement of Corrosion Rate ...................................... 67
Future Technology Transfer to the Field ................................ 79
References ...................................................... 80
V

List of Figures
Figure 1: Schematic of events in the corrosion of rebar inreinforced concrete ................................................ 3
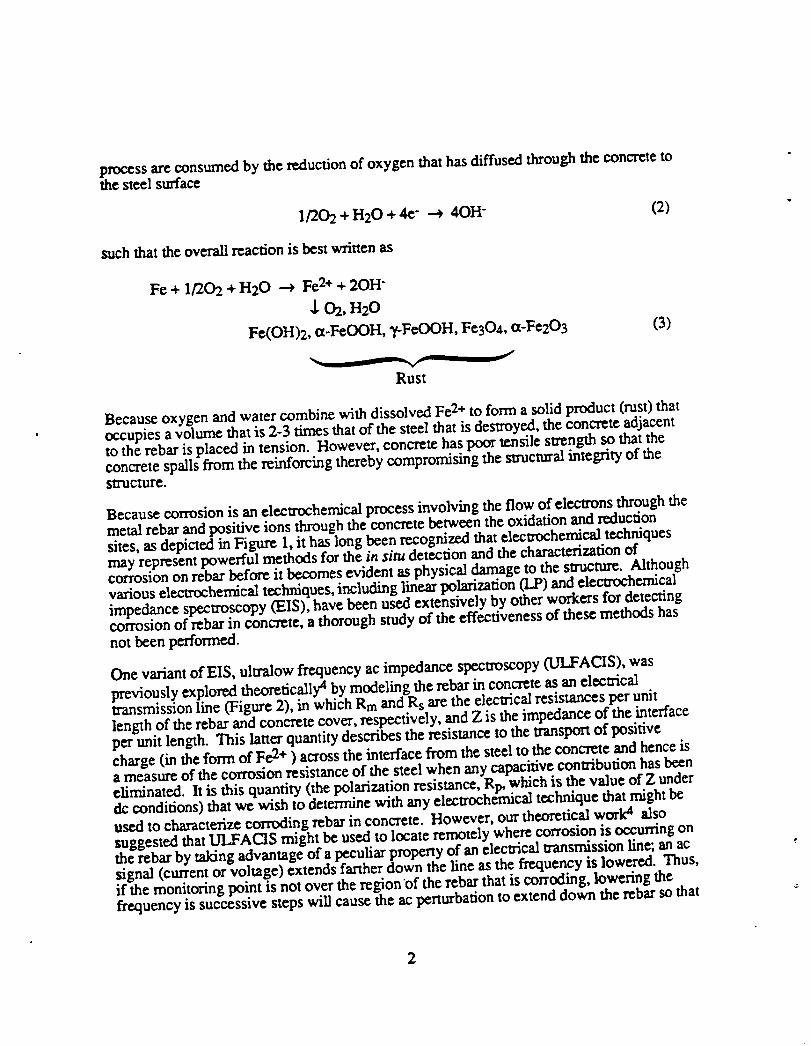
Figure 2: Discretized transmission line model for rebar in reinforced concrete ..... 4
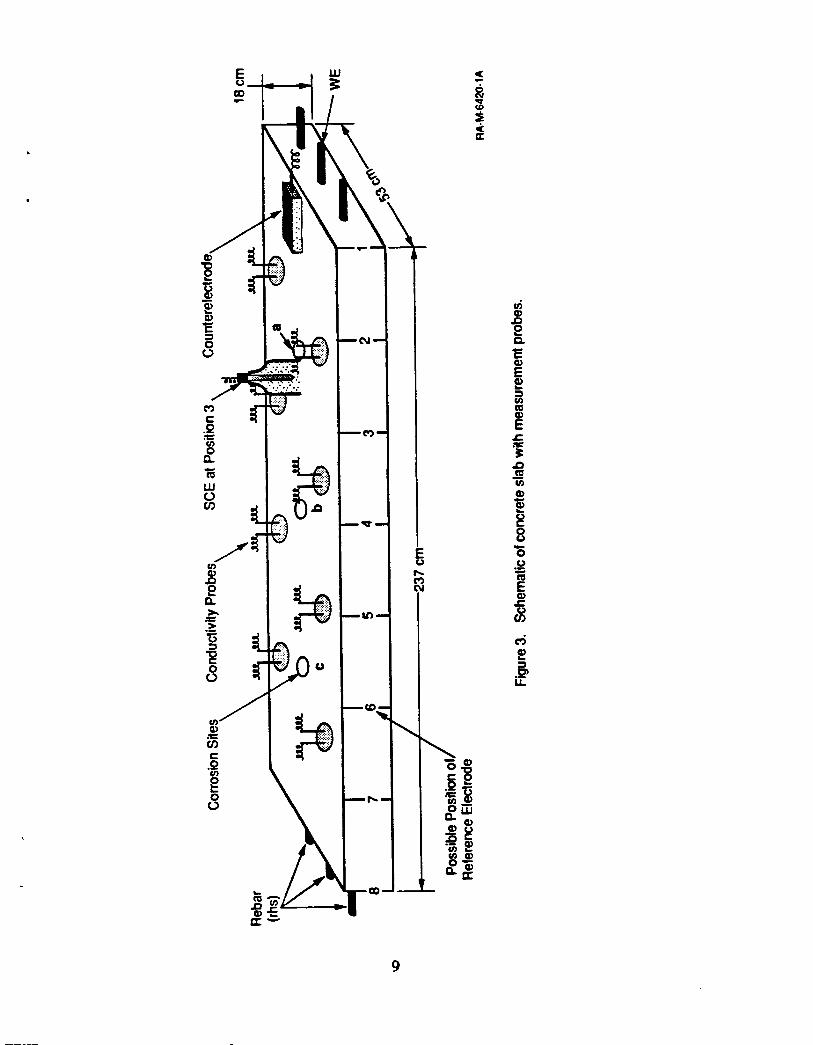
Figure 3: Schematic of concrete slab with measurement probes ................ 9
Figure 4: Schematic Nyquist and Bode plane plots of the rear/concreteimpedance showing the intercepts of the impedance locus on the real(Z') axis at limitingly high and low frequencies to yield theuncompensated resistance and interracial resistance, respectively .............. 10
Figure 5: Schematic of experimental setup for electrochemicalimpedance spectroscopy ........................................... 12
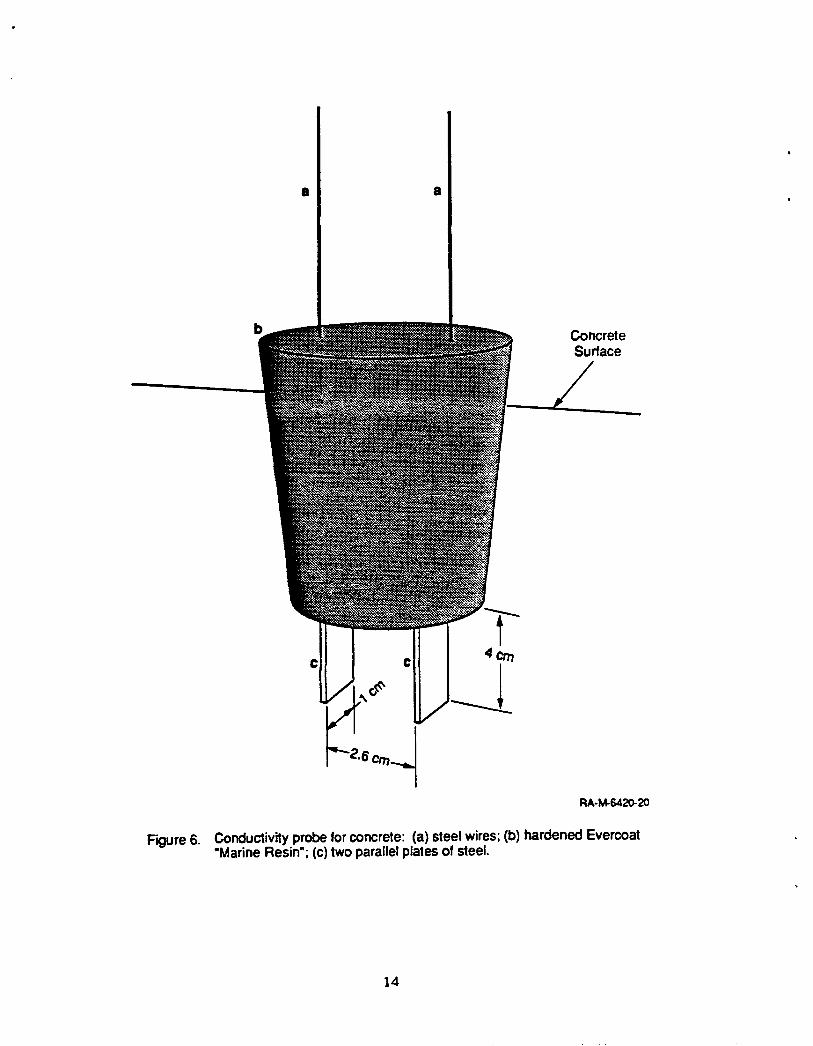
Figure 6: Conductivity probe for concrete: (a) steel wires; (b) hardenedEvercoat "Marine Resin"; (c) two parallel plates of steel .................... 14
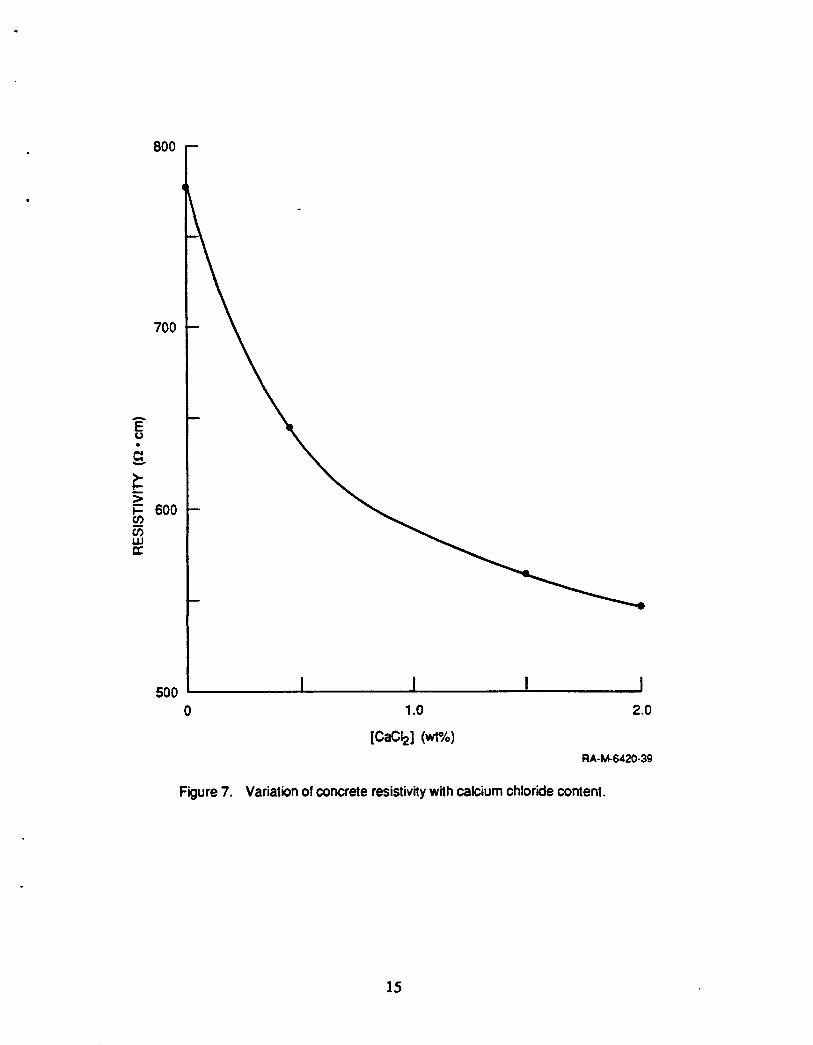
Figure 7: Variation of concrete resistivity with calcium chloride content ......... 15
Figure 8: Sample plots of noncorroding rebar in concrete for differentpositions (p) of the reference electrode, as indicated on each curve ............ 18
Figure 9: Sample plots of log (impedance modulus) versus log (frequency)for three different positions of the reference electrode, as indicatedon each curve ................................................... 19
Figure 10: Change of phase angle with position of the reference electrode fornoncorroding rebar in concrete ...................................... 22
Figure 11: Representative impedance spectra for corroding rebar in concrete (seeFigure 1), with the reference electrode located at the position indicated oneach curve ..................................................... 23
It
Figure 12: Representative plots of log (impedance modulus) versus log (frequency)for three different positions of the reference electrode, as indicated by
-, the labels on the curves ........................................... 24
vii

Figure 13: Dependence of phase angle on frequency for three different locationsof the reference electrode .......................................... 25
Figure 14: Representative impedance spectra of corroding rebar in concrete ...... 28
Figure 15: Plots of log (impedance modulus) versus log (frequency) ............ 29
Figure 16: Dependence of phase angle on log of frequency .................. 30
Figure 17: Impedance spectra of corroding rebar for the reference electrodeat the positions indicated on each curve ................................ 32
Figure 18: Plots of log (impedance modulus) versus log (frequency) ............ 34
Figure 19: Phase angle dependence on log (frequency) ..................... 35
Figure 20: Typical impedance spectrum of corroding rebar in concrete .......... 37
Figure 21: Sample plots of log (impedance modulus) versus log(frequency) for three different positions of reference electrodeas shown ...................................................... 39
Figure 22: Dependence of phase angle on log (frequency) ................... 40
Figure 23: Impedance spectra of rebar in concrete corroding at threesites (the three cavities shown in Figure 3) .............................. 42
Figure 24: Sample plots of log (impedance modulus) versus log (frequency)for three different positions of the reference electrode as shown .............. 43
Figure 25: Dependence on phase angle on log (frequency) ................... 45
Figure 26: Comparison of impedance spectra of corroded and noncorroded rebarin concrete, where reference electrode is at position 2, counter electrodeis at position 1, and [CaC12] = 0 wt% ................................. 47
Figure 27: Impedance spectra for (a) corroding rebar at mid-position 4-5,cavity b, and for (b) noncorroding rebar, for reference electrode atposition 8 ...................................................... 48
Figure 28: Impedance modulus at 0.0038 Hz as a function of the distancebetween the counter electrode and reference electrode (counter electrodeat position 1) ................................................... 49
Figure 29: Value of Bode slope as a function of reference electrode location0-, 1-, 2-, and 3- site corroding rebar .................................. 50
.o.
Vnl

Figure 30: Effect of increasing number of corrosion sites of rebar on thephase angle plots ................................................ 52
• Figure 31: Schematic transmission line model for the reinforced concreteslabs ......................................................... 55
" Figure 32: Discritized transmission line models used for the reinforcedconcrete slabs ................................................... 56
Figure 33: (a) General equivalent circuit for the rebar/concrete interfacialimpedance of each segment, where Z"Cand Z c correspond to the impedance ofnoncorroded and corroded areas, respectively, and (b) Detailed equivalentcircuits for ZSCand Z c (see text) ..................................... 57
Figure 34: Changes in the complex-plane, Bode, and phase-angle plots dueto variations in the values of R_ and R Nc,and Cc ......................... 58
Figure 35: Changes in the complex-plane, Bode, and phase-angle plots dueto variations in the values of o and 0 .................................. 59
Figure 36: Experimental (.) and theoretical (+) complex-plane, Bode, andphase-angle plots for experimental configuration .......................... 62
Figure 37: Experimental (.) and theoretical (+) complex-plane, Bode, andphase-angle plots for same experimental configuration as that for Figure 36,except reference electrode is at position 5 (see text) ....................... 63
Figure 38: Experimental (.) and theoretical (+) complex-plane, Bode, andphase-angle plots for same experimental configuration as that for Figure 36,except reference electrode is at position 8 .............................. 64
Figure 39: Electrical model for the specific interracial impedance .............. 69
Figure 40: Equivalent circuit representation of a uniform-finite transmission line ... 70
Figure 41: Equivalent circuit assumed for the concrete/rebar interface .......... 73
ix

" List of Tables
Table 1: Dependence of different parameters on the position of the referenceelectrode for noncorroded reinforcing bar in concrete ........ .............. 20
Table 2: Dependence of different parameters on the position of the referenceelectrode for one-site corroded reinforcing bar in concrete .................. 26
Table 3: Dependence of different parameters on the position of the referenceelectrode for one-site corroded reinforcing bar in concrete .................. 31
Table 4: Dependence of different parameters on the position of the referenceelectrode for one-site corroded reinforcing bar in concrete .................. 36
Table 5: Dependence of different parameters on the position of the referenceelectrode for two-site corroded reinforcing bar in concrete .................. 41
Table 6: Dependence of different parameters on the position of the referenceelectrode for three-site corroded reinforcing bar in concrete ................. 44
Table 7: Fitted values for the different parameters of the transmission linemodel used to simulate the results for experimental configurations ............ 65
Table 8: Calculated values of polarization resistance (Rp) corrosioncapacitance (Cc), and series concrete resistance (R.), as a functionof the error introduced in the value of concrete resistivity (Re) ............... 75
xi
" Abstract
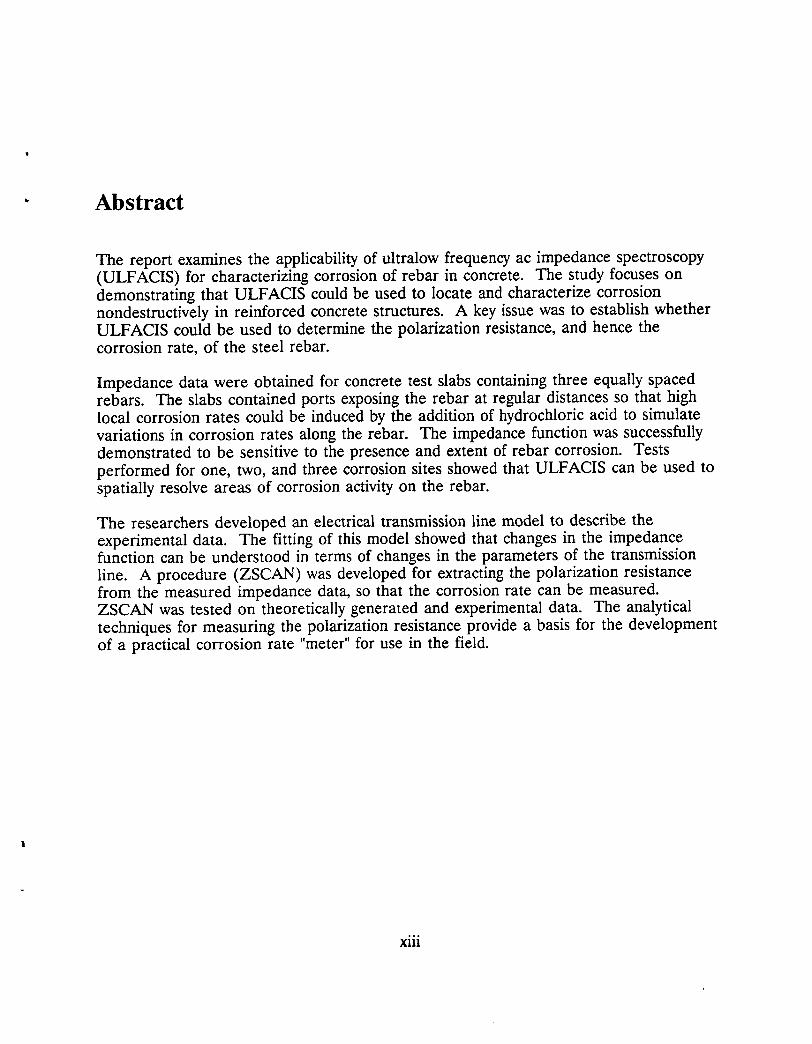
The report examines the applicability of ultralow frequency ac impedance spectroscopy(ULFACIS) for characterizing corrosion of rebar in concrete. The study focuses ondemonstrating that ULFACIS could be used to locate and characterize corrosionnondestructively in reinforced concrete structures. A key issue was to establish whetherULFACIS could be used to determine the polarization resistance, and hence thecorrosion rate, of the steel rebar.
Impedance data were obtained for concrete test slabs containing three equally spacedrebars. The slabs contained ports exposing the rebar at regular distances so that highlocal corrosion rates could be induced by the addition of hydrochloric acid to simulatevariations in corrosion rates along the rebar. The impedance function was successfullydemonstrated to be sensitive to the presence and extent of rebar corrosion. Testsperformed for one, two, and three corrosion sites showed that ULFACIS can be used tospatially resolve areas of corrosion activity on the rebar.
The researchers developed an electrical transmission line model to describe theexperimental data. The fitting of this model showed that changes in the impedancefunction can be understood in terms of changes in the parameters of the transmissionline. A procedure (ZSCAN) was developed for extracting the polarization resistancefrom the measured impedance data, so that the corrosion rate can be measured.ZSCAN was tested on theoretically generated and experimental data. The analyticaltechniques for measuring the polarization resistance provide a basis for the developmentof a practical corrosion rate "meter" for use in the field.
°*°
XlU

- Executive Summary
The corrosion of steel reinforcing bar (rebar) in concrete represents a serious threat tothe nation's infrastructural systems. This corrosion phenomenon developed rapidly afterthe widespread use of deicing salts on roads and bridges became commonplace in the1960s and 1970s, particularly in the northeastern states. A particularly importantproblem is the in situ detection of corroding rebar before damage becomes evident asspalling of concrete from the rebar, or as rust weeps from the surface. This reportexplores an electrochemical technique, ultralow frequency ac impedance spectroscopy(ULFACIS), as a means of detecting, locating, and characterizing corroding steel rebarin concrete before damage becomes evident to an observer.
ULFACIS is based on a prior theoretical study that indicated that corrosion may belocated by imposing a sinusoidal current at a monitoring point on the surface to measurethe rebar/concrete impedance (ratio of voltage to current) as a function of frequency(typically from 104 to 10"3Hz). The ability of ULFACIS to locate corrosion waspredicted on the basis that the distance traveled by the ac wave down the rebarincreases as the frequency is lowered. At some characteristic frequency, the ac waveintersects the corroding region resulting in a sudden, but perceptible change in themeasured impedance. The researchers surmised that the impedance could be used toestimate the true polarization resistance of the rebar from which the corrosion rate canbe calculated. If so, ULFACIS could prove to be a powerful in situ technique forrapidly surveying concrete structures to detect corrosion and to assess the extent ofdamage before the structural integrity is compromised.
This exploratory work accomplished the following:
• Experimentally demonstrated that the electrical impedance of the rebar/concrete system is sensitive to the presence of corrosion on rebar inreinforced concrete structures.
• Demonstrated that the electrical properties of rebar in concrete may beaccurately modeled using transmission line electrical equivalent circuitsconsisting of passive elements (resistors and capacitators). This finding isextremely important because it provides a readily manipulated model that
• can be used to calculate the distance of corroding regions from themonitoring point from the frequency of the applied ac and the propertiesof the concrete.
XV

• Confirmed the theoretical prediction that the phase angle at lowfrequencies (1.0 to 0.01 Hz) is the most sensitive indicator of the presenceof corrosion.
• Demonstrated that, by scanning the reference electrode (which is used todetect the alternating voltage) across the surface, ULFACIS can be used tospatially resolve areas of corrosion activity on rebar and hence can formthe basis of a practical method of surveying corrosion damage to concretestructures.
• Developed a procedure (ZSCAN) for extracting the corrosion rate of therebar from measured impedance data. This procedure circumvents thehitherto unresolved problem for electrochemical techniques of the areabeing sampled depending on the frequency of the electrical perturbation orthe time at which the response is probed.
Although this work was exploratory, in keeping with the philosophy of the IDEAProgram, it has demonstrated the feasibility of practical techniques for the in situlocating and characterizing of corrosion on rebar ULFACIS), and for estimating rebarcorrosion rate (using ZSCAN) in concrete structures before damage becomes externallyevident. The development and field-testing of practical corrosion surveying instrumentsbased on the exploratory work described herein will be carried out in Phase II.
xvi

1
INTRODUCTION
The corrosion of steel reinforcing bar in concrete represents a serious threat to the nation'sinfrastructural systems. I'3 This corrosion phenomenon developed rapidly after the use ofdeicing salt, particularly on roads and highways in the northeast, became commonplace inthe 1960s and 1970s. Furthermore, the use of calcium chloride (C.aCl2) to accelerate thesetting of portland cement in cold climates guarantees the presence of chloride ion innumerous concrete structures, including bridges, roads, buildings, and canals. Thefundamental cause of corrosion of rebar, which may eventually cost several tens of billionsof dollars in this county, has been shown in numerous laboratory studies and fieldinvestigations to be chloride-induced depassivation of steel.
The work reported here was carded out to assess the ability of electrochemical techniquesto detect corrosion on reinforcing bar (rebar) in concrete. Electrochemical techniques arebeing explored for this purpose in various laboratories, because of their unique abilities todetect metal oxidation processes remotely by using relatively simple equipment andanalytical techniques. Their abilities in this regard arise from the fact that corrosion is anelecn'ochemical oxidation process in which iron metal is convened into corrosion products(rust)
Fe --->Fe2+ + 2e-
_-_O> Fe(OH)2, et-FeOOH, ?-FeOOH, Fe304, ct-Fe203 (1)
. which is represented here by ferrous hydroxide [Fe(OH)2], iron oxyhydroxides [tx-FeOOHand "y-FeOOH], magnetite [Fe304], and hematite (ct-Fe203). Under freely corrodingconditions, as exists for rebar in concrete, the electrons released in the iron-oxidation
process are consumed by the reduction of oxygen that has diffused through the concrete tothe steel surface
1/'202 + H20 + 4e" ---) 4OH- (2) "
such that the overall reaction is best written as
Fe + 1/202 + H20 --->Fe 2++ 2OH-
,l, 02,H20Fe(OH)2, ¢t-FeOOH, y-FeOOH, Fe304, ot-Fe203 (3)
Rust
Because oxygen and water combine with dissolved Fe2+ to form a solid product (rust) that• occupies a volume that is 2-3 times that of the steel that is destroyed, the concrete adjacent
to the rebut is placed in tension. However, concrete has poor tensile strength so that theconcrete spalls from the reinforcing thereby compromising the snaactm'a]integrity of thestructure.
Because corrosion is an electrochemical process involving the flow of clccmans through themetal rebut and positive ions through the concrete between the oxidation and reductionsites, as depicted in Figure I, it has long been recognized that electrochemical techniquesmay represent powerful methods for the in sin, detection and the characterization ofcorrosion on rcbar before it bex_mes evident as physical damage to the structure. Althoughvarious elecuochemical techniques, including linear polarization a2) and electrochemicalimpedance spectroscopy OEIS),have been used extensively by other workers for detectingcorrosion of rebal in conc_te, a thorough study of the effectiveness of these methods hasnot beenperformecl.
One variantofEIS,ultralowfrequencyacimpedancespectroscopy(ULFACIS),waspreviouslyexploredtheoretically'_bymodelingtherebutinconcreteasanelectricaltransmissionline(Figure2),inwhichRm andRsarctheclccu'icalresistancesperunitlengthoftherebutandconcretecover,respectively,andZ istheimpedanceoftheinterfaceperunitlength.Thislatterquantitydescribestheresistancetothetransportofposidvccharge(intheformofFc2 acrosstheinterfacefromthesteeltotheconcreteandhenceisameasureofthecorrosionresistanceofthesteelwhenanycapacitivecon_butionhasbeeneliminated.Itisthisquantity(thepolarizationresistance,Rp,whichisthevalueofZ underdc conditions) that we wish to determine with any elecn-och_mical technique that might bcused to characterize corroding rebut in concrete. However, our theoretical work a alsosuggested that ULFACIS might be used to locate remotely where corrosion is occurring ontherebarbytakingadvantageofapeculiarpropertyofanelccn,icaltransmissionline;anacsignal(currentorvoltage)extendsfartherdown thelineasthefrequencyislowered.Thus,ifthemonitoringpointisnotovertheregionoftherebutthatiscorroding,loweringthefrequency is successive steps will cause the ac perturbation to extend down the rebut so that
2

Local Porosity
CI- 0 2
. . 1.,.lJ , _+ 1
Corrosion Concrete Matrix
(a) Initiation
+0 2, CI-
Stress
o / / _.eb+rCorrosion Product
(b) Spalling
OxygenStress Reduction Stress
, \ o,-l_i_lI \d,, _ }
I Corrosion
(c) PropagationRA.32052._.46A
Figure 1. Schematic of events in the corrosion of rebar in reinforced concrete.
t9
E
rr l _ ..
"0 o
)-8
E _ _
° ), _
... Q
4
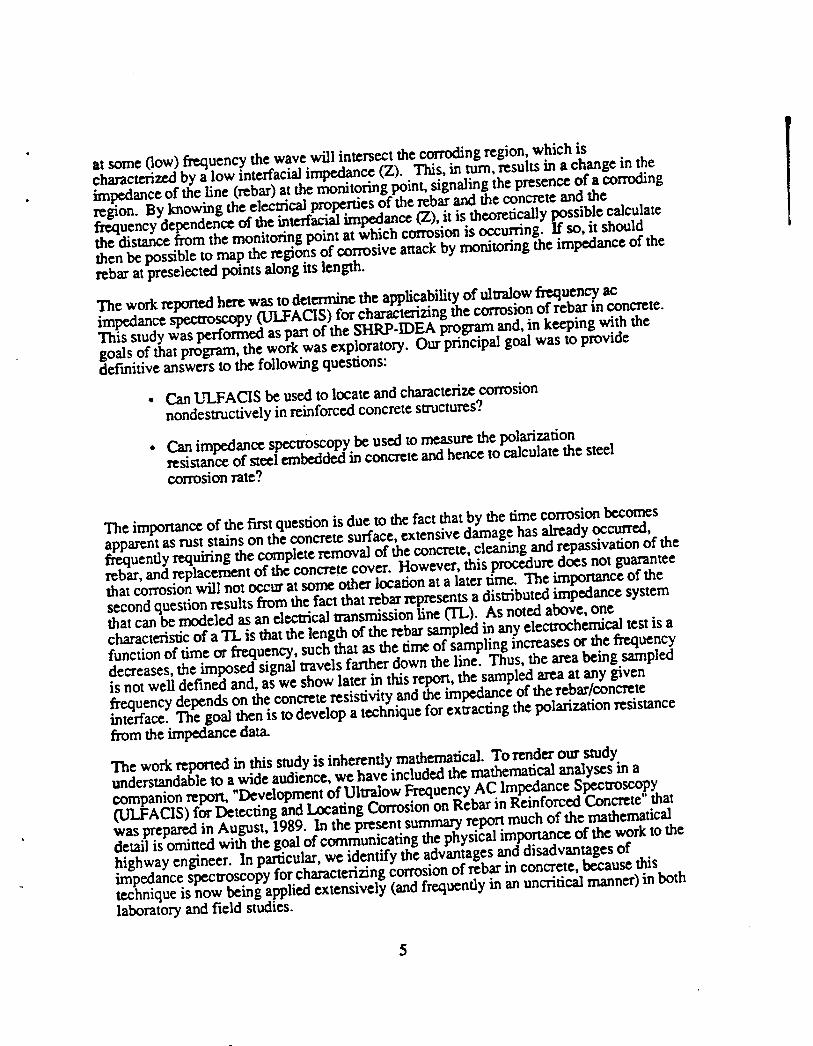
at some flow) frequency the wavewill intersect the corrodingregion,which ischaracterizedby a low interracialimpedance (Z). This, in ram,results in a change in the
• impedance of the line (rebar)at the monitoringpoint, signalingthe presenceof a corrudingregion. By knowing the electric.a]properties of the rebarand the concrete and thefrequencydependenceof the inmrfaciaIimpedance(Z), it is theoretically possible calculatethe distance from the monitoring point at which corrosionis occurring. If so, it shouldthen be possible to map the regions of corrosiveattackby monitoringthe impedance of therebarat preselectedpoints along its length.
The workreportedherewas to determinethe applicabilityof ultralowfrequency acimpedance spectroscopy(ULFACIS)for characterizingthe corrosionof rebar in concrete.This study was performedas partof the SHRP-IDEAprogramand, in keeping with thegoals of that program, the workwas exploratory. Ourprincipalgoal was to providedefinitive answersto the followingquestions:
• Can ULFACIS be used to locate and characterizecorrosionnondesmactivelyin reinforcedconcretestructures?
• Can impedancespectroscopybe used to measure the polarizationresistance of steelembeddedin concreteandhence to calculate the steelcorrosiontale?
Theimportanceofthefirstquestionisduetothefactthatbythetimecorrosionbecomesapparentasruststainsontheconcretesurface,extensivedamagehasalreadyoccurred,frequentlyrequiringthecompleteremovaloftheconcrete,cleaningandrcpassivationoftherebar,andreplacementoftheconcretecover.However,thisproceduredoesnotguaranteethatcorrosionwillnotoccuratsomeotherlocationatalatertime.Theimportanceofthesecondquestionresultsfromthefactthatrebarrepresentsadisn'ibutedimpedancesystemthatcanbemodeledasanelectricaltransmissionline(TL).Asnotedabove,onecharacteristicofaTL isthatthelengthoftherebarsampledinanyelectrochemicaltestisafunctionoftimeorfrequency,suchthatasthetirncofsamplingincreasesorthefrequencydecreases,theimposedsignaltravelsfartherdowntheline.Thus,theareabeingsampledisnotwcUdefinedand,aswe showlaterinthisreport,thesampledareaatanygivenfrequencydepends on the concreteresistivity andthe impedance of the rebar/concreteinterface. The goal then is to develop a technique for extractingthe polarization resistancefrom the impedance data.
The workreported in this studyis inherently mathematical. To render our studyunderstandable to a wide audience,we have includedthe mathematicalanalyses in acompanion report, "Developmentof UltralowFrequencyAC Impedance Spectroscopy(ULFACIS)for Detecting and Locating Corrosionon Rebar in Reinforced Concrete" thatwas preparedin August, 1989. In the present summaryreportmuchof the mathematicaldetail is ominedwith the goal of communicating thephysical importance of the workto thehighway engineer. In particular,we identify the advantages and disadvantages ofimpedance spectroscopyfor characterizingcorrosionof rebar in concrete, because thistechnique is now being appliedextensively (and frequentlyin an uncriticalmanner)in bothlaboratory and field studies.
5

Ii a,, koopiog 1We re-crop.has . --.-, ....... • ;ntended to nroduce an mstrumcm for field use.
month project was exploratory anu wa=,.v, • ¢in develo ing the necessary analytical techniques to measure.!
However, we have .succeeded.. -_-_..... ".-.. ,-_,,"of corrodin_ rcbar with far greaterthe polarization reslstance, ana nence m_ ¢:0, u_,,-,,..... , - corrosion rateprecision than has hitherto been possible. The development of a practical"meter" for use in the field is a logical and achievable extension of this work.
6

2
EXPERIMENTAL STUDIES
An importantpremiseat theoutset of this workwas that meaningfulexperimental studieson the use of ULFACISto characterizethe corrosionof rebarin concretecouldonly becarriedout using test specimens thatrealisticallysimulatecorrodingrebar in the field. Inthis regard,we consideredit importantto employacommercialconcretemix andto useactualrebar in a configurationthat is typicalof that foundin the fieldbut yet is simpleenough that a meaningfulanalysis can be made. Of particularimportancewas that the testspecimen be of sufficientdimension in the longitudinaldirectionto appear to be infinite asfaras the experimental technique (ULFACIS)wasconcerned. Accordingly,test specimenseight feet in length were prepare, in contrast to the small block specimens that arefrequently employed in laboratorystudies.
As noted in the Introduction, corrosionof rebar is due to chloride depassivation of thesteel. Chloride in the concrete originates from the use of deicing salt (NaC1)or from theadditionof calcium chloride (C.aCI2)as a settingagent. In any event, chloride levels of afew tenths of one weight percent may bepresent, and we consideredthe simulation of theselevels to bean importantaspect of ourwork. In systems in which the chloride contaminantis not uniformlydistributed,it is reasonable to expect the extentof corrosiveattack to alsobe nonuniformlydistributed.
Because the distance that an electricalperturbationsignalextendsdown a transmissionline(therebar) is a function of fr_luency, and since the impedance of the transmission line winchange moreor less abruptly when the signal encounters a regionof low interracialimpedance (high corrosion rate), it is also reasonable to expect thatULFACIS mightbeused to locate regions of high corrosionactivity on embedded rebar. This expectation was
' supportedbyarecenttheoreticalstudybyMacdonald,McKubre,andUrquidi-Macdonald,4althoughthosecalculationsindicatedthatdiscriminationbetweenthecorrodingandpassiveregionscouldonlybeachievedatverylowfrequencies(sub-millihcrtzrange).Furthermore,our initial theoretical studiesassumeda sharp demarcationbetween corroding

and noncorroding areas, whereas in real systems, these regions are more likely to be Iseparated by a "fuzzy" boundary over which the corrosion rate may change by severalorders of magnitude. To simulate this variation in corrosion rate along a rebar, weequipped our experimental slabs with ports exposing the rebut at regular distances so thathigh,localcorrosionratescouldbcinducedbytheadditionofhydrochloricacid.We thenexploredtheabilityofULFACIS tolocatetheseregionsofhighcorrosionratebymeasuringthefrequencydispersionoftheimpedanceofthesystem.
PREPARATION AND SPECIFICATION OF CONCRETE SLABS
Four specimen slabs (237 x 53 x 18 cm) simulating those of bridge decks were prepared.A standardconcretemixpreparedbyRMC, LONESTAR ofSanCarlos,California,wasemployed, and the concrete was poured into suitable wood frames that were fabricated insILrs workshop for that purpose. Each slab was prepared with a different chloridecontent, the CaCI2 contents being 0, 0.5, 1.5, and 2 weight%. Each slab contained threerebuts (type KS-,4S-INDONESIA) laid along the length and with equal spacing betweenthem (two successive rebuts being -12 cm apart). The rebuts were located midwaybetween the bouom and the top of the slab. On top of each middle bar (at equal distancealong the length of the slab), three capped cavities were created (during pouring) to enableinitiation of corrosion at various distances down the rebar (working electrode).Furthermore, eight conductivity probes fabricated from parallel stainless steel electrodeswere inserted (during pouring of the concrete) in each slab to measure concrete resisitivityat various locations over the slab. Figure 3 illustrates a concrete slab with all measurementprobes.
IMPEDANCE MEASUREMENTS
Electrochemicalimpedancemeasurementsaremade byimposingasmallamplitudesinusoidal voltage or current at the monitoring point and measuring the response sinusoidalcurrent and voltage, respectively. The amplitudes and the phase difference between the twosignals are then analyzed to yield the impedance, which is a measure of the resistance tocurrent flow in the system. Because the impedance contains both magnitude and phaseinformation it is a complex number. However, if the frequency is made sufficiently high orlow, the impedance approaches constant value which we refer to as the uncompensatedresistance (Ru) and the interracial resistance (Rint), respectively, as illustrated schematicallyin Figure 4, in which the imaginary component of the measured im.pedance is plottedagainst the real component as the frequency is changed. For corrosmn monitoringpurposes, the most important quantity is the apparem polarization resistance (Rp) given by
Rp,app - Rint" Ru (4)
which can be used to calculate the role polarization resistance (Rp) provided that anappropriate electrical model is available for the system. In this @ork, we describe theelectrical properties of rebar in concrete as an electrical wansmission line and the methoddeveloped for extracting the true polarization resistance is described in the companion
8
i= ILl .
_D "- T
- i0.
i:_ I I _- i
i
_ F..JJ_ m
9

DecreasingFrequency
N,
Flu Rint
Z"
(a)Nyquistplane
_ _. log(Ru)
log(c0) log(co)
(b) Bode planeCM-350525-29
Figure 4. SchematicNyquist and Bodeplane plots of the rear/concreteimpedanceshowingtheinterceptsof the impedancelocuson the real (Z') axis at limitinglyhighandlowfrequenciesto yieldthe uncompensatedresistanceRu and interfacialresistanceRint,respectively.
10

report. OnceRphasbeen estimated,it canbe usedin theSt_n-Geary equationto calculate• the corrosion rate.
In performingimpedance measurements,it is necessaryto impose an alternating currentatthe monitoringpoint between the specimen (rebar)and a counter elecu'ode, as noted aboveand as indicated schematically in Figure 5. However, because we are interested insampling the interracial impedanceonly it is necessaryto measure the alternatingvoltage atapoint that is as dose to the interface as possible. This measurement is made usingareferenceelectrode,which providesa constant voltage against which.thevoltage atthesensing goint may be compared. Noting that the measured voltage V and the imposedcurrent(I) are vectorquantities (i.e., they contain both magnitude and phase information)the impedance of the system is defined as
z= (s)
An in-depthdiscussionofelecm_hemicalimpedancespectroscopyiswellbeyondthescopeofthisrcporuHowever,severalexcellentreviewsarcavailable5-7inthescientificandengineeringliteratureandthereadersarereferredtothesesourcesforadditionalinformation.
Itisalsopossible(andindeedcommon)tomeasureimpedancedatabyimposinganalternatingvoltagebetweenthespecimenandthereferenceelectrodeandmonitoringtheresultantcurrentbetweenthespecimenandthecounterelectrode.Wc haveemployedbothmethodsinthisworktomeasuretheimpedanceofrebarinconcrete,butwehavefoundthat the imposed alternating current method is the best for our pro'poses. Accordingly,allimpedancemeasurements reported in this work were carried out using the imposedcurrentmethod.
The elecm:,chemicalimpedance measuring systemwas based ona frequencyresponseanalyzer (SolanronModel 1250),which is capableof generating sinusoidal voltageshavingfrequenciesof 10-5 to 6 x 10⁴Hz and amplitudes from0.01 mV to 10 V. However, thefrequency range covered in the present study was 2 x 10.4 to 104Hz. A Model 362 EG&G(PARC)scanning potentiostatoperating in the galvanostatic mode wasemployed to imposean alternatingcurrent between the rebarand thecounterelectrode. A Macintosh Plusdesktop computer coupled to a Mac 488B 1otechinterface was used to control theexperiment. Whenever needed, the current and voltage werechecked using a Keithley 171digital multimeter.
Theimpedancedataobtainedweredisplayedascomplex-plane,Bode,andphaseangleplotsusingaMacintosh11microcomputercoupledtoaprinter.
COUNTERELECTRODE
Because the measurementof one impedance specmamover the frequency range 2 x 10.4toI04Hz re,quires about 12 hours, we had to developa special counterelectzode thatensured,
11

AlternatingVoltage
Q •Reference Counter
c_ Electrode Electrode
CurrentFlow
QAlternating
CurrentCM-350525-30
Figure 5. Schematic of experimental setupforelectrochemicalimpedancespectroscopy.
12

consistent/y, a relatively long periodof reproducible electrolyticcontactwiththe concrete.After consideraMe trim and error, the required electrode evolved as a combination ot a
• suitably cut piece of graphite fabric enveloping a piece of foam rubber (5 x 7 x 15 cm)which was moistened with saturated aqueous sodium sulfate solution. Electricalconnection of this counterclectrode to the measuring device was obtained via a high densitygraphite rod partially inserted in the grapb.Jtefabric-foam assembly.
REFERENCE ELECTRODE
A commercially available saturated calomel reference electrode was employed throughoutthis study. To achieve suitable electrolytic contact with the concrete surface, the calomelelectrode was tightly fitted into a specially cut piece of foam rubber that was also moistenedwith saturated sulfate solution. The calomel-foam reference electrode was wrapped in athin plastic sheath to minimize evaporation of water.
CONCRETE CONDUCTIVITY PROBE
To determine the bulk resistivity of concrete from impedance spectral measurements, weprepared special conductivity probes. These probes (Figure 6) were essentially composedof two identical stainless steel plates, each of which was independently welded to a steelwire of suitable length. The two plates were kept fixed in a parallel configuration at adistance of 2.6 cm apart, using hardened Evercoat "Marine Resin". Figure 7 shows howthe measured resistivity varies with changing content of CaCl2 in concrete. The resistivityvalues given in Figure 3 were calculated from the real component of the impedanceextrapolated to a sufficiently high frequency that the imaginary component is effectivelyzero.
MEASUREMENTS
The length of the concrete slab was divided into seven equal segments (Figure 3), and thefollowing experiments were carried out during this research program:
(a) Duplicate impedance spectra were measured with the counterclectrodepositioned over the middle rebar (which served as the workingelectrode, WE) and with the counter electrode and the connection tothe rcbar being located at the same endof the slab (countcrelectrode atposition 1). The position of the reference electrode was then varied,according to the segment numbers depicted in Figure 3, from position2 to 8. A win] of fourteen impedame spectra were measmed for eachslab.
Co) The setofmeasurementsdescribedin(a)wererepeatedbutwiththecounterelectrodemoved totheoppositeendoftheslab(position8),i.e., the connections to the working electrode (middle rcbar) and thecounterelectr_e were at opposite ends.
13
IS IIw
b ConcreteSurface
4cnc c_
RA-M-6,420-20
Figure 6. Conductivityprobefor concrete: (a) steel wires;(b) hardened Evercoat"Marine Resin'; (c) twoparallelplatesof steel.
14
• 800 [-e
7OO
A
E
v
600_mO_u.Jrr"
soo ! I ! I0 1.0 2.0
[CaCti (_'/o)RA-M-6420-3g
Figure7. Variationof concreteresistivitywithcalciumchloridecontent.
]5
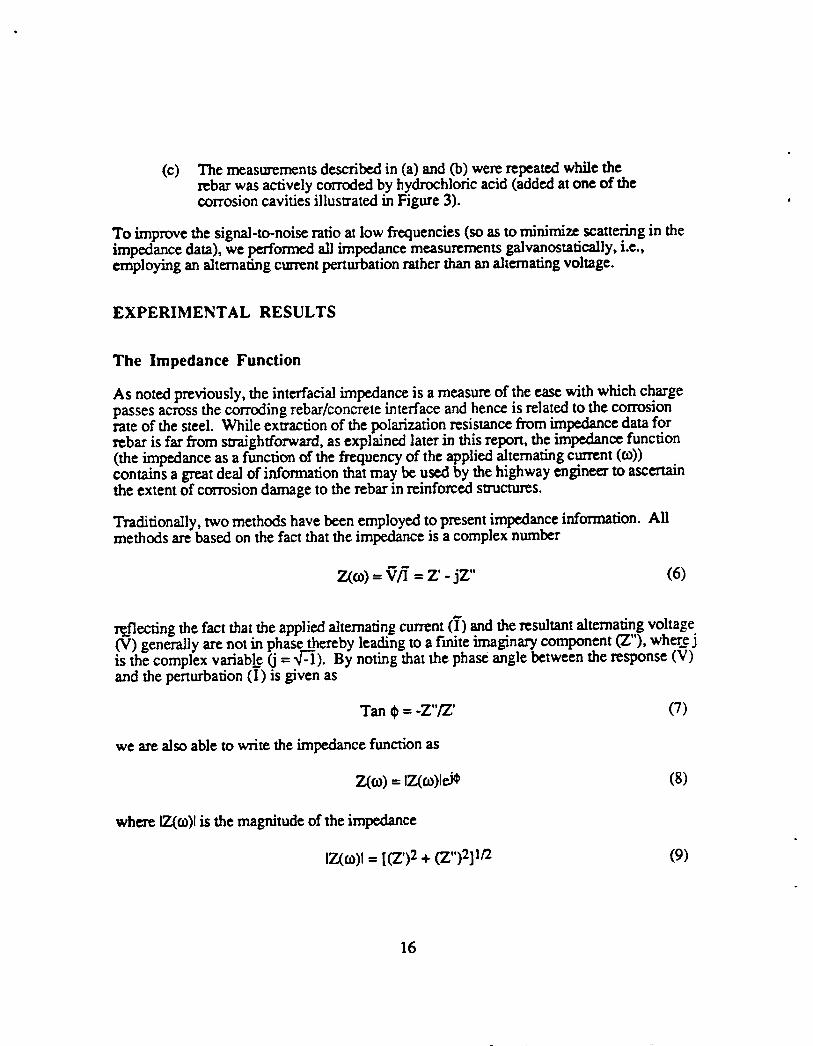
(c) The rneasurements described in (a) and (b) were repeated while therebar was actively corroded by hydrochloric acid (added at one of thecorrosion cavities illustrated in Figure 3).
To improve the signal-to-noise ratio at low frequencies (so as to minimize scattering in theimpedancedata),we performedallimpedancemeasurementsgalvanostatically,i.e.,employinganalternatingcurrentperturbationratherthananahcrnatingvoltage.
EXPERIMENTAL RESULTS
The Impedance Function
As notedpreviously,theinterracialimpedanceisameasureoftheeasewithwhichchargepassesacrossthecorrodingrebar/concrctcinterfaceandhenceisrelatedtothecorrosionram ofthesteel.Whileexn'actionofthepolarizationresistancefromimpedancedataforrebarisfarfromstraightforward,asexplainedlaterinthisreport,theimpedancefunction(theimpedanceasafunctionofthefrequencyoftheappliedahcrnatingcurrent(co))containsagreatdealofinformationthatmay beusedbythehighwayengineertoascertaintheextentofcorrosiondamagetotherebarinreinforcedsn'uctures.
Traditionally,twomethodshavebeenemployedtopresentimpedanceinformation.Allmethodsarcbasedonthefactthattheimpedanceisacomplexnumber
z(co)=_/i"=z'-jz" (6)
reflecting the fact that the applied alternating current (]') and the resultant alternating voltage(V) generally are not in phase thereby lea.ding to a finite imaginary component (Z"), where jis the complex variable (j = "_). By noting that the phase angle between the response (V)and the perturbation (I) is given as
Tan ¢ = -Z"[Z' (7)
we are also able to write the impedance function as
z(co)=tZ(co)le._ (8)
where LZ(CO)Iis the magnitude of the impedance
17_,(co)t= [(z,)2+ (Z,,)211t2 (9)
16
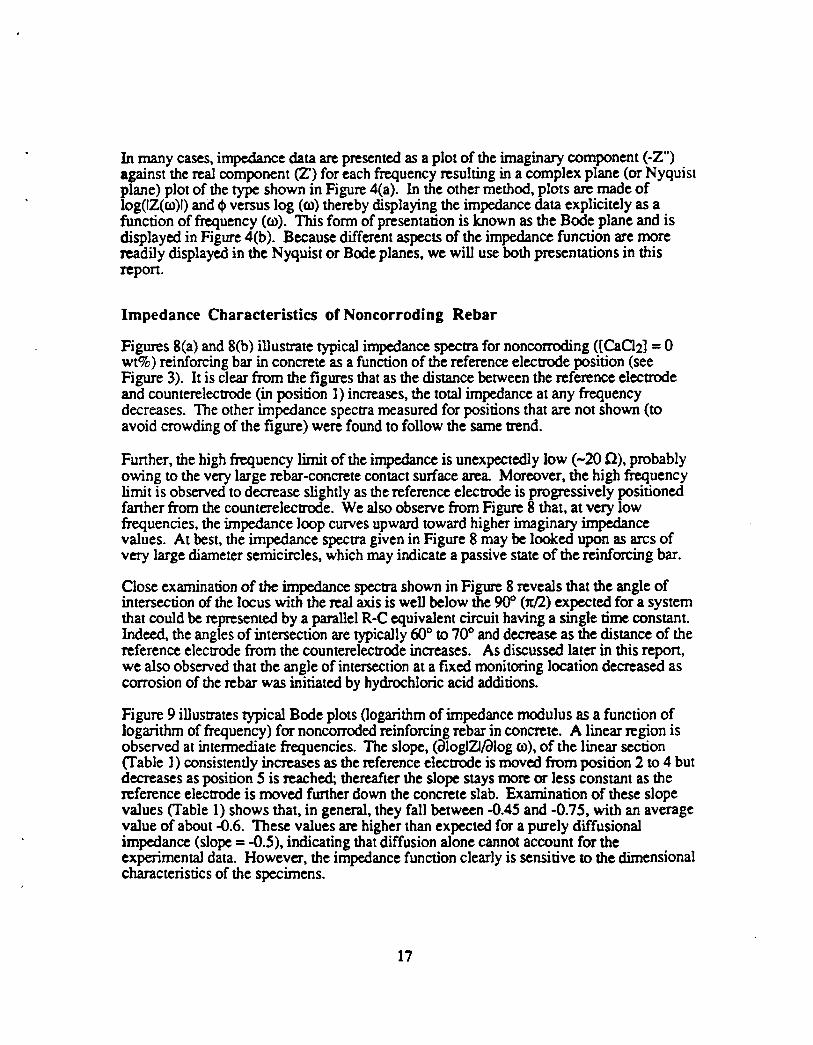
In many cases, impedance data are presented as a plot of the imaginary component (-Z")against the real component (Z') for each frequency resulting in a complex plane (or Nyquistplane) plot of the type shown in Figure 4(a). In the other method, plots are made oflog(IZ(to)l) and _ versus log (co) thereby displaying the impedance data explicitely as afunction of frequency (to). This form of presentation is known as the Bode plane and isdisplayed in Figure 4(b). Because different aspects of the impedance function are morereadily displayed in the Nyquist or Bode planes, we will use both presentations in thisreport.
Impedance Characteristics of Noncorroding Rebar
Figures 8(a) and 8(b) illustrate typical impedance spectra for noncorroding ([CaCI2] = 0wt%) reinforcing bar in concrete as a function of the reference electrode position (seeFigure 3). It is clear from the figures that as the distance between the reference electrodeand counterelectrode (in position 1) increases, the total impedance at any frequencydecreases. The other impedance spectra measured for positions that are not shown (toavoid crowding of the figure) were found to follow the same trend.
Further, the high frequency limit of the impedance is unexpectedly low (-20 f_), probablyowing to the very large rebar-concrete contact surface area. Moreover, the high frequencylimit is observed to decrease slightly as the reference electrode is progressively positionedfarther from the counterelectrode. We also observe from Figure 8 that, at very lowfrequencies, the impedance loop curves upward toward higher imaginary impedancevalues. At best, the impedance spectra given in Figure 8 may be looked upon as arcs ofvery large diameter semicircles, which may indicate a passive state of the reinforcing bar.
Close examination of the impedance specn'a shown in Figure 8 reveals that the angle ofintersection of the locus with the real axis is well below the 90° (rJ2) expected for a systemthat could be represented by a parallel R-C equivalent circuit having a single time constant.Indeed, the angles of intersection are typically 60° to 70° and decrease as the distance of thereference electrode from the counterelecu'ode increases. As discussed later in this report,we also observed that the angle of intersection at a fixed monitoring location decreased ascorrosion of the rebar was initiated by hydrochloric acid additions.
Figure 9 illustrates typical Bode plots (logarithm of impedance modulus as a function oflogarithm of frequency) for noncorroded reinforcing rebar in concrete. A linear region isobserved at intermediate frequencies. The slope, (_loglZl_log to), of the linear section(Table 1) consistently increases as the reference electrode is moved from position 2 to 4 butdecreases as position 5 is reached; thereafter the slope stays more or less constant as thereference electrode is moved further down the concrete slab. Examination of these slopevalues (Table 1) shows that, in general, they fall between -0.45 and -0.75, with an averagevalue of about -0.6. These values are higher than expected for a purely diffusionalimpedance (slope - -0.5), indicating that diffusion alone cannot account for theexperimental data. However, the impedance function clearly is sensitive to the dimensionalcharacteristics of the specimens.
17

800 -
600- 8.1_Cl_Hz J ZSXl0_Hz
400_ 2.SX10"3Hz
2000
0 200 400 Z (_) 600 800 1000
(a)
600 I'- 5.SX10"4Hz/p4 / 2.SX10"4Hz
P7
g
_1, 400
200
00 200 400 600 800 1000
z"(_)(b)
RA-1_6420-31A
Figure 8. Sample plotsof noncorrodingrebar in concrete fordifferent positions(p)of the referenceelectrode,as indicatedon each curve.
[CaCI2]= 0; counterelectrodeat position1; imposedcurrent = 50 pA;(a) Run No. 1; (b) Run No. 2.
18

3.0 P2 P3
2.5P8
f,,j
o_ 2.0.._
1.0-3 -2 -1 0 1 2
I t I=l I I I I I 1 I I-3 -2 -1 0 1 2
I:.l I I I I I I I t I I-3 -2 -1 0 1 2
log (frequency) (rad/s)RA-M-6420-32
Figure 9. Sample plots of log (impedance modulus) versus log (frequency) for threedifferentpositionsof referenceelectrode, as indicatedon eachcurve.
[CaCI2] = 0 wt%; counterelectrodeat position1; imposedcurrent= 50 p.A;Run No. 1 (noncorrodingrebar).
19
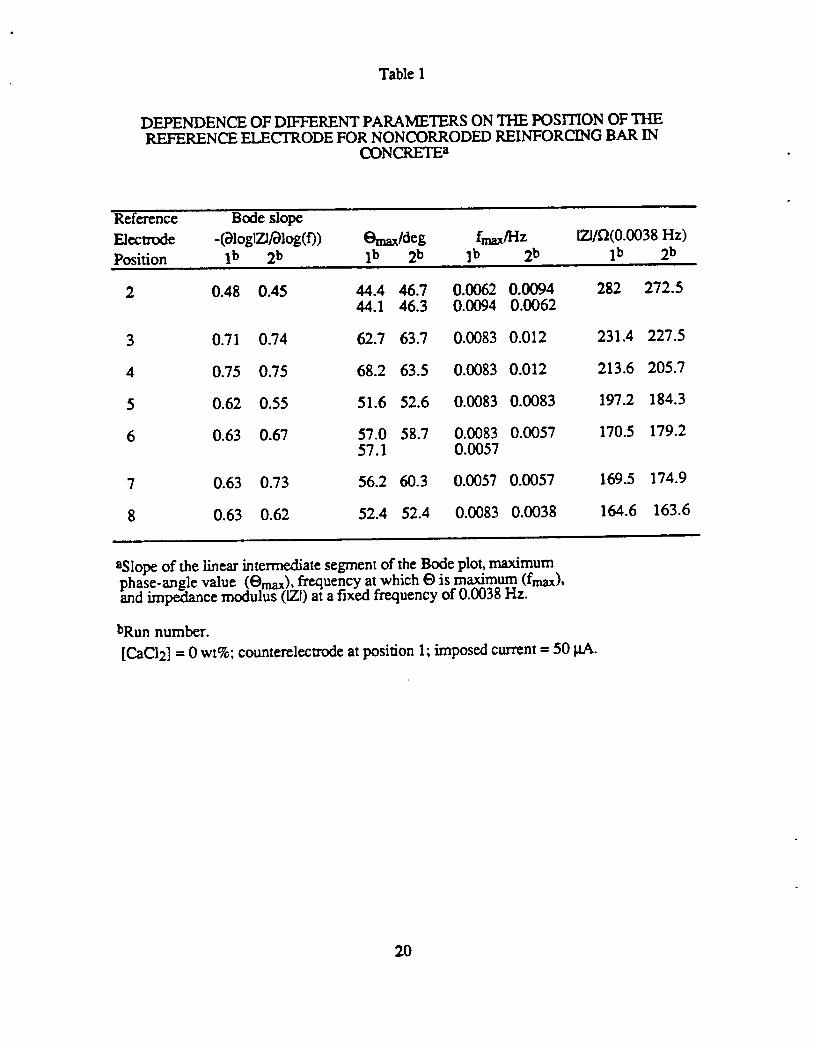
Table 1
DEPENDENCE OF DIFFERENT PARAMETERS ON THE POSITION OF THEREFERENCE ELECTRODE FOR NONCORRODED REINFORCING BAR IN
CONCRETE a
Reference Bodeslope
Electrode -(_)logl7J/Olog(f))(Bmax/dcg fmax/Hz IZJ/fl(0.0038Hz)Position Ib 2b Ib 2b Ib 2b Ib 2b
2 0.48 0.45 44.4 46.7 0.0062 0.0094 282 272.544.1 46.3 0.0094 0.0062
3 0.71 0.74 62.7 63.7 0.0083 0.012 231.4 227.5
4 0.75 0.75 68.2 63.5 0.0083 0.012 213.6 205.7
5 0.62 0.55 51.6 52.6 0.0083 0.0083 197.2 184.3
6 0.63 0.67 57.0 58.7 0.0083 0.0057 170.5 179.257.1 0.0057
7 0.63 0.73 56.2 60.3 0.0057 0.0057 169.5 174.9
8 0.63 0.62 52.4 52.4 0.0083 0.0038 164.6 163.6
aSlope of the linear intermediate segment of the Bode plot, maximumphase-angle value (emax), frequency at.which e is rnax_mum (fmax),and impedance modulus (IZI) at a nxea irequency oi u.tro:_s rtz.
bRun number.
[CaC12] = 0 wt%; counterelectrode at position 1; imposed current = 50 _A.
20
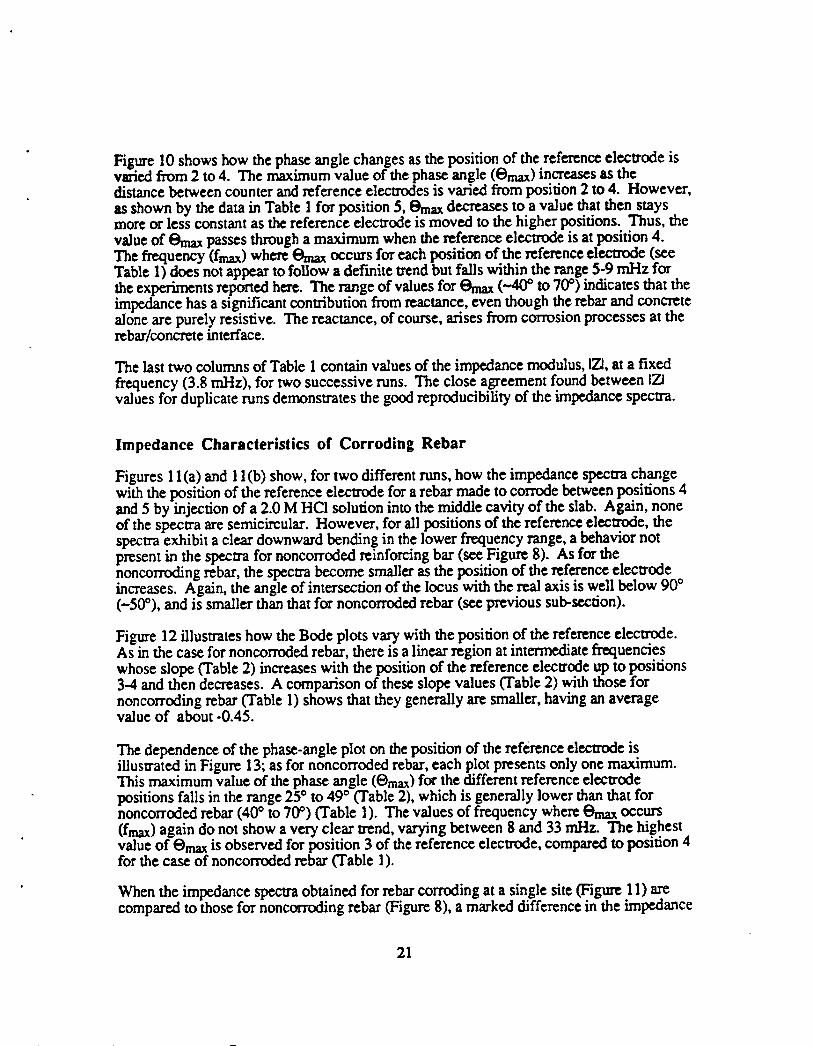
Figure I0 shows how the phase angle changes as the position of the reference electrode isvaried from 2 to 4. The maximum value of the phase angle (@max)increases as thedistance between counter and reference electrodes is varied from position 2 to 4. However,as shown by the data in Table 1 for position 5, Omaxdecreases to a value that then staysmore or less constant as the reference electrode is moved to the higher positions. Thus, thevalue of _ passes through a maximum when the reference electrode is at position 4.The frequency (fmax)where _ occm's for each position of the reference electrode (seeTable 1) does not appear to follow a def'mite trend but falls within the range 5-9 mHz forthe experiments reported here. The range of values for _ (-40 ° to 70°) indicates that theimpedance has a significant contribution from reactance, even though the rebar and concretealone are purely resistive. The reactance, of course, arises from corrosion processes at therebar/concrete interface.
The last two columns of Table I contain values of the impedance modulus, IZI,at a fixedfrequency (3.8 mHz), for two successive runs. The close agreement found between 17dvalues for duplicate runs demonstrates the good reproducibility of the impedance spectra.
Impedance Characteristics of Corroding Rebar
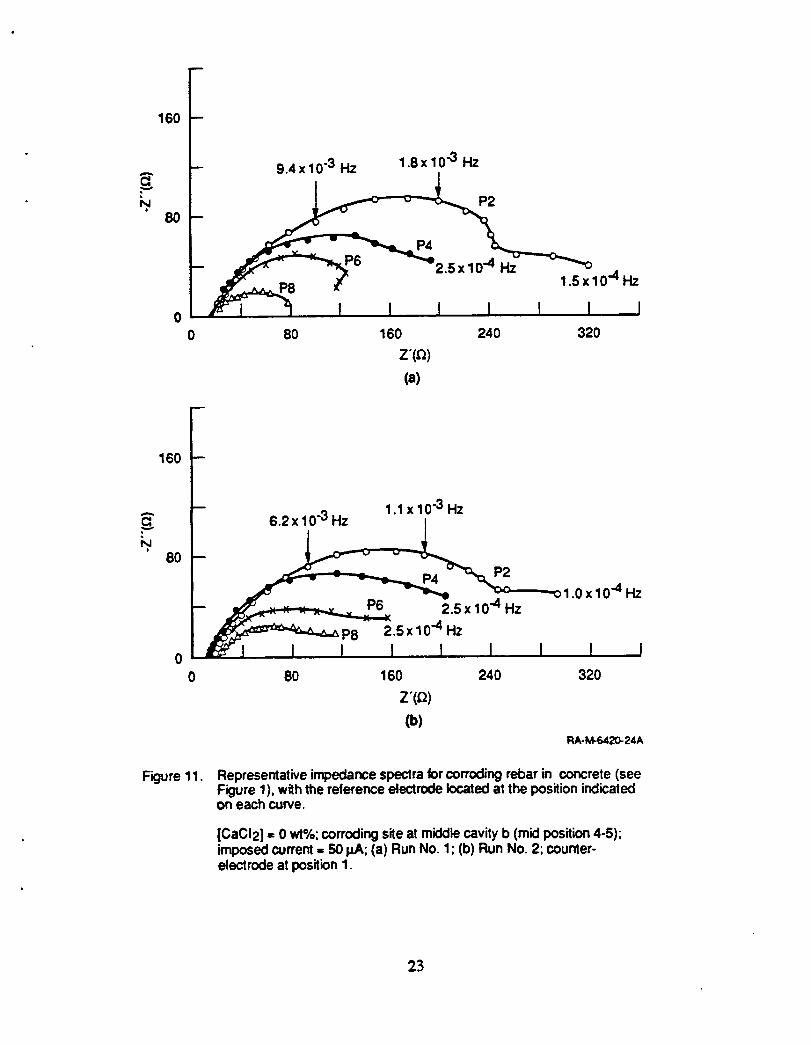
Figures 11(a) and 11(b) show, for two different runs, how the impedance spectra changewith the position of the reference electrode for a rebar made to corrode between positions 4and 5 by injection of a 2.0 M HC1 solution into the middle cavity of the slab. Again, noneof the spectra are semicircular. However, for all positions of the reference electrode, thespectra exhibit a clear downward bending in the lower frequency range, a behavior notpresent in the spectra for noncorroded reinforcing bar (see Figure 8). As for thenoncorroding rebar, the specwa become smaller as the position of the reference electrodeincreases. Again, the angle of intersection of the locus with the real axis is well below 90 °(-50°), and is smaller than that for noncorroded rebar (see previous sub-section).
Figure 12 illustrates how the Bode plots vary with the position of the reference electrode.As in the case for noncorroded rebar, there is a linear region at intermediate frequencieswhose slope (Table 2) increases with the position of the reference electrode up to positions3-4 and then decreases. A comparison of these slope values (Table 2) with those fornoncorroding rebar (Table 1) shows that they generally are smaller, having an averagevalue of about -0.45.
The dependence of the phase-angle plot on the position of the reference electrode isillustrated in Figure 13; as for noncorroded rebar, each plot presents only one maximum.This maximum value of the phase angle (@max)for the different reference electrodepositions falls in the range 25° to 49° (Table 2), which is generally lower than that fornoncorroded rebar (40° to 70*) (Table 1). The values of frequency where Omaxoccurs(fmax)again do not show a very clear trend, varying between 8 and 33 mHz. The hi.g.hestvalue of @maxis observed for position 3 of the reference electrode, compared to posmon 4for the case of noncorroded rebar (Table 1).
When the impedance spectra obtained for rebar corroding at a single site (Figure 11) arecompared to those for noncorroding rebar (Figure 8), a marked difference in the impedance
21

80
EP4
60
40
20
o I-3 -2 -1 0 1 2 3
log (frequency) (rad/s)RA-M-6420-33
Figure 10. Change of phase angle with position of reference electrodetor non-corrodingrebarin concrete.
[CaCI2] = 0 wt%; counterelectrodeat position1; imposedcurrent= 50 gA;Run No. 1.
22
m
160
.-- 94x10 "3 Hz 1.8x 10"3 Hz
P2
1.5x10 "4 _
o I0 80 160 240 320
z'(_)(a)
160
-- ,_ 1.1 x 10"3 Hz
_' 80- P2
o [_" I I I I I I I I I0 80 160 240 320
z'(_)(b)
RA.M-6420-24A
Figure 11. Representativeimpedancespeclraforcorrodingrebarin concrete (seeFigure 1), withthe reterence electrodelocatedat the positionindicatedon each curve.
[CaCI2] = 0 wt%;corrodingsite at middlecavityb (mid position4-5);imposedcurrent= 50 pA; (a) Run No. 1; (b) Run No. 2; counter-electrodeat position1.
23

2.7
2.5 - _2.3 -
P42.1
i,,,,J1.9v
._o
1.7
1.5
1.3
1.1-3 -2 -1 0 1 2
L _ I I I ! I I I I I t-3 -2 -1 0 1 2
log (frequency) (rad/s)RA-M-6420-26
Figure 12. Representative plots of log(impedancemodulus)versuslog (frequency)forthree differentpositionsof the reference electrode,as indicatedbythe labelson the curves.
[CaCI2] = 0 wt%; counterelectrodeat position 1; imposedcurrent= 50 IzA;rebarcorrodingat cavityb; Run No. 1.
24

50 P3
40
A
P2"o--- 30I.U...I(3Z,,¢IJJu) 20,("l-IZ.
10
0
-3 -2 -1 0 1 2 3
log (frequency)(racUs)RA-M-6420-30
Figure 13. Dependence of phaseangleon frequencyfor three differentlocationsof the referenceelectrode.
[CaCI2] = 0 w_X=;counterelectrodeat position1; imposedcurrent= 50 I_A;middle rebarcorrodingat midposition4-5, cavityb; Run No. 1.
25

Table2
DEPENDENCE OF DIFFERENT PARAMETERS ON THE POSITION OF THEREFERENCE ELECTRODE FOR ONE-SITE CORRODED REINFORCING BAR IN
CONCRETE FOR AN IMPOSED AC CURRENT OF 50 gA a
Reference Bode slope
Electrode -(_loglZJ/'blog(f)) Omax/deg fmax/Hz lZJ/_2(0.0038 Hz)Position Ib 2b Ib 2b Ib 2b Ib 2b
2 0.48 0.49 40.7 42.3 0.022 0.033 174.6 162.5
3 0.56 0.56 48.8 49.0 0.018 0.018 119.9 110.7
4 0.50 0.59 45.4 46.6 0.012 0.012 99.4 99.0
5 0.45 0.44 40.5 39.3 0.008 0.012 83.9 80.7
6 0.43 0.41 38.0 35.8 0.018 0.018 86.3 74.035.1 0.027
7 0.36 0.38 31.2 31.3 0.012 0.012 65.4 69.231.0 0.018
8 0.32 0.30 24.7 23.7 0.018 0.008 60.9 61.923.1 0.012
aSlope of the linear intermediate segment of the Bode plot, maximumphase-angle value (Omax), frequency at which O is maximum (fmax),and impedance modulus (IZt)at a fixed frequency of 0.0038 Hz.
bRun number.
[CaC12] = 0 wt%, counterelectrode at position 1; imposed current = 50 p.A;reinforcing bar corroded at cavity b (see Figure 3).
26

values is noted, with those for the corrodingrebar being much smallerat equivalentfrequencies. This difference can be seen by comparingthe values of 17_Jat f = 3.8 mHz forthe two cases for different positions of the referenceelectrode (see Tables 1 and 2).
To check the linearity of the system when probed using an ac current of 50 _, weobtained two other sets of data using higher ac era'rents:330 pA and 500 pA. The resultsof these two last cases are now described.
Figures 14(a)and 14(b) show, fortwo different runs, the impedance spectraobtained fordifferent positions of the reference electrode when an ac currentof 330 pA is imposed.Comparisonof these spectra [(Figures 14(a)and 14(b)] with those for an imposed accurrent of 50 gA [(Figure 1l(a) and 1l(b)] shows that the results for position 2 of thereference elecu'ode(only slightly higher for the 50 p.Acase). However, the results forpositions of the referenceelectrodefarther fromthe counterelectrodeare quitedifferent,thespectrapresenting highervalues of the imaginary impedancefor the 330 _ case (e.g.,compare spectrafor position 8 in Figures 1land 14). At the same time, the comparisonshows that a lowerimposed ac currentled tobetterdifferentiation(discrimination)betweenresults for the differentpositions of the referenceelectrode. The spectrafor the higheracimposed currentalso are less curved downward atthe low frequencies,presenting analmost invariableimaginaryimpedanceas the frequencyis lowered.
The Bode plots obtainedfor the ac imposed currentof 330 I_A,inustratedin Figm'e15, aresomewhat similar to those for the lowerac imposed current(see Figure 12), withcomparable slopesfor the intermediate-frequencylinear region atintermediatefrequencies(see Tables 2 and 3). The highest slope value occursfor positions 3-4, as was found forthe data obtained using anac currentof 50 gA.
Figure 16illustratesthe phase-angle plots for three different positions of the referenceelecu'odewhen the imposed ac currentis 330 I.tA.The uends presented aresimilar to thosefor the lowercurrent (see Figure 13). The maximum value of the phase angle (Omax)fallsin the range33° to ,o,.4"(see Table 3). Thisrange lies withinthe rangeobtained forthe lowercurrent (25° to 49°; see Table 2); thus, therateof decreaseof Omaxas the distance betweencounter and referenceelectrodesis increasedis higherfor the ac imposed current of 50 _A.The frequency (fmax)at which O is maximum is independentof the position of thereferenceelectrode(see Table 3).
The variation of the impedance modulus at a fixed frequencyof 0.0037 Hz (0.1 mHz lowerthan for previous cases; see Tables 1 and 2) with reference electrode position, assummarized inTable3, is similar to thatdiscussed previously for noncorrodedrebar (Table1) and for the measurementscarriedout ata lowerac current(Table2).
The otherset of impedancespectrathat will be discussed now were obtainedfor an evenhigher value of the ac imposed current,i.e., 500 gA. Furthermore,in this case, theposition of the counterelectrodewas changed from 1to 8; thus, the connections for thecounterand workingelectrodeswere at oppositeends of the concrete slab. Figures 17(a)
, and 17(b)show the impedance spectraobtainedfor two different runs for differentpositions of the referenceelecu'ode. Contrary to the priorcase (see Figure 14), the spectrafor differentreferenceelectrodepositions are well differentiated,exhibiting the type of
27

200 --
160 --
120 --
_. -- 1.5X10 "3 Hz80 1.4 X10 "2 Hz _ .
00 10 30 70 110 150 190 230
z"(_)(a)
200 --
160
120
g_. 2.4 Xl 0"3Hz
80I-_,x_o-2.=J . . P3J
4O
00 10 30 70 110 150 190 230
z"(_)(b)
RA.M-r>420-34A
Figure 14. Representative impedancespectra ofcorrodingrebar in concrete. Eachspectrum represents a differentlocationof reference electrode aslabeled on each curve.
[CaCI2] = 0 wt%; counterelectrodeat position2; imposed current= 330pA; •corroding site at mid position4-5, cavity b; (a) Run No. 1; (b) Run No. 2.
28

B
2.3 --_°
E1.9-
1.5 --
1.1 1 ! i I I ! ! ! 1 ! I-3 -2 -1 0 1 2
I ! I I I ! I ! ! I I I°o-3 -2 -1 0 1 2
log (frequency) (rad/s)RA-M-6420-36
Figure 15. Plots of log (impedance modulus) versus log (frequency). Referenceelectrodepositionisgivenon each curve.
[CaCI2] = 0 wt%; counterelectrodeat position1; imposedcurrent = 330 IdZ..rebar corrodingat cavityb.
29

60 --
P3,.., 40 -
'ID
UJ.Jr_z< P4
w P2<:-r"¢1.
20
o f ! ! l-3 -2 -1 0 1 2
log (frequency) (rad/s)RA-M-6420-35
Figure 16. Dependance of phaseangle on logof frequency. For each curve,thereferenceelectrode isat the positionindicated.
[CaCI2] = 0 wt%; counterelectrodeat position1; imposed current= 330 pA;middlerebar corrodingsite at midposition4-5, cavityb;Run No. 1.
3O

Table3
DEPENDENCE OF DIFFERENT PARAMETERS ON THE PosmoN OF THEREFERENCE _-CrRODE FOR ONE-SITE CORRODED REINFORCING BAR IN
CONCREI_ FOR AN IMPOSED AC CURRENT OF 330_a
Rcfm'encc Bodeslope
• Electrode -(_loglZl/'01og(O)Omax/dcg fmax/Hz -tZllf_(0.0037Hz)Position Ib 2b Ib 2b Ib 2b Ib 2b
2 0.43 0.45 37.3 37.9 0.022 0.022 127.0 137.3
3 0.53 0.51 43.5 42.0 0.014 0.014 106.8 101.4
4 0.48 0.51 40.4 41.8 0.009 0.009 89.3 94.5.
5 0.45 0.47 35.2 38.7 0.014 0.009 76.5 86.8
6 0.46 0.43 37.9 36.7 0.009 0.009 87.1 86.5
7 0.42 0.42 36.5 34.4 0.009 0.009 87.2 79.5
8 0.39 0.40 33.8 33.7 0.009 0.014 76.6 81.133.8 33.2 0.009
aSlopcofthelinca.rintcn'ncdiatesegmentoftheBodeplot.maximumphase-anglevalue(emax)),frequencyat whiche ismaximum (fmax),andimpcda.nccmodulus(IZI)atafixedfrequencyof0.0037Hz.
bRun number.
[CaCl2]= 0 w_%,coumerelectrodealpositionI;imposedcurrent= 330p.A;forcingbarcorrodedatcavityb (seeFigure3)
31

s°°E 1.Tx10"3Hz
200 8.4 x 10.3 HzP7
N.100 ,P5 1.5x10.4Hz
HzP3
00 100 200 300 400 500 600
z'(_)(a)
300 -- 8. 1"7x10"3Hz200
0 100 200 300 400 500 600
z'(_)(b)
RA-M.6420-27A
Figure17. Impedancespectraof corrodingrebarfor referenceelectrodeatthepositionsindicatedoneachcurve.
[CaCI2]= 0 wt%;counterelectrodeatposition8; imposedcurrent= 500pA;corrodingsiteatmidposition4-5, cavityb;(a) RunNo.1; (b)RunNo.2.
32

downward curvature at low frequencies seen above for an imposed ac current of 50 I.IA(see Figure 1I). However, the range of values of the impedance is somewhat grea_-_rthanfor the previous cases (compare Figure 17 with Figures 11 and 14); nevertheless, thevalues arc still smaller than those for noncorroded reinforcing bar (compare Figures 17 and8). Again, the impedance spectra becmne smaller as the reference electric is moved awayfrom the cotmterelectrodc.
Figure 1g illustrates the Bode plots obtained when the imposed ac rant is 500 I_, mdthecounterelectrodeisatposition8.Theseplotsarcsimilartothosepreviouslyanalyzed(see Figures 9, 12, and 15), in that they also display a linear segment at int_tefzequencies.The slopesfortheselinearsegmentsforthedifferentreferenceelectrodepositionsarelistedinTable4.The highestvaluefortheslopeoccursforposition6 ofthereferenceelectrode;sincethispositionisanalogoustoposition3 whenthecounterelectrodcisatpositionI,thisresultfallswithinthetrendpreviouslynoted,i.e.,anincreasein(1)IZll0logf)forfastpositionsofreferenceelectrodenearthecounterelectrode,followedbyadecreaseforfartherpositions.
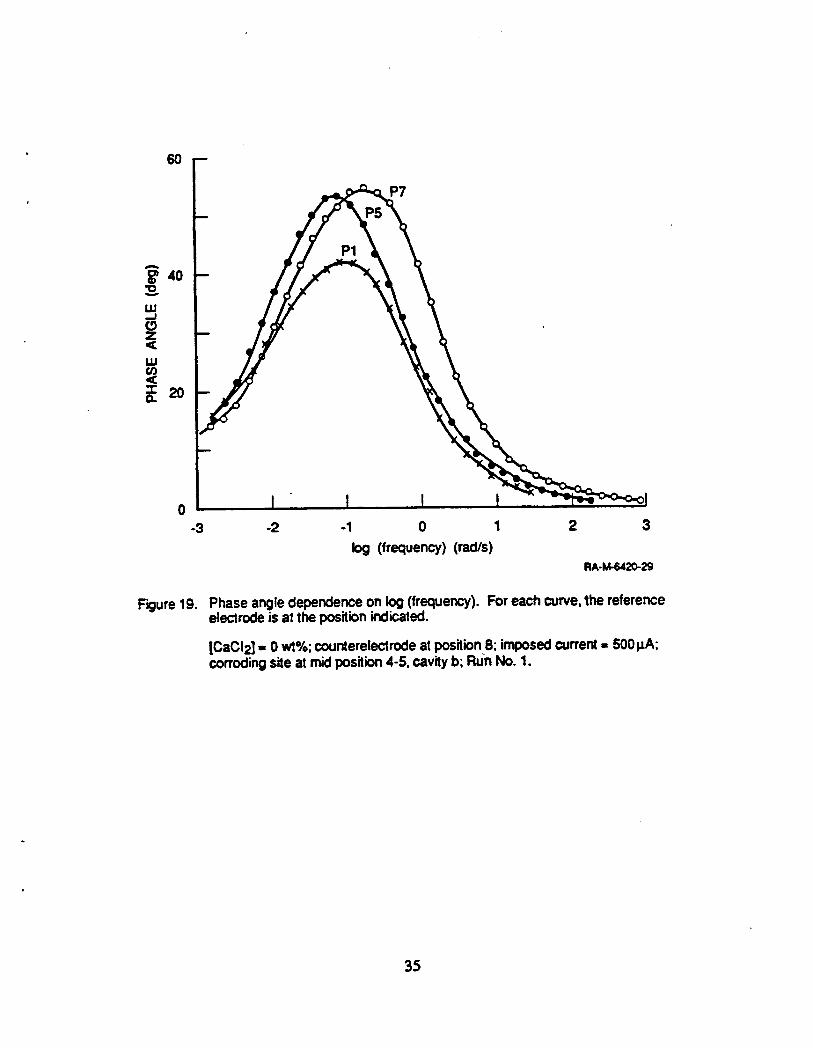
Figure19illustratesthephase-angleplotsforthreepositionsofthereferenceelectrodewhen theimposedaccurremis500l,ha,.The trendspresentedaresimilarto those forthecasespreviouslyanalyzed,althoughtherangeofvaluesforOmax isgreaterthanthosereportedinTables2 and3butisstillsmallerthanthatreportedinTableI.The valueoffmax,exceptforpositionsofthereferenceelectrodeclosetothecounterclectrede,isalmostconstant;thistrendissimilartothatpreviouslyobserved(compareTables3and4).
The variation of the impedance modulus at a f3xedfrequency of 0.0038 Hz shown in Table,4is analogous to those previously analyzed, i.e., 17_.1becomes smaller as the distancebetweencounterandreferenceelectrodesincreases.
Since the concrete slabs that were prepared for this study had three cavities for inducingcorrosion on the rebar with acid, we also recorded impedance spectra while the rebar wasbeing corroded at two or at three well-defined and well-separated sites at the same time.
The studiesoftwo-sitecorrodingreinforcingbarinconcretewerecarriedoutwhilecorrosionwas made tooccursimultaneouslyincavityb(locatedbetweenpositions4 and5)andincavitya (locatedbetweenpositions2 and3)byinjectionofa 2.0M HCI solution.The counterelectrodewaskeptatpositionI,whiletheacimposedcurrentwas50BA.
Figure20showstheimpedanceplotsobtainedforthereferenceelectrodeatpositions2,3,7,and8.A comparisonoftheseplotswiththoseforsimilarconditionsbutonlyonecorrodingsite(secFigure7)showsthattheirshapesarcsimilar,however,theyaresmallerforthetwo-sitecase.Furthermore,forthetwo-sitecase,theimpedancedecreasesgreatlywhen thereferenceelectrodeischangedfromposition2 to3,i.e.,fromapositionwherenocorrodingsiteliesbetweenthecounterandreferenceelectrodetoapositionwherethereisacorrodingsitebetweenthem.Additionally,theimpedanceplotsforthecaseswherethetwocorrodingsiteswerebetweenthecounterandreferenceelectrode(e.g.,positions7 and8;-seeFi.gure20)exhibita semicircularshape,almostintersectingthereal-impedanceaxisattwo polnts.
33

2,7
P6
P5
_1.9 --
1.1 ! ! ! I J-3 -2 -1 0 1 2
log(frequency)(rad/s)RA-M-6420-28
Figure 18. Plotsof log(impedancemodulus)versus log (frequency).Referenceelectrodepositionsshownonthecurves.
[CaCI2]= 0 wt%;counterelectrodeatposition8; imposedcurrent= 5001zA;corrodingsite at midposition4-5, cavityb; RunNo.1.
34
FP7
P1A
4O"o
UJ-J
Z
I,U
n- 20
o I I ! I-3 -2 -1 0 1 2 3
log (frequency)(rad/s)RA.M-6420-29
Figure19. Phaseangledependenceon log(frequency).Foreachcurve,thereferenceelectrodeisatthepositionindicated.
[CaCI2]= 0 wt%;counterelectrodeatposition8; imposedcurrent= 500pA;corrodingsiteatmidposition4-5, cavityb; RunNo.1.
35

Table 4
DEPENDENCE OF DIFFERENT PARAMETERS ON THE POSITION OF THE_RENCE E! -_CTRODE FOR ONE-SITE CORRODED REINFORCING BAR IN
CONCRETE FOR AN IMPOSED AC CURRENT OF 500 _A,a
Reference Bode slope
Elecu_e -(_loglZlfOlog(f)) Omax/deg fmax/Hz IZI/_(0.0038 Hz)"°Position Ib 2 b I b 2b i b 2b Ib 2 b
1 0.50 0.50 42.3 39.2 0.012 0.008 87.7 76.939.1 0.012
2 0.41 0.44" 41.8 39.0 0.012 0.012 103.0 83.9
3 0.45 0.56 40.6 43.3 0.012 0.012 89.7 105.040.6 43.3 0.008 0.008
4 0.52 0.58 47.1 47.5 0.008 0.008 107.6 114.7
5 0.58 0.61 53.7 52.0 0.012 0.012 149.3 130.751.9 0.008
6 0.71 - 58.6 -- 0.018 - 195.6 --
7 0.65 0.58 54.9 56.1 0.028 0.042 288.3 299.3
aSlope of the linear intermediate segment of the Bode plot. maximumphase-angle value (Omax), frequency at which e is maximum (fmax),and impedance modulus (IZI)at a fixed frequency of 0.0038 Hz.
bRun number
[CaCl2] = 0 wt%, counterelectrode at position 8; imposed current - 500 gA;reinforcing bar corroded at cavity b (see Figure 3).
36

8O
1.82x 10.3 Hz 2.59 x10"3lb.
00 40 80 120 160 200
Z'IQRA-M-6420-23A
Figure20. Typical impedancespectrumof corrodingrebar in concrete.[CaCI2],, 0 wt%; imposedcurrent ,, 50 I_ (peak-to-peak).
37

Figure 21 shows three representative Bode plots, which exhibit the same generalcharacteristicsofthosealreadyanalyzed(Figures12,15,and18).The valuesoftheslopesofthelinearsegTncntsoftheseplotsatintermediatefrequenciesarelistedinTable5.Thecomparisonoftheseslopevalueswiththoseforone-sitecorrosion(seeTable2)showsclearlythattheybecomesmallerafterone(ortwo) corrosionsitesarelocatedbetweenthecounterandreferenceelectrons.Thesecasesoccurforthereferenceelectrodeatposition5forone-sitecorrosion(seeTable2)andatposition3fortwo-sitecorrosion(seeTable5).Inconclusion,corrosionatlocalizedregionsbetweenthecounterandreferenceelectrodesseems to especially modify the impedance specn'a.
Phase-angle plots arc illustrated in Figure 22; the plots benzine smaller as the referenceelectrode is moved away from the coumerelcccrode (plots for reference electrode positionsnotshown followthesameu'end).Accordingly,thevaluesfor@max (seeTable5)decreasesteadilyasthereferenceelectrodeismoved awayfromthecounterelecu'ode.TherangeOf@max valuesisnow 19°to39°comparedwith24to49°forone-sitecorrodingrebar(seeTable2).The valuesoffmaxarealmostconstantforallreferenceelectrodepositionswhichcorrespondtohavingoneortwocorrosionsitesbetweencounterandreferenceelectrodes(positions3-8).However,thefmaxvaluesarcslightlyhigherforposition2.
Valuesoftheimpedancemodulusatafrequencyof3.8mHz (Table5)clearlyillusu'ateonceagaintheinfluenceofa corrosionsitebetweenthecounterandreferenceelectrodesontheimpedanceresponseofthesystem,sincetheyfallsharplywhen thereferenceele_-odepositionischangedfrom2 to3.
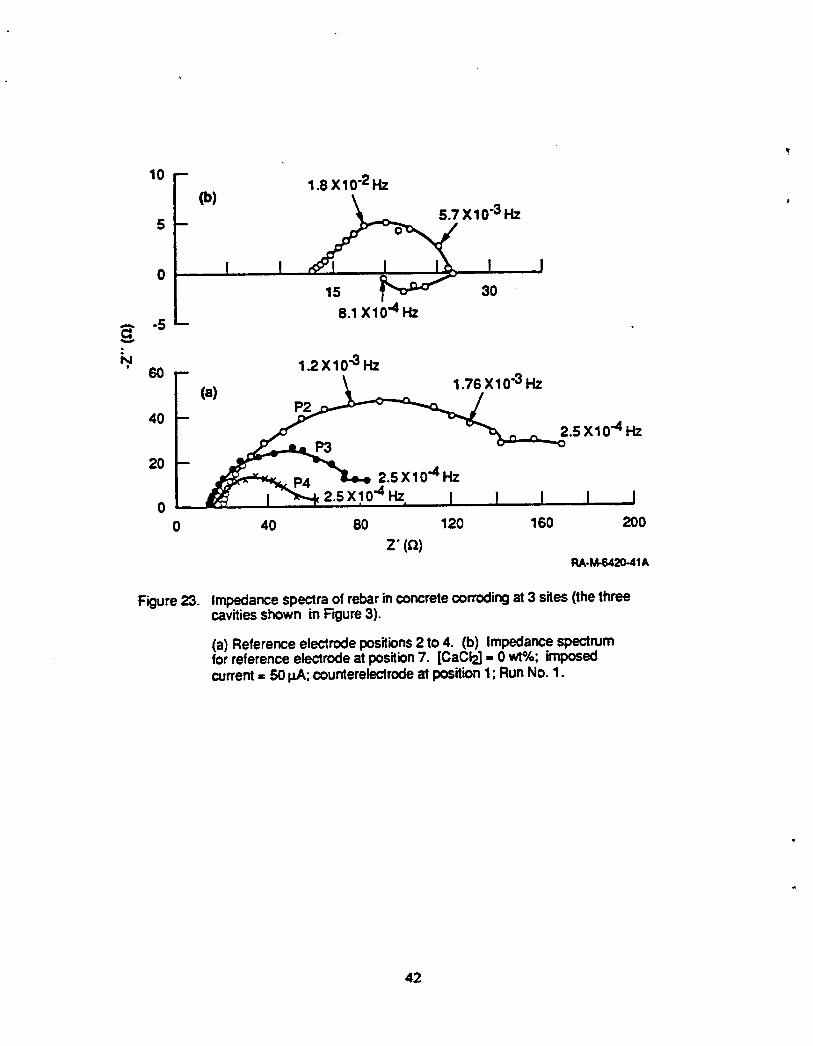
The impedancespectraforthree-sitecorrodingrebar(cavitiesa,b,andc showninFigure3)fordifferentpositionsofthereferenceelectrodeareflluswatedinFigures23(a)and23(b).The spectraaresmaller,atanygivenfrequency,thanthoseobtainedfortwo-sitecorrodingrebar(seeFigure20);significantly,thespecn'umforthereferenceelectrodeatposition2 (nocorrodingsitebetweencounterandreferenceelecu'odes)istheonethatdisplaysthesmallestdecrease.As thenumberofcon'odingsitesbetweencounterandreferenceelecu'odesincreases,theiml:edancespecmambecomessmallerwithamaximumatrelativelyhigherfrequencies,presentinginsomeinstancesapsucdo-inductiveloopatlowfrequency[seeFigure23(b)].
The Bodeplots(Figure24)retainthegeneralcharacteristicsofthosepreviously.analyzed.However,thevaluesoftheslopesofthelinearsegmentatintermediatefrequenclesaresignificantlylower(Table6)thantheapproximately-0.5valuethathadbeenfoundforpreviouscases(seeTables2 through5).The impedancemodulusdoesnotseemtodependasstronglyon frequencyasinthecasesoftwo-andone-sitecorrodingrebarsandismuchlessdependentwhen comparedwiththenoncorrodedrebar.
The phase-angleplots(Figure25)aresimilartothepreviousonesanalyzedbutdisplaymuch lowervaluesof@max,whichdecreaseasthedistancebetweencounterandreferenceelectrodesisincreased(rangeofI0°to36°;seeTable6).The valuesoffmax(Table6)firstdecreaseasthedistancebetweencounterandreferenceelectrodesisincreased,butthenincreaseforthetwolargestdistances(positions6 and7)toavalueevenhigherthanthatwhen thereferenceelectrodeisatposition2.
38

2,4 D
_r
P22.2 -
P3
1.8 --
1o4 m
1.2 i
1.0 I ! ! ! I I I I ! I-3 -2 -1 0 1 2
log (frequency)(rad/s)RA-M-6420-43
Figure 21. Sampleplotsof log(impedancemodulus)versuslog(frequency)lorthreedifferentpositionsof referenceelectrodeasshown.
[CaCI2]= 0 wt%;¢ounterelectrodeatposition1; imposedcurrent= 501_A;concreterebarcorrodingatmiddleandright-hand.side(cavitiesa and binFigure3); RunNo.1.
39

-w
5O
w
40
20
10
0
-3 -2 -1 0 1 2 3
log (frequency)(tad/s}RA-M-6420-25
Figure22. Dependence of phaseangle on log (frequency). For each curve,thereferenceelectrode is at the positionindicated.
[CaCI2] ,, 0 wt%; counterelectrodeat position1, imposedcurrent = 50 IJA;corrodingsitesat midpositions4-5 and 2-3, cavitiesb and a.
4O

Table5
DEPENDENCE OF DIFFERENT PARAMETERS ON THE POSITION OF THEREFERENCE ELECTRODE FOR TWO-SITE CORRODED REINFORCING BAR IN
CONCRETEa
Reference
' Electrode Bode slope (_ax/deg fmax/Hz IZI/t"2(0.0038Hz)
Position -(_logiZl/'Jlog(f))
2 0.46 39.1 0.040 111.6
3 0.45 36.5 0.018 72.6
4 0.37 33.3 0.027 60.2
5 0.30 27.6 0.018 54.7
6 0.40 22.1 0.027 59.2
7 0.33 26.5 0.027 53.1
8 0.23 18.9 0.027 35.8
aSlopcofthelinearintermediatesegmentoftheBodeplot,maximumphase-anglevalue(Omax),frequencyat which0 ismaximum (fmax),andimpedancemodulus(IZI)at a fixed frequencyof 0.0038 Hz.CountcrclcctrodcatpositionI,imposedcurrentffi50p/A;rcinfor_ngbarcorrodedatcavitiesaandb seeFigur_3.
41
10 --1.8 X 10"2 Hz
5 -- Xl0 "3Hz '
o , ,8.1 X10"4 Hz
N 60 1"2X10"3 Hz
(a) 1.7s.x10-3Hz
40 f P_2.5 X10.4 HZ20/ _ Pa. _ 2.SX10"4Hz
0 _ 2.5 X 10⁻⁴ Hz. I ! I _l I0 40 80 120 160 200
z'(_)RA-M-6420-41A
Figure 23. Impedancespectra of rebarinconcrete corrodingat 3 sites (the threecavitiesshown in Figure3).
(a) Reference electrode positions2 to 4. (b) Impedance spectrumfor reference electrodeat position7. [CaCI2] - 0 wt%; imposedcurrent= 50 pA; counterelectrodeat position1; Run No. 1.
42

2.4 --
2.2 -- P2
2.0 -
P3
.... 1.8 -
1.6 --
1.4 --
1.2 --
1.0 I I ! I ! I I I I I I-3 -2 -1 0 1 2
log (frequency) (rad/s)
RA-M-6420-44
Figure 24. Sample plotsof log(impedancemodulus)versuslog (frequency), forthree differentpositionsof referenceelectrodeas shown.
[CaCI2] = 0; ¢ounterelectrodeat position1; imposedcurrent= 50 IzA;concrete rebarcorrodingat cavitiesa, b, and c (see Figure 3).
43

Table6
DEPENDENCE OF DIFFERENT PARAMETERS ON THE POSITION OF THEREFERENCE ELECI_ODE FOR THREE-SITE CORRODED REINFORCING BAR IN
CONCRETE a
Reference
Elccrode Bodeslope emax/deg fmax/Hz Z/fl(0.0038Hz)°
Position -(OloglZlfOlog(f))
2 0.32 29.9 0.027 134.4
3 0.41 36.3 0.018 60.3
4 0.29 24.8 0.012 39.7
5 0.17 14.0 0.012 29.514.2 0.O59
6 0.13 11.9 0.059 23.7
7 O.16 14.5 0.059 26.5
aSlopc of the linear intermediate segment of the Bode plot, maximumphase-angle value (Omax), frequency at which O is maximum (fmax),and impedance modulus (IZl) at a fixed frequency of 0.0038 Hz.[C.aC12]= 0 wt%; imtx_cd current = 50 gA; countcrelcctrode at position 1;rebar corroded at cavities a, b, and c (see Figure 3).
44

70 --
60
5O
_ 30
20
10
o I-3 -2 -1 0 1 2
log (frequency) (red/s)RA-M-6420-42
Figure 25. Dependenceof phaseangle on log(frequency). For each curve,thereferenceelectrodeis at the positionindicated.
[CaCI2] = 0 wt%; counterelectrodeat position 1; imposed current= 5OpA;Run No. 1; corrodingsitesat cavitiesa, b, and c (see Figure3).
45

The values of the impedance magnitude (see Table 6) again confn'm that there is a decreasein the impedance response when corrosion occurs at three sites instead of two sites (seeTable 5).
DISCUSSION
The impedance characteristics of reinforcing bar in concrete have been experimentallyinvestigated in detail for concrete slabs -240 crn long, employing an ac signal of frequencyas low as 0.1 rnHz. Impedance spectra were obtained for different distances betweencounter and reference electrodes (by moving the latter) for different fixed .l.l.l.aositionsof thecounterelcctrodc and for the presence or absence of regions of high corrosion activity onthe rebar as induced by hydrochloric acid. The impedance response was analyzed fortrends in the complex-plane, Bode, and phase-angle plots, and with respect to changes inthe maximum phase-angle (@max),the frequency at which @is maximum, the values of theslopes of the linear segment (at intermediate frequencies) of the Bode plots, and the valuesof the impedance modulus at a fixed (low) frequency.
Figure 26 compares impedance spectra for noncorroding and corroding (cavity 6) rcbar, forthe same position of the reference electrode (position 2), which is 17 cm away fromposition 1 (the location of the counterelcctrodc). Figure 27 shows the same comparison forthe reference electrode at position 8 (220 cm away from the position of thecounterelcctrode). It is clear from these figures that, irrespective of the reference electrodeposition, the impedance values arc significantly lower for corroding rebars than fornoncorroding rebars. Thus, wc conclude that the impedance of the system is reduced bythe occurrence of corrosion at a site that is remc_c from the point of sensing (the position ofthe reference electrode).
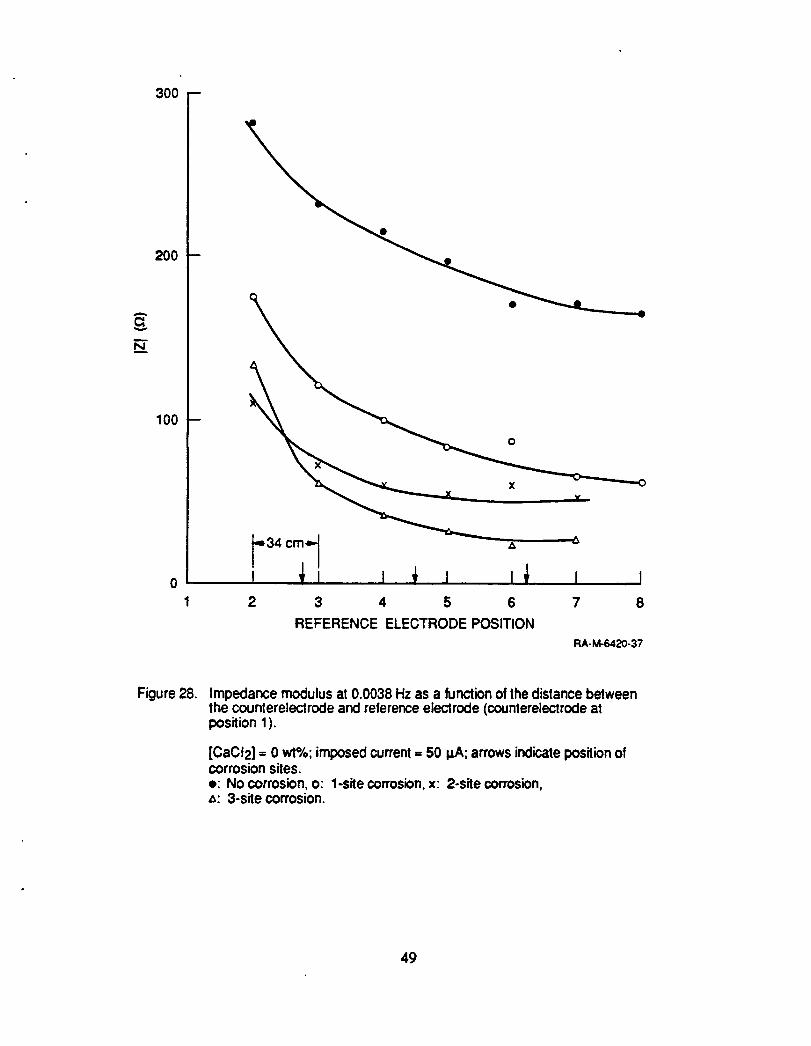
The variation of the impedance modulus IZIat a fixed frequency (3.8 mHz) with theposition of the reference electrode for the different sets of data experimentally obtained inthis study is shown in Figure 28. This figure clearly shows that inducing corrosion (onesite) on the rebar causes a sharp decrease in IZi,which further decreases as more corrosionsites are added. Thus, it seems to be possible to differentiate between noncorroded andcorroding reinforcing bar in concrete structures by careful analysis of impedance spectralmeasurements.
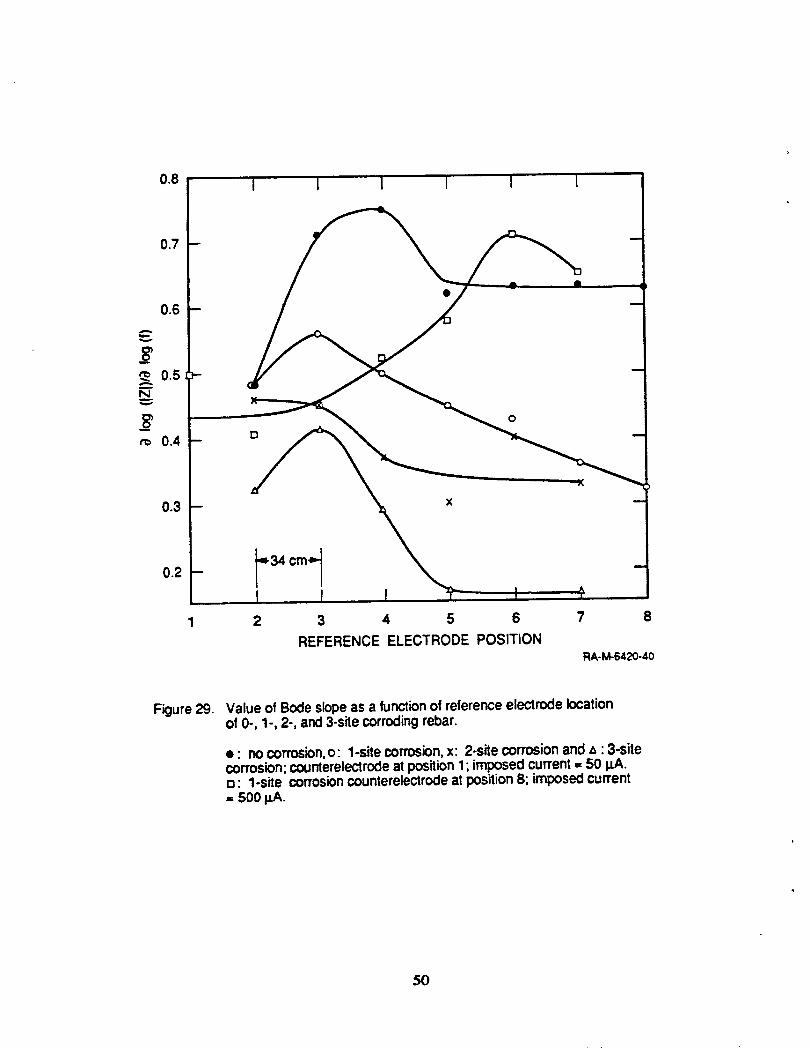
Variation of the slope of the linear segment (for intermediate frequencies) of the Bode plotwith the position of the reference electrode is shown in Figure 29. When the counterelectrode is kept at position 1, in general the slope reaches a maximum when the referenceelectrode is in position 3, irrespective of the presence or absence of corroding activity onthe reinforcing bar. It is also clear from this figure that, after the maximum, the values ofthe Bode slope tend to become approximately constant; this trend is shared by corrodingand noncorroding rebars. Furthermore, the value of the Bode slope for a given referenceelectrode position also decreases as the number of corroding sites is increased, becormng aslow as -0.16 for three-site corroding rebars. The same trends are shown by the slopes ofBode plots for data obtained for the counterelectrode at position 8 (Figure 29).
46

8°°f600
-- 1.1x 10⁻³Hz 23x 10-4Hz 1.0x 10"4Hz
•_v 4009
2O0
--__--x,,_ _ 2.5x 10.4 Hz
0 _1 I ""P_I I I I I ] I I I I I I0 200 400 600 800 I000 1200 1400
z'(_)(a)
800 --
_x 10-4Hz__.
4OO2oo"[--_ _ 2_5xI Hz
0-4
0i_ I"Axl x I I ] I I I I I I I 1 I0 200 400 600 800 1000 1200 1400
z'(_)
(b)RA-M-6402.21A
Figure 26. Comparison of impedance spectra of corrodedandnoncorrodedrebarinconcrete, where referenceelectrode is at position2, counterelectrodeisat position1, and[CaCI2]= 0 wt%.
o: Right-hand-sidenoncorrodingrebarx,e: Middle rebarcorroded at midposition4-5, cavityb (see Figure 3)
• Imposed current= (x) 501_Aand (o) 3301.LA; (a) Run No. 1; (b) Run No. 2.
4?

80f• 40 8.3x 10⁻³Hz 8.0x 10⁻⁴ Hz
ol J"l I I I I I0 40 80 120 160
z "(_)(a)
600
ZSxlO'4Hz
o I , I I I I I I I I0 200 400 600 800
z'(_)(b)
RA-M-6420-22A
Figure 27. Impedancespectrafor (a) corrodingrebar at mid position4-5, cavity b, andfor (b), noncorrodingrebar,_orreference electrodeat position8.
[CaCI2] = 0 wt%;imposedcurrent= 50 I_; counterelectrodeat position1.
48
300 -
200 -
N__
100 --
XY
_,_34cm4,._ A
0 I _l I _ I I; I w1 2 3 4 5 6 7 8
REFERENCE ELECTRODE POSITIONRA-M-6420-37
Figure 28. Impedance modulusat 0.0038 Hz as a functionof thedistancebetweenthe counterelectrodeand referenceelectrode (counterelectrodeatposition1).
[CaCI2] = 0 wt%; imposedcurrent= 50 gA;arrowsindicatepositionofcorrosionsites.o: No corrosion,o: 1-sitecorrosion,x: 2-site corrosion,&: 3-site corrosion.
49
O.8 I 1 I i I I
0.7
0.6A
i
o.5l
__ or_ 0.4 D
0.3 x
0.2
1 2 3 4 5 6 7 8REFERENCEELECTRODEPOSITION
RA-M-6420-40
Figure29. Valueof Bodeslopeas a functionof referenceelectrodelocationof 0-, 1-,2-, and3-sitecorrodingrebar.
• : nocorrosion,o: 1-sitecorrosion,x: 2-sitecorrosionandA :3-sitecorrosion;counterelectrodeatposition1; imposedcurrent= 50 p.A.D: 1-sitecorrosioncounterelectrodeatposition8; imposedcurrent=soopA.
50
Our study has shown that the most sensitive parameter for detecting and locating corrosionon reinforcing bars in concrete structures is the maximum value of the phase angle, emax,as well as the frequency, fmax, at which emax occurs. Figure 30 shows the influence ofthe number of initiated corrosion sites has on the phase-angle plots. The figure clearlyshows that emax decreases as the number of corroding sites is increased; however as theplots for positions 4 and 7 of the reference electrode show, this decrease becomes morepronounced as the reference electrode is moved away from the countcrelectrode. The highsensitivity of the phase angle to the presence of corrosion on rebar in reinforced concretewas predicted theoretically by Macdonald, McKubre, and Urquidi-Macdonald 4 in a studythat formed the basis for the present work.
51

7O 7O
60 -- P2 60
40 _ 40
_<3o _ 30<:
=. 20 =. 20
10 10
0 0-3 -2 -1 0 1 2 3 -3 -2 -1 0 1 2
log (frequency) (rad/s) log (frequency) (rad/s)
7°F60 P7
40
_ 3o
10
0-3 -2 -1 0 1 2
log (frequency) (rad/s)RA.M-6420-45
Figure 30. Effect of increasing number of corrosionsitesof rebaron the phase angleplots.
Data for reference electrodeat positions2, 4, and7 are shown.[CaCI2] = 0 wt%; counterelectrodeat position1; imposed current= 50 IzA;e: No corrosion,o: 1-site corrosion,x: 2-site corrosion,A: 3-site corrosion.
52

3
TRANSMISSION LINE MODELING
Electrochemical methods arc currently being used extensively to investigate the corrosion ofrebut in concrete. 1-13 Recently, the problems associated with interpreting data fromelectrochemical and corrosion studies on highly asymmetric conductors (as may be the casefor rebut) in a resistive, nonhomogencous medium (as is the case for concrete) have beenpointed out.4-12,13 Until recently, impedance or polarization data usually have beeninterpreted in terms of simple electrical equivalent circuits. However, the reportedimpedance spectra typically are characteristicof distributed systems, in which the low-frequency imaginary component is depressed relative to the real component (seeExperimental Studies, above). Thus, the impedance response of such systems cannot bedescribed in tex_s of a simple electrical circuit but instead should be interpreted in terms ofelectrical transmission lines. 4,12.13
Mathematical techniques for analyzing one-dimensional, uniform, finite, or infinitetransmission lines are well developed, and these electrical models have been extensivelyused to describe corrosion and electrochemical processes.4,12"21 In this project, we usedelectrical transmission line models to describe the impedance response of rebut inreinforced concrete slabs for several different experimental situations.
Our purpose in exploring transmission line models was to determine whether theexperimental observations reported in the previous section could be understood in terms ofrelatively simple eleclric.alequivalent circuits that incorporate the distributed characteristicsof a one-dimensional rebar and the nonuniform nature of corrosion on localized regions ofthe bar. While a model of high fidelity would be of considerable theoretical value, it is notnecessary for the purpose of using ULFACIS to survey corrosion damage as indicated inthe previous section. However,, readers who wish to delve into the mathematical aspectsof our work are directed to the full report on this project, in which we develop a method formeasuring the polarization resistance of corroding rebar in concrete.
53

DESCRIPTION OF THE MODEL USED
On the basis of on a previous one-dimensional uniform u'ansmission line model 4 andassuming that the electrical properties of rebar and concrete are purely resistive in nature,the reinforced concrete slabs studied in this project can be viewed as one-dimensionaltransmission lines (Figure 31).
The ac impedance measm'ements were carded out for two different arrangements of theelectrodes: (I) working electrode (rebar) and counterelecmxle connections at the same endof the slab (hereinafter referred to as case l) and (2) working elecu'ode and counterelecu'odeconnections at opposite ends of the slab (hereinafter referred as case 2). In botharrangements, the position of the reference electrode was varied from one end to the otherend of the slab. Figure 32 shows the discretized l_'ansmission line models for thereinforced concrete slabs corresponding to these two different experimental setups. Indeveloping these models, we assumed that the resistivity of both concrete (Pc) and rebar(RM) is independent of position. On the other hand, as a f'_st approach, the concrete-rebarinterfacial impedance (Zi) was assumed to be position independent.
Application of Kirchhoffs voltage law for each segment of the transmission line allows thecalculation of the value of Ik, i.e., the alternating current in each segment. Hence, for caseI, the impedance (Z) of the system (as a function of the angular frequency of the appliedalternafi.ngcurrent) can be calculated as
(+ )/z(_) = - R__ Ik(m) I + Z,,(_) (6)k=o
whereRsistheresistanceofconcretepersegment,Nrefisthepositionofthereferenceelccn-odcalongtheline,Ik(C0)isthe(frequencydependent)ahcmatingcurrentinsegmentk,Zo(cO)isthercbar-concrcteintcrfacialimpedanceatposition1(seeFigure28),andItheimposedahcmatingcurrent.Theanalogousexpressionforcase2 is
(++ )/Z(c0)= - Rs _ Ik(C0)+ It(c_)Zo(c0)I (7)k=o
Consideringthattherebariscorroding,thercbar-concrcteinterracialimpedancemay bemodeledbytheequivalentcircuitshowninFigure33(a),whereZNC istheintcrfacialimpedanceattributedtothenoncorrodedareasandZC istheinterfacialimpedanceassociatedwithcorrodingareas.Thus,theinterracialimpedance,Zk,ofeachscgvr_ntkcanbeviewedashavingacontributionfrombothofthesecomponents.Ifwe define0 asthefractionoftheareaofthekthsegmentthatiscorrodingthcn
54
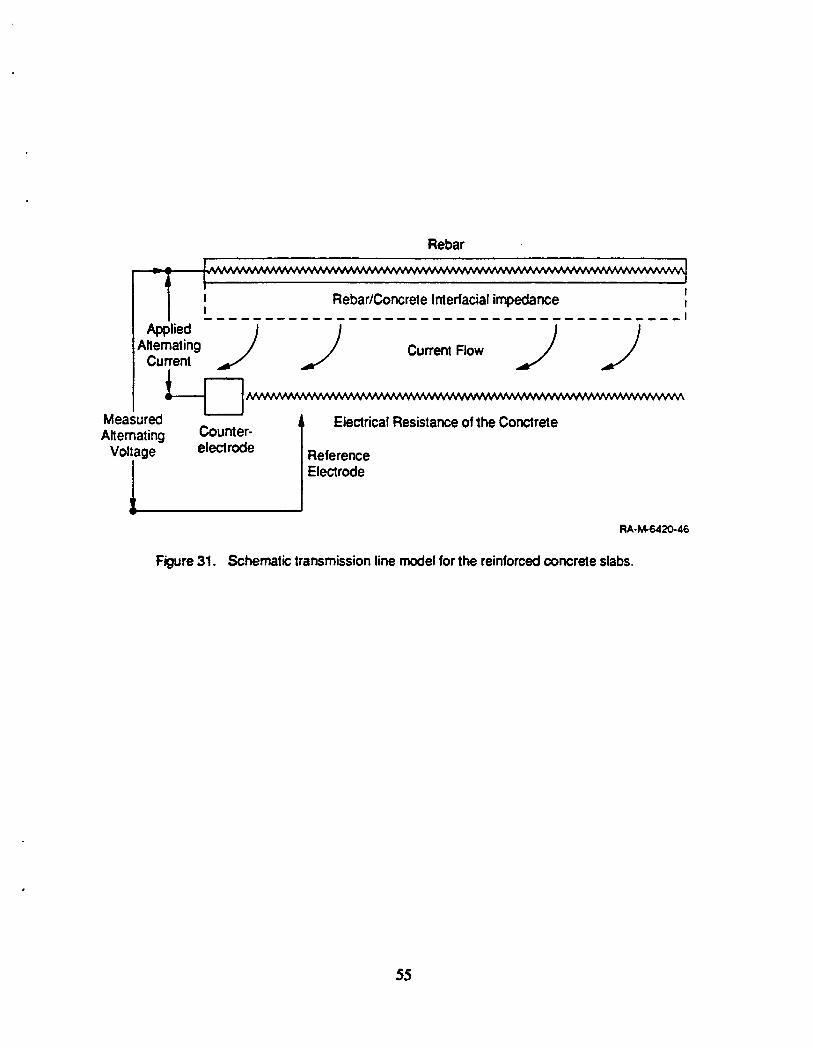
Rebar
-ii= Rebar/ConcreteInterracialimpedance aI II
Applied j j ou.o,,,owj jMeasured ElectricalResistanceof the ConctreteAlternating Counter-
Voltage electrode Reference
ElectrodeRA-M-6420-46
Figure 31. Schematictransmissionlinemodelforthe reinforcedconcrete slabs.
55

RM RM RM RM RM RM
CE_;_ Rc Rc Rc Rc Rc Rc
RE
(a)
RM RM RM RM RM RM
_ _ °
RA-M-r_20-47
Figure 32. Discriticizedtransmissionline modelsused forthe reinforcedconcreteslabs.
WE = workingelectrode;CE = counterelectrode;RE = referenceelectrode;RM = resistanceof metalper segment;Rc = resistance ofconcreteper segment;Zi = rebar/concreteinterracialimpedancepersegment. Ill = alternatingcurrentinsegmenti; I = appliedalternatingcurrent.]
(a) Case 1: counterelectrodeat position1 and referenceelectrode at anypositionbetween2 and n (here illustratedat position5); (b) Case 2:counterelectrodeat position n + 1 andreferenceelectrodeat any positionbetween 1 and n (here illustratedatposition 5).
56

RC:L
i RNC __ Cc
L J
(a) (b)RA-M-6420-48
Fcjure 33. (a) General equivalentcircuitfor the rebar/concreteintedacialimpedanceofeach segment, where ZNCand Z Ccorrespondto the impedanceofnoncorrodedandcorrodedareas, respectively. (b) Detailedequivalentcircuitsfor ZNCand ZC (see text).
57

R=
272 -Z"/13 log (IZl/_) _degreex2
2.9 _ _--'--"- 50
136 x2 ___ x2 +2
1.3 100 ' ��I'_' '0 136 272 -3.16 -0.6 -3.16 -0.6
R NC
t ,I/__l I 1.3 1000 108 216 " -3:16 ' -;.6 ' -3.16 "0.6
CC
-Z"/,Q log (IZI/.Q) _clegree
5O x52.9 5
96 X5 _._+
1.3 x5 ,_'_''_ 10I I I I
0C) 96 192 -3.16 -0.6 -3.16 -0.6
Z'/_ log(f/Hz) log(_/Hz)RA-M-6420-49A
Figure34. Changesin the complex-plane,Bode,and.phase-angleplotsduetovariationsinthevaluesof R=,,RNC,andC_.
Dataforslabwith_/o contentof CaCI2,Case1, referenceelectrodeatposition 2, corrosion at middle site, Run No. 1, imposed AC current of330
58
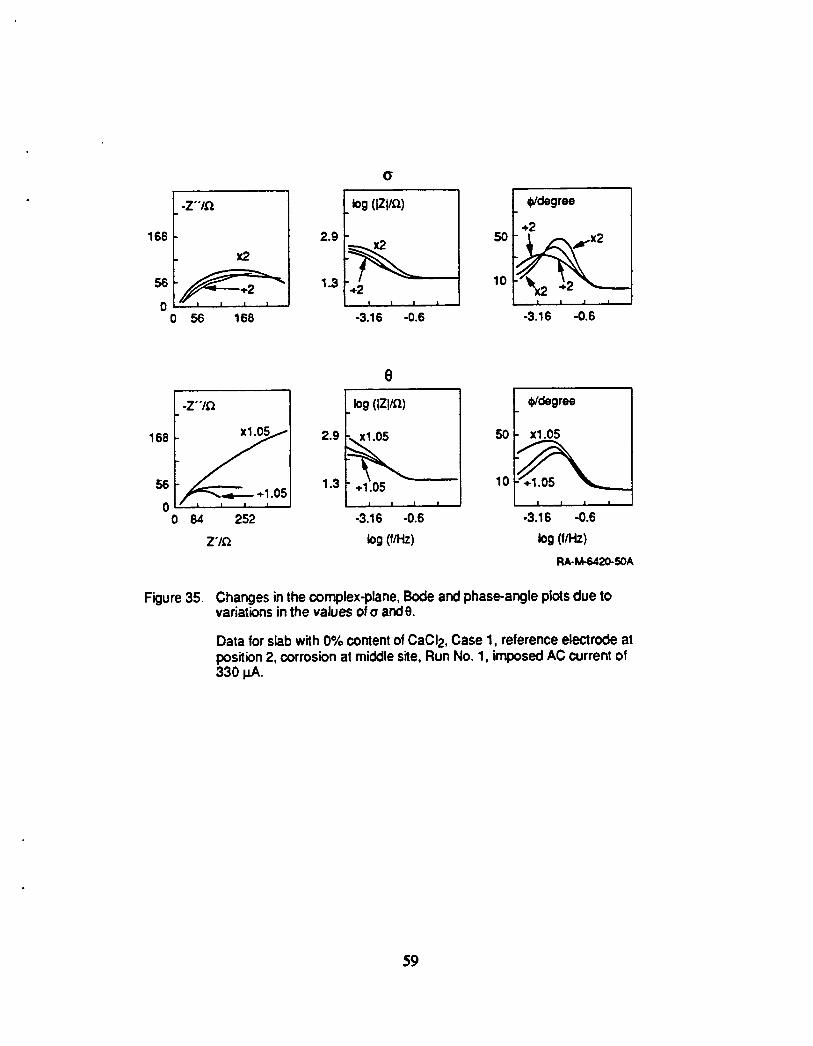
O
-Z"/_ log(IZI/_) L _degree// +2
168 2.9 501- t ..-. r.X2
0 / I I I I
0 56 168 -3.16 -0.6 -3.16 -0.6
e
-Z"%"Z log(IZI/D.) _degree
168 xl.05_ 2.9 _xl.05 50 xl.05
56 1.3 +1.05 10_._.-- +1.05
0 ' i i i i i I i , I i i i i0 84 252 -3.16 -0.6 -3.16 -0.6
Z'/_ log(I/Hz) log(f/Hz)
RA.M-6420-50A
Figure35. Changesin the complex-plane,Bodeandphase-angleplotsdue tovariationsinthe values ofo and9.
Data forslabwith0% contentof CaCI2, Case 1, referenceelectrodeatposition2, corrosionat middlesite,Run No. 1, imposedAC currentof330 I.LA.
59
zC.zNCZk= (8)
(I - O)Zc+ ez_¢
As shown in Figure 33(b), ZNc can be viewed as an RC circuit in series with a hig.h-frequency resistance {R_), while ZC can be viewed as a Randles-type circuit in series witha high-frequency resistance (R_) and including a semi-infinite Warburg impedance due tooxygen diffusion. The Wa.,'burgterm is given as
Zw = a(1 -j)o -Ip- (9)
where a is the Warburg coefficient.
The complete set of equations for the transmission line models used here is given in the fulltechnical report of this project. In all the numerical analyses carried out in this work, thenumber of segments in the n'ansmission line has been kept constant and equal to seven.
MODEL FITTING AND RESULTS OBTAINED
The use of wansmission line models to simulate impedance data for corroding rebarrequired the development of suitable computer algorithms. Initially, we thought that thiscould be simply accomplished by using a commercially available computer program,OPTDES, which was written especially to aid interaetively in the optimization of models todescribe experimental data. However, the efficient use of OFTDES depended on havingreasonable initial values for the several parameters being optimized. In order to generatethe initial values, we developed a computer program in BASIC 5.0 for HI) 9816S computerthat enabled us to vary the parameters employed in the wansmission line model in aninteractive manner to simulate the experimental impedance data (this simulation was quitestringent, since the complex-plane, Bode, and phase-angle plots for a specific data set wereall required to be simulated by the model at the same time). A copy of this program isgiven in the f'mal technical report.
Using the HI' 9816S computer, we searched for appropriate values for the differentparameters in the equations; we refer to the process as fitting. Fitting became possibleafter a sensitivity study, i.e., a study of how variations in the values of the differentparameters (Re, R**,RNC) CNC,RC, Cc, o, and 0) affect the theoretical data obtained andhence the theoretical complex-plane, Bode, and phase-ap.gle plo_ Results of thesensitivity study showed that variations in three (Rc, Cl_c, and Rt:) of the eight parametersdid not greatly affect the results; thus, these parameters were kept constant thereafter.Figures 34 and 35 show how variations in R**,RNc, CC, o, and 0 affect the complex-plane, Bode, and phase-angle plots. Taking these variations into account, we find sets ofvalues for the parameters resulted in good fits for each of the different experimental datasets. This fitting was carried out by fixing values for the different parameters and seeing(with the help of the HP 9816S computer) the resulting complex-plane, Bode, and phase-angle plots; then, depending on the resulting plots, the values of the parameters were
60

modified untilsatisfactoryresultswereobtained.Thus, the values of the parameterswere• fixed by the computer operatorusing theprevioussensitivity study as a guide.
Examples of the fittingsobtainedare showninFigures 36 through 38 for the experimentalconfigurations cited. By inspectingthesefigures, we infer that the theoretical fitting isgood for all threeplots; thisis also the casefor the majorityof the experimentaldataobtained. Table7 containsthefitted values for the differentparameters of the transmissionline model used. As can be seen fromthis table,the fittingof the data for eachposition ofthe reference electroderequiresa differentset of values forthe model parameters. The useof the averagevalueof theseparameterswas testedto describethe threedifferentcaseswithout success,conf'mningthat each position of the referenceelectrode requiresits ownset of parametervalues.
This finding is surprisingbecausea singleset of modelparametersmight be expected todescribethe impedancefunctionmeasuredat all referenceelectrodepositions. However,our experimentalstudiesindicatedthatwhen the ac amplitudeis large, the systemresponseis not strictly linear, so that an equivalentcircuit composed of passive elements, suchasresistors and capacitors,cannot be used. In addition, the measurementswere performedover several weeks, so that the system parameters(e.g., concrete/rebarimpedance andconcrete resistivity)may have changedwith time.
We furtherexploredthe effect of referenceelectrodeposition by fabricating an electricalequivalent circuit(wansmissionline) using standardresistorsand capacitors. By measuringthe impedance with the reference electrodepositioned at variousdistances down the linefrom the counterelectrode,we found the same aend in impedancewith referenceposition asfor the concreteslab. Furthermore,on fitting the transmission line model to theexperimental data fromthe electricalequivalentcircuit,we did indeedobtaindifferentsetsof parameters. The most like]yexplanationis that when the potential is sensed at any pointother than that at which the current is sensed, the system is no longer of "minimumphase"as demanded by linear system theory._
After the fLrStfitting using the BASIC 5.0 program,ff furtherrefinements were necessary,then the OPTDESprogramcan be used. Forinstance, if we want the theoretical andexperimental complex-planedata to not differmuch forthe low-frequencyrange, we canachieve this by settingOPTDESto minimize the following function:
A (10)logt l l /
where the summationis carriedout overall (n) frequencies, IZ'ex,Iis the experimentalimpedance modulusfor frequency i, IZ_,,Iis thecal_lated (frS/fithe model)impedance modulusfor the samefrequ_y i, and IZe_'DIis the highest value forthe
• experimental impedancemodulusin thefrequency rangeof the specific data set being fitted.At the same time OPTDEScan be set to keepthe value of the following functionsbelowspecified values:
61

0192
964o,1." _" 4" '_ "4" '¢" ,i.-
@
96 192
Z'/_
/'7 f2.9 so
.9 2.1 ++ t++ ".**
1.3 10 _" "'t%+***_,.,,_• I , t , I i ! , L ' I J I • J , I ,
-3.16 -0.6 -3,16 -0.6
log (I/Hz) log (f/Hz)RA-M-6420-51A
Figure 36. Experimental (.) and theoretical(+) complex-plane,Bode,and phase-angleplotsfor experimentalconfiguration,Case 1" slabwith0% contentofCaCI2, corrosionat middle site,Run No. 1, imposedAC current of3301_A,reference electrodeat position2 (see text).
62

_|. , ,I
72 144
Z'_
3.7
__.2.9
m 2.1 _*+***** _- ".+ttf ,,1,4,'_l''lk •
o,,#,
1.3 *********4 -": : : : : :" 10 "%
! , J , I , ! , , I , ! , I ! ,
-3.16 -0.6 -3.16 -0.6
log(f,/Hz) log(f/Hz)RA-M-6420-52A
Figure 37. Experimental(-) andtheoretical(+) complex-plane,Bode,andphase-angleplotsfor same experimentalconfigurationas that for Figure32, exceptreferenceelectrode is at position5 (seetext).
63

136
68
t I..,,J/! , • I =
68 136
Z "/_
3.7
2.9 _ 5o
o_ 2.1 _*I.,,,% ._. ,_._'t"H"t't,,_ ,#,¢, ',4, ,,#
I _IP • ,e'e'e _I, 44't'_l'°'ee't'e'P_P'PiPt
e_. ¢,1.3 '**+_ttl't.H..H..H-j-: 10 -
/ _ J _ I i J • I , J_ ] • ! • I..-,,a I ,
-3.16 -0.6 -3.16 -0.6
log (f/Hz) log (f/Hz)RA.M-6420-53A
Figure 38. Experimental (-) andtheoretical(+) complex-plane,Bode, and phase-angleplotsfor same experimentalconfigurationas thatfor Figure 32, exceptreferenceelectrode isat position8 (see text).
64

Table 7
FITTED VALUES FOR THE DIFFERENT PARAMETERS OF THE TRANSMISSIONLINE MODEL USED TO SIMLUATE THE RESULTS FOR EXPERIMENTAL
CONFIGURATIONS a
Rcfcrcncg El¢ctr0_¢ Position
Parameters 2 5 8
Rs/(_.crn) 945.0 945.0 945.0
R_(fl.cm 2) 12000.0 55000.0 95000.0
RNC/(_.cm 2) 300.0 300.0 300.0
CNC/(_F.cm -2) 10.0 10.0 10.0
RC/(_.crn 2) 0.5 0.5 0.5
cC(_F.cm "2) 75.0 50.0 25.0
a/(t_.cm2.s -1/2) 9000.0 18000.0 25000.0
O 0.942 0.820 0.750
aSlab with 0% content of CaCl2, case 1, corrosion at middle site, imtmse,d ac current of330 _A, ran no. 1, and reference elccn'ode position as shown.
65

/i i _2
= --gi/ (11) •i--1 ¢o,,p /rri
,iC = X IZ'ixp" Z,.lcl (12)
i=1
and
11"1
= z,,i _,,i [D _ exp"--, _ct (13)i=1
where 0 is the phase angle, Z' is the real component of the impedance, Z" is its imaginarycomponent, and m is the number of low-frequencydata points for which the fitting shouldbe optimized. The final technical report containsa copy of the computer subroutine forOPTDES that carries out such a fining for m = 7.
In summary, we were able to successfully model experimental impedance data for rebar inconcrete in terms of an electrical transmissionline. Consequently,wecan derive the valuefor the polarization resistance for the rebar/concreteinterface (see below) and also map thedistribution of corrosion, provided a reasonable understanding of the model parameters isgained. While our workhas demonstrated the sensitivity of the impedance function tocorrosion of rebar, we have not developed ULFACIS as a practical tool; doing so wouldrequire additional theoreticaland experimentalwork to derive suitable data analysisalgorithms and to explore the ultimate sensitivityof the method.
The importance of the workdescribed abovelies in our demonstrationthat the electricalproperties of reinforcing bar in concretemay be modeled using an elecwical wansmissionline. Thus, we are now in the position of possessing the necessary techniques forextracting thepolarization resistance from measuredimpedance data and to use this quantityto estimate the corrosion rate of the rebar. It is important to note that, because the length ofthe rebar sampled by the electrical perturbation increases as the frequency decreases, it isnot possible to determine the true polarizationresistance (Rp)directly from the impedancelocus of the type illustratedin Figure 4(a) eventhough in the past many authors haveerroneously assumed that Rp is equal to Rim- Ru.
66

4
MEASUREMENT OF CORROSIONRATE
In the previous sections, we explored the viability of UI.£ACIS for surveying co_xlingrebartodeterminetheposition(s)atwhichcorrosionoccursinnonuniform,one-dimensional extended structures. However, Feliu et al.11have argued that in salt-impregnated structures, such as bridge decks and highways, corrosion quickly extendsacross the entire rebar lattice so that the need to locate specific areas of attack may be moot.In these cases, it is more important to obtain a reliable measure of the polarizationresistance, from which the corrosion rate may be calculated. The dh-ect estimation of the"u'ue"polarization resistance (Rp) of embedded metallic bars in concrete is not feasiblebecause thedistance that the eld:trical signal applied to the concrete-rebar system extendsdown the bar increases as the frequency is lowered. Accordingly, the area sampled isfrequency dependent, and the measured polarization resistance yields erroneous estimatesof the corrosion rate when used in the Stearn-Geary equation. Furthermore, embeddedrebar is a dynamic system whose electrical characteristics change with time andas changesoccur in the environment. Consequently, the concrete resistivity and the interfacialimpedance (impedance between the concrete and the rebar) may themselves be time-dependent quantities. These factors must be taken into account when any electrochemicaltechniqueisattempted to measureRp.
As notedabove,theaccuratedctcrrninationofthepolarizationresistanceisnotasimplematter becausetheelectricalperturbationbecomesincreasinglyattenuatedwithdistancefromthepointofapplication.Becausetherebarcanbedescribedasanelectricaltransmissionline,we havepreviouslyarguedthattheareaofrebarsampledusinganytime-orfrequency-dependentperturbationincreasesasthetimefromapplicationofthesignalincreasesorasthefrequencydecreases.Nonetheless,thepossibilityofestimatingthepolarizationresistance,Rp,inalargereinforcedconcreteslabbymeansofsimple,remotemeasurementsisveryartr:activctoengineersinthefieldbecauseitwouldpermitrapid,
67
nondestructivesurveyofcorrosiondamagetoreinforcedconcretestructures.Inthissection,we describea method fordeterminingthepolarizationresistance,andhencethercbarcorrosionrate,usingacimpedancespccuvscopy.
Theproposedmethodisbasedonthetransmissionlinemodeldescribedintheprevioussection.Feliuetall2,13developeda similarapproach,buttheyassumedthatthembar-concretesystemcouldbcrepresentedbyacompletelynonreactivemodel.Theirapproachisvalidonlyiftheimpedanceoftherebar-concretcsystemcanbcmcasure,d atsufficiently/owfrequenciesthatthephaseangle_ --_0.Our experienceindicatesthatthisisseldomthecase(e.g.,secFigure8),sothatwe willexplorethemoregeneral,reactivecaseforwhichtheinterfacialimpedanceisrepresentedasaparallelcombinationofresistanceandcapacitance(Figure39).
The techniquedevelopedinthiswork,whichwe mfcrtoasZSCAN ®,makesuseofourfindingthattheelectricalpropertiesofrebarinconcretecanbcdescribedintermsofanelectricaltransmissionlineequivalentcircuit(Figure40).Inrealitywc havechosenabifurcatedtransmissionlinetorecognizethefactthatthercbargenerallyextendsintwodirectionsfromthemonitoringpoint(x= 0)andwc recognizethatthelengthsofthetwoarmsmay notbeequal.By applyingKirchoffsequationstoasmallincrementoftheline,asdescribedelsewhere(seeFinalTechnicalReport),we arcabletoderivethefollowingexpressionfortheimpedanceoftherebar/conc'mtesystem
zz(n)=]£1 ._ I)•=o +I)+ +I)(e-2-I) u4)
whereRcistheresis_nceperunitlengthoftheconcrete,
a (15)
andZ istheimpedanceperunitlengthofthebar.
To completethederivation,we describetheimpedanceofthesteel/concreteinterfaceinterms of the electrical equivalent circuit shown in Figure 39. Accordingly,
Rp o_R,p:_.c (16)l/dx- Rs@ 1 2_c2 -J | _p2_2
where Rs is a series resistance, w is the circular frequency, and R;, and C.care thepolarization resistance and interracial capacitance, respectively, per unit length of the rebar.These latter two quantities are related to the specific parameters as
68
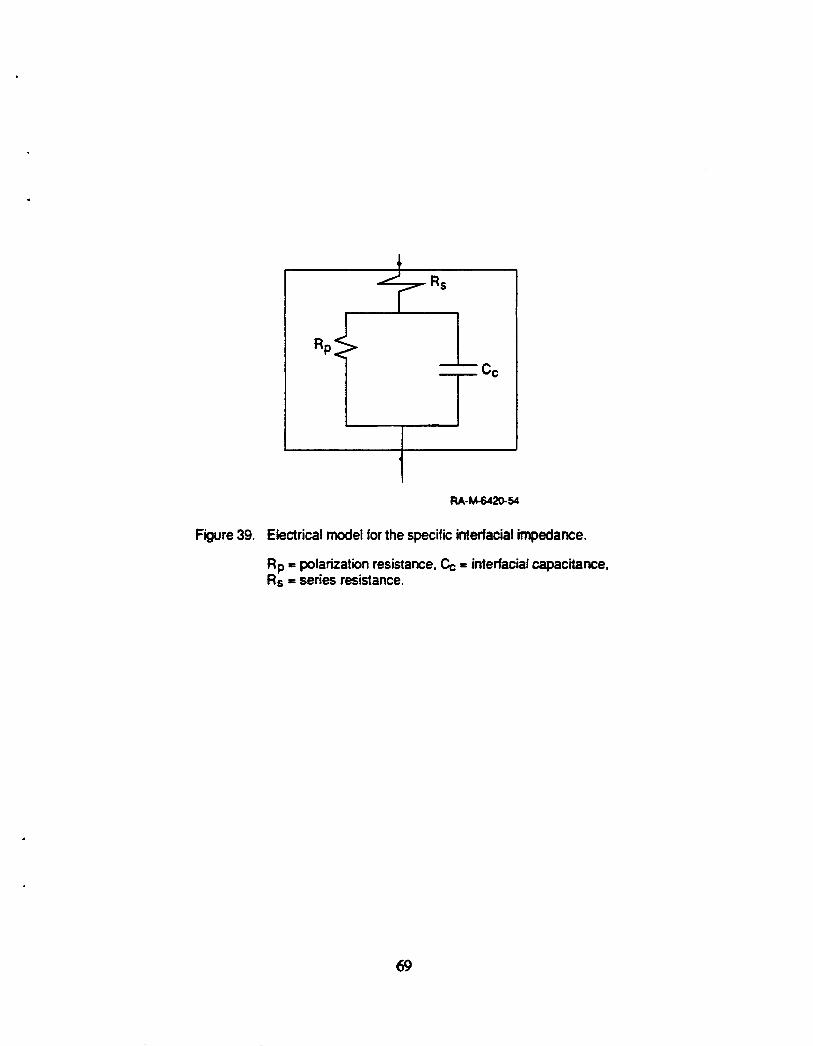
Rs
RA-M-6420-54
Figure39. Electricalmodelforthespecificinterracialimpedance.
Rp= polarizationresistance,Cc= interfacialcapacitance,Rs= seriesresistance.
69

!
I
M =1_ L -"-
Rc Rc Rc Rc Rc Rc Rc Rc
A
Q o x(a)
V + dV i i - diV
_" ": JV_ .: w, ,_'_
"_---'-dx -- _ dx----_
-L
(b)RA-M-6420-56
Figure40. Equivalentcircuitrepresentationof a uniform-finitetransmissionline.
(a) Schematicrepresentationof a finitetransmissionlinewherethecurrent] isappliedatthepointA, distantLcmfromtherightendandM cmfromthe leftend. (b) Detailednodeanalysisofan infinitesimallysmallelementintheLbranch.
7O
Rp = Rp/2m'dx (17)
" _ = 2_rdx.C¢ (18)
whereristheradiusoftherebar.Our objective,then,istofitthetransmissionlinemodeltoexperimentalimpedancedatatoextractvaluesforRs,Rc,R_ andC.c.Theanalyticproblemsthatwe facedwereclearlyonesofthedesiredquantaucsbeingdeeplyburiedinthemodelandthenonlineardependenceoftheimpedanceontheinterfacialpazan_ters.
TheoptimizationprocedureemployedinthisstudyisbasedonourpreviousworkonthedegradationofporousNi(OH)2/NiOOHbatteryelectrodesoncycliccharging/discharginginalkalinesolutions.23Inthatstudy,we developedanoptimizationprocedureforestimating the parameters of a transmission line that was used to represent the porouselectrode after preselected numbers of cycles. In this regard, our present application iscomparable to the previous one. The core of the optimization procedure makes use ofOPTDES, 24 which is a software package used to perform fitting of data to a preconceivedmodel involving several variables related in a linear or highly nonlinear manner. The fittingprocedures are used to extract values for the variables when a function to be minimized isgiven and a set of constraints is listed. We defined the function to be minimized as
F=_ (Zc((Di)-Ze(f, oi))2 i= 1 _Z,(coi)+_! (19)
subject to the following two constraints:
isFi= (2O)
Fi+N Oi _0e(Oi) + 0¢(Oi) J (21)
whereZ'and Z"aretherealand imaginarycomponentsoftheimpedanceIZ(fg)listheimpedancemagnitude,0(_) thephaseangle,withecircularfrequency,andsubscripts"c"and"e"designatecalculatedandexperimentalquantities,respectively.Theconstraintsarethattheindividualdifferencesbetweencalculatedandexperimentalimpedancemagnitudeandphaseangleatdifferentcircularfrequencieswishouldnotexceed0.I.
71

As previously noted, the rebar/concrete interface is represented by a parallel combination ofthe polarizationresistanceand a capacitancein serieswith theconcreteresistancein thedirection perpendicularto the surface(Figure 39 and 41). Theparametersthat wewish toextractdirectly from the fitting procedure,whenthe functionF is minimized, arc the ^interracial concreteresistance,Pc, the seriesresistance,Rs,thepolarization resistance,Rp,andinterfacia]capacitance,C.¢,allperunitlengthoftherebar.The inputparametersfortheminimizationprocedurearc:
P-c(D./crn) Concreteresistanceperunit length
L (crn) Distancebetweenthepointwheretheimpedanceismeasuredandtheleftendof thesystem
M (crn) Distance between the point where the impedance ismeasured and the right end of the system
Z(_)= Z'(00)-jZ"(co)(_) Impedanceoftheconcrete-rebarsystem
r (cm) Radius of rebar
re(rat/s) Circularfrequency
During our initial work ojQtiffs problem, we found that multiple solutions (that is, differentcombinations of Pc, Rs, R_, and Cc ) existed that appeared to represent the impedancecharacteristics equally well. However, the problem of selecting the most appropriate set isgreatly eased by noting that at an effectively infinite frequency Z = Rsdx and hence
ZT(m _ =o)= (pcRsdx)Ir2 (22)
or
Rs = Z_co-_,_)/(Rcdx) (23)
The problem is further eased by assuming that we know the resistance of the concrete perunit length, Pc, which we may estimate from the concrete resistivity and the geometry ofthe system.
If the impedance data can be measured at sufficiently high and low frequencies or can beexlrapolated so that the impedance locus intercepts the real axis at both limits, then fromEquation (16), we may write
72
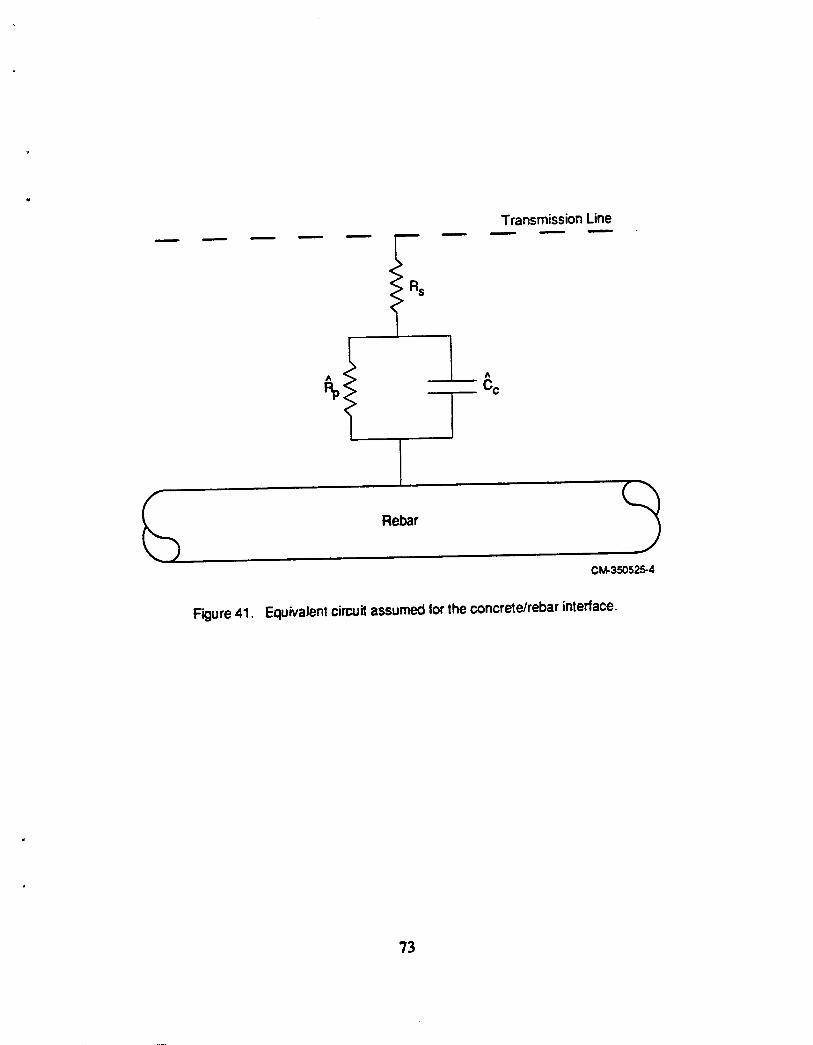
TransmissionLinei i i
I II
CM-350525-4
Figure41. Equivalentcircuitassumedtortheconcrete/rebarinterface.
73

= (R R,dx)I/2 (24)and
Z'TO --(l_Rsdx + RpRcdx) 1/'2 (25)and,hence
Rp = [(Z_)2-(Zp=)2]/(Rcdx) (26)
Note that this procedure for estimating an initial value for Rp applies strictly to an infinitetransmission line and requires an a priori estimate of Pc. I-J,owevcr,Equation (24) hasproved to be most useful for estimating an initial value for Rp for the optimizationprocedure described in this paper.
Any physically realistic model fined to experimental data using wen-fviwulatedminimization and constraint functions will yield not only a calculated impedance thatemulates the experimental data but also physically sensible and accurate values of thevariables Rs. Rp, and Cc. Since no apriori method exists for determining the accuracy ofparametervaluescalculatedfromtheexperimentaldata(becausewe havenoindependentknowledgeofthesevalues),we testedthefiningprocedureusingsyntheticimpedancedatabycomparingthecalculatedparameterswiththoseinitiallyusedtogeneratethe"experimental"impedanceusingthetransmissionlinemodel.Numeroustrialsusinggyntheticdatayieldedexcellentresults,withthetheoreticalvaluesfortheparametersRs,
Rp,and _ beingretrievedregardlessoftheinitialguessesem,_IoyedintheoptimizationprocedurewithI < Rs < I000f2,I00< Rp < I00,000t'2-cm,and0.000005< C.c< 0.1F/cmz.Thesevaluesareconsideredtoberepresentativeofthosethatarcfoundforcorrodingrebarinconcrete.Thenumericalanalysessmnmafize,d abovedemonstratethattheanalyticalproceduresdevelopedinthisworkarecapableofyieldingaccuratevaluesforthepolarizationresistanceaswellasthecorrosioncapacitanceandseriesresistance,providedtheelectricalpropertiesoftherebar/concretesystemcanbeadequatelymodeledbythetransmissionlineshown inFigure40.
Becausethemethodrequiresindependentknowledgeoftheconcr,_teresistivity,itisimportanttoassessthesensitivityofthevaluesobtainedforRs,Rp and_¢tothevalueassumedforPc.Thissensitivityrelationshipwasexploredbyintroducingsystematicerrorsof+20%, +I0%, -I0%,and-20% intothevalueofPc.The resultsareshown inTable8. Clearly,we wereabletoretrifvethevaluesforRsand_ exactly,regardlessofthe uncertainty in Pc, and the errorin Rp is negligible. Therefore, moderate uncertainty inthe concrete resistivity, as might be experienced in the field, can be tolerated by theanalytical procedure developed in this work.
We used the procedure developed in this work to exu'act corrosion parameters fromimpe--hnce data obtained on actual rebar/concretc slabs employed in this study. While theexperimental configuration is not ideal, in that the counter and reference dcetmdcs were notcoincident (i.g. concentric) as depicted in the lransmission line model shown in Figure 40,we obtained Rp values ranging from 1 x 10² to 1 x 10⁹ D, Rs values ranging from 0 to100 f2, and _.¢ values ranging from 1000 to 5000 i.tF for rebar in concrete that does not
74
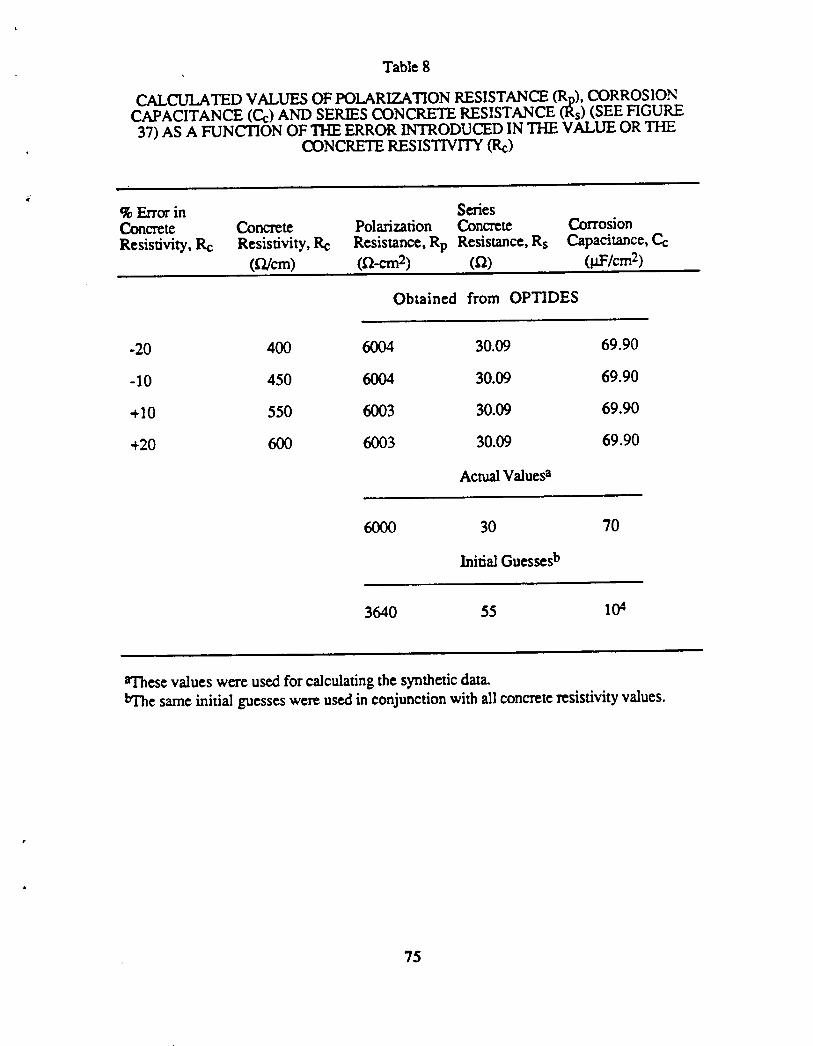
t
Table8
CALCULATED VALUES OF POLARIZATION RESISTANCE 0Rp),CORROSIONCAPACITANCE (Cc) AND SERIES CONCRETE RESISTANCE (Rs) (SEE FIGURE37) AS A FUNCTION OF THE ERROR INTRODUCED IN THE VALUE OR THE
• CONCRETE RESISTIVITY(Pc)
% Errorin SeriesConcrete Concrete Polarization Cone-rote corrosionResistivity, Rc Resistivity, P,c Resistance, Rp Resistance, Rs Capacitance, Cc
(D./cm) (i'2-crn2) (_) (v.Flcm2)
Obtained from OPTIDES
-20 400 6004 30.09 69.90
-10 450 6004 30.09 69.90
+I0 550 6003 30.09 69.90
+20 600 6003 30.09 69.90
ActualValue#
6000 30 70
Initial Guesses b
3640 55 104
aThese values were used for calculating the synthetic data.bThc same initial guesses were used in conjunction with all concrete resistivity values.
75
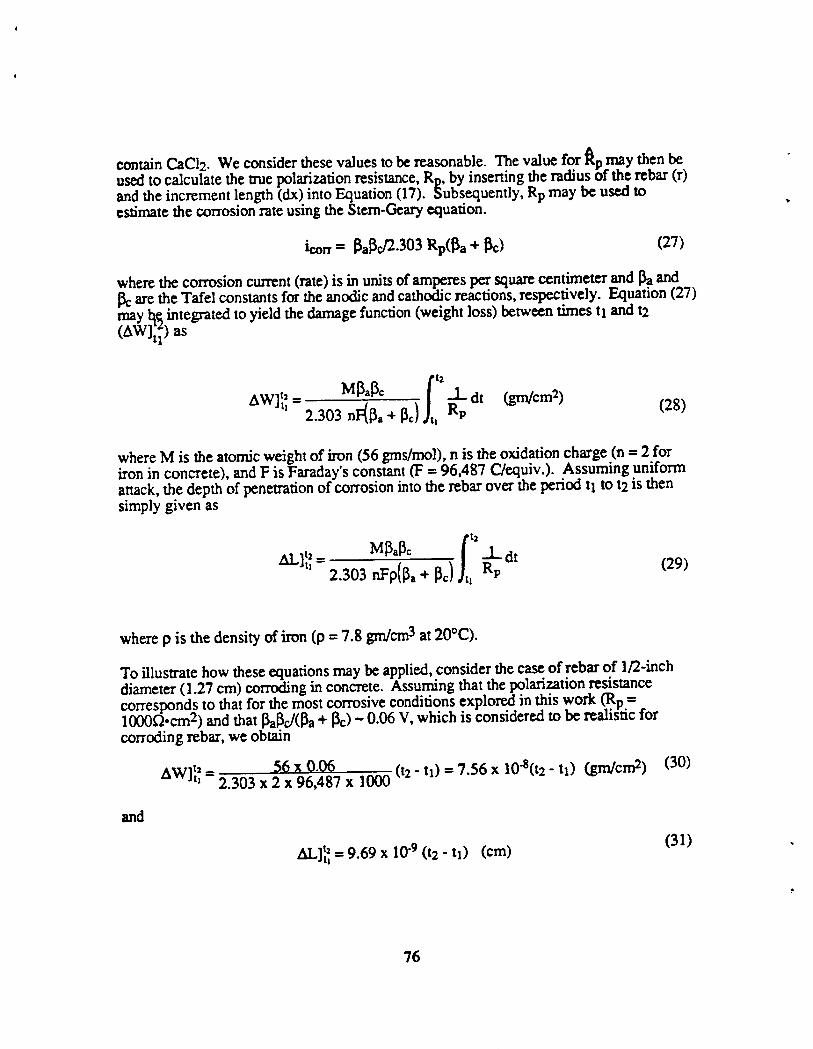
contain CaCI2. We consider these values to be reasonable. The value for t_p may then beused tocalculate the true polarization resistance, Rp, by inserting the radius of the rebar (r)and the increment length (dx) into Equation (17). Subsequently, Rp may be used toestimate the corrosion rate using the Stem-Geary equation.
icon = Paled2.303 Rp(Pa + Pc) (27)
where the corrosion current (rate) is in units of amperes per square centimeter and [3aandare the Tafel constants for the anodic and cathodic reactions, respectively. Equation (27)
may lqqintegrated to yield the damage function (weight loss) between times tl and t2
(AWing)as
= ...i_dt (gm/cm 2)2.303 R, (28)
where M is the atomic weight of iron (56 gins/tool), n is the oxidation charge (n = 2 foriron in concrete), and F is Faraday's constant (1:= 96,487 C/equiv.). Assuming uniformattack, the depth of penetration of corrosion into the rebar over the period tl to t2 is thensimply given as
zm]'?,= M ,IB= tI'_L dt2.303 nFp{pa+ Pc) J,, Rp (29)
where p is the density of iron (p = 7.8 grn/cm3 at 20°C).
To illustrate how these equations may be applied, consider the case of rebar of 1/2-inchdiameter (1.27 cm) corroding in concrete. Assuming that the polarization resistancecorresponds to that for the most corrosive conditions explored in this work (Rp =1000_.crn 2) and that [3al3c/(_a+ 13c)- 0.06 V, which is considered to be realistic forcorroding rebar, we obtain
AW][_ = _6 x 0.06 (t2 - tz) = 7.56 x 10"8(t2- tz) (gm/cm 2) (30)2.303 x 2 x 96,487 x 1000
and
Al-]t, - 9.69 x 10.9 (t2 - tz) (cm) (31)
76
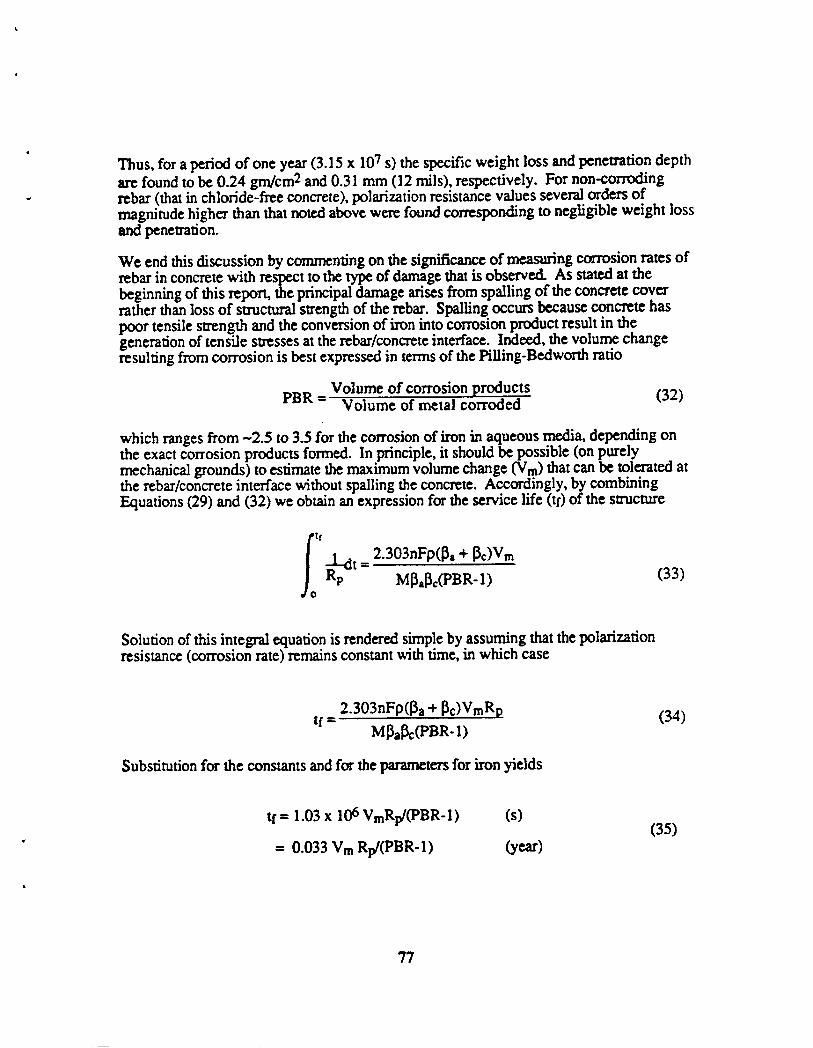
Thus, for a period of one year (3.15 x 10⁷ s) the specific weight loss and penetration depthare found to be 0.24 gm/cm 2 and 0.31 mm (12 mils), respectively. For non-corroding
- rcbar (that in chloride-free concrete), polarization resistance values several orders ofmagnitude higher than that noted above were found corresponding to negligible weight lossand penetration.
We end this discussion by commenting on the significance of measuring corrosion rates ofrebar in concrete with respect to the type of damage that is observed. As slated at thebeginning of this report, the principal damage arises from spalling of the concrete coverrather than loss of structural strength of the rebut. Spalling occurs because concrete haspoor tensile sm_ngth and the conversion of iron into corrosion product result in thegeneration of tensile stresses at the rebar/concrete interface. Indeed, the volume changeresulting from corrosion is best expressed in terms of the Pilling-Bedworth ratio
Volume of corrosion productsPBR = Volume of metal corroded (32)
which ranges from -2.5 to 3.5 for the corrosion of iron in aqueous media, depending onthe exact corrosion products formed. In principle, it should be possible (on purelymechanical grounds) to estimate the maximum volume change (Vm) that can be tolerated atthe rebar/concrete interface without spalling the concrete. Accordingly, by combiningEquations (29) and (32) we obtain an expression for the service life (tf) of the structure
fl f-l-dr = 2.303nFp([_a + [3¢)VmRp M_I_e(PBR- 1) (33)
Solution of this integral equation is rendered simple by assuming that the polarizationresistance (corrosion rate) remains constant with time, in which case
2.303nFp(_a+ [_c)VmRptf- (34)M_a_(PBR-I)
Substitutionfortheconstantsandfortheparametersforironyields
tfffi1.03x 106VmRp/(PBR-I) (s)(35)
" = 0.033Vm Rp/(PBR-I) (year)
77
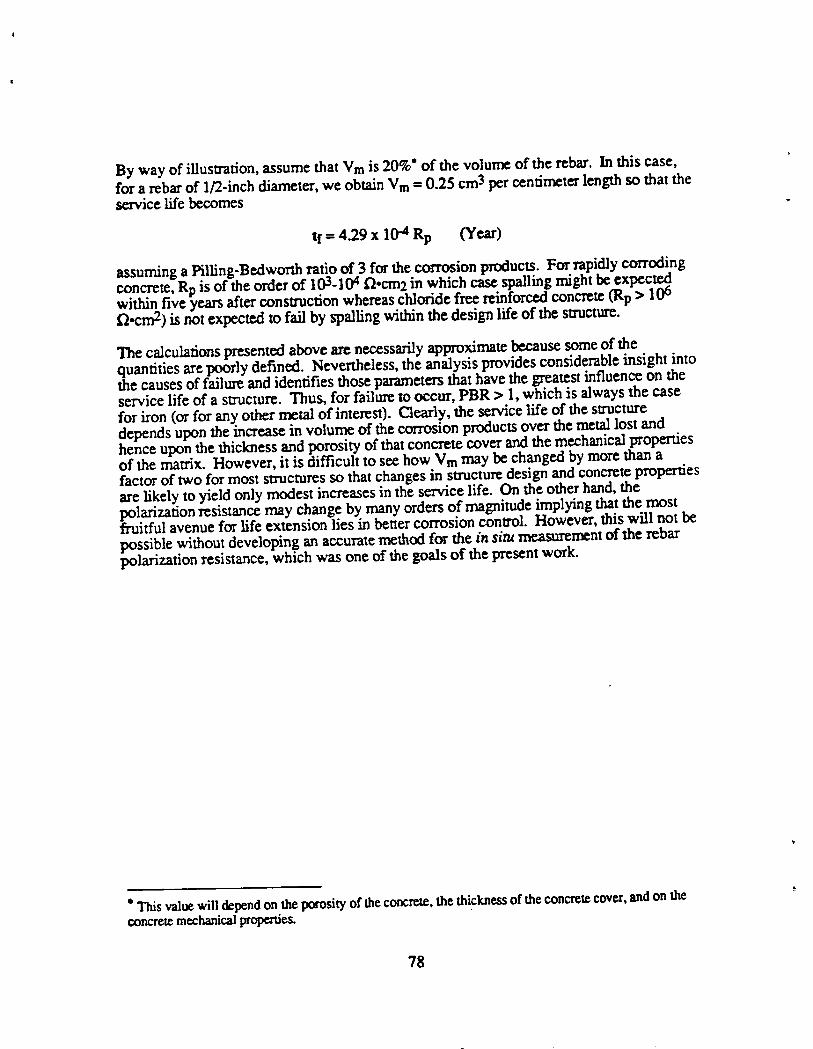
By way of illustration, assume that Vm is 20%"of the volume of the rebar. In this case,for a rebarof 1/2-inch diameter, we obtain Vm = 0.25 cm3 per centimeter length so that theservice life becomes
v
tf=4.29xI0-4Rp (Year)
assumingaPilling-Bedworthratioof3 forthecorrosionproducts.Forrapidlycorrodingconcrete,RpisoftheorderofI03-I0ai2-cm2inwhichcasespallingmightbeexpecte_I.withinfive),earsafterconstructionwhereaschloridefreereinforcedconcrete(Rp> 10o£2-cm2)isnotexpectedtofailbyspallingwithinthedesignlifeofthestructure.
The calculations presented above are necessarily approximate becausesome of thequantities are poorly defined. Nevertheless, the analysis provides considerable insight intothe causes of failure and identifies those parameters that have the greatest influence on theservice life of a structure. Thus, for failure w occur, PBR > 1, which is always the casefor iron (or for any other metal of interest). Clearly, the service life of the structuredepends upon the increase in volume of the corrosion products over the metal lost andhence upon the thickness and porosity of that concrete cover and the mechanical propertiesof the matrix. However, it is difficult to see how Vm may be changed by more than afactor of two for most structures so that changes in structure design and concrete propertiesare likely to yield only modest increases in the service life. On the other hand, thepolarization resistance may change by many orders of magnitude implying that the mostfruitful avenue for life extension lies in better corrosion control. However, this will not bepossible without developing an accurate method for the in situ meamrement of the rebarpolarization resistance, which was one of the goals of the present work.
*Thisvaluewilldependon theporosityoftheconcrete,thethicknessoftheconcretecover,andon theconcretemechanicalproperties.
78

5
FUTURE TECHNOLOGYTRANSFER TO THE FIELD
While much of the work reported here is fundamental in nature, in that we sought todevelop an understanding of the physical and electrochemical natureof the corrosion ofrebar in concrete, we have solved the problem of extracting the polarization resistance from
impedanc_ data and hence we have developed a more accurate and reliable method(ZS.CAN) for measuring corrosion rate. This development is most important for theengineer in the field because we can offer, for the fhst time, a practical technique, soundlybased on theory, for nondestructively surveying rebut with respect to corrosion rate. Webelieve that relatively simple, cost- effective instrumentation can be developed to providethis important capability to surveying crews. However, the practicality and ultimateaccuracy of ZSCAN _ can only be assesssed and demonstrated by developing andevaluating the instrumentation and software in cooperation with engineers in the field onactual concrete s_'uctures.
The ZSCAN @insmament package would consist of five components: (1) counter andreference electrode assembly, (2) a conmalled currentoscillator that can generate asinusoidal current of suitable amplitude over a wide frequency range, (3) data aquisifionhardware/software including a transfer function analyzer driven by a microcomputer, (4)data analysis software based on the OPTDES optimization algorithm, and (5) a-fourelectrode probe for measuring concrete resistivity. It is too early to estimate the cost ofsuch a package, but we note that inexpensive transfer function analyzers, such as thatoffered by CPCIS/Voltech Instruments Ltd., UK, for £1800 (-$2900), are now becomingavailable. We envisage that the entire inslrument package including the computer and
• operator stationcould be accommodated in a small utility van. In this way, the instrumentwould be highly mobile and could be used to survey a large number of structures over awide geographical areaefficiently and cost effectively.a,
79

6
REFERENCES
1. l:h'oc. Symp. Corrosion Steel Reinf. Concr. Constr., Soc. Chem. Ind. London(1979).
2. J.E. Slater, "Corrosion of Metals in Association with Concrete," ASTM STP 818,ASTM, Philadelphia, PA (1983).
3. Proc. Conf. C,ath. Prot. Reinforced. Concr. Bridge Decks, NACE, Houston, "IX(1985).
4. D.D. Macdonald, M.C.H. McKubre, and M. Urquidi-Macdonald, Corrosion-NACE, 44, 2 (1988).
5. J.L. Dawson, J. A. Richardson, L. M. Callow and K. Hladky, "Elecn'ochemicalImpedance Measurements Applied to the Corrosion of Reinforced Steel in Concrete,"CORROSION/78, Paper 125, NACE, Houston, TX (1978).
6. D.G. John, P. C. Searson, and J. L. Dawson, Br. Corrosion J., 16, 102 (1981).
7. P. Lay, P. F. Lawrence, N. J. Wilkins, and D. E. Williams, J. Appl. Electrochem.,15, 755 (1985).
8. K. Matsuoka, "Monitoring of Corrosion of Reinforcing Bar in Concrete,"CORROSION/g7, Paper 121, NACE, Houston, 'IX (1987).
9. A.A. Sagues, "Corrosion Measurements of Reinforcing Steel in Concrete Exposedto Various Aqueous Environments," CORROSION/87, Paper 118, NACE, Houston,"I'X (1987).
$0

10. D.G. John et al, "Corrosion Measurements on Reinforcing Steel and Monitoring ofConcrete Smaetures," CORROSION/87, Paper 136, NACE, Houston, TX (1987).
11. S. Feliu, J. A. Gonzalez, M. C. Andrade, and V. Feliu, "On-site Determination ofthe Polarization Resistance in a Reinforced Concrete Beam," CORROSION/87, paper145, Houston, TX (1987).
12. S. Feliu, J. A. Gonzalez, M. C. Andrade, and V. Feliu, Corrosion Eng., 44, 761(1988).
13. S. Feliu, J. A. Gonzalez, M. C. Andrade, and V. Feliu, Corrosion Sci., 29, 105(1989).
14. J.J. Coleman, Trans. Elecla'achem. Sac., 90, 545 (1946).
15. R. de Levie, Elecu'achim. Act,a, 9, 1231 (1964).
16. R. de Levie, Electrachim. Acta, 10, 113 (1965).
17. R. de Levie, in Advances in Electrochemistry and Electrochemical Engineering, Vol.6, P. Delahay and 12.W. Tobias, Eds., Interscience, New York, 1967, pp. 329-397.
18. M.C.H. McKubre, "An Impedance Study of the Membrane Polarization Effect inSimulated Rock Systems," Ph.D. Thesis, Victoria University, Wellington, NewZealand (1976).
19. S. Aflung and T. Jacobsen, Eieetrohim. Aeta, 21,575 (1976).
20. J.R. Park and D. D. Macdonald, Corrosion Sci., 23, 295 (1983).
21. S.J. Lenhart, D. D. Macdonald, and B. G. Pound, "Resu'ucturing of Porous Nickel• Electrodes," Prac. 19th IECEC Conference, San Francisco, (1984), p. 875.
22. H.W. Bode, Network Analysis and Feedback Amplifier Design, Van Nostrand,New York, 1945.
81
23. D.D. Macdonald and M. Urquidi-Macdonald, J.Elecu'ochem. So<:.,132, 2316(1985).
24. M. Urquidi-Macdonald, S. Real, and D. D. Macdonald, J. Electrochcm. Soc., 133,2018 (1986).
25. M. Stern and A. L. Geary, J. Elcctrochem. Soc., 104, 56 (1957).
26. S.J. Lenhart, D. D. Macdonald, and B. G. Pound, J. Elcctrochcm. Soc., 135, 1063(1988).
82