Pulsed Discharge Detector Models D-2 and D-2-I Instruction Manual
Evaluation of discharge behavior of the pulsed plasmathruster SIMP-LEX
Tony Schönherr∗ and Kimiya Komurasaki†
The University of Tokyo, Kashiwa, Chiba, 277-8561, Japan
Rei Kawashima‡ and Yoshihiro Arakawa§
The University of Tokyo, Bunkyo, Tokyo, 113-8656, Japan
Georg Herdrich¶
Universität Stuttgart, Stuttgart, Baden-Württemberg, 70569, Germany
The pulsed plasma thruster Add Simp-lex, developed at the IRS, was investigated atthe University of Tokyo to further characterize the thruster’s performance and dischargebehavior. This was done by experimental investigation of configurations with a differentamount of capacitors and discrete applied voltages. To do so, a measurement system for thedischarge current and the optical properties was built up and successfully applied. Further,the numerical model for the prediction of the current-normalized magnetic flux densitywas improved and the convergence properties of the integration towards the change ininductance studied. From the discharge current waveforms and the pictures taken from thepropagating plasma, information about the amount of plasma creations, their propagationvelocity and the oscillation behavior was deducted. For further characterization, the energytransfer efficiency and the electrical efficiency was derived from these data, leading to atool to compare different configurations. It was found, that a middle voltage yields higherelectrical efficiencies of about 40% whereas the energy transfer efficiency is higher the lowerthe applied voltage.
Nomenclature
α Half divergence angleδ Grid sizeηacc Acceleration efficiencyηdiv Beam divergence efficiencyηel Electrical efficiencyηtran Energy transfer efficiencyηt Thrust efficiencyΨ Current action integralB Magnetic flux densityI Discharge currentIpeak Peak value of discharge current∆L Change in inductancelchar Characteristic lengthmbit Ablated mass shot
∗Ph.D. student, Department of Advanced Energy, Kashiwa-no-ha 5-1-5, Kiban-tou 313, 277-8561 Kashiwa, Japan,[email protected], and Student Member AIAA.
†Professor, Department of Advanced Energy, Senior Member AIAA.‡Graduate Student, Department of Aeronautics and Astronautics, Hongo 7-3-1, 113-8656 Bunkyo, Japan§Professor, Department of Aeronautics and Astronautics, and Senior Member AIAA.¶Associate Professor, Head Plasma Wind Tunnels and Electric Propulsion, Institute for Space Systems (IRS), Pfaffenwaldring
31, 70569 Stuttgart, Germany, Senior Member AIAA
1 of 12
American Institute of Aeronautics and Astronautics
46th AIAA/ASME/SAE/ASEE Joint Propulsion Conference & Exhibit25 - 28 July 2010, Nashville, TN
AIAA 2010-6530
Copyright © 2010 by Tony Schönherr. Published by the American Institute of Aeronautics and Astronautics, Inc., with permission.

t Discharge time
I. Introduction
The Institute of Space Systems (IRS) of the Universität Stuttgart in Germany is undergoing the challengeof realizing several small satellites within the Stuttgart Small Satellite Program.1 The LEO satellite
Perseus is planned to comprise one thermal arcjet thruster named Talos and one pulsed MPD thrusternamed Simp-lex, both developed and studied at IRS in close national and international collaboration.2,3An important mission objective is the intense evaluation of the on-board electric propulsion systems in re-gard to operativeness, compatibility and reliability for space application. Pulsed magnetoplasmadynamicthrusters, usually referred to as PPT (Pulsed Plasma Thruster), are promising candidates for usage on boardsmall satellites due to the robust and simple design and the very low requirements in the power consumption.They consist of a capacitor bank, a pair of electrodes, an ignition device and the propellant, and create mostof their thrust by acceleration of charged species by Lorentz force in a short-time discharge.PPT can be classified depending on their design (parallel plate, coaxial), on the propellant (ablative, liquidpropellant, gas-fed), on the propellant feed (breech-fed, side-fed), on the ignition method (spark plug, laser)or on the main acceleration method (electromagnetic, electrothermal). Further, size and energy level havesignificant influence on performance and quality of the thruster.Due to imperfect acceleration and phenomena like late-time ablation, pulsed MPD thrusters often suffer fromlow thrust efficiency. Optimization was conducted at IRS with geometric and electric aspects to improve thisthrust efficiency, eventually leading to a new engineering model named Add Simp-lex4,5 showing a tremen-dously higher efficiency. Investigations showed that not only the energy itself but also the balance betweencapacitance and voltage have an influence on the final performance of the thruster, i.e., impulse bit andablated mass shot. While a higher energy in a general sense does lead to a higher efficiency, additional gaincan be achieved by distributing this energy thoughtfully. To entirely understand the phenomena happeningduring the discharge and the influence of energy-related parameters on the thruster behavior, additionalmeasurements of discharge current and plasma propagation speed were seen necessary and conducted withina mutual collaboration at the University of Tokyo.6 A Rogowski coil and a high-speed camera with wave-length filters were used for these purposes, and were applied to thruster configurations with varying voltageand amount of capacitors. The magnetic flux density and the derived change in inductance during theplasma acceleration were calculated using the Biot-Savart law and a numerical integration, with the aim ofproviding input data for the performance model7 and to enable calculation of the electrical efficiency. Furtherinvestigations of the plasma creation and spread were conducted to insightfully characterize the thruster.Information about the energy transfer efficiency, the electrical efficiency and the propagations speeds fordifferent thruster setups were derived and compared. The goal of this study is to understand not only howbut also why the energy distribution affects the performance for a small energy thruster.
II. Experimental setup
Figure 1. Setup of Add Simp-lex.
Experiments were conducted at the Department of Advanced En-ergy of the University of Tokyo. The vacuum chamber used is evac-uated by means of a rotary vane pump and a turbomolecular pumpproviding a throughput of 2.2 ×10⁻³ Pa m3/s at 0.01 Pa. Typi-cal background pressure during experiment was 5 × 10⁻² Pa. Thethruster model used for the experiments is an identical setup of AddSimp-lex as used at IRS in Stuttgart.6,8 It is shown in Figure 1.The engineering model consists of up to 4 capacitors à 20 µF andcan be charged up to 1300 V. Anode and cathode are connected tothe capacitors’ pins with shortest current paths, are made of cop-per and insulated by Kapton™ foil. The pure Teflon™ propellantis placed in between the electrodes in a side-fed configuration. Forthe experiments conducted, the voltage was varied between 500 and 1300 V for configurations of 1 and 4capacitors. No propellant feed system was needed as only few pulses were conducted for the calibration ofthe current probe, and the evaluation of the different thruster configurations. Voltage measurement wasconducted by a Yokogawa 700924 differential high voltage probe.
2 of 12
American Institute of Aeronautics and Astronautics

II.A. Current measurement
Figure 2. Position of Ro-gowski coil.
Due to the limiting geometry of Add Simp-lex, the discharge current wasmeasured by an in-house Rogowski coil,9 placed in a shielding box and aroundthe pin of one of the capacitors as can be seen in Figure 2. The anode electrodeis then placed directly upon the box separated by Kapton foil.The output signal was then lead by BNC cables to avoid strong electromagneticnoise. A passive RC circuit was used for integration of the signal. Calibrationwas conducted and a sensitivity of about 10,000 A/V derived.
II.B. Optical measurement
Figure 3. Optical setup.
A high-speed camera of type Ultra-8 was used to record pic-tures of the plasma propagation. A Nikon 85mm f/1.8 lens wasused to focus the image of the center plane of the electrodes.Two different filters were put into the optical path to enableobservation of a distinct plasma species. At a wavelength of426.8 nm, simple ionized carbon (C+) emits very intensively,so a filter for this species was used to identify the charged par-ticle front whereas a filter for 514.5 nm was used to determinethe strong emission line of excited diatomic carbon (C2), asrepresentative of the neutral particles.Eight pictures with a resolution of 520 × 520 pixel were takenat an exposure time of 100 ns and a frame speed of 5 Mfps.Brightness of the pictures was adjusted by regulating the aper-ture of the lens, and the gain of the camera sensor respectively. While using the filters, the brightness ofthe picture decreased a lot yielding the need for an aperture of f/1.8 and using a high gain. This eventuallyresults in slightly blurry and noisy images.Triggering of the camera was done by a pulse generator which itself was triggered by a photo detectorpointed towards the center of the discharge space. That means that there is a minimum hardware delaymaking it impossible to see the very first few 100 ns of the discharge. However, due to the side-fed thrusterconfiguration the plasma is blocked from view by the propellant bar thus, no information about the plasmapropagation was lost.The optical setup is summarized in Figure 3.
III. Model for magnetic field
To calculate the magnetic flux density and the resulting change in inductance during the discharge ofa pulsed plasma thruster, and particularly for Simp-lex, a calculation method was derived in previouswork4,7, 10 using either Ampère’s law applied to infinite current filaments or the Biot-Savart law. It wasmodified to handle the flared and pointed electrode geometry eventually leading to an increase in computationtime which lead to a reduction of the grid finesse. However, it was found that convergence of the results forsome geometries could not be guaranteed.Modifications and optimization of the computational code were conducted with the aim of reducing thetime needed. Especially, an improvement of variable and memory management, algorithm operations andthe integration method used to calculate the magnetic flux density based on geometry yielded significantsavings in computational load. A transition to Fortran 90, being more suited to this amount of mathematicaloperations, and the extension of the computation on a cluster improved the calculation time furthermore.That is, it was possible to compute finer grids and verify whether or not the calculation is converging.As was shown previously,4 the magnetic flux density can be integrated towards the change in inductancewhich is a result of the propagating plasma, the current sheet respectively. This integration could be donepartially analytically for the calculation method using Ampère’s law, but is entirely numerical in case of theBiot-Savart law. The first step to investigate the convergence of the computation was to verify whether theintegration method itself is converging. For this reason, the following four methods have been applied andcompared: composed Simpson’s rule (S), composed Simpson’s 3/8 rule (S3/8), Newton-Cotes formulas (NC)and the Clenshaw-Curtis integration (CC).11 Figure 4 shows the results of the computations for different grid
3 of 12
American Institute of Aeronautics and Astronautics

sizes and the geometry of Add Simp-lex. The change in inductance computed for the case when the currentsheet reaches the tip of the electrodes is plotted against the grid size, i.e., the reciprocal of the number of gridpoints. For the first 3 integration methods no convergence could be deducted whereas the Clenshaw-Curtisalgorithm shows very good converging properties. It was, hence, selected for further calculations.
606264666870727476
0 0.05 0.1 0.15
Indu
ctan
ce∆
L,nH
Grid δ/lchar, -
NC
+
+
+
S
×
××
×××
×S3/8
2
2
2
2
2
2
CC
△△△△△△
△
Figure 4. Change in inductance for different integration methods and varying grid sizes
Adding a current sheet to the calculation process introduced some strong gradients in the magnetic fluxdensity yielding small instabilities in the numerical integration. Therefore, convergence was investigated fordifferent current sheet thicknesses and types (adaptive or static). An example on how the magnetic fluxdensity is distributed in between the electrodes is shown in Figure 5 for the case with and without currentsheet.
(a) Inter-electrode space in detail (b) Magnetic flux density neglectingcurrent sheet
(c) Magnetic flux density respectingcurrent sheet
Figure 5. Calculated normalized magnetic flux densities for Add Simp-lex.
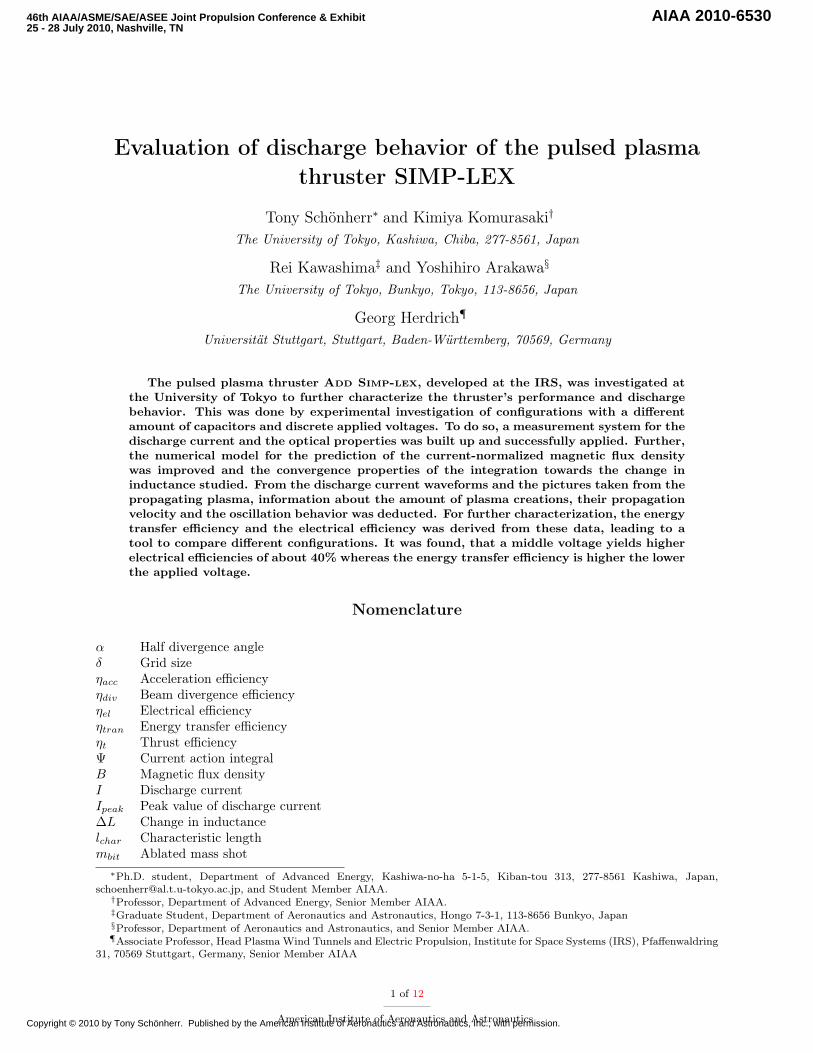
From Figure 6(a), it can be deducted that a finer grid is required for any of the cases of sheet thicknessthan compared to the case without a current sheet. In the case of the geometry of Add Simp-lex, anincrease in grid points beyond 50 for each coordinate axis yielded but a slight change in the results as canbe seen in Figure 6(b). That means that further calculations can be done with a grid of 503 grid points toguarantee a converged result.With these efforts, not only the accelerating fraction of the magnetic flux density can be calculated, but alsothe change in inductance, crucial for further calculations, can be estimated more precisely.
IV. Results and Discussion
IV.A. Current measurement
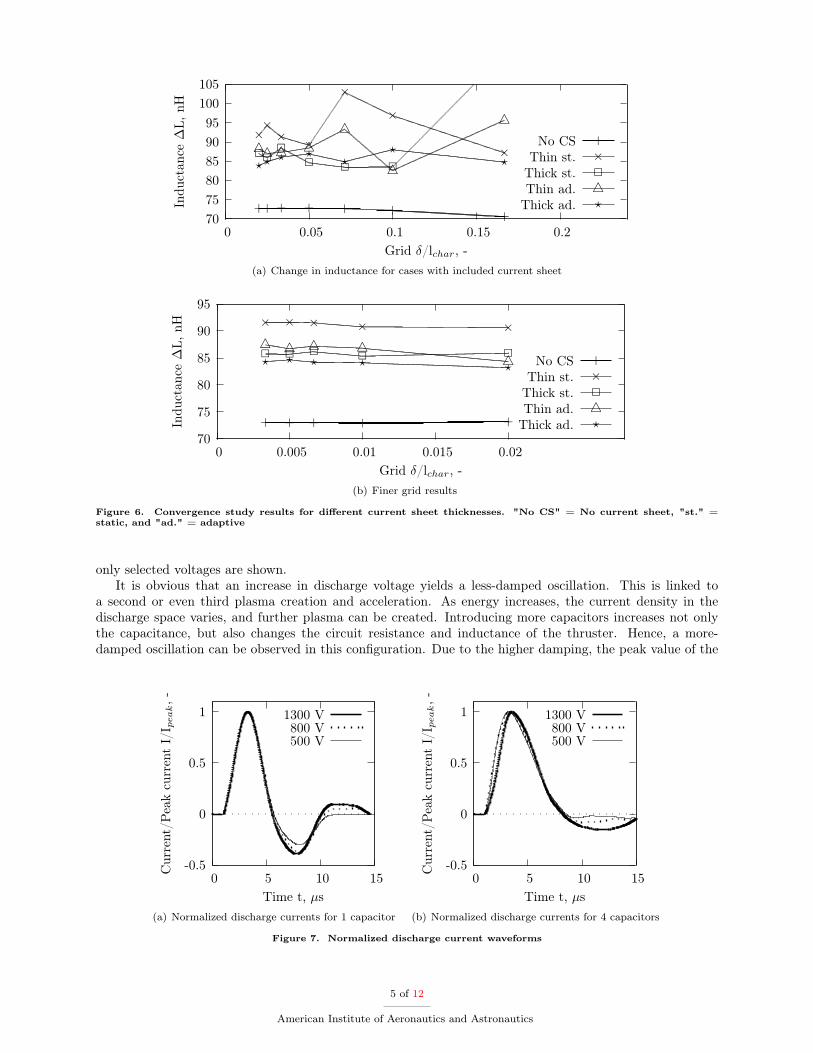
Measuring the discharge current and voltage alike gives information about the oscillation behavior and thepeak currents occurring during the breakdown. These information are evident, as they enable a judgementwhether a PPT is well optimized and efficiently working. Although the maximum value is already interesting,in order to compare the discharge behavior of different configurations, it is better to normalize the plots bytheir peak value. Thruster configurations with one and four capacitors were investigated for applied voltagesbetween 500 and 1300 V. Figures 7(a) and 7(b) show the normalized results. For the sake of better visibility,
4 of 12
American Institute of Aeronautics and Astronautics
707580859095
100105
0 0.05 0.1 0.15 0.2
Indu
ctan
ce∆
L,nH
Grid δ/lchar, -
No CS
+++++++
+
Thin st.×
×
×
×××
××
Thick st.222
222
2
Thin ad.
△
△
△△△△△
△Thick ad.
⋆⋆
⋆⋆⋆⋆⋆
⋆
(a) Change in inductance for cases with included current sheet
70
75
80
85
90
95
0 0.005 0.01 0.015 0.02
Indu
ctan
ce∆
L,nH
Grid δ/lchar, -
No CS
+++++
+
Thin st.
×××××
×Thick st.
22222
2
Thin ad.
△△△△△
△Thick ad.
⋆⋆⋆⋆⋆
⋆
(b) Finer grid results
Figure 6. Convergence study results for different current sheet thicknesses. "No CS" = No current sheet, "st." =static, and "ad." = adaptive
only selected voltages are shown.It is obvious that an increase in discharge voltage yields a less-damped oscillation. This is linked to
a second or even third plasma creation and acceleration. As energy increases, the current density in thedischarge space varies, and further plasma can be created. Introducing more capacitors increases not onlythe capacitance, but also changes the circuit resistance and inductance of the thruster. Hence, a more-damped oscillation can be observed in this configuration. Due to the higher damping, the peak value of the
-0.5
0
0.5
1
0 5 10 15Cur
rent
/Pea
kcu
rren
tI/
I peak,-
Time t, µs
1300 V800 V500 V
(a) Normalized discharge currents for 1 capacitor
-0.5
0
0.5
1
0 5 10 15Cur
rent
/Pea
kcu
rren
tI/
I peak,-
Time t, µs
1300 V800 V500 V
(b) Normalized discharge currents for 4 capacitors
Figure 7. Normalized discharge current waveforms
5 of 12
American Institute of Aeronautics and Astronautics

discharge current increases only by a factor of 2.5 than compared to the 4-times higher energy stored in thecapacitor bank, leading to a maximum value of 25 kA at the 68 J configuration. As the Lorentz force isproportional to the current density, one would then expect a higher oscillation to be favorable. However,previous thruster investigations5,12 have shown that performance, i.e. impulse bit and thrust efficiency, isimproved for a higher damping coefficient. Furthermore, additional oscillations badly affect the capacitorsand increase energy losses.13 A value to characterize the thruster configuration is the so-called current actionintegral Ψ, defined as:14,15
Ψ =
∫ ∞
0
I2 dt. (1)
Information about this value, and the influence of parameters on it, can yield conclusions about theimpulse bit, and the mass bit respectively.16–18 However, the equations presented by Palumbo and Guman,neglect edge effects of the electrodes on the magnetic flux density which is a too strong simplification of thecalculation method explained in Section III. Nevertheless, general tendencies can be derived. The valueswere computed for different thruster setups and normalized by the amount of capacitors used, and are shownin Figure 8.
0
250
500
0 250 500 750 1000 1250 1500
ΨnC
ap,A
2·s
Voltage U, V
Action int. 1 cap
×× × × ×× × ××
×Action int. 4 cap
+ +++
+++
+
++
Figure 8. Current action integrals for different voltages and capacitors
From this data, it can be seen that the current action integral per capacitor is higher for the higher-damped oscillation of the configuration with 4 capacitors. That is, a higher impulse bit and mass bit percapacitor could be expected which would influence the thrust efficiency eventually. According to Palumboand Guman,16 the ablated mass shot would be proportional to the current action integral and the ratio ofthe propellant surfaces. The latter were not changing during the experiments herein. Dividing the mass shotand the impulse bit5 by the measured current action integral yields the values shown in Table 1.
Table 1. Mass shots, impulse bits and calculated proportionality factors for U=1300 V
1 capacitor 4 capacitorsmbit, µg 17.3 53.4Ibit, µNs 342 1370Ψ, A2· s 230 1580
mbit/Ψ, ng/(A2· s) 75 34Ibit/Ψ, µN/(A2) 1.5 0.9
The proportionality factor for the mass shot is more than twice as high for the thruster with only onecapacitor whereas the impulse bit changes by a factor of roughly 1.5. That means that the proportionalityfactor is strongly dependent on the properties of the thruster, and of the oscillation circuit respectively. Itis further possible to conclude that the acceleration is indeed higher for the weakly damped case, but thatalso much more mass is ablated and probably not accelerated and by that negatively influencing the overallperformance. Introducing more capacitors is not only affecting the capacitance of the system, but alsointroduces inductance and resistance influencing the damping coefficient but also the plasma creation. Asthe plasma itself introduces resistance and inductance, the possible effect on the overall behavior is difficult
6 of 12
American Institute of Aeronautics and Astronautics

to predict without a proper understanding of the ablation process and the electrical properties of the circuitand the plasma. For this sake, Palumbo and Guman14 showed a method to derive the initial inductance ofthe system leading to values of 214±7 nH for the one-capacitor case, and 93±8 nH for the four-capacitorcase respectively. This lower inductance increases the damping coefficient of the oscillation circuit.
IV.B. High-speed camera
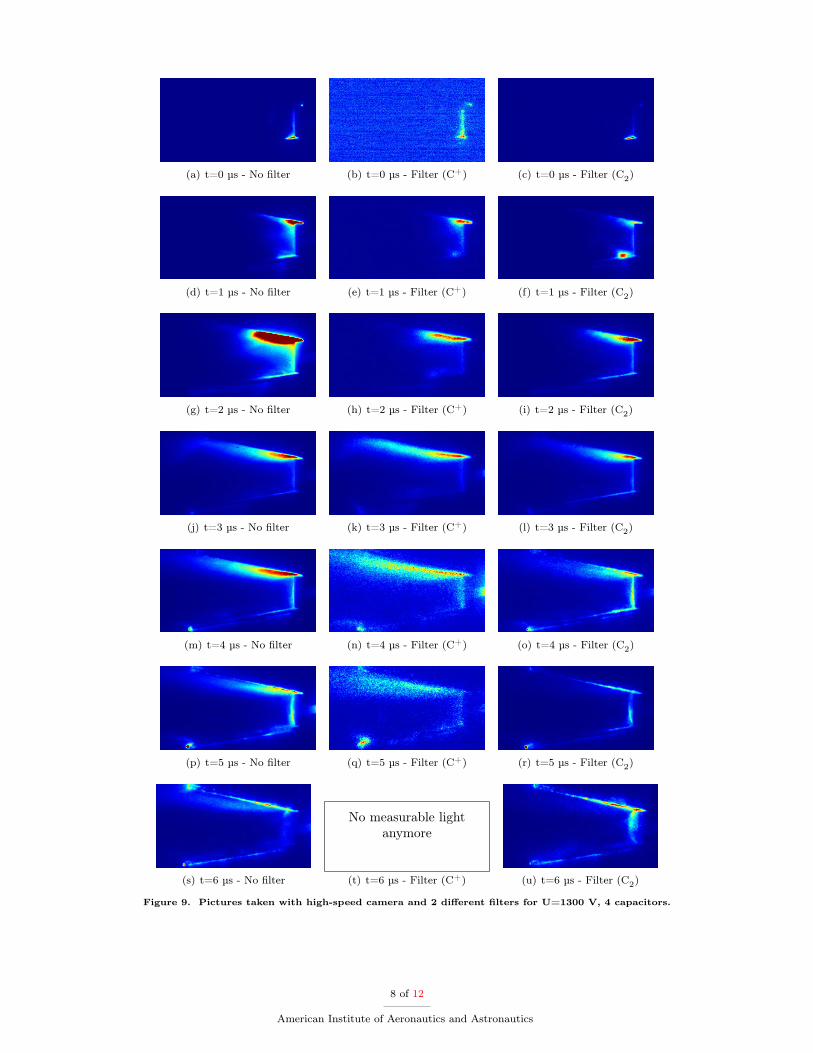
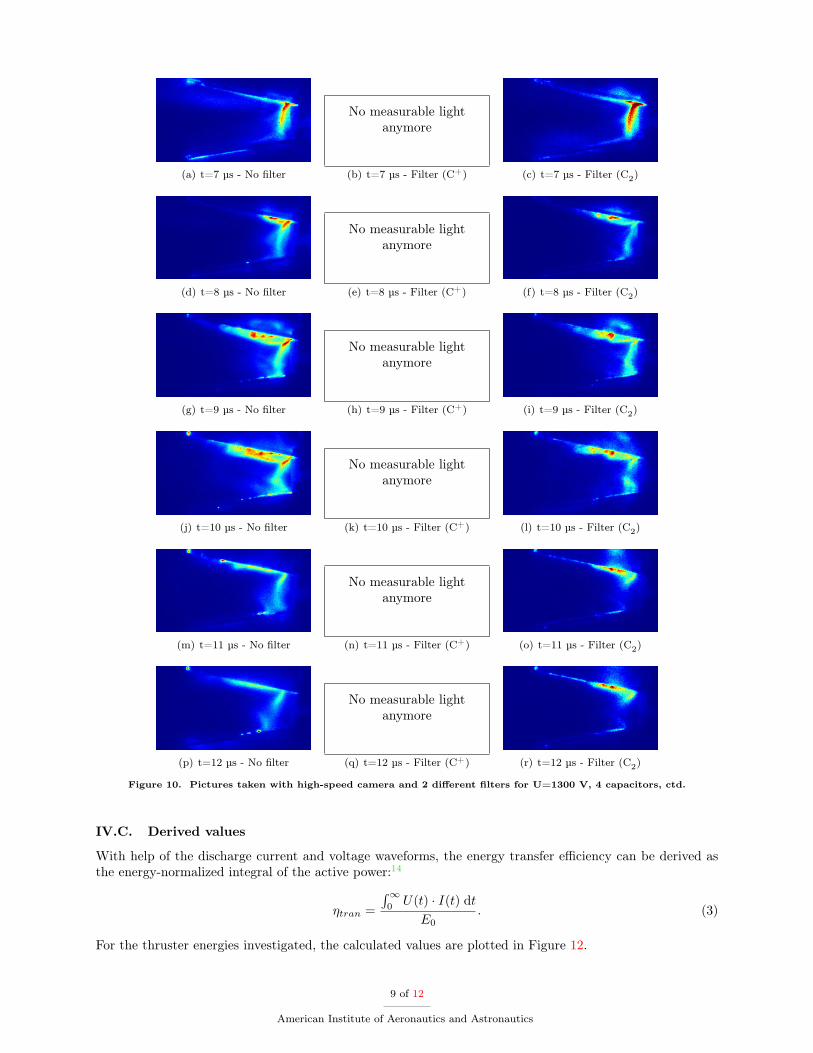
With help of the high-speed camera system explained in Section II.B, pictures of the plasma creation andpropagation could be recorded for different voltages and capacitances, and with and without application ofwavelength filters. As an example, the post-processed pictures for the 3 filter cases (without, C+, C2) of the[4 cap - 1300 V]-configuration are shown in Figures 9 and 10. Therein, the plasma is propagating to the left,showing the cathode in the upper half, and the anode in the lower half. The post-processing was done in away, so that the brightest part of the picture is associated to "red" whereas the dark parts are representedby "blue".During the first few µs of the discharge, a very bright plasma phenomenon can be observed close to thecathode. This is strongly visible while using the filter for C+, implying the presence of charged particlesaccelerated by the magnetic field, and attracted to the cathode by the still-present electric field. Hence, theso-called current sheet canting occurs. However, a distinct current sheet cannot be observed for the firstplasma phenomenon. After the first 5 µs, almost no light is emitted anymore at the wavelength of C+. Asthe discharge current has already past its maximum at that time (refer to Figure 7(b)), the following currentdensity is not sufficient to yield ionized particles. Nevertheless, neutral particles are ablated and propagatedby thermal expansion, and light is then emitted by the excited matter even after the discharge currentceases. A distinct current sheet of about 2 mm thickness could be observed for this part of the plasma,as acceleration forces do not distort the sheet to a diffuse one. Comparing with the discharge current, thismeans that the negative part of the current waveform does not significantly contribute to the thrust creationas almost no charged particles are created and accelerated, but only a neutral plasma fraction. For theother thruster configurations, similar observations were done. In case of the [1 cap - 1300 V]-configuration,however, a second, slower plasma phenomenon was observed, complying with the more oscillating characterof the discharge current (Figure 7(a)).
From the pictures taken, the propagation velocity of the plasma in the thrust direction was derived forthe different thruster setups. However, due to the changes in brightness between the frames, plasma cantingeffects, inhomogeneous lighting and a diffuse current sheet, the measurement was strongly defied. Table 2shows the estimated plasma velocities for the main plasma propagation, as well as for the second plasmacreation for the [1 cap - 1300 V]-configuration, and the thermally accelerated neutral particles for the [4 cap- 1300 V]-configuration.
Table 2. Plasma propagation velocities, in km/s
1 capacitor 4 capacitors500 V 24.6 43.1900 V 40.7 55.4
1300 V 35.6 (first) 25.7 (plasma)25.9 (second) 1.3 (thermal)
The values show that the highest velocities are found in the middle voltage range whereas for higherenergies, more mass is ablated and, thus, not accelerated equivalently. Further, it can be derived that thesecond plasma phenomenon is not accelerated as much as the first one, as the lower peak current doesindicate.
Taking a picture from an lower view of the thruster yields information about the divergence of the plasmabeam. For a configuration with U=1300 V and 4 capacitors, Figure 11 shows the raw image and a stronglypost-processed picture of the first plasma phenomenon. An angle of 2α= 11.5 deg was measured, resultingin a beam divergence efficiency of:
ηdiv =
(1
2(1 + cos2 α)
)2
= 96%. (2)
7 of 12
American Institute of Aeronautics and Astronautics
(a) t=0 µs - No filter (b) t=0 µs - Filter (C+) (c) t=0 µs - Filter (C2)
(d) t=1 µs - No filter (e) t=1 µs - Filter (C+) (f) t=1 µs - Filter (C2)
(g) t=2 µs - No filter (h) t=2 µs - Filter (C+) (i) t=2 µs - Filter (C2)
(j) t=3 µs - No filter (k) t=3 µs - Filter (C+) (l) t=3 µs - Filter (C2)
(m) t=4 µs - No filter (n) t=4 µs - Filter (C+) (o) t=4 µs - Filter (C2)
(p) t=5 µs - No filter (q) t=5 µs - Filter (C+) (r) t=5 µs - Filter (C2)
(s) t=6 µs - No filter
No measurable lightanymore
(t) t=6 µs - Filter (C+) (u) t=6 µs - Filter (C2)
Figure 9. Pictures taken with high-speed camera and 2 different filters for U=1300 V, 4 capacitors.
8 of 12
American Institute of Aeronautics and Astronautics
(a) t=7 µs - No filter
No measurable lightanymore
(b) t=7 µs - Filter (C+) (c) t=7 µs - Filter (C2)
(d) t=8 µs - No filter
No measurable lightanymore
(e) t=8 µs - Filter (C+) (f) t=8 µs - Filter (C2)
(g) t=9 µs - No filter
No measurable lightanymore
(h) t=9 µs - Filter (C+) (i) t=9 µs - Filter (C2)
(j) t=10 µs - No filter
No measurable lightanymore
(k) t=10 µs - Filter (C+) (l) t=10 µs - Filter (C2)
(m) t=11 µs - No filter
No measurable lightanymore
(n) t=11 µs - Filter (C+) (o) t=11 µs - Filter (C2)
(p) t=12 µs - No filter
No measurable lightanymore
(q) t=12 µs - Filter (C+) (r) t=12 µs - Filter (C2)
Figure 10. Pictures taken with high-speed camera and 2 different filters for U=1300 V, 4 capacitors, ctd.
IV.C. Derived values
With help of the discharge current and voltage waveforms, the energy transfer efficiency can be derived asthe energy-normalized integral of the active power:14
ηtran =
∫∞0
U(t) · I(t) dtE0
. (3)
For the thruster energies investigated, the calculated values are plotted in Figure 12.
9 of 12
American Institute of Aeronautics and Astronautics

(a) Raw picture for first plasma phenomenon (b) Post-processed picture for first plasmaphenomenon
Figure 11. View from downside on anode
0.5
0.6
0.7
0.8
0.9
1
0 20 40 60 80
Ene
rgy
tran
s.eff
.η t
ran,-
Energy E, J
1 cap
×××
××
××××
×4 cap
+ + ++ + + + + +
+
Figure 12. Energy transfer efficiencies for different thruster energies
The values between 56 and 77% compare well with values of 50 to 75% for the thruster of Palumbo andGuman14 and the ≈70% for the thruster of Osaka Institute of Technology.19 However, as for the accelerationefficiencies ηacc = ηt/ηtran, the values differ strongly for Add Simp-lex, as can be seen in Figure 13. Ingeneral, it can be derived, that an increase in discharge voltage leads to a decrease in transfer efficiencywhereas the acceleration efficiency might be positively influenced. However, not enough experimental dataof the thrust efficiency were present to verify this theory.
0
0.1
0.2
0.3
0.4
0.5
0.6
0.7
1 10 100 1000
Acc
eler
atio
neff
.η a
cc,-
Energy E, J
ADD SIMP-LEX
××
×Palumbo/Guman14
++++++++++
+
Osaka I of T19
△ △△△△
△
Figure 13. Acceleration efficiencies for different thrusters
10 of 12
American Institute of Aeronautics and Astronautics

Another efficiency to characterize PPT was introduced by Jahn,20 named the electrical efficiency. Theassumption herein is that the ohmic fraction of the used power is regarded as loss, and that the input powerinto the plasma only depends on the inductive part. Hence, it is defined as:
ηel =1
2
∫ τ
0I2(t) · L̇(t) dt
E0. (4)
Although, this efficiency might yield information about the transformation of electrical energy into kineticenergy of the plasma, it neglects dynamic losses and assumes a transfer efficiency of 100%. To computethis value for the thruster configurations investigated, it is necessary to combine the measured dischargecurrent signal, the calculated change in inductance as a function of the position of the current sheet, andthe measured plasma propagation velocity to transform the change in inductance into a function of time. Asevery of these values is affected by error sources, e.g., electromagnetic noise, calibration errors, measurementuncertainties, etc., these values have to be regarded cautiously. Table 3 shows some benchmark efficienciescomputed for Add Simp-lex.
Table 3. Electrical efficiency for different thruster configurations, in %
1 capacitor 4 capacitors500 V 8.6 20.5900 V 38.0 39.1
1300 V 22.6 23.7
The values do not change a lot for a change in capacitors, except for the low-energy case. Further, themaximum values are not found for the highest energies, but for the middle voltage. One possible explanationmight be that the differences in plasma creation affect the energy exchange with the plasma. While anincrease in voltage to 900 V ameliorates this exchange, the additional plasma creation during the 1300 Vcase reduces the efficiency again as more energy is going towards the ablation, dissociation and ionization ofthe propellant. To improve this discussion, a better definition of the efficiencies might be necessary, reducingthe assumptions made. Further, a more reliable method to determine the plasma propagation speed mightbe necessary to improve the results shown.Combining the information about the computed current-normalized magnetic flux density and the maximumdischarge current yields a maximum value of about 4 T close to the electrodes, and 8 to 10 T close to thecurrent sheet, for the highest-energy case. This is much higher compared to the 0.7 T measured for Simp-lex10 implying a stronger acceleration of the plasma created and justifies the design changes made.
V. Conclusions and Outlook
Investigations of the discharge current and the plasma propagation for the pulsed plasma thruster AddSimp-lex were done successfully for different thruster configurations. A link between both results was seenin terms of number of plasma creations, brightness and creation of charged particles. Combination of bothmeasurements towards an electrical efficiency was realized by means of the modeled change in inductance,enabling a possibility to compare the thruster configurations. The model was improved with regard to com-putation speed and convergence. Measurement of the propagation velocity for the plasma front was defiedby several effects, and therefore, a more reliable measurement method would be desirable. To also enableverification of the computed magnetic flux densities, induction probe measurements are envisaged from whichthe plasma velocity can also be deducted.The pictures taken with the high-speed camera indicate different distributions and compositions of theplasma species especially with regard to the ionization capability of later current extrema. Application ofspectroscopic means to determine the composition and spatial distribution of these species would furtherimprove the insight into the discharge processes.The calculation of the energy transfer efficiencies indicate similar values if compared with previous otherresearches. Higher values were found for lower voltages, implying that the losses are more crucial at higherdischarge energies. Regarding the electrical efficiency, higher values of about 40% were found at the middlevoltage of 900 V. As seen from the high-speed camera pictures, almost only neutral particles are createdduring the negative current period, possibly reducing the efficiency of the energy conversion into the plasma.
11 of 12
American Institute of Aeronautics and Astronautics
For lower voltages, however, the current density in the discharge space might not be sufficient to "per-fectly" create plasma, and, thus, suffering from losses due to a lower ionization degree. Again, spectroscopicmeasurements will help elucidate more accurately these observations.
Acknowledgments
T. Schönherr wants to thank the Japanese Ministry of Education, Culture, Sports, Science and Technology(Monbukagakusho) for the financial support of the PhD thesis, and M. Lau (IRS) for the discussion of theexperimental setup and results.
References1Bock, D., Herdrich, G., Lau, M., Schönherr, T., Wollenhaupt, B., and Röser, H.-P., “Electric Propulsion Systems for
Small Satellites: The LEO Mission Perseus,” 3rd European Conference for Aero-Space Sciences, Versailles, France, July 2009.2Herdrich, G., Bauder, U., Bock, D., Eichhorn, C., Haag, D., Lau, M., Schönherr, T., Stindl, T., Fertig, M., Löhle,
S., Auweter-Kurtz, M., and Röser, H.-P., “Activities in Electric Propulsion Development at IRS,” Transactions JSASS SpaceTechnology Japan, Vol. 7, No. ists26, 2009, pp. Tb_5–Tb_14.
3Schönherr, T., Nawaz, A., Lau, M., Petkow, D., and Herdrich, G., “Review of Pulsed Plasma Thruster Development atIRS,” Transactions JSASS Space Technology Japan, under review, 2010.
4Schönherr, T., Nawaz, A., Herdrich, G., Röser, H.-P., and Auweter-Kurtz, M., “Influence of Electrode Shape on Perfor-mance of Pulsed Magnetoplasmadynamic Thruster SIMP-LEX,” Journal of Propulsion and Power , Vol. 25, No. 2, March-April2009, pp. 380–386.
5Nawaz, A., Albertoni, R., and Auweter-Kurtz, M., “Thrust efficiency optimization of the pulsed plasma thruster SIMP-LEX,” Acta Astronautica, Vol. 67, No. 3-4, August-September 2010, pp. 440–448.
6Schönherr, T., Komurasaki, K., Lau, M., Herdrich, G., Röser, H.-P., Yokota, S., and Arakawa, Y., “Cooperation Activitiesbetween IRS and the University of Tokyo in the Field of Pulsed Plasma Thruster Development,” 31st International ElectricPropulsion Conference, Ann Arbor, MI, USA, September 2009.
7Nawaz, A., Bauder, U., Böhrk, H., Herdrich, G., and Auweter-Kurtz, M., “Electrostatic Probe and Camera Measurementsfor Modeling the iMPD SIMP-LEX,” 43rd AIAA/ASME/SAE/ASEE Joint Propulsion Conference and Exhibit , Cincinnati,OH, USA, July 2007.
8Nawaz, A., Entwicklung und Charakterisierung eines gepulsten instationären MPD Triebwerks als Primärantrieb fürWeltraumsonden, Dissertation, Universität Stuttgart, Stuttgart, Germany, February 2010.
9Schönherr, T., Komurasaki, K., Kawashima, R., Arakawa, Y., and Herdrich, G., “Effect of Capacitance on DischargeBehavior of Pulsed Plasma Thruster,” Journal of IAPS , Vol. 18, No. 1, (under review) 2010.
10Nawaz, A., Lau, M., Herdrich, G., and Auweter-Kurtz, M., “Investigation of the Magnetic Field in a Pulsed PlasmaThruster,” AIAA Journal , Vol. 46, No. 11, November 2008, pp. 2881–2889.
11Clenshaw, C. W. and Curtis, A. R., “A method for numerical integration on an automatic computer,” NumerischeMathematik , Vol. 2, No. 1, December 1960, pp. 197–205.
12Popov, G. A. and Antropov, N. N., “Ablative PPT. New Quality, New Perspectives,” Acta Astronautica, Vol. 59, No.1-5, July-September 2006, pp. 175–180.
13Burton, R. L. and Turchi, P. J., “Pulsed Plasma Thruster,” Journal of Propulsion and Power , Vol. 14, No. 5, September-October 1998, pp. 716–735.
14Palumbo, D. J. and Guman, W. J., “Propellant Sidefeed-Short Pulse Discharge Thruster Studies,” Technical ReportNASA CR-112035, Fairchild Industries Inc., Farmingdale, NY, USA, January 1972.
15Thomas, R. E., Burton, R. L., and Polzin, K. A., “Gallium Electromagnetic (GEM) Thruster Performance Measurements,”31st International Electric Propulsion Conference, Ann Arbor, MI, USA, September 2009.
16Palumbo, D. J. and Guman, W. J., “Effects of Propellant and Electrode Geometry on Pulsed Ablative Plasma ThrusterPerformance,” Journal of Spacecraft and Rockets, Vol. 13, No. 3, March 1976, pp. 163–167.
17Guman, W. J., “Pulsed plasma technology in microthrusters,” Technical Report AFAPL-TR-68-132, Fairchild HillerCorp./Republic Aviation Division, Wright-Patterson AFB, OH, USA, November 1968.
18Palumbo, D. J. and Guman, W. J., “Pulsed Plasma Propulsion Technology,” Technical Report AD-768224, FairchildIndustries Inc., Farmingdale, NY, USA, September 1973.
19Edamitsu, T. and Tahara, H., “Study on Performance Enhancement of an Electrothermal Pulsed Plasma Thruster,”Journal of High Temperature Society (in Japanese), Vol. 31, No. 5, 2005, pp. 291–298.
20Jahn, R. G., Physics of Electric Propulsion, Dover Publications, Inc., Mineola, NY, USA, 2006.
12 of 12
American Institute of Aeronautics and Astronautics


![Experimental Study of Nanosecond Repetitively Pulsed ... · microwave discharge and radio frequency discharge [7, 8]. On the other hand, water dissociation using non-thermal plasma](https://static.fdocuments.net/doc/165x107/60cbc39cbf11295abe6adfd0/experimental-study-of-nanosecond-repetitively-pulsed-microwave-discharge-and.jpg)