Evaluation of Composition-Dependent Collection Efficiencies for...
25
Aerosol Science and Technology, 46:258–271, 2012 Copyright C American Association for Aerosol Research ISSN: 0278-6826 print / 1521-7388 online DOI: 10.1080/02786826.2011.620041 Evaluation of Composition-Dependent Collection Efficiencies for the Aerodyne Aerosol Mass Spectrometer using Field Data Ann M. Middlebrook, 1 Roya Bahreini, 1,2 Jose L. Jimenez, 2,3 and Manjula R. Canagaratna 4 1 NOAA Earth System Research Laboratory, Chemical Sciences Division, Boulder, Colorado, USA 2 University of Colorado, Cooperative Institute for Research in Environmental Studies (CIRES), Boulder, Colorado, USA 3 Department of Chemistry and Biochemistry, University of Colorado, Boulder, Colorado, USA 4 Aerodyne Research Inc., Billerica, Massachusetts, USA In recent years, Aerodyne aerosol mass spectrometers (AMS) have been used in many locations around the world to study the size-resolved, nonrefractory chemical composition of ambient par- ticles. In order to obtain quantitative data, the mass or (number) of particles detected by the AMS relative to the mass (or num- ber) of particles sampled by the AMS, i.e., the AMS collection efficiency (CE) must be known. Previous studies have proposed and used parameterizations of the AMS CE based on the aerosol composition and sampling line relative humidity. Here, we eval- uate these parameterizations by comparing AMS mass concen- trations with independent measurements of fine particle volume or particle-into-liquid sampler (PILS) ion chromatography mea- surements for 3 field campaigns with different dominant aerosol mixtures: (1) acidic sulfate particles, (2) aerosol containing a high mass fraction of ammonium nitrate, and (3) aerosol composed of primarily biomass burning emissions. The use of the default CE of 0.5 for all campaigns resulted in 81–90% of the AMS speciated and total mass concentrations comparing well with fine particle volume or PILS measurements within experimental uncertainties, with positive biases compared with a random error curve. By using composition-dependent CE values (sometimes as a function of size) which increased the CE for the above aerosol types, the fraction of data points within the measurement uncertainties increased to more than 92% and the mass concentrations decreased by ∼5–15% on an average. The CE did not appear to be significantly dependent Received 23 March 2011; accepted 1 August 2011. We thank Chuck Brock, Adam Wollny, Carlos Gallar, Julie Cozic, Shuka Schwarz, Ryan Spackman, Ru-Shan Gao, Laurel Watts, David Fahey, Brendan Matthew, Kristen Schulz, Derek Coffman, Trish Quinn, Tim Onasch, Frank Drewnick, and the AMS user community for pro- viding data and/or useful discussions. JLJ was supported by NASA NNX08AD39G and NOAA NA08OAR4310565. Address correspondence to Ann M. Middlebrook, NOAA Earth System Research Laboratory, Chemical Sciences Division, 325 Broadway, R/CSD2, Boulder, CO 80305, USA. E-mail: [email protected] on changes in organic mass fraction although it was substantial in the 3 campaigns (47, 30, and 55%). [Supplementary materials are available for this article. Go to the publisher’s online edition of Aerosol Science and Technology to view the free supplementary files.] INTRODUCTION Current uncertainties of aerosol impacts on climate and hu- man health have driven the development of advanced instrumen- tation that allows rapid and sensitive measurements of aerosol chemical species. The Aerodyne Aerosol Mass Spectrometers (AMS) or AMS instruments (Aerodyne Research Inc., Billerica, MA) (Jayne et al. 2000; Canagaratna et al. 2007) are currently the most commonly used research instrument in this category, and they are often used in the field and laboratory studies across the world (Zhang et al. 2007a; Jimenez et al. 2009). The general operation of AMS instruments has been described elsewhere (Jayne et al. 2000; Allan et al. 2003b; Jimenez et al. 2003; Drewnick et al. 2005; DeCarlo et al. 2006; Canagaratna et al. 2007). Briefly, particles are transmitted into the AMS detection region using an aerodynamic focusing lens, where they im- pact an inverted-cone porous-tungsten vaporizer typically held at 600 ◦ C, and volatilize, with the vapors being analyzed by electron ionization mass spectrometry. The net overall particle transmission and detection efficiency is called the collection effi- ciency (CE) and is expressed by the product of 3 terms (Huffman et al. 2005): CE (d va ) = E L (d va ) × E S (d va ) × E b (d va ) [1] where E L is the transmission efficiency of the aerodynamic lens for spherical particles, E S captures the loss of transmission 258 Downloaded by [University of Colorado Libraries] at 22:05 05 October 2011
Transcript of Evaluation of Composition-Dependent Collection Efficiencies for...

Aerosol Science and Technology, 46:258–271, 2012Copyright C© American Association for Aerosol ResearchISSN: 0278-6826 print / 1521-7388 onlineDOI: 10.1080/02786826.2011.620041
Evaluation of Composition-Dependent CollectionEfficiencies for the Aerodyne Aerosol Mass Spectrometerusing Field Data
Ann M. Middlebrook,1 Roya Bahreini,1,2 Jose L. Jimenez,2,3
and Manjula R. Canagaratna4
1NOAA Earth System Research Laboratory, Chemical Sciences Division, Boulder, Colorado, USA2University of Colorado, Cooperative Institute for Research in Environmental Studies (CIRES), Boulder,Colorado, USA3Department of Chemistry and Biochemistry, University of Colorado, Boulder, Colorado, USA4Aerodyne Research Inc., Billerica, Massachusetts, USA
In recent years, Aerodyne aerosol mass spectrometers (AMS)have been used in many locations around the world to study thesize-resolved, nonrefractory chemical composition of ambient par-ticles. In order to obtain quantitative data, the mass or (number)of particles detected by the AMS relative to the mass (or num-ber) of particles sampled by the AMS, i.e., the AMS collectionefficiency (CE) must be known. Previous studies have proposedand used parameterizations of the AMS CE based on the aerosolcomposition and sampling line relative humidity. Here, we eval-uate these parameterizations by comparing AMS mass concen-trations with independent measurements of fine particle volumeor particle-into-liquid sampler (PILS) ion chromatography mea-surements for 3 field campaigns with different dominant aerosolmixtures: (1) acidic sulfate particles, (2) aerosol containing a highmass fraction of ammonium nitrate, and (3) aerosol composed ofprimarily biomass burning emissions. The use of the default CEof 0.5 for all campaigns resulted in 81–90% of the AMS speciatedand total mass concentrations comparing well with fine particlevolume or PILS measurements within experimental uncertainties,with positive biases compared with a random error curve. By usingcomposition-dependent CE values (sometimes as a function of size)which increased the CE for the above aerosol types, the fractionof data points within the measurement uncertainties increased tomore than 92% and the mass concentrations decreased by ∼5–15%on an average. The CE did not appear to be significantly dependent
Received 23 March 2011; accepted 1 August 2011.We thank Chuck Brock, Adam Wollny, Carlos Gallar, Julie Cozic,
Shuka Schwarz, Ryan Spackman, Ru-Shan Gao, Laurel Watts, DavidFahey, Brendan Matthew, Kristen Schulz, Derek Coffman, Trish Quinn,Tim Onasch, Frank Drewnick, and the AMS user community for pro-viding data and/or useful discussions. JLJ was supported by NASANNX08AD39G and NOAA NA08OAR4310565.
Address correspondence to Ann M. Middlebrook, NOAAEarth System Research Laboratory, Chemical Sciences Division,325 Broadway, R/CSD2, Boulder, CO 80305, USA. E-mail:[email protected]
on changes in organic mass fraction although it was substantial inthe 3 campaigns (47, 30, and 55%).
[Supplementary materials are available for this article. Go tothe publisher’s online edition of Aerosol Science and Technologyto view the free supplementary files.]
INTRODUCTIONCurrent uncertainties of aerosol impacts on climate and hu-
man health have driven the development of advanced instrumen-tation that allows rapid and sensitive measurements of aerosolchemical species. The Aerodyne Aerosol Mass Spectrometers(AMS) or AMS instruments (Aerodyne Research Inc., Billerica,MA) (Jayne et al. 2000; Canagaratna et al. 2007) are currentlythe most commonly used research instrument in this category,and they are often used in the field and laboratory studies acrossthe world (Zhang et al. 2007a; Jimenez et al. 2009). The generaloperation of AMS instruments has been described elsewhere(Jayne et al. 2000; Allan et al. 2003b; Jimenez et al. 2003;Drewnick et al. 2005; DeCarlo et al. 2006; Canagaratna et al.2007). Briefly, particles are transmitted into the AMS detectionregion using an aerodynamic focusing lens, where they im-pact an inverted-cone porous-tungsten vaporizer typically heldat 600◦C, and volatilize, with the vapors being analyzed byelectron ionization mass spectrometry. The net overall particletransmission and detection efficiency is called the collection effi-ciency (CE) and is expressed by the product of 3 terms (Huffmanet al. 2005):
CE (dva) = EL (dva) × ES (dva) × Eb (dva) [1]
where EL is the transmission efficiency of the aerodynamic lensfor spherical particles, ES captures the loss of transmission
258
Dow
nloa
ded
by [
Uni
vers
ity o
f C
olor
ado
Lib
rari
es]
at 2
2:05
05
Oct
ober
201
1

AMS CE PARAMETERIZATIONS EVALUATED WITH FIELD DATA 259
due to particle nonsphericity which causes the particle beamto broaden, and Eb is the efficiency with which a particle thatimpacts the vaporizer is detected. EL is largely dependent onparticle size (vacuum aerodynamic diameter or dva) (DeCarloet al. 2004) and the lens design and operating pressure (Jayneet al. 2000; Zhang et al. 2004; Liu et al. 2007; Bahreini et al.2008). For ambient particles transmitted through the AMS lens,laboratory, and field measurements have shown that even thoughambient particles are often slightly nonspherical in the AMS, thelosses due to particle nonsphericity are minor (Huffman et al.2005; Quinn et al. 2006; Salcedo et al. 2007).
Eb is dependent on the degree to which particles bouncewhen they impact the vaporizer. Field experiments suggested(Allan et al. 2004a; Quinn et al. 2006) and laboratory experi-ments demonstrated (Matthew et al. 2008) that the last term ofthe AMS CE, Eb, is a function of particle phase. In general,previous studies indicate that particles with liquid surfaces havehigher AMS CE than those that are solid. There are 4 mainfactors which influence particle phase in the AMS: relative hu-midity in the sampling line, acidity/neutralization of the sulfatecontent, ammonium nitrate content, and organic liquid content.Thus far, only the inorganic species have been studied exten-sively in the laboratory. Since particles typically lose all or muchof the particle-phase water in the AMS inlet and vacuum sys-tem (Zelenyuk et al. 2006; Matthew et al. 2008), the samplingline RH must be above 90% RH for the particles to remain liq-uid when impacting on the vaporizer (Matthew et al. 2008). Atlower RH, sulfuric acid particles are liquid whereas the phaseof ammonium bisulfate and sulfate particles in the atmospheredepends on whether or not the particles were initially dry or hy-drated (Tang 1980). Indeed, field measurements of particulatephase suggest that ambient sulfate aerosols are more frequentlymetastable liquids between 45 and 75% RH (Rood et al. 1989) orthat particles can retain water at RH lower than the deliquescencepoint (Khlystov et al. 2005; Engelhart et al. 2011), although par-ticles in that RH range may lose most or all of their water inthe AMS. Ammonium nitrate is a metastable liquid in the at-mosphere at any sampling line RH. For pure ammonium sulfateand sulfate-dominated ambient particles, Eb increases with sam-pling line RH above the deliquescence RH (Allan et al. 2004a;Matthew et al. 2008) as well as with the deposition of thickcoatings of organic liquids (Matthew et al. 2008). The CE fordry sulfate particles also increases with aerosol acidity (Quinnet al. 2006) and increasing nitrate content (Weimer et al. 2006;Crosier et al. 2007; Matthew et al. 2008; Nemitz et al. 2011).In all cases, the trends are qualitatively explained by changes inparticle phase.
Organic particles can be either liquid or solid, but the-ory predicts that mixtures of inorganic salts and dicarboxylicacids will remain in a liquid phase under ambient conditions(Marcolli et al. 2004). Recent results suggest that aged ambi-ent organic aerosols have very low volatility, which calls intoquestion whether they form a liquid phase in the atmosphere(Huffman et al. 2009; Cappa and Jimenez 2010). Liquid organic
particles are collected with Eb = 1 (Matthew et al. 2008), how-ever, ambient organic-dominated particles have typical Eb ∼ 0.5(Salcedo et al. 2006; DeCarlo et al. 2008; Kleinman et al. 2008;Aiken et al. 2009) which suggests that they are not liquid in theAMS.
For some field studies, apparent CE values have been deter-mined with the ambient data by comparing AMS mass loadingsfor the individual species with other particulate chemical mea-surements such as particle-into-liquid samplers (PILS) with ionchromatography analysis (Weber et al. 2001; Takegawa et al.2005) and online OC analyzers (Takegawa et al. 2005), or bycomparing the total AMS mass loadings with total apparentvolume- or total mass-based instruments such as scanning mo-bility particle sizers (Quinn et al. 2006) or tapered element os-cillating microbalances (TEOM) (Allan et al. 2004a; Drewnicket al. 2004; Hogrefe et al. 2004; Weimer et al. 2006). Manyfield studies reported that reasonable agreement and linear cor-relations were obtained with other measurements by using aCE of 0.5 (Allan et al. 2003a; Alfarra et al. 2004; Topping etal. 2004; Takegawa et al. 2005; Salcedo et al. 2006; Aiken etal. 2009; Timonen et al. 2010). In several field studies, the CEvalue was estimated from sulfate comparisons (Drewnick et al.2004; de Gouw et al. 2005; Takegawa et al. 2005; Venkatachariet al. 2006; Weimer et al. 2006; Kondo et al. 2007; de Gouwet al. 2008). In such cases, the AMS organic mass calculatedusing the CE value estimated from only the sulfate mass in-tercomparisons was still linearly-correlated with independentorganic carbon measurements with reasonable average organicmass to organic carbon ratios of 1.7 ± 0.3 (de Gouw et al.2005; Takegawa et al. 2005; Venkatachari et al. 2006; Kondoet al. 2007; de Gouw et al. 2008). These results suggest thatthe observed CE of ∼0.5 for most environments and chemicalcompositions is valid because ambient particles are solid in theAMS (Matthew et al. 2008) and are internally mixed (Murphyet al. 2006; Zhang et al. 2007a).
AMS instruments with in situ light-scattering detection havethe potential to provide a direct measurement of CE (Cross etal. 2009; Slowik et al. 2010). However, particles must be largeenough to scatter light in the instrument (∼215 nm in diame-ter), provide enough signal from the single particle mass spectrato count individual particles, and evaporate in 3 ms or less,which make the results not directly applicable to the most com-monly used MS-mode in which smaller particles and slower-evaporating species are still detected. More studies involvingthis method are needed to evaluate its use with ambient aerosols.
While a single CE value can be used to obtain speciatedaerosol mass concentrations in many ambient environments,some field measurement comparisons suggest that individualpollution events are best captured by introducing composition-dependent CE values. Previous studies have developed em-pirical formulations of inorganic composition-dependent CEbased on field comparisons (Quinn et al. 2006; Crosier et al.2007). Here, we use data from 3 different field studies to com-pare AMS mass, using the default CE = 0.5, with external
Dow
nloa
ded
by [
Uni
vers
ity o
f C
olor
ado
Lib
rari
es]
at 2
2:05
05
Oct
ober
201
1
260 A.M. MIDDLEBROOK ET AL.
measurements, to support parameterizations of CE as a functionof composition, and finally to show case studies of how theseparameterizations improved the overall comparisons with datafrom other instruments. Since EL is explicitly taken into accountfor these comparisons, ES is assumed to be 1 based on previousbeam width measurements of ambient particles (Huffman et al.2005; Salcedo et al. 2007), and Eb for a single component hasnot shown size-dependence in the laboratory (Matthew et al.2008), the apparent CE should be equal to Eb.
FIELD DATA AND INSTRUMENTATIONThree sets of field data are used in this work: an airborne study
based in Houston, TX during September–October 2006 (TexasAir Quality Study/Gulf of Mexico Atmospheric Compositionand Climate Study, TexAQS-II/GoMACCS), a ground-basedstudy in Boulder, CO during January–February 2005, and an air-borne study above northern Alaska during April 2008 (Aerosol,Radiation, and Cloud Processes affecting Arctic Climate, AR-CPAC). The AMS instrument used in the ground-based studywas equipped with a quadrupole mass spectrometer, whereasa compact-time-of-flight (C-ToF) mass spectrometer was usedwith a pressure-controlled inlet for the airborne studies (Bahreiniet al. 2008). In all 3 datasets analyzed here, the instrument wasalternated between the bulk mass spectral mode (MS) and theparticle time-of-flight mode (PToF). As shown below and inthe supplemental material (Figures S1–S3), these 3 sets of fielddata spanned a wide range of aerosol composition in terms ofthe mass fractions of different species.
The AMS inlet flow rate, particle velocity, nitrate ionizationefficiency, and relative ionization efficiency for ammonium werecalibrated before, during, and after the field studies with stan-dard procedures (e.g., Canagaratna et al. 2007). MS and PToFdata were recorded every 2.5 min for the ground-based studyand every 10–15 s for the airborne studies. The data were pro-cessed using custom software written in Igor Pro (WavemetricsInc.) and developed for the AMS and shared across the AMScommunity (Allan et al. 2004b; DeCarlo et al. 2006). The massloadings for each species (Cs in µg m−3) were calculated inthe following manner (adapted from (Jimenez et al. 2003) andEquation 7 in (Allan et al. 2004b)):
Cs = 1012 MWNO3
CEsRIEsIENO3 QNA
∑i
Is,i [2]
where MWNO3 is the molecular weight of nitrate (62 g mol−1),CEs is the collection efficiency of species s, IENO3 is the ioniza-tion, transmission, and ion detection efficiency of nitrate (in ionsmolec−1, typically shortened as “ionization efficiency”), RIEs isthe ionization efficiency of species s relative to the ionizationefficiency of nitrate, Q is the volumetric sample flow rate intothe instrument (in cm3 s−1), NA is Avogadro’s number, Is is themeasured ion rate in the partial mass spectra for species s (inions s−1), where all of the m/z fragments (i) in the partial mass
spectra are summed for species s. For some species, the calcu-lation of partial mass spectra relies on fragmentation patternsdetermined in the laboratory and known isotopic ratios (Allanet al. 2004b). The factor of 1012 converts the units from g cm−3
to µg m−3. The uncertainty in CE is around 30% (2σ ) and itdominates the uncertainty for individual species (Bahreini etal. 2009). For organic material, the uncertainty in the organicRIE is around 20% (2σ ) and is also a major contributor to itsuncertainty (Bahreini et al. 2009). The propagated, overall un-certainty for the total AMS mass concentration is 20–35% (2σ )(Bahreini et al. 2009). See Supplementary Information sectionS1 of Bahreini et al. (2009) for details on uncertainty propa-gation. Here we used 30% uncertainty in the AMS total massfor the propagation of the combined measurement uncertaintiesbetween the AMS and UHSAS (ultra-high sensitivity aerosolspectrometer) or PILS.
The AMS detection limits were determined periodically dur-ing each field study by placing a filter in front of the AMS inlet,averaging the mass concentrations for each species using thedefault CE, and multiplying the resulting standard deviationsby 3. Only data where all mass concentrations were greaterthan 3 times the detection limit were used in the results reportedhere. This effectively removes a bias toward larger errors for datawhere the mass concentrations were close to the detection limits.
For the fine particle volume measurements in the airbornestudies, an ultra-high sensitivity aerosol spectrometer (UHSAS,Droplet Measurement Technologies, Boulder, CO) was used tomeasure the particle number distribution as a function of opticaldiameter, from which the apparent fine particle volume is cal-culated and reported (here for dry particles). The UHSAS wasoperated at ambient relative humidity in the sampling line onthe aircraft, which was the same sampling line relative humidityas the AMS. The conditions in the AMS inlet cause additionaldrying that can change the phase of the particles from what theywere in the sampling line (Matthew et al. 2008). The UHSASinstrument was calibrated with monodisperse, dry, ammoniumsulfate particles, which have a known index of refraction. EachUHSAS bin of scattered light intensity was converted to particlesize, based on the dry, ammonium sulfate index of refraction.The UHSAS volume was computed from the number distri-bution by assuming spherical particles. Mass was calculatedfrom volume by using the AMS composition data to estimatethe average density. The size range for the UHSAS is 0.06–1microns. Uncertainty in size due to estimates of the actual re-fractive index (likely between 1.4 to 1.6 without an imaginarycomponent) lead to ∼10–15% uncertainty in diameter. This isthe largest component of the 30–45% uncertainties in volumefrom the UHSAS (Brock et al. 2011).
To account for particle transmission losses in the AMS lens,the measured AMS lens transmission curve (Bahreini et al.2008) was applied to the fine particle number distributions.The fine particle mass reported here therefore takes the lenstransmission curve into account. Note that particle losses in theAMS lens can otherwise be incorrectly attributed to particle
Dow
nloa
ded
by [
Uni
vers
ity o
f C
olor
ado
Lib
rari
es]
at 2
2:05
05
Oct
ober
201
1

AMS CE PARAMETERIZATIONS EVALUATED WITH FIELD DATA 261
bounce losses. Accurately accounting for the lens transmissionefficiency is thus critical in comparisons of AMS mass concen-trations with other measurements of the individual species. Herethe additional mass measured by the UHSAS and not measuredby the AMS due to lens transmission losses was at most 10%and typically less than 5%. Measurement uncertainties (2σ )for the UHSAS particle volume data were 30% for TexAQS(Bahreini et al. 2009) and +45/–31% for ARCPAC (Brock et al.2011).
Ion chromatography was performed on aerosol samples col-lected with a PILS (Weber et al. 2001) and high-quality PILSmeasurements were available only for the Boulder study. Forthe data described here, the PILS system was operated with a1 micron impactor on the sampling line which is similar to theupper limit of particles transmitted by the AMS lens. Particulateblack carbon (BC) mass concentrations were obtained in the 2airborne studies with a single-particle soot photometer (SP2)instrument (Schwarz et al. 2006). The size range measured bythe SP2 instrument depends on particle density and is 0.07–0.50µm mass-equivalent diameter assuming a BC density of 1.8 gcm−3 (Park et al. 2004). Experimental uncertainties (2σ ) in thePILS and BC measurements are 10% (Weber et al. 2001) and15% (Schwarz et al. 2006), respectively.
The AMS mass concentrations were compared with the othermeasurements in 2 ways: the AMS total plus BC mass wasdivided by the mass estimated from the UHSAS fine particlevolume, or the AMS nitrate plus sulfate mass was divided bythe nitrate plus sulfate mass from the PILS-IC system. Thefine particle mass was obtained by multiplying the fine particlevolume transmitted into the AMS by the density estimated fromthe AMS and BC composition. The mass-weighted density (ρ)was calculated using ρorg = 1.25 g cm−3 (for TexAQS) or 1.3g cm−3 (for ARCPAC), ρ inorg = 1.75 g cm−3 (primarily dryammonium sulfate, (Perry and Green 1997)), and ρBC = 1.8g cm−3 (Park et al. 2004), for organic mass, inorganic mass,and BC, respectively. This calculation is not very sensitive tothe density of BC because its mass fraction was nearly alwaysless than 5%. The density for organic material is consistent withrecent density measurements of ambient organic and biogenicsecondary organic aerosol which have been determined in 3independent studies as 1.27, 1.22–1.28, and 1.3 ± 0.1 g cm−3
(Cross et al. 2007; Zelenyuk et al. 2008; Kiendler-Scharr et al.2009).
In this work, we develop and evaluate empirical parameteri-zations for CE to calculate bulk ensemble mass concentrations.Thus, some of the variability in the estimated CE could indeed bedue to external versus internal mixing issues. The standard AMSinstrument does not have a direct means of evaluating the mixingstate of the particles, but differences in speciated size distribu-tions can be indicative of different degrees of internal mixing.Here, the Boulder dataset and a few events in the TexAQS datashowed distinctly different speciated size distributions. We havecorrected for this effect on the bulk mass concentrations by us-ing a size dependent CE. For the ARCPAC dataset and most
of the TexAQS dataset where size dependent parameterizationswere not needed, internal mixing is supported by other measure-ments (Asa-Awuku et al. 2011; Brock et al. 2011). Most of thesubmicron aerosol mass in these 3 field studies was either non-refractory species or BC. For the Boulder study, about 99% ofthe ions measured with PILS were potentially measured by theAMS (chloride, nitrate, sulfate, and ammonium) and less than2% were refractory species (sodium, calcium, magnesium, pluspotassium). The number fraction of mineral dust and sea saltwas always less than 10% of fine (<0.7 micron) aerosols in theARCPAC study, with the exception of the Arctic boundary layeraerosols which had a slightly higher fraction of sea salt (Brocket al. 2011). Data with a clear influence of dust during ARCPACwas identified by comparisons of the AMS total mass to aerosolextinction data and removed from this analysis. Unfortunately,no comparable direct information about nonrefractory specieswas obtained during the TexAQS field study. The fact that theresulting correlation between AMS + BC mass and fine parti-cle mass is good, with only a few outliers (see Figures S5–S6),suggests that dust or sea salt were not significant componentsof the fine particle mass.
RESULTS AND DISCUSSION
Evaluation of the Default AMS CEMass concentrations are typically calculated with a default
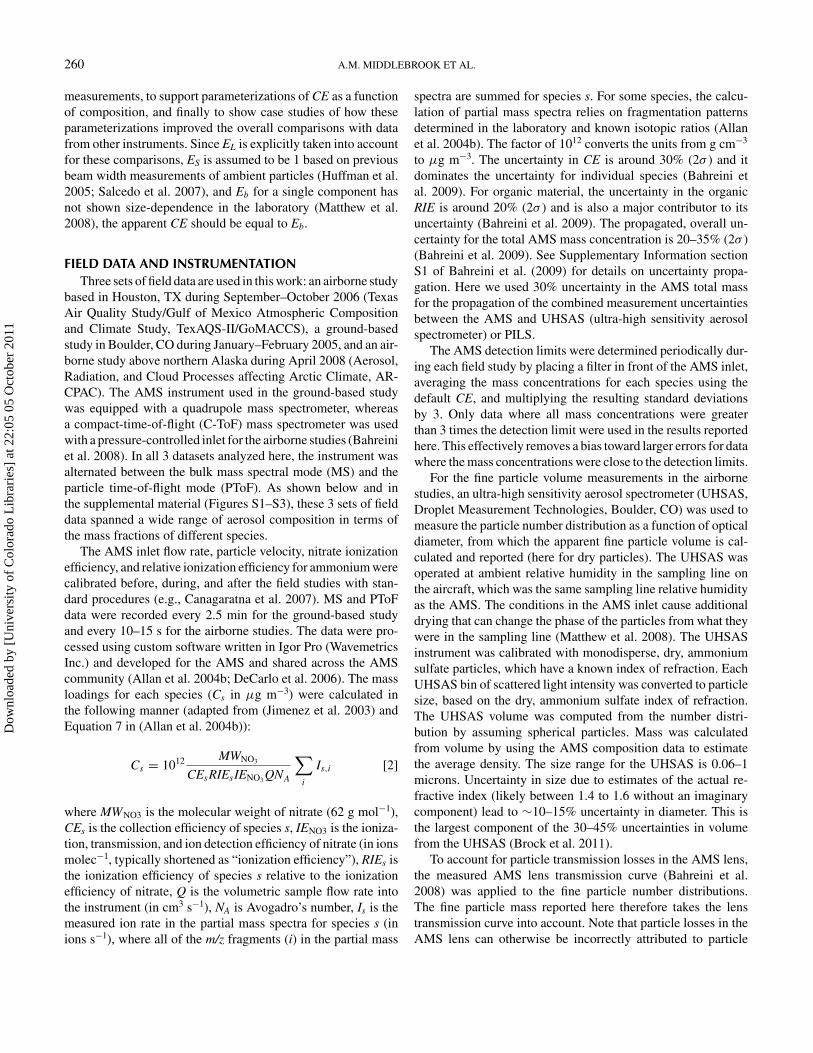
CE = 0.5 for most ambient environments. Here, datasets from 3field campaigns (TexAQS, Boulder, CO, and ARCPAC) are usedto examine the appropriateness of the default CE and parameter-izations of CE based on chemical composition. Figure 1 showshistograms of either (1) the ratio of the AMS total mass (usingthe default CE) plus BC mass to fine particle mass (Mfine), or (2)the AMS nitrate plus sulfate mass divided by the PILS nitrateplus sulfate mass for all 3 field studies. The propagated uncer-tainties (2σ ) for the combined instrument mass ratios are 45%for TexAQS, 45% for Boulder, and +56/–46% for ARCPACand 95.5% of the mass ratios are expected to cluster around 1.0within these measurement uncertainties. The Gaussian randomerror curves for each study based on the combined measurementuncertainties are included with the histograms in Figure 1. Morethan 81% of the data fall within these combined measurementuncertainties (Table 1), which is consistent with the observationof a CE around 0.5 in most ambient measurement campaigns.However, significant fractions of all 3 datasets (12% for Tex-AQS, 19% for Boulder, and 18% for ARCPAC) are beyond thecombined uncertainties, while the expected percentage due torandom effects would be less than 5%. Most of the data pointsthat were outside the combined measurement uncertainties wereon the right-hand side of the random error curve (Figure 1), sug-gesting a systematic positive bias for a subset of the data. Theratios of speciated mass to fine particle mass that lie well above1.0 correspond to pollution events or compositional differencesfor which composition-dependent parameterization of CE maybe needed.
Dow
nloa
ded
by [
Uni
vers
ity o
f C
olor
ado
Lib
rari
es]
at 2
2:05
05
Oct
ober
201
1
262 A.M. MIDDLEBROOK ET AL.
FIG. 1. The frequency distributions of mass ratios from multiple, carefully-operated instruments from the 3 field studies when the default collection efficiency(CE) of 0.5 is used for the AMS data. Also plotted are the Gaussian error curves (dashed curves) for the combined measurement uncertainties. Mass ratios that aresignificantly greater than 1 are likely due to the various effects on the AMSCE. (Color figure available online.)
Parameterization of CE from CompositionPrevious laboratory and field studies have shown clear trends
of increasing AMS CE with particle acidity, nitrate content,sampling relative humidity, and coatings of pure liquid organicmaterial. Figures 2–4 show a comparison of these various pa-
rameterizations of CE as a function of aerosol chemical com-position. These composition-dependent parameterizations areevaluated using data from the 3 field studies and an algorithmfor calculating mass concentrations from these parameteriza-tions is developed.
TABLE 1Average mass ratios of either AMS + BC to fine particle mass or AMS (nitrate + sulfate) to PILS (nitrate + sulfate) ± 2 standarddeviations and the fraction of data that lies within the 2σ combined measurement uncertainties, as indicated for each study, using
different CE values
CE = 0.5 CE algorithm
Field study 2σ uncertainties (%) Ratio Fraction (%) Ratio Fraction (%)
TexAQS: all 45 1.0 ± 1.8 88 0.94 ± 0.62 92TexAQS: October 5, 2006 45 1.14 ± 0.48 90 0.98 ± 0.28 99.5Boulder 45 1.17 ± 0.78 81 0.97 ± 0.48 95ARCPAC +56 and −46 1.1 ± 3.4 82 0.99 ± 0.64 92
Dow
nloa
ded
by [
Uni
vers
ity o
f C
olor
ado
Lib
rari
es]
at 2
2:05
05
Oct
ober
201
1

AMS CE PARAMETERIZATIONS EVALUATED WITH FIELD DATA 263
FIG. 2. The ratio of AMS mass to the mass of fine particles (Mfine) minus theblack carbon (BC) mass (from multiple, carefully-operated instruments) demon-strates the acidity effect, where the apparent CE increases for acidic particles(here as a function of the ratio of measured ammonium to predicted ammonium,NH4/NH4,predict). Error bars are the standard deviations of the averages. Datawhere the particles have high nitrate content (ANMF ≥ 0.4), which mainly af-fected the Boulder dataset, are omitted for clarity. The parameterization fromQuinn et al. (2006) field data is shown as the dashed line and Equation 4 is thesolid line. (Color figure available online.)
FIG. 3. The ratio of AMS mass to either the mass of fine particles (Mfine) minusthe black carbon (BC) mass or the PILS-IC mass (from multiple, carefully-operated instruments) demonstrates the nitrate effect, where CE increases withnitrate content (here, as a function of ammonium nitrate mass fraction, ANMF).Error bars are the standard deviations of the averages. Data where the particleshave high acidic content (NH4/NH4,predict ≤ 0.75) are omitted for clarity. Theparameterizations described by Crosier et al. (2007), Nemitz et al. (2011), andMatthew et al. (2008) are shown as the dot-dash, dashed, and dotted lines,respectively. Note that the ANMF-axis for the Crosier et al. parameterizationfrom field data (based solely on nitrate and sulfate mass) is not precisely thesame as for the other field data which included chloride and organic content.Also the particles for the laboratory data parameterized by Matthew et al. didnot contain chloride or organic material. Equation 6 is shown as the solid line.(Color figure available online.)
FIG. 4. The ratio of AMS mass to the mass of fine particles (Mfine) minusthe black carbon (BC) mass (from multiple, carefully-operated instruments)demonstrates the CE does not change significantly with organic content. Thesedata were filtered for dry, neutralized, sulfate-rich particles (NH4/NH4,predict >
0.75 and ANMF< 0.4), which removed most of the Boulder data. Error barsare the standard deviations of the averages. The overall average of all thesedata points (a total of 12989 from the 2 field studies) is 0.45 ± 0.22 (2σ ).The CEs determined from laboratory experiments by Matthew and coworkers(Matthew et al. 2008) for organic liquid coatings on dry ammonium sulfate, pure,metastable ammonium sulfate, and pure, dry ammonium sulfate are shown asthe dashed, dotted, and solid lines respectively. Note there is not any organicmaterial in the uncoated metastable and dry particles (dotted and solid lines).The TexAQS organic material is representative of aged urban organic aerosol(Bahreini et al. 2009) and the ARCPAC organic material is representative ofaged biomass burning aerosol (Warneke et al. 2009). (Color figure availableonline.)
The 3 datasets used in this work exemplify different regimesof the H+/NH4
+/SO42−/NO3
− phase diagram, organic massfraction content, and sampling line RH (Figures S1–S3). How-ever, the RH in the AMS sampling inlet was greater than 80%only for the Boulder study and these data were also high inammonium nitrate content. Unfortunately, the effect of RH onthe CE could not be explored independently for these studies.The data presented here were thus restricted to those where thesampling line RH was less than 80%.
In order to demonstrate the various effects (acidity, nitrate,and organic) on the AMS CE, ambient AMS mass concentra-tions from all 3 field studies were calculated with a CE = 1 andthen compared with those obtained from other measurements.Figures 2–4 show the ratio of AMS total (or nitrate + sulfate)mass (CE = 1) to total (or nitrate + sulfate) mass from othermeasurements plotted against parameters representing acidity,nitrate content, and organic content. Note that these measure-ments were obtained with carefully-operated instruments andtook into account variations in particle sampling sizes and
Dow
nloa
ded
by [
Uni
vers
ity o
f C
olor
ado
Lib
rari
es]
at 2
2:05
05
Oct
ober
201
1
264 A.M. MIDDLEBROOK ET AL.
sampling conditions. The data were filtered for all mass con-centrations more than 3 times the detection limit and for lesshumid conditions (sampling line RH< 80%). The mass ratiosin Figures 2–4 can be taken as estimates of the AMS CE orapparent CE, assuming that all other effects have been properlytaken into account since AMS mass is now compared with thecorresponding mass (i.e., total – BC or nitrate + sulfate) fromother measurements.
Effect of High Aerosol AcidityFigure 2 shows the effect of aerosol acidity on the observed
mass ratio. For clarity, periods with high nitrate content (es-pecially observed with the Boulder data) were omitted. If in-cluded in this figure, these data points would cluster aroundNH4/NH4,predict = 1.0 and show a large range of observed massratios due to the effect of nitrate content. The nitrate effectis presented in more detail in the discussion below. The levelof particle acidity in the datasets is characterized by the ra-tio between measured ammonium concentration (NH4) and thetheoretically predicted concentration of ammonium (NH4,predict)needed to neutralize the inorganic anion mass concentrationsobserved by the AMS:
NH4,predict = 18 × (SO4/96 × 2 + NO3/62 + Chl/35.45) [3]
where SO4, NO3, and Chl were the measured aerosol sulfate,nitrate, and chloride mass concentrations (in µg m−3), respec-tively, from Equation (2) with CE = 1 for all species. Theratio NH4/NH4,predict is correlated with other parameters used torepresent acidity such as pH (Zhang et al. 2007b). The AMS-measured chloride is typically dominated by ammonium chlo-ride and not sodium chloride (e.g., Salcedo et al., 2006). Notethat this calculation neglected the possibility of ammonium be-ing needed to neutralize organic acids, that a small fractionof the sulfate and nitrate may be due to organosulfates andorganonitrates (Farmer et al. 2010), and assumes the particlesare internally-mixed with the same CE.
In field measurements Quinn and coworkers observed that ifsulfate was fully or partially acidic, the CE increased linearlyto 1 with increasing acidity (Quinn et al. 2006). For partially orfully neutralized particles, the CE was 0.45. While the typicaldefault CE is 10% higher than this, the difference is small con-sidering the 30% uncertainty determined for CE (Bahreini et al.2009). The equation for CE used in the Quinn et al. work wasconverted into a function of NH4/NH4,predict for Figure 2 as: CE= max[0.45, 1.0–1.1 × (NH4/NH4,predict)]. As shown below andin Figure 4, the average for ambient ammonium sulfate particlesis 0.45 ± 0.22 (2σ ), hence 0.45 was considered a lower limit onthe CE of ambient particles. Although the field data in Figure 2agree with the previously published parameterization of Quinnet al. when considering the observed variability as representedby the error bars, the averaged dry CE appears to be more closely
represented by:
CEdry = max(
0.45, 1.0 − 0.73 ×(
NH4/NH4,predict
))[4]
One potential explanation for this slight difference is that themass from fine particle volume shown in Figure 2 was correctedfor AMS lens transmission efficiency whereas the Quinn et al.parameterization was based on the AMS sulfate mass comparedwith PILS-IC sulfate mass and may not have accounted fordifferences in particle transmission between the 2 instruments.
Effect of High Ammonium Nitrate FractionFigure 3 shows the variation in mass ratio as a function of
nitrate content in the sampled aerosol for the 3 studies. Forsimplification periods where the acidity effect discussed aboveis active are removed and only the data where particles weremostly neutralized are shown. Here the aerosol nitrate contentis characterized by the ammonium nitrate mass fraction (ANMF)as follows:
ANMF = 80/62 × NO3
(NH4 + SO4 + NO3 + Chl + Org)[5]
where NH4, SO4, NO3, Chl, and Org were the measured aerosolammonium, sulfate, nitrate, chloride, and organic concentrations(in µg m−3), respectively, from Equation (2) with CE = 1 forall species. Again, this assumes that the particles are internallymixed and have the same CE.
Previous laboratory and field work both yielded CE = 1 forANMF = 1 (Jayne et al. 2000; Crosier et al. 2007; Matthew et al.2008; Nemitz et al. 2011). Yet, the previous work differed in theCE for ANMF = 0 and how the CE increased with ANMF. TheCE parameterizations from previous work are shown in Fig-ure 3. For this representation, the Crosier et al. parameterizationfrom field data which only included nitrate and sulfate mass wasconverted into a function of ANMF neglecting the chloride andorganic concentrations: CE = 0.393 + 0.582 × ANMF. Notethat the ANMF-axis depicted in Figure 3 for their parameteriza-tion (based solely on nitrate and sulfate mass) is not precisely thesame as for the other curves which included chloride and organiccontent. For pure, dry mixed ammonium sulfate/ammonium ni-trate particles with an ANMF less than 0.55, the laboratory CEwas similar to that of pure, dry ammonium sulfate where CE =0.24 and fairly constant (Matthew et al. 2008). Above ANMF= 0.55, the laboratory CE increased linearly with ANMF. Forthe field data reported by Crosier and coworkers (2007), theCE increased linearly from 0.4 for ammonium sulfate (ANMF= 0) to 1 for ammonium nitrate (ANMF = 1). The Nemitzet al. parameterization is from the EUCAARI (European Inte-grated Project on Aerosol Cloud Climate Air Quality Interac-tions) field project and is between the 2 other parameterizations(Nemitz et al. 2011). The data reported here when taken togetherwith the previous field and laboratory studies suggest a different
Dow
nloa
ded
by [
Uni
vers
ity o
f C
olor
ado
Lib
rari
es]
at 2
2:05
05
Oct
ober
201
1

AMS CE PARAMETERIZATIONS EVALUATED WITH FIELD DATA 265
ANMF-dependent CE parameterization as follows:
CEdry = max(0.45, 0.0833 + 0.9167 × ANMF) [6]
in which a constant CE of 0.45 is used for ANMF ≤ 0.4 and alinear CE increase up to 1 for ANMF > 0.4. The ANMF wherethe CE increases in this parameterization (0.4) is a bit lowerthan it is for pure, laboratory particles (0.55), perhaps due to theeffect of organic material in ambient particles.
Lack of Effect of High Organic FractionIn the atmosphere, inorganic aerosol constituents such as
sulfate and nitrate are internally mixed with organic aerosolmaterial (Murphy et al. 2006; Zhang et al. 2007a). Laboratorystudies have shown an effect of the organic content on the AMSCE when the organic material is a liquid coating on solid ammo-nium sulfate (Matthew et al. 2008). In that work, the CE linearlyincreased from the dry value up to 1 for an organic mass fractionof approximately 50%. Whether or not the organic content hasan effect on the CE for ambient particles is explored here withdata from 2 field studies, where Figure 4 shows the observedmass ratios as a function of organic aerosol mass fraction foraerosols with dominantly an inorganic composition of ammo-nium sulfate. Data points with high nitrate content (especiallyobserved with the Boulder data) were excluded from this figurebecause the nitrate effect would obscure an organic effect onCE. This figure indicates that changes in organic content be-tween 25 and 80% do not have a clear effect on AMS CE. Thelack of a strong organic effect in the AMS CE may be consis-tent with recent findings that ambient organic aerosols are solidsand not liquids at low relative humidities (Virtanen et al. 2010),which are present in the AMS inlet. Furthermore, the aged ur-ban aerosol (TexAQS) and the aged biomass burning aerosols(ARCPAC) behaved similarly, which suggests that these typesof organic aerosol are probably not liquid when detected by theAMS instrument. The overall average of all 12989 data pointsfrom the 2 field studies is 0.45 ± 0.22 (2σ ). Note that this er-ror bar represents the combined uncertainty of both the AMSand UHSAS. These results need to be tested further with freshorganic aerosols.
While laboratory measurements have shown a CE of approx-imately 0.25 for pure, dry ammonium sulfate (Matthew et al.2008), most ambient internally mixed sulfate/organic particles,however, display a higher CE around 0.45 (Figure 4). In therelative humidity range of 32–80% RH for dehydrating parti-cles, pure ammonium sulfate particles are metastable liquidsin the atmosphere and have a statistically higher CE of 0.36versus 0.25 for dry particles (Matthew et al. 2008). Yet the CEfor the metastable particles is also on average lower than theCE for the ambient particles (Figure 4). Thus, it is possiblethat the ubiquitous organic content plays a role in increasingthe CE of ammonium sulfate to about 0.45 in internally mixedparticles.
Effect of High RHBecause only the Boulder data had points when the sam-
pling line RH was greater than 80% and these points werealso high in ANMF, the effect of RH on the CE could notbe independently investigated for these studies. However, anRH effect was observed in an ambient data set obtained atTrinidad Head, CA, where the mass concentrations of sulfateincreased by a factor of about 2 when the RH was higher than71% (Allan et al. 2004a). Here, an RH-dependent parameter-ization of CE was estimated based on the laboratory work byMatthew et al. (2008). Since particles lose water to some extentin the AMS lens and vacuum chamber, the sampling line RHwhere particles solidify in the AMS was typically higher thanthe crystallization RH and where particles become liquid wasapproximately equal to the deliquescence RH (Matthew et al.2008). Matthew and coworkers showed that if the sampling lineRH falls between 80 and 90%, the CE increased linearly fromthe “dry” CE. The observed relationship can be summarized asfollows:
CE = max(CEdry, (5×CEdry −4)+ (1−CEdry)/20×RH) [7]
where CEdry was the CE based on the dry particle compositionfrom either Equation 4 or 6 above and RH refers to the relativehumidity of the sampling inlet line (in %). If RH was not mea-sured or was less than 80%, CE was set to CEdry. Again, thisestimation was approximate and did not take metastable phasesinto account, other than ammonium nitrate. Additional studies
FIG. 5. The Comparison of the apparent CE (from the ratio of measurementsfrom multiple, carefully-operated instruments) from all 3 field studies with thedry phase diagram for the H+/NH4
+/SO42−/NO3
− system at 298 K (Martin2000). Note that the calculation of cation mole fraction (X) and anion molefraction (Y) only included the species H+, ammonium, sulfate, and nitrate forthe field data and did not include chloride or organic content.
Dow
nloa
ded
by [
Uni
vers
ity o
f C
olor
ado
Lib
rari
es]
at 2
2:05
05
Oct
ober
201
1
266 A.M. MIDDLEBROOK ET AL.
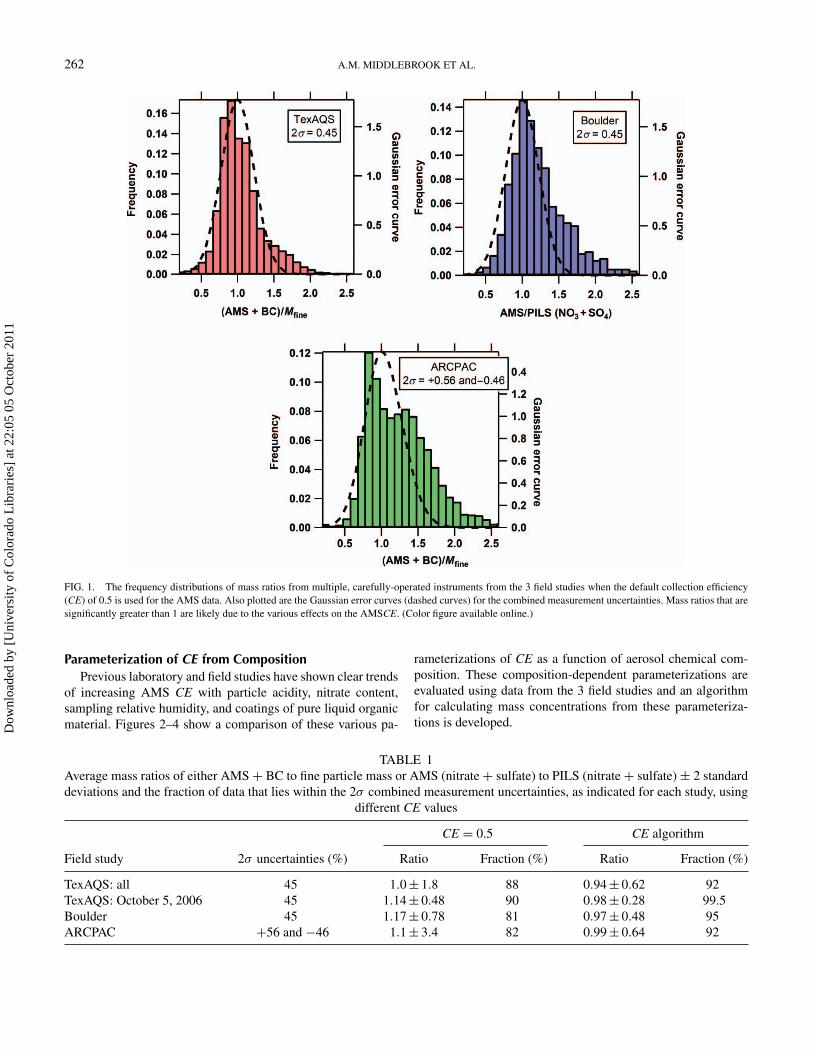
FIG. 6. Example of the acidity effect showing a portion of flight data from October 5, 2005 around Houston with the AMS CE = 0.5 (solid, black curve) or withCE as a function of the composition-dependent algorithm. The calculated fine particle mass (Mfine) is shown in the top panel with the AMS plus black carbon (BC)mass and the frequency distributions of the ratio of the AMS total mass from the 2 CEs plus BC mass to Mfine for the entire flight are shown in the bottom panel.The gray region (top panel) shows ± 30% (2σ ) uncertainty in fine particle volume measurements and the dashed curve (bottom panel) is the Gaussian error curvewith the 2σ combined measurement uncertainty (45%). (Color figure available online.)
are needed to assess the RH parameterization of CE shown inEquation 7.
A representation of the effect of acidity and nitrate content onthe apparent CE is shown in Figure 5 with the isothermal phasediagram for the H+/NH4
+/SO42−/NO3
− system at dry conditions(Martin 2000). In general, the apparent CE is broadly consistentwith known solid/liquid phases at 298 K. Variability is likely dueto drying in the AMS instrument and the relatively wide range ofsampling temperatures for the AMS (from 267 to 310 K for the3 studies). Note that in addition to ionic composition, relativehumidity, and temperature, the phase of atmospheric particlesmay also depend on the organic content or the presence ofinclusions to promote efflorescence of metastable phases suchas ammonium nitrate.
Algorithm Including All EffectsAn algorithm was developed to estimate the chemical
composition-dependent CE according to the parameterizationsshown in Equations (4) and (6) for the 3 datasets (see supplemen-tal information for the Igor procedure file). There were 2 mainsteps to this algorithm. In the first step, the CE was estimatedwith Equations (4) or (6). It is useful to note that the CE correc-tions for nitrate content and particle acidity in these equations donot conflict with each other since ammonium nitrate forms un-der conditions when ammonium sulfate is partially or fully neu-tralized at tropospheric temperatures (Wexler and Clegg 2002).This is clear for the ARCPAC data set which spanned the 2extremes, acidic and high nitrate content particles, during vari-ous times in the field study (Figures 2, 3, and S3). Second, if the
Dow
nloa
ded
by [
Uni
vers
ity o
f C
olor
ado
Lib
rari
es]
at 2
2:05
05
Oct
ober
201
1
AMS CE PARAMETERIZATIONS EVALUATED WITH FIELD DATA 267
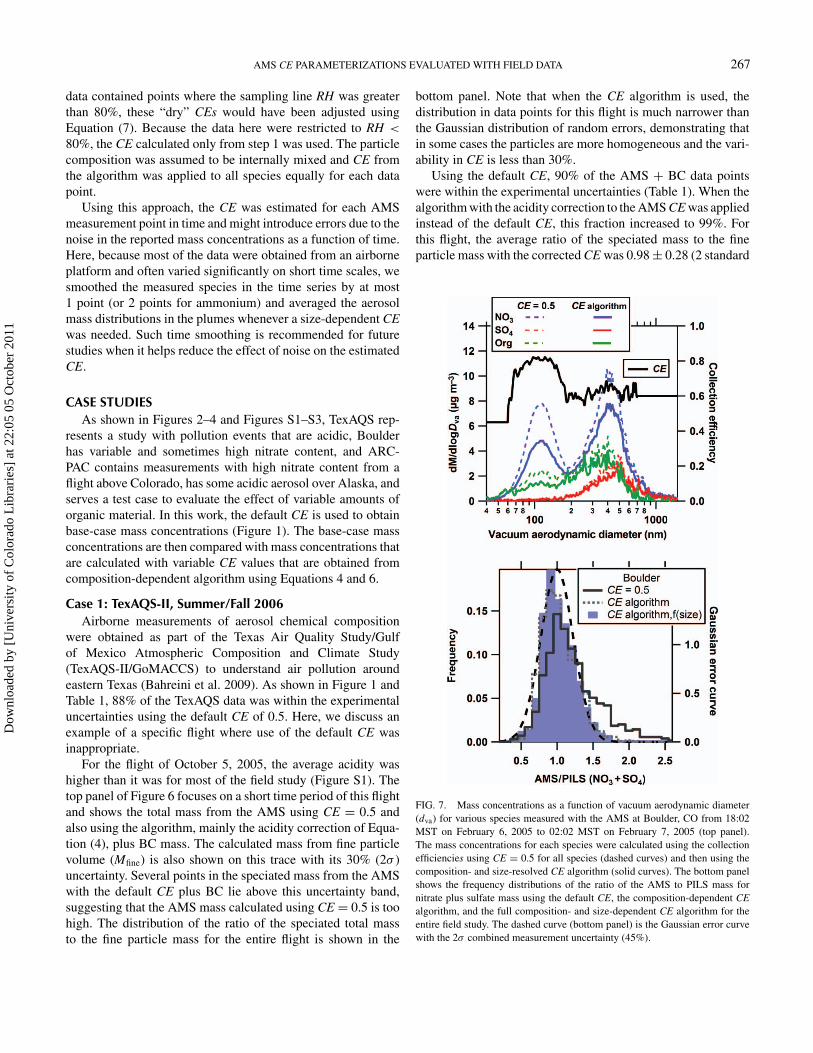
data contained points where the sampling line RH was greaterthan 80%, these “dry” CEs would have been adjusted usingEquation (7). Because the data here were restricted to RH <
80%, the CE calculated only from step 1 was used. The particlecomposition was assumed to be internally mixed and CE fromthe algorithm was applied to all species equally for each datapoint.
Using this approach, the CE was estimated for each AMSmeasurement point in time and might introduce errors due to thenoise in the reported mass concentrations as a function of time.Here, because most of the data were obtained from an airborneplatform and often varied significantly on short time scales, wesmoothed the measured species in the time series by at most1 point (or 2 points for ammonium) and averaged the aerosolmass distributions in the plumes whenever a size-dependent CEwas needed. Such time smoothing is recommended for futurestudies when it helps reduce the effect of noise on the estimatedCE.
CASE STUDIESAs shown in Figures 2–4 and Figures S1–S3, TexAQS rep-
resents a study with pollution events that are acidic, Boulderhas variable and sometimes high nitrate content, and ARC-PAC contains measurements with high nitrate content from aflight above Colorado, has some acidic aerosol over Alaska, andserves a test case to evaluate the effect of variable amounts oforganic material. In this work, the default CE is used to obtainbase-case mass concentrations (Figure 1). The base-case massconcentrations are then compared with mass concentrations thatare calculated with variable CE values that are obtained fromcomposition-dependent algorithm using Equations 4 and 6.
Case 1: TexAQS-II, Summer/Fall 2006Airborne measurements of aerosol chemical composition
were obtained as part of the Texas Air Quality Study/Gulfof Mexico Atmospheric Composition and Climate Study(TexAQS-II/GoMACCS) to understand air pollution aroundeastern Texas (Bahreini et al. 2009). As shown in Figure 1 andTable 1, 88% of the TexAQS data was within the experimentaluncertainties using the default CE of 0.5. Here, we discuss anexample of a specific flight where use of the default CE wasinappropriate.
For the flight of October 5, 2005, the average acidity washigher than it was for most of the field study (Figure S1). Thetop panel of Figure 6 focuses on a short time period of this flightand shows the total mass from the AMS using CE = 0.5 andalso using the algorithm, mainly the acidity correction of Equa-tion (4), plus BC mass. The calculated mass from fine particlevolume (Mfine) is also shown on this trace with its 30% (2σ )uncertainty. Several points in the speciated mass from the AMSwith the default CE plus BC lie above this uncertainty band,suggesting that the AMS mass calculated using CE = 0.5 is toohigh. The distribution of the ratio of the speciated total massto the fine particle mass for the entire flight is shown in the
bottom panel. Note that when the CE algorithm is used, thedistribution in data points for this flight is much narrower thanthe Gaussian distribution of random errors, demonstrating thatin some cases the particles are more homogeneous and the vari-ability in CE is less than 30%.
Using the default CE, 90% of the AMS + BC data pointswere within the experimental uncertainties (Table 1). When thealgorithm with the acidity correction to the AMS CE was appliedinstead of the default CE, this fraction increased to 99%. Forthis flight, the average ratio of the speciated mass to the fineparticle mass with the corrected CE was 0.98 ± 0.28 (2 standard
FIG. 7. Mass concentrations as a function of vacuum aerodynamic diameter(dva) for various species measured with the AMS at Boulder, CO from 18:02MST on February 6, 2005 to 02:02 MST on February 7, 2005 (top panel).The mass concentrations for each species were calculated using the collectionefficiencies using CE = 0.5 for all species (dashed curves) and then using thecomposition- and size-resolved CE algorithm (solid curves). The bottom panelshows the frequency distributions of the ratio of the AMS to PILS mass fornitrate plus sulfate mass using the default CE, the composition-dependent CEalgorithm, and the full composition- and size-dependent CE algorithm for theentire field study. The dashed curve (bottom panel) is the Gaussian error curvewith the 2σ combined measurement uncertainty (45%).
Dow
nloa
ded
by [
Uni
vers
ity o
f C
olor
ado
Lib
rari
es]
at 2
2:05
05
Oct
ober
201
1

268 A.M. MIDDLEBROOK ET AL.
deviations), whereas it was 1.14 ± 0.48 (2 standard deviations)with the default CE (Table 1).
Case 2: Boulder, CO, Winter 2005We applied the CE algorithm to an AMS data set collected
during a ground-based study from January 26 to February 9,2005 at a mesa site overlooking the southwestern edge of Boul-der. For most of the study, aerosol sulfate was primarily in theaccumulation mode and aerosol nitrate, ammonium, and organicmaterial were distributed in the accumulation mode as well as ina smaller mode (Figure S4). Because the AMS lens transmissionefficiency was 100% for particles between 100 and 560 nm andthere were times when a mode of smaller particles was present,the CE algorithm was mainly evaluated for the time periodswhere this small mode was not present (i.e., nitrate present inthe small mode was contributing to <40% of the total nitrate).For these time periods, a large fraction of the ambient submicronmass was measured by the AMS and the particles measured bythe AMS were likely measured by the bulk PILS-IC. There wassufficient ammonium to fully neutralize both the sulfate and ni-trate (slope of measured to predicted NH4 = 0.93, r2 = 0.88) andthe ANMF was often more than 60% across the size range withmost of the mass (Figure S4). Hence, a composition-dependentCE is likely to help improve the ratio of AMS nitrate plus sulfatemass to the PILS nitrate plus sulfate mass calculated using thedefault CE (Figure 1). While the higher nitrate content affectsthe overall applicability of CE = 0.5 for this dataset, the lackof a strong size-dependence on the ANMF on average suggeststhat applying a size-dependent CE might not be important forthis dataset.
There were, however, time periods where the ANMF variedacross the size range measured. An example of this is shownin Figure 7. Here the ammonium nitrate mass fraction washigher in the smaller mode than in the larger mode, makingthe estimated CE change as a function of size. Applying thecomposition-dependent CE algorithm as a function of size re-sults in a slightly different shape to the mass distributions sincethe CE was higher for the smaller particles where there wasrelatively more ammonium nitrate. Unfortunately, high-quality,dry volume distribution data are not available for this field study,which would allow a direct evaluation of the composition- andsize-dependent CE.
For this dataset, mass distributions were obtained every 2.5min and typically had sufficient signal-to-noise to generate aCE from the algorithm using the mass distributions as a func-tion of time. This composition- and size-dependent CE wasthen applied across each of the species in individual mass dis-tributions, which were integrated to give the final mass con-centrations for each species. Using the default CE, 81% of themass ratios of AMS to PILS data were within the experimentaluncertainties (Table 1). When the algorithm with the nitrate-content correction to the AMS CE was applied instead of thedefault CE, this fraction increased to 95%. For both the bulkand size-dependent CEs from the algorithm, less than 3% of
data points with mass ratios greater than 1 were outside themaximum range of uncertainties from random effects whereasfor the default CE this fraction was 18%. The final mass ratiosof AMS to PILS data improved from 1.17 ± 0.78 (2 standarddeviations) using the default CE to 0.97 ± 0.48 (2 standard de-viations) for the CE as a function of both composition and size(Figure 7 and Table 1). While applying only the composition-dependent CE algorithm to the entire field study improves themass ratios of the AMS to PILS for nitrate plus sulfate andfollows the Gaussian distribution of random errors from thecombined measurement uncertainties, using the composition-and size-dependent CE narrows the distribution of data pointsfurther.
Case 3: ARCPAC, Spring 2008For the ARCPAC study, 18% of the data points had mass
ratios beyond the combined uncertainties when CE = 0.5 wasused (Figure 1), when less than 5% were expected due to ran-dom effects. This case was the only 1 of the 3 studies where bothcompositional extremes were observed: high acidity (Figure 2)and high nitrate content (Figure 3). Furthermore, the particlecomposition during the latter part of this field study was domi-nated by organic material from aged biomass burning particles,which had been transported to the Arctic from fires in Siberiaand Kazakhstan (Warneke et al. 2009). The BC mass fractionfor the entire field study including the biomass burning parti-cles was less than 5%. When the composition-dependent CEwas applied, the mass concentrations for the acidic and nitrate-dominated points were reduced and 13% more of the massratios were closer to 1.0 and within the uncertainties (Figure 8).The distribution created using the CE algorithm for the AMSmass clearly fits the Gaussian distribution of random errors moreclosely than that created using the default CE. The average massratio and its standard deviation improved from 1.1 ± 1.7 (2
FIG. 8. Ratio of the AMS plus black carbon (BC) mass to the fine particlemass (Mfine) for the entire ARCPAC study using either the default CE or the CEalgorithm. The dashed curve is the Gaussian error curve with the 2σ combinedmeasurement uncertainty (+56/–46%). (Color figure available online.)
Dow
nloa
ded
by [
Uni
vers
ity o
f C
olor
ado
Lib
rari
es]
at 2
2:05
05
Oct
ober
201
1

AMS CE PARAMETERIZATIONS EVALUATED WITH FIELD DATA 269
TABLE 2Results from orthogonal distance regressions with an intercept through zero of the total measured mass, either from AMS + BC
versus fine particle mass, or AMS (nitrate + sulfate) versus PILS (nitrate + sulfate) for each study using different CE values(shown in Figures S5–S8)
CE = 0.5 CE algorithm
Field study Number of data points slope R2 χ2 slope R2 χ2
TexAQS: all 13275 0.98 0.82 68509 0.96 0.90 29835TexAQS: October 5, 2006 1543 1.15 0.72 10289 0.98 0.85 3699Boulder 1228 1.23 0.80 3048 0.96 0.92 914ARCPAC 2622 0.86 0.92 12827 0.89 0.95 8716
standard deviations) using the default CE to 0.99 ± 0.32 (2standard deviations) using the composition-dependent CE algo-rithm.
CONCLUSIONSAn algorithm was created for estimating AMS CE for field
data based on the aerosol chemical composition and samplingline RH in addition to laboratory and field measurements of CE.This approach improves quantification of AMS mass concen-trations in comparison with other particle mass measurementsin cases where particles are acidic or contain large amounts ofnitrate, where the CE is actually higher than the default CE of0.5. It is useful to note that for all 3 datasets particles that are notacidic and do not contain large amounts of nitrate have a baseCE of 0.45. The default CE of 0.5 that has been typically used inambient AMS measurements lies within the uncertainty of thisvalue. In the datasets where the algorithm was applied, particlecomposition sometimes varied across different size ranges anda composition-dependent CE as a function of size was neededto achieve better agreement with other particle measurements.Consistent with previous results, in the base case scenario inwhich CE = 0.5 is used for all data points, the agreement be-tween AMS mass and external measurements of mass lies withinthe experimental uncertainties for at least 81% of the data. Inall case studies, the systematic positive biases in the mass ratioswere indicative of the need for a higher CE than the default.For these situations, the mass concentrations using the defaultCE may be too high by as much as a factor of 2. In the fieldstudies examined here, the mass concentrations using the CEalgorithm compared with using the default CE decreased on av-erage by 6% (TEXAQS), 16% (Boulder), and 10% (ARCPAC).The departures from the default CE allow for better descriptionsof individual events and may be particularly necessary for en-vironments with high acidity, nitrate content, and/or samplinginlet RH. Tables 1 and 2 summarize how the algorithm improvedthe mass ratio for all 3 studies, reducing the systematic positivebiases depicted in Figure 1 and increasing the linear correlationbetween the various methods of determining submicron aerosolmass. Furthermore, when the CE algorithm was applied, thesedata points fell into the range of data expected by random error
of the combined measurement uncertainties with a 30% (2σ ) un-certainty in AMS mass concentration. The variability in organiccontent does not seem to correlate with obvious changes in CEacross the 3 environments. Due to the potential additional vari-ation of CE at high humidity levels (Allan et al. 2004a; Ng et al.2011), it is recommended that the AMS sampling line be driedto low humidities (∼20% RH) before entering the AMS. Thisstrategy simplifies the application of the composition-dependentCE determined in this paper and reduces further losses for par-ticles that become too large to be transmitted through the lenswhen hydrated. Although the application of this algorithm ap-pears to provide reasonable AMS mass concentrations for thesefield data sets, it should be tested with other data sets, especiallyto determine effect of sampling line RH and different organicmaterials in a variety of environments.
REFERENCESAiken, A. C., Salcedo, D., Cubison, M. J., Huffman, J. A., DeCarlo, P. F., Ul-
brich, I. M., et al. (2009). Mexico City Aerosol Analysis During MILAGROUsing High Resolution Aerosol Mass Spectrometry at the Urban Supersite(T0). Part 1: Fine Particle Composition and Organic Source Apportionment.Atmos. Chem. Phys. 9:6633–6653, doi:10.5194/acp-9–6633-2009.
Alfarra, M. R., Coe, H., Allan, J. D., Bower, K. N., Boudries, H., Canagaratna, M.R., et al. (2004). Characterization of Urban and Rural Organic Particulate inthe Lower Fraser Valley Using Two Aerodyne Aerosol Mass Spectrometers.Atmos. Environ. 38:5745–5758, doi:10.1016/j.atmosenv.2004.01.054.
Allan, J. D., Alfarra, M. R., Bower, K. N., Williams, P. I., Gallagher, M.W., Jimenez, J. L., et al. (2003a). Quantitative Sampling Using an Aero-dyne Aerosol Mass Spectrometer 2. Measurements of Fine ParticulateChemical Composition in Two U.K. Cities. J. Geophys. Res. 108:4091,doi:10.1029/2002JD002359.
Allan, J. D., Bower, K. N., Coe, H., Boudries, H., Jayne, J. T., Canagaratna,M. R., et al. (2004a). Submicron Aerosol Composition at Trinidad Head,California, During ITCT 2K2: Its Relationship with Gas Phase VolatileOrganic Carbon and Assessment of Instrument Performance. J. Geophys.Res. 109:D23S24, doi:10.1029/2003JD004208.
Allan, J. D., Delia, A. E., Coe, H., Bower, K. N., Alfarra, M. R., Jimenez, J.L., et al. (2004b). A Generalised Method for the Extraction of ChemicallyResolved Mass Spectra from Aerodyne Aerosol Mass Spectrometer Data.J. Aerosol Sci. 35:909–922, doi:10.1016/j.jaerosci.2004.02.007.
Allan, J. D., Jimenez, J. L., Williams, P. I., Alfarra, M. R., Bower, K. N., Jayne, J.T., et al. (2003b). Quantitative Sampling Using an Aerodyne Aerosol MassSpectrometer 1. Techniques of Data Interpretation and Error Analysis. J.Geophys. Res. 108:4090, doi:10.1029/2002JD002358.
Dow
nloa
ded
by [
Uni
vers
ity o
f C
olor
ado
Lib
rari
es]
at 2
2:05
05
Oct
ober
201
1

270 A.M. MIDDLEBROOK ET AL.
Asa-Awuku, A., Moore, R. H., Nenes, A., Bahreini, R., Holloway, J. S., Brock,C. A., et al. (2011). Airborne Cloud Condensation Nuclei MeasurementsDuring the 2006 Texas Air Quality Study. J. Geophys. Res. 116:D11201,doi:10.1029/2010JD014874.
Bahreini, R., Dunlea, E. J., Matthew, B. M., Simons, C., Docherty, K. S.,DeCarlo, P. F., et al. (2008). Design and Operation of a Pressure-ControlledInlet for Airborne Sampling with an Aerodynamic Aerosol Lens. AerosolSci. Technol. 42:465–471, doi:10.1080/02786820802178514.
Bahreini, R., Ervens, B., Middlebrook, A. M., Warneke, C., de Gouw, J. A.,DeCarlo, P. F., et al. (2009). Organic Aerosol Formation in Urban and Indus-trial Plumes Near Houston and Dallas, Texas. J. Geophys. Res. 114:D00F16,doi:10.1029/2008JD011493.
Brock, C. A., Cozic, J., Bahreini, R., Froyd, K. D., Middlebrook, A. M., Mc-Comiskey, A., et al. (2011). Characteristics, Sources, and Transport ofAerosols Measured in Spring 2008 During the Aerosol, Radiation, and CloudProcesses Affecting Arctic Climate (ARCPAC) Project. Atmos. Chem. Phys.11:2423–2453, doi:10.5194/acp-11-2423-2011.
Canagaratna, M. R., Jayne, J. T., Jimenez, J. L., Allan, J. D., Alfarra, M. R.,Zhang, Q., et al. (2007). Chemical and Microphysical Characterization ofAmbient Aerosols with the Aerodyne Aerosol Mass Spectrometer. MassSpectrom. Rev. 26:185–222, doi:10.1002/mas.20115.
Cappa, C. D., and Jimenez, J. L. (2010). Quantitative Estimates of the Volatil-ity of Ambient Organic Aerosol. Atmos. Chem. Phys. 10:5409–5424,doi:10.5194/acp-10-5409-2010.
Crosier, J., Allan, J. D., Coe, H., Bower, K. N., Formenti, P., and Williams, P.I. (2007). Chemical Composition of Summertime Aerosol in the Po Valley(Italy), Northern Adriatic and Black Sea. Q. J. Roy. Meteor. Soc. 133:61–75,doi:10.1002/qj.88.
Cross, E. S., Onasch, T. B., Canagaratna, M., Jayne, J. T., Kimmel, J., Yu, X.-Y., et al. (2009). Single Particle Characterization Using a Light ScatteringModule Coupled to a Time-of-Flight Aerosol Mass Spectrometer. Atmos.Chem. Phys. 9:7769–7793, doi:acp-9-7769-2009.
Cross, E. S., Slowik, J. G., Davidovits, P., Allan, J. D., Worsnop, D. R., Jayne, J.T., et al. (2007). Laboratory and Ambient Particle Density DeterminationsUsing Light Scattering in Conjunction with Aerosol Mass Spectrometry.Aerosol Sci. Technol. 41:343–359, doi:10.1080/02786820701199736.
de Gouw, J. A., Brock, C. A., Atlas, E. L., Bates, T. S., Fehsenfeld, F. C.,Goldan, P. D., et al. (2008). Sources of Particulate Matter in the North-eastern United States in Summer: 1.Direct Emissions and Secondary For-mation of Organic Matter in Urban Plumes. J. Geophys. Res. 113:D08301,doi:10.1029/2007JD009243.
de Gouw, J. A., Middlebrook, A. M., Warneke, C., Goldan, P. D., Kuster, W.C., Roberts, J. M., et al. (2005). Budget of Organic Carbon in a PollutedAtmosphere: Results from the New England Air Quality Study in 2002. J.Geophys. Res. 110:D16305, doi:10.1029/2004JD005623.
DeCarlo, P. F., Dunlea, E. J., Kimmel, J. R., Aiken, A. C., Sueper, D., Crounse,J., et al. (2008). Fast Airborne Aerosol Size and Chemistry MeasurementsAbove Mexico City and Central Mexico During the MILAGRO Campaign.Atmos. Chem. Phys. 8:4027–4048, doi:10.5194/acp-8-4027-2008.
DeCarlo, P. F., Kimmel, J. R., Trimborn, A., Northway, M. J., Jayne, J. T.,Aiken, A. C., et al. (2006). Field-Deployable, High-Resolution, Time-of-Flight Aerosol Mass Spectrometer. Anal. Chem. 78:8281–8289, doi:8210.1021/ac061249n.
DeCarlo, P. F., Slowik, J. G., Worsnop, D. R., Davidovits, P., and Jimenez, J.L. (2004). Particle Morphology and Density Characterization by CombinedMobility and Aerodynamic Diameter Measurements. Part 1: Theory. AerosolSci. Technol. 38:1185–1205, doi:10.1080/027868290903907.
Drewnick, F., Hings, S. S., DeCarlo, P., Jayne, J. T., Gonin, M., Fuhrer, K., et al.(2005). A New Time-of-Flight Aerosol Mass Spectrometer (TOF-AMS) -Instrument Description and First Field Deployment. Aerosol Sci. Technol.39:637–658, doi:10.1080/02786820500182040.
Drewnick, F., Schwab, J. J., Jayne, J. T., Canagaratna, M., Worsnop, D.R., and Demerjian, K. L. (2004). Measurements of Ambient AerosolComposition During PMTACS-NY 2001 Using an Aerosol Mass Spec-
trometer. Part I: Mass Concentrations. Aerosol Sci. Technol. 38:92–103,doi:10.1080/02786820390229507.
Engelhart, G. J., Hildebrandt, L., Kostenidou, E., Mihalopoulos, N., Donahue,N. M., and Pandis, S. N. (2011). Water Content of Aged Aerosol. Atmos.Chem. Phys. 11:911–920, doi:10.5194/acp-11-911-2011.
Farmer, D. K., Matsunaga, A., Docherty, K. S., Surratt, J. D., Seinfeld,J. H., Ziemann, P. J., et al. (2010). Response of an Aerosol MassSpectrometer to Organonitrates and Organosulfates and Implications forAtmospheric Chemistry. Proc. Natl. Acad. Sci. U.S.A. 107:6670–6675,doi:10.1073/pnas.0912340107.
Hogrefe, O., Schwab, J. J., Drewnick, F., Lala, G. G., Peters, S., Demerjian, K.L., et al. (2004). Semicontinuous PM2.5 Sulfate and Nitrate Measurementsat an Urban and a Rural Location in New York: PMTACS-NY Summer 2001and 2002 Campaigns. J. Air Waste Manage. Assoc. 54:1040–1060.
Huffman, J. A., Docherty, K. S., Aiken, A. C., Cubison, M. J., Ulbrich, I.M., DeCarlo, P. F., et al. (2009). Chemically-Resolved Aerosol Volatil-ity Measurements from two Megacity Field Studies. Atmos. Chem. Phys.9:7161–7182, doi:10.5194/acp-9-7161-2009.
Huffman, J. A., Jayne, J. T., Drewnick, F., Aiken, A. C., Onasch, T., Worsnop, D.R., et al. (2005). Design, Modeling, Optimization, and Experimental Tests ofa Particle Beam Width Probe for the Aerodyne Aerosol Mass Spectrometer.Aerosol Sci. Technol. 39:1143–1163, doi:10.1080/02786820500423782.
Jayne, J. T., Leard, D. C., Zhang, X., Davidovits, P., Smith, K. A., Kolb, C.E., et al. (2000). Development of an Aerosol Mass Spectrometer for Sizeand Composition Analysis of Submicron Particles. Aerosol Sci. Technol.33:49–70, doi:10.1080/027868200410840.
Jimenez, J. L., Canagaratna, M. R., Donahue, N. M., Prevot, A. S. H., Zhang, Q.,Kroll, J. H., et al. (2009). Evolution of Organic Aerosols in the Atmosphere.Science 326:1525–1529, doi:10.1129/science.1180353.
Jimenez, J. L., Jayne, J. T., Shi, Q., Kolb, C. E., Worsnop, D. R., Yourshaw, I.,et al. (2003). Ambient Aerosol Sampling Using the Aerodyne Aerosol MassSpectrometer. J. Geophys. Res. 108:8425, doi:10.1029/2001JD001213.
Khlystov, A., Stanier, C. O., Takahama, S., and Pandis, S. N. (2005). WaterContent of Ambient Aerosol During the Pittsburgh Air Quality Study. J.Geophys. Res. 110:D07S10, doi:10.1029/2004JD004651.
Kiendler-Scharr, A., Zhang, Q., Hohaus, T., Kleist, E., Mensah, A., Mentel, T.F., et al. (2009). Aerosol Mass Spectrometric Features of Biogenic SOA: Ob-servations from a Plant Chamber and in Rural Atmospheric Environments.Environ. Sci. Technol. 43:8166–8172, doi:10.1021/es901420b.
Kleinman, L. I., Springston, S. R., Daum, P. H., Lee, Y.-N., Nunnermacker,L. J., Senum, G. I., et al. (2008). The Time Evolution of Aerosol Com-position Over the Mexico City Plateau. Atmos. Chem. Phys. 8:1559–1575,doi:10.5194/acp-8-1559-2008.
Kondo, Y., Miyazaki, Y., Takegawa, N., Miyakawa, T., Weber, R. J., Jimenez, J.L., et al. (2007). Oxygenated and Water-Soluble Organic Aerosols in Tokyo.J. Geophys. Res. 112:D01203, doi:10.1029/2006JD007056.
Liu, P. S. K., Deng, R., Smith, K. A., Williams, L. R., Jayne, J. T., Canagaratna,M. R., et al. (2007). Transmission Efficiency of an Aerodynamic FocusingLens System: Comparison of Model Calculations and Laboratory Measure-ments for the Aerodyne Aerosol Mass Spectrometer. Aerosol Sci. Technol.41:721–733, doi:10.1080/02786820701422278.
Marcolli, C., Luo, B., and Peter, T. (2004). Mixing of the Organic AerosolFractions: Liquids as the Thermodynamically Stable Phases. J. Phys. Chem.A 108:2216–2224, doi:10.1021/jp036080l.
Martin, S. T. (2000). Phase Transitions of Aqueous Atmospheric Particles.Chem. Rev. 100:3403–3453, doi:10.1021/cr990034t.
Matthew, B. M., Middlebrook, A. M., and Onasch, T. B. (2008). CollectionEfficiencies in an Aerodyne Aerosol Mass Spectrometer as a Function ofParticle Phase for Laboratory Generated Aerosols. Aerosol Sci. Technol.42:884–898, doi:10.1080/02786820802356797.
Murphy, D. M., Cziczo, D. J., Froyd, K. D., Hudson, P. K., Matthew, B.M., Middlebrook, A. M., et al. (2006). Single-Particle Mass Spectrom-etry of Tropospheric Aerosol Particles. J. Geophys. Res. 111:D23S32,doi:10.1029/2006JD007340.
Dow
nloa
ded
by [
Uni
vers
ity o
f C
olor
ado
Lib
rari
es]
at 2
2:05
05
Oct
ober
201
1

AMS CE PARAMETERIZATIONS EVALUATED WITH FIELD DATA 271
Nemitz, E., other1, other2, other3, other4, other5, et al. (2011). Aerosol MassSpectrometer Network Measurements During the EUCAARI/EMEP Inten-sive Measurement Campaigns. Atmos. Chem. Phys. Disc. in prep.
Ng, N. L., Herndon, S. C., Trimborn, A., Canagaratna, M. R., Croteau,P. L., Onasch, T. B., et al. (2011). An Aerosol Chemical SpeciationMonitor (ACSM) for Routine Monitoring of the Composition and MassConcentrations of Ambient Aerosol. Aerosol Sci. Technol. 45:780–794,doi:10.1080/02786826.2011.560211.
Park, K., Kittelson, D. B., Zachariah, M. R., and McMurry, P. H. (2004).Measurement of Inherent Material Density of Nanoparticle Agglomer-ates. J. Nanoparticle Res. 6:267–272, doi:10.1023/B:NANO.0000034657.71309.e6.
Perry, R. H., and Green, D. W., eds. (1997). Perry’s Chemical Engineers’Handbook. McGraw-Hill, New York, NY.
Quinn, P. K., Bates, T. S., Coffman, D., Onasch, T. B., Worsnop, D., Baynard,T., et al. (2006). Impacts of Sources and Aging on Submicrometer AerosolProperties in the Marine Boundary Layer Across the Gulf of Maine. J.Geophys. Res. 111:D23S36, doi:10.1029/2006JD007582.
Rood, M. J., Shaw, M. A., Larson, T. V., and Covert, D. S. (1989). Ubiq-uitous Nature of Ambient Metastable Aerosol. Nature 337:537–539,doi:10.1038/337537a0.
Salcedo, D., Onasch, T. B., Canagaratna, M. R., Dzepina, K., Huffman, J. A.,Jayne, J. T., et al. (2007). Technical Note: Use of a Beam Width Probe in anAerosol Mass Spectrometer to Monitor Particle Collection Efficiency in theField. Atmos. Chem. Phys. 7:549–556, doi:10.5194/acp-7-549-2007.
Salcedo, D., Onasch, T. B., Dzepina, K., Canagaratna, M. R., Zhang, Q., Huff-man, J. A., et al. (2006). Characterization of Ambient Aerosols in MexicoCity During the MCMA-2003 Campaign with Aerosol Mass Spectrome-try: Results from the CENICA Supersite. Atmos. Chem. Phys. 6:925–946,doi:10.5194/acp-6-925-2006.
Schwarz, J. P., Gao, R. S., Fahey, D. W., Thomson, D.S., Watts, L. A., Wilson,J. C., et al. (2006). Single-Particle Measurements of Midlatitude Black Car-bon and Light-Scattering Aerosols from the Boundary Layer to the LowerStratosphere. J. Geophys. Res. 111:D16207, doi:10.1029/2006JD007076.
Slowik, J. G., Stroud, C., Bottenheim, J. W., Brickell, P. C., Chang, R. Y.-W.,Liggio, J., et al. (2010). Characterization of a Large Biogenic SecondaryOrganic Aerosol Event from Eastern Canadian Forests. Atmos. Chem. Phys.10:2825–2845, doi:10.5194/acp-10-2825-2010.
Takegawa, N., Miyazaki, Y., Kondo, Y., Komazaki, Y., Miyakawa, T., Jimenez,J. L., et al. (2005). Characterization of an Aerodyne Aerosol Mass Spec-trometer (AMS): Intercomparison with Other Aerosol Instruments. AerosolSci. Technol. 39:760–770, doi:10.1080/02786820500243404.
Tang, I. N. (1980). Deliquescence Properties and Particle Size Change of Hy-groscopic Aerosols, in Generation of Aerosols and Facilities for ExposureExperiments, K. Willeke, ed., Ann Arbor Science Publishers, Ann Arbor,MI, 153–167.
Timonen, H., Aurela, M., Carbone, S., Saarnio, K., Saarikoski, S., Makela, T.,et al. (2010). High Time-Resolution Chemical Characterization of the Water
Soluble Fraction of Ambient Aerosols with PILS-TOC-IC and AMS. Atmos.Meas. Tech. 3:1063–1074, doi:10.5194/amt-3–1063-2010.
Topping, D., Coe, H., McFiggans, G., Burgess, R., Allan, J., Alfarra, M. R., et al.(2004). Aerosol Chemical Characteristics from Sampling Conducted on theIsland of Jeju, Korea During ACE Asia. Atmos. Environ. 38:2111–2123,doi:10.1016/j.atmosenv.2004.01.022.
Venkatachari, P., Zhou, L., Hopke, P. K., Schwab, J. J., Demerjian, K. L.,Weimer, S., et al. (2006). An Intercomparison of Measurement Methodsfor Carbonaceous Aerosol in Ambient air in New York City. Aerosol Sci.Technol. 40:788–795, doi:10.1080/02786820500380289.
Virtanen, A., Joutsensaari, J., Koop, T., Kannosto, J., Yli-Pirila, P., J.Leskinen,et al. (2010). An Amorphous Solid State of Biogenic Secondary OrganicAerosol Particles. Nature 467:824–827, doi:10.1038/nature09455.
Warneke, C., Bahreini, R., Brioude, J., Brock, C. A., de Gouw, J. A., Fahey, D.W., et al. (2009). Biomass Burning in Siberia and Kazakhstan as an ImportantSource for Haze Over the Alaskan Arctic in April 2008. Geophys. Res. Lett.36:L02813, doi:10.1029/2008GL036194.
Weber, R. J., Orsini, D., Daun, Y., Lee, Y.-N., Klotz, P. J., and Brechtel,F. (2001). A Particle-into-Liquid Collector for Rapid Measurement ofAerosol Bulk Chemical Composition. Aerosol Sci. Technol. 35:718–725,doi:10.1080/02786820152546761.
Weimer, S., Drewnick, F., Hogrefe, O., Schwab, J. J., Rhoads, K., Orsini, D.,et al. (2006). Size-Selective Nonrefractory Ambient Aerosol MeasurementsDuring the Particulate Matter Technology Assessment and CharacterizationStudy - New York 2004 Winter Intensive in New York City. J. Geophys.Res. 111:D18305, doi:10.1029/2006JD007215.
Wexler, A. S., and Clegg, S. L. (2002). Atmospheric Aerosol Models for SystemsIncluding the Ions H+, NH4+, Na+, SO42-, NO3-, Cl-, Br-, and H2O. J.Geophys. Res. 107:4207, doi:10.1029/2001JD000451.
Zelenyuk, A., Imre, D., and Cuadra-Rodriguez, L. A. (2006). Evaporation ofWater from Particles in the Aerodynamic Lens Inlet: An Experimental Study.Anal. Chem. 78:6942–6947, doi:10.1021/ac061184o.
Zelenyuk, A., Imre, D., Han, J. H., and Oatis, S. (2008). Simultaneous Mea-surements of Individual Ambient Particle Size, Composition, EffectiveDensity, and Hygroscopicity. Anal. Chem. 80:1401–1407, doi:10.1021/ac701723v.
Zhang, Q., Jimenez, J. L., Canagaratna, M. R., Allan, J. D., Coe, H., Ulbrich, I.,et al. (2007a). Ubiquity and Dominance of Oxygenated Species in OrganicAerosols in Anthropogenically-Influenced Northern Hemisphere Midlati-tudes. Geophys. Res. Lett. 34:L13801, doi:10.1029/2007GL029979.
Zhang, Q., Jimenez, J. L., Worsnop, D. R., and Canagaratna, M. (2007b).A Case Study of Urban Particle Acidity and Its Ifluence on Sec-ondary Organic Aerosol. Environ. Sci. Technol. 41:3213–3219, doi:10.1021/es061812j.
Zhang, X., Smith, K. A., Worsnop, D. R., Jimenez, J. L., Jayne, J. T., Kolb,C. E., et al. (2004). Characterization of Particle Beam Collimation: PartII Integrated Aerodynamic Lens-Nozzle System. Aerosol Sci. Technol.38:619–638, doi:10.1080/02786820490479833.
Dow
nloa
ded
by [
Uni
vers
ity o
f C
olor
ado
Lib
rari
es]
at 2
2:05
05
Oct
ober
201
1
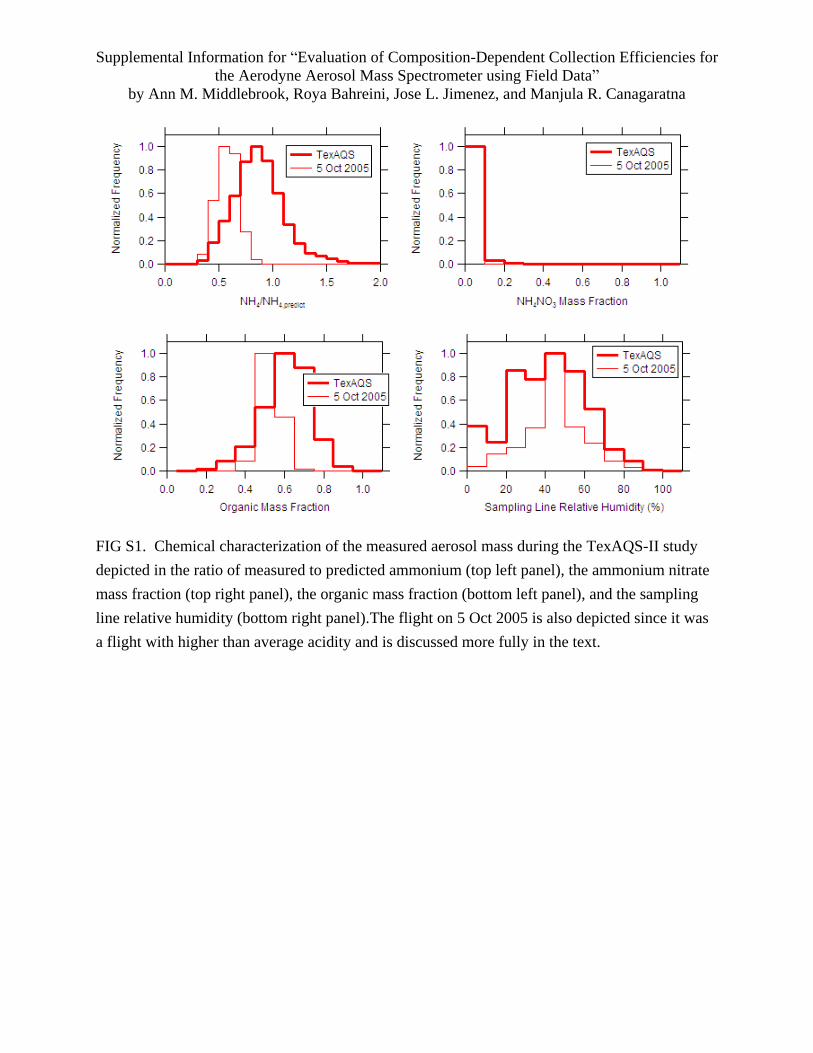
Supplemental Information for “Evaluation of Composition-Dependent Collection Efficiencies for
the Aerodyne Aerosol Mass Spectrometer using Field Data”
by Ann M. Middlebrook, Roya Bahreini, Jose L. Jimenez, and Manjula R. Canagaratna
FIG S1. Chemical characterization of the measured aerosol mass during the TexAQS-II study
depicted in the ratio of measured to predicted ammonium (top left panel), the ammonium nitrate
mass fraction (top right panel), the organic mass fraction (bottom left panel), and the sampling
line relative humidity (bottom right panel).The flight on 5 Oct 2005 is also depicted since it was
a flight with higher than average acidity and is discussed more fully in the text.

2
FIG S2. Chemical characterization of the measured aerosol mass during the Boulder winter
study depicted in the ratio of measured to predicted ammonium (top left panel), the ammonium
nitrate mass fraction (top right panel), the organic mass fraction (bottom left panel), and the
sampling line relative humidity (bottom right panel).
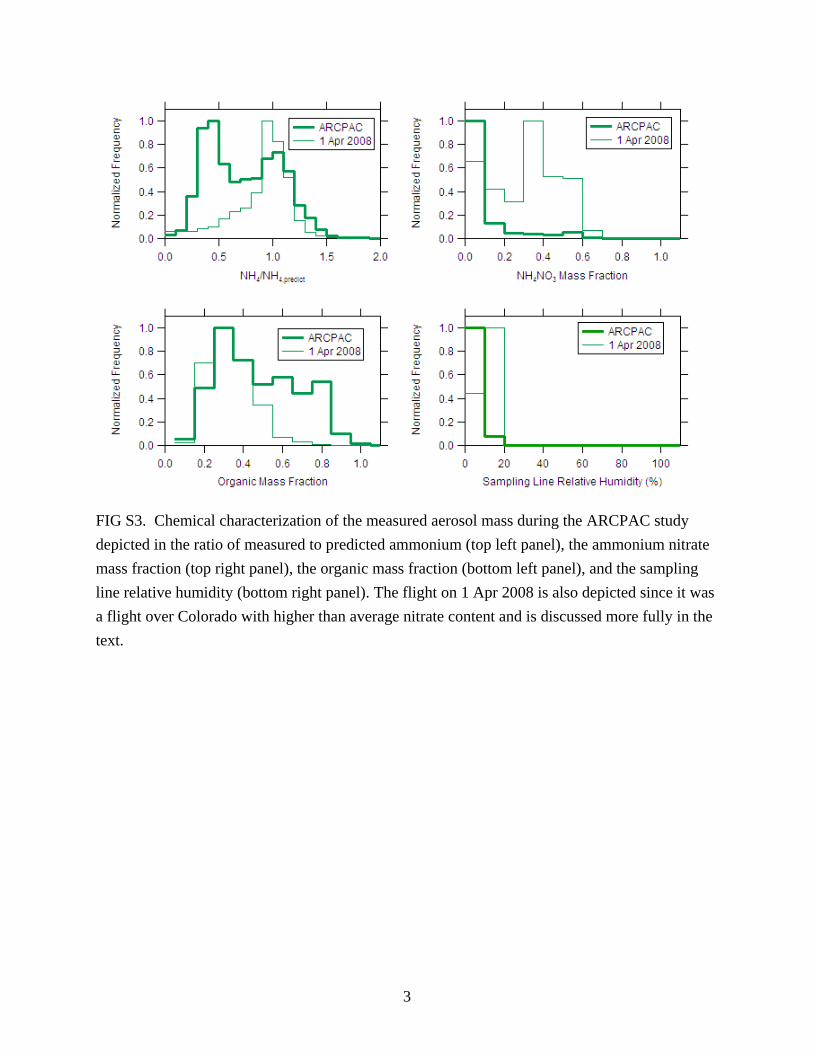
3
FIG S3. Chemical characterization of the measured aerosol mass during the ARCPAC study
depicted in the ratio of measured to predicted ammonium (top left panel), the ammonium nitrate
mass fraction (top right panel), the organic mass fraction (bottom left panel), and the sampling
line relative humidity (bottom right panel). The flight on 1 Apr 2008 is also depicted since it was
a flight over Colorado with higher than average nitrate content and is discussed more fully in the
text.
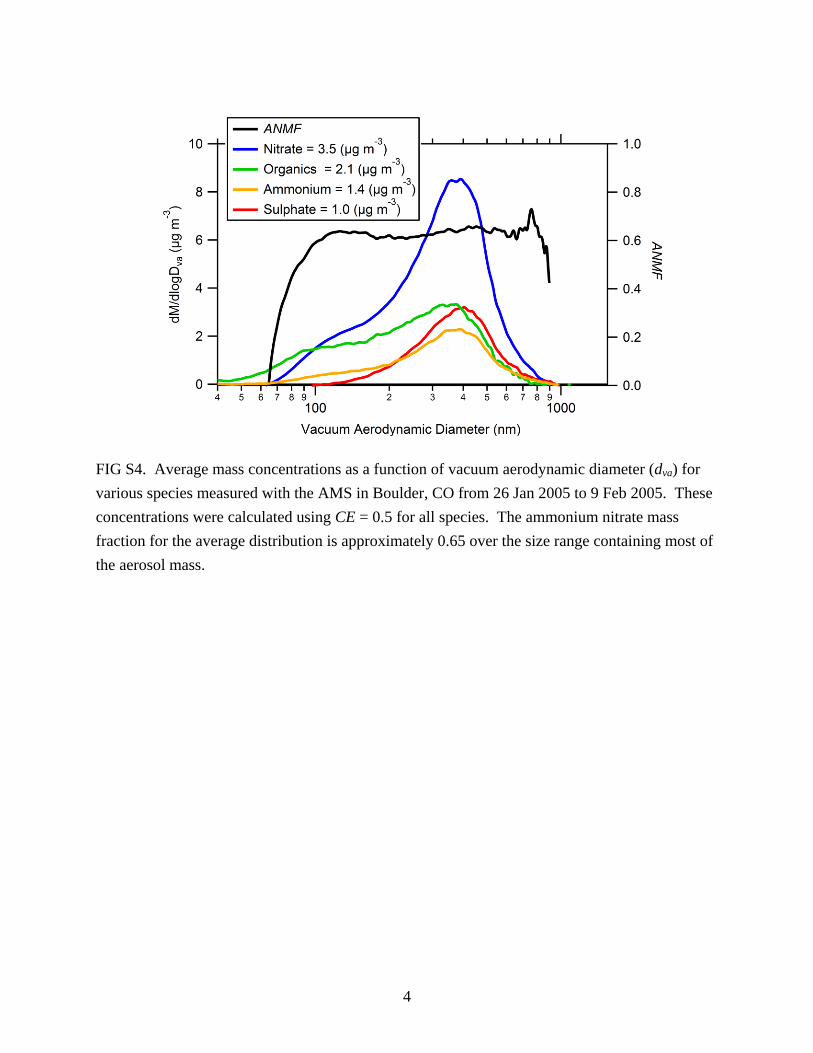
4
FIG S4. Average mass concentrations as a function of vacuum aerodynamic diameter (dva) for
various species measured with the AMS in Boulder, CO from 26 Jan 2005 to 9 Feb 2005. These
concentrations were calculated using CE = 0.5 for all species. The ammonium nitrate mass
fraction for the average distribution is approximately 0.65 over the size range containing most of
the aerosol mass.

5
Fig. S5. Mass from the AMS plus black carbon (BC) versus the fine particulate mass (Mfine)
from the TexAQS field study. The default CE is used to calculate the AMS mass in the top panel
and the CE algorithm described in this manuscript was used in the bottom panel. The linear fit is
an orthogonal distance regression with an intercept of 0. The difference in slopes between the
two is not significant. The decrease in χ2 indicates that the data obtained using the CE algorithm
is better represented by a linear relationship to Mfine than the data obtained using the default CE.

6
Fig. S6. Mass from the AMS plus black carbon (BC) versus the fine particulate mass (Mfine)
from 5 Oct. 2006 during the TexAQS field study. The default CE is used to calculate the AMS
mass in the top panel and the CE algorithm described in this manuscript was used in the bottom
panel. The linear fit is an orthogonal distance regression with an intercept of 0. The slope from
the fit for the data using the CE algorithm is closer to one than the slope from the fit for the data
using the default CE. The decrease in χ2 indicates that the data obtained using the CE algorithm
is better represented by a linear relationship to Mfine than the data obtained using the default CE.

7
Fig. S7. Nitrate plus sulfate mass from the AMS versus nitrate plus sulfate mass from the PILS
instrument during the field study in Boulder, CO. The default CE is used to calculate the AMS
mass in the top panel and the CE algorithm described in this manuscript was used in the bottom
panel. The linear fit is an orthogonal distance regression with an intercept of 0. The slope from
the fit for the data using the CE algorithm is closer to one than the slope from the fit for the data
using the default CE. The decrease in χ2 indicates that the data obtained using the CE algorithm
is better represented by a linear relationship to Mfine than the data obtained using the default CE.

8
Fig. S8. Mass from the AMS plus black carbon (BC) versus the fine particulate mass (Mfine)
from the ARCPAC study. The default CE is used to calculate the AMS mass in the top panel and
the CE algorithm described in this manuscript was used in the bottom panel. The linear fit is an
orthogonal distance regression with an intercept of 0. The slope from the fit for the data using the
CE algorithm is closer to one than the slope from the fit for the data using the default CE. The
decrease in χ2 indicates that the data obtained using the CE algorithm is better represented by a
linear relationship to Mfine than the data obtained using the default CE.

9
IGOR Procedure File (ipf) for determining the composition- (phase-) dependent CE using
Equations 3-7.
Function CalcCE_fPhase(NH4_DL,CE_lowNH4)
Variable NH4_DL,CE_lowNH4
// NH4_DL = ammonium detection limit
// CE_lowNH4 = CE for points where ammonium is below its detection limit
// Prior to running this procedure, all species must be calculated using CE=1.
// The sampling line relative humidity (if measured) should be named "RH_SL"
wave SO4, NH4, NO3, Chl, org, RH_SL
// Create waves of each species to smooth for the calculations.
duplicate/o SO4 SO4_CE1
duplicate/o NH4 NH4_CE1
duplicate/o NO3 NO3_CE1
duplicate/o Chl Chl_CE1
duplicate/o org org_CE1
Smooth 1, SO4_CE1,NH4_CE1,NO3_CE1,Chl_CE1, org_CE1
Variable i
Duplicate/o SO4 PredNH4_CE1, NH4_MeasToPredict, ANMF
Duplicate/o SO4 CE_dry,CE_fPhase
CE_dry=nan
CE_fPhase=nan
// Equation 3
PredNH4_CE1=18*(SO4_CE1/96*2+NO3_CE1/62+Chl_CE1/35.45)
NH4_MeasToPredict=NH4_CE1/PredNH4_CE1
// Equation 5
ANMF=(80/62)*NO3_CE1/(NO3_CE1+SO4_CE1+NH4_CE1+Org_CE1+Chl_CE1)
// Calculate the dry collection efficiency, CE_dry
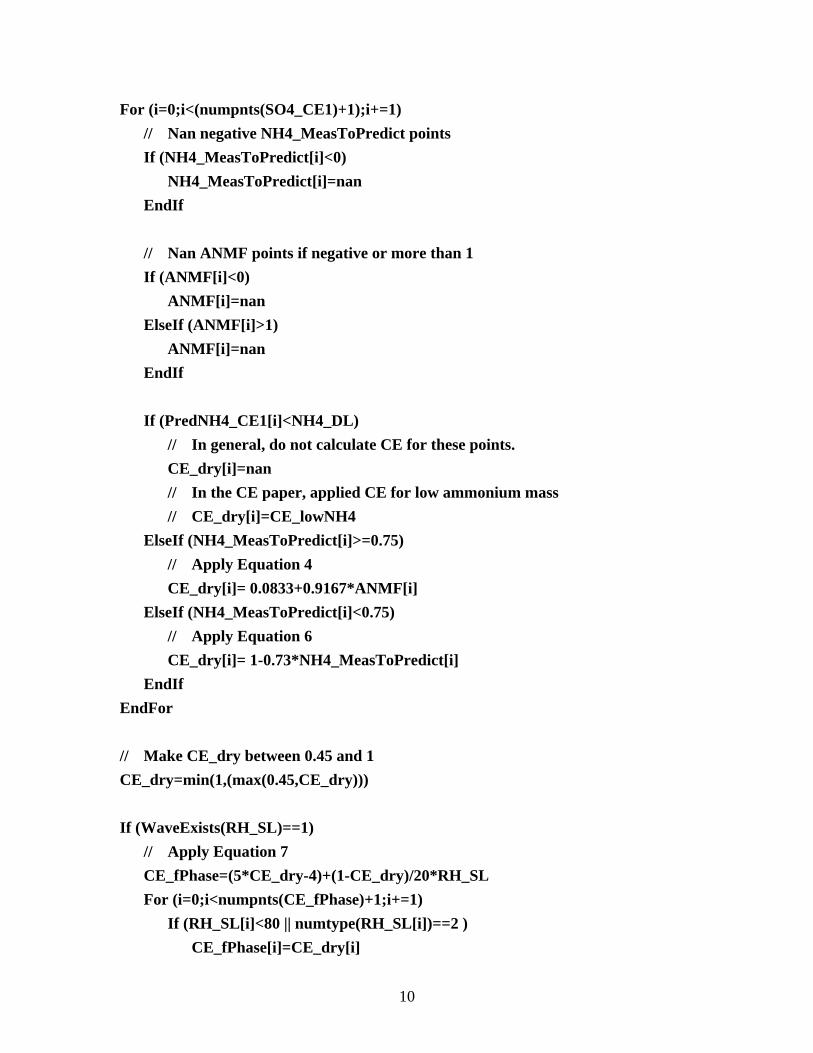
10
For (i=0;i<(numpnts(SO4_CE1)+1);i+=1)
// Nan negative NH4_MeasToPredict points
If (NH4_MeasToPredict[i]<0)
NH4_MeasToPredict[i]=nan
EndIf
// Nan ANMF points if negative or more than 1
If (ANMF[i]<0)
ANMF[i]=nan
ElseIf (ANMF[i]>1)
ANMF[i]=nan
EndIf
If (PredNH4_CE1[i]<NH4_DL)
// In general, do not calculate CE for these points.
CE_dry[i]=nan
// In the CE paper, applied CE for low ammonium mass
// CE_dry[i]=CE_lowNH4
ElseIf (NH4_MeasToPredict[i]>=0.75)
// Apply Equation 4
CE_dry[i]= 0.0833+0.9167*ANMF[i]
ElseIf (NH4_MeasToPredict[i]<0.75)
// Apply Equation 6
CE_dry[i]= 1-0.73*NH4_MeasToPredict[i]
EndIf
EndFor
// Make CE_dry between 0.45 and 1
CE_dry=min(1,(max(0.45,CE_dry)))
If (WaveExists(RH_SL)==1)
// Apply Equation 7
CE_fPhase=(5*CE_dry-4)+(1-CE_dry)/20*RH_SL
For (i=0;i<numpnts(CE_fPhase)+1;i+=1)
If (RH_SL[i]<80 || numtype(RH_SL[i])==2 )
CE_fPhase[i]=CE_dry[i]

11
EndIf
EndFor
Else
CE_fPhase=CE_dry
EndIf
KillWaves SO4_CE1,NH4_CE1,NO3_CE1,Chl_CE1, org_CE1, PredNH4_CE1
End Function