Evaluation of CAP measures applied to the dairy sector applied to the dairy ... the dairy sector as...
336
WAGENINGEN UR ( UNIVERSITY & RESEARCH CENTRE) Evaluation of CAP measures applied to the dairy sector Final deliverable Contract No. 30-CE-0382055/00-63 November 2011 Directorate-General for Agriculture and Rural Development
-
Upload
truongcong -
Category
Documents
-
view
219 -
download
0
Transcript of Evaluation of CAP measures applied to the dairy sector applied to the dairy ... the dairy sector as...

WAGENINGEN UR ( UNIVERSITY & RESEARCH CENTRE)
Evaluation of CAP
measures applied to the
dairy sector Final deliverable
Contract No. 30-CE-0382055/00-63
November 2011
Directorate-General for Agriculture and Rural Development

2
Authors of this report and contact details
Name: Partner acronym
Roel Jongeneel LEI (coordinator)
Alison Burrell expert
Aikaterini Kavallari LEI
With input from:
Martin Banse vTI
Vincent Chatellier expert
Jeremy Franks UNoT
Agnese Krievina LSIAE
Alberto Menghi CRPA
Edward Majewski UoW
Michal Keane UoC
Leopold Kirner AWI
Werner Kleinhanss vTI
Peter Nowicki LEI
Declan O’Connor IoT
Kees de Roest CRPA
Andrea Rothe vTI
Vincent Réquillart expert
Paolo Sckokai UNICATT
Charles Scott UNoT
Francesco Seneiro IDEGA-USC
Claudio Soregaroli UCSC
David Verhoog LEI
Rinus Wientjens LEI
Sascha Weber vTI
LEI, part of Wageningen-UR
PO Box 29703
2502 LS The Hague
The Netherlands
3
Executive summary
Introduction
The dairy sector makes a substantial contribution to the revenue earned by agriculture in the EU as a
whole. More than one million dairy producers supply close to 150 million tonnes of milk annually. At the
same time, the size and importance of the dairy sector varies considerably between MS and across
regions due to agronomic, economic, historic and other factors. In addition, the milk processing industry
employs a further 400 000 people. The total EU budget expenditure for the milk sector for 2008-2011
was on average €3,500 million.
The EU dairy market is regulated by the Common Market Organisation (CMO) for milk and milk products,
consisting of the traditional instruments of the Common Agricultural Policy (CAP) (import duties, export
refunds, and intervention stockholding for butter and skimmed milk powder). These measures are aimed
at directly supporting dairy product prices, and hence indirectly the raw milk price and the incomes of
dairy farmers. Alongside public intervention, the private sector’s stockholding role has also been
stimulated by measures including mandatory private storage aid for butter, and optional private storage
aid for skimmed milk powder and cheese. Moreover, in order to stimulate final demand for dairy
products, internal disposal aids for butter, cream and skim milk powder have been used.
In 2003, new and revised CAP measures for the dairy sector were adopted. The most radical component
was the switch of some income support out of market prices into a direct payment for milk producers,
known as the dairy premium. The aim of this reform was to bring dairy policy into line with measures
already adopted in other sectors to replace price support with direct income payments, with the aim of
promoting a more market-oriented and competitive agriculture. The reform of the measures for dairy
was part of a larger, more comprehensive set of policy changes introducing a Single Payment Scheme
(SPS) of decoupled income support, which combined several pre-existing direct payments into a single
farm payment (SFP). The dairy premium was scheduled to be incorporated into the SFP between 2005
and 2007. The decoupled SFP is intended to maintain income support levels whilst allowing farmers more
freedom to respond to market demand.
The new Member States had the option of applying a simplified decoupled support scheme, the Single
Area Payment Scheme. They also had the possibility to grant additional support during the phasing-in
period for the direct payments and subject to the approval by the Commission in the form of
complementary national direct payments (CNDP).
Objective and scope
The objective of this retrospective evaluation is to analyse the economic and structural aspects of the EU
dairy sector, and to assess the impacts of the CAP measures applied to this sector since the 2003 CAP
reform. Therefore, the first policy changes to be evaluated are those enshrined in decisions legislated in
2003, or decided earlier, but not implemented until after 2003. The evaluation period begins on 1 July
2004, when the first cuts to intervention prices were implemented and the phasing-in of the dairy
premium began. However, in order to capture the impacts of implementing the 2003 CAP reform, data
from the pre-2004 period are used to establish a reference point or period. Most of the indicators on
which the evaluation is based are reported up to 2009 or 2010, depending on data availability. Those
based on farm accounting data from the EU-FADN data base extend up to 2007.
The report falls into two main parts. The first part, consisting of an extensive background chapter and
eight chapters evaluating specific and concrete impacts of the policies is intended to establish a factual
basis on which to base the evaluation of the effectiveness, efficiency and relevance of policy measures in
relation to their objectives. The report is also required to identify possible unintended side-effects of the
measures and their deadweight. The coherence of the new measures for dairy with the overall concept
and principles of the 2003 CAP reform, and with rural development measures and state aids, is also
assessed.
The geographical scope of the study covers the 27 Member States of the present European Union (EU-
27). However, it must be borne in mind that ten of these Member State did not formally come under EU
dairy policy until their accession in May 2004, and two of them (Bulgaria and Rumania) adopted the CAP
4
only with their accession in 2007. Moreover, after joining the EU, the agricultural sectors of these 12
Member States were subject to various additional or differentiated transition measures as agreed in their
accession terms. Furthermore, for some of the indicators, comparable data for the pre-2004 period are
not available for these new Member States. Therefore, for some policy impact indicators, more weight is
attached to evidence provided by the Member States of the EU in its 2003 borders (i.e. EU-15).
Approach and methodology
An important characteristic of the EU’s dairy policy is its complexity and the inter-related nature of links
between instruments, results and impacts. Policy measures often act on more than one objective and
have intermediate impacts that contribute to more than one global objective. In addition, the policies
under evaluation were introduced sequentially during the evaluation period, as successive legislation
extended or reinforced measures already taken or at least already announced, in previous legislation.
This makes the evaluation task more difficult than if it had to evaluate the impact of one single reform or
legislative act, or a set of measures introduced at the same point in time. Apart from this, some impacts
are themselves spread over time, not just because of the finite reaction time of the producers to the
policy changes, but also because policy changes were themselves phased in over time, or implemented
in different years by Member States.
The study follows a standard evaluation methodology, encompassing four phases:
• Structuring: detailed planning of the study, identification of sources, theoretical analysis of the
policy measures applicable to dairy and their impact on production, demand, markets, and trade;
development of questionnaires for producers and processors, empirical analysis of the sector;
identification of judgement criteria and indicators to answer the evaluation questions; define and
create the evaluation tools for answering the evaluation questions. This phase is based on an
elaboration of the intervention logic.
• Observing: data collection by means of exploiting existing data sets and primary data gathering;
carry out case studies, interviews and surveys. This phase comprises two main components: (a) an
extensive descriptive chapter, based on official data sources, presents data on the evolution of the
EU dairy sector and dairy markets in their international and policy contexts; (b) 11 case studies in
10 Member States, whose full results are not presented in this report, supplement the official
statistics used to answer the evaluation questions with additional data and insights.
• Analysing: based upon the data collected, the analysis is organised around the 11 evaluation
questions raised by the European Commission. The analysis is based on empirical indicators. These
indicators are defined with the intention of verifying the impacts of the policy changes under
evaluation, as predicted by the intervention logic. Indicators are calculated at EU level, at Member
State or regional level, or for the average (dairy) farm, according to the type of impact that is being
investigated and subject to data availability. A change in the level or trend of an indicator from
2004 onwards, compared with its level or trend in the preceding period, is prima facie evidence in
favour of a policy impact. In some cases, this interpretation is beyond question. In other cases,
because of the lack of a counterfactual that would enable a clearer attribution of changes to
particular policy changes, and especially because of the exogenous disruptions occurring in dairy
markets in the period 2007-2010, interpretation has to be more nuanced.
• Judging and recommending: evidence-based conclusions are drawn with respect to the performance
of policy measures, both as a package and individually. Judgements are qualitative, based on the
indicators and their interpretation. They are formally expressed as qualitative scores for each policy
measure in relation to its target. The scores represent the consensus of the evaluation team and
endorsed by other market experts. Recommendations are made based on lessons learned from the
evaluation, relating achieved results to stated policy objectives.
Qualitative and quantitative tools
An economic theory framework was developed for the dairy sector, which describes and explains the
basic mechanisms linking policy objectives, policy measures and their impacts. This framework depicts
the dairy sector as a supply chain beginning with the primary production of raw milk by dairy farmers,
followed by the processing of the raw milk into various dairy products by the processing sector, then
domestic retailers and trading (export and import) companies, and lastly final consumers. The interfaces
between the different stages of the supply chain consist of national and international markets.
5
Based on this theoretical framework and the intervention logic (see below), indicators intended to
capture the specific impact of the measures to be evaluated were defined, taking into account the
causality structures derived from the theoretical framework. These indicators were quantified using
empirical data from the evaluation period and compared with their quantified benchmark values. A
number of specific analytical tools were used to construct some of these indicators. More specifically:
• a market balance tool, which is used to identify imbalances (of protein and fat milk components,
and of raw milk) taking into account the specific characteristics of raw milk and dairy products (fat,
protein and other milk components),
• a measure of price support, which relies on the calculation of EU and world market equivalent raw
milk prices, taking into account the linkage between raw milk and milk product prices (accounting
for processing margin and quality differences),
• various price volatility indicators (e.g. price-bands, the coefficient of variation and the annualised
standard deviation in order to assess volatility of milk and milk product prices,
• long-term trends in various dimensions of farm structure,
• a model based on the FADN data, which identifies revenue, cost, margin and income indicators
related to dairy activities, the impacts of the policy on dairy farm income, in order to assess the
income evolution in dairy relative to other sectors.
In addition, primary data tools were developed to recover information from producers, milk processors
and policy makers and experts. More specifically:
• a producer questionnaire was drawn up containing questions related to each relevant evaluation
question (e.g. milk price, payment system, quota, farm income, farm structure, the decision to
continue or exit milk production, role of the direct payments and state aid).
• a milk processor survey was designed with questions related to those evaluations questions with
links to the processing sector (e.g. response to changes in measures for public and private
storage, export licenses, domestic aid programs, changes in structure and policy impacts on firm
marketing strategy).
• an open question survey of policy makers was used to obtain information on policy implementation
and state aid.
• open interviews with experts (e.g. market analysts, stakeholder organisations, farm extension
providers) were used to obtain missing information, discuss trends and observations and improve
background insights, as well as to cross-validate findings obtained from other sources.
Intervention Logic
As a preliminary step to interpreting the empirical evaluation questions and defining the indicators for
addressing them, an intervention logic was developed which links measures and their impacts to the
specified objectives, and aims to identify the expected effects of changes in policy measures. Establishing
the intervention logic is a challenging task in the context of dairy policy, with its on-going policy agenda,
steady stream of legislation and interlinked policy changes. For the measures agreed in the 2003 reform
package, we consider that (although some were not implemented for 2 or 3 years) enough time has
elapsed to allow a full ex post evaluation of the intermediate impacts (i.e. short- to medium-term
impacts) based on empirical indicators. The global impacts are assessed in terms of the trends set in
motion by these changes and whether they are likely to continue in the desired direction towards
fulfilling the global objectives in the coming period. For later policy changes (in particular those of the
2008 Health Check package), it is too soon to attempt the same kind of evidence-based analysis even of
the intermediate impacts.
The relevant legislation specifies the following policy objectives as the main guiding principles of the
reforms to be evaluated:
• Improving market performance (market balance and market stability)
• Maintaining producer incomes
• Enhancing the competitiveness and market orientation of the sector
• Improving structures and facilitating structural change
• Policy simplification

6
• Promoting environmental standards and product quality
The intervention logic relates the policy measures to the specified objectives, and helps to identify the
expected effects of changes in policy measures. The following new measures or changes in existing
measures are covered:
• Milk quota system
• Quota management
• Direct payments to producers (dairy premium, additional payment for milk)
• Special payments by Member States (CNDP in New Member States)
• Decoupling of direct payments that were previously coupled to production
• Price targeting
• Public intervention measures for butter and skimmed milk powder
• Private storage aids for butter and cheese
• Consumption aids in the milk and milk products sector
• Butter, concentrated butter and cream disposal scheme
• Trade policy (export refunds, import duties, licence system, and tariff rate quotas)
• Article 69 of Reg. (EC) No. 1782/2003
• Cross compliance
The school milk programme is not included among the measures under evaluation, as a separate
evaluation study for this measure is foreseen.
Information sources and their use
In order to build up the factual basis for the evaluation, the report relies on various sources of
information:
• Statistical and accounting data: DG AGRI, DG BUDGET, Eurostat, Farm Accountancy Data Network
(EU-FADN), the OECD PSE database, UN COMTRADE, the TARIC database, national/regional
statistics, data collected from national and international institutes (Productschap Zuivel; IDF);
• Case studies conducted in 11 Member States/13 regions (South-West region of Ireland, North-east
region of the Netherlands, Bavaria, Lower Saxony, West-France, Franche Comté, Upper Austria,
Lombardy, Emilia Romagna, Galicia, Latvia, Podlaski, and UK), including interviews with the main
stakeholders: national and Regional Authorities, professional organisations, farmers and processing
industries;
With respect to the analysis based on EU-FADN data, the following choices have been made:
• The period of analysis is 2000-2007 (the latest year for which data for all EU Member States were
available at the time when the work was done).
• The analysis focuses more particularly on specialist dairy farms (TF41, defined in the Commission’s
Farm Typology as farms earning at least two thirds of their standard gross margin from dairying).
Where necessary to get an adequate representation of the dairy farms, this sample is supplemented
by farms earning 50% or more of their standard gross margin from dairying.
• The cost and gross margin calculations are based on a cost allocation model, developed in the EU-
FADN unit of the European Commission, and slightly adapted by the Von Thünen Institute in
Braunschweig. Reallocation of costs to the dairy sector is based on different shares, i.e. share of
milk in total output or share of dairy livestock units within total livestock units. The model only uses
data from specialised dairy farms (TF 41), cattle dairying and rearing (TF 43), mixed livestock,
mainly dairying (TF 71), and field crops and grazing livestock combined (TF 81).
Other methodological issues
As regards the analysis of market balance the approach used involved:
• defining the concept of structural excess supply based on the theoretical framework;
7
• calculating the structural excess supply of all components (fat, protein, other solids);
• converting components into milk equivalents by using the total solid method as developed by the
IDF.
The analysis of the impact of policy measures applicable to the dairy sector for each evaluation question
required specifying a benchmark against which the impact could be assessed. In order to do this, the
following approach was followed:
• If an evaluation question focuses on a change or improvement (e.g. dairy farm incomes) the period
preceding the start of the evaluation period (2003, or the period 2001-2003) is chosen as a
benchmark.
• When in the pre-evaluation period variables already show a trend (e.g. structural change), a longer
period before the observation period is used as a benchmark, in order to allow identification of
changes in trends rather than levels of variables.
• In case of the price volatility analysis, price variability indicators for the period 2003-2010 are
compared to indicators for the 7 year period preceding the evaluation period.
• Where appropriate, the pre- and post-reform periods are broken down into sub-periods in order to
capture the timing of impacts.
• Because the period under review is a transition period (from price support to a coupled direct
payment, which is then decoupled), certain indicators (such as income support, or budget cost) are
calculated both with and without including decoupled payments.
• In order to separate out the impact of reform from other exogenous developments in the efficiency
analysis, a counterfactual is constructed that removes the impact of the demand surges for
commodities on the world market, which played a dominant role during the period 2007-2009 and
tended to overshadow the effects of EU policies on internal markets.
Limitations of the analysis
Some of the limitations of the analysis that should be taken into account when interpreting the results
are:
� The period 2007-2009 was characterised by severe disruption of internal EU markets, which
originated in world commodity markets. The sharp spike in dairy prices dominates price movements,
and overshadows any price impacts that may have been triggered by EU dairy policy changes.
‘Noise’ caused by exogenous factors that cannot be removed from the observations made in real
time can cause the analysis to be inconclusive. Another example encountered in this report concerns
the ten New Member States that entered the EU in 2004. The evolution of their dairy sectors was
strongly marked by their adjustment to the CAP and more generally their acceptance of the Single
Market. It is often impossible to separate out the impacts of specific dairy policy changes from the
more powerful trends set in motion by these accession processes.
� These extreme cases illustrate a general problem encountered when conducting an indicator-based
assessment, as in this evaluation. Without being able to compare actual outcomes with a true
counterfactual scenario, in which all factors except the policy change to be assessed are reproduced
but with the policy remaining unchanged, one must be cautious when interpreting changes in an
indicator as an impact of the policy change, or as caused solely by the policy change.
� In some cases, it has been impossible to reach conclusions encompassing all Member States
because of missing data in some statistical collections, or for some variables or time periods. For
example, this holds for Bulgaria and Romania, which entered the EU in 2009, and to a much lesser
extent also for the Member States that entered the EU in 2004.
� Problems of data availability were also encountered in specific areas addressed by the analysis. With
respect to state aid it has been very difficult to obtain information, whether from the Commission or
from organisations in Member States. Because of this lack, the completeness of the analysis done
on this item cannot be guaranteed. Other areas where data were difficult or impossible to obtain
data involve particular products (adequate market data on cream and drinking milk) and public
administration costs (obtained from only two Member States, and calculated according to different
methodologies, which renders them non-comparable).
8
� The surveys are performed with relatively small and non-representative samples. Care should be
used when drawing conclusions about the population of EU milk producers from the survey results,
in particular when answers to a certain question strongly diverge over respondents. However, the
information obtained from this source sheds light on a number of issues not covered in the official
statistical collections, and can supplement the latter as an information source.
� The response rate to the processor survey was particularly low, in spite of repeated efforts to
increase participation. Moreover, processors may have behaved strategically in answering a number
of questions, perhaps because they found certain information too sensitive to share with outsiders.
The Evaluation Questions
The analysis is structured according to the eleven evaluation questions set out below. The approach
chosen is to show to what extent dairy policies (as a package) have affected each particular outcome, as
well as to indicate what role has been played particularly by specific instruments. The first eight
questions seek to establish a clear picture of how the policy-relevant aspects of the sector have evolved
since 2003, and to verify the link between the trends identified and policy measures. The last three
questions focus on the implications for these findings according to more abstract criteria that permit an
overall multidimensional judgement to be formed.
The main findings are very briefly indicated and further explained in the text below.
Overview of Evaluation Questions (EQs) and main findings
EQ Short description of key
question Main findings with keywords
1 Production
and supply to
/ demand by
dairies
To what extent have the CAP
measures applicable to the dairy
sector contributed to balancing
supply and demand of milk and
led to production restructuring?
• Domestic supply became less determined by
quota ceilings and more responsive to milk
prices, with quota no longer being always filled
for most Member States
• The shift of income support from market price
to direct payments, reduced intervention for
butter and SMP, and the abolition of the target
price for milk led to a falling structural excess
supply (from 2004 onwards) and contributed
positively to balancing demand and supply
• Structural changes affecting the number of
dairy cows and herds, the herd-size
distribution and extent of specialisation of
farms in milk production have continued, but
they cannot be linked to specific CAP
measures studied here
• Higher national quota ceilings led to greater
geographic mobility of productive capacity in
some Member States
Table continues on the next page

9
EQ Short description of key
question Main findings with keywords
2 Producer
prices
To what extent have the CAP
measures applicable to the dairy
sector affected prices paid to
producers, the payment system
and price stability?
• The abolition of the target price for milk,
reduction in intervention prices for butter and
skim milk powder, the scaling down of
consumption aids and relaxation of quota
ceilings led to a reduction in commodity (and
hence milk) prices and gradual convergence of
the EU towards world market prices during
2004-2006
• The case study surveys suggest that the
changes in CAP measures did not affect the
milk payment system
• In 2007-2009, the effects of the CAP
measures on internal prices were masked by
the price turbulence originating in the world
market commodity boom
• During 2007-8, which was a period of
abnormally high world market prices, export
refunds and intervention buying were no
longer operational during the months when
the world prices exceeded the intervention
price levels
• In 2009, on the downside of the price spike,
although intervention buying-in was activated,
the (average) EU-27 raw milk price fell to
below €25/100 kg in June and July
3 Producer’s
income
To what extent have the CAP
measures applicable to the dairy
sector contributed to maintaining
/ increasing the farmers’ income?
� Trends in dairy farm income, measured by
FNVA/AWU, was maintained
� The profitability of dairying relative to other
commodity sectors was maintained
� Maintenance of dairy incomes despite lower
institutional prices is largely due to the role of
direct payments
� Structural change (farm size expansion) was
also a positive factor contributing to dairy
farmers’ income
4 Producer’s
competitivene
ss and market
orientation
To what extent have the CAP
measures applicable to the dairy
sector contributed to increasing
farmers’ market orientation and
competitiveness?
� Market orientation improved due a reduction
in the price gap between the EU and world
markets, weaker quota constraints and hence
stronger supply response to price signals
� Cost-competitiveness did not improve, and the
share of milk from ‘profitable’ milk enterprises
declined after 2003 until the sharp price
increase in 2007
5 Prices of
milk products
To what extent have the CAP
measures applicable to the dairy
sector contributed to stabilising
the market prices for milk
products?
� EU dairy product prices remained stable until
2006 due to export refunds and public
intervention
� Volatility increased after 2007 due to a
commodity boom on world markets
Table continues on the next page

10
EQ Short description of key
question Main findings with keywords
6 Market
balance
To what extent have the CAP
measures applicable to the dairy
sector contributed to balancing
supply and demand for milk
products?
� Structural excess supply declined for the main
dairy products after 2003
� The main factor driving these falls was an
increase in unsubsidised demand
� Because of the absence of lower product
prices (apart from weak evidence regarding
butter), only a limited impact of policy
changes could be identified
7 Structure of
processing
industry
To what extent have the CAP
measures applicable to the dairy
sector influenced structural
changes in the processing sector?
� No strong conclusions could be drawn with
respect to policy impacts
� Concentration and consolidation of firms
increased in some Member States
8
Competitive-
ness on
international
markets
To what extent have the CAP
measures applicable to the dairy
sector contributed to improved
competitiveness of milk products
on international markets?
� Price gap relative to the world market declined
due to lower intervention prices for butter and
SMP, and increasing world market prices
� The volume of unsubsidised exports of cheese
increased (this holds in particular for quality
and PDO/PDI cheeses)
� During the evaluation period, the EU was not
competitive at world market prices for all
products, but for some products its
competitiveness has improved
9 Efficiency To what extent have the CAP
measures applied to the dairy
sector been efficient with respect
to their objectives?
� Efficiency has generally increased
� The total cost of dairy support policy declined
whilst market balance improved and producer
income levels were maintained
� Market orientation and sector structure
improved without any related increase in
policy costs
� There was no marked change in the
competitiveness of milk or dairy products
� Dairy production became more sustainable but
at an additional cost
� Price stability deteriorated, largely due to
external factors, whereas costs of intervention
and export refunds declined
10.1
Coherence -
Rural
Development
Programmes
To what extent have the CAP
measures applicable to the dairy
sector been coherent with the
rural development measures and
the national aid granted in
accordance with relevant EU rules
stated?
� Good degree of coherence between the CAP
dairy measures, and rural development
measures and state aids
� Pillar 1, RDP and national aid measures
operate at different levels and scales, giving
them a complementary character
� Several synergies and one source of potential
conflict between CAP dairy measures and RDP
objectives were identified
Table continues on next page

11
EQ Short description of key
question Main findings with keywords
10.2
Coherence –
Overall CAP
objectives
To what extent have the CAP
measures applicable to the dairy
sector been coherent with the
overall concepts and principles of
the 2003 reform of the CAP?
� A high degree of coherence was found ex post
� Market orientation and competitiveness
improved to an extent
� Income support was maintained at pre-2003
levels and income trends continued unchanged
post-2003
� Environmental sustainability increased
� Socio-economic sustainability in question due
to a fall in the rate of entry of young dairy
farmers
11 Relevance To what extent have the CAP
measures applicable to the dairy
sector been relevant with respect
to the needs and problems of
farmers, processors and
consumers?
� Milk producers’ concerns over income,
production flexibility and expansion are met,
but at the cost of a heavier administrative
burden and more exposure to price risk
� Processors also face more price and market
risk
� Society benefits from increased efficiency, and
more focus on environmental sustainability
� Consumers face potentially lower product
prices, but this benefit is conditional on the
transmission lower milk prices along the
supply chain
The effectiveness of individual instruments
The main findings with respect to the evaluation questions assume that the potential link between
individual policy instruments and targeted outcomes has been activated. These findings can be
structured explicitly in terms of the effectiveness of each instrument, taking account of the fact that
many of the measures influence – directly or indirectly – more than one of the policy objectives.
The following table provides an overview of the effectiveness with which particular instruments were
deployed over the period 2004-2010.
12
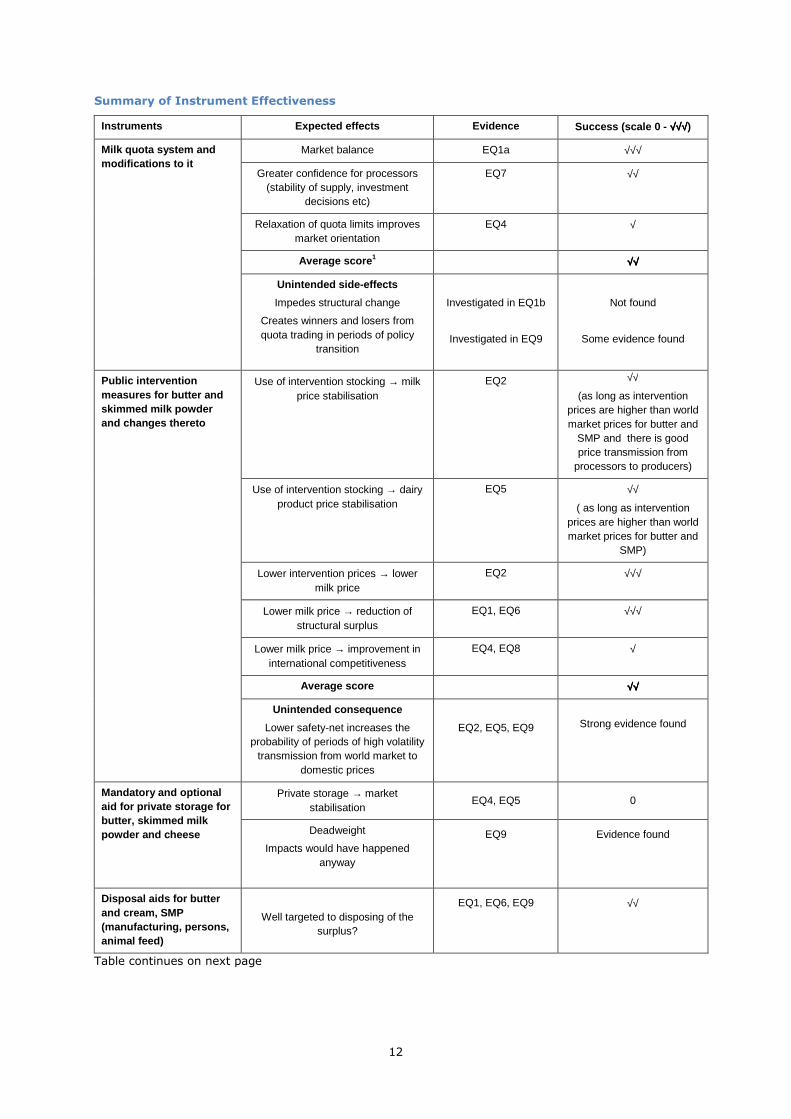
Summary of Instrument Effectiveness
Instruments Expected effects Evidence Success (scale 0 - √√√√√√√√√√√√)
Milk quota system and modifications to it
Market balance EQ1a √√√
Greater confidence for processors (stability of supply, investment
decisions etc)
EQ7 √√
Relaxation of quota limits improves market orientation
EQ4 √
Average score 1 √√√√√√√√
Unintended side-effects
Impedes structural change
Creates winners and losers from quota trading in periods of policy
transition
Investigated in EQ1b
Investigated in EQ9
Not found
Some evidence found
Public intervention measures for butter and skimmed milk powder and changes thereto
Use of intervention stocking → milk price stabilisation
EQ2 √√
(as long as intervention prices are higher than world market prices for butter and
SMP and there is good price transmission from
processors to producers)
Use of intervention stocking → dairy product price stabilisation
EQ5 √√
( as long as intervention prices are higher than world market prices for butter and
SMP)
Lower intervention prices → lower milk price
EQ2 √√√
Lower milk price → reduction of structural surplus
EQ1, EQ6 √√√
Lower milk price → improvement in international competitiveness
EQ4, EQ8 √
Average score √√√√√√√√
Unintended consequence
Lower safety-net increases the probability of periods of high volatility
transmission from world market to domestic prices
EQ2, EQ5, EQ9
Strong evidence found
Mandatory and optional aid for private storage for butter, skimmed milk powder and cheese
Private storage → market stabilisation
EQ4, EQ5 0
Deadweight
Impacts would have happened anyway
EQ9 Evidence found
Disposal aids for butter and cream, SMP (manufacturing, persons, animal feed)
Well targeted to disposing of the surplus?
EQ1, EQ6, EQ9 √√
Table continues on next page

13
Instruments Expected effects Evidence Success (scale 0 - √√√√√√√√√√√√)
Licence system, tariff rate quotas, import duties and export refunds
Export refunds as disposal mechanism for surpluses
EQ1a, EQ6 √√√
Export refunds as an instrument for price stabilisation of
Dairy products
Raw milk
EQ2, EQ5 √√√
(as long as intervention prices are higher than world market prices for butter and SMP and (for raw milk) there
is good price transmission from processors to
producers)
Tariffs and tariff rate quotas as a precondition for maintaining higher
domestic price
EQ2
√√√
Export refunds as means of improving international
competitiveness
EQ4 √√
Export refunds as a price stabilising mechanism EQ2, EQ5
√√√
(providing domestic prices are above world market
prices)
Average score √√√√√√√√
Single Payment Scheme (SPS) and Single Area Payment Scheme (SAPS) (with respect to beneficiaries in the dairy sector)
Effectiveness in maintaining producers incomes despite the
lowering of the milk price
EQ3, EQ9
√√√
Dairy premium and additional payment
Effectiveness in compensating producers for the milk price reduction
EQ9 √√√
Effect on structural change and the exit rate
EQ1b √
(not included in the average score)
Improved market orientation EQ4 √
Average score √√√√√√√√
Additional payments granted in the framework of Art. 69 of Council Regulation 1782/2003 and Art. 68 of Council Regulation 73/2009
Allocation by MS to the dairy sector EQ10 Art 69 (only one MS), Art 68 (two MS)
Uptake by producers EQ10 Partial evidence of strong uptake
Effectiveness in attaining specific objectives at MS level
Not assessed
1. The ‘average score’ is a subjective assessment based on the distribution of the scores reported for each objective of the corresponding instrument.

14
Relevance of the policies
The underlying aim of economic policy intervention is to modify the functioning of the economy or a
sector of the economy so as to induce outcomes that are more beneficial or desirable to the main
stakeholder groups. The relevance of a policy depends on the extent to which it meets the needs and
concerns of the main stakeholder groups, and this aspect of CAP dairy policy has also been assessed.
It is of interest to summarise the relevance of certain blocks or clusters of instruments that have an
impact on particular stakeholder concerns (even if they impact on more than one concern and/or more
than one stakeholder group). The summary based on this approach is reproduced in the following table.
Summary of the relevance of policy changes
Stakeholder Group
Policy change Milk producers Processors Consumers S ociety
Package of changes involved in switching from market price support to a decoupled payment (including lower prices and more visible support through budget payments)
+++ (income levels
maintained)
++ (more flexible
production choices without losing
support entitlement)
+ (lower prices for raw milk, but also potentially lower
prices for processed products)
+ (potentially lower
prices, BUT receiving them
depends on price transmission along
the chain)
+++ (the package is more efficient)
- (cost becomes
more visible as a budget item and
hence needs to be properly explained)
Introduction of cross compliance requirements for milk producers
- - (investment costs,
greater administrative
burden)
0
0
++ (makes dairying
more environment-ally friendly, helps to gain support for
the CAP among the wider public)
Gradual increase and then abolition of quotas
++ (more scope for expansion, scale
economies)
+
(more abundant milk supplies)
0
+/- (fear of negative
environmental consequences,
disappearance of dairy farming in mountain areas/
family farms)
Reduction of intervention to a safety net
- - (greater risk of price instability)
- (greater risk of price instability)
0
+ (large intervention stocks often seen
negatively by society)
Simplification of policies
- Milk producers
perceive greater complexity rather than simplification
+ (depends on the
type of activities of the company)
0
+/-
Difficult to obtain a balanced picture,
more transparency needed

15
Recommendations
It is assumed the EU will continue to pursue the same policy objectives as those that motivated the
policy changes reviewed, and to maintain those measures that were found to have had some success in
promoting these objectives. The recommendations made below are based on conclusions drawn from this
evaluation regarding gaps or inadequacies in the current set of policy measures.
1. In a rapidly changing global market context with shocks potentially occurring in any period of the
year, intervention price levels, buying-in periods and ceilings set some years previously in a
multi-annual framework and on the assumption of internally generated (seasonal) price
movements are not necessarily able to provide an effective year-round safety net. In order to
operate a safety net that is relevant for a more market-oriented sector facing greater
exogenously produced price volatility, a more flexible safety net is required. To this end, we
recommend the adoption of more flexible intervention mechanisms so that they can
respond more quickly at any time of the year to sharp falls in market price reaching
abnormally low levels.
2. Under the reformed CAP, the probability of fluctuating prices has significantly increased. Price
volatility above a certain level creates uncertainty in the market, which inhibits investment, and
hampers market orientation, as farmers can no longer appropriately distinguish ‘noise’ from
changes in underlying market fundamentals. Therefore, it is recommended that private or
public risk management tools for farmers (individually or collectively) are facilitated
and/or developed that aim to enable farmers to cope with higher levels of market
price volatility, so as to counteract its negative effects on sector performance.
3. The effective operation of the EU’s dairy policy with respect to its objectives relies heavily on
backward price transmission in the dairy supply chain. A better balance of market power
between the various actors along the supply chain, particularly between milk producers and
processors, is likely to become more important with the abolition of the quota scheme.
Therefore, it is recommended that the available options for redressing power
imbalances in bargaining power be actively studied. To counteract market power
imbalances, several options can be envisaged. They include creating countervailing power
(within the limits allowed by competition policy), legislating for more competitive behaviour in
the price formation process within the chain, or restricting the build-up of market power
concentration at local and national level downstream in the supply chain using new legislation to
safeguard competition in the vertical dimension.

16
Table of Contents
Executive summary .................................................................................................................... 3
Table of Contents ..................................................................................................................... 16
List of Figures .......................................................................................................................... 20
List of Tables ........................................................................................................................... 22
List of Abbreviations ................................................................................................................. 26
1 Introduction ....................................................................................................................... 28
2 EU dairy sector ................................................................................................................... 30
2.1 Dairy production in the world perspective ......................................................................... 30 2.1.1 World market prices .......................................................................................... 30 2.1.2 World production ............................................................................................... 31 2.1.3 World trade developments .................................................................................. 37
2.2 EU dairy production and prices ....................................................................................... 43 2.2.1 Raw cow’s milk supply in the EU .......................................................................... 43 2.2.2 Supply of dairy products in the EU ....................................................................... 52 2.2.3 Consumption and self sufficiency of dairy products in the EU ................................... 60 2.2.4 Structure of the processing industry ..................................................................... 61
2.3 Evolution of EU dairy farming ......................................................................................... 63 2.3.1 Livestock farming and specialist dairy production in Member States .......................... 63 2.3.2 Dairy herds in Less-Favoured Areas ..................................................................... 70
2.4 Policy related data for the dairy sector ............................................................................. 72 2.4.1 Milk quota system ............................................................................................. 72 2.4.2 Market support: ‘safety net’ intervention .............................................................. 76 2.4.3 Direct aid ......................................................................................................... 77 2.4.4 Private intervention storage ................................................................................ 81 2.4.5 Export refunds .................................................................................................. 82 2.4.6 Aid for marketing dairy products.......................................................................... 84 2.4.7 Article 68 (69) .................................................................................................. 84 2.4.8 Rural development ............................................................................................ 85 2.4.9 Other drivers influencing the impact of EU policies on the dairy sector ....................... 87
3 Intervention Logic of the CAP measures applicable to dairy ........................................................ 89
3.1 Introduction: Overview of EU dairy policy prior to the evaluation period ................................ 89 3.2 Methodological considerations ........................................................................................ 90 3.3 Objectives and policy measures ...................................................................................... 93 3.4 The intervention logic .................................................................................................. 101
4 Theoretical analysis ........................................................................................................... 103
4.1 The market for raw milk .............................................................................................. 103 4.2 The dairy supply chain ................................................................................................. 109 4.3 Trade measures for dairy products ................................................................................ 114 4.4 Dairy income and the decision to quit ............................................................................ 117
5 EQ1: Production and supply to / demand from dairies ............................................................. 122
A. EQ1a: Production and supply to / demand from dairies (market balance) ............................ 122 5.1 Interpretation and comprehension of the key terms of the EQ1a ........................................ 122 5.2 Methodology used for answering EQ1a: market balance ................................................... 123 5.3 Judgement criteria, indicators and information sources used for each indicator .................... 125 5.4 Milk supply ................................................................................................................ 126 5.5 Structural excess supply and market surplus for fat, protein and other non-fat solids ............ 128 5.6 Conclusions ............................................................................................................... 130 B. EQ1b: Production and supply to / demand by dairies (structural change) ............................ 132 5.7 Interpretation and comprehension of key terms of EQ1b .................................................. 132 5.8 Methodology used for answering the EQ1b: production restructuring .................................. 133 5.9 Judgement criteria, indicators and information sources used for each indicator .................... 134 5.10 Evolution of dairy cow numbers and dairy herds in the EU ................................................ 136 5.11 Herd size restructuring ................................................................................................ 139 5.12 Structure of specialisation ............................................................................................ 144 5.13 Geographical structure of production ............................................................................. 146 5.14 Conclusions ............................................................................................................... 148
17
6 EQ2: Producer prices ......................................................................................................... 151
6.1 Interpretation and comprehension of the key terms of the EQ2 ......................................... 151 6.2 Methodology used for answering the EQ2 ....................................................................... 151
6.2.1 Level of producer prices ................................................................................... 151 6.2.2 Payment system ............................................................................................. 153 6.2.3 Price volatility ................................................................................................. 153
6.3 Judgement criteria, indicators and information sources used for each indicator .................... 155 6.4 Impact of policy changes on milk price ........................................................................... 156
6.4.1 Price trends .................................................................................................... 156 6.4.2 Price support (P-SUP): Levels and trends ............................................................ 157
6.5 Information on the payment system .............................................................................. 160 6.6 Price volatility ............................................................................................................ 162
6.6.1 Statistical analysis ........................................................................................... 163 6.6.2 Coefficient of variation (CV) for producer milk prices ............................................ 164 6.6.3 Annualised Standard Deviation .......................................................................... 164
6.7 Conclusions ............................................................................................................... 167
7 EQ3: Producers’ income ..................................................................................................... 171
7.1 Interpretation and comprehension of the key terms of the EQ3 ......................................... 171 7.2 Methodology used for answering the EQ3 ....................................................................... 171 7.3 Judgement criteria, indicators and information sources used for each indicator .................... 174 7.4 Dairy farm income ...................................................................................................... 175
7.4.1 Farm net value added per annual work unit (FNVA/AWU) ...................................... 175 7.4.2 Family farm income per family work unit (FFI/FWU) ............................................. 177 7.4.3 Income evolution (nominal and real) .................................................................. 178 7.4.4 Dairy income relative to incomes of other agricultural sectors ................................ 180
7.5 Income from milk ....................................................................................................... 181 7.5.1 Milk margin .................................................................................................... 181 7.5.2 Farm development .......................................................................................... 183
7.6 Revenues and subsidies ............................................................................................... 185 7.6.1 Revenues from milk and milk price .................................................................... 185 7.6.2 Coupled direct payments and national aid ........................................................... 187 7.6.3 Decoupled direct payments ............................................................................... 189 7.6.4 Contribution of subsidies to income .................................................................... 191
7.7 Costs of milk production .............................................................................................. 192 7.7.1 Total costs ..................................................................................................... 192 7.7.2 Specific costs .................................................................................................. 193 7.7.3 Other costs .................................................................................................... 194
7.8 Conclusions ............................................................................................................... 195
8 EQ4: Producers’ competitiveness and market orientation ......................................................... 198
8.1 Interpretation and comprehension of the key terms of the EQ4 ......................................... 198 8.2 Methodology used for answering EQ4 ............................................................................ 200 8.3 Judgement criteria, indicators and information sources used for each indicator .................... 200 8.4 Evidence on market orientation .................................................................................... 202
8.4.1 Share of milk delivered to dairies ....................................................................... 202 8.4.2 Producers’ response to decoupling of the dairy premium ....................................... 203 8.4.3 Producers’ response to price falls ....................................................................... 204 8.4.4 Ability to respond to price increases ................................................................... 205 8.4.5 Exposure to world market prices ........................................................................ 205
8.5 Results on competitiveness .......................................................................................... 205 8.5.1 Cost of production ........................................................................................... 205 8.5.2 Gross margin and share of ‘profitable milk’ ......................................................... 206 8.5.3 Profitability of specialist dairy farms relative to other farm types ............................ 207 8.5.4 Relative cost of milk production of the EU with respect to key competitors ............... 209
8.6 Conclusions ............................................................................................................... 210
9 EQ5: Price stabilisation ....................................................................................................... 213
9.1 Interpretation and comprehension of the key terms of the EQ5 ......................................... 213 9.2 Methodology used for answering EQ5 ............................................................................ 214 9.3 Judgement criteria, indicators and information sources used for each indicator .................... 215 9.4 Results and analysis .................................................................................................... 216
9.4.1 Butter ............................................................................................................ 216 9.4.2 SMP .............................................................................................................. 218 9.4.3 WMP ............................................................................................................. 220 9.4.4 Cheese .......................................................................................................... 222

18
9.4.5 Drinking milk and cream .................................................................................. 224 9.5 Conclusions ............................................................................................................... 224
10 EQ6: Market balance .......................................................................................................... 227
10.1 Interpretation and comprehension of the key terms of the EQ6 ......................................... 227 10.2 Methodology used for answering EQ6 ............................................................................ 227 10.3 Judgement criteria, indicators and information sources used for each indicator .................... 228 10.4 Results and analysis .................................................................................................... 229
10.4.1 Butter ............................................................................................................ 229 10.4.2 SMP .............................................................................................................. 229 10.4.3 WMP ............................................................................................................. 230 10.4.4 Cheese .......................................................................................................... 230 10.4.5 Drinking milk .................................................................................................. 232 10.4.6 Cream ........................................................................................................... 232
10.5 Conclusions ............................................................................................................... 232
11 EQ7: Structure of dairy industry .......................................................................................... 234
11.1 Interpretation and comprehension of the key terms of EQ7 ............................................... 234 11.2 Methodology used for answering EQ7 ............................................................................ 234
11.2.1 Methodology ................................................................................................... 234 11.2.2 Limitations and difficulties faced ........................................................................ 235
11.3 Judgement criteria, indicators and information sources used for each indicator .................... 236 11.4 Results and analysis .................................................................................................... 236
11.4.1 Evolution of the EU dairy processing sector ......................................................... 236 11.4.2 Market share of the EU’s dairy firms in world markets ........................................... 240
11.5 Concentration ratio ..................................................................................................... 241 11.6 Impact of dairy policy measures on structural change in the processing sector ..................... 241 11.7 Conclusions ............................................................................................................... 242
12 EQ8: Competitiveness on international markets ..................................................................... 244
12.1 Interpretation and comprehension of the key terms of the EQ8 ......................................... 244 12.2 Methodology used for answering the EQ8 ....................................................................... 245 12.3 Judgement criteria, indicators and information sources used for each indicator .................... 245 12.4 Market shares of EU dairy products in export and import markets ...................................... 246
12.4.1 Butter ............................................................................................................ 246 12.4.2 SMP .............................................................................................................. 248 12.4.3 WMP ............................................................................................................. 249 12.4.4 Cheese .......................................................................................................... 250
12.5 Prices for dairy products .............................................................................................. 251 12.5.1 Butter ............................................................................................................ 251 12.5.2 SMP .............................................................................................................. 251 12.5.3 WMP ............................................................................................................. 251 12.5.4 Cheese .......................................................................................................... 252
12.6 Other issues on competitiveness ................................................................................... 252 12.6.1 Perceptions on policy changes and competitiveness by the dairy industry ................ 252
12.7 Marketing strategies for dairies ..................................................................................... 253 12.8 Conclusions ............................................................................................................... 254
13 EQ9: Efficiency .................................................................................................................. 257
13.1 Interpretation and comprehension of the key terms of EQ9 ............................................... 257 13.2 Methodology used for answering EQ9: efficiency ............................................................. 261
13.2.1 Estimating the SFP equivalent of the DP ............................................................. 261 13.2.2 Sources and estimates of other payments from the EU budget ............................... 261 13.2.3 Sources and estimates of national budget payments ............................................. 262
13.3 Judgement criteria, indicators and information sources used for each indicator .................... 262 13.4 General efficiency of the measures ................................................................................ 263
13.4.1 Cost of EU dairy policy ..................................................................................... 263 13.4.2 Cost of balancing the market ............................................................................ 264 13.4.3 Cost of market stabilisation .............................................................................. 268 13.4.4 Cost of producer income support ....................................................................... 271 13.4.5 Transfer efficiency ........................................................................................... 275
13.5 Deadweight ............................................................................................................... 278 13.6 Unintended side-effects ............................................................................................... 279
13.6.1 Increased price uncertainty ............................................................................... 279 13.6.2 Unforeseen interactions with quota markets and quota values ................................ 280 13.6.3 Implications for the age structure of milk producers ............................................. 284
13.7 Simplification of policies and administrative procedures .................................................... 285

19
13.8 Conclusions ............................................................................................................... 288
14 EQ10: Coherence .............................................................................................................. 289
14.1 Interpretation and comprehension of the key terms of EQ10 ............................................. 289 14.2 EQ10.1: Coherence with rural development measures ...................................................... 289
14.2.1 Methodology used for answering EQ10.1: coherence with RD measures................... 289 14.2.2 Judgement criteria, indicators and information sources used for each indicator ......... 290
14.3 Ex ante analysis of EQ10.1 ........................................................................................... 291 14.4 Ex post analysis of EQ10.1 ........................................................................................... 293
14.4.1 Economic viability............................................................................................ 293 14.4.2 Rural employment ........................................................................................... 294 14.4.3 Support for modernisation and investment .......................................................... 295 14.4.4 Measures to enhance environmental sustainability ............................................... 296
14.5 Conclusions to EQ10.1 ................................................................................................. 299 14.6 EQ10.2: Coherence with the principles of the 2003 reform ................................................ 301
14.6.1 More market-oriented agricultural markets and a more competitive agriculture ........ 303 14.6.2 Maintenance of income support at current levels .................................................. 308 14.6.3 Fair producer incomes ...................................................................................... 309 14.6.4 Sustainability of agriculture .............................................................................. 311 14.6.5 Simplification of policies and procedures ............................................................. 313
14.7 Conclusions to EQ10.2 ................................................................................................. 313
15 EQ11: Relevance ............................................................................................................... 317
15.1 Approach to answering EQ11 ........................................................................................ 317 15.1.1 Interpretation and comprehension of the key terms of EQ11 .................................. 317 15.1.2 Methodology used for answering EQ11 ............................................................... 318 15.1.3 Judgement criteria, indicators and judgement criteria used for each indicator ........... 318
15.2 Milk producers ............................................................................................................ 319 15.2.1 Level and stability of income ............................................................................. 319 15.2.2 Administrative burden ...................................................................................... 319 15.2.3 Constraints on production choices ...................................................................... 319 15.2.4 Constraints on expansion ................................................................................. 319
15.3 Processors ................................................................................................................. 320 15.3.1 Milk prices ...................................................................................................... 320 15.3.2 Product prices ................................................................................................. 320 15.3.3 Availability and stability of raw milk supply ......................................................... 320
15.4 Consumers ................................................................................................................ 321 15.4.1 Consumer price ............................................................................................... 321
15.5 Society ..................................................................................................................... 322 15.5.1 Environmental sustainability ............................................................................. 322 15.5.2 GHG emissions ............................................................................................... 322 15.5.3 Cost of the CAP ............................................................................................... 322 15.5.4 Administrative costs of agricultural policy............................................................ 322
15.6 Conclusions ............................................................................................................... 323
16 Conclusions and recommendations ....................................................................................... 325
16.1 Conclusions with respect to policy objectives .................................................................. 325 16.2 Conclusions with respect to the evaluation questions ....................................................... 326 16.3 Conclusions with respect to the effectiveness of the instruments........................................ 329 16.4 Recommendations ...................................................................................................... 332
References ............................................................................................................................ 333

20
List of Figures
Figure 2.1 Medium-term evolution of world market prices for selected dairy products ...................... 30
Figure 2.2 Milk production of largest producers (left axis) and the world (right axis) in 2000-2009
(million tonnes; all milk-producing animal types) ........................................................ 31
Figure 2.3 Evolution of world production of dairy products, 2000-2009 .......................................... 33
Figure 2.4 EU production of milk products as a share (%) of world production, 2000-2009 ............... 33
Figure 2.5 EU net exports (1000 tonnes) of cheese, butter, skim milk powder (SMP) and whole milk
powder (WMP), 2000-2009 ...................................................................................... 40
Figure 2.6 Geographical changes in milk production in the EU at NUTS2 level: comparison of periods
1996-2003 and 2003-2008 ...................................................................................... 47
Figure 2.7 Overrun and underuse of milk quota in the EU ............................................................ 76
Figure 2.8 Public intervention stocks for butter and skim milk powder (SMP) on 31 December, 2000-
2010, 1000 t ......................................................................................................... 77
Figure 3.1 Hierarchy of Actions and Impacts .............................................................................. 91
Figure 3.2 Expected Intervention Logic driving Dairy Policy during the period 2003-2008 ............... 102
Figure 4.1 Quota scheme (as sole measure) to support market price for milk ............................... 103
Figure 4.2 Price support in the EU prior to milk quotas .............................................................. 105
Figure 4.3 Quota scheme as a supply-control measure when market price support is achieved by
other measures .................................................................................................... 106
Figure 4.4 Switch from market price support to a direct payment, maintaining quota .................... 107
Figure 4.5 The stages in the chain ......................................................................................... 109
Figure 4.6 The stages in the chain showing the main dairy policy interventions ............................. 110
Figure 4.7 The stages in the chain showing the main dairy policy interventions and the effect of the
dairy premium ..................................................................................................... 112
Figure 4.8 The EU domestic market and the world market, showing the operation of the main trade
measures ............................................................................................................ 117
Figure 4.9 Economics of milk supply ....................................................................................... 118
Figure 4.10 Milk supply and the impact of an individual quota ...................................................... 118
Figure 4.11 Economics of quota transfer ................................................................................... 120
Figure 4.12 Quota abolition and the decision to quit ................................................................... 121
Figure 5.1 Milk production and supply in EU-15, EU-10 and EU-02, 1997-2009 ............................. 126
Figure 5.2 Total milk supply (deliveries to dairies + direct sales), 1997-2009 ............................... 126
Figure 5.3 Structural excess supply of fat, protein, other non-fat solids and milk-equivalent as % of
total supply, 2000-2009 ........................................................................................ 129
Figure 5.4 Milk equivalent disposed of with domestic consumption aids and export subsidies, 2000-
2009 .................................................................................................................. 130
Figure 5.5 Herd numbers in EU-15, 2000 and 2007 .................................................................. 136
Figure 5.6 Number of dairy herds in seven countries of EU-10, 2003 and 2007 ............................. 137
Figure 5.7 Number of dairy herds in five countries of EU-10 and EU-02, 2003 and 2007 ................ 137
Figure 5.8 Average herd size, EU-15 Member states, 1991-2007 ................................................ 140
Figure 5.9 Average herd size, EU-10 and EU-02, 2000-2007 ...................................................... 141
Figure 5.10 Number of cows per size class in EU-15, 2000 and 2007 ............................................ 142
Figure 5.11 Number of cows per size class in EU-10, 2003 and 2007 ............................................ 142
Figure 5.12 Share (%) of total delivered milk coming from specialist dairy farms (2007) by Member
State and change in this share (measured in percentage points), 2001-2007 ................ 144
Figure 5.13 Number of dairy cows in EU regions, 2000-2010 ....................................................... 146
Figure 6.1 Monthly producer price for milk, EU-15, €/100kg, 1996(1)-2010(12) ........................... 156
Figure 6.2 Evolution of price support and milk price equivalents in EU-27 .................................... 158
Figure 6.3 Price-band analysis for Germany ............................................................................. 163
Figure 6.4 Results of price-band analysis by sub period for all Member States .............................. 163
Figure 6.5 Coefficient of Variation, EU-15 and EU-10 ................................................................ 164
Figure 6.6 Annualised Standard Deviation (Denmark and Czech Republic).................................... 165
Figure 6.7 Volatility of the WMPE, PMPE and the EU-15 producer milk price, 1997-2010 ................. 166
Figure 7.1 Gross margin over operating costs for EU-15 for period 2000-2007 and EU-10 for period
2004-2007(left axis), and milk price (right axis), €/t ................................................. 183
Figure 7.2 Raw milk price as received by specialist dairy farmers in EU-15, EU-10 and EU-02 in the
period 2000-2007, €/t ........................................................................................... 187

21
Figure 7.3 Decomposition of costs of milk production in the EU .................................................. 195
Figure 8.1 Share of total cows’ milk production delivered to dairies, EU-15, EU-25, EU-27 .............. 203
Figure 8.2 Number of EU dairy herds, 1990-2007 ..................................................................... 204
Figure 8.3 Share of milk from farms (and share of farms) having a positive net economic margin
(left side: EU-15, right side: EU-10); gross margin and net economic margin (right axis) 207
Figure 8.4 Profitability of dairy farming relative to other agricultural sectors, 2000-2008, FNVA/AWU208
Figure 8.5 Average milk production costs relative to Oceania, 2001 and 2003 .............................. 209
Figure 8.6 Costs of milk production inside and outside the EU, 2007, mean values and spread ........ 210
Figure 9.1 Evolution of EU and world butter prices, 1997-2010................................................... 216
Figure 9.2 Annualised standard deviation (ASD) for butter prices ................................................ 218
Figure 9.3 Evolution of EU and world SMP prices, 1997-2010 ..................................................... 219
Figure 9.4 Annualised standard deviation for SMP prices ........................................................... 219
Figure 9.5 Evolution of EU and world WMP prices, 1997-2010 .................................................... 221
Figure 9.6 Annualised standard deviation for WMP prices ........................................................... 221
Figure 9.7 Evolution of EU and world cheddar prices, 1997-2010 ................................................ 222
Figure 9.8 Annualised standard deviation for cheddar cheese prices ............................................ 223
Figure 9.9 Monthly producer prices for Gouda, Emmentaler, Edammer and Cheddar cheese, 2006-
2010 .................................................................................................................. 223
Figure 9.10 Producer prices for PDO cheeses, 2006-2010 ............................................................ 224
Figure 10.1 Structural excess supply as share (%) of total EU supply of butter, SMP, WMP and
cheese, 2000-2009 ............................................................................................... 231
Figure 12.1 EU-27 market share in world butter trade, 1997-2009, in % ....................................... 247
Figure 12.2 Unsubsidised exports of butter, EU-27, in 1,000 tonnes ............................................. 247
Figure 12.3 EU-27 market share in world SMP trade, 1997-2009, in % ......................................... 248
Figure 12.4 Unsubsidised exports of SMP, EU-27, in 1,000 tonnes ................................................ 248
Figure 12.5 EU-27 market share in world WMP trade, 1997-2009, in % ......................................... 249
Figure 12.6 Unsubsidised WMP exports, EU-27, in 1000 tonnes .................................................... 249
Figure 12.7 EU-27 market share in world cheese trade, 1997-2009, in % ...................................... 250
Figure 12.8 Unsubsidised cheese exports, EU-27, in 1000 tonnes ................................................. 251
Figure 13.1 Total budget costs (EU and Member States), 1995-20101........................................... 264
Figure 13.2 Export refund expenditure and structural excess supply, 1995-2009 ............................ 265
Figure 13.3 Composition of export refunds by product type, 1995-2009 ........................................ 266
Figure 13.4 Expenditure on aids to domestic consumption (SMP, butter and school milk) ................. 266
Figure 13.5 Budget cost of export refunds and consumption aids per tonne of structural excess
supply ................................................................................................................ 268
Figure 13.6 Budget cost of public and private intervention stocks, 1995-2009 ................................ 268
Figure 13.7 Cost of public intervention relative to movements in structural excess supply ................ 270
Figure 13.8 Intervention activity and milk price volatility, 1995-2009............................................ 270
Figure 13.9 Total support to milk production, 1995-2009 ............................................................ 272
Figure 13.10 Support from consumers and taxpayers relative to production value, 1995-2009 ........... 273
Figure 13.11 Support from consumers and taxpayers (assuming ‘normal’ market conditions in 2007-
2009) ................................................................................................................. 274
Figure 13.12 Farm Net Value-Added and Farm Net Value-Added per Annual Work Unit, all holdings and
dairy holdings, 1997-2008 ..................................................................................... 275
Figure 13.13 Gross revenue relative (excluding decoupled payments) to the EU-15 average, specialist
dairy farms, for MS groups according to the year of decoupling ................................... 277
Figure 13.14 Family Farm Income per FWU relative to the EU-15 average, specialist dairy farms, for
MS groups according to the year of decoupling ......................................................... 277
Figure 13.15 Expenditure on operation of EU dairy policy in the Netherlands, 1996-2011 .................. 286
Figure 14.1 Labour on farms with dairy herds, EU-15, 1990-2008 ................................................ 295
Figure 14.2 EU world market share for dairy products and evolution of world exports for these
products, 2000-2009 ............................................................................................ 304
Figure 14.3 Unsubsidised and total exports of butter, SMP and cheese, 2000-2009 ......................... 305
Figure 14.4 EU imports of dairy products, 2000-2009 ................................................................. 307
Figure 14.5 Share of direct payments in FNVA, EU-15, 1995-20081 .............................................. 310

22
List of Tables
Table 2.1 Milk production in 2009 for world, EU and selected countries, totals in tonnes and shares
by animal type ....................................................................................................... 32
Table 2.2 World production and production shares of milk and dairy products in 2009 for the EU
and selected countries ............................................................................................. 34
Table 2.3 Milk cow numbers in selected countries (1000 head), 2000-2010................................... 35
Table 2.4 Milk yield per cow (in tonnes per head), 2000-2010 ..................................................... 36
Table 2.5 Evolution of dairy exports (in milk equivalents), 2000-2009 .......................................... 37
Table 2.6 World exports and market shares for the top 5 exporters by dairy product ...................... 38
Table 2.7 World imports and market shares for the top 5 importers by dairy product...................... 39
Table 2.8 EU trade in cheese (HS 0406), 2000-2009 ................................................................. 40
Table 2.9 EU trade in butter (of HS 040510), 2000-2009 ........................................................... 41
Table 2.10 EU trade in skim milk powder (HS 040210), 2000-2009 ............................................... 42
Table 2.11 EU trade in whole milk powder (HS 040221 + 040229), 2000-2009 ............................... 43
Table 2.12 Raw cows’ milk produced by member State, 2000-2009, 1000 t .................................... 44
Table 2.13 Raw cows’ milk collected by EU Member State, 2000-2010, 1000 t ................................ 45
Table 2.14 Share (%) of raw cow milk collected by EU Member State, 2000-2010 ........................... 46
Table 2.15 Share (%) of on-farm use and direct sales in total cows’ milk production by Member
State, 2000-2009 ................................................................................................... 48
Table 2.16 Milk collected, EU Member State totals and shares of national totals by animal type, 2009 49
Table 2.17 Fat and protein content (%) in raw cows’ milk delivered to dairies, by Member State,
2000-2009 ............................................................................................................ 50
Table 2.18 Producer prices for raw cows’ milk by Member State, 2001-2009, €/t ............................. 51
Table 2.19 Production of butter in the EU MS, 2000-2010, 1000 t ................................................. 52
Table 2.20 Prices of butter by Member State, 2001-2010, €/t ....................................................... 53
Table 2.21 Production of cheese in the EU by Member State, 2000-2010, 1000 t ............................. 54
Table 2.22 Production of drinking milk in EU Member States, 2000-2010, 1000 t ............................. 55
Table 2.23 Production of skim milk powder by Member State, 2000-2010, 1000 t ............................ 56
Table 2.24 Prices of skim milk powder by Member State, 2001-2009, €/t ....................................... 57
Table 2.25 Production of whole milk powder by EU Member State, 2000-2010, 1000 t ..................... 58
Table 2.26 Prices of whole milk powder by Member State, 2001-2009, €/t ..................................... 59
Table 2.27 Per capita consumption of factory cheese (from cows’ milk), butter and liquid milk in EU-
27, kg ................................................................................................................... 60
Table 2.28 Self-sufficiency ratio (in %) for the EU-27, 2000-2010 ................................................. 61
Table 2.29 Dairy enterprises, volume of annual milk production and average milk processed per
firm, 1000 t ........................................................................................................... 62
Table 2.30 Share of livestock-related farm-types (in %) in total holdings by Member States, 2000
and 2007 .............................................................................................................. 64
Table 2.31 Distribution of all farms with dairy cows by herd size, 2000 and 2007 (number of farms
in 1000) ................................................................................................................ 65
Table 2.32 Distribution of dairy cows over herds of different size class, 2000 and 2007 (thousand) .... 66
Table 2.33 Farms with dairy cows and specialist dairy farms, by Member State, 2007 ...................... 68
Table 2.34 % TF 41 farms and cows kept at TF 41 as % of all cows, 2000-2007 .............................. 69
Table 2.35 Evolution of herd sizes and their output by Member State, 2000 and 2007 ...................... 70
Table 2.36 Distribution of dairy cows by LFA/non-LFA, 2003 and 2007 ........................................... 71
Table 2.37 Distribution of farms with dairy cows by LFA/non-LFA, 2003 and 2007 ........................... 72
Table 2.38 Evolution of milk quotas in EU MS, 2000/1 – 2014/15, 1000 t ....................................... 74
Table 2.39 Milk production in excess or deficit of the allocated quota per Member State (in %).......... 75
Table 2.40 Intervention prices (and percentage declines) for butter and SMP, €/100kg .................... 76
Table 2.41 Threshold levels for butter and SMP intervention, 1000 t .............................................. 77
Table 2.42 Additional payments for milk producers, million euro ................................................... 78
Table 2.43 CNDP payments, 2005-2008, € and % ....................................................................... 79
Table 2.44 State aid to the dairy sector ..................................................................................... 80
Table 2.45 Economic details of private storage aid for butter, 2001-2007 ....................................... 81
Table 2.46 Aided quantities of private storage for cheese, 2001-2007, tonnes ................................. 81
Table 2.47 Private storage aid for different types of cheese .......................................................... 82
Table 2.48 Total subsidised exports and average refund paid ........................................................ 83

23
Table 2.49 Summary of aided disposal of butter, 2000-2009, in 1000t of butter equivalent ............... 84
Table 2.50 Expenditures applied for and accepted under Article 69 ................................................ 85
Table 2.51 Ratio of RDP payments for dairy farms relative to all farms per EU-15 MS, 2000-2008 ...... 86
Table 2.52 Rural Development payments for dairy farms, 2000-2008, €/farm ................................. 86
Table 2.53 Overview of drivers affecting different stages of the dairy supply chain ........................... 87
Table 3.1 Dairy policy legislation (1999-2008): links between stated objectives (from recitals) and
measures .............................................................................................................. 94
Table 3.2 Frequency of objectives linked to substantive policy changes, 1999-2008 ....................... 98
Table 3.3 Summary and discussion of the main objectives linked to substantive policy changes,
1999-2008 ............................................................................................................ 99
Table 4.1 Expected impacts of main policy changes (arrows show the direction of the effect) ........ 113
Table 5.1 Indicators, data requirements and information sources for EQ1a ................................. 125
Table 5.2 Summary of EU milk supply, averages in different sub-periods .................................... 127
Table 5.3 Market and structural excess supply for the milk components and milk equivalents, EU-
15/25/27, 2000-2009, 1,000 t ............................................................................... 128
Table 5.4 Indicators, data requirements and information sources relating to production
restructuring for EQ1b ........................................................................................... 134
Table 5.5 Evolution of the number of dairy cows per MS over the period 1990-2010 (thousands) ... 135
Table 5.6 Reasons why milk producers have seriously considered stopping milk production at some
time since 2003 ................................................................................................... 138
Table 5.7 Effect of various policy changes on the incentive to decrease, continue, or expand dairy
production (number of answers) ............................................................................. 139
Table 5.8 Growth in average herd size (% per year), EU-15, 1991-2007, and sub-periods ............ 140
Table 5.9 Share (%) of all farms with dairy cows having a positive net profit .............................. 143
Table 5.10 Average number of dairy cows per specialist and non-specialist dairy farm in the EU-15,
EU-10, EU-02 and EU-27 for the period 2000-2007 ................................................... 145
Table 5.11 Milk yield evolution for specialist and non-specialist dairy farms in EU-15, EU-10, EU-02
and EU-27, kg/cow ............................................................................................... 145
Table 5.12 Share (%) of each Member State’s milk output in total EU-27 milk production ............... 147
Table 5.13 Average annual change (%) in number of dairy herds in different regions by Member
State .................................................................................................................. 148
Table 6.1 Indicators, data requirements and information sources for EQ2 ................................... 155
Table 6.2 Annual average milk price by Member State, four sub-periods, €/100kg ....................... 157
Table 6.3 EU and world market prices, EU price support, averages for sub-periods of 1997-2009 ... 158
Table 6.4 Price support indicator (P-SUP) for the EU-27 ........................................................... 159
Table 6.5 Selected characteristics of pricing for raw milk (apart from fat and protein) in selected
Member States ..................................................................................................... 162
Table 6.6 Mean Annualised Standard Deviation, countries of EU-25 ........................................... 165
Table 7.1 Income, margin, revenues and cost concepts............................................................ 173
Table 7.2 Indicators, data requirements and information sources for EQ3 ................................... 174
Table 7.3 Farm net value added for specialist dairy farms, €/AWU ............................................. 176
Table 7.4 Farm net value added for non-specialist dairy farms, €/AWU ....................................... 177
Table 7.5 Family farm income per family farm working unit, € .................................................. 178
Table 7.6 Income evolution (farm net value added per AWU) of specialist dairy farms (index 2003
= 1) ................................................................................................................... 179
Table 7.7 Income evolution in real terms (index FNVA/AWU, with 2003 = 1) ............................... 180
Table 7.8 Income of specialist dairy farming relative to other agricultural sectors (measured in
terms of FNVA/AWU) ............................................................................................ 181
Table 7.9 Gross margin over operating costs for specialist EU dairy farms by Member State
(including coupled payments and national aids), €/t .................................................. 182
Table 7.10 Indicators on evolution of average labour productivity on specialist dairy farms ............. 184
Table 7.11 Farm herd size and percentage coverage of costs by revenues for case study regions ..... 185
Table 7.12 Total milk revenues for specialist dairy farms (including coupled payments and national
aids), €/t ............................................................................................................. 186
Table 7.13 Average coupled payments and national aid receipts per tonne of milk and per average
specialist dairy farm .............................................................................................. 188
Table 7.14 Subsidies with regard to dairy activity, €/farm .......................................................... 188
Table 7.15 Share (%) of dairy premium and additional payment in dairy subsidies and amount per
tonne of milk ....................................................................................................... 189

24
Table 7.16 Total decoupled payments per dairy farm, €/tonne of milk and €/farm ......................... 190
Table 7.17 Share (%) of subsidies in gross income of specialist dairy farms (before taxes and levies)191
Table 7.18 Total costs of milk production for specialist dairy farms, €/t ........................................ 192
Table 7.19 Specific costs for specialist dairy farms, €/t .............................................................. 193
Table 7.20 Average feed costs (including roughage) for specialist dairy farms, €/tonne of milk ........ 194
Table 8.1 Indicators, data requirements and information sources for EQ4 ................................... 201
Table 8.2 Total cost of milk production for specialist dairy farms, €/t ......................................... 206
Table 8.3 Profitability of dairy farming relative to other agricultural sectors, 2000-2008, FNVA/AWU208
Table 9.1 Indicators, data requirements and information sources for EQ5 ................................... 215
Table 9.2 Average producer price for butter, selected Member States, 2009, €/100kg .................. 217
Table 9.3 Average producer price for SMP, selected Member States,2009, €/100kg, ..................... 220
Table 10.1 Indicators, data requirements and information sources for EQ6 ................................... 228
Table 10.2 Structural excess supply for butter in the EU-15/25/27, 2000-2009, 1,000 t 1............... 229
Table 10.3 Structural excess supply for SMP in the EU-15/25/27, 2000-2009, 1,000 t1 .................. 230
Table 10.4 Market excess supply for WMP in the EU-15/25/27, 2000-2009, 1,000 t1 ..................... 230
Table 10.5 Structural excess supply for cheese in the EU-15/25/27, 2000-2009, 1,000 t1 .............. 231
Table 11.1 Indicators, data requirements and information sources for EQ7 ................................... 236
Table 11.2 Number of dairy enterprises and quantity of milk processed by dairy enterprises per
Member State in 2003 and 2009 ............................................................................. 237
Table 11.3 Distribution of enterprises by volume of annual production of cheese, 2003 and 2009,
number of enterprises in 1000 ................................................................................ 238
Table 11.4 Distribution of enterprises by volume of annual production of butter, 2003 and 2009,
number of enterprises ........................................................................................... 239
Table 11.5 The world’s biggest dairy firms by milk intake in 2009 ............................................... 240
Table 11.6 Change of concentration between 2003 and 2009 in selected Member States ................ 241
Table 12.1 Indicators, data requirements and information sources for EQ8 ................................... 245
Table 12.2 Impact of CAP policy measures to the dairies competitiveness on national and
international markets (frequency of answers given in survey) ..................................... 252
Table 12.3 Innovations in the dairy sector for selected Member States in 2009 ............................. 253
Table 13.1 Various definitions of policy cost ............................................................................. 259
Table 13.2 Indicators, data requirements and information sources for EQ9 ................................... 262
Table 13.3 Stylised classification of the range of judgements ...................................................... 263
Table 13.4 Total budget expenditure, annual averages by sub-period .......................................... 263
Table 13.5 Correlation between changes in structural excess supplies and changes in expenditure on
measures to balance the market ............................................................................. 267
Table 13.6 Average annual expenditure (€ million) on intervention stocks by sub-period, 1995-2009 269
Table 13.7 Levels of support to dairy according to different measures in various sub-periods, 1995-
2009 .................................................................................................................. 274
Table 13.8 Average annual income growth (%), all holdings and dairy holdings, 1997-2008 ............ 276
Table 13.9 Evidence on quota transfers and prices from six Member States .................................. 282
Table 13.10 Changes in the age structure of specialist dairy farmers, 1985-2007 ............................ 284
Table 13.11 Classification of the range of judgements ................................................................. 288
Table 14.1 Judgement criteria and indicators for EQ10.1 ............................................................ 290
Table 14.2 Share of specialist dairy farms with positive net economic profit, 2000-2007 ................. 294
Table 14.3 Use of extra revenue during the high-price period of 2007-2008 .................................. 296
Table 14.4 Importance of direct payments to milk producers for staying in milk production ............. 297
Table 14.5 Impact of specific types of cross compliance on costs, % of respondents ...................... 298
Table 14.6 Number of dairy cows on certified-organic farms, thousand, 1998-2009 ....................... 299
Table 14.7 Judgement criteria and indicators for EQ10.2 ............................................................ 302
Table 14.8 Applied tariffs for imports into the EU (GATT years) (all quantities in thousand tonnes, all
tariffs in €/100kg) ................................................................................................ 306
Table 14.9 Milk per hectare of forage area (tonnes/hectare), 2000-2007 ...................................... 312
Table 14.10 Outlook on farm succession ................................................................................... 313
Table 14.11 Coherence between CAP reform principle and changes in CAP dairy policy ..................... 314
Table 15.1 Judgement criteria and indicators for EQ11 .............................................................. 318
Table 15.2 Summary of CAP dairy policy measures according to how their outcomes have responded
to stakeholder concerns......................................................................................... 323
Table 16.1 Summary of findings with respect to the policy objectives .......................................... 325
Table 16.2 Summary of findings with respect to the evaluation questions ..................................... 327
25
Table 16.3 Summary of instrument effectiveness ...................................................................... 330

26
List of Abbreviations
Abbreviation Explanation
ASD Annualised Standard Deviation
Assoc. Association
AWU Annual Work Unit
CAP Common Agricultural Policy
CMO Common Market Organisation
CNDP Complementary national direct payment
CNIEL Centre National Interprofessionel de l’Economie Laitière
CRIEL Centre Régional Interprofessionel de l’Economie laitière
CR Concentration ratio
CV Coefficient of variation
D Demand
DG AGRI Directorate-General Agriculture and Rural Development
DG BUDG Directorate-General for Budget
DP Dairy premium
EAGGF European Agricultural Guidance and Guarantee Fund
EEC European (Economic) Community
EQ Evaluation question
EU European Union
EU-27 European Union, 27 Member States
EU-25 European Union, 25 Member States (prior to the accession of Bulgaria and
Romania)
EU-15 European Union, 15 Member States (prior to the accession of EU-12)
EU-12
European Union, 12 Member States: Bulgaria, Czech Republic, Cyprus,
Estonia, Hungary, Malta, Latvia, Lithuania, Poland, Romania, Slovakia,
Slovenia
EU-10 European Union, 10 Member States: Czech Republic, Cyprus, Estonia,
Hungary, Malta, Latvia, Lithuania, Poland, Slovakia, Slovenia
EU-02 European Union, 2 Member States: Bulgaria and Romania
EU-FADN European Union Farm Accountancy Data Network
FAO Food and Agriculture Organisation of the United Nations
FFI Farm family income
FNVA Farm net value added
FOB Free on board
FSS Farm Structure Survey
FWU Family Work Unit
GMO Genetically modified organism
IDF International Dairy Federation
IFCN International Farm Cost Network
IMPE Intervention milk price equivalent
Inc. Incorporated
kg kilogramme
LFA Less Favoured Area
MPS Market Price Support
MS Member State
OECD Organisation for Economic Cooperation and Development
PMPE Producer milk price equivalent
PSE Producer Support Estimate
P-SUP Price support ratio
RDP Rural Development Programme
RDR Rural Development Regulation
Reg Regulation
S Supply
27
SD Standard deviation
SES Structural Excess Supply
SFP Single Farm Payment
SMP Skim milk powder
t metric tonne
TF Type of farm
TRQ Tariff rate quota
UK United Kingdom
URA Uruguay Round Agreement
USA United States of America
USDA United States of America Department of Agriculture
VES Variable export subsidy
WMP Whole milk powder
WMPE World milk price equivalent
WTO World Trade Organisation

28
1 Introduction Following the implementing rules of the Financial Regulation applicable to the general budget of the
European Union (Council Regulation (EC) No 1605/2002), all measures causing budgetary expenditure
must have their results evaluated every six years. The Commission’s Directorate-General for Agriculture
and Rural Development is in charge of the regular evaluation of agricultural policy measures.
The Common Market Organisation (CMO) measures for dairy were last evaluated in 2002. The
environmental aspects of the CAP measures related to the beef and milk sectors, and to the
implementation of milk quotas by Member States, were studied in 2007 and in 2008, respectively. The
DG AGRI multi-annual evaluation plan 2010-2012 provides for an evaluation of CAP measures applied to
the dairy sector to be carried out in 2010.
The objective of this retrospective evaluation is to analyse the economic and structural aspects of the
sector, and to assess the impacts of the CAP measures applied to this sector since the 2003 CAP reform.
Therefore, the first policy changes to be evaluated are those enshrined in decisions legislated in 2003, or
– in a few cases – decided earlier, but not implemented until after 2003. The evaluation period begins on
1 July 2004, when first cuts to intervention prices were implemented. However, in order to capture the
impacts of implementing the 2003 CAP reform, data from the previous period are used to establish a
reference point.
The evaluation is intended to examine the effectiveness, efficiency and relevance of policy measures in
relation to their objectives. The evaluation will also assess possible unintended side-effects of the
measures and their deadweight. The coherence of the new measures for dairy with the overall concept
and principles of the 2003 CAP reform, and with rural development measures are also to be assessed.
The coherence of measures financed by state aid with the new dairy measures is also within the scope of
the assessment.
This report presents the answers to the Evaluation Questions of Theme 1, 2 and 3:
Theme Evaluation issue Short description of key question
1 Raw Milk 1 Production and
supply to / demand
by dairies
To what extent have the CAP measures applicable to the dairy
sector contributed to balancing supply and demand of milk and
led to production restructuring?
2 Producer prices To what extent have the CAP measures applicable to the dairy
sector affected prices paid to producers, the payment system
and price stability?
3 Producer’s income To what extent have the CAP measures applicable to the dairy
sector contributed to maintaining / increasing the farmers’
income?
4 Producer’s
competitiveness and
market orientation
To what extent have the CAP measures applicable to the dairy
sector contributed to increasing farmers’ market orientation
and competitiveness?
2 Milk
products
5 Prices of milk
products
To what extent have the CAP measures applicable to the dairy
sector contributed to stabilising the market prices for milk
products?
6 Market balance To what extent have the CAP measures applicable to the dairy
sector contributed to balancing supply and demand for milk
products?
7 Structure of
processing industry
To what extent have the CAP measures applicable to the dairy
sector influenced structural changes in the processing sector?
8 Competitiveness on
international markets
To what extent have the CAP measures applicable to the dairy
sector contributed to improved competitiveness of milk
products on international markets?

29
Theme Evaluation issue Short description of key question
3
Efficiency,
coherence
and
relevance
9 Efficiency To what extent have the CAP measures applied to the dairy
sector been efficient with respect to their objectives?
10a Coherence -
Rural Development
Programmes
To what extent have the CAP measures applicable to the dairy
sector been coherent with the rural development measures and
the national aid granted in accordance with relevant EU rules
stated?
10b Coherence –
Overall CAP
To what extent have the CAP measures applicable to the dairy
sector been coherent with the overall concepts and principles of
the 2003 reform of the CAP?
11 Relevance To what extent have the CAP measures applicable to the dairy
sector been relevant with respect to the needs and problems of
farmers, processors and consumers?
The rest of the report is organised as follows:
The second chapter describes the dairy sector in the EU and places it in the world markets. The third
chapter describes EU dairy policy and focuses on the reform of the CAP dairy policies after 2003, which
are subject to the present evaluation. It discusses what the objectives of the policies are and explains
the benchmark followed in answering the evaluation questions. The fourth chapter analyses the
theoretical effects of the presented CAP dairy policies. Chapters 5 to 15 answer each of the evaluation
questions respectively. Finally chapter 16 concludes.

30
2 EU dairy sector
2.1 Dairy production in the world perspective
2.1.1 World market prices
Figure 2.1 shows the longer-run evolution of world market prices for key dairy products. Over the period
1990-2004, there were no strong variations in world dairy product prices. Thereafter, there seems to be
a tendency for prices to increase. The period 2006-2010 was particularly turbulent, with prices for dairy
commodities reaching very high levels in 2007 and declining gradually in 2008 and early 2009. These
price movements caused severe disruption on milk markets in the EU and worldwide. Prices recovered
partly in 2010, but the year was marked by further imbalances on world dairy markets (caused by events
like food safety concerns in China for milk powders, limited supply in Oceania, and stronger demand in
Russia and south east Asian countries). A number of factors contributed to the 2007 price peak, such as
supply shortfalls linked to extreme weather conditions, high input costs, overall economic crisis and
policy-driven trade limitations. While these developments fuelled discussions about food security, there is
still little consensus on which factors affected food markets and to what extent (see for example Baffes
and Haniotis, 2010; FAO, 2010; von Braun, 2008).
Figure 2.1 Medium-term evolution of world market prices for selected dairy products
0
1000
2000
3000
4000
5000
6000
7000
8000
9000
1990 1992 1994 1996 1998 2000 2002 2004 2006 2008 2010
US
D 7
t
Cheese Butter SMP WMP Casein Whey powder
Notes: Prices refer to: SMP: FOB export price, non-fat dry milk, 1.25% butterfat, Oceania. WMP: FOB export price, WMP 26% butterfat, Oceania Butter: FOB export price, butter, 82% butterfat, Oceania. Cheese: FOB export price, cheddar cheese, 39% moisture, Oceania. Casein: Export price, New Zealand. Whey powder: Edible dry whey, Wisconsin, plant
Source: OECD-FAO, 2011.
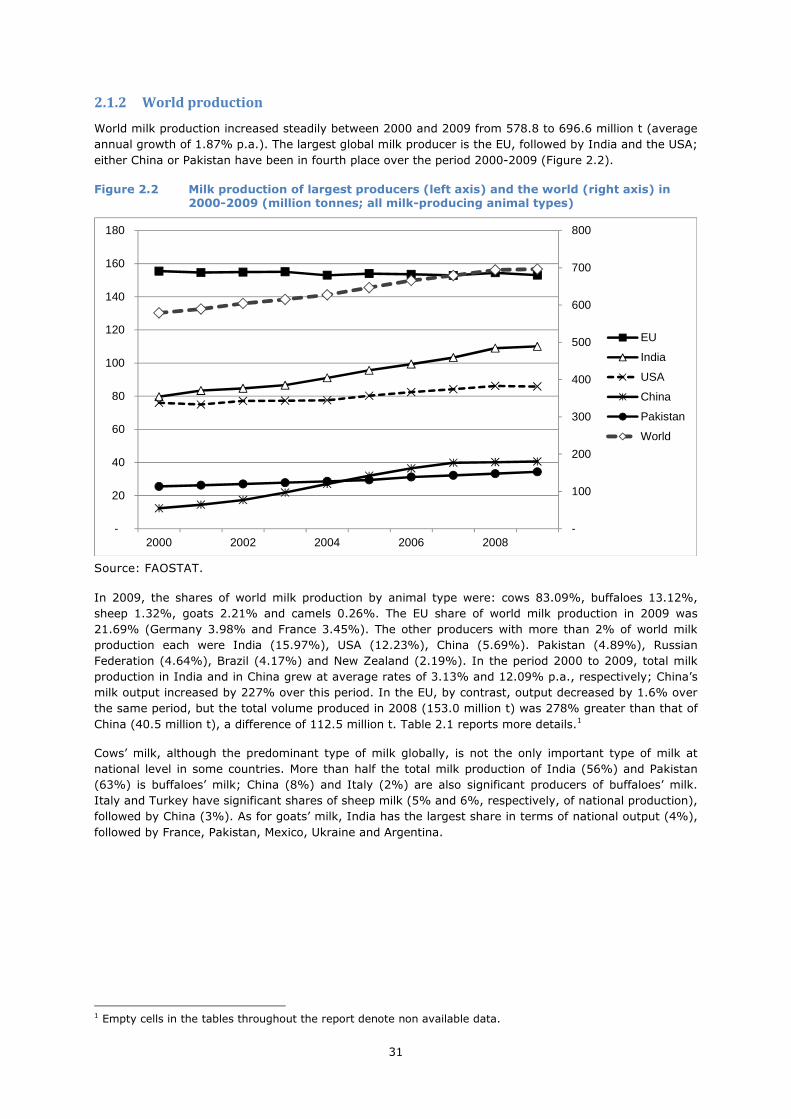
31
2.1.2 World production
World milk production increased steadily between 2000 and 2009 from 578.8 to 696.6 million t (average
annual growth of 1.87% p.a.). The largest global milk producer is the EU, followed by India and the USA;
either China or Pakistan have been in fourth place over the period 2000-2009 (Figure 2.2).
Figure 2.2 Milk production of largest producers (left axis) and the world (right axis) in 2000-2009 (million tonnes; all milk-producing animal types)
-
100
200
300
400
500
600
700
800
-
20
40
60
80
100
120
140
160
180
2000 2002 2004 2006 2008
EU
India
USA
China
Pakistan
World
Source: FAOSTAT.
In 2009, the shares of world milk production by animal type were: cows 83.09%, buffaloes 13.12%,
sheep 1.32%, goats 2.21% and camels 0.26%. The EU share of world milk production in 2009 was
21.69% (Germany 3.98% and France 3.45%). The other producers with more than 2% of world milk
production each were India (15.97%), USA (12.23%), China (5.69%). Pakistan (4.89%), Russian
Federation (4.64%), Brazil (4.17%) and New Zealand (2.19%). In the period 2000 to 2009, total milk
production in India and in China grew at average rates of 3.13% and 12.09% p.a., respectively; China’s
milk output increased by 227% over this period. In the EU, by contrast, output decreased by 1.6% over
the same period, but the total volume produced in 2008 (153.0 million t) was 278% greater than that of
China (40.5 million t), a difference of 112.5 million t. Table 2.1 reports more details.1
Cows’ milk, although the predominant type of milk globally, is not the only important type of milk at
national level in some countries. More than half the total milk production of India (56%) and Pakistan
(63%) is buffaloes’ milk; China (8%) and Italy (2%) are also significant producers of buffaloes’ milk.
Italy and Turkey have significant shares of sheep milk (5% and 6%, respectively, of national production),
followed by China (3%). As for goats’ milk, India has the largest share in terms of national output (4%),
followed by France, Pakistan, Mexico, Ukraine and Argentina.
1 Empty cells in the tables throughout the report denote non available data.

32
Table 2.1 Milk production in 2009 for world, EU and selected countries, totals in tonnes
and shares by animal type
Regions/Countries
Milk Total
Share of world total Share of national total by animal type
All milk Cows’ milk Cow Buffalo Sheep Goat Camel
1000 t per cent
per cent
per cent
per cent
per cent
per cent
per cent
World 702,137 100.0 83.1 83.1 13.1 1.3 2.2 0.3
EU-27 152,260 21.7 21.0 96.7 0.1 1.9 1.2 0.0
EU-25 145,219 20.7 20.1 97.1 0.1 1.6 1.2 0.0
EU-15 123,054 17.5 16.9 96.6 0.2 1.8 1.4 0.0
EU-10 22,165 3.2 3.1 99.5 0.0 0.2 0.3 0.0
EU-02 7,041 1.0 0.9 89.2 0.1 9.8 0.9 0.0
Germany 27,972 4.0 4.0 99.9 0.0 0.0 0.1 0.0
France 24,218 3.5 3.3 96.4 0.0 1.1 2.6 0.0
United Kingdom 13,237 1.9 1.9 100.0 0.0 0.0 0.0 0.0
Poland 12,467 1.8 1.8 99.8 0.0 0.0 0.2 0.0
Italy 13,063 1.9 1.7 93.5 1.6 4.6 0.3 0.0
Netherlands 11,469 1.6 1.6 100.0 0.0 0.0 0.0 0.0
India 112,114 16.0 6.4 40.3 56.1 0.0 3.7 0.0
USA 85,859 12.2 12.2 100.0 0.0 0.0 0.0 0.0
China 39,946 5.7 5.1 88.9 7.5 2.9 0.7 0.0
Pakistan 34,362 4.9 1.7 34.9 62.9 0.1 2.1 0.0
Russian Federation 32,562 4.6 4.6 99.3 0.0 0.0 0.7 0.0
Brazil 29,256 4.2 4.2 99.5 0.0 0.0 0.5 0.0
New Zealand 15,400 2.2 2.2 100.0 0.0 0.0 0.0 0.0
Turkey 12,542 1.8 1.7 92.4 0.3 5.9 1.5 0.0
Ukraine 11,610 1.7 1.6 97.9 0.0 0.2 1.9 0.0
Mexico 10,719 1.5 1.5 98.4 0.0 0.0 1.6 0.0
Argentina 10,366 1.5 1.5 100.0 0.0 0.0 0.0 0.0
Australia 9,388 1.3 1.3 100.0 0.0 0.0 0.0 0.0
Canada 8,213 1.2 1.2 100.0 0.0 0.0 0.0 0.0
Japan 7,909 1.1 1.1 100.0 0.0 0.0 0.0 0.0
Source: FAOSTAT.
World production of all the major milk products except skim milk powder increased between 2000 and
2009 (Figure 2.3). Butter production grew by 30%, with India increasing its production by 86%, Pakistan
by 28% and the USA by 25%. EU production fell by 7%. Cheese production rose by 17% over this
period, led by the USA (21%) and the EU (11%). Whole milk powder (WMP) production increased by
18%, but EU production fell by 15%; by contrast, Brazil’s production doubled and that of New Zealand
grew by 45%. Skim milk powder (including buttermilk powder) production decreased by 1% globally and
by 16% in the EU, although production in the USA increased by 28%. World production of evaporated
and condensed milk grew by 17% (29% in the USA), whereas EU production decreased by 3%. Global
whey (powder) production grew by 21%, and by 29% in the EU.

33
Figure 2.3 Evolution of world production of dairy products, 2000-2009
0
2,000
4,000
6,000
8,000
10,000
12,000
14,000
16,000
18,000
20,000
2000 2001 2002 2003 2004 2005 2006 2007 2008 2009
1000
t
Cheese
Butter
EvapCond
SMP
WMP
Whey
Source: FAOSTAT.
Figure 2.4 EU production of milk products as a share (%) of world production, 2000-2009
0
10
20
30
40
50
60
70
80
2000 2001 2002 2003 2004 2005 2006 2007 2008 2009
Whey
Cheese
SMP
EvapCond
WMP
Butter
Source: FAOSTAT.
The distribution of the of world production of milk and dairy products in 2009 is shown in Table 2.2 and
the share of the EU production of milk products in world production is shown in Figure 2.4.
The EU was the largest producer of all the main milk products except butter (including ghee) in 2009, for
which India had the largest output. The EU produced almost twice as much cheese as the USA, with
Germany and France being the second and third largest world individual country producers. France was
the world leader for whey production, for which the EU as a whole produced over two thirds of global
output. World production of SMP, WMP and evaporated and condensed milk was not as concentrated as

34
for butter, cheese and whey. The EU was the largest global producer for these products also, but with
lower shares of world production (34, 24 and 32% respectively). Other important producers of SMP were
USA (25%) and New Zealand (9%), while France and Germany were the largest producers among EU
Member States (with 8.6% and 7.0% of world production, respectively). For WMP, New Zealand and
Brazil were the second and third most important producers, whereas the USA was by far the second most
important producer of evaporated and condensed milk.
Table 2.2 World production and production shares of milk and dairy products in 2009 for the EU and selected countries
Regions/Countries Milk Butter
(including ghee)
Cheese Whole milk
powder
Skim & butter-milk
powder
Evaporated & condensed
milk
Whey powder
World (1000 t) 702,137 9,968 20,051 2,915 3,288 4,765 2,384
Share of world production, per cent
EU-27 21.7 19.3 43.6 25.3 34.2 31.8 67.5
EU-25 20.7 19.2 42.7 25.3 33.9 31.8 67.5
EU-15 17.5 16.5 37.5 22.4 26.6 28.5 61.1
EU-10 3.2 2.7 5.3 2.9 7.3 3.3 6.4
EU-02 1.0 0.1 0.9 0.0 0.3 0.0 0.0
Germany 4.0 4.5 10.1 3.0 7.1 9.8 15.0
France 3.5 4.1 9.2 5.0 8.6 0.9 26.9
United Kingdom 1.9 1.2 1.6 1.7 2.0 2.6 3.6
Poland 1.8 1.8 3.2 1.3 4.0 0.8 3.3
Italy 1.9 0.9 5.6 0.0 0.0 3.2 0.1
Netherlands 1.6 1.3 3.6 2.9 2.1 8.3 8.4
India 16.0 42.0 0.0 0.1 5.0 0.0 0.0
USA 12.2 7.2 24.6 0.9 24.9 22.3 21.6
China 5.7 1.1 1.4 0.0 0.0 2.8 0.0
Pakistan 4.9 6.3 0.0 0.0 0.0 0.0 0.0
Russian Federation 4.6 2.3 3.1 1.7 2.0 4.1 0.0
Brazil 4.2 0.9 0.2 16.2 0.0 1.1 0.0
New Zealand 2.2 4.4 1.7 26.3 8.9 0.0 0.9
Turkey 1.8 1.5 0.8 0.0 0.0 0.0 0.7
Ukraine 1.7 0.8 1.2 0.7 3.4 1.6 0.4
Mexico 1.5 0.2 1.0 3.7 0.7 3.4 0.0
Argentina 1.5 0.5 2.5 7.6 1.1 0.2 0.0
Australia 1.3 1.5 1.7 5.1 5.6 0.4 4.0
Canada 1.2 0.9 1.9 0.0 2.7 1.0 0.9
Japan 1.1 0.8 0.6 1.5 5.1 1.0 0.0
Source: FAOSTAT.

35
Table 2.3 Milk cow numbers in selected countries (1000 head), 2000-2010
2000 2001 2002 2003 2004 2005 2006 2007 2008 2009 2010
European Union
EU-15 19,911 20,016 19,562 19,272 18,736 18,377 17,975 17,900 18,107 17,826
EU-25 23,305 22,920 22,316 22,267 22,450 21,972
EU-27 24,176 24,248 23,653
EU(15/25/27) 19,911 20,016 19,562 19,272 23,305 22,920 22,316 24,176 24,248 23,653
North America
Canada 1,141 1,091 1,084 1,065 1,055 1,066 1,019 995 985 979 981
Mexico 6,800 6,800 6,800 6,800 6,800 6,850 6,875 6,010 6,204 6,400 6,560
United States 9,199 9,103 9,139 9,084 9,012 9,043 9,112 9,189 9,315 9,201 9,111
Sub-total 17,140 16,994 17,023 16,949 16,867 16,959 17,006 16,194 16,504 16,580 16,652
South America
Argentina 2,450 2,450 2,150 2,000 2,000 2,100 2,150 2,150 2,150 2,100 2,100
Brazil 16,040 15,900 15,600 15,300 15,200 15,100 15,290 15,925 16,700 17,200 17,600
Sub-total 18,490 18,350 17,750 17,300 17,200 17,200 17,440 18,075 18,850 19,300 19,700
Former Soviet Union
Russia 12,900 12,500 12,200 11,700 11,200 10,400 9,900 9,910 9,800 9,530 9,200
Ukraine 5,431 4,958 4,918 4,715 4,313 4,130 3,840 3,221 3,096 2,856 2,758
Sub-total 18,331 17,458 17,118 16,415 15,513 14,530 13,740 13,131 12,896 12,386 11,958
South Asia
India 35,750 35,900 36,000 36,500 37,000 38,000 38,000 38,000 38,500 42,600 43,600
Asia
China 2,280 2,848 3,420 4,466 5,466 6,800 7,900 8,755 8,575 7,115 7,350
Japan 992 971 966 964 936 910 900 871 862 848 830
Sub-total 3,272 3,819 4,386 5,430 6,402 7,710 8,800 9,626 9,437 7,963 8,180
Oceania
Australia 2,171 2,281 2,369 2,050 2,036 2,041 1,870 1,800 1,640 1,676 1,630
New Zealand 3,337 3,557 3,749 3,842 3,920 3,970 4,100 4,163 4,200 4,597 4,753
Sub-total 5,508 5,838 6,118 5,892 5,956 6,011 5,970 5,963 5,840 6,273 6,383
Total Selected Countries 100,491 100,360 100,397 100,489 100,942 102,415 102,962 102,996 104,035 107,111 106,473 Notes: Data for 2010 are provisional.
Source: Eurostat, DG AGRI (various years); USDA (2010 and 2007).

36
Table 2.3 provides an overview of the total cow numbers in different regions. On average, for the period
2007-2009, nearly 40% of the reported total number of cows are kept in India, and about one fifth are
located in the EU-27. The three year average 2007-2009 shares for the USA, Russia and China are 9%,
9% and 8% respectively. The corresponding share of Oceania is about 4%.For the EU and Canada, which
both have dairy supply management policies, total dairy cow numbers were declining at an average rate
of 1.2% and 1.5% per annum, respectively. These trends are the result of continuing milk yield increases
whilst total milk output is constrained by quota. Total cow numbers for the USA did not show a particular
trend, remaining rather stable. In the Former Soviet Union, cow numbers declined by about 4% per
year. In Oceania, New Zealand recorded a relatively strong increase in dairy cows (+3.6% per annum),
whereas in Australia the decline was about 2.8% per annum. The net result was, nevertheless, an
increasing dairy cow herd in Oceania. As regards newly emerging economies, the number of dairy cows
in China increased on average by more than 13% p.a., whereas for India annual average increase was
close to 2%.
Table 2.4 shows average milk yields in various world regions, measured in terms of milk delivered per
dairy cow and suggests that these developments have already started to occur (as reflected by
increasing yields over time). For example the yield increases for China and India based on the reported
data are 1.1% and 1.2% per annum, respectively, and the calculated annual yield increase in South
America is about 2%. However, in Mexico and Ukraine with yield growth rates of more than 6% per year,
adjustment is much faster. It should be noted that in Ukraine the total number of dairy cows declined at
the same rate, and because of this the volume of production remained almost constant.
Table 2.4 Milk yield per cow (in tonnes per head), 2000-2010
2000 2001 2002 2003 2004 2005 2006 2007 2008 2009 2010p
European Union
EU-15 6.11 6.12 6.13 6.27 6.34 6.50 6.58 6.62 6.70 6.69
EU-25 6.01 6.17 6.26 6.32 6.40 6.41
EU-27 6.06 6.16 6.17
EU (15/25/27) 6.11 6.12 6.13 6.27 6.01 6.17 6.26 6.06 6.16 6.17
North America
Canada 7.15 7.43 7.35 7.30 7.40 7.40 7.89 8.25 8.40 8.46 8.51
Mexico 1.00 1.00 1.00 1.44 1.45 1.44 1.46 1.77 1.76 1.70 1.70
United States 8.25 8.24 8.44 8.50 8.60 8.87 9.02 9.16 9.25 9.33 9.60
South America
Argentina 4.00 3.88 3.95 3.98 4.38 4.65 4.74 4.44 4.66 4.93 5.05
Brazil 1.38 1.40 1.45 1.49 1.53 1.61 1.65 1.68 1.67 1.67 1.70
Former Soviet Union
Russia 2.47 2.64 2.75 2.82 2.86 3.08 3.14 3.25 3.32 3.42 3.45
Ukraine 2.28 2.66 2.82 2.84 3.20 3.25 3.36 3.72 3.72 3.98 3.97
South Asia
India 1.01 1.01 1.01 1.00 1.01 1.01 1.08 1.13 1.16 1.13 1.15
Asia
China 3.63 3.60 3.80 3.91 4.14 4.05 4.04 4.03 4.00 4.00 3.96
Japan 8.57 8.55 8.68 8.71 8.90 9.10 9.04 9.19 9.26 9.33 9.39
Oceania
Australia 5.15 4.76 4.90 5.19 5.10 5.11 5.56 5.48 5.79 5.56 5.77
New Zealand 3.67 3.70 3.71 3.73 3.83 3.65 3.71 3.76 3.61 3.78 3.56 Notes: The table measures the yields in terms of milk delivered per dairy cow. By doing this, it underestimates the total amount of milk actually produced per cow for those countries where a significant part of the milk produced is not delivered to dairies. For countries/regions with high delivery rates, like the EU, the USA, Canada, Japan, Australia and New Zealand, these numbers are a good proxy for physical milk yields. However, for countries with low reported milk yields, such as Mexico, Brazil and India, where deliveries per dairy cow may be less than half those of OECD countries, it is not clear to what extent closing the gap would imply an improvement in physical yields (e.g. by breeding programs and optimization of feed nutrition) or a change in market structures (greater vertical integration and commercialisation of the supply chain).
Source: Eurostat; DG AGRI (various years); USDA( 2010 and 2007).
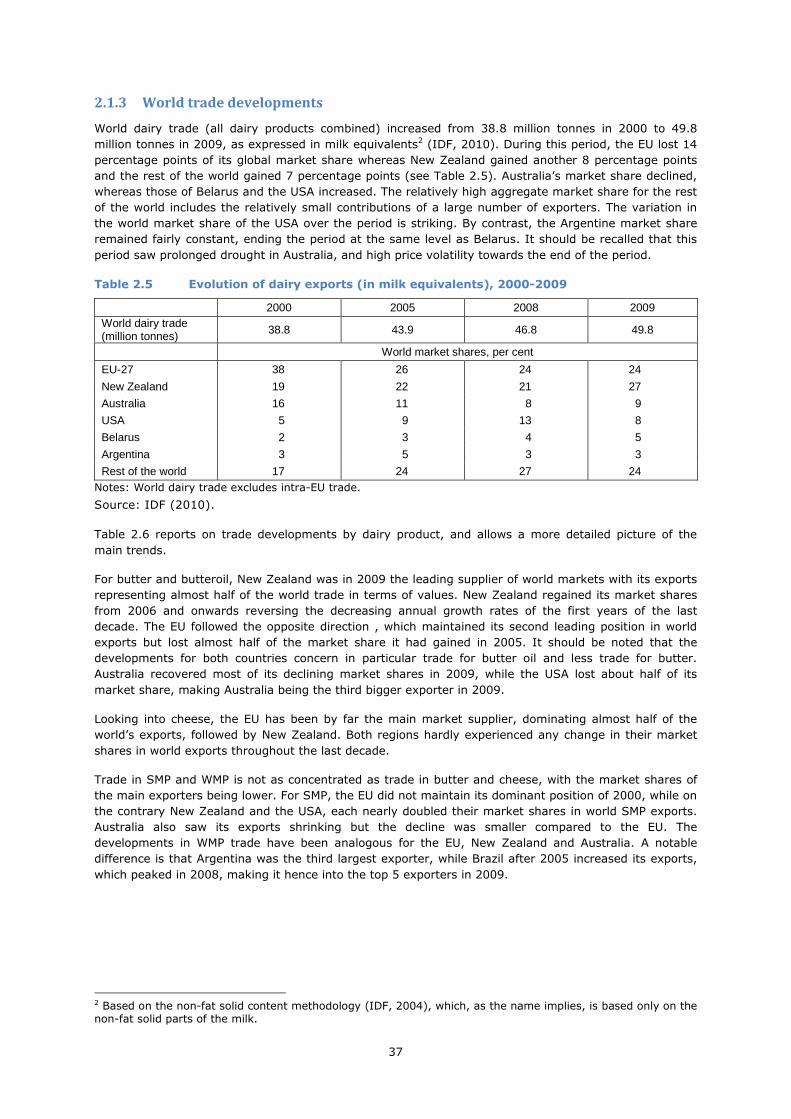
37
2.1.3 World trade developments
World dairy trade (all dairy products combined) increased from 38.8 million tonnes in 2000 to 49.8
million tonnes in 2009, as expressed in milk equivalents2 (IDF, 2010). During this period, the EU lost 14
percentage points of its global market share whereas New Zealand gained another 8 percentage points
and the rest of the world gained 7 percentage points (see Table 2.5). Australia’s market share declined,
whereas those of Belarus and the USA increased. The relatively high aggregate market share for the rest
of the world includes the relatively small contributions of a large number of exporters. The variation in
the world market share of the USA over the period is striking. By contrast, the Argentine market share
remained fairly constant, ending the period at the same level as Belarus. It should be recalled that this
period saw prolonged drought in Australia, and high price volatility towards the end of the period.
Table 2.5 Evolution of dairy exports (in milk equivalents), 2000-2009
2000 2005 2008 2009 World dairy trade (million tonnes) 38.8 43.9 46.8 49.8
World market shares, per cent
EU-27 38 26 24 24
New Zealand 19 22 21 27
Australia 16 11 8 9
USA 5 9 13 8
Belarus 2 3 4 5
Argentina 3 5 3 3
Rest of the world 17 24 27 24 Notes: World dairy trade excludes intra-EU trade.
Source: IDF (2010).
Table 2.6 reports on trade developments by dairy product, and allows a more detailed picture of the
main trends.
For butter and butteroil, New Zealand was in 2009 the leading supplier of world markets with its exports
representing almost half of the world trade in terms of values. New Zealand regained its market shares
from 2006 and onwards reversing the decreasing annual growth rates of the first years of the last
decade. The EU followed the opposite direction , which maintained its second leading position in world
exports but lost almost half of the market share it had gained in 2005. It should be noted that the
developments for both countries concern in particular trade for butter oil and less trade for butter.
Australia recovered most of its declining market shares in 2009, while the USA lost about half of its
market share, making Australia being the third bigger exporter in 2009.
Looking into cheese, the EU has been by far the main market supplier, dominating almost half of the
world’s exports, followed by New Zealand. Both regions hardly experienced any change in their market
shares in world exports throughout the last decade.
Trade in SMP and WMP is not as concentrated as trade in butter and cheese, with the market shares of
the main exporters being lower. For SMP, the EU did not maintain its dominant position of 2000, while on
the contrary New Zealand and the USA, each nearly doubled their market shares in world SMP exports.
Australia also saw its exports shrinking but the decline was smaller compared to the EU. The
developments in WMP trade have been analogous for the EU, New Zealand and Australia. A notable
difference is that Argentina was the third largest exporter, while Brazil after 2005 increased its exports,
which peaked in 2008, making it hence into the top 5 exporters in 2009.
2 Based on the non-fat solid content methodology (IDF, 2004), which, as the name implies, is based only on the non-fat solid parts of the milk.
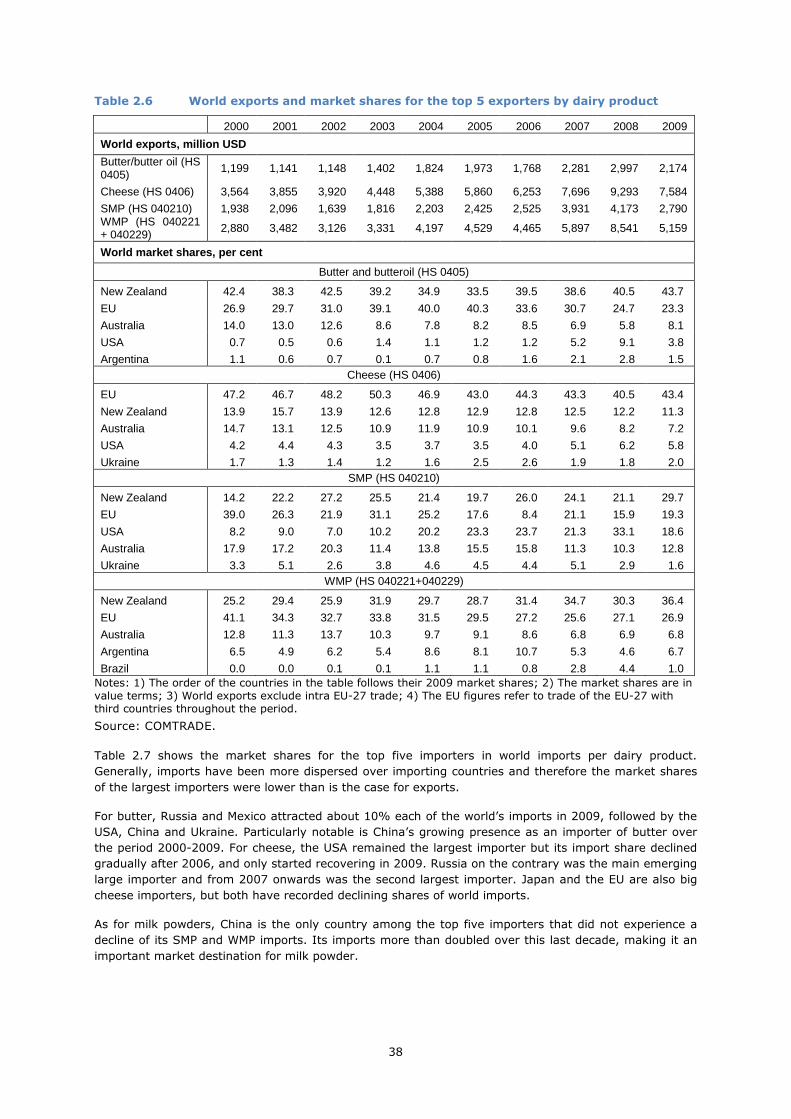
38
Table 2.6 World exports and market shares for the top 5 exporters by dairy product
2000 2001 2002 2003 2004 2005 2006 2007 2008 2009
World exports, million USD
Butter/butter oil (HS 0405) 1,199 1,141 1,148 1,402 1,824 1,973 1,768 2,281 2,997 2,174
Cheese (HS 0406) 3,564 3,855 3,920 4,448 5,388 5,860 6,253 7,696 9,293 7,584
SMP (HS 040210) 1,938 2,096 1,639 1,816 2,203 2,425 2,525 3,931 4,173 2,790 WMP (HS 040221 + 040229) 2,880 3,482 3,126 3,331 4,197 4,529 4,465 5,897 8,541 5,159
World market shares, per cent
Butter and butteroil (HS 0405)
New Zealand 42.4 38.3 42.5 39.2 34.9 33.5 39.5 38.6 40.5 43.7
EU 26.9 29.7 31.0 39.1 40.0 40.3 33.6 30.7 24.7 23.3
Australia 14.0 13.0 12.6 8.6 7.8 8.2 8.5 6.9 5.8 8.1
USA 0.7 0.5 0.6 1.4 1.1 1.2 1.2 5.2 9.1 3.8
Argentina 1.1 0.6 0.7 0.1 0.7 0.8 1.6 2.1 2.8 1.5 Cheese (HS 0406)
EU 47.2 46.7 48.2 50.3 46.9 43.0 44.3 43.3 40.5 43.4
New Zealand 13.9 15.7 13.9 12.6 12.8 12.9 12.8 12.5 12.2 11.3
Australia 14.7 13.1 12.5 10.9 11.9 10.9 10.1 9.6 8.2 7.2
USA 4.2 4.4 4.3 3.5 3.7 3.5 4.0 5.1 6.2 5.8
Ukraine 1.7 1.3 1.4 1.2 1.6 2.5 2.6 1.9 1.8 2.0 SMP (HS 040210)
New Zealand 14.2 22.2 27.2 25.5 21.4 19.7 26.0 24.1 21.1 29.7
EU 39.0 26.3 21.9 31.1 25.2 17.6 8.4 21.1 15.9 19.3
USA 8.2 9.0 7.0 10.2 20.2 23.3 23.7 21.3 33.1 18.6
Australia 17.9 17.2 20.3 11.4 13.8 15.5 15.8 11.3 10.3 12.8
Ukraine 3.3 5.1 2.6 3.8 4.6 4.5 4.4 5.1 2.9 1.6 WMP (HS 040221+040229)
New Zealand 25.2 29.4 25.9 31.9 29.7 28.7 31.4 34.7 30.3 36.4
EU 41.1 34.3 32.7 33.8 31.5 29.5 27.2 25.6 27.1 26.9
Australia 12.8 11.3 13.7 10.3 9.7 9.1 8.6 6.8 6.9 6.8
Argentina 6.5 4.9 6.2 5.4 8.6 8.1 10.7 5.3 4.6 6.7
Brazil 0.0 0.0 0.1 0.1 1.1 1.1 0.8 2.8 4.4 1.0 Notes: 1) The order of the countries in the table follows their 2009 market shares; 2) The market shares are in value terms; 3) World exports exclude intra EU-27 trade; 4) The EU figures refer to trade of the EU-27 with third countries throughout the period.
Source: COMTRADE.
Table 2.7 shows the market shares for the top five importers in world imports per dairy product.
Generally, imports have been more dispersed over importing countries and therefore the market shares
of the largest importers were lower than is the case for exports.
For butter, Russia and Mexico attracted about 10% each of the world’s imports in 2009, followed by the
USA, China and Ukraine. Particularly notable is China’s growing presence as an importer of butter over
the period 2000-2009. For cheese, the USA remained the largest importer but its import share declined
gradually after 2006, and only started recovering in 2009. Russia on the contrary was the main emerging
large importer and from 2007 onwards was the second largest importer. Japan and the EU are also big
cheese importers, but both have recorded declining shares of world imports.
As for milk powders, China is the only country among the top five importers that did not experience a
decline of its SMP and WMP imports. Its imports more than doubled over this last decade, making it an
important market destination for milk powder.

39
Table 2.7 World imports and market shares for the top 5 importers by dairy product
2000 2001 2002 2003 2004 2005 2006 2007 2008 2009
World imports, million USD
Butter/butter oil (HS 0405) 965 1,101 1,060 1,258 1,629 1,770 1,596 1,904 2,390 1,497
Cheese (HS 0406) 3,455 3,734 3,817 4,365 5,054 5,559 5,843 6,981 8,265 6,949
SMP (HS 040210) 1,807 2,188 1,727 1,904 2,346 2,486 2,413 3,996 4,297 2,559 WMP (HS 040221 + 040229) 2,189 2,655 2,178 2,341 2,733 3,561 3,987 4,899 6,315 4,007
World market shares, per cent
Butter and butteroil (HS 0405)
Russia 7.8 11.3 12.5 14.7 10.0 8.6 12.4 9.1 10.4 10.9
Mexico 6.0 6.0 6.6 6.5 8.9 10.3 7.0 8.3 7.5 10.1
USA 3.9 9.4 6.1 5.3 8.6 8.3 5.6 5.1 2.6 4.6
China 0.5 0.2 0.6 1.3 1.5 1.8 1.7 1.9 2.5 4.4
Ukraine 0.2 0.2 0.1 0.0 0.0 0.0 0.0 0.1 0.4 3.0 Cheese (HS 0406)
USA 21.1 21.0 21.9 21.3 20.3 19.1 18.3 16.6 14.7 15.1
Russia 1.8 4.5 6.2 8.1 9.1 11.9 10.2 12.1 13.0 12.8
Japan 15.9 14.9 15.1 13.1 13.8 13.2 12.4 12.0 12.1 11.7
EU (extra) 13.4 13.3 12.0 11.6 10.2 9.2 9.3 8.7 8.2 8.6
Australia 3.0 3.0 3.0 3.1 3.4 3.7 3.9 3.7 4.3 3.8 SMP (HS 040210)
Mexico 12.9 14.1 11.6 11.6 11.9 14.4 10.3 11.6 12.5 13.8
China 1.9 1.7 3.0 3.7 4.5 3.8 5.6 3.6 5.0 6.1
Japan 4.6 4.8 3.8 3.5 2.9 2.8 2.7 2.7 2.8 3.1
Russia 1.9 1.6 0.1 0.6 1.0 1.5 0.5 1.1 0.8 0.9
Brazil 3.0 1.1 1.7 0.6 0.3 0.5 0.8 0.3 0.6 0.9 WMP (HS 040221+040229)
China 3.7 2.9 5.0 6.2 6.1 3.9 3.9 3.7 2.9 10.6
Brazil 9.2 3.3 6.8 2.6 1.6 1.8 1.7 1.2 1.5 3.1
Mexico 2.8 4.6 3.0 3.5 2.4 2.9 2.5 3.0 1.7 1.3
USA 0.4 0.4 0.5 0.7 0.7 1.0 0.9 0.6 0.5 0.9
Australia 0.3 0.4 0.2 0.3 0.6 0.4 0.3 0.4 0.5 0.5 Notes: 1) The order of the countries in the table follows their 2009 market shares; 2) The market shares are in terms of values; 3) World exports exclude intra EU-27 trade; 4) The EU figures refer to trade of the EU-27 with third countries throughout the period.
Source: COMTRADE.
Figure 2.5 shows the evolution during 2000-2009 of net exports of the EU for four key dairy products,
notably cheese, butter, SMP and whole milk powder. The EU was a net exporter of dairy products
throughout the period and its net exports increased by 44%, because of both increasing exports and
declining imports, and this holds for all four products shown in the figure. The decline in imports from
third countries is partly because of the EU enlargement in 2004 (the intra-EU trade increased). The entry
of 10 new Member States coincides with an increase in the underlying level of cheese exports. The net
exports of whole milk powder declined, in particular after 2003. There is no clear pattern in the EU’s net
exports of SMP, which show significant fluctuations around a mean of 164 thousand tonnes. Net exports
of butter first increased to 116 thousand tonnes in 2005, then they declined to about 50 thousand
tonnes.
The variability of global demand has been particularly visible in recent dairy trade developments. The
global economic crisis and volatile world market prices in the second half of the decade disrupted the
smoother patterns observed in earlier years. The year 2010 was marked by food safety concerns in
China, which boosted Chinese imports of milk powders, by increased demand from Russia and southern
Asian countries, as well as by constrained supply in Oceania (in particular, New Zealand). These

40
developments affected EU trade and led to an increase of the EU milk powder exports (in particular
SMP).
Figure 2.5 EU net exports (1000 tonnes) of cheese, butter, skim milk powder (SMP) and whole milk powder (WMP), 2000-2009
-100
0
100
200
300
400
500
600
2000 2001 2002 2003 2004 2005 2006 2007 2008 2009
cheese
butter
SMP
WMP
Source: own calculations based on COMTRADE (data as reported in Tables 2.8 to 2.11).
Tables 2.8 to 2.11 show the EU’s exports and imports, separated into intra and extra EU trade, and
differentiated with respect to destination and origin. The EU increased its market share in the growing
domestic market for high value-added commodities, while gradually losing world market share primarily
for bulk commodities like SMP and WMP. With respect to cheese, the EU has been able to expand its
domestic trade and to maintain its share on the world market. Except for the exports of cheese, the
exports of the other products declined by -0.4% (butter), -2.6% (SMP), and -3.2% (whole milk powder)
respectively.
Table 2.8 EU trade in cheese (HS 0406), 2000-2009
Destination 2000 2001 2002 2003 2004 2005 2006 2007 2008 2009 EU1 exports of cheese and curd, 1000 tonnes Intra-EU (15/25/27) 2047 2343 1981 2273 2499 2696 2856 2980 3071 2900 Extra-EU 450 463 480 506 578 545 578 592 553 553 Extra-EU, of which Accession countries 22 18 25 26 4 5 7 Non-EU Europe 104 110 124 150 184 187 224 231 240 233 Russian Fed. 56 60 69 92 112 122 157 157 163 150 Switzerland 30 32 30 31 33 31 33 37 41 45 NAFTA 122 130 133 135 149 133 133 144 126 114 USA 97 102 104 110 125 112 112 120 103 96 Asia 55 62 60 66 77 68 69 73 60 65 Japan 46 51 48 51 57 50 48 45 35 37 Middle East 81 80 74 67 90 76 64 61 49 59 Saudi Arabia 37 36 33 28 38 32 26 24 17 18 Africa 28 30 32 35 44 47 49 48 48 53 Other America 25 23 23 18 19 16 20 20 16 16 Oceania 9 8 8 8 10 10 11 14 14 14 Rest of World 5 2 3 2 2 2 1 1 0 0
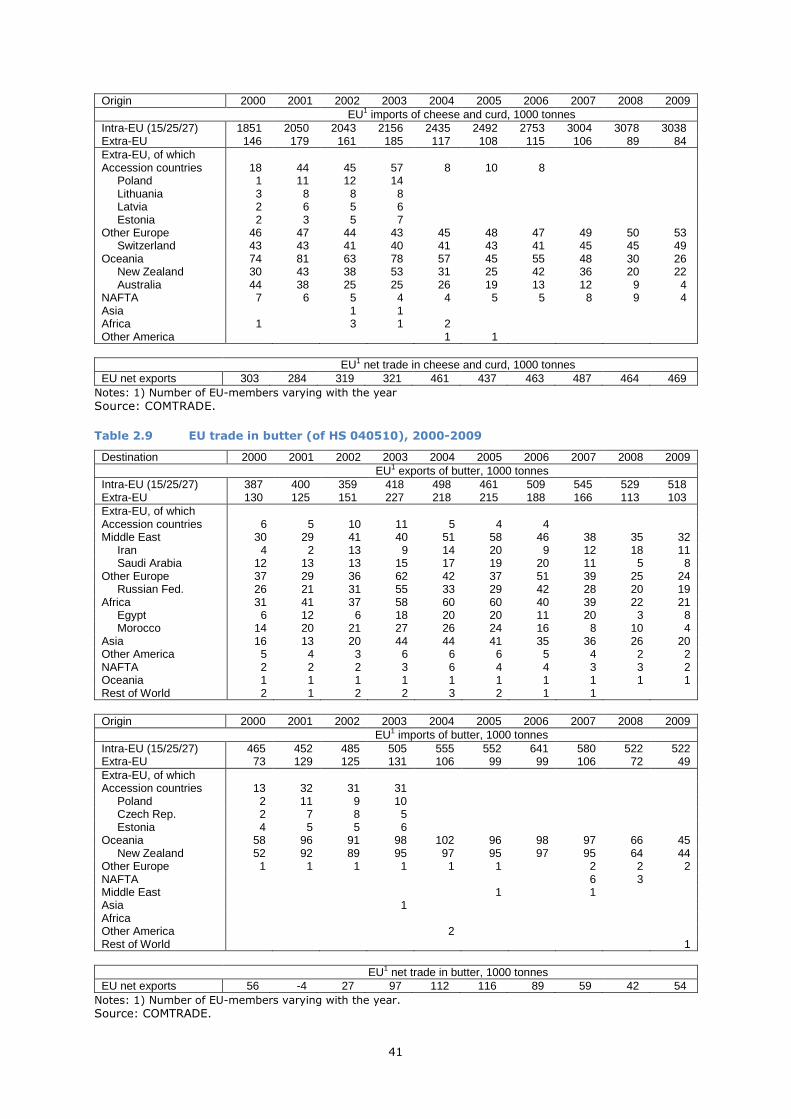
41
Origin 2000 2001 2002 2003 2004 2005 2006 2007 2008 2009 EU1 imports of cheese and curd, 1000 tonnes Intra-EU (15/25/27) 1851 2050 2043 2156 2435 2492 2753 3004 3078 3038 Extra-EU 146 179 161 185 117 108 115 106 89 84 Extra-EU, of which Accession countries 18 44 45 57 8 10 8 Poland 1 11 12 14 Lithuania 3 8 8 8 Latvia 2 6 5 6 Estonia 2 3 5 7 Other Europe 46 47 44 43 45 48 47 49 50 53 Switzerland 43 43 41 40 41 43 41 45 45 49 Oceania 74 81 63 78 57 45 55 48 30 26 New Zealand 30 43 38 53 31 25 42 36 20 22 Australia 44 38 25 25 26 19 13 12 9 4 NAFTA 7 6 5 4 4 5 5 8 9 4 Asia 1 1 Africa 1 3 1 2 Other America 1 1
EU1 net trade in cheese and curd, 1000 tonnes EU net exports 303 284 319 321 461 437 463 487 464 469
Notes: 1) Number of EU-members varying with the year Source: COMTRADE.
Table 2.9 EU trade in butter (of HS 040510), 2000-2009
Destination 2000 2001 2002 2003 2004 2005 2006 2007 2008 2009 EU1 exports of butter, 1000 tonnes Intra-EU (15/25/27) 387 400 359 418 498 461 509 545 529 518 Extra-EU 130 125 151 227 218 215 188 166 113 103 Extra-EU, of which Accession countries 6 5 10 11 5 4 4 Middle East 30 29 41 40 51 58 46 38 35 32 Iran 4 2 13 9 14 20 9 12 18 11 Saudi Arabia 12 13 13 15 17 19 20 11 5 8 Other Europe 37 29 36 62 42 37 51 39 25 24 Russian Fed. 26 21 31 55 33 29 42 28 20 19 Africa 31 41 37 58 60 60 40 39 22 21 Egypt 6 12 6 18 20 20 11 20 3 8 Morocco 14 20 21 27 26 24 16 8 10 4 Asia 16 13 20 44 44 41 35 36 26 20 Other America 5 4 3 6 6 6 5 4 2 2 NAFTA 2 2 2 3 6 4 4 3 3 2 Oceania 1 1 1 1 1 1 1 1 1 1 Rest of World 2 1 2 2 3 2 1 1
Origin 2000 2001 2002 2003 2004 2005 2006 2007 2008 2009 EU1 imports of butter, 1000 tonnes Intra-EU (15/25/27) 465 452 485 505 555 552 641 580 522 522 Extra-EU 73 129 125 131 106 99 99 106 72 49 Extra-EU, of which Accession countries 13 32 31 31 Poland 2 11 9 10 Czech Rep. 2 7 8 5 Estonia 4 5 5 6 Oceania 58 96 91 98 102 96 98 97 66 45 New Zealand 52 92 89 95 97 95 97 95 64 44 Other Europe 1 1 1 1 1 1 2 2 2 NAFTA 6 3 Middle East 1 1 Asia 1 Africa Other America 2 Rest of World 1
EU1 net trade in butter, 1000 tonnes EU net exports 56 -4 27 97 112 116 89 59 42 54
Notes: 1) Number of EU-members varying with the year. Source: COMTRADE.

42
Table 2.10 EU trade in skim milk powder (HS 040210), 2000-2009
Destination 2000 2001 2002 2003 2004 2005 2006 2007 2008 2009 EU1 exports of skim milk powder, 1000 tonnes Intra-EU (15/25/27) 526 450 413 479 556 537 559 542 534 493 Extra-EU 357 142 161 223 283 194 90 208 179 217 Extra-EU, of which Accession countries 5 2 3 4 6 4 4 Africa 95 58 69 68 106 82 43 88 112 108 Algeria 54 19 22 22 53 32 14 48 72 45 Egypt 10 11 12 14 16 14 7 5 6 28 Nigeria 10 10 9 11 14 16 11 14 13 11 Morocco 4 9 14 9 8 9 7 11 6 8 Asia 131 52 55 95 118 71 30 72 32 65 Indonesia 31 13 16 27 24 16 5 20 8 12 China 6 1 6 7 11 3 1 3 3 8 Thailand 21 9 11 16 31 21 7 15 6 7 Malaysia 17 7 4 13 14 5 2 13 2 7 Viet Nam 6 3 4 10 14 11 8 7 2 6 Philippines 28 7 4 7 10 4 6 1 3 Middle East 20 9 11 18 28 15 6 12 13 20 Other Europe 2 1 3 4 6 5 4 6 14 16 Russian Fed. 1 1 1 1 1 2 5 8 Other America 42 12 10 14 6 10 3 10 8 5 Cuba 15 5 4 7 3 1 3 1 1 NAFTA 61 8 10 19 13 6 1 14 3 Mexico 60 7 10 19 13 6 1 13 3
Origin 2000 2001 2002 2003 2004 2005 2006 2007 2008 2009 EU1 imports of skim milk powder, 1000 tonnes Intra-EU (15/25/27) 542 442 375 480 611 546 511 532 529 482 Extra-EU 86 66 76 102 31 10 20 15 8 5 Extra-EU, of which EU accession 48 31 45 46 Poland 14 8 18 18 Czech Rep. 13 8 6 6 Estonia 8 3 8 9 Hungary 1 2 4 4 Slovakia 4 3 4 4 Other Europe 32 34 12 4 6 4 3 8 1 2 Ukraine 18 22 2 1 1 Russian Fed. 9 7 1 Switzerland 5 1 6 3 4 4 2 1 1 Middle East 1 1 1 1 Oceania 3 1 16 47 4 5 3 1 New Zealand 16 47 3 4 2 1 NAFTA 2 3 22 4 11 5 5 Asia Rest of World. Other America 2 Africa
EU1 net trade in skim milk powder, 1000 tonnes EU net exports 271 76 84 121 252 184 70 192 171 213
Notes: 1) Number of EU-members varying with the year
Source: COMTRADE.

43
Table 2.11 EU trade in whole milk powder (HS 040221 + 040229), 2000-2009
Destination 2000 2001 2002 2003 2004 2005 2006 2007 2008 2009 EU1 exports of whole milk powder, 1000 tonnes Intra-EU (15/25/27) 219 208 229 251 286 278 330 320 342 272 Extra-EU 573 475 490 477 516 492 435 370 484 426 Extra-EU, of which Accession countries 5 3 4 3 3 2 3 Africa 209 196 226 230 230 233 235 179 218 203 Algeria 104 89 108 83 72 75 69 62 84 58 Nigeria 16 26 30 41 41 40 44 38 43 37 Egypt 10 6 5 9 11 8 8 8 6 14 Senegal 15 12 10 17 18 20 13 9 10 14 Angola 4 6 7 9 10 6 15 10 12 12 Middle East 161 150 141 122 174 132 119 102 157 136 Oman 13 31 14 14 19 21 20 20 54 45 Saudi Arabia 50 46 50 46 54 37 42 35 35 19 Lebanon 10 9 9 9 13 10 11 8 9 14 United Arab Em. 20 17 16 17 22 20 16 14 14 14 Iraq 31 11 11 3 30 4 1 2 9 11 Asia 54 43 36 48 43 59 27 39 35 39 China 3 1 3 1 1 1 1 5 8 Indonesia 4 4 3 7 5 4 3 9 7 6 Other America 127 79 67 66 59 61 46 42 68 38 Dominican Rep. 27 22 23 17 13 23 20 23 16 14 Venezuela 34 22 12 21 18 7 7 3 39 12 Cuba 20 3 4 6 10 13 6 3 1 Other Europe 3 2 2 2 6 4 4 3 5 8 NAFTA 7 1 14 5 1 1 0 1 1 1 Rest of World 5 Oceania 1
Origin 2000 2001 2002 2003 2004 2005 2006 2007 2008 2009 EU1 imports of whole milk powder, 1000 tonnes Intra-EU (15/25/27) 249 219 244 238 283 295 302 309 300 267 Extra-EU 8 20 19 17 4 3 3 2 1 3 Extra-EU: EU accession 7 18 16 14 Czech Rep. 3 3 4 3 Estonia 2 5 6 7 Poland 5 2 1 Rest of World 2 Other Europe 2 2 3 1 1 Oceania 1 2 3 1 1 2 1 1
EU1 net trade in whole milk powder, 1000 tonnes EU net exports 565 455 471 460 512 489 432 368 483 422
Notes: 1) Number of EU-members varying with the year
Source: COMTRADE.
2.2 EU dairy production and prices
2.2.1 Raw cow’s milk supply in the EU
Table 2.12 shows the evolution of raw cows’ milk production in the EU. Milk production has remained
rather stable during the last decade with Germany, France, UK and Poland being the main milk
producers, followed closely by the Netherlands and Italy.
Table 2.13 shows the evolution of milk collection per MS for the period 2000-2009. The distribution of
milk collection per MS is shown in Table 2.14. France and Germany are consistently the countries with
the largest volume of milk delivered to dairies, together accounting for about 40% of EU milk deliveries.
Italy, the Netherlands and the UK account for 25%, while Poland and Spain follow with around 10%.
Poland is the largest supplier among the new MS, with around 50% of collection in EU-12.

44
Table 2.12 Raw cows’ milk produced by member State, 2000-2009, 1000 t
2000 2001 2002 2003 2004 2005 2006 2007 2008 2009
Austria 3,233 3,300 3,292 3,230 3,137 3,114 3,147 3,155 3,196 3,230
Belgium 3,425 3,357 3,160 3,127 3,120 3,082 2,917 2,943 2,892 2,996
Denmark 4,719 4,553 4,590 4,659 4,568 4,627 4,619 4,656 4,814
Finland 2,524 2,530 2,532 2,472 2,449 2,433 2,413 2,356 2,311 2,332
France 24,929 24,862 25,254 24,667 24,452 24,675 24,367 23,426 24,272 23,341
Germany 28,332 28,191 27,874 28,533 28,245 28,453 27,995 28,403 28,656 29,199
Greece 789 778 758 768 762 761 764 774 787 753
Ireland 5,212 5,382 5,233 5,397 5,307 5,100 5,272 5,268 5,130 4,967
Italy 10,774 10,764 10,743 10,750 10,728 10,975 10,989 11,062 11,286 11,364
Luxembourg 264 270 271 267 269 270 268 274 278 284
Netherlands 10,966 11,291 10,677 11,075 10,905 10,846 10,995 11,128 11,620 11,791
Portugal 2,060 1,983 2,103 1,952 2,010 2,061 1,984 1,969 2,022 1,999
Spain 6,290 6,495 6,610 6,637 6,576 6,561 6,378 6,320 6,340 6,251
Sweden 3,348 3,339 3,274 3,253 3,275 3,206 3,130 2,986 2,987 2,933
United Kingdom 14,496 14,714 14,877 15,020 14,643 14,574 14,348 14,073 13,722 13,596
Cyprus 147 142 153 162 151 147 149 144 152 152
Czech Rep. 2,789 2,783 2,810 2,725 2,675 2,813 2,767 2,801 2,781
Estonia 630 684 611 611 652 670 692 692 694 671
Hungary 2,137 2,136 2,124 2,031 1,895 1,929 1,844 1,842 1,840 1,758
Latvia 823 846 812 783 784 807 812 838 832 828
Lithuania 1,713 1,718 1,765 1,789 1,842 1,854 1,885 1,931 1,879 1,787
Malta 45 45 43 40 42 41 41 41 40
Poland 11,889 11,884 11,873 11,892 11,822 11,923 11,982 12,096 12,425 12,447
Slovakia 1,099 1,147 1,198 1,142 1,079 1,100 1,092 1,075 1,057 957
Slovenia 649 653 686 664 650 659 642 666 654 626
Bulgaria 1,409 1,224 1,306 1,309 1,345 1,287 1,299 1,148 1,143 1,073
Romania 5,002 5,159 5,024 4,977 5,285 4,997 4,854 4,654
Total 149,693 150,229 144,627 144,955 148,407 144,318 148,081 144,225 148,526 147,582
EU-15 121,361 121,808 121,248 121,806 120,446 116,111 119,593 118,754 120,154 119,849
EU-10 21,921 22,038 22,073 21,840 21,592 21,942 21,905 19,325 22,375 22,006
EU-02 6,411 6,383 1,306 1,309 6,369 6,264 6,584 6,145 5,997 5,727
Source: Eurostat.
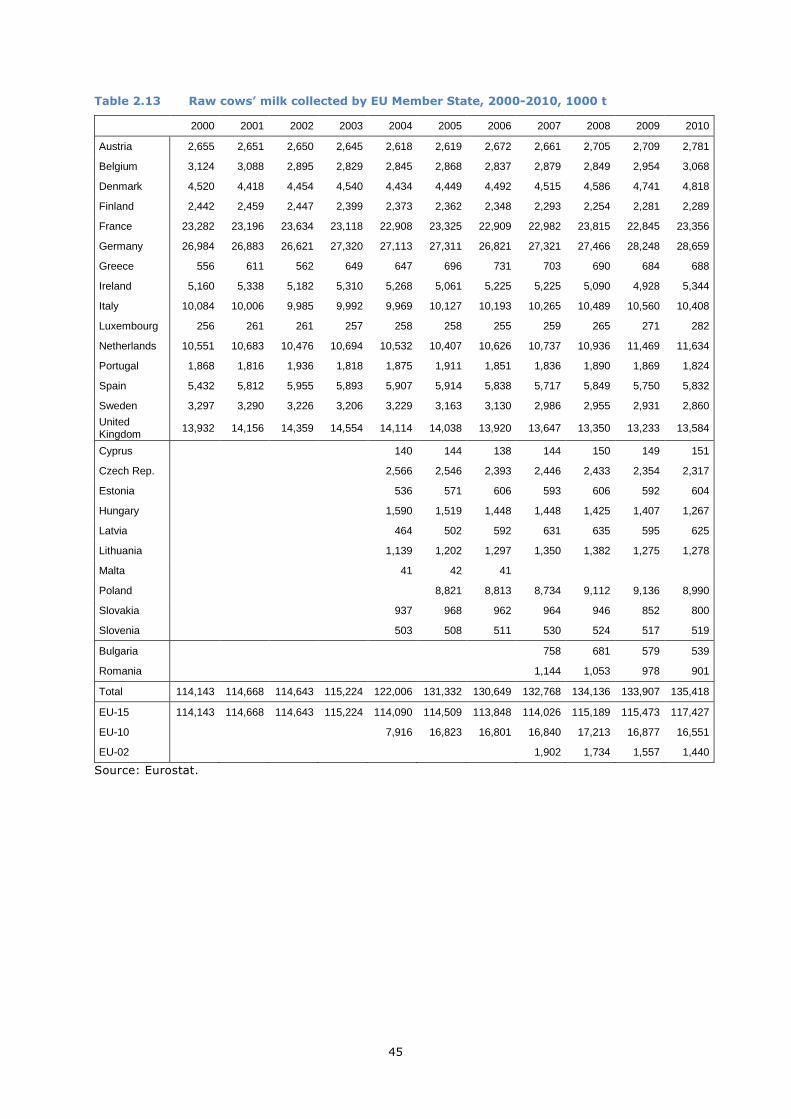
45
Table 2.13 Raw cows’ milk collected by EU Member State, 2000-2010, 1000 t
2000 2001 2002 2003 2004 2005 2006 2007 2008 2009 2010
Austria 2,655 2,651 2,650 2,645 2,618 2,619 2,672 2,661 2,705 2,709 2,781
Belgium 3,124 3,088 2,895 2,829 2,845 2,868 2,837 2,879 2,849 2,954 3,068
Denmark 4,520 4,418 4,454 4,540 4,434 4,449 4,492 4,515 4,586 4,741 4,818
Finland 2,442 2,459 2,447 2,399 2,373 2,362 2,348 2,293 2,254 2,281 2,289
France 23,282 23,196 23,634 23,118 22,908 23,325 22,909 22,982 23,815 22,845 23,356
Germany 26,984 26,883 26,621 27,320 27,113 27,311 26,821 27,321 27,466 28,248 28,659
Greece 556 611 562 649 647 696 731 703 690 684 688
Ireland 5,160 5,338 5,182 5,310 5,268 5,061 5,225 5,225 5,090 4,928 5,344
Italy 10,084 10,006 9,985 9,992 9,969 10,127 10,193 10,265 10,489 10,560 10,408
Luxembourg 256 261 261 257 258 258 255 259 265 271 282
Netherlands 10,551 10,683 10,476 10,694 10,532 10,407 10,626 10,737 10,936 11,469 11,634
Portugal 1,868 1,816 1,936 1,818 1,875 1,911 1,851 1,836 1,890 1,869 1,824
Spain 5,432 5,812 5,955 5,893 5,907 5,914 5,838 5,717 5,849 5,750 5,832
Sweden 3,297 3,290 3,226 3,206 3,229 3,163 3,130 2,986 2,955 2,931 2,860
United Kingdom 13,932 14,156 14,359 14,554 14,114 14,038 13,920 13,647 13,350 13,233 13,584
Cyprus 140 144 138 144 150 149 151
Czech Rep. 2,566 2,546 2,393 2,446 2,433 2,354 2,317
Estonia 536 571 606 593 606 592 604
Hungary 1,590 1,519 1,448 1,448 1,425 1,407 1,267
Latvia 464 502 592 631 635 595 625
Lithuania 1,139 1,202 1,297 1,350 1,382 1,275 1,278
Malta 41 42 41
Poland 8,821 8,813 8,734 9,112 9,136 8,990
Slovakia 937 968 962 964 946 852 800
Slovenia 503 508 511 530 524 517 519
Bulgaria 758 681 579 539
Romania 1,144 1,053 978 901
Total 114,143 114,668 114,643 115,224 122,006 131,332 130,649 132,768 134,136 133,907 135,418
EU-15 114,143 114,668 114,643 115,224 114,090 114,509 113,848 114,026 115,189 115,473 117,427
EU-10 7,916 16,823 16,801 16,840 17,213 16,877 16,551
EU-02 1,902 1,734 1,557 1,440
Source: Eurostat.

46
Table 2.14 Share (%) of raw cow milk collected by EU Member State, 2000-2010
2000 2001 2002 2003 2004 2005 2006 2007 2008 2009 2010
Austria 2.33 2.31 2.31 2.30 2.29 2.29 2.35 2.33 2.35 2.35 2.37
Belgium 2.74 2.69 2.53 2.46 2.49 2.50 2.49 2.52 2.47 2.56 2.61
Denmark 3.96 3.85 3.89 3.94 3.89 3.89 3.95 3.96 3.98 4.11 4.10
Finland 2.14 2.14 2.13 2.08 2.08 2.06 2.06 2.01 1.96 1.98 1.95
France 20.40 20.23 20.62 20.06 20.08 20.37 20.12 20.16 20.67 19.78 19.89
Germany 23.64 23.44 23.22 23.71 23.76 23.85 23.56 23.96 23.84 24.46 24.41
Greece 0.49 0.53 0.49 0.56 0.57 0.61 0.64 0.62 0.60 0.59 0.59
Ireland 4.52 4.66 4.52 4.61 4.62 4.42 4.59 4.58 4.42 4.27 4.55
Italy 8.83 8.73 8.71 8.67 8.74 8.84 8.95 9.00 9.11 9.14 8.86
Luxembourg 0.22 0.23 0.23 0.22 0.23 0.23 0.22 0.23 0.23 0.23 0.24
Netherlands 9.24 9.32 9.14 9.28 9.23 9.09 9.33 9.42 9.49 9.93 9.91
Portugal 1.64 1.58 1.69 1.58 1.64 1.67 1.63 1.61 1.64 1.62 1.55
Spain 4.76 5.07 5.19 5.11 5.18 5.16 5.13 5.01 5.08 4.98 4.97
Sweden 2.89 2.87 2.81 2.78 2.83 2.76 2.75 2.62 2.57 2.54 2.44
United Kingdom 12.21 12.35 12.52 12.63 12.37 12.26 12.23 11.97 11.59 11.46 11.57
EU-15 100.00 100.00 100.00 100.00 100.00 100.00 100.00 100.00 100.00 100.00 100.00
Cyprus 1.77 0.86 0.82 0.86 0.87 0.88 0.91
Czech Rep. 32.42 15.13 14.24 14.52 14.13 13.95 14.00
Estonia 6.77 3.39 3.61 3.52 3.52 3.51 3.65
Hungary 20.09 9.03 8.62 8.60 8.28 8.34 7.66
Latvia 5.86 2.98 3.52 3.75 3.69 3.53 3.78
Lithuania 14.39 7.14 7.72 8.02 8.03 7.55 7.72
Malta 0.52 0.25 0.24 0.00 0.00 0.00 0.00
Poland 0.00 52.43 52.46 51.86 52.94 54.13 54.32
Slovakia 11.84 5.75 5.73 5.72 5.50 5.05 4.83
Slovenia 6.35 3.02 3.04 3.15 3.04 3.06 3.14
EU-10 100.00 100.00 100.00 100.00 100.00 100.00 100.00
Bulgaria 39.85 39.27 37.19 37.43
Romania 60.15 60.73 62.81 62.57
EU-02 100.00 100.00 100.00 100.00
Total (1000t)
114,143 114,668 114,643 115,224 122,006 131,332 130,649 132,768 134,136 133,907 135,418
EU-15 100.00 100.00 100.00 100.00 93.51 87.19 87.14 85.88 85.87 86.23 86.71
EU-10 6.49 12.81 12.86 12.68 12.83 12.60 12.22
EU-02 1.43 1.29 1.16 1.06
Total 100.00 100.00 100.00 100.00 100.00 100.00 100.00 100.00 100.00 100.00 100.00
Source: own calculations.
Figure 2.6 provides a more detailed overview of the geographical changes in EU milk production
since 1996 at NUTS2 level (comparison of annual growth rates in milk production for sub periods
1996-2003 and 2003-2008). Note that where milk quota are binding and fixed an increase in one
location has to be matched by a decrease elsewhere (in reality quota have been increased, be it at
modest rates). As such Figure 2.6 illustrates the extent to which milk production is migrating within
Member States. An illustrative example is the increase of milk production in the West of France The
first is the West of France (consisting of the regions Bretagne, Basse-Normandie and Pays-de-la-
Loire), which together now produce 45% of the total national milk supply. The graph also suggests
that on average the increase in milk production has slowed down in the period 2003-2008 as
compared to the period 1996-2003.

47
Figure 2.6 Geographical changes in milk production in the EU at NUTS2 level: comparison of periods 1996-2003 and 2003-2008
Note: Data for two Scottish regions were missing.
Source: Eurostat (FSS).

48
Table 2.15 shows the share of on-farm use and direct sales in total cows’ milk production. The on-farm
use and direct sales are derived as the difference between milk produced and milk delivered to dairies.
This share tends to be higher in the new Member States (EU-10 and EU-02) compared to EU-15.
Although there are marked differences between Member States in EU-15, with Austria having the highest
share and Sweden and Ireland the lowest, within each Member State shares remained relatively stable,
with just a slight downward trend. By contrast, it fell significantly in almost all new MS apart from the
Czech Republic and Hungary. However, the share of on-farm use and direct sales in 2009 were still
generally higher (and hence that of deliveries to dairies lower) compared to EU-15 at the end of the
period. Romania stands out in that most cows’ milk produced milk is not delivered to dairies.
Table 2.15 Share (%) of on-farm use and direct sales in total cows’ milk production by Member State, 2000-2009
2000 2001 2002 2003 2004 2005 2006 2007 2008 2009
Austria 17.7 19.6 19.5 18.1 16.6 15.8 15.0 15.6 15.0 15.9
Belgium 8.8 8.0 8.4 9.5 8.8 6.9 2.7 2.2 1.5 1.4
Denmark 4.2 3.0 2.9 2.9 3.0 2.9 2.9 1.6 1.7
Finland 3.2 3.2 3.4 3.2 3.1 2.9 2.7 2.7 2.5 2.2
France 6.5 6.6 6.4 6.3 6.3 5.2 6.0 1.9 2.0 1.9
Germany 4.8 4.6 4.6 4.3 4.0 3.8 4.0 3.8 4.2 6.0
Greece 15.1 9.3 10.6 13.9 9.9 13.3 12.3 7.5 10.3 9.0
Ireland 1.0 0.8 0.8 0.8 0.7 0.8 0.7 0.5 0.5 0.5
Italy 6.4 7.0 7.1 7.1 6.8 6.9 7.2 7.2 7.1 7.6
Luxembourg 3.2 3.2 3.6 3.8 4.0 4.3 4.9 5.4 4.6 4.5
Netherlands 2.2 4.1 3.0 3.4 3.2 3.4 3.1 3.0 2.8 2.7
Portugal 8.1 8.1 8.1 6.8 6.8 6.8 6.7 6.7 6.7 6.5
Spain 13.9 11.3 10.2 11.5 10.6 10.1 8.7 9.3 8.0 8.1
Sweden 1.5 1.5 1.5 1.4 1.4 1.3 0.0 0.0 0.0 0.0
United Kingdom 3.9 3.8 3.5 3.1 3.6 3.7 3.0 3.0 2.7 2.6
Cyprus 7.9 7.4 7.1 7.4 7.5 1.6 6.5 0.0 0.2 0.1
Czech Rep. 8.2 7.3 7.8 4.6 4.2 9.6 13.5 13.1 15.3
Estonia 35.0 37.4 19.0 20.6 17.8 14.7 12.4 14.2 12.6 8.7
Hungary 14.4 8.2 10.3 15.4 18.6 21.3 21.5 21.4 22.5 20.0
Latvia 51.0 66.3 52.6 44.3 39.0 37.8 27.1 24.8 23.8 28.1
Lithuania 44.7 42.9 45.0 42.6 38.1 35.2 31.2 30.2 26.8
Malta 0.7 0.2 0.0 0.0 2.1 0.0 0.0 0.0 0.0 0.0
Poland 43.0 39.1 37.4 36.6 31.0 26.0 26.3 27.7 28.4 26.6
Slovakia 15.4 14.5 16.4 14.8 13.1 12.0 11.9 10.3 10.6 11.0
Slovenia 30.5 29.2 29.7 24.9 22.6 22.9 20.4 20.4 19.8 17.3
Bulgaria 49.0 43.1 42.5 37.7 40.7 37.6 35.4 35.1 35.3 34.3
Romania 83.1 83.6 79.7 77.7 78.6 77.3 78.3 78.7
Total 12.8 12.5 9.0 8.7 11.0 7.5 10.4 7.9 9.5 9.1
EU-15 5.7 5.7 5.5 5.4 5.2 1.2 4.8 3.9 3.8 4.3
EU-10 33.9 31.5 30.0 29.2 25.8 23.3 23.2 12.6 23.9 19.1
EU-02 75.6 75.8 71.5 69.5 70.0 69.4 70.1 70.4
Source: own calculations based on Eurostat (data as reported in Tables 2.12 and 2.14).
The different trends between the EU-15 and the EU-10 on on-farm use and direct sales of milk imply
differences in consumption and supply and trends. The rather stable proportion in EU-15 indicates
mature marketing structures adapted to national preferences for direct sales of milk an farm-produced
dairy products. The marked decrease for many New Member States after their accession to the EU (or

49
even in anticipation of that event) suggests increasing commercialisation of dairying and integration of
the supply chain for dairy products.
Table 2.16 indicates where milk other than cows’ milk is produced in the EU. Greece, Bulgaria, France
and Spain are the main EU producers of sheep and goat milk, while Italy is the largest buffalo milk
producer.
Table 2.16 Milk collected, EU Member State totals and shares of national totals by animal
type, 2009
Total volume
collected
Volume by animal type Share of total by animal type
Cows Sheep Goat Buffalo Cows Sheep Goat Buffalo
Thousand tonnes Per cent
Austria 2,724.7 2,715.6 3.4 5.8 99.7 0.1 0.2
Belgium 2,962.6 2,954.4 8.1 99.7 0.3
Bulgaria 641.9 599.9 33.4 6.5 2.2 93.5 5.2 1.0 0.3
Cyprus 190.0 152.1 19.4 18.6 80.0 10.2 9.8
Spain 6,457.6 5,742.1 373.5 341.9 0.1 88.9 5.8 5.3 0.0
France 23,646.8 22,898.2 251.5 497.1 96.8 1.1 2.1
Greece 1,368.8 685.0 529.7 154.1 50.0 38.7 11.3
Hungary 1,407.8 1,407.1 0.7 100.0 0.1
Italy 11,138.1 10,500.0 440.7 22.6 174.9 94.3 4.0 0.2 1.6
Netherlands 11,655.6 11,468.6 98.4 1.6
Poland 9,141.6 9,140.0 0.1 1.5 100.0 0.0 0.0
Portugal 1,900.5 1,867.6 21.2 11.7 98.3 1.1 0.6
Romania 1,011.5 991.6 13.7 4.0 2.1 98.0 1.4 0.4 0.2
Slovakia 856.9 852.4 4.6 99.5 0.5
EU-02 1,653.4 1,591.5 47.1 10.5 4.3 96.3 2.9 0.6 0.3
EU-10 12,113.2 12,068.3 24.7 20.1 99.6 0.2 0.2
EU-15 61,854.7 58,831.5 1,619.9 1,228.3 175.0 95.1 2.6 2.0 0.3
EU-27 75,621.3 72,491.3 1,691.8 1,258.9 179.3 95.9 2.2 1.7 0.2
Source: Eurostat.
Table 2.17 looks at trends in the fat and protein content of raw cows’ milk delivered to dairies over the
last decade. The fat content of the milk produced in the EU-15 remained almost stable with small
variations among the years but no real trend. In the new Member States, fat content increased except in
Poland. Among the Member States with the higher levels of fat content are Poland, Denmark and
Germany. On average, fat content in the EU-10 tends to be a little higher than in EU-15, whereas it is
considerably lower in Romania and Bulgaria. The variations in the protein content between 2000 and
2009 have been even smaller. There was, however, a slight upward trend over the whole period.
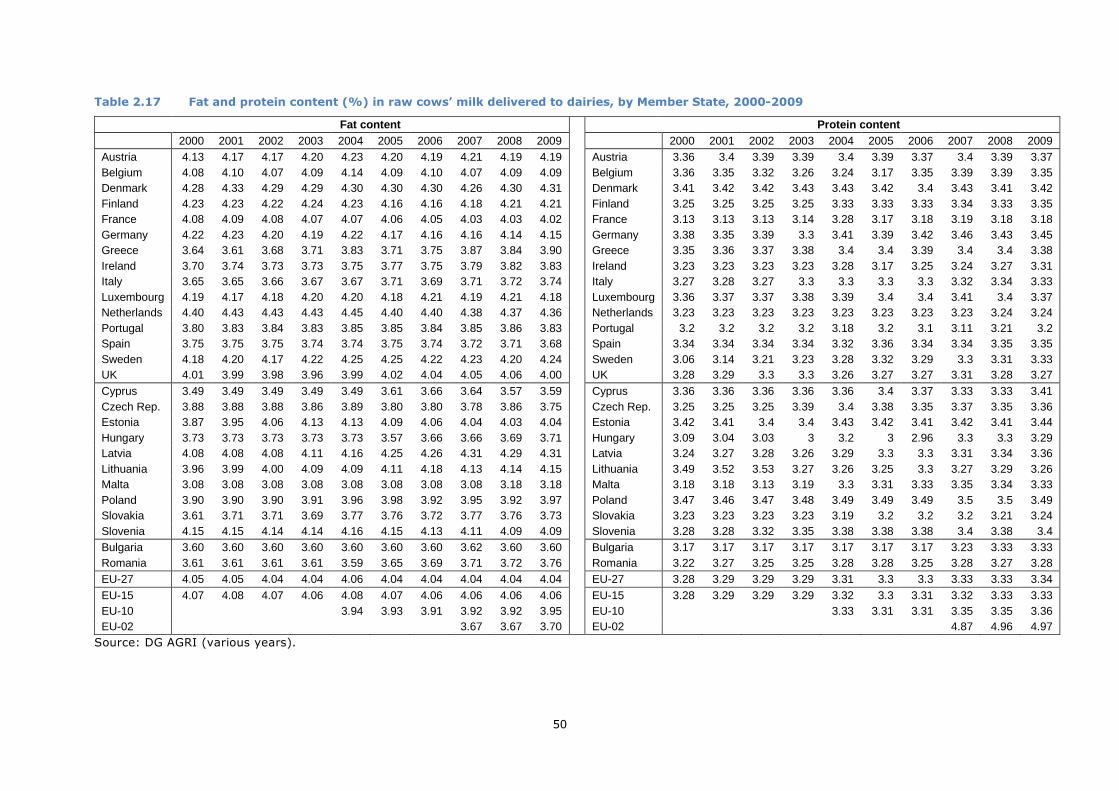
50
Table 2.17 Fat and protein content (%) in raw cows’ milk delivered to dairies, by Member State, 2000-2009
Fat content Protein content 2000 2001 2002 2003 2004 2005 2006 2007 2008 2009 2000 2001 2002 2003 2004 2005 2006 2007 2008 2009 Austria 4.13 4.17 4.17 4.20 4.23 4.20 4.19 4.21 4.19 4.19 Austria 3.36 3.4 3.39 3.39 3.4 3.39 3.37 3.4 3.39 3.37 Belgium 4.08 4.10 4.07 4.09 4.14 4.09 4.10 4.07 4.09 4.09 Belgium 3.36 3.35 3.32 3.26 3.24 3.17 3.35 3.39 3.39 3.35 Denmark 4.28 4.33 4.29 4.29 4.30 4.30 4.30 4.26 4.30 4.31 Denmark 3.41 3.42 3.42 3.43 3.43 3.42 3.4 3.43 3.41 3.42 Finland 4.23 4.23 4.22 4.24 4.23 4.16 4.16 4.18 4.21 4.21 Finland 3.25 3.25 3.25 3.25 3.33 3.33 3.33 3.34 3.33 3.35 France 4.08 4.09 4.08 4.07 4.07 4.06 4.05 4.03 4.03 4.02 France 3.13 3.13 3.13 3.14 3.28 3.17 3.18 3.19 3.18 3.18 Germany 4.22 4.23 4.20 4.19 4.22 4.17 4.16 4.16 4.14 4.15 Germany 3.38 3.35 3.39 3.3 3.41 3.39 3.42 3.46 3.43 3.45 Greece 3.64 3.61 3.68 3.71 3.83 3.71 3.75 3.87 3.84 3.90 Greece 3.35 3.36 3.37 3.38 3.4 3.4 3.39 3.4 3.4 3.38 Ireland 3.70 3.74 3.73 3.73 3.75 3.77 3.75 3.79 3.82 3.83 Ireland 3.23 3.23 3.23 3.23 3.28 3.17 3.25 3.24 3.27 3.31 Italy 3.65 3.65 3.66 3.67 3.67 3.71 3.69 3.71 3.72 3.74 Italy 3.27 3.28 3.27 3.3 3.3 3.3 3.3 3.32 3.34 3.33 Luxembourg 4.19 4.17 4.18 4.20 4.20 4.18 4.21 4.19 4.21 4.18 Luxembourg 3.36 3.37 3.37 3.38 3.39 3.4 3.4 3.41 3.4 3.37 Netherlands 4.40 4.43 4.43 4.43 4.45 4.40 4.40 4.38 4.37 4.36 Netherlands 3.23 3.23 3.23 3.23 3.23 3.23 3.23 3.23 3.24 3.24 Portugal 3.80 3.83 3.84 3.83 3.85 3.85 3.84 3.85 3.86 3.83 Portugal 3.2 3.2 3.2 3.2 3.18 3.2 3.1 3.11 3.21 3.2 Spain 3.75 3.75 3.75 3.74 3.74 3.75 3.74 3.72 3.71 3.68 Spain 3.34 3.34 3.34 3.34 3.32 3.36 3.34 3.34 3.35 3.35 Sweden 4.18 4.20 4.17 4.22 4.25 4.25 4.22 4.23 4.20 4.24 Sweden 3.06 3.14 3.21 3.23 3.28 3.32 3.29 3.3 3.31 3.33 UK 4.01 3.99 3.98 3.96 3.99 4.02 4.04 4.05 4.06 4.00 UK 3.28 3.29 3.3 3.3 3.26 3.27 3.27 3.31 3.28 3.27 Cyprus 3.49 3.49 3.49 3.49 3.49 3.61 3.66 3.64 3.57 3.59 Cyprus 3.36 3.36 3.36 3.36 3.36 3.4 3.37 3.33 3.33 3.41 Czech Rep. 3.88 3.88 3.88 3.86 3.89 3.80 3.80 3.78 3.86 3.75 Czech Rep. 3.25 3.25 3.25 3.39 3.4 3.38 3.35 3.37 3.35 3.36 Estonia 3.87 3.95 4.06 4.13 4.13 4.09 4.06 4.04 4.03 4.04 Estonia 3.42 3.41 3.4 3.4 3.43 3.42 3.41 3.42 3.41 3.44 Hungary 3.73 3.73 3.73 3.73 3.73 3.57 3.66 3.66 3.69 3.71 Hungary 3.09 3.04 3.03 3 3.2 3 2.96 3.3 3.3 3.29 Latvia 4.08 4.08 4.08 4.11 4.16 4.25 4.26 4.31 4.29 4.31 Latvia 3.24 3.27 3.28 3.26 3.29 3.3 3.3 3.31 3.34 3.36 Lithuania 3.96 3.99 4.00 4.09 4.09 4.11 4.18 4.13 4.14 4.15 Lithuania 3.49 3.52 3.53 3.27 3.26 3.25 3.3 3.27 3.29 3.26 Malta 3.08 3.08 3.08 3.08 3.08 3.08 3.08 3.08 3.18 3.18 Malta 3.18 3.18 3.13 3.19 3.3 3.31 3.33 3.35 3.34 3.33 Poland 3.90 3.90 3.90 3.91 3.96 3.98 3.92 3.95 3.92 3.97 Poland 3.47 3.46 3.47 3.48 3.49 3.49 3.49 3.5 3.5 3.49 Slovakia 3.61 3.71 3.71 3.69 3.77 3.76 3.72 3.77 3.76 3.73 Slovakia 3.23 3.23 3.23 3.23 3.19 3.2 3.2 3.2 3.21 3.24 Slovenia 4.15 4.15 4.14 4.14 4.16 4.15 4.13 4.11 4.09 4.09 Slovenia 3.28 3.28 3.32 3.35 3.38 3.38 3.38 3.4 3.38 3.4 Bulgaria 3.60 3.60 3.60 3.60 3.60 3.60 3.60 3.62 3.60 3.60 Bulgaria 3.17 3.17 3.17 3.17 3.17 3.17 3.17 3.23 3.33 3.33 Romania 3.61 3.61 3.61 3.61 3.59 3.65 3.69 3.71 3.72 3.76 Romania 3.22 3.27 3.25 3.25 3.28 3.28 3.25 3.28 3.27 3.28 EU-27 4.05 4.05 4.04 4.04 4.06 4.04 4.04 4.04 4.04 4.04 EU-27 3.28 3.29 3.29 3.29 3.31 3.3 3.3 3.33 3.33 3.34 EU-15 4.07 4.08 4.07 4.06 4.08 4.07 4.06 4.06 4.06 4.06 EU-15 3.28 3.29 3.29 3.29 3.32 3.3 3.31 3.32 3.33 3.33 EU-10 3.94 3.93 3.91 3.92 3.92 3.95 EU-10 3.33 3.31 3.31 3.35 3.35 3.36 EU-02 3.67 3.67 3.70 EU-02 4.87 4.96 4.97
Source: DG AGRI (various years).

51
Table 2.18 shows the trends in raw milk producer prices between 2001 and 2009. On average, producer
prices have been higher in the EU-15 than in the EU-10 and the EU-02, with Cyprus being the only new
MS with relatively high producer prices. Among Member States of the EU-15, those with the higher prices
are Finland, Greece, Italy and France.
Table 2.18 Producer prices for raw cows’ milk by Member State, 2001-2009, €/t
2001 2002 2003 2004 2005 2006 2007 2008 2009
Austria 334 316 297 296 295 300 340 388 290
Belgium 320 291 273 288 276 270 346 320 237
Denmark 343 342 326 306 291 290 317 372 275
Finland 355 362 362 354 346 359 376 457 396
France 317 308 304 316 306 293 315 363 298
Germany 342 311 297 292 286 270 326 335 237
Greece 330 340 344 358 361 350 387 432 377
Ireland 289 269 275 289 284 272 349 355 247
Italy 386 388 352 350 338 321 344 374 306
Luxembourg 343 334 327 323 308 305 361 376 268
Netherlands 341 328 315 294 287 278 328 359 268
Portugal 328 330 329 334 286 274 317 363 290
Spain 307 287 287 308 303 296 353 379 292
Sweden 322 332 338 321 295 287 313 360 262
United Kingdom 301 266 255 268 267 256 294 315 258
Cyprus 367 396 401 404 415 496 511
Czech Rep. 238 246 271 269 295 329 226
Estonia 185 239 254 243 269 297 211
Hungary 274 248 255 236 286 322 215
Latvia 135 174 212 235 264 276 187
Lithuania 139 169 198 204 244 255 182
Malta 413 400 349
Poland 159 193 249 254 295 303 222
Slovakia 215 229 246 250 290 323 209
Slovenia 294 284 262 264 280 330 25
Bulgaria 250 315 254
Romania 204
EU-151 331 320 312 313 302 295 338 370 287
EU-101 172 180 157 188 209 159
EU-021 223
Notes: The prices for the EU-15, EU-10 and EU-02 have been calculated as simple arithmetic averages of the prices per relevant MS.
Source: DG AGRI (various years).
There are differences in milk price trends for the EU-15 and the EU-10. Between 2000 and 2006, milk
prices declined in 13 out of the 15 MS in EU-15, with the decline ranging from -3% in Spain to -21% in
Germany. By contrast, EU-10 milk prices increased substantially, approaching the price level of the EU-
15. During 2006 and 2008, however, prices increased in all MS with price increases varying from 19%
(Belgium, Poland) to 36% (Hungary). Thereafter, in 2009, prices dropped sharply, with significant
consequences for shorter-term profitability and causing great concern in the milk-producing sector.

52
2.2.2 Supply of dairy products in the EU
This section reports the trends in production of drinking milk, cheese, butter, whole milk powder (WMP)
and skim milk powder (SMP) over the last decade. The reader should note that regional EU aggregates
are not always complete given the lack of data at MS level for certain commodities. Furthermore, for
drinking milk and cheese, the information concerns only the produced quantities.
Butter
Table 2.19 Production of butter in the EU MS, 2000-2010, 1000 t
2000 2001 2002 2003 2004 2005 2006 2007 2008 2009 2010
Austria 36 36 33 33 32 30 32 34 33 32 33
Belgium 121 99 100 114 117 110 104 101 87 91 81
Denmark 46 47 49 53 47 44 38 36 38 37 34
Finland 62 61 61 58 58 57 57 55 54 56 52
France 452 455 456 435 418 420 408 412 434 416 408
Germany 425 420 435 452 444 455 438 445 465 453 449
Greece 1 1 1 1 1 1 1 1 1 1 1
Ireland 144 140 142 147 144 145 141 143 126 123 138
Italy 133 122 124 124 121 130 120 115 106 107 95
Luxembourg
Netherlands 128 132 119 117 102 100 106 129 131 128 126
Portugal 25 24 28 26 26 27 29 28 30 29 26
Spain 39 32 55 52 50 58 46 38 40 37 38
Sweden 42 37 42 30 41 34 30 27 28 30 24
United Kingdom 132 126 136 131 122 130 117 121 113 120 119
Cyprus 1
Czech Rep. 48 42 41 37 36 34 27
Estonia 8 7 7 7 9
Hungary 10 11 8 8 8 8 9
Latvia 5 7 7 7 6 6 5
Lithuania 16 13 14 14 12 15 11
Malta
Poland 173 159 161 157 140 139
Slovakia 11 8 9 10 10 8 8
Slovenia 4 3 2 2 3
Bulgaria 2 1 1 1
Romania 8 8 10 10
Total 1,786 1,732 1,781 1,773 1,825 1,996 1,912 1,942 1,933 1,893 1,837
EU-15 1,786 1,732 1,781 1,773 1,723 1,741 1,667 1,685 1,686 1,660 1,624
EU-10 255 245 247 238 222 202
EU-02 10 9 11 11
Source: Eurostat.
As shown in Table 2.19, EU butter production remained relatively stable in the period 2000-2003, after
which it increased due to enlargement, but towards the end of the period it began to decline again.
France and Germany produced most of the EU’s butter (average market shares are 23% and 24%
respectively), followed by a second group of relatively larger producers, namely Ireland, the Netherlands,
Italy, United Kingdom and Poland. Production in EU-15 declined by about 1.4% per annum since 2005.
In the EU-10 during the period 2005-2010 the annual decline was about 4.5%. This is related to the
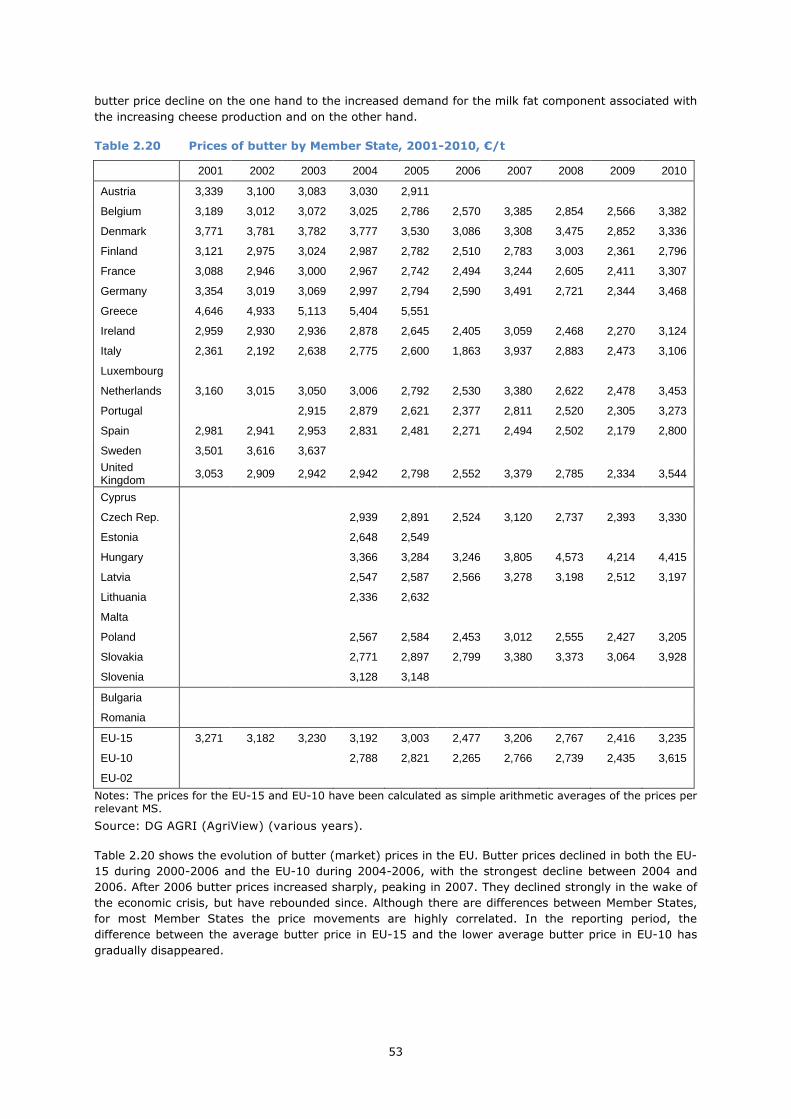
53
butter price decline on the one hand to the increased demand for the milk fat component associated with
the increasing cheese production and on the other hand.
Table 2.20 Prices of butter by Member State, 2001-2010, €/t
2001 2002 2003 2004 2005 2006 2007 2008 2009 2010
Austria 3,339 3,100 3,083 3,030 2,911
Belgium 3,189 3,012 3,072 3,025 2,786 2,570 3,385 2,854 2,566 3,382
Denmark 3,771 3,781 3,782 3,777 3,530 3,086 3,308 3,475 2,852 3,336
Finland 3,121 2,975 3,024 2,987 2,782 2,510 2,783 3,003 2,361 2,796
France 3,088 2,946 3,000 2,967 2,742 2,494 3,244 2,605 2,411 3,307
Germany 3,354 3,019 3,069 2,997 2,794 2,590 3,491 2,721 2,344 3,468
Greece 4,646 4,933 5,113 5,404 5,551
Ireland 2,959 2,930 2,936 2,878 2,645 2,405 3,059 2,468 2,270 3,124
Italy 2,361 2,192 2,638 2,775 2,600 1,863 3,937 2,883 2,473 3,106
Luxembourg
Netherlands 3,160 3,015 3,050 3,006 2,792 2,530 3,380 2,622 2,478 3,453
Portugal 2,915 2,879 2,621 2,377 2,811 2,520 2,305 3,273
Spain 2,981 2,941 2,953 2,831 2,481 2,271 2,494 2,502 2,179 2,800
Sweden 3,501 3,616 3,637
United Kingdom 3,053 2,909 2,942 2,942 2,798 2,552 3,379 2,785 2,334 3,544
Cyprus
Czech Rep. 2,939 2,891 2,524 3,120 2,737 2,393 3,330
Estonia 2,648 2,549
Hungary 3,366 3,284 3,246 3,805 4,573 4,214 4,415
Latvia 2,547 2,587 2,566 3,278 3,198 2,512 3,197
Lithuania 2,336 2,632
Malta
Poland 2,567 2,584 2,453 3,012 2,555 2,427 3,205
Slovakia 2,771 2,897 2,799 3,380 3,373 3,064 3,928
Slovenia 3,128 3,148
Bulgaria
Romania
EU-15 3,271 3,182 3,230 3,192 3,003 2,477 3,206 2,767 2,416 3,235
EU-10 2,788 2,821 2,265 2,766 2,739 2,435 3,615
EU-02
Notes: The prices for the EU-15 and EU-10 have been calculated as simple arithmetic averages of the prices per relevant MS.
Source: DG AGRI (AgriView) (various years).
Table 2.20 shows the evolution of butter (market) prices in the EU. Butter prices declined in both the EU-
15 during 2000-2006 and the EU-10 during 2004-2006, with the strongest decline between 2004 and
2006. After 2006 butter prices increased sharply, peaking in 2007. They declined strongly in the wake of
the economic crisis, but have rebounded since. Although there are differences between Member States,
for most Member States the price movements are highly correlated. In the reporting period, the
difference between the average butter price in EU-15 and the lower average butter price in EU-10 has
gradually disappeared.
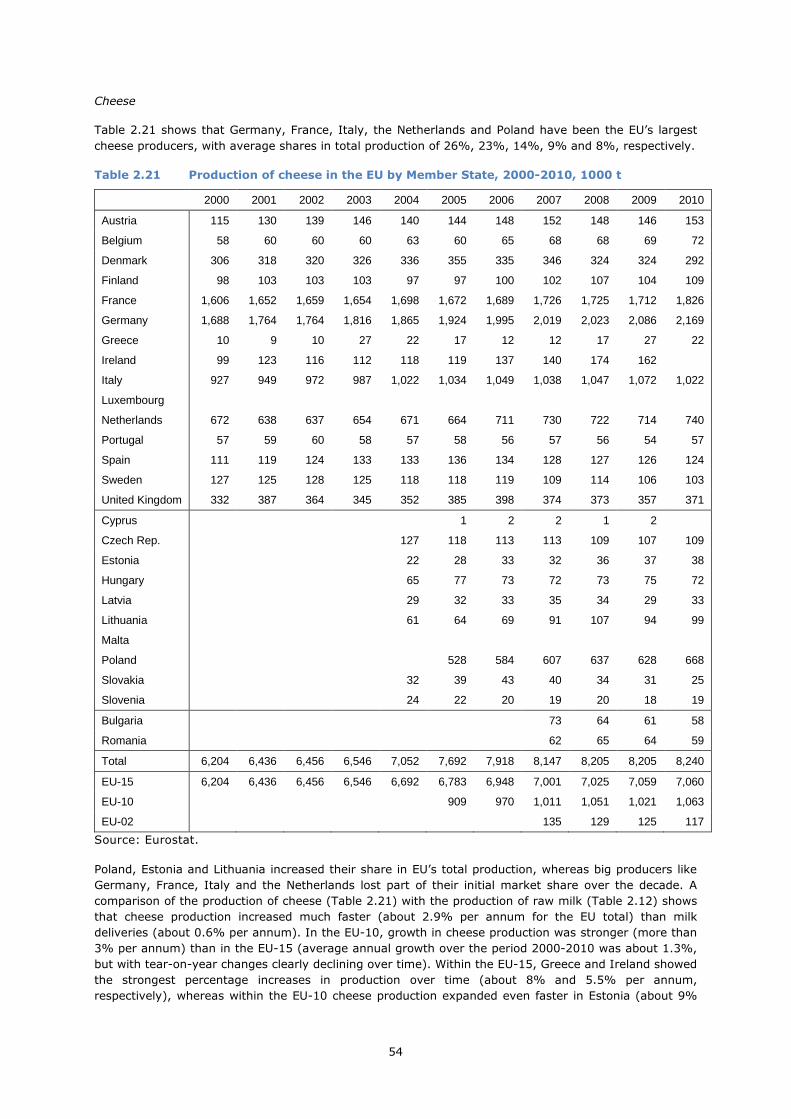
54
Cheese
Table 2.21 shows that Germany, France, Italy, the Netherlands and Poland have been the EU’s largest
cheese producers, with average shares in total production of 26%, 23%, 14%, 9% and 8%, respectively.
Table 2.21 Production of cheese in the EU by Member State, 2000-2010, 1000 t
2000 2001 2002 2003 2004 2005 2006 2007 2008 2009 2010
Austria 115 130 139 146 140 144 148 152 148 146 153
Belgium 58 60 60 60 63 60 65 68 68 69 72
Denmark 306 318 320 326 336 355 335 346 324 324 292
Finland 98 103 103 103 97 97 100 102 107 104 109
France 1,606 1,652 1,659 1,654 1,698 1,672 1,689 1,726 1,725 1,712 1,826
Germany 1,688 1,764 1,764 1,816 1,865 1,924 1,995 2,019 2,023 2,086 2,169
Greece 10 9 10 27 22 17 12 12 17 27 22
Ireland 99 123 116 112 118 119 137 140 174 162
Italy 927 949 972 987 1,022 1,034 1,049 1,038 1,047 1,072 1,022
Luxembourg
Netherlands 672 638 637 654 671 664 711 730 722 714 740
Portugal 57 59 60 58 57 58 56 57 56 54 57
Spain 111 119 124 133 133 136 134 128 127 126 124
Sweden 127 125 128 125 118 118 119 109 114 106 103
United Kingdom 332 387 364 345 352 385 398 374 373 357 371
Cyprus 1 2 2 1 2
Czech Rep. 127 118 113 113 109 107 109
Estonia 22 28 33 32 36 37 38
Hungary 65 77 73 72 73 75 72
Latvia 29 32 33 35 34 29 33
Lithuania 61 64 69 91 107 94 99
Malta
Poland 528 584 607 637 628 668
Slovakia 32 39 43 40 34 31 25
Slovenia 24 22 20 19 20 18 19
Bulgaria 73 64 61 58
Romania 62 65 64 59
Total 6,204 6,436 6,456 6,546 7,052 7,692 7,918 8,147 8,205 8,205 8,240
EU-15 6,204 6,436 6,456 6,546 6,692 6,783 6,948 7,001 7,025 7,059 7,060
EU-10 909 970 1,011 1,051 1,021 1,063
EU-02 135 129 125 117
Source: Eurostat.
Poland, Estonia and Lithuania increased their share in EU’s total production, whereas big producers like
Germany, France, Italy and the Netherlands lost part of their initial market share over the decade. A
comparison of the production of cheese (Table 2.21) with the production of raw milk (Table 2.12) shows
that cheese production increased much faster (about 2.9% per annum for the EU total) than milk
deliveries (about 0.6% per annum). In the EU-10, growth in cheese production was stronger (more than
3% per annum) than in the EU-15 (average annual growth over the period 2000-2010 was about 1.3%,
but with tear-on-year changes clearly declining over time). Within the EU-15, Greece and Ireland showed
the strongest percentage increases in production over time (about 8% and 5.5% per annum,
respectively), whereas within the EU-10 cheese production expanded even faster in Estonia (about 9%

55
per annum) and Lithuania (about 8% per annum). Member States whose production slightly declined
were Denmark, Sweden, Czech Republic, Slovakia and Slovenia, together with Bulgaria and Romania.
Cyprus, Greece and Slovenia produced less cheese from cows’ milk compared to the other Member
States. Greece is nonetheless an important producer of cheeses from sheep and goat milk.
As cheese is not a homogeneous commodity, it is not possible to compare prices of cheese across the
EU.
Drinking milk
Drinking milk relates only to milk intended for direct consumption, normally in containers of 2 litres or
less. As Table 2.22 shows, Germany, followed by France, Italy, Spain, Sweden and the United Kingdom
were the main producers of drinking milk in the EU between 2000 and 2010.
Table 2.22 Production of drinking milk in EU Member States, 2000-2010, 1000 t
2000 2001 2002 2003 2004 2005 2006 2007 2008 2009 2010
Austria 521 591 632 649 704 701 786 813 710 715 727
Belgium 664 665 625 619 609 607 638 651 664 660 696
Denmark 518 520 511 498 487 460 467 486 511 483 471
Finland 735 733 719 711 710 732 733 735 738 734 731
France 3,813 3,990 3,935 3,867 3,866 3,806 3,792 3,811 3,676 3,496 3,515
Germany 5,424 5,485 5,524 5,821 5,805 5,783 5,971 5,923 5,132 5,288 5,276
Greece 417 412 400 417 416 423 428 416 434 435 453
Ireland 546 556 553 546 540 536 539 511 536 510 508
Italy 2,944 2,944 2,952 2,911 2,871 2,982 2,884 2,852 2,760 2,690 2,714
Luxembourg
Netherlands 968 877 821 793 793 838 778 758 718 710
Portugal 877 857 864 884 899 957 954 919 882 837 832
Spain 3,559 3,707 3,775 3,750 3,813 3,672 3,533 3,519 3,612 3,600 3,540
Sweden 1,024 1,021 1,023 1,012 1,009 992 952 926 915 908 908
United Kingdom 6,826 6,825 6,896 6,835 6,781 6,748 6,804 6,793 6,811 6,735 6,937
Cyprus 77 79 81 78 76
Czech Rep. 515 587 608 619 611 681 637
Estonia 73 79 83 83 82 89 94
Hungary 586 566 522 526 415 387 362
Latvia 92 100 104 104 99 72 71
Lithuania 75 74 81 81 86 88 88
Malta 29 28 28
Poland 1,373 1,347 1,335 1,358 1,462 1,471
Slovakia 290 245 236 249 239 260 275
Slovenia 179 179 156 165 156 143 163
Bulgaria 53 53 52 62
Romania 184 199 222 223
Total 28,836 29,183 29,230 29,313 31,142 32,545 32,503 32,631 31,525 31,333 30,751
EU-15 28,836 29,183 29,230 29,313 29,303 29,237 29,259 29,151 28,099 27,801 27,305
EU-10 3,308 3,244 2,243 3,174 3,258 3,161
EU-02 237 252 274 285
Source: Eurostat.
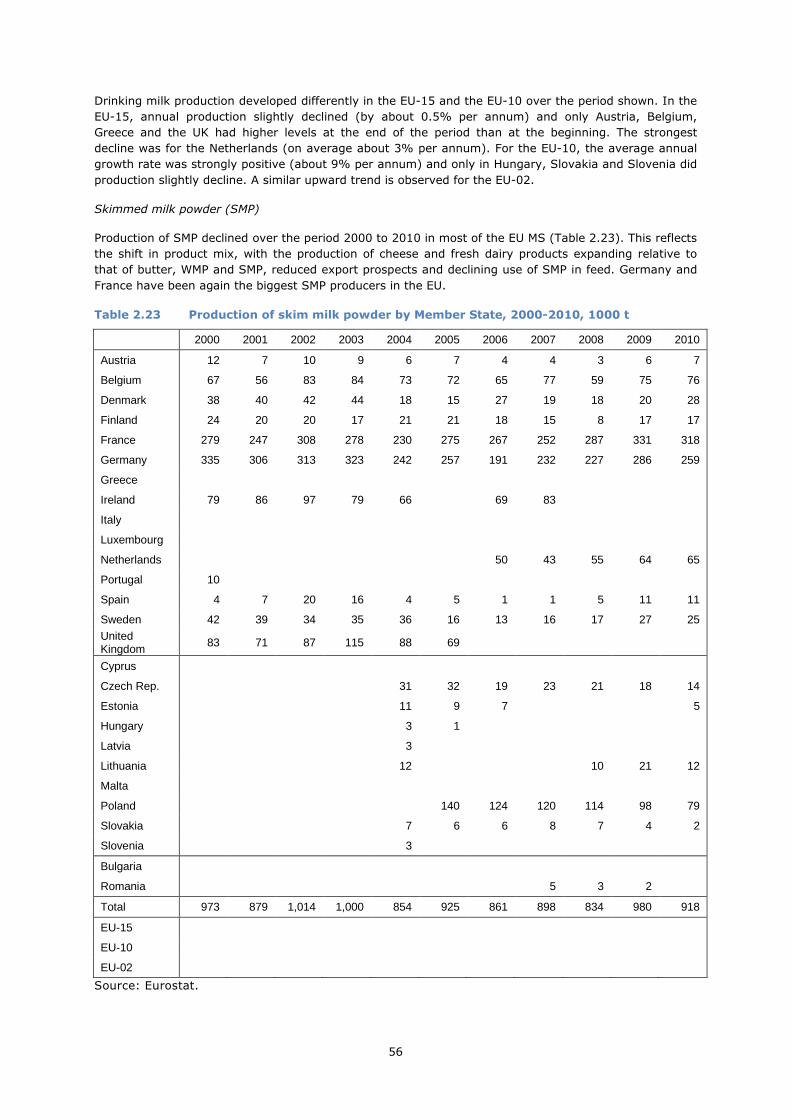
56
Drinking milk production developed differently in the EU-15 and the EU-10 over the period shown. In the
EU-15, annual production slightly declined (by about 0.5% per annum) and only Austria, Belgium,
Greece and the UK had higher levels at the end of the period than at the beginning. The strongest
decline was for the Netherlands (on average about 3% per annum). For the EU-10, the average annual
growth rate was strongly positive (about 9% per annum) and only in Hungary, Slovakia and Slovenia did
production slightly decline. A similar upward trend is observed for the EU-02.
Skimmed milk powder (SMP)
Production of SMP declined over the period 2000 to 2010 in most of the EU MS (Table 2.23). This reflects
the shift in product mix, with the production of cheese and fresh dairy products expanding relative to
that of butter, WMP and SMP, reduced export prospects and declining use of SMP in feed. Germany and
France have been again the biggest SMP producers in the EU.
Table 2.23 Production of skim milk powder by Member State, 2000-2010, 1000 t
2000 2001 2002 2003 2004 2005 2006 2007 2008 2009 2010
Austria 12 7 10 9 6 7 4 4 3 6 7
Belgium 67 56 83 84 73 72 65 77 59 75 76
Denmark 38 40 42 44 18 15 27 19 18 20 28
Finland 24 20 20 17 21 21 18 15 8 17 17
France 279 247 308 278 230 275 267 252 287 331 318
Germany 335 306 313 323 242 257 191 232 227 286 259
Greece
Ireland 79 86 97 79 66 69 83
Italy
Luxembourg
Netherlands 50 43 55 64 65
Portugal 10
Spain 4 7 20 16 4 5 1 1 5 11 11
Sweden 42 39 34 35 36 16 13 16 17 27 25
United Kingdom 83 71 87 115 88 69
Cyprus
Czech Rep. 31 32 19 23 21 18 14
Estonia 11 9 7 5
Hungary 3 1
Latvia 3
Lithuania 12 10 21 12
Malta
Poland 140 124 120 114 98 79
Slovakia 7 6 6 8 7 4 2
Slovenia 3
Bulgaria
Romania 5 3 2
Total 973 879 1,014 1,000 854 925 861 898 834 980 918
EU-15
EU-10
EU-02
Source: Eurostat.

57
The SMP prices declined by 15% on average from 2001 to 2002, and remained rather stable over the
period 2002-2006 (Table 2.24). After 2006, the SMP price strongly increased (on average by 30%) in
2007 (peak). After 2007 the SMP price strongly declined again, and fell below its long-run average value
of €2000/tonne. Although there are differences between Member States, price movements are highly
correlated between most Member States .
Table 2.24 Prices of skim milk powder by Member State, 2001-2009, €/t
2001 2002 2003 2004 2005 2006 2007 2008 2009
Austria 2,574 2,138 2,118 2,100 2,120
Belgium 2,386 2,027 2,061 2,073 2,008 2,137 3,242 2,258 1,827
Denmark 2,404 2,086 2,104 2,080 2,063 2,109 3,052 2,643 1,870
Finland 2,339 1,934 1,943 1,958 1,969
France 2,351 2,001 2,040 2,076 2,029 2,129 3,278 2,214 1,795
Germany 2,369 2,045 2,071 2,088 2,034 2,137 3,261 2,284 1,780
Greece
Ireland 2,176 1,972 2,020 1,992 1,920 1,948 2,980 2,093 1,704
Italy
Luxembourg
Netherlands 2,320 1,993 2,031 2,044 1,968 2,125 3,165 2,125 1,758
Portugal 1,870
Spain 2,571 2,118 1,960 2,105 2,195
Sweden 2,183 2,177 2,138 2,115 2,091 2,139 2,755
United Kingdom 2,872 2,268 2,210 2,241 2,142 2,050 2,944 2,458 1,753
Cyprus
Czech Rep. 1,929 1,937 2,007 2,705 2,326 1,646
Estonia 1,875 1,879
Hungary 2,554 2,080 3,760 4,052 3,815 3,237
Latvia 1,938 1,981 2,083 2,897 3,212 2,307
Lithuania 1,800 2,013
Malta
Poland 1,830 1,900 1,982 2,933 2,132 1,617
Slovakia 1,852 1,979 2,038 2,963 2,680 2,111
Slovenia 3,155 3,182
Bulgaria
Romania
EU-15 2,413 2,069 2,047 2,079 2,049 2,097 3,085 2,296 1,784
EU-10 2,117 2,119 2,374 3,110 2,833 2,184
EU-02
Notes: The prices for the EU-15, EU-10 and EU-02 have been calculated as simple arithmetic averages of the prices per relevant MS.
Source: DG AGRI (AgriView) (various issues).

58
Whole milk powder (WMP)
Trends in the production of whole milk powder (WMP) are shown in Table 2.25. Production declined in
France and Germany – the two bigger producers in the EU – while it increased in Denmark and in the
Netherlands. This reflects the relative increase in demand for high value added products (e.g. cheeses),
in which France is particularly specialised. At the same time, it reflects the competition in high quality
whole milk powder in and outside the EU.
The fragmentation of the available data for the new Member States does not allow any conclusion on the
evolution of their WMP production.
Table 2.25 Production of whole milk powder by EU Member State, 2000-2010, 1000 t
2000 2001 2002 2003 2004 2005 2006 2007 2008 2009 2010
Austria 4 2 1 1 3 3 3 2 1
Belgium 70 84 74 72 75 80 71 71 94 68 69
Denmark 97 88 81 82 87 94 91 93 95 111 119
Finland 2 2 2 3 3 3 4
France 258 241 235 206 198 193 158 145 165 123 124
Germany 185 167 154 154 162 161 157 170 90 80 84
Greece
Ireland 100 85 81 97
Italy
Luxembourg
Netherlands 108 110 127 139 135
Portugal 9
Spain 12 10 8 9 7 6 8 5 4 2 2
Sweden 6 5 6 12 32 37 36 40 31 23
United Kingdom 105 87 105 102 80 52
Cyprus
Czech Rep. 19 17 16 14 16 11 10
Estonia
Hungary
Latvia 2
Lithuania 4 6 2 3
Malta
Poland 54 37 39 45 30 26
Slovakia 5 7 3 2
Slovenia
Bulgaria
Romania 4 3 2 2
Total 840 770 743 729 654 701 688 693 690 606 603
EU-15
EU-10
EU-02
Source: Eurostat.
WMP prices declined from 2001 to 2002 by about 8% in EU-15, after which it remained fairly stable over
the period 2002-2006 at a level of about €2500/tonne (Table 2.26). After 2006, WMP prices strongly
increased (by 35%) and then dropped sharply in 2009. Although there are differences between Member
States, for most Member States the price movements are highly correlated.

59
Table 2.26 Prices of whole milk powder by Member State, 2001-2009, €/t
2001 2002 2003 2004 2005 2006 2007 2008 2009
Austria 3,012 2,639 2,601 2,685 2,748
Belgium 2,798 2,494 2,560 2,579 2,439 2,417 3,473 2,773 2,219
Denmark 2,840 2,517 2,541 2,511 2,405 2,308 3,005 2,692 2,045
Finland 2,775 2,572 2,434 2,470 2,424
France 2,639 2,436 2,484 2,494 2,382 2,367 3,393 2,734 2,125
Germany 2,915 2,509 2,551 2,544 2,426 2,407 3,405 2,661 2,029
Greece
Ireland 2,548 2,395 2,430 2,380 2,274 2,188 3,183 2,343 1,990
Italy
Luxembourg
Netherlands 2,765 2,464 2,500 2,557 2,411 2,371 3,328 2,693 2,033
Portugal 2,220
Spain 2,152
Sweden 3,561 3,145 2,296
United Kingdom 3,265 2,582 2,727 3,023 2,688 2,264 2,928 2,559 1,988
Cyprus
Czech Rep. 2,315 2,355 2,296 3,032 3,017 2,045
Estonia 2,387 2,331
Hungary 2,894 2,336 2,980
Latvia 2,329 2,340 2,226 3,027 3,232 2,079
Lithuania 2,166 2,301
Malta
Poland 2,325 2,309 2,281 3,126 2,625 1,891
Slovakia 2,282 2,341 2,329 3,148 2,910 2,324
Slovenia 3,645 3,668
Bulgaria
Romania
EU-15 2,840 2,476 2,505 2,582 2,466 2,332 3,284 2,700 2,090
EU-10 2,543 2,498 2,283 3,083 2,953 2,085
EU-02
Notes: The prices for the EU-15 and EU-10 have been calculated as simple arithmetic averages of the prices per relevant MS.
Source: DG AGRI (AgriView) (various issues).
To sum up, considering individual production lines, it can be seen that the production of cheese over the
period 2000-2010 increased, whereas the production of all three other products declined. This reflects a
switch in the product mix from industrial and bulk products to high-value consumer products (cheese
and fresh dairy products). Part of the explanation for this substitution is that the total volume of raw milk
production was restricted by the quota during 2000-2010. As a result, the expansion of cheese
production can only take place if that of other dairy products is reduced, since they all compete for the
fat and protein constituents of raw milk.

60
2.2.3 Consumption and self sufficiency of dairy products in the EU
Table 2.27 shows the per capita consumption of cheese (factory cheese), butter and drinking milk in the
EU-27. The per capita consumption remained rather stable with a slightly declining trend for butter and a
slightly increasing trend for cheese and drinking milk.
The differences among the Member States reflect the variability in consumption patterns in Europe.
Traditional milk producing countries had the highest per capita consumption, such as France, Germany,
the UK and Poland. Italy had the highest per capita consumption of cheese, whereas the EU-12 had a
lower per capita consumption of drinking milk, which is related as well to the higher on-farm
consumption of milk (Table 2.15).
Table 2.27 Per capita consumption of factory cheese (from cows’ milk), butter and liquid milk in EU-27, kg
Cheese Butter Drinking milk
2000 2005 2009 2000 2005 2009 2000 2005 2009
Austria 18.1 18.6 19.1 4.8 4.8 4.8 64.0 68.0 58.0
Belgium 15.8 14.9 14.2 5.0 3.6 3.1 65.0 58.0 63.0
Denmark 18.8 16.6 16.3 5.3 3.7 3.2 97.0 90.0 90.0
Finland 16.5 18.7 19.1 3.8 2.7 2.7 143.0 140.0 122.0
France 21.0 19.6 19.6 8.7 7.9 7.1 63.0 65.0 61.0
Germany 19.7 19.9 21.3 6.5 6.4 6.3 63.0 64.0 67.0
Greece 24.6 25.6 31.1 0.7 0.7 0.7 40.0 39.0 33.0
Ireland 5.9 6.3 6.0 3.3 3.0 2.7 143.0 129.0 106.0
Italy 22.3 23.1 23.1 2.8 2.8 2.6 52.0 50.0 53.0
Luxembourg 13.8 13.2 13.2 5.1 4.8 4.6 65.0 58.0 62.0
Netherlands 17.9 19.7 20.0 3.3 3.2 3.4 63.0 62.0 60.0
Portugal 10.0 10.4 10.3 1.9 1.6 1.4 86.0 91.0 84.0
Spain 9.3 9.6 9.0 0.9 1.1 1.0 88.0 85.0 80.0
Sweden 16.9 18.2 17.8 3.4 2.7 2.7 115.0 109.0 89.0
UK 9.1 10.9 11.5 4.3 4.0 3.8 116.0 114.0 95.0
Cyprus 11.0 10.6 10.0 99.0 107.0 100.0
Czech Rep. 13.9 15.7 16.7 4.1 4.7 4.9 46.0 56.0 63.0
Estonia 12.8 15.6 16.7 2.9 4.6 4.3 42.0 59.0 83.0
Hungary 8.8 5.2 2.6 0.7 0.9 0.8 56.0 51.0 41.0
Latvia 8.3 13.6 13.1 1.7 2.2 2.6 45.0 52.0 48.0
Lithuania 3.2 4.2 4.9 2.6 3.0 2.9 21.0 21.0 24.0
Malta 11.2 10.4 9.2 80.0 72.0 32.0
Poland 12.0 10.4 10.7 5.0 4.5 3.6 69.0 53.0 53.0
Slovenia 11.1 10.2 9.3 2.1 1.5 1.0 125.0 89.0 81.0
Slovakia 5.7 9.1 10.2 2.7 3.5 2.3 60.0 45.0 48.0
Bulgaria 4.8 5.6 0.3 0.5 27.0 27.0
Romania 1.8 2.9 2.9 0.3 0.5 0.5 112.0 119.0
EU-27 15.0 15.9 16.2 4.3 4.0 3.7 69.0 77.0 76.0 Notes: The data do not consider on-farm consumption
Source: Productschap Zuivel (2009).
61
The balance of production and consumption can be used to construct a production-use ratio for each
product, which is an indicator of the EU’s degree of self-sufficiency3 for that product. As Table 2.28
shows, self-sufficiency for all products and years exceeded 100%, indicating that the EU market cannot
absorb all the cheese, butter, WMP and SMP produced in the EU. For example, the EU’s self-sufficiency
ratio fluctuates between 105 and 106, which indicates that the net exportable surplus is 5-6% of
domestic consumption needs. The self-sufficiency ratio of milk powders and in particular of WMP is
higher. The self-sufficiency ratios for the other three products shown in the table have fluctuated more
over the period shown than those for cheese. This reflects the fact that processors can switch their
product mix more easily during the year between producing butter and SMP, or whole milk powder, in
response to market conditions.
Table 2.28 Self-sufficiency ratio (in %) for the EU-27, 2000-2010
2000 2001 2002 2003 2004 2005 2006 2007 2008 2009
Butter 105 106 110 111 113 113 108 106 105 105
Cheese 105 105 106 106 106 106 106 106 106 106
SMP 122 122 122 129 135 123 108 127 125 135
WMP 254 232 252 251 263 234 219 185 223 236 Source: own calculations based on DG AGRI (various years).
2.2.4 Structure of the processing industry
This section uses information from Eurostat, the own case studies and on a report presented at the EU’s
High Level Expert Group on milk (European Commission, 2009a).
There are currently around five thousand dairy processors in the EU, of which about 55% are categorized
as being small processors. That is, the volume of raw milk they process per year does not exceed 5,000
t. The remaining 45% consist of 26% classified as medium-sized (their volume of raw milk processed is
between 5,001 and 100,000 t), and 18% classified as large (their volume of raw milk processed exceed
100,001 t) (European Commission, 2009a). It should be noted that the largest dairy processors tend to
significantly exceed the level of 500,000 tonnes.
Table 2.29 shows the number of dairy enterprises4 and the total amount of milk processed per Member
State. For 2006, the total number of dairy processors in EU-27 was 5800 of which about 80% were
located in the EU-15 and the remaining 20% in the EU-10 and the EU-02. In all EU-15 Member States
except Portugal, the Netherlands and Sweden, the number of dairy enterprises declined over time (in the
UK and Belgium by approximately 5% per annum, but at lower rates of decline for other EU-15 Member
States). The picture is less uniform in EU-12. In Estonia, Latvia and Slovakia the number of enterprises
increased in the period 2003-2006, whereas in the Czech Republic, Hungary, Lithuania and Slovenia
declines in the number of dairy enterprises are observed. For those Member States where currently the
dairy industry consists of a large number of relatively small-sized enterprises, this process was strong.
By contrast, in Member States where the processing sector was already highly consolidated, such as the
Netherlands, the number of enterprises could even increase. Dividing the annual milk collection with the
corresponding number of dairy enterprises gives the average volume of raw milk processed per
processing firm. The estimated average milk collection by enterprise in terms of volumes varies from 3
thousand tonnes in Bulgaria and Romania to almost 740 thousand tonnes in the Netherlands. During the
period 2003-2006 the number of enterprises in Czech Republic, Estonia and Lithuania declined by 6%,
4% and 9% respectively. The rates of decline for Poland and Romania are in the same order of
magnitude (6% annual decline in number of enterprises between 2006 and 2009).
3 Self-sufficiency = 100 × {[domestic production/total consumption] = 1 + [exports – imports + change in stocks]/total consumption}. The amount by which self-sufficiency exceeds 100% shows net exports and net additions to stocks of the product as a percentage of domestic use. 4 The term enterprise follows the definition of the Council Regulation (EEC) No 696/93 and refers to milk processing firms which are identified as legal units. The reader should note that an enterprise may have one or more factories processing milk.
62
Table 2.29 Dairy enterprises, volume of annual milk production and average milk processed per firm, 1000 t
Number of enterprises Processed milk (1000t)
2000 2003 2006 2009 2000 2003 2006 2009
Austria 96 86 79 79 2657 2644 2674 1660
Belgium 80 69 66 50 3125 2830 2846 2945
Germany 218 201 190 194 26814 27431 27715 28615
Denmark 31 26 23 27 4495 4518 4480 4716
Spain 597 570 582 616 6609 6605 6586 5150
Finland 23 19 16 2398 2348
France 531 468 441 414 10780 10910 10576 6858
Greece 649 877 815 1362 1429 1385
Ireland 66 63 59 5160 5310 5232
Italy 1734 1707 1601 1439 9390 9175 9183 8627
Luxembourg 4 3 180 176
Netherlands 15 14 16 10340 10373 10657
Portugal 140 188 200 178 746 666 685
Sweden 10 10 10 14 3297 3206 3130 3972
United Kingdom 729 622 524 456 14090 14195 13386
EU-15 4699 101799
Cyprus 79 190
Czech Republic 55 46 38 2601 2393 1970
Estonia 23 26 18 485 606 412
Hungary 53 41 75 1719 1450 530
Lithuania 20 13 11 954 1011 593
Latvia 43 67 65 436 592 236
Malta 1 1 40 41
Poland 226 190 8195 8154
Slovenia 95 7 499 389
Slovakia 32 40 49 973 962 593
Bulgaria 170 529
Romania 410 337 1133 876
EU-12
EU-27 Notes: Processed milk refers to milk delivered to dairies.
Source: Eurostat.
With respect to the producer-processor relationship, the report presented at the EU’s High Level Expert
Group on milk (European Commission, 2009a), indicated that about 58% of the total raw milk deliveries
were made by members of cooperatives to their cooperatives (mainly in EU-15). About 20% was
delivered based on individual contracts between producers and private processors. There can be overlap
between cooperatives and private processors when cooperatives sign contracts with non-members or sell
part of their milk intake to private processors. About 8% of the total raw milk was delivered through
producer delivery groups. These groups take various forms and names, and range from delivery groups
and producer organisations to sales cooperatives. They have been explicitly identified in Cyprus,
Germany, Hungary and Spain. It should be noted that in some cases producer groups are classified as
cooperatives and in other cases as private contracts. A fourth category, ‘other types of producer-
processor relations’, accounts for 2.5% of total EU milk deliveries, and reflects either lack of organisation
of the milk market or ways of introducing more flexibility into the market. Spot markets play a rather

63
residual role for milk that has not been contracted or delivered to cooperatives. It should be noted that
Member States could not identify the type of contractual arrangement under which it was delivered. In
particular, for France, Romania, Greece and Slovakia, the non-classifiable share is large. For most of the
Member States the contractual arrangements have remained rather unchanged, while the importance of
the cooperatives increased.
Cooperatives are obliged to buy all the milk delivered by their members. Milk prices are determined by
the governing bodies of the cooperative and tend to be indicative prices (often one month ahead), which
are adjusted later. The basic price is usually the same for all members, but is further differentiated by
accounting for the fat/protein content of the milk delivered, and subject to quality and quantity
premiums. As regards the milk sold under private contractual arrangements, these contracts are usually
for one year, with price and volume fixed in the contract. In Member States where cooperatives play an
important role, the conditions of private contracts reflect those of the cooperatives (e.g. being long-term
(> 1 year), with similar price setting mechanisms and an undertaking to accept all the milk delivered)
(European Commission, 2009a). At the same time, it was indicated by several Member States that
unwritten and much less formal contracts can play an important role in the private sector.
2.3 Evolution of EU dairy farming
This section places milk production in the context, first, of total livestock grazing activity. This is done in
order to understand the relative importance of dairy farming compared with other forms of livestock
management. Second, dairy farming is considered from a territorial point of view in connection with Less
Favoured Areas, which may have a marginal character for other forms of agriculture but are often well
suited for grazing, and for milk production in particular.
2.3.1 Livestock farming and specialist dairy production in Member States
In the EU-15, EU-10 and EU-02 alike, total farm numbers have been gradually declining, and this trend
is expected to continue (Nowicki et al., 2009). The numbers of total farm units by Member State for
2000 and 2007 given in Table 2.30 reflect a general trend to increase farm scale and in doing so to
exploit the economies of scale. This trend is also observed in the dairy sector. However, in the EU-15
except for Germany and Portugal, there was a steeper decline in the number of specialist dairy farming
compared to all types of farm. In some cases (Belgium, France, Netherlands) this decline was relatively
minor, in others (Austria, Denmark, Spain, Finland, Ireland, Luxembourg) it was more pronounced, and
in a few it was quite significant (Sweden, UK). This reflected a relatively strong structural change taking
place in dairy farming, characterised by significant scale increases. In the EU-10, there appears to be
restructuring in some Member States, with an increase in the share of specialist dairy farming for Latvia
and Lithuania, which is in contrast to the steady decline in Estonia, Poland, Slovenia, Slovakia. For the
EU-02, one sees the positive effects of restructuring with regard to specialist dairy farming in view of
accession to the EU. Cyprus, Greece and Malta have a very small specialist dairy sector, and their share
seems stable. Table 2.30 shows that between 2000 and 2007 the evolution of the share of specialist
dairying in the total number of farms per MS, in contrast to the other farm types of holdings with
livestock, did not follow any particular pattern. There was, moreover, country-specific diversity in general
in the evolution of livestock activity. Table 2.30 compares four types of farms:
• TF 41: Specialist dairy farms: farms in which at least two thirds of the standard gross margin comes
from the production of milk.
• TF 42: Specialist cattle rearing and fattening: farms in which at least two thirds of the standard
gross margin comes from the production of meat.
• TF 43: Cattle dairying, raising and fattening combined: farms where the production is based on
cattle.
• TF 44: Sheep, goats and other grazing livestock: these farms have no cattle, and they produce both
milk and meat.
Some countries had very unbalanced shares in one type of livestock farming or another: For example
Austria, Finland, Germany, Luxemburg, Netherlands, Slovakia and Sweden had predominantly more
livestock holdings in milk production, while France had a rather balanced distribution of livestock activity
across the four types. This share seems not to be related to the total milk output.

64
Table 2.30 Share of livestock-related farm-types (in %) in total holdings by Member States, 2000 and 2007
Total (in 1000) % change
2007 vs. 2000
Specialist dairying (TF 41)
Specialist cattle-rearing and fattening (TF 42)
Cattle-dairying, rearing and fattening combined (TF 43)
Sheep, goats and other grazing livestock (TF 44)
2000 2007 2000 2007 2000 2007 2000 2007 2000 2007
Austria 199.47 165.42 -0.2 23.9 19.2 6.7 12.0 8.7 7.8 14.9 19.1
Belgium 61.71 48.01 -0.2 14.3 13.7 18.2 18.0 5.9 5.8 7.5 7.5
Bulgaria 493.13 8.6 0.3 0.3 9.2
Cyprus 40.12 0.5 0.0 0.0 4.3
Czech Republic 39.40 4.5 6.5 0.7 14.9
Denmark 57.83 44.62 -0.2 15.0 10.0 1.2 2.9 0.2 0.1 3.2 6.9
Estonia 23.34 10.0 0.6 0.4 19.1
Finland 81.19 68.23 -0.2 26.5 18.0 4.1 2.4 1.4 1.2 4.2 2.3
France 614.00 527.35 -0.1 11.0 10.4 11.8 12.5 1.8 1.7 11.6 11.6
Germany 471.96 370.48 -0.2 19.5 20.0 3.8 7.8 1.8 2.0 11.2 14.2
Greece 817.06 860.15 0.1 0.2 0.3 0.3 0.5 0.1 0.1 5.4 4.7
Hungary 966.92 626.32 -0.4 1.1 0.9 0.1 0.1 0.1 0.0 1.8 2.6
Ireland 141.53 128.24 -0.1 18.6 15.0 51.0 53.2 2.7 1.2 20.1 23.4
Italy 2,153.72 1,679.44 -0.2 2.5 1.6 0.8 1.7 0.1 1.0 7.0 6.5
Latvia 140.84 107.75 -0.2 5.2 20.5 0.0 0.4 0.1 0.7 9.9 8.4
Lithuania 230.27 14.0 0.4 2.5 4.3
Luxembourg 2.81 2.30 -0.2 32.4 27.8 10.0 9.6 5.7 11.7 7.8 10.4
Malta 11.02 0.9 0.0 0.2 2.5
Netherlands 101.55 76.74 -0.2 26.3 24.6 3.6 2.8 1.3 0.5 17.0 23.0
Poland 2,390.96 4.4 0.3 1.8 10.6
Portugal 415.97 275.08 -0.3 3.4 3.5 2.3 3.4 0.6 0.3 5.7 6.6
Romania 3,931.35 3.0 0.1 0.7 4.2
Slovakia 71.04 68.99 0.0 13.1 9.8 1.3 0.6 0.5 0.1 3.3 4.8
Slovenia 86.47 75.34 -0.1 15.0 9.8 14.9 10.2 5.1 6.7 7.6 15.3
Spain 1,287.42 1,043.91 -0.2 3.6 2.6 4.2 4.1 0.7 0.3 6.3 7.8
Sweden 81.41 72.61 -0.1 15.8 8.9 6.4 13.6 0.2 0.1 1.8 15.2
United Kingdom 233.25 299.83 0.3 10.8 5.9 14.5 11.9 0.6 1.1 38.0 26.9 Source: Eurostat (FSS).
65
Table 2.31 Distribution of all farms with dairy cows by herd size, 2000 and 2007 (number of farms in 1000)
Herd size 1 - 2 3 - 9 10 - 19 20 - 29 30 - 49 50 - 99 ≥ 100 Total Number of farms in 2000
Austria 11.81 37.06 22.15 5.05 1.27 0.14 0.01 77.47 Belgium 0.56 1.43 3.28 3.70 5.34 3.60 0.29 18.19 Bulgaria1 170.08 21.67 2.12 0.54 0.31 0.19 0.10 195.01 Cyprus1 0.01 0.01 0.02 0.11 0.11 0.25 Czech Rep.1 4.49 1.26 0.69 0.23 0.24 0.35 1.19 8.45 Germany 5.92 24.47 38.09 31.13 31.58 17.58 3.89 152.65 Denmark 0.28 0.36 0.72 1.01 2.92 4.58 1.29 11.16 Estonia1 9.27 1.95 0.51 0.18 0.14 0.10 0.25 12.40 Spain 19.46 20.41 17.55 9.21 7.02 3.16 1.02 77.81 Finland 1.05 5.38 11.43 4.59 1.31 0.14 0.01 23.91 France1 4.18 4.94 13.30 22.99 44.80 22.37 1.35 113.93 Greece 3.19 4.63 2.01 0.80 0.80 0.49 0.15 12.06 Hungary 21.85 11.04 1.13 0.27 0.17 0.14 0.61 35.19 Ireland 1.26 2.47 4.62 5.43 10.09 6.95 0.99 31.81 Italy 15.14 24.73 14.90 8.23 8.38 6.72 3.51 81.60 Lithuania1 150.88 39.52 2.21 0.33 0.20 0.11 0.14 193.39 Luxembourg 0.01 0.03 0.10 0.27 0.65 0.17 0.02 1.23 Latvia 58.07 14.15 1.11 0.23 0.13 0.09 0.10 73.89 Malta1 0.02 0.02 0.01 0.02 0.04 0.05 0.01 0.17 Netherlands 1.67 2.56 2.90 3.65 9.25 13.09 1.95 35.06 Poland1 593.04 225.04 44.52 7.68 2.27 0.64 0.60 873.80 Portugal 15.15 8.59 3.78 2.19 1.94 1.07 0.27 32.99 Romania1 1,151.49 50.23 2.18 0.45 0.25 0.15 0.14 1,204.89 Sweden 0.37 1.06 3.00 3.47 3.88 1.85 0.34 13.96 Slovenia 12.97 11.88 3.01 0.52 0.16 0.04 0.01 28.59 Slovakia 16.58 0.44 0.07 0.02 0.04 0.14 0.65 17.94 United Kingdom 1.67 1.42 1.76 2.23 5.70 11.04 8.04 31.86 EU-27 2,270.46 516.75 197.15 114.43 138.90 95.06 27.04 3,359.66
Number of farms in 2007 Austria 9.71 18.25 14.54 4.75 1.82 0.34 0.03 49.45 Belgium 0.54 0.98 1.51 2.29 4.07 3.51 0.42 13.32 Bulgaria 98.47 16.69 3.07 1.12 0.87 0.43 0.16 120.82 Cyprus 0.01 0.01 0.01 - 0.02 0.11 0.08 0.24 Czech Rep. 2.54 0.78 0.55 0.21 0.20 0.31 1.04 5.62 Germany 2.89 11.40 21.36 19.15 21.90 19.20 5.18 101.07 Denmark 0.14 0.21 0.24 0.31 0.64 1.34 2.50 5.38 Estonia 4.11 0.97 0.36 0.16 0.12 0.13 0.23 6.08 Spain 7.66 6.61 7.01 5.00 6.05 3.51 1.46 37.29 Finland 0.65 2.12 5.51 3.45 1.99 0.60 0.06 14.39 France 2.55 3.72 7.63 14.72 37.46 24.85 2.19 93.12 Greece 2.05 2.30 1.27 0.74 0.75 0.68 0.23 8.02 Hungary 4.61 5.17 1.21 0.29 0.34 0.12 0.42 12.17 Ireland 0.43 0.72 1.70 2.68 6.48 7.96 1.35 21.32 Italy 9.27 17.99 11.64 5.90 6.60 7.03 4.37 62.79 Lithuania 93.06 24.29 3.67 0.98 0.65 0.34 0.19 123.17 Luxembourg 0.10 0.08 0.08 0.17 0.41 0.24 0.02 1.09 Latvia 31.64 9.07 1.72 0.52 0.34 0.25 0.15 43.69 Malta 0.05 0.02 0.01 0.01 0.03 0.04 0.02 0.19 Netherlands 1.01 1.67 1.55 1.68 4.47 10.88 3.26 24.51 Poland 438.69 137.07 51.18 15.21 6.63 1.65 0.62 651.05 Portugal 4.23 2.75 2.05 1.52 1.58 1.05 0.33 13.50 Romania 939.89 66.30 4.02 1.05 0.56 0.39 0.19 1,012.41 Sweden 0.01 0.22 0.89 1.25 2.17 1.82 0.74 7.10 Slovenia 8.04 7.24 2.68 0.76 0.37 0.10 0.01 19.20 Slovakia 10.25 0.57 0.06 0.03 0.04 0.08 0.51 11.54 United Kingdom 6.19 3.30 1.44 0.94 2.36 6.21 7.69 28.14 EU-27 1,678.79 340.50 146.96 84.89 108.92 93.17 33.45 2,486.67 %change, 2007 vs. 2000 -26.1 -34.1 -25.5 -25.8 -21.6 -2.0 23.7 -26.0
Notes: 1) Data refer to the year 2003
Source: Eurostat (FSS).

66
There was strong heterogeneity between Member States with respect to the herd size distribution (Table
2.31). For example, in Romania and in Poland the dominant size class was herds with fewer than 10 (and
often even no more than 2) dairy cows. In contrast, in Sweden such relatively small dairy farms hardly
existed. A comparison of 2000 and 2007 shows that the decline in farm numbers in most Member States
was at the expense of the smaller herds, whereas larger herds increased their number. For example, in
Austria there were net losses of farms in the first four herd-size groups, but numbers increased in the
last three herd-size groups (from 30 cows onwards). In Germany, it is only the two largest herd-size
groups (from 50 cows onwards) that register a growth in numbers. However, this pattern does not hold
in all Member States. In the United Kingdom, where herd sizes are already much larger than the EU
average, there was an increase in the number of herds with 10 cows or less, whereas all other herd-size
groups lost herd numbers.
Herd-size distributions are inevitably very skewed, with predominantly more herds among the smaller
size-groups and far fewer in the larger-sized groups. However, the distribution of cows or of milk output
over herds of different sizes rarely follows this pattern, since the larger cow numbers and higher output
of the larger farms partly or fully counteracts the disproportionate weight of the smaller farm numbers.
Table 2.32 Distribution of dairy cows over herds of different size class, 2000 and 2007 (thousand)
Herd size 1 - 2 3 - 9 10 - 19 20 - 29 30 - 49 50 - 99 ≥ 100 Total
Number of dairy cows in 2000
Austria 18.73 208.72 298.68 116.51 44.95 8.88 0.85 697.31
Belgium 0.82 8.66 47.46 88.71 204.04 230.42 35.76 615.86
Bulgaria1 210.41 87.83 26.08 11.96 11.06 12.82 15.42 375.58
Cyprus1 0.03 0.15 0.58 7.97 17.17 25.96
Czech Rep.1 5.66 6.23 9.26 5.36 9.25 25.24 406.85 467.85
Germany 8.89 151.47 547.09 747.27 1,185.37 1,129.28 995.77 4,765.14
Denmark 0.41 2.05 10.57 24.66 115.01 314.80 172.70 640.19
Estonia1 11.38 9.26 6.79 4.28 5.25 6.77 76.08 119.80
Spain 26.35 114.18 241.70 216.14 256.11 201.63 186.20 1,242.31
Finland 1.40 36.03 163.83 106.93 46.10 8.57 1.26 364.12
France1 5.99 30.14 199.16 566.97 1,682.74 1,405.37 160.60 4,050.96
Greece 4.84 24.07 25.65 18.18 28.72 31.32 21.02 153.79
Hungary 31.22 47.92 14.32 6.04 6.02 9.27 245.98 360.77
Ireland 1.77 14.68 66.24 131.07 386.42 445.57 131.69 1,177.45
Italy 22.72 132.54 201.29 192.44 307.93 443.67 595.46 1,896.05
Lithuania1 200.79 162.47 27.78 7.76 7.33 7.27 37.66 451.05
Luxembourg 0.01 0.16 1.50 6.79 24.55 10.41 1.72 45.14
Latvia 78.25 59.63 14.55 5.25 4.95 6.13 24.65 193.41
Malta1 0.03 0.10 0.12 0.55 1.67 3.42 1.74 7.63
Netherlands 2.43 14.13 41.80 89.67 368.10 876.56 257.05 1,649.73
Poland1 784.77 1,045.01 571.31 174.88 79.74 42.98 152.67 2,851.36
Portugal 21.09 41.90 52.02 51.81 71.46 68.78 48.68 355.73
Romania1 1,357.79 185.30 27.81 10.41 9.01 10.16 29.17 1,629.65
Sweden 0.52 6.88 44.23 83.81 145.69 118.34 49.07 448.52
Slovenia 18.44 59.48 38.96 11.99 5.84 2.17 4.70 141.57
Slovakia 18.06 1.84 0.95 0.55 1.72 10.71 196.55 230.38
United Kingdom 2.33 7.83 25.50 54.61 225.55 792.55 1,226.49 2,334.84
EU-27 2,835.10 2,458.54 2,704.65 2,734.75 5,235.16 6,231.06 5,092.96 27,292.15
Table continues on the next page.

67
Number of dairy cows in 2007
Austria 12.64 106.43 199.95 112.12 65.70 21.58 3.27 521.68
Belgium 0.81 5.38 22.31 55.67 157.07 229.37 53.10 523.70
Bulgaria 122.40 72.37 38.42 25.55 31.89 28.25 31.31 350.18
Cyprus 0.01 0.05 0.09 - 0.78 7.44 14.17 22.65
Czech Rep. 3.21 3.87 7.40 5.01 7.65 21.63 367.76 416.52
Germany 4.48 71.02 309.83 463.05 832.31 1,278.20 1,117.50 4,076.38
Denmark 0.22 1.20 3.41 7.56 25.47 97.60 409.97 545.42
Estonia 5.18 4.71 4.89 3.84 4.71 8.45 76.05 107.84
Spain 9.86 38.90 100.08 118.55 226.38 227.81 253.28 974.86
Finland 0.85 14.20 80.13 82.23 73.47 37.25 7.94 296.07
France 3.67 21.53 113.95 362.56 1,436.40 1,612.55 263.99 3,814.63
Greece 3.09 12.17 16.84 16.87 28.27 45.11 35.06 157.41
Hungary 6.87 25.83 15.60 7.04 12.57 8.15 189.36 265.43
Ireland 0.63 4.12 24.64 65.27 252.75 525.90 184.91 1,058.21
Italy 13.44 95.80 155.70 136.67 244.67 474.94 769.68 1,890.91
Lithuania 116.66 109.75 47.89 23.08 23.71 22.65 54.64 398.37
Luxembourg 0.13 0.40 1.18 4.23 15.82 15.24 3.05 40.04
Latvia 41.00 41.09 22.74 12.38 12.61 17.16 35.35 182.32
Malta 0.07 0.09 0.18 0.27 1.41 2.89 3.18 8.08
Netherlands 1.50 9.15 22.29 41.28 179.32 770.28 444.49 1,468.30
Poland 565.39 659.73 689.79 353.11 236.34 104.59 158.83 2,767.78
Portugal 6.05 14.47 29.46 36.05 58.67 68.96 59.00 272.66
Romania 1,165.39 261.67 52.66 24.88 20.56 25.96 35.58 1,586.69
Sweden 0.01 1.60 13.33 30.81 83.83 122.55 117.52 369.65
Slovenia 11.19 36.27 35.71 17.83 13.29 6.47 3.42 124.19
Slovakia 11.48 2.29 0.76 0.67 1.65 6.16 154.22 177.22
United Kingdom 7.88 16.70 20.08 23.18 94.23 458.65 1,332.77 1,953.49
EU-27 2,114.11 1,630.79 2,029.31 2,029.76 4,141.53 6,245.79 6,179.40 24,370.68
%change, 2007 vs. 2000 -0.03 -0.03 -0.02 -0.03 -0.02 0.00 0.02 -0.01
Notes: 1) Data refer to the year 2003
Source: Eurostat (FSS).
Table 2.32, showing the number of dairy cows in herds of each size class, illustrates this pattern. For the
EU as a whole, the largest number of dairy cows were kept in herds of a size ranging from 50 to 99 dairy
cows. Form 2000 (2003) to 2007, the number of cows in herds of 50 cows and upwards increased in
absolute terms. The number of cows in herds of less than 30 dairy cows declined in the period 2000
(2003) until 2007 by about 25%, with the percentage decline being rather equally distributed over the
size classes.
Another observation from comparing numbers in Tables 2.31 and 2.32 is that whereas in the period 2000
(2003)-2007 the total number of farms having dairy cows declined by nearly 26%, the total number of
dairy cows also declined, but much less steeply (only by 11%). This is a feature of the trend towards
farm scale increases. However, it also shows implicit influence of milk quotas, which have kept the total
volume of milk output more or less constant: the reduction in the total number of dairy cows roughly
compensates the increase in milk yields (see Table 2.4 for aggregate milk yield trends), so that the total
amount of milk produced remains stable. Without quotas in place, the yield increases are likely to have
caused such a compensating reduction in cow numbers, and total output would probably have increased.
Table 2.33 provides additional information on the number of specialist dairy farms in the total number of
farms having dairy cows. As can be seen from comparing farm numbers and cow numbers, Member
States having a large number of farms (e.g. Romania) did not necessarily have a high share in the
68
number of dairy cows they represent. Obviously not only farm numbers, but also farm size is important
in explaining the shares in total dairy cow numbers.
In 2007, specialist dairy farms had a predominant share (more than 50%) of farms with dairy herds in
13 of the Member States of EU-15. In the EU-10, specialist dairy farms predominated in five Member
States (Cyprus, Latvia, Malta, Portugal and Slovakia). In the remaining Member States, non-specialist
holdings with dairy cows were in the majority. There is no general pattern in the trends over time at
Member State level. In those Member States where specialist dairy farms are claiming a greater share of
farms with dairy herds, the percentage of dairy cows on specialist dairy farms has also increased.
However, the opposite is not always the case. For example, the UK ended with a lower share of specialist
dairy farms in all farms with dairy herds, yet the proportion of dairy cows on specialist dairy farms
continued to increase.
Table 2.33 Farms with dairy cows and specialist dairy farms, by Member State, 2007
Farms with dairy cows Dairy cows TF 41 dairy farms
in 1000 in % in 1000 in % in 1000 in %
Austria 49.45 2.0 521.68 2.1 31.73 4.8
Belgium 13.32 0.5 523.70 2.1 6.57 1.0
Bulgaria 120.82 4.9 350.18 1.4 42.57 6.5
Cyprus 0.24 0.0 22.65 0.1 0.20 0.0
Czech Republic 5.62 0.2 416.52 1.7 1.77 0.3
Germany 101.07 4.1 4,076.38 16.7 74.26 11.3
Denmark 5.38 0.2 545.42 2.2 4.46 0.7
Estonia 6.08 0.2 107.84 0.4 2.33 0.4
Spain 37.29 1.5 974.86 4.0 26.64 4.1
Finland 14.39 0.6 296.07 1.2 12.25 1.9
France 93.12 3.7 3,814.63 15.7 55.04 8.4
Greece 8.02 0.3 157.41 0.6 2.62 0.4
Hungary 12.17 0.5 265.43 1.1 5.91 0.9
Ireland 21.32 0.9 1,058.21 4.3 19.30 2.9
Italy 62.79 2.5 1,890.91 7.8 26.07 4.0
Lithuania 123.17 5.0 398.37 1.6 32.33 4.9
Luxembourg 1.09 0.0 40.04 0.2 0.64 0.1
Latvia 43.69 1.8 182.32 0.7 22.08 3.4
Malta 0.19 0.0 8.08 0.0 0.10 0.0
Netherlands 24.51 1.0 1,468.30 6.0 18.90 2.9
Poland 651.05 26.2 2,767.78 11.4 105.26 16.0
Portugal 13.50 0.5 272.66 1.1 9.59 1.5
Romania 1,012.41 40.7 1,586.69 6.5 117.57 17.9
Sweden 7.10 0.3 369.65 1.5 6.49 1.0
Slovenia 19.20 0.8 124.19 0.5 7.39 1.1
Slovakia 11.54 0.5 177.22 0.7 6.74 1.0
United Kingdom 28.14 1.1 1,953.49 8.0 17.83 2.7
EU-27 2,486.67 100.0 24,370.68 100.0 656.64 100.0
Source: Eurostat (FSS).
The shares of dairy cows in the total number of dairy cows that are kept on specialist farms are in
general higher than the corresponding shares in terms of holdings (Table 2.34). This reveals that the
scale of specialist dairy farms tends to be larger than that of non-specialist dairy farms. In 2007, in 7 out
of the EU-15 Member States (notably Denmark, Finland, Ireland, the Netherlands, Portugal, Sweden and
the UK) more than 90% of the total number of dairy cows was in specialist dairy herds. In the EU-10,
this was the case only for Cyprus. In new Member States such as Romania, the Czech Republic, Slovakia,

69
Lithuania, and Poland, where more than 50% of total dairy cows is kept on non-specialist dairy farms,
these farms are still important for understanding changes in milk supply.
Table 2.34 % TF 41 farms and cows kept at TF 41 as % of all cows, 2000-2007
2000 2003 2005 2007 2000 2003 2005 2007
Austria 61.6 58.2 68.0 64.2 69.3 75.0 83.5 81.3
Belgium 48.5 51.4 48.7 49.3 61.3 63.2 61.0 62.7
Denmark 77.6 80.3 82.1 82.9 84.7 88.5 92.8 92.7
Finland 89.8 87.6 88.1 85.1 94.1 92.9 93.6 92.1
France 59.5 58.6 59.1 62.9 61.3 61.6
Germany 60.3 70.7 70.6 73.5 61.8 71.5 71.4 75.4
Greece 16.9 26.8 29.0 32.7 44.9 59.6 69.1 71.5
Ireland 82.6 86.5 88.8 90.5 90.7 92.1 93.5 95.1
Italy 66.9 71.7 53.8 41.5 85.3 86.5 74.5 59.9
Luxembourg 74.0 71.2 71.1 58.7 77.0 75.0 74.8 71.7
Netherlands 76.3 87.6 87.4 77.1 89.8 93.6 93.4 91.5
Spain 60.3 70.0 72.8 71.4 80.2 87.3 89.6 88.1
Sweden 92.0 94.8 91.7 91.4 93.6 94.9 92.0 91.9
United Kingdom 78.9 81.0 80.9 63.4 84.6 88.1 88.8 90.8
Cyprus 88.0 83.3 83.3 93.1 94.9 94.2
Czech Republic 23.8 27.1 31.5 12.7 15.4 17.5
Estonia 32.1 25.5 38.3 71.9 67.0 75.8
Hungary 29.5 31.5 43.1 48.6 36.4 40.8 45.9 47.0
Latvia 8.4 12.5 26.1 50.5 18.9 30.3 48.8 66.1
Lithuania 14.1 17.0 26.2 19.8 27.7 38.0
Malta 70.6 61.1 52.6 83.2 84.0 83.0
Poland 14.0 11.9 16.2 20.5 25.8 39.5
Portugal 43.0 52.0 65.1 71.0 80.8 88.3 94.0 94.8
Slovakia 51.7 29.5 47.8 58.4 16.5 15.4 23.2 32.9
Slovenia 45.3 53.3 50.8 38.5 63.1 74.5 75.1 64.7
Bulgaria 24.7 33.7 35.2 33.3 47.9 54.3
Romania 4.0 13.7 11.6 6.1 19.6 18.8
EU 56.4 21.4 25.4 26.4 74.7 63.3 64.3 66.1
Source: Eurostat (FSS).
Table 2.35 shows the evolution of average herd sizes from 2000 to 2007, and indicates that even if herd
size may be growing in some countries on both the specialist and non-specialist dairy farms, overall the
share of production is shifting towards the specialist units (farm type TF 41).

70
Table 2.35 Evolution of herd sizes and their output by Member State, 2000 and 2007
Member State Herd size (number of cows/farm) Share of total milk production
Specialist Non-specialist Specialist Non-specialist
2000 2007 2000 2007 2000 2007 2000 2007
Belgium 49 50 33 35 0.67 0.72 0.33 0.28
Denmark 64 119 45 68 0.92 0.95 0.08 0.05
Germany 42 50 35 41 0.79 0.85 0.21 0.15
Greece 24 7 0.71 0.29
Spain 26 31 14 4 0.90 0.93 0.10 0.07
France 38 46 36 41 0.69 0.74 0.31 0.26
Ireland 43 55 23 20 0.90 0.97 0.10 0.03
Italy 33 48 14 16 0.92 0.93 0.08 0.07
Luxembourg 39 43 35 37 0.75 0.79 0.25 0.21
Netherlands 59 72 31 62 0.96 0.96 0.04 0.04
Austria 17 19 11 11 0.51 0.61 0.49 0.39
Portugal 23 29 3 10 0.95 0.99 0.05 0.01
Finland 19 24 12 14 0.98 0.98 0.02 0.02
Sweden 38 53 19 32 0.95 0.93 0.05 0.07
United Kingdom 90 118 55 81 0.93 0.95 0.07 0.05
EU-15 average 41 51 25 25 0.83 0.87 0.17 0.13
2004 2007 2004 2007 2004 2007 2004 2007
Cyprus
Czech Republic 68 93 154 158 0.24 0.28 0.76 0.72
Estonia 40 63 32 17 0.75 0.86 0.25 0.14
Hungary 27 54 24 37 0.50 0.45 0.50 0.55
Lithuania 12 14 8 8 0.41 0.56 0.59 0.44
Latvia 18 14 7 8 0.69 0.71 0.31 0.29
Malta - 63 0.99 0.01
Poland 16 16 7 6 0.60 0.63 0.40 0.37
Slovakia 148 190 248 199 0.24 0.19 0.76 0.81
Slovenia 12 15 8 8 0.89 0.80 0.11 0.20
EU-10 average 18 18 8 8 0.54 0.56 0.46 0.44
Bulgaria 10 8 0.76 0.24
Romania 4 2 0.72 0.28
EU-02 average 5 3 0.76 0.24
EU-27 average 31 10 0.83 0.17
Source: EU-FADN.
2.3.2 Dairy herds in Less-Favoured Areas
Table 2.36 shows the distribution of dairy cows in Less Favoured Areas (LFAs) and in non-LFAs by
Member State. The distribution of total holdings and specialist dairy holdings in the two area types per
Member State is given in Table 2.37.
The evolution of all farm holdings and specialist dairy holdings in both types of LFA regions (non-
mountainous and mountainous) and in non-LFA areas is remarkably similar. Generally, specialist dairy
farms retained a higher share than average in all areas, with country-specific exceptions (for example,
Sweden). Because it is a comparison between 2000 and 2007, this table does not report the distribution
of all holdings and specialist livestock grazing holdings as of 2007, which is given in Table 2.35.
Effectively, the EU-12 countries were not members of the EU in 2000, and therefore their territory was
not zoned according to LFA criteria. Nevertheless, the farms that were in non-LFA zones in 2007 were
also in the same non-LFA zones in 2000, so this comparison between 2000 and 2007 remains valid.
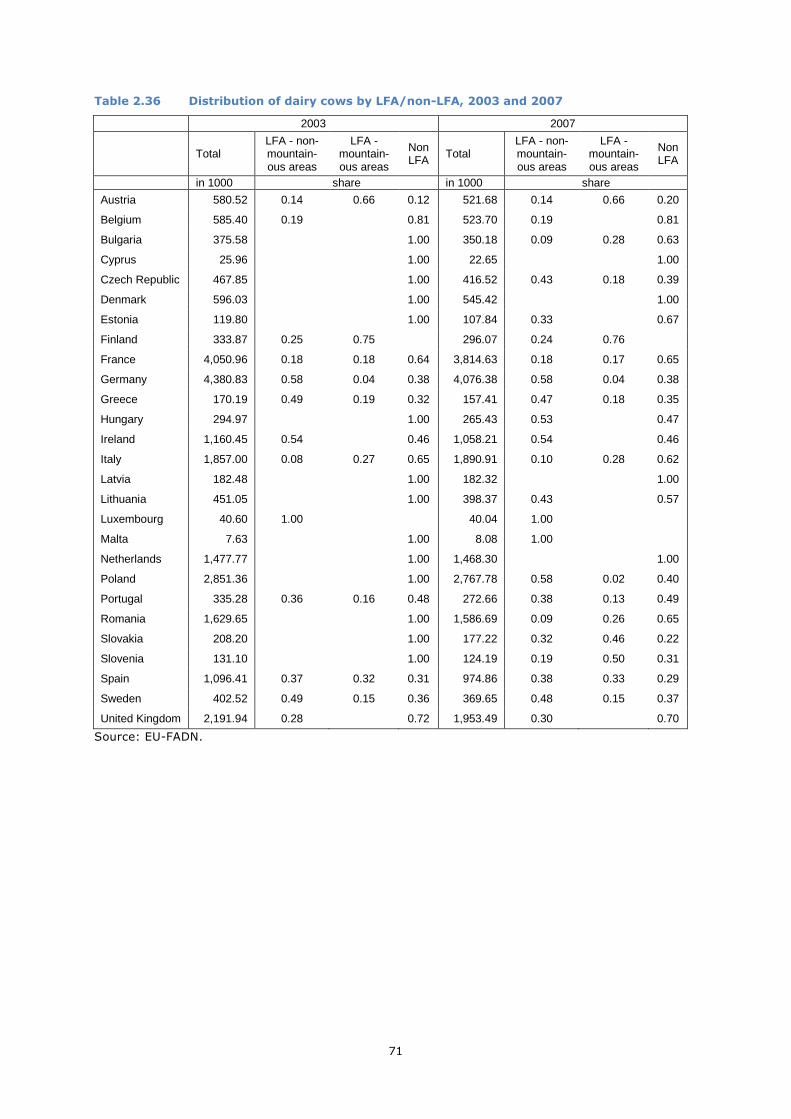
71
Table 2.36 Distribution of dairy cows by LFA/non-LFA, 2003 and 2007
2003 2007
Total LFA - non-mountain-ous areas
LFA - mountain-ous areas
Non LFA Total
LFA - non-mountain-ous areas
LFA - mountain-ous areas
Non LFA
in 1000 share in 1000 share
Austria 580.52 0.14 0.66 0.12 521.68 0.14 0.66 0.20
Belgium 585.40 0.19 0.81 523.70 0.19 0.81
Bulgaria 375.58 1.00 350.18 0.09 0.28 0.63
Cyprus 25.96 1.00 22.65 1.00
Czech Republic 467.85 1.00 416.52 0.43 0.18 0.39
Denmark 596.03 1.00 545.42 1.00
Estonia 119.80 1.00 107.84 0.33 0.67
Finland 333.87 0.25 0.75 296.07 0.24 0.76
France 4,050.96 0.18 0.18 0.64 3,814.63 0.18 0.17 0.65
Germany 4,380.83 0.58 0.04 0.38 4,076.38 0.58 0.04 0.38
Greece 170.19 0.49 0.19 0.32 157.41 0.47 0.18 0.35
Hungary 294.97 1.00 265.43 0.53 0.47
Ireland 1,160.45 0.54 0.46 1,058.21 0.54 0.46
Italy 1,857.00 0.08 0.27 0.65 1,890.91 0.10 0.28 0.62
Latvia 182.48 1.00 182.32 1.00
Lithuania 451.05 1.00 398.37 0.43 0.57
Luxembourg 40.60 1.00 40.04 1.00
Malta 7.63 1.00 8.08 1.00
Netherlands 1,477.77 1.00 1,468.30 1.00
Poland 2,851.36 1.00 2,767.78 0.58 0.02 0.40
Portugal 335.28 0.36 0.16 0.48 272.66 0.38 0.13 0.49
Romania 1,629.65 1.00 1,586.69 0.09 0.26 0.65
Slovakia 208.20 1.00 177.22 0.32 0.46 0.22
Slovenia 131.10 1.00 124.19 0.19 0.50 0.31
Spain 1,096.41 0.37 0.32 0.31 974.86 0.38 0.33 0.29
Sweden 402.52 0.49 0.15 0.36 369.65 0.48 0.15 0.37
United Kingdom 2,191.94 0.28 0.72 1,953.49 0.30 0.70
Source: EU-FADN.
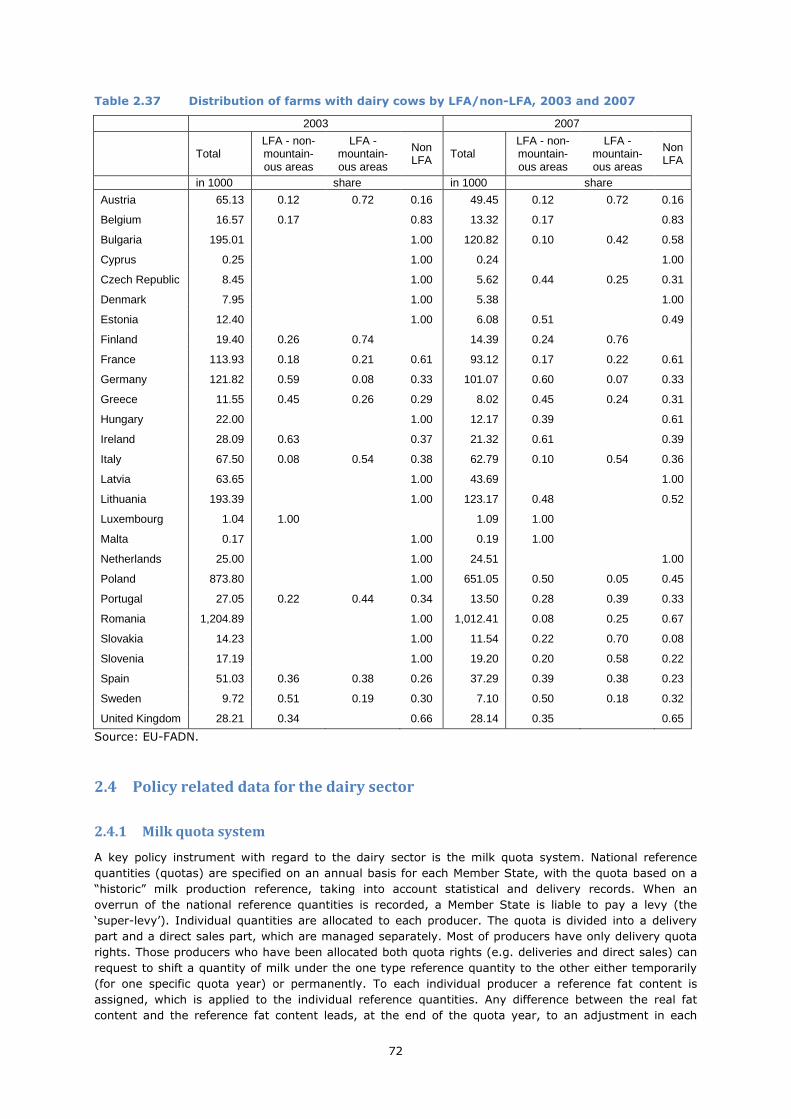
72
Table 2.37 Distribution of farms with dairy cows by LFA/non-LFA, 2003 and 2007
2003 2007
Total LFA - non-mountain-ous areas
LFA - mountain-ous areas
Non LFA Total
LFA - non-mountain-ous areas
LFA - mountain-ous areas
Non LFA
in 1000 share in 1000 share
Austria 65.13 0.12 0.72 0.16 49.45 0.12 0.72 0.16
Belgium 16.57 0.17 0.83 13.32 0.17 0.83
Bulgaria 195.01 1.00 120.82 0.10 0.42 0.58
Cyprus 0.25 1.00 0.24 1.00
Czech Republic 8.45 1.00 5.62 0.44 0.25 0.31
Denmark 7.95 1.00 5.38 1.00
Estonia 12.40 1.00 6.08 0.51 0.49
Finland 19.40 0.26 0.74 14.39 0.24 0.76
France 113.93 0.18 0.21 0.61 93.12 0.17 0.22 0.61
Germany 121.82 0.59 0.08 0.33 101.07 0.60 0.07 0.33
Greece 11.55 0.45 0.26 0.29 8.02 0.45 0.24 0.31
Hungary 22.00 1.00 12.17 0.39 0.61
Ireland 28.09 0.63 0.37 21.32 0.61 0.39
Italy 67.50 0.08 0.54 0.38 62.79 0.10 0.54 0.36
Latvia 63.65 1.00 43.69 1.00
Lithuania 193.39 1.00 123.17 0.48 0.52
Luxembourg 1.04 1.00 1.09 1.00
Malta 0.17 1.00 0.19 1.00
Netherlands 25.00 1.00 24.51 1.00
Poland 873.80 1.00 651.05 0.50 0.05 0.45
Portugal 27.05 0.22 0.44 0.34 13.50 0.28 0.39 0.33
Romania 1,204.89 1.00 1,012.41 0.08 0.25 0.67
Slovakia 14.23 1.00 11.54 0.22 0.70 0.08
Slovenia 17.19 1.00 19.20 0.20 0.58 0.22
Spain 51.03 0.36 0.38 0.26 37.29 0.39 0.38 0.23
Sweden 9.72 0.51 0.19 0.30 7.10 0.50 0.18 0.32
United Kingdom 28.21 0.34 0.66 28.14 0.35 0.65
Source: EU-FADN.
2.4 Policy related data for the dairy sector
2.4.1 Milk quota system
A key policy instrument with regard to the dairy sector is the milk quota system. National reference
quantities (quotas) are specified on an annual basis for each Member State, with the quota based on a
“historic” milk production reference, taking into account statistical and delivery records. When an
overrun of the national reference quantities is recorded, a Member State is liable to pay a levy (the
‘super-levy’). Individual quantities are allocated to each producer. The quota is divided into a delivery
part and a direct sales part, which are managed separately. Most of producers have only delivery quota
rights. Those producers who have been allocated both quota rights (e.g. deliveries and direct sales) can
request to shift a quantity of milk under the one type reference quantity to the other either temporarily
(for one specific quota year) or permanently. To each individual producer a reference fat content is
assigned, which is applied to the individual reference quantities. Any difference between the real fat
content and the reference fat content leads, at the end of the quota year, to an adjustment in each
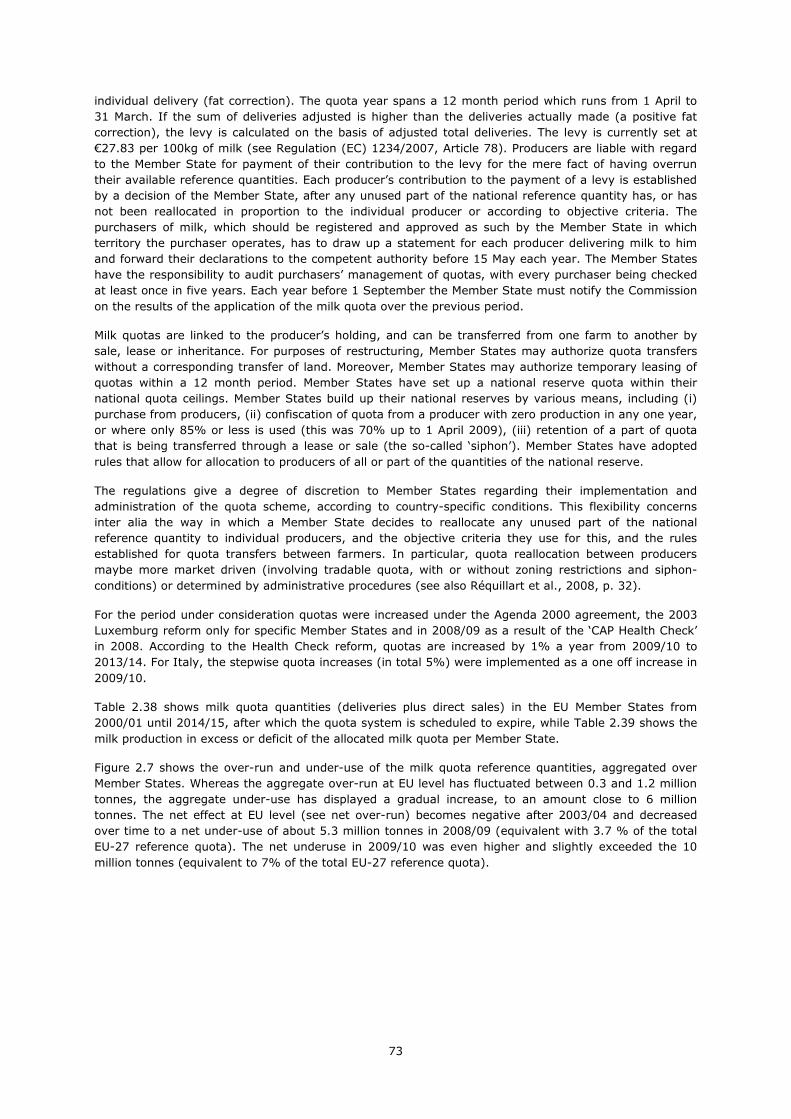
73
individual delivery (fat correction). The quota year spans a 12 month period which runs from 1 April to
31 March. If the sum of deliveries adjusted is higher than the deliveries actually made (a positive fat
correction), the levy is calculated on the basis of adjusted total deliveries. The levy is currently set at
€27.83 per 100kg of milk (see Regulation (EC) 1234/2007, Article 78). Producers are liable with regard
to the Member State for payment of their contribution to the levy for the mere fact of having overrun
their available reference quantities. Each producer’s contribution to the payment of a levy is established
by a decision of the Member State, after any unused part of the national reference quantity has, or has
not been reallocated in proportion to the individual producer or according to objective criteria. The
purchasers of milk, which should be registered and approved as such by the Member State in which
territory the purchaser operates, has to draw up a statement for each producer delivering milk to him
and forward their declarations to the competent authority before 15 May each year. The Member States
have the responsibility to audit purchasers’ management of quotas, with every purchaser being checked
at least once in five years. Each year before 1 September the Member State must notify the Commission
on the results of the application of the milk quota over the previous period.
Milk quotas are linked to the producer’s holding, and can be transferred from one farm to another by
sale, lease or inheritance. For purposes of restructuring, Member States may authorize quota transfers
without a corresponding transfer of land. Moreover, Member States may authorize temporary leasing of
quotas within a 12 month period. Member States have set up a national reserve quota within their
national quota ceilings. Member States build up their national reserves by various means, including (i)
purchase from producers, (ii) confiscation of quota from a producer with zero production in any one year,
or where only 85% or less is used (this was 70% up to 1 April 2009), (iii) retention of a part of quota
that is being transferred through a lease or sale (the so-called ‘siphon’). Member States have adopted
rules that allow for allocation to producers of all or part of the quantities of the national reserve.
The regulations give a degree of discretion to Member States regarding their implementation and
administration of the quota scheme, according to country-specific conditions. This flexibility concerns
inter alia the way in which a Member State decides to reallocate any unused part of the national
reference quantity to individual producers, and the objective criteria they use for this, and the rules
established for quota transfers between farmers. In particular, quota reallocation between producers
maybe more market driven (involving tradable quota, with or without zoning restrictions and siphon-
conditions) or determined by administrative procedures (see also Réquillart et al., 2008, p. 32).
For the period under consideration quotas were increased under the Agenda 2000 agreement, the 2003
Luxemburg reform only for specific Member States and in 2008/09 as a result of the ‘CAP Health Check’
in 2008. According to the Health Check reform, quotas are increased by 1% a year from 2009/10 to
2013/14. For Italy, the stepwise quota increases (in total 5%) were implemented as a one off increase in
2009/10.
Table 2.38 shows milk quota quantities (deliveries plus direct sales) in the EU Member States from
2000/01 until 2014/15, after which the quota system is scheduled to expire, while Table 2.39 shows the
milk production in excess or deficit of the allocated milk quota per Member State.
Figure 2.7 shows the over-run and under-use of the milk quota reference quantities, aggregated over
Member States. Whereas the aggregate over-run at EU level has fluctuated between 0.3 and 1.2 million
tonnes, the aggregate under-use has displayed a gradual increase, to an amount close to 6 million
tonnes. The net effect at EU level (see net over-run) becomes negative after 2003/04 and decreased
over time to a net under-use of about 5.3 million tonnes in 2008/09 (equivalent with 3.7 % of the total
EU-27 reference quota). The net underuse in 2009/10 was even higher and slightly exceeded the 10
million tonnes (equivalent to 7% of the total EU-27 reference quota).

74
Table 2.38 Evolution of milk quotas in EU MS, 2000/1 – 2014/15, 1000 t
2000/1 2001/4 2004/6 2006/7 2007/8 2008/9 2009/10 2010/11 2011/12 2012/13 2013/15
Austria 2,749 2,749 2,750 2,764 2,778 2,847 2,876 2,905 2,934 2,963 2,993
Belgium 3,310 3,310 3,310 3,241 3,344 3,427 3,462 3,496 3,531 3,566 3,602
Bulgaria 979 999 1,009 1,018 1,028 1,039 1,049
Cyprus 145 145 145 148 149 151 153 154 156
Czech Rep. 2,682 2,738 2,738 2,793 2,821 2,849 2,877 2,906 2,935
Denmark 4,455 4,455 4,455 4,478 4,500 4,613 4,659 4,705 4,752 4,800 4,848
Estonia 624 646 646 659 666 673 679 6,869 693
Finland 2,406 2,406 2,407 2,419 2,431 2,492 2,517 2,542 2,567 2,593 2,619
France 24,236 24,236 24,236 24,537 24,478 25,091 25,342 25,582 25,582 26,110 26,371
Germany 27,865 27,865 27,865 27,864 28,142 28,847 29,136 29,427 29,722 30,019 30,319
Greece 675 701 821 821 821 837 845 854 862 871 880
Hungary 1,947 1,990 1,990 2,030 2,050 2,071 2,091 2,112 2,133
Irelands 5,342 5,396 5,396 5,396 5,396 5,504 5,559 5,670 5,670 5,727 5,784
Italy 10,314 10,530 10,530 10,530 10,530 10,741 11,289 11,289 11,289 11,289 11,289
Latvia 695 728 729 743 751 758 766 773 781
Lithuania 1,646 1,704 1,705 1,739 1,756 1,774 1,792 1,809 1,828
Luxembourg 269 269 269 270 272 279 281 284 287 290 293
Malta 49 49 49 50 51 51 52 52 52
Netherlands 11,075 11,075 11,075 11,130 11,185 11,466 11,580 11,696 11,813 11,931 12,050
Poland 8,964 9,380 9,380 9,568 9,663 9,706 9,858 9,956 10,056
Portugal 1,872 1,870 1,870 1,930 3,057 31,148 3,149 3,181 3,213 3,245 3,277
Romania 1,939 1,987 2,007 2,027 2,048 2,068 2,089
Slovakia 1,013 1,040 1,041 1,062 1,072 1,083 1,094 1,105 1,116
Slovenia 560 576 576 588 594 600 606 612 618
Spain 5,917 6,117 6,117 6,117 6,117 6,239 6,302 6,365 6,428 6,493 6,558
Sweden 3,303 3,303 3,303 3,320 3,336 3,420 3,454 3,488 3,523 3,558 3,594
UK 14,603 14,610 14,610 14,683 14,756 15,125 15,276 15,429 15,583 15,739 15,897
EU-15 118,389 118,893
EU-25 137,338 138,496
EU-27 143,060 146,412 148,316 149,686 150,800 152,467 153,880 Source: Regulations (EC) 1255/1999, 1234/2007 and 72/2009.
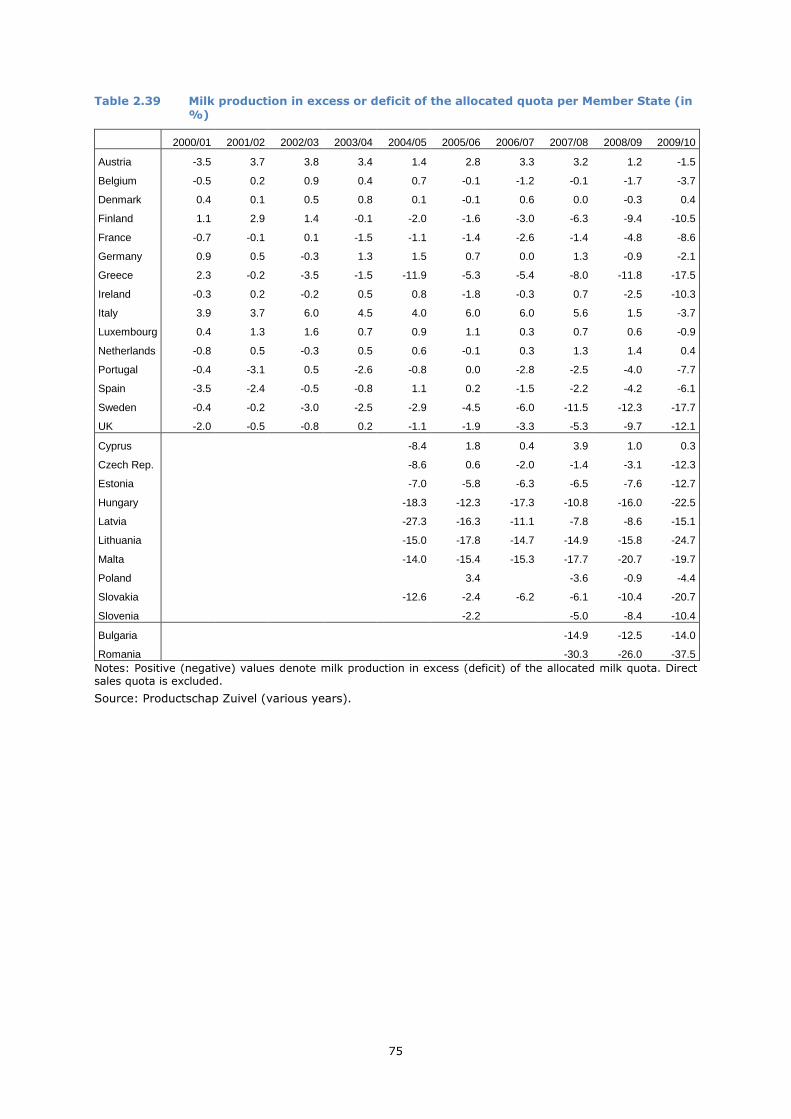
75
Table 2.39 Milk production in excess or deficit of the allocated quota per Member State (in %)
2000/01 2001/02 2002/03 2003/04 2004/05 2005/06 2006/07 2007/08 2008/09 2009/10
Austria -3.5 3.7 3.8 3.4 1.4 2.8 3.3 3.2 1.2 -1.5
Belgium -0.5 0.2 0.9 0.4 0.7 -0.1 -1.2 -0.1 -1.7 -3.7
Denmark 0.4 0.1 0.5 0.8 0.1 -0.1 0.6 0.0 -0.3 0.4
Finland 1.1 2.9 1.4 -0.1 -2.0 -1.6 -3.0 -6.3 -9.4 -10.5
France -0.7 -0.1 0.1 -1.5 -1.1 -1.4 -2.6 -1.4 -4.8 -8.6
Germany 0.9 0.5 -0.3 1.3 1.5 0.7 0.0 1.3 -0.9 -2.1
Greece 2.3 -0.2 -3.5 -1.5 -11.9 -5.3 -5.4 -8.0 -11.8 -17.5
Ireland -0.3 0.2 -0.2 0.5 0.8 -1.8 -0.3 0.7 -2.5 -10.3
Italy 3.9 3.7 6.0 4.5 4.0 6.0 6.0 5.6 1.5 -3.7
Luxembourg 0.4 1.3 1.6 0.7 0.9 1.1 0.3 0.7 0.6 -0.9
Netherlands -0.8 0.5 -0.3 0.5 0.6 -0.1 0.3 1.3 1.4 0.4
Portugal -0.4 -3.1 0.5 -2.6 -0.8 0.0 -2.8 -2.5 -4.0 -7.7
Spain -3.5 -2.4 -0.5 -0.8 1.1 0.2 -1.5 -2.2 -4.2 -6.1
Sweden -0.4 -0.2 -3.0 -2.5 -2.9 -4.5 -6.0 -11.5 -12.3 -17.7
UK -2.0 -0.5 -0.8 0.2 -1.1 -1.9 -3.3 -5.3 -9.7 -12.1
Cyprus -8.4 1.8 0.4 3.9 1.0 0.3
Czech Rep. -8.6 0.6 -2.0 -1.4 -3.1 -12.3
Estonia -7.0 -5.8 -6.3 -6.5 -7.6 -12.7
Hungary -18.3 -12.3 -17.3 -10.8 -16.0 -22.5
Latvia -27.3 -16.3 -11.1 -7.8 -8.6 -15.1
Lithuania -15.0 -17.8 -14.7 -14.9 -15.8 -24.7
Malta -14.0 -15.4 -15.3 -17.7 -20.7 -19.7
Poland 3.4 -3.6 -0.9 -4.4
Slovakia -12.6 -2.4 -6.2 -6.1 -10.4 -20.7
Slovenia -2.2 -5.0 -8.4 -10.4
Bulgaria -14.9 -12.5 -14.0
Romania -30.3 -26.0 -37.5 Notes: Positive (negative) values denote milk production in excess (deficit) of the allocated milk quota. Direct sales quota is excluded.
Source: Productschap Zuivel (various years).
76
Figure 2.7 Overrun and underuse of milk quota in the EU
-12
-10
-8
-6
-4
-2
0
2
2000
/01
2001
/02
2002
/03
2003
/04
2004
/05
2005
/06
2006
/07
2007
/08
2008
/09
2009
/10
mill
ion
tonn
es
overrun
underuse
net overrun
Source: DG AGRI (various years).
2.4.2 Market support: ‘safety net’ intervention
Since the 2003 reform and as in other sectors, the elements of dairy market support are increasingly
oriented towards a ‘safety net’ approach, with public intervention (buying into storage) being a measure
of last resort. The prevailing rules on intervention are laid down in Chapter 1 of Regulation (EC)
1234/2007. Only butter and skim milk powder are eligible for public intervention. Intervention is
accessible from March 1st to August 31st of any year. As a result of the 2003 reform, butter and SMP
intervention prices were reduced step by step over a four year period, beginning on 1 July 2004 (Table
2.40). The cumulative percentage declines in the butter and SMP intervention prices were 25% and 15%,
respectively. The intervention prices did not change with the Single CMO Regulation (Regulation (EC)
1234/2007). Most recently, the SMP intervention price was further reduced by another 3% within the so-
called mini milk package (Regulation (EC) 361/2008).
Table 2.40 Intervention prices (and percentage declines) for butter and SMP, €/100kg
Product\year 2003/04 2004/04 2005/06 2006/07 2007/08 2008/09 and onwards
Butter 328.20 305.23 282.44 259.52 246.39 246.39
(-7%) (-7%) (-7%) (-4%) (0%)
SMP 205.52 195.24 184.97 174.69 174.69 169.80
(-5%) (-5%) (-5%) (0%) (-3%)
Source: Regulations (EC) 1787/2003, 1234/2007 and 361/2008.
Buying in takes place at a guaranteed price (at 90% of intervention price for butter and for SMP at the
intervention price) for the quantities offered for intervention until the thresholds given in Table 2.41
below. The Commission may continue buying in additional quantities using a tendering procedure and
without a guaranteed price.

77
Table 2.41 Threshold levels for butter and SMP intervention, 1000 t
Product\year 2004 2005 2006 2007 2008 and onwards
Butter 70 60 50 40 30
SMP 109 109 109 109 109
Source: Regulation (EC) 1787/2003.
Figure 2.8 shows the end-of-year public intervention stocks for butter and skim milk powder over the last
decade. In 2009, the sharp decline in commodity prices resulted in the adoption of ‘emergency
measures’ that included keeping intervention open between 1 September and 28 February 2010, and
potentially over the winter of 2010/11, depending on how the market situation develops.5
Figure 2.8 Public intervention stocks for butter and skim milk powder (SMP) on 31 December, 2000-2010, 1000 t
0
50
100
150
200
250
300
2000 2001 2002 2003 2004 2005 2006 2007 2008 2009 2010
Butter SMP
Source: DG AGRI (various years).
With regard to skim milk powder, the largest quantity moved into intervention storage over the last
decade was purchased in 2009. Germany and France in particular applied this instrument in 2009 and
2010. For butter, the largest quantity was purchased in 2003. Besides Germany and France, butter has
been purchased quite heavily in Ireland, Spain, the Netherlands, Portugal and the United Kingdom.
2.4.3 Direct aid
By way of compensation for the cuts in intervention prices, from 2004 to 2007 producers qualify for
support payments paid directly to producers. These payments, which will be paid per holding and
calendar year, consist initially of two elements: the dairy premiums, paid equally to all milk producers
and additional payments paid to milk producers according to criteria decided upon by the Member
States. Following Regulation (EC) 1782/2003 (Art. 95) milk producers were granted a dairy premium
that will be paid on the individual reference quantity for milk on 31st of March on the holding of the
corresponding calendar year. It amounted to:
• €8.15/tonne for the calendar year 2004,
5 In practice, intervention buying-in stopped for butter in early September 2009 and in early October 2009 for SMP. Tenders for intervention during the period December 2009 and February 2010 were not opened due to the improved market situation.
78
• €16.31/tonne for the calendar year 2005,
• €24.49/tonne for the calendar years 2006 and 2007.
Beyond the dairy premium, Member States were allowed to make additional payments to producers on a
yearly basis. A Member State may retain at most up to 10% of the component of a national contributed
by a certain sector (i.e. the dairy sector). The additional payments for milk producers are listed in Table
2.42.
Table 2.42 Additional payments for milk producers, million euro
National upper limit Expenditure
2004 2005 2006 2007 2004 2005 2006 2007
Austria 10.1 20.2 30.3 30.3 10.1 19.5 29.0 0.0
Belgium 12.1 24.3 36.5 36.5 12.1 23.4 0.0 0.0
Demark 13.3 32.7 49.1 49.1 16.3 0.0 0.0 0.0
Finland 8.8 17.7 26.5 26.5 8.8 17.1 0.0 0.0
France 88.7 177.9 266.8 266.8 88.7 171.6 0.0 0.0
Germany 102.0 204.5 306.8 306.8 101.0 0.0 0.0 0.0
Greece 2.3 4.6 6.9 6.9 2.3 4.5 6.6 0.0
Ireland 19.2 38.5 57.8 57.8 19.0 0.0 0.0 0.0
Italy 36.3 72.9 109.5 109.5 36.3 69.7 0.0 0.0
Luxembourg 1.0 2.0 3.0 3.0 1.0 0.0 0.0 0.0
Netherlands 40.5 81.3 121.9 121.9 40.5 78.4 117.1 0.0
Portugal 6.9 13.7 20.6 20.6 6.3 13.5 20.0 0.0
Spain 20.4 40.9 61.3 61.3 20.1 38.4 0.0 0.0
Sweden 12.1 24.2 36.4 36.4 12.2 15.7 23.5 0.0
United Kingdom 53.4 107.1 160.6 160.6 51.2 0.0 0.0 0.0
Source: Regulation (EC) 1782/2003, Article 96 and DG AGRI (unpublished).
Since 2007 for all Member States dairy premiums and additional payments have been included into the
Single Farm Payment. However, as a result of the ‘CAP Health Check’ in 2008, Member States can give
additional support to dairy farmers up to 31 March 2014. A sum of €300 million has been devoted to help
dairy farmers who suffer from the sharp decline in milk prices in 2009. This sum was allocated to
Member States according to 2008/09 quota quantity.
Another form of direct aid payments are complementary national direct payments (CNDP) allocated to
certain accession countries since 2005 (Table 2.43). Part of this aid (percentage varying from 9 to 39 per
cent of total CNDP expenditure) is coupled to dairy production. In the EU-10 Hungary is the Member
State with the highest CNDP expenditure. According to the EU-FADN data, also Malta applies national
aids. The equivalent amounts per tonne of milk vary between €10/tonne and €20/tonne (an exception
being Malta which had higher amount) (see EU-FADN). In the EU-15 only Finland applied national aids to
the dairy sector, with a support rate of approximately €80/tonnes of milk (see EU-FADN). The Finish
national aids follows from schemes applied under Articles 141 and 142 of the Act of Accession.
The various state aids are registered with the European Commission and are recapitulated in Table 2.44.

79
Table 2.43 CNDP payments, 2005-2008, € and %
2005 2006
Total
CNDP Envelope for Dairy
% dairy of total
Payments for Dairy
% of dairy envelope paid
Total CNDP
Envelope for Dairy
% dairy of total
Payments for Dairy
% of dairy envelope paid
Bulgaria
Cyprus 26,224 3,502 13.35 3,414 97.49
Czech Rep.
Estonia 46,506 17,824 38.33 10,067 56.48
Hungary 430,354 37,836 8.79 36,364 96.11 454,428 61,009 13.43 53,463 87.63
Latvia 61,271 11,484 18.74 6,944 60.47 69,260 20,051 28.95 14,685 73.24
Lithuania 124,161 22,892 18.44 14,710 64.26 159,447 43,725 27.42 16,176 36.99
Malta
Poland
Romania
Slovakia
Slovenia 7,077 11,344 2007 2008
Total
CNDP Envelope for Dairy
% dairy of total
Payments for Dairy
% of dairy envelope paid
Total CNDP
Envelope for Dairy
% dairy of total
Payments for Dairy
% of dairy envelope paid
Bulgaria 169,108 15,622 9.24 13,145 84.14
Cyprus 34,462 3,492 10.13 3,364 96.33 32,403 3,474 10.72 3,252 93.61
Czech Rep.
Estonia 48,198 18,845 39.10 16,170 85.81 48,987 17,880 36.50 17,691 98.94
Hungary 403,011 65,552 16.27 62,050 94.66 518,800 63,873 12.31 63,194 98.94
Latvia 71,402 21,394 29.96 19,839 92.73 72,944 20,368 27.92 19,706 96.75
Lithuania 180,967 46,295 25.58 20,244 43.73 188,558 42,302 22.43 34,658 81.93
Malta
Poland
Romania
Slovakia Slovenia Source: EU-FADN.

80
Table 2.44 State aid to the dairy sector
Country Sector Scheme Duration
Belgium Raising of dairy cattle, Raising of poultry
N 704 / 2002 - Cessation of livestock activities in the poultry and the cattle sector
09.10.2002 - 30.06.2003
Belgium Raising of dairy cattle N 244 / 2004 – Project fixing mandatory payments for the health and quality of animals and products (dairy)
02.06.2004 - 01.05.2005
Bulgaria Agriculture, forestry and fishing
XA 169 / 2009 - Aid for establishment and maintenance of herd books and for determination of genetic quality and yield of livestock
08.06.2009 - 31.12.2013
Bulgaria Crop and animal production, hunting and related service activities
N 90 / 2010 - Investment aid to agricultural holdings to meet the quality requirements on the production and storage of raw milk laid down in Regulation (EC) 853/2004
09.03.2010 - 31.12.2011
Bulgaria Crop and animal production, hunting and related service activities Manufacture of food products
N 108 / 2010 - State aid under the Temporary Framework to agricultural holdings active in primary production, processing and marketing of agricultural products
19.04.2010 - 31.12.2010
Cyprus XA 118 / 2006 - Scheme to provide state aid to the Cyprus Holstein - Friesian Breeders Association
22.12.2006 - 21.12.2011
Cyprus XA 395 / 2007 - Aid à l'association chypriote d'exploitants de bovins Holstein-Friesian.
19.12.2007 -
Cyprus Raising of dairy cattle Raising of poultry Raising of sheep and goats
XA 455 / 2008 - Programme for the eradication and monitoring of Brucellosis of cattle and ovines
30.12.2008 - 31.12.2009
Cyprus XA 138 / 2009 - Program for the Monitoring of Transmissible Bovine Spongiform Encephalopathy
29.04.2009 -31.12.2009
Cyprus XA 274 / 2009 - Program of extirpation and monitoring of brucellosis in Cattle and Ovines.
13.01.2010 - 31.12.2010
Cyprus XA 4 / 2010 - Programme for the monitoring of bovine spongiform Encephalopathy
15.01.2010 - 31.12.2010
Cyprus Agriculture, forestry and fishing
XA 104 / 2010 - Aide à l'association chypriote d'exploitants de bovins Holstein-Friesian
01.01.2011 -31.12.2013
Czech Rep. N 427 / 2005 - National Eradication program on Infective Beef Rhinotracheitidis
01.01.2006 - 31.12.2012
Denmark Animal production N 341 / 2004 - Co-financing of expenses paid by slaughterhouses and processing plants in relation to the monitoring of TSE among bovine, ovine and caprine animals
02.08.2004 - 31.12.2004
Denmark N 277 / 2005 - Financing of expenses paid by slaughterhouses and processing plants in relation to the monitoring of TSE among bovine, ovine and caprine animals
03.06.2005 - 31.12.2005
Denmark Agriculture, forestry and fishing
N 597 / 2008 - Production and pro mille funds in agriculture
01.01.2010 - 31.12.2013
Estonia Agriculture, forestry and fishing
XA 93 / 2008 - Support for the breeding of agricultural animals
16.02.2008 - 31.12.2011
Finland Agriculture, forestry and fishing
N635/2003 Amendment of Finnvera loan program for the processing and marketing of agricultural products
13.05.2004
Hungary XA 73 / 2007 - State aid for the prevention and eradication of certain animal diseases
04.05.2007
Lithuania Crop and animal production, hunting and related service
N 683 / 2007 - Compensation of losses 22.07.2007 -

81
Country Sector Scheme Duration
activities Manufacture of food products
caused by transmissible animal diseases 31.12.2013
Slovakia XA 255 / 2009 - State aid scheme for prevention and eradication of animal diseases as amended by appendix 1
27.11.2009 - 31.12.2013
Sweden Raising of dairy cattle N 164 / 2003 - Aid for TSE and BSE tests 15.04.2003 - 06.10.2003
Source: European Commission (2010c).
2.4.4 Private intervention storage
In order to balance the milk market and stabilise market prices, the Common Market Organisation has
provided for the granting of aid for private storage with respect to cream, certain butter products and
certain cheese products (see Regulation (EC) 1234/2007, Article 28). The Commission determines which
national quality grades should be met before a product is eligible for the private storage scheme. The
amount of aid is fixed by the Commission, taking into account storage costs and the likely trend of the
market price. Tables 2.45 up to 2.47 provide further details of the aids applied and the volumes put into
private storage.
Since the cheese market is steadily expanding, with increasing demand on domestic and international
markets, the Commission decided that the private storage of high value, market driven products like
cheese is no longer necessary. The permanent and optional aids for private storage of cheese were
therefore abolished (see Regulation (EC) 72/2009).
Table 2.45 Economic details of private storage aid for butter, 2001-2007
2001 2002 2003 2004 2005 2006 2007
Fixed costs (€/tonne) 24.00 24.00 24.00 24.00 17.92 17.64 15.83
Daily allowance (€/tonne/day) 0.35 0.35 0.35 0.35 0.33 0.31 0.30
Interest (%/year) 4.50 3.00 2.75 2.25 2.25 2.50 3.75
Source: DG AGRI (unpublished).
Table 2.46 Aided quantities of private storage for cheese, 2001-2007, tonnes
Cheese types 2001 2002 2003 2004 2005 2006 2007
Parmigiano-Reggiano 78,301 81,052 81,234 82,353 87,870 81,684 79,564
Grana Padano 104,126 111,380 114,110 61,354 119,021 107,520 102,026
Provolone 9,535 223 57 5,317 4,400 1,848 720
Pecorino-Romano 15,000 15,000 15,000 19,000 16,205 12,918 14,316
Kefalotyri/Kasseri 1,778 1,353 871 403 423 147 194
Other long-keeping cheeses 21,701 21,040 20,780 18,905 23,425 19,522 17,793
Total 230,441 230,048 232,052 187,332 251,344 223,639 214,612
Source: DG AGRI (unpublished).

82
Table 2.47 Private storage aid for different types of cheese
Grana-Padano
Parmigiano-Regiano Provolone Emmental Kefalotyri Pecorino-
Romano
2001
Fixed Costs (€/tonne) 75.00 75.00 75.00 75.00 75.00 75.00
Daily Allowance (€/tonne/day) 0.35 0.35 0.35 0.35 0.35 0.35
Interest (€/tonne/day) 0.64 0.89 0.52 0.50 0.58 0.52
2002
Fixed Costs (€/tonne) 35.00 35.00 35.00 35.00 35.00 35.00
Daily Allowance (€/tonne/day) 0.35 0.35 0.35 0.35 0.35 0.35
Interest (€/tonne/day) 0.48 0.69 0.39 0.36 0.51 0.46
2003
Fixed Costs (€/tonne) 20.00 20.00 20.00 20.00 20.00 20.00
Daily Allowance (€/tonne/day) 0.25 0.25 0.25 0.25 0.25 0.25
Interest (€/tonne/day) 0.40 0.58 0.32 0.28 0.47 0.38
2004
Fixed Costs (€/tonne) 10.00 10.00 10.00 10.00 10.00 10.00
Daily Allowance (€/tonne/day) 0.25 0.25 0.25 0.25 0.25 0.25
Interest (€/tonne/day) 0.32 0.52 0.26 0.23 0.39 0.28
2005
Fixed Costs (€/tonne) 7.50 7.50 7.50 7.50 7.50 7.50
Daily Allowance (€/tonne/day) 0.20 0.20 0.20 0.20 0.20 0.20
Interest (€/tonne/day) 0.30 0.40 0.25 0.23 0.39 0.28
2006
Fixed Costs (€/tonne) 0.00 0.00 0.00 0.00 0.00 0.00
Daily Allowance (€/tonne/day) 0.10 0.10 0.10 0.10 0.10 0.10
Interest (€/tonne/day) 0.38 0.46 0.30 0.28 0.49 0.35
20071 Aid (€/tonne/day) 0.48 0.56 0.40 0.38 0.59 0.45
Notes: 1) In 2007 there was a single amount of aid (Regulation (EC) 587/2007).
Source: DG AGRI (unpublished).
2.4.5 Export refunds
The historical purpose of export refunds was to enable EU exports to compete on the generally lower-
priced international market. As shown in Table 2.48, expenditure on refunds and subsidised volumes for
butter was higher in the years 2003/4 to 2005/6 than in the late 1990s/early 2000s, and the average
refund per tonne remained around €170-190 per tonne. For cheese, the figures show small fluctuations
around a more or less constant level from the late 1990s to the mid-2000s. By contrast, the figures for
SMP show much more volatility over the same period. From 2006 onwards, the picture changes.
Subsidised volumes and/or the rate of refund paid were much lower for all the product categories shown
in Table 2.48, and export refunds were almost not used at all in 2007/08. However, in January 2009
export refunds were reintroduced to help support EU market prices in the wake of the sharp decline in
world prices. Nonetheless, the quantities subsidised and the refund rates were far lower than in the
earlier part of the decade.
The largest quantities of cheese exported with refunds in 2009/2010 were traded from the Netherlands,
Germany, France and Finland, whereas for skim milk powder in the same period, the largest quantities

83
Table 2.48 Total subsidised exports and average refund paid
Periods from July to June
Quantities in 1000 tonnes Expenditure in million euro Average Refund paid in €/100 kg
Butter SMP Cheese Other dairy products Butter SMP Cheese Other dairy
products Butter SMP Cheese Other dairy products
Weighted average
1995-1996 146 241 422 1157 256 141 438 728 175 58 104 63
1996-1997 276 269 402 1141 552 170 271 732 200 63 68 64
1997-1998 169 176 324 1117 311 116 176 756 184 66 54 68
1998-1999 165 221 226 951 286 192 149 759 173 87 66 80
1999-2000 194 417 305 1104 333 338 236 905 172 81 77 82 90
2000-2001 197 128 305 873 338 26 238 410 171 20 78 47 67
2001-2002 194 87 279 764 325 37 189 402 168 42 68 53 72
2002-2003 292 220 317 833 545 163 268 596 187 74 84 72 95
2003-2004 353 259 321 880 618 142 239 631 175 55 74 72 90
2004-2005 354 212 300 827 519 66 157 409 146 31 52 49 68
2005-2006 295 117 317 737 292 15 141 276 99 13 45 38 49
2006-2007 3 126 291 458 0 26 108 129 3 20 37 28 30
2007-2008 0 0 0 16 0 0 0 2 0 0 0 12 12
2008-2009 98 126 134 466 54 26 25 96 55 20 18 21 24
2009-2010 71 129 128 409 42 32 24 97 59 25 19 24 27
Source: DG AGRI (unpublished).

84
exported with a refund came from Belgium, France and Germany. However, it is important to note that
these products circulate easily within the single market of the EU and EU exporters are free to choose the
port of departure for their products. Therefore, the Member State from which products are exported is
not always the Member State in which they were produced.
2.4.6 Aid for marketing dairy products
Aid measures for the marketing of dairy products within the CAP are: aid for skim milk and SMP used as
animal feed or for casein production, and for butter intended for pastry and ice cream manufacture, or
for direct consumption.6
Budget expenditure on aid for skim milk powder as an animal feedstuff was reduced significantly in the
period after 2000, and was zero in 2010. As laid down in Regulation (EC) 72/2009 aid for skim milk and
SMP for use as feeding stuffs has become an optional scheme, which the Commission may re-activate if
surpluses of milk products build up or are likely to occur, creating or likely to create serious imbalances
in the market. The same applies to the aid for skim milk processed into casein and caseinates. When
relevant, the Commission should fix the aids, taking into account the reference price, market conditions
or may be fixed by means of tendering procedures.
Disposal aid for butter is shown in Table 2.49. It includes welfare schemes, aid to non-profit making
bodies, aid for butter concentrate and aid to food processors. As explained above, the disposal aid for
butter intended for food processors (namely for pastry and ice cream) was abolished under the Health
Check reform.
Table 2.49 Summary of aided disposal of butter, 2000-2009, in 1000t of butter equivalent
Measure Regulation nr 2001 2002 2003 2004 2005 2006 2007 2008 2009
Pastry 400 393 408 411 403 398 130 0 0
Ice cream 76 71 82 79 77 77 26 0 0
Total 1898/05 Chap. II 476 465 490 490 479 475 155 0 0
Ex 2571/97
Non-profitm. organ. 1898/05 Chap. IV 29 27 27 24 24 22 22 18 12
Ex 2191/81
Concentrated butter 1898/05 Chap. III 14 14 14 15 15 15 5 0 0
Ex 429/90
Deprived persons 3149/92 32 27 3 27 34 45 24 0 0
Free sales 2771/99 1 0 0 44 11 50 29 0 0
Total 551 533 535 600 564 607 235 18 12
Source: DG AGRI (various years).
2.4.7 Article 68 (69)
Article 68 (Regulation (EC) No 73/2009, (previously Article 69 of Regulation (EC) No 1782/2003) allows
Member States to grant specific support to farmers for a range of purposes. The specific support should
not exceed 10% of the national ceiling for direct payments of each Member State (Regulation (EC) No
1782/2003). The purposes for which the payments can be used are:
• to protect the environment, improve the quality and marketing of products and to enhance animal
welfare standards ;
• to address disadvantages faced by specific sectors, including dairy, in economically vulnerable or
environmentally sensitive areas as well as for economically vulnerable types of farming;
• to ensure against land abandonment (whenever is a threat) and to address specific disadvantages
of the farmers in such areas;
• to support for risk assurance in the form of contributions to crop insurance premia; and
• in the form of mutual funds to act against animal and plant diseases. 6 Aid for school milk supply is not considered in this study since it will be subject to a separate evaluation.

85
The support should not be trade-distorting, most notably where Article 68 is used to fund agri-
environment type measures beyond those included within Pillar 2. Proposals for payments under Article
68 need to be formally approved by the Commission. As with the rules for other direct payments,
support provided under Article 68 is not subject to national co-financing.
For the evaluation period covered by this study (2003-2009/10) it is the expenditure of Member States
under the (old) Article 69 and involving the dairy sector that is relevant. Spain is the only Member State
where there has been expenditure under Article 69. This is reported in Table 2.50.
Table 2.50 Expenditures applied for and accepted under Article 69
Total number of applications claimed Corresponding amount (1000€) Amount per application
(€)
2006 27,445 19,763 720
2007 25,807 19,763 766
2008 24,212 19,763 816
2009 23,196 19,763 852
Total number of applications accepted
Corresponding amount that has been granted (1000€)
Amount per application (€)
2006 26,780 18,571 693
2007 24,791 18,052 728
2008 22,368 18,143 811
Source: DG AGRI (unpublished).
More recently, other Member States (among them Belgium, Bulgaria, Germany, Estonia, Ireland, Latvia,
Hungary, Austria, Slovakia and Finland) have defined specific support payments under Article 68, that
might affect or target the dairy sector (European Commission, 2010a).
2.4.8 Rural development
Although rural development policies are horizontal policies that do not target any specific commodity or
production activity, they might interact with policy measures aimed at the dairy sector. Dairy farmers are
not only producers of milk, but usually also managers of fixed natural resources and capital (issues that
are specifically addressed by the first two axes of the CAP’s second pillar Rural Development policy). An
indication of participation of EU dairy farmers in rural development activities, such as agri-environmental
schemes, is given by the payments received by dairy farms for participation in projects under the Rural
Development Programme (RDP). Data on dairy farm receipts of RDP payments are available from EU-
FADN. It should be noted that this data source reports only total payments received without identifying
payments specifically affecting dairy activities, or the RDP axis under which the payment was made.
Table 2.51 shows the ratio of RDP payments per average dairy farm relative to the RDP payments per
average non-dairy farm (all other farms) for the period 2000-8. A ratio greater than 1 indicates that the
typical dairy farm received more revenue from participating in RDP activities than the typical non-dairy
farm in its Member State. For three out of the 15 MS (EU-15), notably Finland, Ireland and the UK this
ratio is smaller than 1. For all other EU-15 countries the ratio is greater than 1. The ratio in Denmark is
particularly high, falling below 2 only once over the nine-year period. These ratios have remained
relatively stable for each Member State, although there are marked differences between Member States.
For most EU countries, the average payment per farm increased gradually over the period 2000-2008
(Table 2.52). The highest payments per farm were realised in the EU-10, notably in Slovakia and Czech
Republic. In the EU-15 dairy farmers in Luxembourg, Finland and Sweden received relatively high
payments per farm of approximately €20,000 in 2008, followed by Austria (approximately €10,000/dairy
farm). Since 2003 Spain, the UK, Belgium and to a lesser extent also the Netherlands show a relatively
strong increase in average rural development payments received per dairy farm. Although their growth
rates were high, the average level of payments farmers in these Member States received is still relatively
low. For a few EU-10 countries, the increase since 2004 has been particularly marked (e.g. Hungary and
Poland).

86
Table 2.51 Ratio of RDP payments for dairy farms relative to all farms per EU-15 MS, 2000-2008
2000 2001 2002 2003 2004 2005 2006 2007 2008
Austria 1.17 1.24 1.07 1.07 1.13 1.08 1.10 1.17 1.13
Belgium 1.45 1.34 1.39 1.15 0.82 1.02 1.29 1.16 1.26
Denmark 2.40 2.27 2.37 1.97 2.68 3.21 3.52 4.89 4.25
Finland 0.85 0.89 0.92 0.89 0.90 1.03 0.82 0.93 0.95
France 1.62 1.51 1.52 1.47 1.57 1.56 1.64 1.78 1.71
Germany 1.27 1.21 1.46 1.42 1.28 1.34 1.42 1.33
Greece 5.43 5.59 8.58 5.00
Ireland 0.70 0.87 0.77 0.78 0.78 0.73 0.78 0.76 0.76
Italy 1.84 2.86 2.85 2.98 3.93 3.28 2.75 2.84
Luxembourg 1.35 1.29 1.28 1.23 1.29 1.38 1.45 1.46 1.45
Netherlands 1.05 1.11 1.17 1.13 1.47 1.44 1.41 1.71 1.58
Portugal 2.42 1.85 1.42 1.14 1.40 1.62 1.34 1.66 1.66
Spain 1.85 1.72 1.07 1.33 1.77 1.52 1.46 1.87 2.29
Sweden 2.09 2.20 2.35 2.28 1.43 1.97 2.54 2.23 2.75
UK 0.37 0.27 0.28 0.25 0.32 0.30 0.38 0.35 0.37
Source: own calculations based on EU-FADN.
Table 2.52 Rural Development payments for dairy farms, 2000-2008, €/farm
2000 2001 2002 2003 2004 2005 2006 2007 2008
Austria 8921 10471 10129 10460 11491 11638 11707 10435 10484
Belgium 794 913 1124 1043 926 1280 1940 2289 2771
Denmark 1186 969 1224 1052 4401 2789 3564 3121 6252
Finland 12238 12768 13778 13691 15192 20225 15046 19627 20837
France 2407 2617 3176 3746 4280 4413 4531 4231 4108
Germany 3790 4174 5035 5338 5525 5691 6070 4984
Greece 350 949 1974 3453
Ireland 1356 3077 3302 3254 3768 4054 4936 5018 5091
Italy 1261 1795 2068 1416 1481 2482 1937 1898
Luxembourg 14926 16278 17033 18067 18410 19265 20207 19909 20625
Netherlands 624 1420 1245 1151 1448 1792 1998 2121 2219
Portugal 1029 1204 1216 1272 1624 2267 2077 2131 2028
Spain 214 321 257 321 474 315 565 505 1541
Sweden 8625 11803 14558 12753 11335 15897 17245 17394 19824
UK 1741 1847 1797 1560 2181 2381 3942 4410 3882
Cyprus
Czech Rep. 16469 20166 26147 26465 31943
Estonia 8968 10944 9231 9244 10478
Hungary 136 1768 2168 3924 4946
Latvia 3070 2834 4231 3422 3712
Lithuania 1999 1798 1622 1464 1785
Malta 1798 980 5394 16250 11303
Poland 79 581 1968 1052 1370
Slovakia 34048 86799 125537 135286 144122
Slovenia 2642 2789 2254 2734 2662
Bulgaria 75
Romania 19
Source: own calculations based on EU-FADN data.
87
2.4.9 Other drivers influencing the impact of EU policies on the dairy sector
This section reports on drivers other than the above discussed policies that can affect the dairy sector. To
identify them and understand their importance, one should consider entire dairy supply chain (Table
2.53).
Table 2.53 Overview of drivers affecting different stages of the dairy supply chain
EU-Milk production: facing “new challenges”
• New challenges regarding
o natural side factors (weather turbulences as e.g. drought or heavy rainfalls)
o more volatile milk prices and prices for input factors
o new competitors on the land markets (bio-energy, non-agricultural investors)
o new/more social demands from consumers regarding animal welfare and environmental regulations
• Increasing competition for input factors (especially land and qualified labour)
Dairies/Industry : ensuring high quality milk in adequate quantity
• Face regional re-orientation due to regional changes in milk production
• Increasing impacts of world dairy market on EU markets influence a) prices, b) product portfolios and c) competition among EU-dairies for intra-EU-shares and Exports
• Increasing margin pressure through higher pressure between retailers leading to more pressure on dairies
Marketing: meeting new consumer preferences
• New trends in consumers’ preferences (climatic aspects, animal welfare, convenience, package sizes…)
• Seasonal differences in milk quantity (different amplitude depending on the region and production system)
• Demand volumes influenced more by increasing prices rather than by decreasing prices
• Different consumers’ attitudes towards the general value of food (e.g. higher in France than in Germany)
Logistics: facing higher complexity
• Increasing prices for fuel and energy
• Increasing ecological awareness
• More complex logistic activities related to diverging and more heterogeneous sizes/demands of farmers, component suppliers, dairies and retail markets/export
Retail, Consumption within EU/Export:
more focused on world market developments
• Market power in the retail may change relative to other stages in the supply chain
• Strongly depending on prices – not only for milk but also for supplementary goods (higher awareness of global developments on consumers side)
• Without export subsidies more dependent on own competitiveness
• Not influenced by changing consumers’ preferences within EU but also globally
• Non-tariff trade barriers
• Exchange rate adjustments and fluctuation might affect competitiveness
Source: own compilation.
Dairy farmers are at the beginning of the supply chain. Their decisions on how much milk to produce and
whether to continue dairying certainly depend on the level of the prices for which they can sell their raw
milk and their confidence in prices remaining stable and sufficient to cover costs in the future. Price
fluctuations and in particular price peaks either upwards or downwards as well as the occurrence of such
events were named as influential for farmers decisions (see case study reports). Furthermore, the degree
to which dairy farmers are affected by a policy reform depends on the degree of specialisation of the
farm in a particular activity.
88
The next actors in the supply chain are the processors. Their product mix and the structure of the
markets they sell to can affect their behaviours. The processors interviewed in the case study areas
confirmed different behaviours depending on whether they are selling niche products and are therefore
active in an inelastic market (e.g. special cheese types) or whether they sell on markets with more
elastic demand. In the past, if they were active in international markets they could more easily cope with
domestic changes because they use their international sales for absorbing the internal fluctuations.
However, this flexibility has been reduced by the scaling down of export subsidies. Here again the
product portfolio and the transition period of the policy reforms affect them as well. If the policy change
is for a particular product and this is the only product they are processing and selling, then the
processing companies are highly affected, while if the transition period is short and the policy reforms
are not announced well in advance, then they do not have enough time to adjust.
Marketing strategies and the organisation of work can ease processes and establish an easy entry and
access in markets if they are efficient and effective. With this are meant the type and the length of
contracts among the actors, the existence of intermediates and brokers between the processors and the
final consumers. These elements influence the price transmission over the supply chain and can create
an own dynamic either stabilising or distorting the markets.
At the end of the chain are the final consumers, in both domestic and international markets. Changing
consumption patterns can stem from new and more socially oriented demands from consumers regarding
animal welfare and environmental regulations but also because of changing financial and economic
conditions both in the EU Member States and in foreign markets. With respect to foreign markets, the
processors interviewed also mentioned the importance exchange rate fluctuations or adjustments could
have on the sector’s competitiveness. While recent economic recession in several EU Member States may
lead to different consumption patterns inside the EU, economic growth in big consuming countries such
as China and India can potentially result in new world market balances and therefore new EU market
balances.
The role of transaction and distribution costs (‘logistics’) should also be acknowledged. They add to the
production costs of the final product. If market infrastructure and institutions function effectively and
efficiently, these costs can be reduced.
Finally, the dairy supply chain is part of the agribusiness complex and as such dairy production and
consumption is affected by additional factors that influence agricultural markets, including developments
in the energy sector, both in crude oil prices and in biofuel markets, which affect not only the prices of
feed-stocks but also the prices of agricultural land. Climate change and extreme weather conditions
increase risk and uncertainty in agriculture and hence in dairying.

89
3 Intervention Logic of the CAP measures applicable to dairy
3.1 Introduction: Overview of EU dairy policy prior to the evaluation period
The common market organization for milk and milk products became operational on 1 November 1964.
Its objectives were in line with the general principles for the common agricultural policy laid down in
Article 39 of the Treaty of Rome (1958), namely (1) to increase productivity, by promoting technical
progress and ensuring the optimum use of the factors of production, in particular labour; (2) to ensure a
fair standard of living for the agricultural community; (3) to stabilise markets; (4) to secure availability
of supplies; and (5) to provide consumers with food at reasonable prices.
Given that milk and milk products were heavily subsidised at national level by the six founder members
of the EC and that milk production was perceived as “the basis of the farmer’s income in the EEC” (EC,
1964)7, the first objective of the original dairy policy package was to harmonise the different national
policies in a politically acceptable way, that is without impairing the central role played by this
commodity in supporting farmers’ livelihoods. Thus, a high level of price support was built into the
common market organisation for milk from the outset. As stated in an official communication (EC, 1964),
“the main objective of the market organisation for milk is therefore the ex-farm target price for milk with
a fat content of 3.7% (Articles 17 and 18 of the regulation)”. This price was to be supported by variable
import levies, in order to insulate domestic dairy product prices from those on world markets, and by an
intervention buying system that would take supplies of butter and skim milk powder (SMP) off the
domestic market when their prices fell below an intervention price, store them and subsequently release
them back onto the market when prices recovered. The rational use of such an intervention system is to
stabilise within-year price movements due to (predictable) seasonal fluctuations and (less predictable but
temporary) price shifts. It cannot per se function as a mechanism for more structural, medium term price
support without involving the risk of increasing levels of carry-over stocks, with associated high costs of
storage and product deterioration.
At the time the common market organisation for milk came into force, the EEC of six members had a
joint milk surplus of about 1.7 million tonnes. Very quickly, the cost and magnitude of intervention
stockholding became problematic. Regulation 25 of 1962, setting up the European Agricultural Guidance
and Guarantee Fund and establishing the rules for financing the common agricultural policy, had made
provision for the mechanism whereby surplus products could be exported with refunds (export subsidies)
to third countries. Subsidised exports of butter and SMP from intervention and periodic ‘distress’ sales to
targeted outlets on domestic markets were used from the 1970s in an attempt to manage the EEC’s
growing milk surplus.
In 1984, supply controls in the form of annual quotas on the amount of milk delivered to dairies and sold
directly by farmers to consumers were introduced in an attempt to curb the ever more acute problem of
surplus production. This measure was a compromise choice by the (then) ten member states, who could
not agree on what would have been a more straightforward solution to the structural surplus, namely a
reduction in price levels.8 Although there had been considerable structural evolution of the milk
producing sector and modernisation of milk production systems in some member states, it was
considered that a price reduction of sufficient magnitude to deal with the surplus problem would be
unacceptably damaging to many small farmers and specific rural regions. It is worth recalling that, until
the 1992 CAP reform, which introduced direct income payments for farmers as a new instrument of the
CAP, the common agricultural policy had no general policy mechanism for supporting farm incomes other
than by means of market price, which cannot be used to target particular groups of farmers.
The total milk quota ceiling set in 1984 at EEC level represented a substantial structural surplus.9 Thus,
the problem of excess dairy production did not disappear with the introduction of quotas. However, the
7 European Communities Joint Information Service, Newsletter on the Common Agricultural Policy No. 23, October 1964. Available at http://aei.pitt.edu/6328/01/003503_1.pdf. 8 For the background to the decision establishing the quota regime, see Petit et al. (1987). 9 In 1983, exports (in milk equivalents) were 8.9% of EU-10 production of cows’ milk (of 113.4 million tonnes), and in 1984 (the first year of the quota regime, when production was over 2 million tonnes lower than in 1983
90
longer-term strategy was to reduce progressively the quota limits, and to allow the growth of internal
demand (due to population increases and rising income) to further erode the magnitude of the surplus.
Within several years of their inception, quotas on volumes were supplemented by quotas on milk fat, and
producers’ milk deliveries had to keep within ‘fat-adjusted’ quota limits. This was necessary because (a)
the milk surplus problem, as manifest in the excess supply of particular dairy products, was due even
more to its fat content than to its protein content, and (b) because producers initially tried to offset some
of the impact of milk quotas on income by increasing the fat content of their delivered milk in order to
improve the price they were able to get for it.
Over the ensuing 15 years, various smaller adjustments were made to the quota regime. On the one
hand, overall quota limits were tightened several times (although the market was slowly growing with
population growth) and the superlevy became even more dissuasive for producers. On the other hand,
provisions for managing quota (including its transfer between producers and regions) were allowed to
evolve within member states according to national priorities and preferences within general legislative
guidelines laid down at EU level. These guidelines themselves had to be adapted several times to
accommodate requests or de facto practices of member states (for example, short-term quota leasing
was recognised and some regulatory parameters were defined at EU level although the decision whether
or not to allow leasing was left to the member states). By the early 2000s, there was considerable
divergence among member states regarding the modalities of operating the scheme10 whilst the limits on
supply and the consequences of exceeding them were rigorously observed through the Union.
With milk supply at last under control, the dairy sector was bypassed by the 1992 CAP reform, which
focused on the arable sector. Nonetheless, the reform package of 1992 introduced a new approach to
agricultural policy and new policy measures (lower, more market oriented intervention prices
accompanied by direct payments) for cereals, oilseeds and protein crops that would also be applied to
the dairy sector some years later. Indeed, in 199911, as part of the Agenda 2000 re-orientation of policy,
it was agreed that a regime of lower intervention prices and direct payments would be extended to the
dairy sector starting in 2005. The 2003 reform laid down the specific rules for implementing such a
regime in the dairy sector, and the timetable for subsequently merging the direct payment for milk with
the Single Farm Payment Scheme, which allocates to producers specific amounts of entitlements to direct
income payments, based on historical production patterns and regardless of which commodities they are
currently producing. Other long-standing elements of dairy policy (import tariffs, export refunds,
provisions for subsidised public and private storage, consumption aids) were maintained.
This brief review establishes the historical background for the context within which EU dairy policy has
been evolving over time. It is intended to explain why the common market organisation for milk at the
starting point of the period covered by this evaluation was characterised by the particular set of
instruments that were in place and to give the longer-term rationale for the set of policy objectives
pursued during the evaluation period. In particular, the review of the objectives of EU dairy policy, based
on legislation since 1999, shows the prominent place given to the objective of ‘achieving market
balance’. It has to be stressed that there is nothing specific to milk or to the dairy sector per se that
makes it more difficult for these markets to avoid structural surpluses, providing price is allowed to play
its role of equating supply and demand.12
3.2 Methodological considerations
A working document of the European Commission (2004) sets out the methodology for preparing the
intervention logic, which is a first step towards drawing up the evaluation questions and defining the
indicators. The intervention logic maps the links between the objectives of the policy to be evaluated, its
implementation and its effects (see Figure 3.1).
but the total community quota level was exceeded), this share rose to over 11% of EU-10 cows’ milk production (figures based on Eurostat data, obtained from Burrell (1997). 10 For an overview of practices regarding quota implementation in the member states, see Baldock et al. (2008). 11 See Council Regulation (EC) No 1255/1999 of 17 May 1999. 12 Whether unconstrained, self-equilibrating markets for milk would achieve an acceptable degree of price stability is another issue, and hence it is very important to distinguish between the concepts of ‘market balance’ and ‘market (or price) stability’.
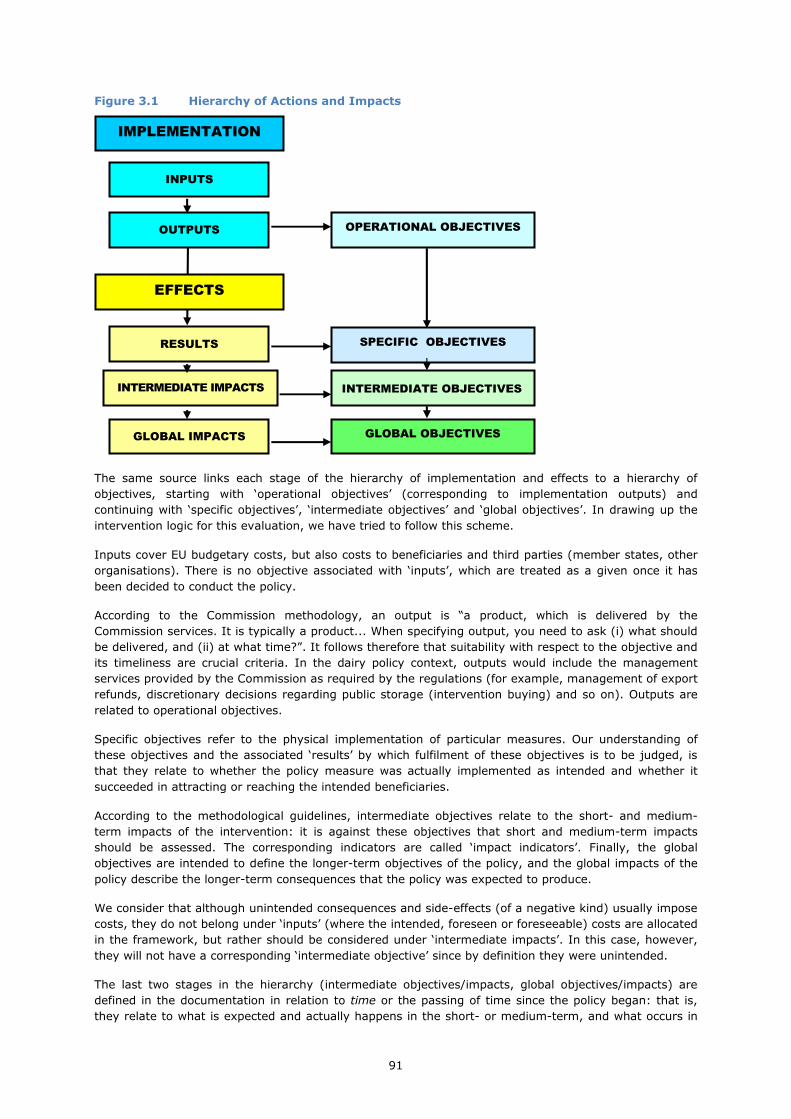
91
Figure 3.1 Hierarchy of Actions and Impacts
The same source links each stage of the hierarchy of implementation and effects to a hierarchy of
objectives, starting with ‘operational objectives’ (corresponding to implementation outputs) and
continuing with ‘specific objectives’, ‘intermediate objectives’ and ‘global objectives’. In drawing up the
intervention logic for this evaluation, we have tried to follow this scheme.
Inputs cover EU budgetary costs, but also costs to beneficiaries and third parties (member states, other
organisations). There is no objective associated with ‘inputs’, which are treated as a given once it has
been decided to conduct the policy.
According to the Commission methodology, an output is “a product, which is delivered by the
Commission services. It is typically a product... When specifying output, you need to ask (i) what should
be delivered, and (ii) at what time?”. It follows therefore that suitability with respect to the objective and
its timeliness are crucial criteria. In the dairy policy context, outputs would include the management
services provided by the Commission as required by the regulations (for example, management of export
refunds, discretionary decisions regarding public storage (intervention buying) and so on). Outputs are
related to operational objectives.
Specific objectives refer to the physical implementation of particular measures. Our understanding of
these objectives and the associated ‘results’ by which fulfilment of these objectives is to be judged, is
that they relate to whether the policy measure was actually implemented as intended and whether it
succeeded in attracting or reaching the intended beneficiaries.
According to the methodological guidelines, intermediate objectives relate to the short- and medium-
term impacts of the intervention: it is against these objectives that short and medium-term impacts
should be assessed. The corresponding indicators are called ‘impact indicators’. Finally, the global
objectives are intended to define the longer-term objectives of the policy, and the global impacts of the
policy describe the longer-term consequences that the policy was expected to produce.
We consider that although unintended consequences and side-effects (of a negative kind) usually impose
costs, they do not belong under ‘inputs’ (where the intended, foreseen or foreseeable) costs are allocated
in the framework, but rather should be considered under ‘intermediate impacts’. In this case, however,
they will not have a corresponding ‘intermediate objective’ since by definition they were unintended.
The last two stages in the hierarchy (intermediate objectives/impacts, global objectives/impacts) are
defined in the documentation in relation to time or the passing of time since the policy began: that is,
they relate to what is expected and actually happens in the short- or medium-term, and what occurs in
IMPLEMENTATION
INPUTS
OUTPUTS
RESULTS
INTERMEDIATE IMPACTS
GLOBAL IMPACTS
EFFECTS
INTERMEDIATE OBJECTIVES
GLOBAL OBJECTIVES
OPERATIONAL OBJECTIVES
SPECIFIC OBJECTIVES

92
the longer-term. This methodology seems quite appropriate in the context of a single finite policy action
that starts at a certain point in time and whose effects are intended to be fully achieved over a given
period. The short-, medium- and longer-term notions used to identify these two sets of objectives and
impacts can then be defined in relation to the intended life of the project, which starts with a clearly
defined problem and aims to resolve it within a certain period.
In the case of an on-going policy agenda, however, like that of dairy policy, which as explained in section
3.1 has been evolving over decades, and which is characterised by a steady stream of legislation
(substantial reforms interspersed with smaller adjustments to fine-tune existing measures) and inter-
connected policy changes, applying all aspects of the methodology presents a strong challenge. For
example, we have seen that ‘improving market balance’ has been a global objective – or a driving force -
of dairy policy for the last 30 years or so. However, it is also striking that throughout that period, market
balance has never been rigorously defined (in such a way that a scientific analysis could demonstrate
categorically whether or not it has been achieved), nor have any quantitative or quantifiable targets been
set for how much ‘improvement’ is expected within a given time frame, nor has any time frame or target
date ever been set. This means that separating impacts of specific time-designated policy measures in
terms of whether they occur in the short, medium or long term, and relating them to objectives that
need also to be identified according to their positioning over time (short-, medium- or long-term) is
rather subjective.
We have dealt with that challenge as follows. For the measures agreed in the 2003 Luxembourg
package, we consider that (although some were not implemented for 2 or 3 years) enough time has
elapsed to allow a full ex post evaluation of the intermediate impacts (i.e. short- to medium-term
impacts) based on empirical indicators from all relevant sources (statistical collections of the Commission
and Eurostat, data from external official data collections and the sample surveys that will be carried out
for the specific purpose of this evaluation). The global impacts will be assessed in terms of the trends set
in motion by these changes and whether they are likely to continue in the desired direction towards
fulfilling the global objectives in the coming period. For later policy changes (in particular those of the
Health Check package), it is too soon to attempt the same kind of evidence-based analysis of even the
intermediate impacts.
A second challenge we faced in designing this evaluation, namely that the Commission’s suggested
methodology does not make explicit provision for evaluating a set of measures as a package. In
explaining the approach to Evaluation Question 9, we set out our approach to evaluating a multi-
objective multi-measure policy package as a whole.
The crucial conceptual stages involved in drawing up the intervention logic can be summarized as
follows:13
• collect the official documents establishing the intervention and allocating resources.
• identify the main activities.
• identify the objectives.
• translate the objectives into expected results and impacts.
• connect the activities to the expected impacts by reconstructing the logical cause-and-effect
relations (if… then…)
• check that cause-and-effect relations are logical, i.e. considered as plausible in the light of available
knowledge.
The official documents used are ten regulations spanning the period 1999 to 2009. The first of these,
Regulation (EC) No 1255/1999, serves as the benchmark for the policy changes to be evaluated in this
exercise, namely policy changes introduced over the period 2003 to 2008-2009. The next three
regulations perused (Regulations (EC) 1782/2003, 1787/2003 and 1788/2003) present the changes to
dairy policy that emerged from the 2003 ‘Luxembourg’ reform of the CAP that was completed in 2003.
Three ‘interim’ regulations (Regulations (EC) 1898/2005, 1234/2007 and 248/2008) are also included.
An ex post evaluation will be performed of these policies.
13 List taken from a Commission document: EC External Services Evaluation Unit, Outcome and Impact Level Intervention Logic & Indicators: Methodological Approach. Source: http://ec.europa.eu/europeaid/evaluation/methodology/methods/mth_log_en.htm

93
More recent legislation, namely the two regulations based on the ‘Health Check’ of the CAP (Regulations
(EC) 72/2009 and 73/2009), decided in November 2008, and the legislation covering the emergency
support for the dairy sector (Regulation (EC) 1233/2009) in response to the crisis in milk markets of
earlier that year, will not be covered. It is too early, on the basis of data available up to the end of 2010,
to perform a reliable ex post evaluation of the impacts of the last three pieces of legislation.
The benchmark legislation (Regulation (EC) No 1255/1999) and the six ensuing regulations (up to and
including Regulation (EC) 248/2008) have been analysed to identify the main policy changes affecting
the dairy sector and the objectives cited to justify these changes. The causal mechanics translating the
policy instruments into expected results and impacts are presented in the next Chapter (the theoretical
framework). Whether or not the desired/expected causal relationships are fully logical and consistent
with economic theory, or whether – even though theoretically sound - they are unrealistic given the
constraints and the current situation of the dairy sector, will be analysed in depth in a later part of the
evaluation. As the methodological guidelines referred to above (EC, 2004) state: “It should be noted that
this preliminary structuring work need not always examine the intervention logic and causality in full
depth; only to the extent needed for drafting the evaluation questions”, and we have followed this
advice.
3.3 Objectives and policy measures
This section presents in chronological order of the legislation the various policy changes and the linked
objectives provided in the recitals contained in the preface to the legislation (see Table 3.1). A
considerable number of diverse objectives are identified, some of which recur from one document to
another. This reflects the complexity of the sector, the degree of intervention existing in the benchmark
situation and to which the sector has traditionally been exposed, the fact that interventions take place in
more than one segment of the chain, and the diversity of issues (‘stakes’) involved.
The legislative changes also reflect what has been a period of rapid evolution for the sector, and one that
has seen unusual endogenous change and exogenously generated disruption. Not only has dairy policy
been following its own internal strategy (the progressive elimination of the structural milk surplus whilst
maintaining the viability and strength of the industry), but it has also been swept along by the more
comprehensive systemic changes within the CAP (the bringing of virtually all common market
organisations into a single framework, characterised by a switch of support from market price to direct
decoupled payments). In addition, a two-year period of price turbulence that occurred on a global scale
and for most major commodities also severely affected EU milk prices and incomes starting in early
2008. It must be stressed that, when interpreting the indicators and answering the evaluation questions
in later stages of this work, it will not always be possible to separate out the impacts of these changes
that are extraneous to dairy policy itself from the effects of the dairy policy per se.
Based on the systematic and comprehensive identification of objectives and policy changes in Table 3.1,
it is possible to derive a grouping of the recitals under a number of summary headings:
• market performance (market balance, market stability)
• producer income
• competitiveness, market orientation
• consumption of dairy products
• structures, structural change
• policy simplification
• other (environmental standards, product quality)

94
Table 3.1 Dairy policy legislation (1999-2008): links between stated objectives (from recitals) and measures
Reg. (EC) No. Recital number, stated objective Associated measure
1255/1999
on the common
organisation of the
market in milk and
milk products
(2) to stabilise markets and to ensure a fair standard of living for the agricultural community but in a standardized way so as not to impede the free movement of goods in question within the Community.
Intervention buying of butter and skimmed milk powder and the granting of private storage aids for these products.
(3) to reduce the imbalance between supply and demand on the milk and milk-product market and resulting structural surpluses.
Continuation of the milk quota scheme and the “additional levy” (superlevy) until April 2008.
(4) to stimulate the consumption of milk and milk products within the Community and to improve the competitiveness of these products on the international markets
Reduction in the level of market support through a gradual reduction of the target prices and intervention prices for butter and skimmed milk powder starting from 1 July 2005.
(5) to maintain the competitive position of butter on the market and provide for the most efficient possible storage (particularly with regard to quality requirements).
Quality standards for intervention buying-in of butter (conditional on intervention buying being necessary to maintain market price stability, and being carried out under a tendering procedure).
(7) to enable the best return to be obtained from milk proteins and to support the prices of products which have special importance in determining producer prices for milk.
Intervention buying and private storage aid for skimmed milk powder, with intervention subject to suspension when a certain quantity is reached and thereafter replaced by buying-in under a tender procedure.
(9) to help balance the milk market and stabilise the market prices for milk and milk products.
Complementary measures increasing the possibility of disposing of milk products (including the grant of private storage aid for certain types of cheeses, and of aids for the marketing of certain milk products with a view to specific uses and destinations)
(10) to stimulate the consumption of milk by young people. Subsidy for expenditure on supplying milk to pupils in schools.1
(11) to compensate for the reduction in market support in such a way as to keep the overall income support at the level of the Member States' total reference quantities as applicable when the Regulation comes into force.
Introduction of direct income support measures for milk producers in the form of a dairy premium (starting in 2005), based on the individual reference quantities, and whose the level will develop in parallel with the gradual reduction of market support.
(12) to take account of heterogeneity across production areas of the Community and of structural and natural disparities, and the diverse needs resulting there from, that would not be accommodated by a rigid Community-wide scheme with uniform dairy payments to all producers.
Provision of a flexible framework of additional Community payments to be made by Member States within fixed global amounts and in accordance with certain common criteria; and in such a way as not to produce discriminatory effects or introduce market and competition distortions (Article 17, from 2005).
(19) to prevent or counteract adverse effects on the Community market that could result from imports of certain agricultural products.
Imports of one of more such products should be subject to payment of an additional import duty, if certain conditions are fulfilled.
Notes: 1) This measure is not under evaluation in the present report.

95
Reg. (EC) No. Recital number, stated objective Associated measure
1782/2003
common rules for
direct support
schemes under the
common
agricultural policy
and for
certain support
schemes for
farmers
(21) To ensure a fair standard of living for the agricultural community. This objective is closely related to the maintenance of rural areas…
Introduction of a dairy premium (direct payment) as from 2004, phased in over 3 years, plus additional payments allocated by Member States.
(24) …and so to maintain overall income support at the current level despite diminishing market price support and higher costs due to environmental and quality standards (not specific to the dairy sector)
Completion of the shift from production support to producer support by introducing a system of decoupled income support for each farm. Dairy premium and additional dairy payments to be incorporated in the Single Farm Payment no later than 1 January 2008.
(24) Enhancing the competitiveness of agriculture, encouraging a more market-oriented and sustainable agriculture and promoting food quality and environmental standards requires a reduction in price support and will entail an increase in production costs. The aim is to increase the effectiveness of direct income aid, while leaving the actual amounts paid to farmers unchanged.
Introduction of cross compliance conditions associated with direct income support payments.
To protect or enhance the environment, or to improve the quality and marketing of agricultural products (introduction to Article 69).
Article 69: Optional implementation for specific types of farming and quality production:
Discretionary payments made from retentions of up to 10% from the national ceilings on direct payment funding.
Reg. (EC) No. Recital number, stated objective Associated measure
1787/2003
amending
Regulation
1255/1999 on the
common
organisation of the
market in milk and
milk products
(2) To promote consumption of milk and milk products in the Community and improve their competitiveness on international markets, by reducing the level of market support.
Gradual reduction from 1 July 2004 of intervention prices for butter and skimmed milk powder set by Council Regulation (EC) No 1255/1999.
(3) To simplify policy (reason given: since intervention for both products is now only applied for a maximum quantity and during a limited period of the year, and the target price, which served as an indication of the support level, was constituted especially by the intervention prices for butter and skimmed milk powder).
Abolition of the target price for milk.
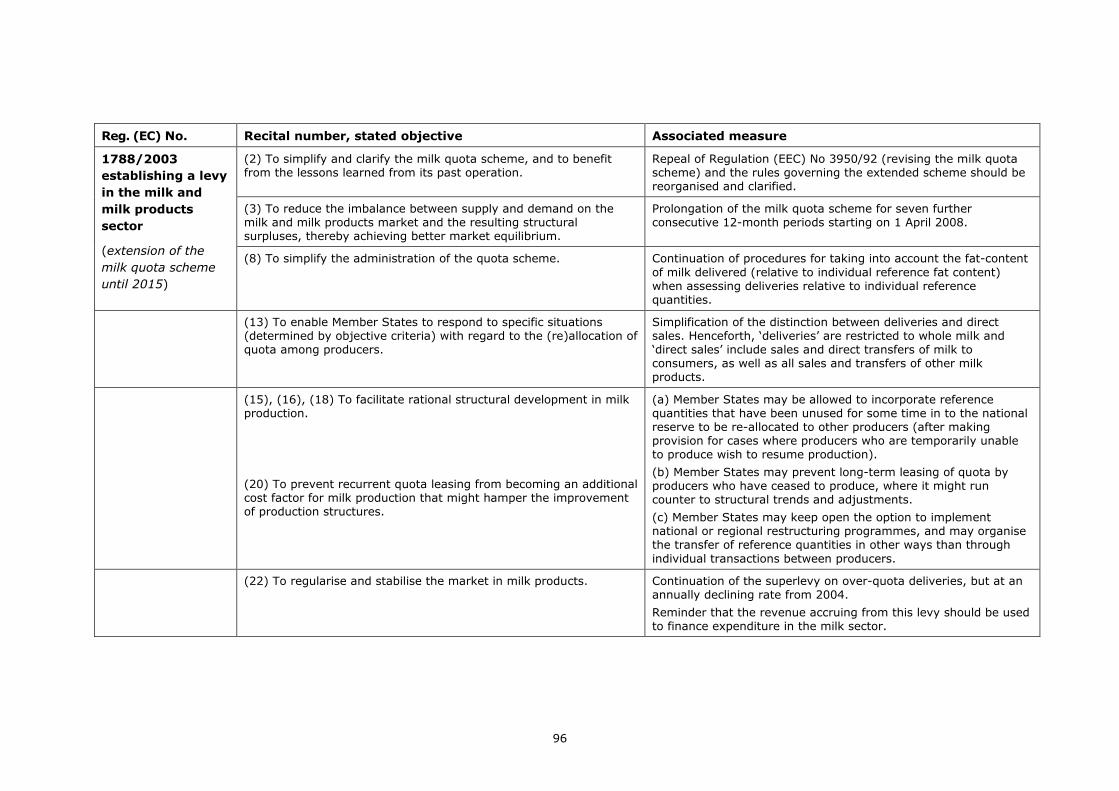
96
Reg. (EC) No. Recital number, stated objective Associated measure
1788/2003
establishing a levy
in the milk and
milk products
sector
(extension of the
milk quota scheme
until 2015)
(2) To simplify and clarify the milk quota scheme, and to benefit from the lessons learned from its past operation.
Repeal of Regulation (EEC) No 3950/92 (revising the milk quota scheme) and the rules governing the extended scheme should be reorganised and clarified.
(3) To reduce the imbalance between supply and demand on the milk and milk products market and the resulting structural surpluses, thereby achieving better market equilibrium.
Prolongation of the milk quota scheme for seven further consecutive 12-month periods starting on 1 April 2008.
(8) To simplify the administration of the quota scheme. Continuation of procedures for taking into account the fat-content of milk delivered (relative to individual reference fat content) when assessing deliveries relative to individual reference quantities.
(13) To enable Member States to respond to specific situations (determined by objective criteria) with regard to the (re)allocation of quota among producers.
Simplification of the distinction between deliveries and direct sales. Henceforth, ‘deliveries’ are restricted to whole milk and ‘direct sales’ include sales and direct transfers of milk to consumers, as well as all sales and transfers of other milk products.
(15), (16), (18) To facilitate rational structural development in milk production.
(20) To prevent recurrent quota leasing from becoming an additional cost factor for milk production that might hamper the improvement of production structures.
(a) Member States may be allowed to incorporate reference quantities that have been unused for some time in to the national reserve to be re-allocated to other producers (after making provision for cases where producers who are temporarily unable to produce wish to resume production).
(b) Member States may prevent long-term leasing of quota by producers who have ceased to produce, where it might run counter to structural trends and adjustments.
(c) Member States may keep open the option to implement national or regional restructuring programmes, and may organise the transfer of reference quantities in other ways than through individual transactions between producers.
(22) To regularise and stabilise the market in milk products. Continuation of the superlevy on over-quota deliveries, but at an annually declining rate from 2004.
Reminder that the revenue accruing from this levy should be used to finance expenditure in the milk sector.

97
Reg. (EC) No. Recital number, stated objective Associated measure
1898/2005 rules
for implementing
Reg 1255/1999 as
regards measures
for the internal
disposal of cream,
butter & concen-
trated butter
In the interests of simplification, harmonisation, and clarity and rationality of the aid scheme, and because some provisions have not been applied for some years and the current market situation does not warrant keeping them.
Changes to Commission Regulation (EC) No 2571/97 on the sale of butter at reduced prices and the granting of aid for cream, butter and concentrated butter for use in the manufacture of pastry products, ice-cream and other foodstuffs.
Reg. (EC) No. Recital number, stated objective Associated measure
1234/2007
establishing a
common
organisation of
agricultural
markets & specific
provisions for
certain products
(Single CMO Regulation)
(19) To contribute to balancing the milk market and to stabilising market prices.
Maintenance of the provisions for the granting aid for private storage in respect of cream, certain butter products and certain cheese products, and for discretionary aid granted by the Commission for private storage of certain other cheese products.
(37) The main purpose of the milk quota system remains that of reducing the imbalance between supply and demand on the respective markets and the resulting structural surpluses.
Maintenance of the various features of the milk quota scheme laid down in Regulation (EC) No 1788/ 2003.
(43) To contribute to balancing the milk market and to stabilise the market prices for milk and milk products.
Maintenance of measures (targeted marketing aids, aids for school milk1) to increase the possibility of disposing of milk products.
Notes: 1) This measure is not under evaluation in the present report.
Reg. (EC) No. Associated measure Recital number, stated objective
248/2008
amending
Regulation (EC) No
1234/2007 as
regards national
quotas for milk
(4) in the current period and as projected to allow the Community to help satisfy emerging demand requirements for dairy products for Community and world markets in the current period and as projected up to 2014.
Increase of all Member States’ quotas by 2% from 1 April 2008.
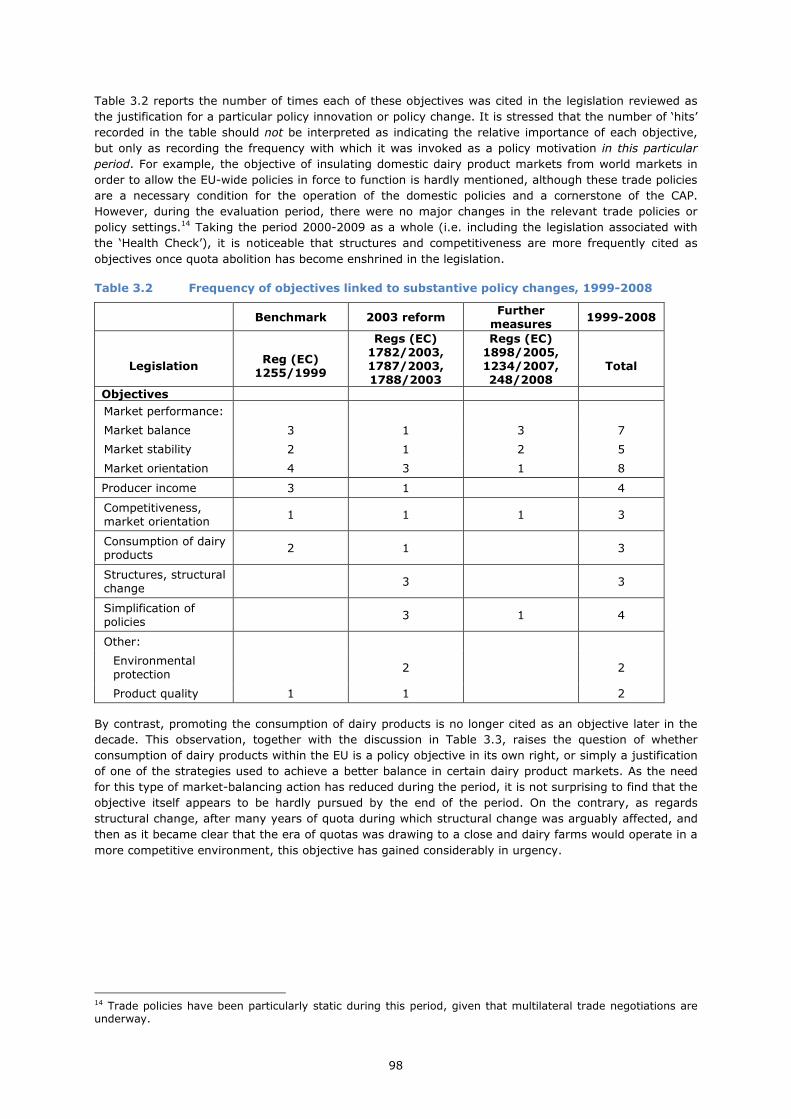
98
Table 3.2 reports the number of times each of these objectives was cited in the legislation reviewed as
the justification for a particular policy innovation or policy change. It is stressed that the number of ‘hits’
recorded in the table should not be interpreted as indicating the relative importance of each objective,
but only as recording the frequency with which it was invoked as a policy motivation in this particular
period. For example, the objective of insulating domestic dairy product markets from world markets in
order to allow the EU-wide policies in force to function is hardly mentioned, although these trade policies
are a necessary condition for the operation of the domestic policies and a cornerstone of the CAP.
However, during the evaluation period, there were no major changes in the relevant trade policies or
policy settings.14 Taking the period 2000-2009 as a whole (i.e. including the legislation associated with
the ‘Health Check’), it is noticeable that structures and competitiveness are more frequently cited as
objectives once quota abolition has become enshrined in the legislation.
Table 3.2 Frequency of objectives linked to substantive policy changes, 1999-2008
Benchmark 2003 reform Further measures
1999-2008
Legislation
Reg (EC)
1255/1999
Regs (EC) 1782/2003, 1787/2003, 1788/2003
Regs (EC) 1898/2005, 1234/2007, 248/2008
Total
Objectives
Market performance:
Market balance 3 1 3 7
Market stability 2 1 2 5
Market orientation 4 3 1 8
Producer income 3 1 4
Competitiveness, market orientation
1 1 1 3
Consumption of dairy products
2 1 3
Structures, structural change
3 3
Simplification of policies
3 1 4
Other:
Environmental protection
2 2
Product quality 1 1 2
By contrast, promoting the consumption of dairy products is no longer cited as an objective later in the
decade. This observation, together with the discussion in Table 3.3, raises the question of whether
consumption of dairy products within the EU is a policy objective in its own right, or simply a justification
of one of the strategies used to achieve a better balance in certain dairy product markets. As the need
for this type of market-balancing action has reduced during the period, it is not surprising to find that the
objective itself appears to be hardly pursued by the end of the period. On the contrary, as regards
structural change, after many years of quota during which structural change was arguably affected, and
then as it became clear that the era of quotas was drawing to a close and dairy farms would operate in a
more competitive environment, this objective has gained considerably in urgency.
14 Trade policies have been particularly static during this period, given that multilateral trade negotiations are underway.

99
Table 3.3 Summary and discussion of the main objectives linked to substantive policy changes, 1999-2008
Objectives Background and comments
Market
performance
Market balance
with more
market-
orientation
Throughout the period, the structural milk surplus on the EU market built into the
EU quota ceiling has needed to be addressed by policy measures. Achieving this
objective has two aspects: (1) disposing of current surpluses using the various
policy instruments available for that purpose; (2) creating incentives for a reduction
in the structural surplus over time. For (1), the surplus has to be disposed of in a
way that (a) does not undermine the aim of supporting the market price received
by producers (b) is sustainable (c) is cost-effective. This means either increasing
final demand disposals (domestic or export) or reducing supply. Over the longer
term, aspect (2) has been achieved by a variety of means: (a) stimulating
unsubsidized demand (b) encouraging milk producers to leave the sector (c)
technological improvements that allow milk producers to achieve appropriate
incomes with a lower level of price support (d) shifting support from market prices
to direct payments. Shifting support to direct payments during the evaluation
period marks a strong shift to more market-oriented policies. The market balance
objective is invoked only once in the legislation reviewed to justify a trade measure,
namely the raising of import duties if market balance risks adverse effects from
imported products (recital 19 of Reg 1255/1999).
Market
performance
Market stability
Market stability refers both to the maintenance of a stable flow of dairy products to
consumers at steady prices, and to stability of the price received by milk producers.
Traditionally, this objective has related to within-year price and quantity
movements caused by seasonality in yields and production systems (which is quite
pronounced in some EU regions) or, less typically, to movements from one year to
the next due to unusual meteorological variations. In 2008-2009, stability was
challenged in a new way by extreme price movements, unrelated to domestic
production conditions. It cannot be assumed that the same instruments are
appropriate for addressing these different types of market instability.
Producer income Milk production represents a long-term commitment (in terms of herd investment,
infrastructures and human skill). It is often carried out in regions where there are
few opportunities for other types of farming. Milk is a staple food commodity and
highly perishable in its raw state. These and other factors underlie the strong
weight that has been attached to the objective of supporting milk producers’
incomes. This objective is regularly cited in the legislation relating to policy changes
over the whole evaluation period. Moreover, it was the dominant motivation for the
choices made when setting up the original common market organization for milk,
the consequences of which are still being unravelled, with the aid of a broader and
more appropriate mix of policy instruments, by the policy changes implemented
during the evaluation period.
Competitiveness,
market
orientation
This objective, as expressed in the recitals, has various aspects, which include the
degree of price competitiveness of milk and dairy products (not least on world
markets), the extent to which milk producers are exposed, and able to respond, to
market signals, and the quality of milk and dairy products on final markets. In the
legislation reviewed, this objective has been invoked in support of various policy
changes, including the laying down of quality standards for butter bought into
intervention, the shift of support from price to direct producer aids, and the
removal of market management measures that are deemed to be no longer
necessary in the current market situation.
Consumption of
dairy products
The expansion of dairy consumption is referred to as an explicit aim in several
recitals, where it is always associated with a policy change linked to the objective of
achieving market balance. Therefore, it can be questioned whether it is an objective
in its own right, or whether it is cited simply to justify the use of a policy measure
in the interests of a ‘higher’ (more fundamental) objective. A stronger case might
be made that the objective of increasing milk consumed by school children is

100
Objectives Background and comments
motivated by nutritional concerns independently of any concern for market balance.
Similarly, supporting the use of milk products as animal feed can be seen simply as
correcting for a policy distortion to the price of an intermediate input. This objective
has received little weight in the latter part of the evaluation period, as the
structural milk surplus has come under better control. Moreover, most of the
measures that relate to it have been dismantled or partly dismantled. This suggests
that stimulating consumption has been largely a means to an end rather than an
objective in its own right.
Structures,
structural change
This objective recognises that the sector’s structural evolution, when driven by
market forces, is generally beneficial from an economic viewpoint, leading to herd
sizes and geographical location of production that are more efficient and more
economically viable. Policy intervention to prevent, cushion or re-direct endogenous
structural change is justified to correct for the effects of market failure (e.g. when it
leads to environmentally unsound outcomes), to relieve an unfair burden of short-
run adjustment costs or in response to other over-riding objectives, such as
maintaining farming in LFAs. It has been widely thought15 that supply quotas,
whether or not they are tradable or otherwise transferable between holdings,
reduce the pace and distort the pattern of structural change. This is not explicitly
mentioned in the legislation reviewed until Reg. 72/2007 (recitals 7 & 8), although
changes in the 2003 legislation allow Member States to make temporary use and
permanent transfer of quota more flexible for structural purposes.
Simplification of
dairy policy
Simplification of dairy policy has been a recurrent objective over the period,
consisting largely of discontinuing measures that have not been used for some
time, or the need for which in the current and projected future period was
considered to be no longer justified in terms of other objectives. Whilst the benefits
accruing from this objective are clear (lower budget costs and/or policy transaction
costs, better understanding of the policy package by stakeholders and so on), it is
still necessary to evaluate the choice and the timing of the changes undertaken
with this objective. In some cases, it may be asked whether changes made in the
name of ‘simplification’ were not also driven by an implicit goal of rationalizing
certain aspects of the sector, and whether there was any case where the budget or
administrative savings were outweighed by costs borne by the sector or consumer.
Sustainable production and consumption
Environmental
protection
The objective of protecting the environment appears first in Reg. 1782/2003 in
relation to cross compliance, and again as a rationale for measures under Article
69. It appears again in various recitals supporting the measures under Article 68 of
the Health Check. In none of these cases is it specifically related to the dairy sector.
This follows from the horizontal nature of the objective itself, and the fact that the
dairy sector cannot be singled out as necessarily requiring specific or more targeted
measures in this respect. However, it is appropriate that cross compliance and the
use of Article 69 is evaluated with respect to the dairy sector.
Product quality Product quality is invoked to justify standards for intervention butter, and again as
one of the motivations for payments under Article 69. The stringent food safety and
animal health standards with which milk and dairy products must comply within the
EU are extensively addressed by other legislation and do not come under the
common agricultural policy. References to ‘quality’ here relate to price-relevant
differences in product characteristics, to regional product variations, and to other
considerations that determine the attractiveness of dairy products to users and
their marketability.
15 See for example Hanf (1989), Colman (2002), Richards and Jeffrey (1997).

101
3.4 The intervention logic
Figure 3.2 shows the intervention logic of the legislation summarised in Table 3.1. A number of measures
(new measures or change sin existing measures) are identified, and on the left-hand side of the figure
they are linked to the regulations in which they were introduced or modified. The next vertical stack of
blocks shows the expected results of these changes, and to the right, another stack of blocks shows the
expected medium-term impacts of these impacts. Finally, the right-hand side of the figure summarises
how these various impacts contribute to the longer terms goals of the policy.
This figure intends to capture at least some of the complexity and inter-related nature of links between
instruments, results and impacts. It shows clearly that some measures act on more than one objective
and have intermediate impacts that contribute to more than global objective. It also indicates that,
during the evaluation period, successive legislation extended or reinforced measures already taken or at
least already announced, in previous legislation. This makes the evaluation task more difficult than if it
had to evaluate the impact of one single reform or legislative act. Apart from this, some impacts are
spread over time, not just because of the finite reaction time of the producers to the policy changes, but
also because policy changes were themselves ‘staggered’ over time, or implemented in different years by
member states (e.g. the decoupling of the dairy premium, which had to be completed by 2008).
The intervention logic as set out above shows that the set of policy changes introduced during the
evaluation period are interconnected and convergent in purpose: improving the market orientation and
self-regulating capacity of the dairy sector, and maintaining sectoral incomes. They are also interlinked in
terms of their effects – various changes have the capacity to enhance, constrain or increase the
uncertainty of outcome of other changes. Moreover, although our analysis of the legislation enabled
objectives (recitals) to be paired with individual policy measures (changes), many of the results are
linked with several intermediate impacts, which in turn influence more than one of the global impacts.
The links between the objectives themselves (not shown in the figure but emphasised in the historical
review and the theoretical chapter) are striking: the more beneficial structural change the sector can
attain, the less time will be needed to achieve market balance whilst maintaining the incomes of the
remaining producers. Alternatively, it could be stated as: the more quickly structural features can adapt
to attain greater efficiency, the easier it will be to maintain the incomes of the remaining producers
whilst improving market balance. The link between these objectives is price: efficiency-enhancing
structural change lowers costs and ‘fair’ prices, whilst lower prices stimulates demand.
These inter-linkages highlight the main challenges of this evaluation, which are:
• to evaluate the effectiveness of individual policy changes in a context where the mapping between
policy measures, outcomes and objectives is not one-to-one but many-to-many;
• to evaluate the set of policy measures together in terms of the set of joint outcomes;
• to go beyond the narrow evaluation of policies in terms of their expected outcomes in order to
consider, as well, whether (a) additional, accompanying measures should have been taken (when
they were not) (for example, in order to ease adjustment burdens or to help producers cope with
greater exposure to market risk) and whether (b) any of the measures adopted had undesirable
collateral effects that were not foreseen but that nevertheless should be taken into account when
evaluating the policies.
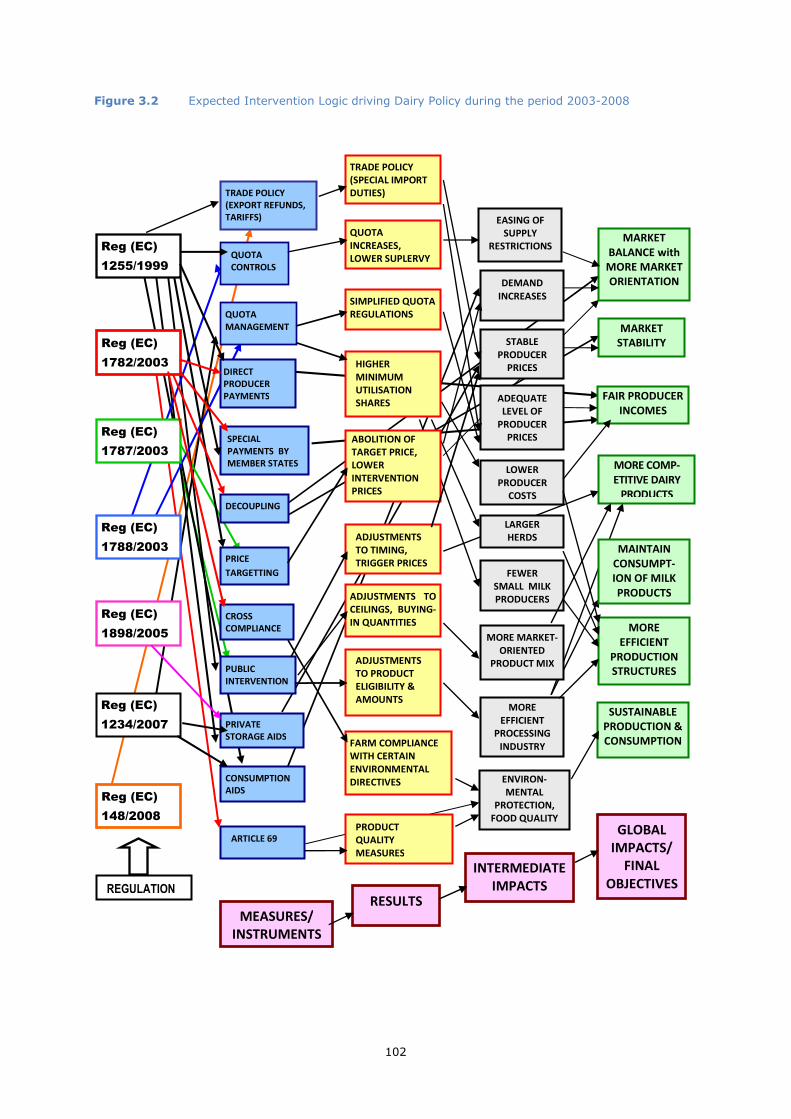
102
Figure 3.2 Expected Intervention Logic driving Dairy Policy during the period 2003-2008
QUOTA
MANAGEMENT
DIRECT
PRODUCER
PAYMENTS
DECOUPLING
PUBLIC
INTERVENTION
PRIVATE
STORAGE AIDS
CONSUMPTION
AIDS
CROSS
COMPLIANCE
SPECIAL
PAYMENTS BY
MEMBER STATES
QUOTA
INCREASES,
LOWER SUPLERVY
ABOLITION OF
TARGET PRICE,
LOWER
INTERVENTION
PRICES
ADJUSTMENTS
TO TIMING,
TRIGGER PRICES
ADJUSTMENTS TO
CEILINGS, BUYING-
IN QUANTITIES
ADJUSTMENTS
TO PRODUCT
ELIGIBILITY &
AMOUNTS
EASING OF
SUPPLY
RESTRICTIONS
TRADE POLICY
(EXPORT REFUNDS, TARIFFS)
HIGHER
MINIMUM
UTILISATION
SHARES
FARM COMPLIANCE
WITH CERTAIN
ENVIRONMENTAL
DIRECTIVES
PRODUCT
QUALITY
MEASURES
DEMAND
INCREASES
ADEQUATE
LEVEL OF
PRODUCER
PRICES
LOWER
PRODUCER
COSTS
FEWER
SMALL MILK
PRODUCERS
MORE MARKET-
ORIENTED
PRODUCT MIX
MORE
EFFICIENT
PROCESSING
INDUSTRY
MARKET
BALANCE with
MORE MARKET
ORIENTATION
MARKET
STABILITY
FAIR PRODUCER
INCOMES
MORE COMP-
ETITIVE DAIRY
PRODUCTS
MAINTAIN
CONSUMPT-
ION OF MILK
PRODUCTS
MORE
EFFICIENT
PRODUCTION
STRUCTURES
MEASURES/
INSTRUMENTS
RESULTS
INTERMEDIATE
IMPACTS
GLOBAL
IMPACTS/
FINAL
OBJECTIVES
LARGER
HERDS
STABLE
PRODUCER
PRICES
ENVIRON-
MENTAL
PROTECTION,
FOOD QUALITY
ARTICLE 69
Reg (EC)
1255/1999
TRADE POLICY
(SPECIAL IMPORT
DUTIES)
Reg (EC)
1782/2003
Reg (EC)
1787/2003
Reg (EC)
1788/2003
Reg (EC)
1898/2005
Reg (EC)
1234/2007
Reg (EC)
148/2008
SUSTAINABLE
PRODUCTION &
CONSUMPTION
PRICE
TARGETTING
SIMPLIFIED QUOTA
REGULATIONS
QUOTA
CONTROLS
REGULATION

103
4 Theoretical analysis
This chapter contains four sections dealing with the market for raw milk (4.1), the operation of the dairy
supply chain (4.2), trade measures for dairy products (4.3) and dairy income and the decision to quit
(4.4).
The aim in all sections is to analyse the impact of policies on the behaviour of decision makers. The
approach is therefore to introduce policy measures into stylised situations, or to change the settings of
policy measures already in place, in order to analyse their impacts, while holding constant all other
possible but unrelated changes. The policies analysed have been in operation over extended periods of
time, during which other factors – which are important in the real world and in empirical analysis that
attempts to understand real-world developments – have been changing. However, for a sharper
understanding of what can be expected of the various policy measures per se, these other changing
factors are deliberately assumed to be held constant unless otherwise stated.
4.1 The market for raw milk
In this section, the theory underlying the market for raw milk and the operation of policy measures that
impact on that market is presented.
In order to simplify the presentation, it is assumed that the country is ‘small’ in relation to world trade.
That is, changes in its domestic policies and the induced changes in trade flows do not affect world
market prices for the relevant commodities. Trade aspects are dealt with explicitly in section 4.3.
Figure 4.1 Quota scheme (as sole measure) to support market price for milk
Figure 4.1 shows how a market supply quota alters the market outcome in a competitive market when
there are no other policy measures in use and where, for simplification, it is assumed that there is no
external trade. By definition, in this competitive market, no buyer or seller is large enough to affect the
market price. The intersection of the milk demand and milk supply functions determine the no-
intervention, perfect-competition market outcome, denoted by quantity = Q0 and price = P0.
When market supply is restricted by quotas to the level Q1, competition between buyers forces the price
up to P1. At this price, the market for the smaller supply is balanced. The economic cost of the policy is
P1
Q1
D=DEMAND
S=SUPPLY
Q0
P0
PRICE
QUANTITY
QUOTA
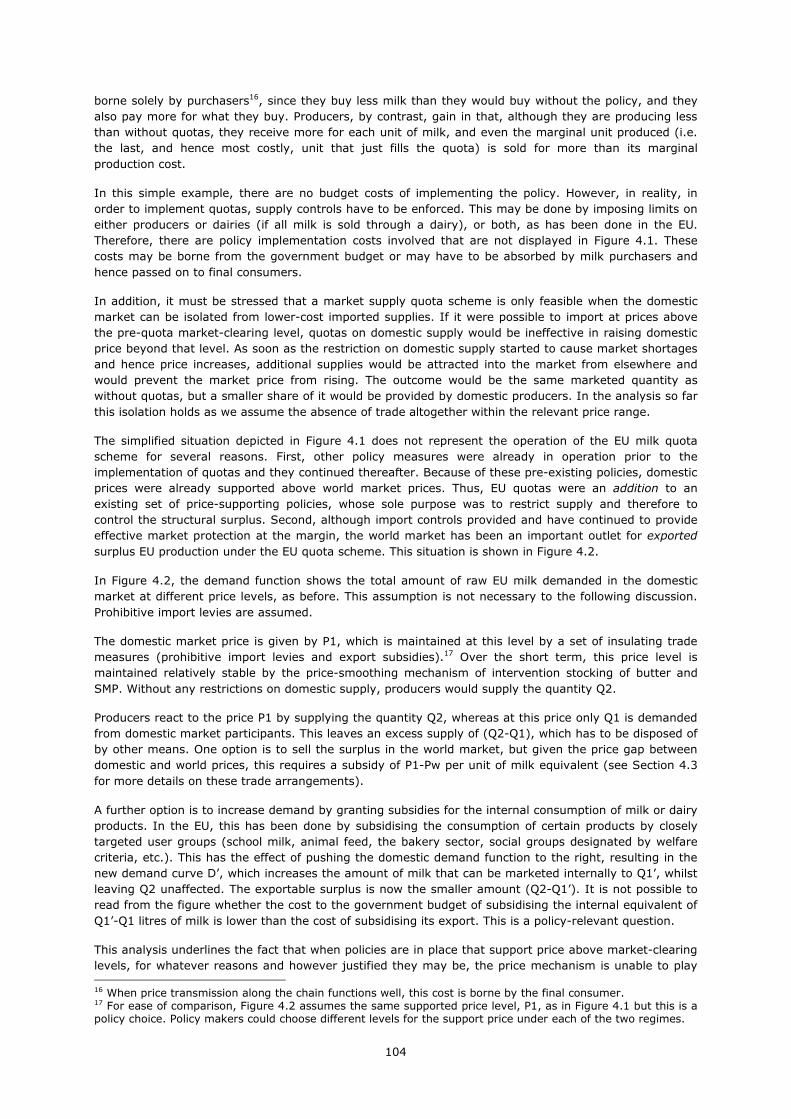
104
borne solely by purchasers16, since they buy less milk than they would buy without the policy, and they
also pay more for what they buy. Producers, by contrast, gain in that, although they are producing less
than without quotas, they receive more for each unit of milk, and even the marginal unit produced (i.e.
the last, and hence most costly, unit that just fills the quota) is sold for more than its marginal
production cost.
In this simple example, there are no budget costs of implementing the policy. However, in reality, in
order to implement quotas, supply controls have to be enforced. This may be done by imposing limits on
either producers or dairies (if all milk is sold through a dairy), or both, as has been done in the EU.
Therefore, there are policy implementation costs involved that are not displayed in Figure 4.1. These
costs may be borne from the government budget or may have to be absorbed by milk purchasers and
hence passed on to final consumers.
In addition, it must be stressed that a market supply quota scheme is only feasible when the domestic
market can be isolated from lower-cost imported supplies. If it were possible to import at prices above
the pre-quota market-clearing level, quotas on domestic supply would be ineffective in raising domestic
price beyond that level. As soon as the restriction on domestic supply started to cause market shortages
and hence price increases, additional supplies would be attracted into the market from elsewhere and
would prevent the market price from rising. The outcome would be the same marketed quantity as
without quotas, but a smaller share of it would be provided by domestic producers. In the analysis so far
this isolation holds as we assume the absence of trade altogether within the relevant price range.
The simplified situation depicted in Figure 4.1 does not represent the operation of the EU milk quota
scheme for several reasons. First, other policy measures were already in operation prior to the
implementation of quotas and they continued thereafter. Because of these pre-existing policies, domestic
prices were already supported above world market prices. Thus, EU quotas were an addition to an
existing set of price-supporting policies, whose sole purpose was to restrict supply and therefore to
control the structural surplus. Second, although import controls provided and have continued to provide
effective market protection at the margin, the world market has been an important outlet for exported
surplus EU production under the EU quota scheme. This situation is shown in Figure 4.2.
In Figure 4.2, the demand function shows the total amount of raw EU milk demanded in the domestic
market at different price levels, as before. This assumption is not necessary to the following discussion.
Prohibitive import levies are assumed.
The domestic market price is given by P1, which is maintained at this level by a set of insulating trade
measures (prohibitive import levies and export subsidies).17 Over the short term, this price level is
maintained relatively stable by the price-smoothing mechanism of intervention stocking of butter and
SMP. Without any restrictions on domestic supply, producers would supply the quantity Q2.
Producers react to the price P1 by supplying the quantity Q2, whereas at this price only Q1 is demanded
from domestic market participants. This leaves an excess supply of (Q2-Q1), which has to be disposed of
by other means. One option is to sell the surplus in the world market, but given the price gap between
domestic and world prices, this requires a subsidy of P1-Pw per unit of milk equivalent (see Section 4.3
for more details on these trade arrangements).
A further option is to increase demand by granting subsidies for the internal consumption of milk or dairy
products. In the EU, this has been done by subsidising the consumption of certain products by closely
targeted user groups (school milk, animal feed, the bakery sector, social groups designated by welfare
criteria, etc.). This has the effect of pushing the domestic demand function to the right, resulting in the
new demand curve D’, which increases the amount of milk that can be marketed internally to Q1’, whilst
leaving Q2 unaffected. The exportable surplus is now the smaller amount (Q2-Q1’). It is not possible to
read from the figure whether the cost to the government budget of subsidising the internal equivalent of
Q1’-Q1 litres of milk is lower than the cost of subsidising its export. This is a policy-relevant question.
This analysis underlines the fact that when policies are in place that support price above market-clearing
levels, for whatever reasons and however justified they may be, the price mechanism is unable to play 16 When price transmission along the chain functions well, this cost is borne by the final consumer. 17 For ease of comparison, Figure 4.2 assumes the same supported price level, P1, as in Figure 4.1 but this is a policy choice. Policy makers could choose different levels for the support price under each of the two regimes.
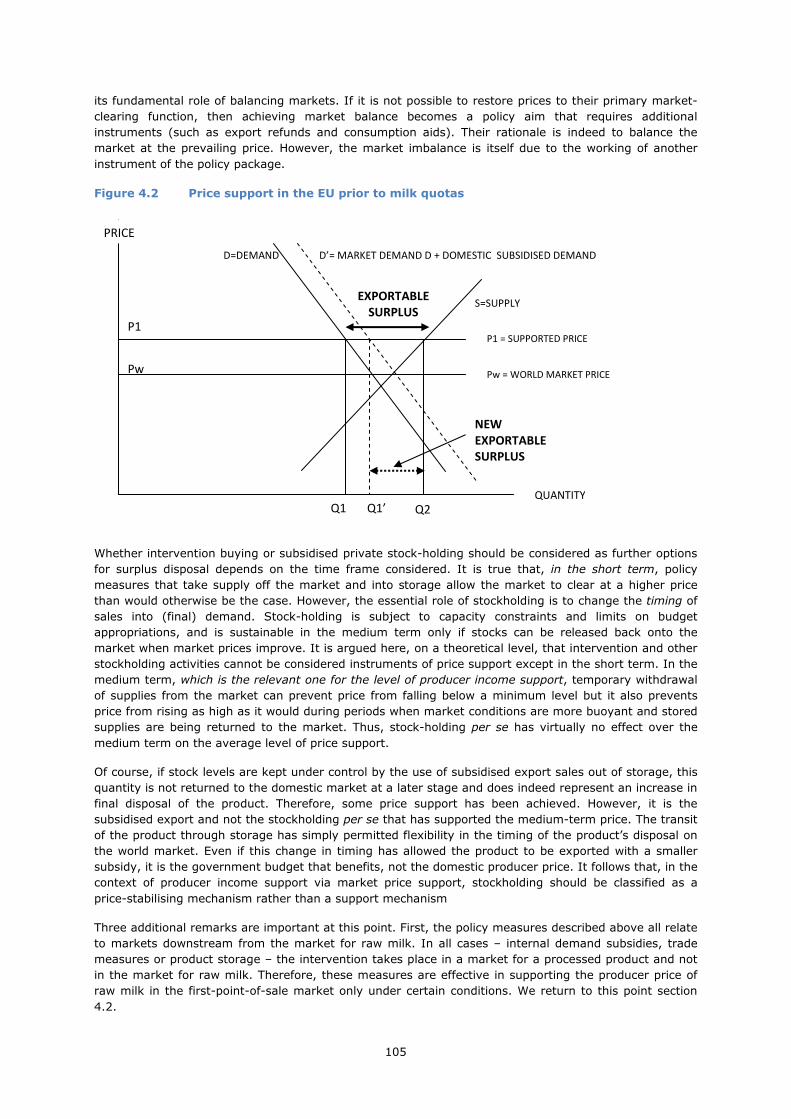
105
Q1’
its fundamental role of balancing markets. If it is not possible to restore prices to their primary market-
clearing function, then achieving market balance becomes a policy aim that requires additional
instruments (such as export refunds and consumption aids). Their rationale is indeed to balance the
market at the prevailing price. However, the market imbalance is itself due to the working of another
instrument of the policy package.
Figure 4.2 Price support in the EU prior to milk quotas
Whether intervention buying or subsidised private stock-holding should be considered as further options
for surplus disposal depends on the time frame considered. It is true that, in the short term, policy
measures that take supply off the market and into storage allow the market to clear at a higher price
than would otherwise be the case. However, the essential role of stockholding is to change the timing of
sales into (final) demand. Stock-holding is subject to capacity constraints and limits on budget
appropriations, and is sustainable in the medium term only if stocks can be released back onto the
market when market prices improve. It is argued here, on a theoretical level, that intervention and other
stockholding activities cannot be considered instruments of price support except in the short term. In the
medium term, which is the relevant one for the level of producer income support, temporary withdrawal
of supplies from the market can prevent price from falling below a minimum level but it also prevents
price from rising as high as it would during periods when market conditions are more buoyant and stored
supplies are being returned to the market. Thus, stock-holding per se has virtually no effect over the
medium term on the average level of price support.
Of course, if stock levels are kept under control by the use of subsidised export sales out of storage, this
quantity is not returned to the domestic market at a later stage and does indeed represent an increase in
final disposal of the product. Therefore, some price support has been achieved. However, it is the
subsidised export and not the stockholding per se that has supported the medium-term price. The transit
of the product through storage has simply permitted flexibility in the timing of the product’s disposal on
the world market. Even if this change in timing has allowed the product to be exported with a smaller
subsidy, it is the government budget that benefits, not the domestic producer price. It follows that, in the
context of producer income support via market price support, stockholding should be classified as a
price-stabilising mechanism rather than a support mechanism
Three additional remarks are important at this point. First, the policy measures described above all relate
to markets downstream from the market for raw milk. In all cases – internal demand subsidies, trade
measures or product storage – the intervention takes place in a market for a processed product and not
in the market for raw milk. Therefore, these measures are effective in supporting the producer price of
raw milk in the first-point-of-sale market only under certain conditions. We return to this point section
4.2.
NEW
EXPORTABLE
SURPLUS
D’= MARKET DEMAND D + DOMESTIC SUBSIDISED DEMAND
Q1
D=DEMAND
S=SUPPLY
Pw
P1
PRICE
QUANTITY
EXPORTABLE
SURPLUS
P1 = SUPPORTED PRICE
Pw = WORLD MARKET PRICE
Q2
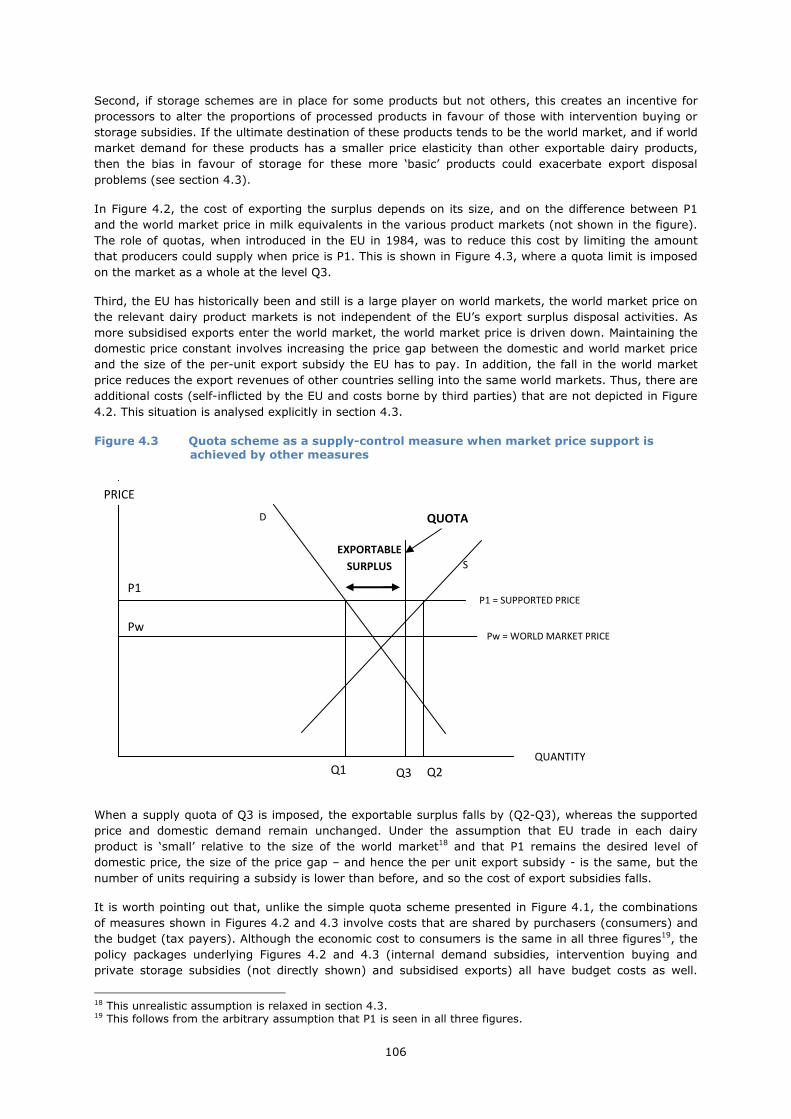
106
Second, if storage schemes are in place for some products but not others, this creates an incentive for
processors to alter the proportions of processed products in favour of those with intervention buying or
storage subsidies. If the ultimate destination of these products tends to be the world market, and if world
market demand for these products has a smaller price elasticity than other exportable dairy products,
then the bias in favour of storage for these more ‘basic’ products could exacerbate export disposal
problems (see section 4.3).
In Figure 4.2, the cost of exporting the surplus depends on its size, and on the difference between P1
and the world market price in milk equivalents in the various product markets (not shown in the figure).
The role of quotas, when introduced in the EU in 1984, was to reduce this cost by limiting the amount
that producers could supply when price is P1. This is shown in Figure 4.3, where a quota limit is imposed
on the market as a whole at the level Q3.
Third, the EU has historically been and still is a large player on world markets, the world market price on
the relevant dairy product markets is not independent of the EU’s export surplus disposal activities. As
more subsidised exports enter the world market, the world market price is driven down. Maintaining the
domestic price constant involves increasing the price gap between the domestic and world market price
and the size of the per-unit export subsidy the EU has to pay. In addition, the fall in the world market
price reduces the export revenues of other countries selling into the same world markets. Thus, there are
additional costs (self-inflicted by the EU and costs borne by third parties) that are not depicted in Figure
4.2. This situation is analysed explicitly in section 4.3.
Figure 4.3 Quota scheme as a supply-control measure when market price support is achieved by other measures
When a supply quota of Q3 is imposed, the exportable surplus falls by (Q2-Q3), whereas the supported
price and domestic demand remain unchanged. Under the assumption that EU trade in each dairy
product is ‘small’ relative to the size of the world market18 and that P1 remains the desired level of
domestic price, the size of the price gap – and hence the per unit export subsidy - is the same, but the
number of units requiring a subsidy is lower than before, and so the cost of export subsidies falls.
It is worth pointing out that, unlike the simple quota scheme presented in Figure 4.1, the combinations
of measures shown in Figures 4.2 and 4.3 involve costs that are shared by purchasers (consumers) and
the budget (tax payers). Although the economic cost to consumers is the same in all three figures19, the
policy packages underlying Figures 4.2 and 4.3 (internal demand subsidies, intervention buying and
private storage subsidies (not directly shown) and subsidised exports) all have budget costs as well.
18 This unrealistic assumption is relaxed in section 4.3. 19 This follows from the arbitrary assumption that P1 is seen in all three figures.
Q1
D
S
Pw
P1
PRICE
QUANTITY
EXPORTABLE
SURPLUS
P1 = SUPPORTED PRICE
QUOTA
Pw = WORLD MARKET PRICE
Q3 Q2

107
Therefore, the total costs of the policies shown are higher than in Figure 4.1, whilst at the same time
domestic producer benefits are also higher20 - and greater in Figure 4.2 without quota than in Figure 4.3.
Figure 4.4 Switch from market price support to a direct payment, maintaining quota
Figure 4.4 shows the situation when some support is shifted out of market price support into a direct
income payment. The supported internal price is reduced to P2. Internal demand expands to Q4. On the
supply side, the figure shows that quota is still binding at this lower price since at market price P2,
producers would like to supply more than Q3 (intersection of P=P2 and the supply function, but are
prevented from doing so by the quota). Thus, the total amount produced does not change. However,
since internal demand is higher, the size of the exportable surplus (Q3-Q4) is lower. Moreover, the price
gap between domestic and world market prices (P2–Pw) is also lower. Therefore, the total cost and the
cost per unit of exporting the surplus is reduced.
At the same time, the direct payment that accompanies the market price fall has to be funded out of the
budget. If the producers’ lost market revenue is fully compensated, then this budget cost amounts to
(P1-P2)× Q3. Whether this is greater or less than the saving on export subsidies depends on how much
internal demand expands at the lower price, the size of the original price gap and how much it is
reduced.21 It has to be specified when defining the policy how the amount payable to each producer is
calculated, together with other parameters such as duration of the payment, its transferability and
transfer rights, and so on. In order to minimise any production incentive, the EU dairy premium was
based on individual production levels but, in a second stage, rebased according to historic production
levels, merged with the single farm payment and hence decoupled altogether from milk production.
Based on other precedents, it is thus fully compatible with the WTO definition of a green box payment.
20 This statement must be qualified. If the support to the sector encourages herd expansion and new entrants to the sector, the cost of land suitable for dairying, as well as other dairy-specific assets, will be bid up in the medium term and producers’ fixed costs (the cost of using these assets for milk production) will rise. The extent to which the price support provided by the pre-quota package of measures shown in Figure 4.2 helps to maintain net farm income over the medium term depends on a number of case- and location-specific factors. When a quota scheme is added to the policy mix (Figure 4.3), the price support will tend to be capitalised in the value of quota (and its price, when it is marketable) since this is the most tightly controlled, and hence the most scarce, of the dairy-specific production assets. In both cases, support adds to production costs in the medium term, hence reducing farm income but boosting the income and wealth of (dairy-specific) asset owners who may or may not be milk producers. See section 4.4 for more discussion. 21 Given the low elasticity of demand for milk and dairy products on the internal market, the result is likely to be an increase in budget expenditure. However, taking account of the reduction in the consumer’s hidden subsidy to milk producers via the market price, the total economic cost of the income support is lower when a direct payment replaces some market price support.
P2
Q1 Q4
D
S
Pw
P1
PRICE
QUANTITY
NEW
EXPORTABLE
SURPLUS
P1 = OLD SUPPORTED PRICE
QUOTA
Pw = WORLD MARKET PRICE
Q3 Q2
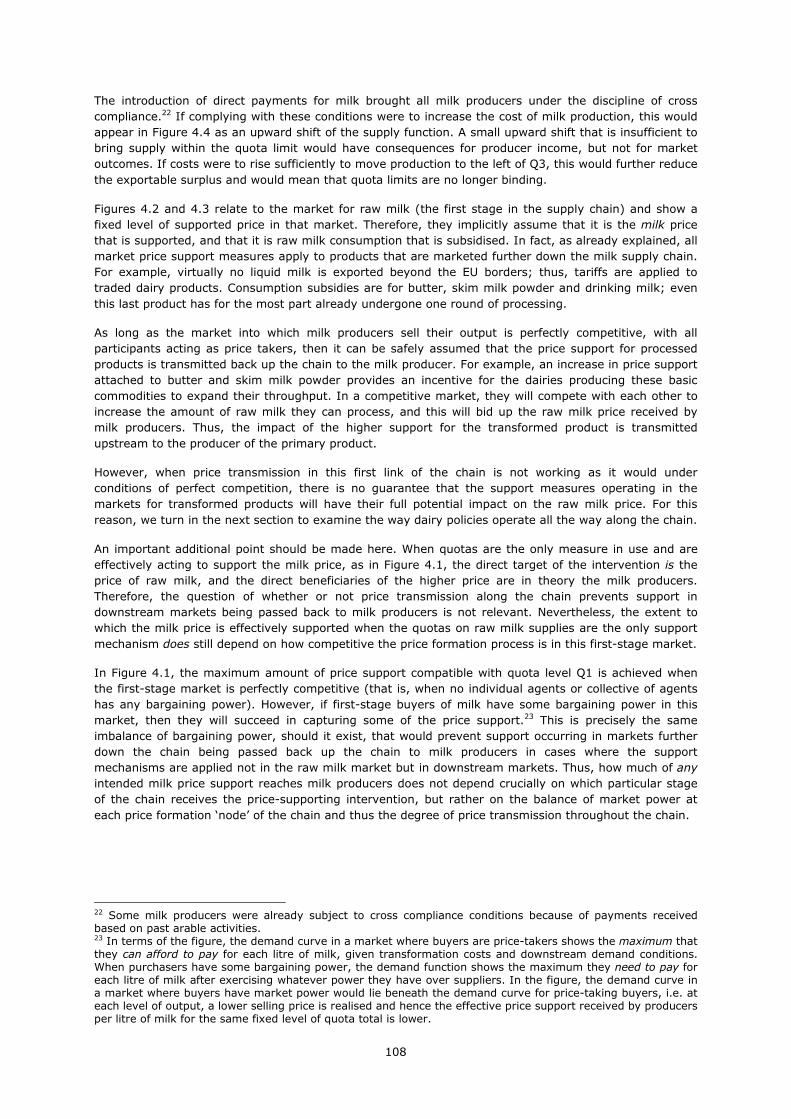
108
The introduction of direct payments for milk brought all milk producers under the discipline of cross
compliance.22 If complying with these conditions were to increase the cost of milk production, this would
appear in Figure 4.4 as an upward shift of the supply function. A small upward shift that is insufficient to
bring supply within the quota limit would have consequences for producer income, but not for market
outcomes. If costs were to rise sufficiently to move production to the left of Q3, this would further reduce
the exportable surplus and would mean that quota limits are no longer binding.
Figures 4.2 and 4.3 relate to the market for raw milk (the first stage in the supply chain) and show a
fixed level of supported price in that market. Therefore, they implicitly assume that it is the milk price
that is supported, and that it is raw milk consumption that is subsidised. In fact, as already explained, all
market price support measures apply to products that are marketed further down the milk supply chain.
For example, virtually no liquid milk is exported beyond the EU borders; thus, tariffs are applied to
traded dairy products. Consumption subsidies are for butter, skim milk powder and drinking milk; even
this last product has for the most part already undergone one round of processing.
As long as the market into which milk producers sell their output is perfectly competitive, with all
participants acting as price takers, then it can be safely assumed that the price support for processed
products is transmitted back up the chain to the milk producer. For example, an increase in price support
attached to butter and skim milk powder provides an incentive for the dairies producing these basic
commodities to expand their throughput. In a competitive market, they will compete with each other to
increase the amount of raw milk they can process, and this will bid up the raw milk price received by
milk producers. Thus, the impact of the higher support for the transformed product is transmitted
upstream to the producer of the primary product.
However, when price transmission in this first link of the chain is not working as it would under
conditions of perfect competition, there is no guarantee that the support measures operating in the
markets for transformed products will have their full potential impact on the raw milk price. For this
reason, we turn in the next section to examine the way dairy policies operate all the way along the chain.
An important additional point should be made here. When quotas are the only measure in use and are
effectively acting to support the milk price, as in Figure 4.1, the direct target of the intervention is the
price of raw milk, and the direct beneficiaries of the higher price are in theory the milk producers.
Therefore, the question of whether or not price transmission along the chain prevents support in
downstream markets being passed back to milk producers is not relevant. Nevertheless, the extent to
which the milk price is effectively supported when the quotas on raw milk supplies are the only support
mechanism does still depend on how competitive the price formation process is in this first-stage market.
In Figure 4.1, the maximum amount of price support compatible with quota level Q1 is achieved when
the first-stage market is perfectly competitive (that is, when no individual agents or collective of agents
has any bargaining power). However, if first-stage buyers of milk have some bargaining power in this
market, then they will succeed in capturing some of the price support.23 This is precisely the same
imbalance of bargaining power, should it exist, that would prevent support occurring in markets further
down the chain being passed back up the chain to milk producers in cases where the support
mechanisms are applied not in the raw milk market but in downstream markets. Thus, how much of any
intended milk price support reaches milk producers does not depend crucially on which particular stage
of the chain receives the price-supporting intervention, but rather on the balance of market power at
each price formation ‘node’ of the chain and thus the degree of price transmission throughout the chain.
22 Some milk producers were already subject to cross compliance conditions because of payments received based on past arable activities. 23 In terms of the figure, the demand curve in a market where buyers are price-takers shows the maximum that they can afford to pay for each litre of milk, given transformation costs and downstream demand conditions. When purchasers have some bargaining power, the demand function shows the maximum they need to pay for each litre of milk after exercising whatever power they have over suppliers. In the figure, the demand curve in a market where buyers have market power would lie beneath the demand curve for price-taking buyers, i.e. at each level of output, a lower selling price is realised and hence the effective price support received by producers per litre of milk for the same fixed level of quota total is lower.
109
4.2 The dairy supply chain
Figure 4.5 The stages in the chain
Note: S : supply; D: demand; S=D indicates market equilibrium.
In this simplified depiction of the dairy supply chain (see Figure 4.5), it is assumed that there are no
imports. Although it is still the case that the volume of imports not benefiting from an access quota is
quite small, a significant volume of imported dairy products (mainly butter and cheese) enter the EU
under bilateral preference agreements or multilateral Tariff Rate Quotas (TRQs). They could be shown in
Figure 4.5 and the following figures either as an additional source of supply, feeding into the retail
segment, or as a lower volume of final consumer demand (which would then be interpreted as final
consumer demand for EU dairy products). Since these import flows are largely the result of commitments
made in WTO trade schedule, and were not changed in 2003, they are not considered as part of the
policy package to be evaluated. It follows that, to keep things simple, they are omitted from the figures.
Trade measures are treated in more detail in section 4.3.
MILK PRODUCTION
DAIRIES, PROCESSORS (incl. FOOD INDUSTRY)
DIRECT SALES
EXPORTS
STOCK CHANGES
EU CONSUMERS
S=D
DOMESTIC RETAILERS,
RESTAURANTS/CATERERS
S=D
S=D
MILK REVENUE = PRODUCTION × PRICE

110
Figure 4.6 The stages in the chain showing the main dairy policy interventions
Note: S : supply; D: demand; S=D indicates market equilibrium.
Figure 4.6 represents the situation prior to the 2003 CAP reform package. It is striking that all the
explicit support measures (apart from quota24, which, as shown above for a competitive market, impacts
on price by limiting supply) relate to price formation mechanisms downstream from the milk producers.
Implicit price support measures include the tariff barriers that allow EU domestic prices to remain at
levels above those of the world market without attracting competitive imported products. These
measures also apply effectively only to processed dairy products.
Insofar as the subsidies acting on the second stage of the chain boost demand for dairy products and
help to clear the respective markets for dairy products, they contribute to the objective of achieving a
24 It is important to point out that quotas are adjusted for the fat content of the milk. This is clearly due to the fact that in the past the surplus problems have always been more acute for the fat component of milk (butter) than for the protein component (SMP).
MILK PRODUCTION
DAIRIES, PROCESSORS (incl. FOOD INDUSTRY)
DIRECT SALES
EXPORTS WITHOUT SUBSIDY
EXPORTS WITH SUBSIDY
STOCK CHANGES
SUBSIDISED DOMESTIC USE
(SCHOOL MILK, ANIMAL FEED, WELFARE PROGRAMMES, INDUSTRIAL BUTTER)
EU CONSUMERS
S=D
S=D
DOMESTIC RETAILERS
RESTAURANT/CATERERS
QUOTAS INTERVENTION
PRIVATE STORAGE AID
SUBSIDIES
S=D
MILK REVENUE = PRODUCTION × PRICE

111
better balance between supply and demand, especially once the quantity of raw milk is more or less fixed
by delivery quotas. However, the efficacy of such measures in supporting the price received by milk
producers or stabilising that price, clearly depends on the price formation mechanism in the first link of
the chain, namely between milk producers and dairies, as argued above. At the same time, it is also
dependent on the price formation mechanism downstream from the supported market. For example, if
retailers can act as price-makers in the market for processed products, they will be able to use their
market power to capture some of the price support provided by policy measures in this market in order
to keep down the cost of their own supplies. If this occurs, then even if the dairies and wholesalers are
price-takers in the raw milk market or, despite having structural advantages in that market nevertheless
act like price-takers rather than using their market power, the price support available for transmission
back up the chain to milk producers will be reduced because of the market imbalance further down the
chain.
For completeness, stockholding is also shown in Figure 4.6 although we consider that it can act as a price
support measure only on the short term (see Section 4.1) and that it should more properly be classified
as a price stabilising measure rather than a price support measure. Figure 4.6 emphasises that
intervention buying and subsidies to stockholding apply in downstream markets, not in the raw milk
market. Hence, just as in the case of price-support measures, their effectiveness in stabilising the milk
price depends on the price formation process and the resulting degree of price transmission in upstream
markets.
Figure 4.7 represents the situation as envisaged by the 2003 reform, but before the decoupling of the
dairy premium. It is expected that, with the gradual relaxation of quota, more milk will be produced, thus
putting downward pressure on the milk price (quantity effect on milk price). The lower milk price will be
supplemented by the dairy premium paid directly to farmers, which is intended to compensate for the fall
in market price support. Even when the dairy premium just compensates for the price fall, whether or
not milk income remains unaffected depends on the extent of the production increase and the extent, if
any, that cross compliance constraints increase milk production costs.25
Therefore, the impact on farm incomes of these changes depends on three unknown factors:
• by how much does production increase? That is, do producers do fill the expanded quota?
• what consequences, if any, does the introduction of cross compliance have on milk production
costs?
• does the price formation process at the various links in the chain continue to function as it has in
the past, or do changed circumstances downstream (i.e. the withdrawal of some consumption
subsidies and the lower intervention prices and ceilings) change the behaviour of some market
participants? That is, do these changes in other segments in the chain provoke endogenous
behavioural shifts that affect the market for raw milk and the price received by milk producers in
unexpected ways?
25 For example, restrictions on manure production and handling, the identification and registration of animals regulation, animal welfare protocols (such as requirements with respect to the housing of calves).
112
Figure 4.7 The stages in the chain showing the main dairy policy interventions and the
effect of the dairy premium
Note: S : supply; D: demand; S=D indicates market equilibrium.
Furthermore, if there is a fall in the producer price of raw milk, the extent to which consumers benefit
from the lower milk price depends on the functioning of the second and third price formation
mechanisms in the chain. If the price fall is not passed on from dairies to retailers, and from retailers to
consumers, there will be no impact on consumer prices. If this should happen, then the increased milk
production due to an expansion in quota will not be taken up by increased consumer demand, and this
would leave more product available for export. However, if export outlets (subsidised and unsubsidised)
are saturated at current prices, further downward pressure would be exerted on the milk price.
MILK PRODUCTION
DAIRIES, PROCESSORS (incl.
FOOD INDUSTRY)
DIRECT SALES
EXPORTS WITHOUT SUBSIDY
EXPORTS WITH SUBSIDY
STOCK CHANGES
SUBSIDISED DOMESTIC USE
(SCHOOL MILK, ANIMAL FEED, WELFARE PROGRAMMES, INDUSTRIAL BUTTER)
EU CONSUMERS
S=D
S=D
DOMESTIC RETAILERS
RESTAURANTS/CATERERS
INTERVENTION
PRIVATE STORAGE AID
SUBSIDIES
S=D
QUOTAS ↑↑↑↑ MILK REVENUE = PRODUCTION ×××× (LOWER PRICE + DAIRY PREMIUM)

113
When the dairy premium is decoupled from milk production, it is no longer necessary to remain in milk
production in order to receive it. If the pressure on price is such that production costs are no longer
covered by price plus direct payment, the incentive to remain in milk production is low and an
acceleration in the rate of exit from milk production is likely.
These expected changes are summarised in Table 4.1.
Table 4.1 Expected impacts of main policy changes (arrows show the direction of the effect)
Factors expected to affect Consequences for milk income
Stage volume produced number of milk producers
producer price for milk
milk income = revenue minus costs
Pre-2003 reform
quota limits binding following a secular decline
following a secular decline26
falling price trend offset by yield increases
Post-2003 reform Stage 1 (price ↓ + dairy premium)
� quota limits still binding in most Member States
� lower superlevy unlikely to be a production incentive
following a secular decline � post-2013
uncertainty↓ � need to produce in
order to get MP↑
� lower intervention ceilings → price instability ↑
� dairy premium intended to offset fall in market price =
� costs of cross compliance ↓/-
Post-2003 reform Stage 2 (decoupling of dairy premium, intervention/ storage ↓
� more quota ↑ � decoupling ↓ � price pressure (if
in excess of compensation from DP) ↓
� lower prices ↓ � decoupling removes
production as condition for receiving DP ↓
� more quota ↓ lower interven-tion prices and ceilings + withdrawal of storage aid → price instability ↑
Expected outcome: Higher volume (quota increase) plus structural rationalisation (post-decoupling) will maintain the income of producers who remain in production
Table 4.1 summarises the main theoretical predictions concerning the impacts of the two stages of the
2003 reform on several key variables and on one of the objectives of the policies, namely milk producers’
income. These two post-2003 stages correspond to before and after decoupling of the dairy premium.
The table reveals that the package of changes set in motion is expected to impact on farm incomes in a
complex way. By the end of the period, the net impact of this package on the incomes of milk producers
who continue in production depends on a number of uncertainties:
• the extent of the structural rationalisation following decoupling, and its characteristics (in particular,
whether this process has kept the efficient competitive producers in production whilst allowing or
encouraging marginal producers to exit)
• the utilisation rate of the higher quota limits such that, by expanding in size, continuing herds can
exploit economies of size and remain viable
• the extent of the downward pressure on price, and whether the (decoupled) dairy premium turns
out to provide an adequate compensation for the price fall.
In evaluating the policy changes, one can ask a number of general questions:
• Was the policy outcome, as summarised in the bottom right-hand cells of Table 4.1, a reasonable
one to expect, given the expectations at the time about world market conditions and producer
behaviour?
• Was sufficient account taken of the cumulative effect of the whole package, over and above the
effect of each policy change considered in isolation?
• Were the assumptions about the speed of adjustment (in particular, the mobility out of the sector)
reasonable?
• Given that the strategy, as summarised by the challenge defined in the table, relies on rapid
structural change, but change that favours the retention of the most competitive producers, were
26 In real terms. In nominal terms, the EU producer price for milk was fairly stable from the mid-1990s to about 2000, it then declined very gradually from about 2001 until mid-2007. This was followed by an extreme price peak, and a sharp fall to a low of €24-26 per 100kg, since when it has gradually recovered to the level of the early 2000s.

114
appropriate structural adjustment policies put in place (e.g. safety nets, mobility incentives,
information explaining the rationale of the changes, who should benefit and how)?
• Since most milk output moves along a complex chain before reaching the consumer, and since some
support measures applied to the sector actually apply to dairy products and act on downstream
stages in the chain rather than directly on primary milk producers, was it reasonable to embark on
reforms to ensure greater market orientation and a greater role of the ‘market’ in the milk-
producing sector without considering the potential market power and the marketing strategies of
other players further down in the chain, in the light of their potential in a less regulated primary
sector to unduly influence the ‘market-determined’ producer price for milk?
4.3 Trade measures for dairy products
As background to a theoretical overview of the trade measures in place for the dairy sector, it is useful to
compare the situation before and after the changes enshrined in the Agreement on Agriculture of the
WTO Uruguay Round Agreement (URA), which was signed in 1994 and fully implemented by 2000. Prior
to the URA, agricultural trade remained outside the discipline and obligations imposed by the General
Agreement on Tariffs and Trade (GATT). This was in part because special exemptions were accorded to
agriculture (for example, as regards the use of import quotas), and in part because various other trade
measures that were heavily used by various countries for agricultural protection were not covered by
GATT rules at all (such as the use of variable import levies and variable export subsidies).
The key EU trade measures for major agricultural commodities consisted of variable import levies (VIL)
and variable export subsidies (VES). The variable import levy for a product was adjusted its world market
price varied, in such a way as to keep the entry price (i.e., the price of the imported product on the
domestic market = Pw + VIL) at a steady level (the ‘threshold price’). For products that, at the high
domestic price, had a structural surplus that had to be exported, a subsidy paid from the EAGGF, was
needed to cover the price gap between the domestic and world market price. The export price on the
world market (Pw + VES) was set at a somewhat lower level than the entry price, and the VES was also
adjusted as a function of fluctuating Pw in order to keep Pw + VES relatively constant.
For chronically surplus products, it is this price (Pw + VES) that more or less set the price level in the
domestic market. In cases where EU self-sufficiency was less than 100%, the domestic price
corresponded to the entry price, Pw + VIL.
Because the VIL and the VES varied inversely with the world market, EU domestic agricultural prices
were insulated from world price movements: not only were they protected against exogenous world
market price instability (whilst instability originating internally on the domestic market was in the short
run counteracted by intervention buying), but these price levels could in the medium term remain
independent of world market price trends. However, this was at the expense of escalating budget
expenditure on export subsidies.
The URA imposed a number of important changes on this set of measures (the details below relate to the
situation at the end of the 6-year transition period 1995-2000).
Market access
Import duties: variable import levies became illegal and were replaced by their tariff equivalents, based
on the effective protection for each tariff line afforded by the border measures in place during 1986-88.
These tariffs were bound and the bindings had to be reduced by an average of 36% (minimum reduction
for a particular tariff line of 15%). Unlike some major trade competitors, the EU did not reduce tariffs on
a selective basis but rather imposed the straight 36% cut on all agricultural products.27
27 The complex, and in some respects incompletely specified, methodology for calculating tariff equivalents allowed countries to report the most ‘favourable’ base-year tariff equivalents as the basis for the agreed reductions. This produced the phenomenon known as ‘water in the tariffs’ whereby, even after the full agreed reduction had been imposed on the base-year tariff equivalent, the difference between bound tariff and the actual equivalent import duty in 1986-88 could be relatively small. Ingco (1996) estimated that the actual (average) tariff equivalent for EU dairy products was 177% in 1986-88 whereas the (average) bound tariff
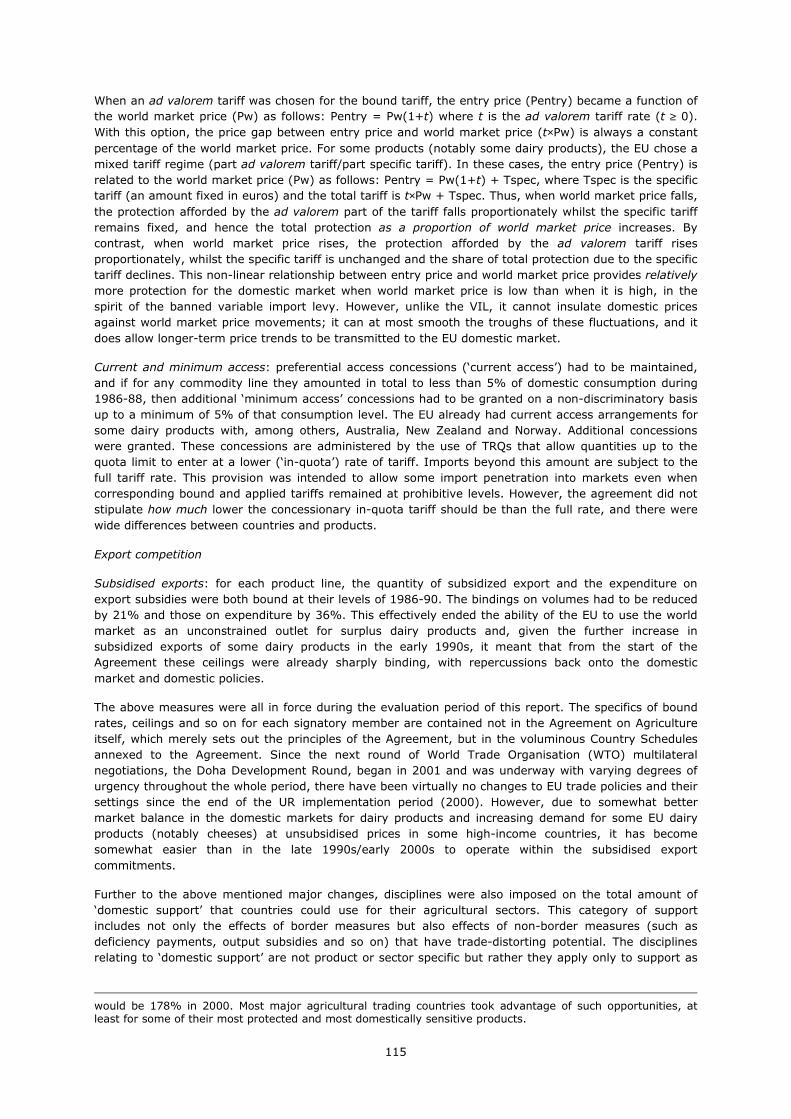
115
When an ad valorem tariff was chosen for the bound tariff, the entry price (Pentry) became a function of
the world market price (Pw) as follows: Pentry = Pw(1+t) where t is the ad valorem tariff rate (t ≥ 0).
With this option, the price gap between entry price and world market price (t×Pw) is always a constant
percentage of the world market price. For some products (notably some dairy products), the EU chose a
mixed tariff regime (part ad valorem tariff/part specific tariff). In these cases, the entry price (Pentry) is
related to the world market price (Pw) as follows: Pentry = Pw(1+t) + Tspec, where Tspec is the specific
tariff (an amount fixed in euros) and the total tariff is t×Pw + Tspec. Thus, when world market price falls,
the protection afforded by the ad valorem part of the tariff falls proportionately whilst the specific tariff
remains fixed, and hence the total protection as a proportion of world market price increases. By
contrast, when world market price rises, the protection afforded by the ad valorem tariff rises
proportionately, whilst the specific tariff is unchanged and the share of total protection due to the specific
tariff declines. This non-linear relationship between entry price and world market price provides relatively
more protection for the domestic market when world market price is low than when it is high, in the
spirit of the banned variable import levy. However, unlike the VIL, it cannot insulate domestic prices
against world market price movements; it can at most smooth the troughs of these fluctuations, and it
does allow longer-term price trends to be transmitted to the EU domestic market.
Current and minimum access: preferential access concessions (‘current access’) had to be maintained,
and if for any commodity line they amounted in total to less than 5% of domestic consumption during
1986-88, then additional ‘minimum access’ concessions had to be granted on a non-discriminatory basis
up to a minimum of 5% of that consumption level. The EU already had current access arrangements for
some dairy products with, among others, Australia, New Zealand and Norway. Additional concessions
were granted. These concessions are administered by the use of TRQs that allow quantities up to the
quota limit to enter at a lower (‘in-quota’) rate of tariff. Imports beyond this amount are subject to the
full tariff rate. This provision was intended to allow some import penetration into markets even when
corresponding bound and applied tariffs remained at prohibitive levels. However, the agreement did not
stipulate how much lower the concessionary in-quota tariff should be than the full rate, and there were
wide differences between countries and products.
Export competition
Subsidised exports: for each product line, the quantity of subsidized export and the expenditure on
export subsidies were both bound at their levels of 1986-90. The bindings on volumes had to be reduced
by 21% and those on expenditure by 36%. This effectively ended the ability of the EU to use the world
market as an unconstrained outlet for surplus dairy products and, given the further increase in
subsidized exports of some dairy products in the early 1990s, it meant that from the start of the
Agreement these ceilings were already sharply binding, with repercussions back onto the domestic
market and domestic policies.
The above measures were all in force during the evaluation period of this report. The specifics of bound
rates, ceilings and so on for each signatory member are contained not in the Agreement on Agriculture
itself, which merely sets out the principles of the Agreement, but in the voluminous Country Schedules
annexed to the Agreement. Since the next round of World Trade Organisation (WTO) multilateral
negotiations, the Doha Development Round, began in 2001 and was underway with varying degrees of
urgency throughout the whole period, there have been virtually no changes to EU trade policies and their
settings since the end of the UR implementation period (2000). However, due to somewhat better
market balance in the domestic markets for dairy products and increasing demand for some EU dairy
products (notably cheeses) at unsubsidised prices in some high-income countries, it has become
somewhat easier than in the late 1990s/early 2000s to operate within the subsidised export
commitments.
Further to the above mentioned major changes, disciplines were also imposed on the total amount of
‘domestic support’ that countries could use for their agricultural sectors. This category of support
includes not only the effects of border measures but also effects of non-border measures (such as
deficiency payments, output subsidies and so on) that have trade-distorting potential. The disciplines
relating to ‘domestic support’ are not product or sector specific but rather they apply only to support as
would be 178% in 2000. Most major agricultural trading countries took advantage of such opportunities, at least for some of their most protected and most domestically sensitive products.

116
an aggregate (although it is stipulated that total support granted to an individual commodity cannot
exceed its 1992 level), and therefore we do not elaborate on them here.
Two provisions of the Agreement relating to domestic support are, nevertheless, relevant to the changes
in EU dairy policy during the evaluation period. These are, first, that that no new domestic support
measure can be introduced unless it satisfies the conditions of the (Annex 2 of the Agreement) ‘green
box’ (Article 7: 2(a)) and, second, that direct payments made under production-limiting programmes are
not included in the aggregate that is subject to a reduction commitment if (inter alia) they are based on
fixed area and yields (Article 6: 5(a)). This helps to explain the design of the dairy premium and its
subsequent mutation: when it was first introduced (and linked to milk quota reference quantities), it
arguably complied with the Article 6 provision, whereas once it was fully decoupled it could be defended as
complying with green box definitions, even in a post-milk quota setting (i.e. with no production-limiting
programme).
Having said this, the WTO Agreement was almost certainly not the prime motivation for the specific form
taken by the dairy premium. It is much more likely that it was motivated by the intention to harmonise and
simplify the CAP across the major commodities. Since payments to the arable sector had already been
reformed in a similar way – i.e. decoupled from current production and then merged in a non-product-
specific payment (and for that sector one could plausibly argue that WTO guidelines were a major factor), it
was virtually a foregone conclusion that the dairy premium would follow suit and be merged with the SFP,
thereby losing its identity as ‘originating’ in the dairy support programme.
Figure 4.8 sets out diagrammatically the operation of the most important trade measures as they apply to
each dairy product. The first panel of the diagram shows the relationship between the entry price for
products subject to the full Most Favoured Nation (MFN) tariff, the world price and the entry price for
products imported within a TRQ. As depicted in Figure 4.8, it is effectively the size of the EU export subsidy
that fixes the level of the EU domestic price (in other words, the export subsidy determines the effective
price gap). Imports under the TRQ can enter at a rate of duty less than the subsidy, but are sold on the EU
market at the full domestic price, with the ‘quota rent’ accruing to whoever is the holder of the licence to
import under the TRQ.
This figure allows us to relax the ‘small country’ assumption, which was made for simplicity in section 4.2
above. A country is ‘small’ with respect to a particular commodity when its trade flows are too small relative
to the world market to alter world market price. This is clearly not true in the case of the EU and world
markets for dairy products. It can be seen (although it is not shown explicitly in Figure 4.8), that if the EU
opted for a higher domestic price the following changes would ensue:
in the second panel – domestic market:
• EU domestic supply would increase,
• the amount of exportable surplus would increase.
in the third panel – world market:
• the EU would move up its excess supply curve,
• world-market purchasers would move down their demand curve to absorb the higher export offer,
and
• the EU export subsidy would have to increase to cover the larger price gap.
Note that the required adjustment of the export subsidy is already implicit in the second panel of the figure.
This reasoning demonstrates clearly how the EU’s active use of the world market for surplus disposal in
previous decades had the effect of driving down the price and worsening the demand conditions it faced in
those world markets, to the benefit of net importing countries but to the cost of other dairy exporting
countries. It also shows that the inability to continue subsidising exports beyond a given ceiling weakens
control over the EU domestic price. Effectively, it constrains the marginal rate of export subsidy and hence
forces the market managers, faced with an increase in exportable surplus when the ceiling is already
reached, to allow the domestic market price to fall so that the increase is either absorbed by domestic
demand or can be sold on the world market without subsidy.

117
Figure 4.8, as drawn, does not include EU quotas on domestic milk supply. If quota limits are added to the
figure, their impact is the same as was set out in detail in Section 4.1: the exportable surplus is reduced,
thereby reducing the number of units of export that have to be exported with subsidy, but without
changing EU demand. However, Figure 4.8 also shows clearly that, when the exporting country is ‘large’,
the world market price itself rises when the EU’s exportable surplus falls and the rate of export subsidy
needed to hold the domestic price level is reduced. Therefore, there is a two-fold downward impact on the
cost of surplus disposal.
Figure 4.8 The EU domestic market and the world market, showing the operation of the main trade measures
4.4 Dairy income and the decision to quit
This section analyses the micro-economics of the individual price-taking milk producing enterprise. In
particular, it considers the link between price support and income, and attempts to shed light on the
factors underlying the decision to quit milk production.
Figure 4.9 provides the basic framework for analysing these questions. The upward-sloping supply curve
shows how much milk a producer would be willing to supply at each level of market price. For example,
at the market price shown in the figure, the producer would be willing to supply the amount Q*.
The supply curve also traces out the marginal cost of supplying the last unit of milk at each of these
potential supply levels. It is clear that, at each level of supply, the full market price is needed to cover
the extra cost of the last unit only. For all the intra-marginal units, the given level of price exceeds the
marginal cost of producing them. The total area under the supply curve up to the output level Q* is
interpreted as the sum of the marginal cost of producing all units, or in other words the total cost of the
variable inputs used to produce Q*.
EU
EXPORTABLE
SURPLUS
EU SUPPLY
TRQ
EU EXPORT
SUBSIDY
P EU
Pw
IMPORT
DUTY
P ENTRY
WITHIN
-
QUOTA
TARIFF
TOTAL
DEMAND
NET OF TRQ
I. EUROPEAN UNION II. REST-OF-THE-WORLD
EXCESS
SUPPLY EU
EXCESS
DEMAND
REST-OF-THE-
WORLD
TOTAL EU
WORLD MARKET EU BORDER MEASURES EU DOMESTIC MARKET
EU

118
Figure 4.9 Economics of milk supply
When the market price is as shown in the figure, the producer’s revenue is the rectangle PRICE × Q*. As
only the part of the revenue that lies under the supply curve is needed to remunerate the variable
inputs, the remainder – the area above the supply function but under the price line - is the income
available to remunerate the fixed factors (permanent labour, land and other capital). More efficient
producers, or producers with natural cost advantages like better grazing land or superior herd capital,
will have lower intra-marginal variable costs, and hence supply curves that are lower for much of the
range of output up to the final unit produced. Therefore, for these producers, there will be more revenue
left after paying the variable factors to enable a higher remuneration of these better-performing fixed
factors. Over time, the income-earning potential of fixed factors becomes built into their asset value –
higher-earning land has a higher market value. Therefore, the income to fixed factors must not be
equated with ‘profit’, which is what is left when all factors have been remunerated at their economic cost.
Figure 4.10 Milk supply and the impact of an individual quota
PRICE
MARKET PRICE
FOR MILK
SUPPLY =
MARGINAL COST
QUANTITY Q*
QUOTA PRICE
SHADOW PRICE
MILK
MARKET PRICE
MILK
SUPPLY =
MARGINAL COST
QUANTITY
QUOTA Q*

119
In Figure 4.10, a supply quota has been imposed, which prevents the producer from supplying his
desired level of output, Q*. We assume the market price remains unchanged at the same (supported)
level. The supply function shows that a much lower price incentive would have been sufficient to
persuade the producer to supply only up to the quota level. This price is the so-called shadow price of
milk. Yet he receives a much higher price. The difference between the market price and the shadow price
is the (marginal) quota rent. The shaded area represents the total quota rent – the revenue that he
receives for supplying the quota amount over and above what he would have needed to receive in order
to supply (only) that amount voluntarily.
Under a quota scheme, the producer needs to be in possession of the right to supply his quota allocation.
Without this right, he cannot supply. Therefore, it follows that the total quota rent can be interpreted as
the economic return to the possession of the corresponding quantity of quota rights for one supply
period, and the amount (MARKET PRICE FOR MILK – SHADOW PRICE) is the implicit value to him of a
unit of quota for one supply period, at this level of quota. The asset value of the quota is the present
value of the discounted flow of future quota rents, with the rate of tie discounting reflecting uncertainties
about the duration of the quota scheme and about future decisions relating to the support price.
If quota can be leased, it would be advantageous for the producer to lease out some of his quota as long
as the leasing price is greater than his own marginal quota rent. Leasing out, and hence moving back
down his supply curve, would increase his quota rent at the margin until it comes into line with the
market leasing price. Alternatively, he would lease in more quota if the leasing price is less than the
quota rent that he could earn on units of output beyond his current quota limit. When permanent sales of
quota are possible, the same reasoning applies: the producer will in theory be a quota purchaser if the
quota price is less than the discounted present sum of the future quota rent he can earn on extra units,
or in the opposite case, he will be a quota seller.
In the real world, many other factors influence the quota transfer decision. For example, a potential
purchaser may face a borrowing constraint that makes it impossible for him to enter the market, the
herd may be just one of the enterprises on the farm and may be in balance with the logistics of the
whole farm at its present size, or there may be non-pecuniary (psychological or subjective) reasons for
not wanting to expand or downsize. Furthermore, it has to be recognized that milk is not the only
marketable output of a dairy herd – calves and culled cows also provide income and this may influence
production decisions.
Two further remarks should be made. First, it cannot be assumed that the amount identified in Figure
4.9 as the remuneration of the fixed factors is automatically part of the producer’s own income. If he
owns all this fixed factors, then it does form part of his income but not his income as a farm operator. It
is in fact income accruing to his asset ownership. For example, the part of this payment that represents
the return to land is his income as a landowner rather than as a milk producer. It follows that if he does
not own his land (for example, he is a tenant or the bank loan used to buy the land has not yet been
paid off), the corresponding part of the fixed factor income is paid out by him to the owner of the
corresponding asset, and he is left with the part of the fixed factor income that corresponds to his own
assets (managerial skill, herd capital or whatever).
The same reasoning applies to the final destination of the quota rent. If the producer owns the quota,
quota rent remains part of his farm income (but strictly speaking because of asset ownership rather than
his production activity). However, if he has borrowed to buy the quota and is paying interest on his loan,
the quota rent will be paid out in interest to the lender.

120
Figure 4.11 Economics of quota transfer
Figure 4.11 compares the situation of two different milk enterprises, the first being characterized by a
greater level of efficiency, and a higher level of quota, than the second. The efficiency differential is
reflected in the very different levels of the two shadow prices. With the current milk price and their given
level of quota, both are able to stay in production.
If they are able to trade quota, producer 1 would be willing to buy quota at prices less than the
capitalized equivalent of PRICE – SP1, and producer 2 would be willing to sell at prices above the
equivalent of PRICE – SP2. Therefore, a transaction could be agreed between them for a price
somewhere in the range: PRICE – SP2 < QUOTA PRICE < PRICE – SP1. Indeed, producer 2 would sell his
entire quota for a price in excess of (the capitalized equivalent of) PRICE – EXIT PRICE. But even at this
price, which is feasible for producer 1 at the margin, the entire quota would not be bought by producer
1, because only a smaller number of units of output beyond his quota level can earn quota rent in excess
of this amount.
The above analysis does not explicitly allow for differences in the opportunity cost of fixed factors
between farms in different locations and situations. In cases where there is no other economic use for
the fixed factors (land and/or labour) apart from milk production, producer 2 would resist profitable
quota trades as long as this enabled his fixed factors to continue to earn some income (over and above
variable costs).28
Finally, we consider what would happen if quotas are abolished and the market price for milk falls to the
level denoted in the figure as POST-QUOTA MARKET PRICE (Figure 4.12). In this case, producer 1
remains in milk production and expands output beyond his old quota level, whereas producer 2 cannot
cover his variable costs and ceases production. Under this scenario, producer 2 does not receive any exit
payment. It is therefore a possibility that, before quota is abolished and while it still has some
marketable value, producer 2 might sell his entire quota for less than PRICE – EXIT PRICE if he expected
to no longer be able to survive in the post-quota environment. At least in this way he would realize some
capital on his quota holding.
28 A consequence of this analysis is that the aggregate supply curve might shift down as compared to a situation where quotas are not tradable. See Réquillart et al. (2008) for further details.
EXIT PRICE
SP2
SP1
PRICE PRICE QUOTA 1 QUOTA 2
S1
S2
MARKET PRICE
MILK
QUANTITY
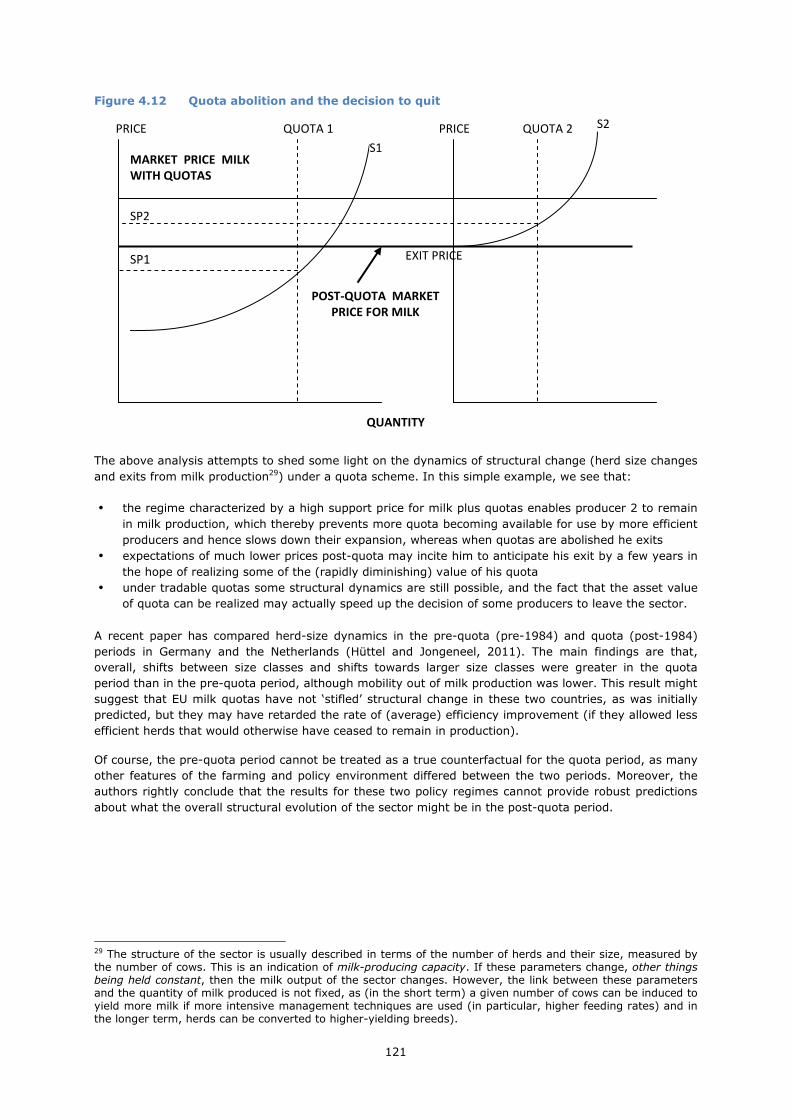
121
Figure 4.12 Quota abolition and the decision to quit
The above analysis attempts to shed some light on the dynamics of structural change (herd size changes
and exits from milk production29) under a quota scheme. In this simple example, we see that:
• the regime characterized by a high support price for milk plus quotas enables producer 2 to remain
in milk production, which thereby prevents more quota becoming available for use by more efficient
producers and hence slows down their expansion, whereas when quotas are abolished he exits
• expectations of much lower prices post-quota may incite him to anticipate his exit by a few years in
the hope of realizing some of the (rapidly diminishing) value of his quota
• under tradable quotas some structural dynamics are still possible, and the fact that the asset value
of quota can be realized may actually speed up the decision of some producers to leave the sector.
A recent paper has compared herd-size dynamics in the pre-quota (pre-1984) and quota (post-1984)
periods in Germany and the Netherlands (Hüttel and Jongeneel, 2011). The main findings are that,
overall, shifts between size classes and shifts towards larger size classes were greater in the quota
period than in the pre-quota period, although mobility out of milk production was lower. This result might
suggest that EU milk quotas have not ‘stifled’ structural change in these two countries, as was initially
predicted, but they may have retarded the rate of (average) efficiency improvement (if they allowed less
efficient herds that would otherwise have ceased to remain in production).
Of course, the pre-quota period cannot be treated as a true counterfactual for the quota period, as many
other features of the farming and policy environment differed between the two periods. Moreover, the
authors rightly conclude that the results for these two policy regimes cannot provide robust predictions
about what the overall structural evolution of the sector might be in the post-quota period.
29 The structure of the sector is usually described in terms of the number of herds and their size, measured by the number of cows. This is an indication of milk-producing capacity. If these parameters change, other things being held constant, then the milk output of the sector changes. However, the link between these parameters and the quantity of milk produced is not fixed, as (in the short term) a given number of cows can be induced to yield more milk if more intensive management techniques are used (in particular, higher feeding rates) and in the longer term, herds can be converted to higher-yielding breeds).
POST-QUOTA MARKET
PRICE FOR MILK
EXIT PRICE
SP2
SP1
PRICE PRICE QUOTA 1 QUOTA 2
S1
S2
MARKET PRICE MILK
WITH QUOTAS
QUANTITY

122
5 EQ1: Production and supply to / demand from dairies
Raw milk production represents the first stage of the dairy supply chain (see section 4.2). It is used by
all the other parts of the chain and hence is affected indirectly by all factors that affect one or another
part of the supply chain. The evaluation of the impact of CAP measures on raw milk production and
supply takes into account policies that targeted raw milk production directly (for example, expansion of
production quotas for milk deliveries) but also policies that were directed to other downstream segments
of the supply chain.
A. EQ1a: Production and supply to / demand from dairies (market balance)
To what extent have the CAP measures applicable to the dairy sector contributed to balancing supply and
demand for milk?
5.1 Interpretation and comprehension of the key terms of the EQ1a
The key terms in this evaluation question are supply, demand and balance. We interpret supply as milk
that leaves the farm, that is milk production minus on-farm use and losses, which is equivalent to the
sum of the volumes delivered to dairies and sold directly off farms. The demand for milk is a derived
demand − it depends on the demand for the dairy products that has been obtained from the milk and is
properly assessed at the moment where it is demanded by an end-user − the final consumer. We
interpret ‘demand for milk’ as the demand for the final consumption of milk as embodied in all its derived
products, and at the point where it becomes final domestic consumption or export use.
In a managed market, balance can be defined in different ways, which require careful definition.
‘Structural balance’ holds when the quantity supplied is matched by the amounts demanded for final use
by consumers and export markets without any policy measures being required to stimulate or create this
demand. Clearly, the concept of an absolute level of structural balance has no sense, since both sides of
the balance are responsive to price. In the case of the EU market for milk, as long as the quantity
supplied is – more or less - fixed by quota and imports under TRQs, and if prices are not perfectly free to
adjust to clear markets without government assistance, then it is quite possible to have a structural
imbalance, leading to a structural excess supply.
A second concept of balance, market balance, is achieved when no aids to final demand and no policy-
managed stocking or de-stocking are needed to maintain an acceptable price level in the short term. The
market surplus is defined as the structural surplus plus the net change in stocks used for the purpose of
smoothing prices. Stock changes temporarily remove or re-supply products from and to the market so
that it balances at a more stable price than would otherwise be the case, but they are not part of final
demand. Over a period of years, the underlying trends in structural excess supply and market surplus
are the same.
The analysis below focuses on the concepts of structural balance and structural excess supply. Their
exact definitions are given in the following section.

123
5.2 Methodology used for answering EQ1a: market balance
As explained in Chapter 4, balance between supply and demand is established more or less automatically
in a market with perfect competition where prices and quantities are free to adjust. However, if prices
and quantities are not free to adjust, then imbalances are very likely to occur.
Structural balance for EU raw milk is given by equation (1):
Total supply onto the EU market on the left-hand side of equation (1) depends on policy measures
affecting the domestic supply of milk (or its constituents) such as the milk quota ceiling, while imports
also depend on trade policies (see also discussion in the Theoretical analysis, Chapter 1). Although there
is hardly any trade in raw milk, all processed dairy products are traded on international markets.
Without demand management policies, total supply has to be absorbed spontaneously by final demand
outlets. This occurs if the pressure of supply is allowed to drive prices down, thereby inducing an
increase in demand (and/or a decrease in supply if supply is not fixed), until demand absorbs the supply
that is offered.30 Given the current milk-producing capacity in the EU and current demand levels,
achieving structural balance without changing the left-hand side of (1) would mean a substantial
lowering of the level of market price.31 If this is considered to be unacceptable, policy measures can be
used that boost the demand side of (1).
CAP policies to increase market off-take influence various segments of dairy demand. They are:
• domestic consumption aid programmes for dairy products (for example, disposal aid for butter,
school milk programme32)
• subsidies on exports
All these measures play a role in determining the structural excess supply of milk. This is summarised in
equation (2):
In addition, some CAP measures withhold products from the market temporarily, namely
• net intervention (public) stocks and subsidised private storage
30 This is a medium-term concept, since the first three terms are fairly stable over time. Demand for unsubsidised exports may be more variable, given exchange rate variations and so on. Therefore, a public stockholding facility that buys on the domestic market if price dips and sells when it is restored, may be used to smooth fluctuations in domestic price. The use of such a mechanism is compatible with medium-term structural balance as long as the average level of stocks is constant over the medium term (and net stock changes average to zero in the medium term. 31 This statement assumes that demand conditions (on EU and world markets) remain unchanged. During 2007-2008 world market demand temporarily increased dramatically, forcing up the world market price and the EU price also, so that even with higher prices the structural excess supply fell. In the longer term, with population growth and hence growing internal demand, reducing the structural surplus can be achieved without lowering prices as much as with no internal demand growth. In both these example, the price increase is demand-led. 32 The school milk programme is not under evaluation in this report.
Structural balance occurs when
EU domestic supply + imports = unsubsidised EU consumption + unsubsidised exports (1)
Structural excess supply = subsidised EU consumption + subsidised exports (2)
Market surplus = subsidised EU consumption + subsidised exports + net changes in
public and subsidised private stocks (3)
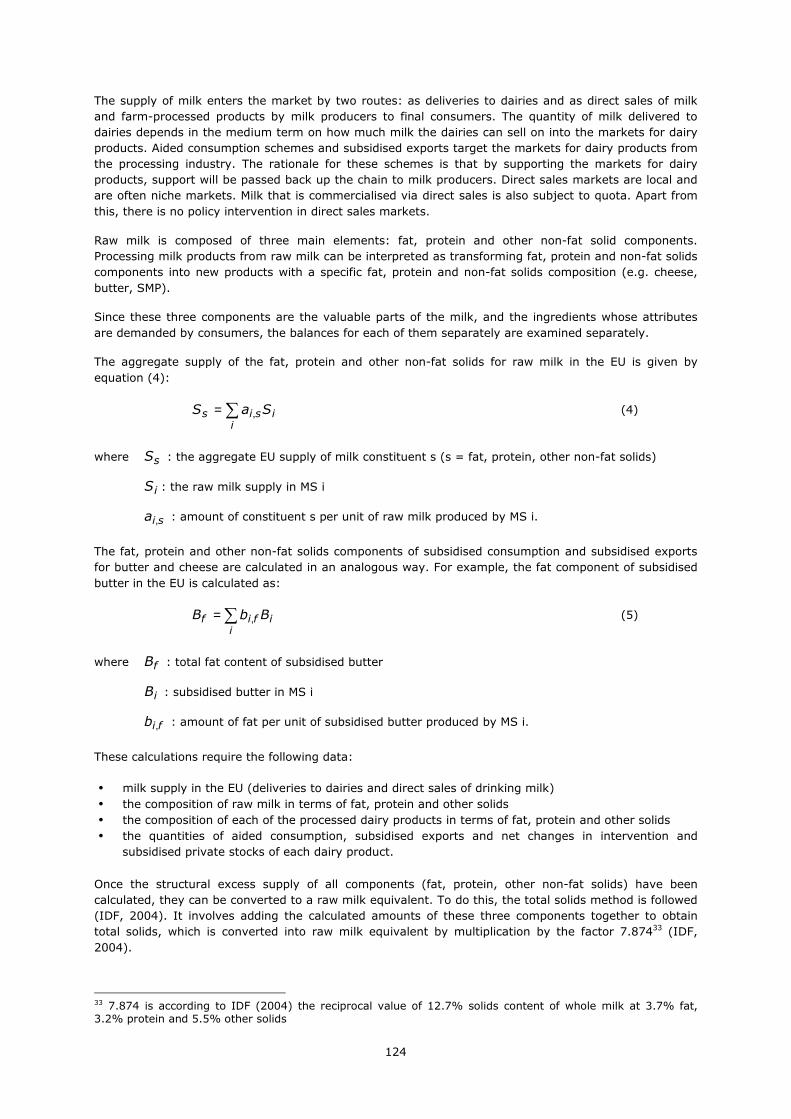
124
The supply of milk enters the market by two routes: as deliveries to dairies and as direct sales of milk
and farm-processed products by milk producers to final consumers. The quantity of milk delivered to
dairies depends in the medium term on how much milk the dairies can sell on into the markets for dairy
products. Aided consumption schemes and subsidised exports target the markets for dairy products from
the processing industry. The rationale for these schemes is that by supporting the markets for dairy
products, support will be passed back up the chain to milk producers. Direct sales markets are local and
are often niche markets. Milk that is commercialised via direct sales is also subject to quota. Apart from
this, there is no policy intervention in direct sales markets.
Raw milk is composed of three main elements: fat, protein and other non-fat solid components.
Processing milk products from raw milk can be interpreted as transforming fat, protein and non-fat solids
components into new products with a specific fat, protein and non-fat solids composition (e.g. cheese,
butter, SMP).
Since these three components are the valuable parts of the milk, and the ingredients whose attributes
are demanded by consumers, the balances for each of them separately are examined separately.
The aggregate supply of the fat, protein and other non-fat solids for raw milk in the EU is given by
equation (4):
∑=i
isis SaS , (4)
where sS : the aggregate EU supply of milk constituent s (s = fat, protein, other non-fat solids)
iS : the raw milk supply in MS i
sia , : amount of constituent s per unit of raw milk produced by MS i.
The fat, protein and other non-fat solids components of subsidised consumption and subsidised exports
for butter and cheese are calculated in an analogous way. For example, the fat component of subsidised
butter in the EU is calculated as:
∑=i
ifif BbB , (5)
where fB : total fat content of subsidised butter
iB : subsidised butter in MS i
fib , : amount of fat per unit of subsidised butter produced by MS i.
These calculations require the following data:
• milk supply in the EU (deliveries to dairies and direct sales of drinking milk)
• the composition of raw milk in terms of fat, protein and other solids
• the composition of each of the processed dairy products in terms of fat, protein and other solids
• the quantities of aided consumption, subsidised exports and net changes in intervention and
subsidised private stocks of each dairy product.
Once the structural excess supply of all components (fat, protein, other non-fat solids) have been
calculated, they can be converted to a raw milk equivalent. To do this, the total solids method is followed
(IDF, 2004). It involves adding the calculated amounts of these three components together to obtain
total solids, which is converted into raw milk equivalent by multiplication by the factor 7.87433 (IDF,
2004).
33 7.874 is according to IDF (2004) the reciprocal value of 12.7% solids content of whole milk at 3.7% fat, 3.2% protein and 5.5% other solids
125
5.3 Judgement criteria, indicators and information sources used for each
indicator
The indicators and information sources used to answer the questions concerning supply, demand and
market balance are provided in Table 5.1.
Table 5.1 Indicators, data requirements and information sources for EQ1a
Indicator Data requirement Information sources
Milk production, supply Data on raw milk production and supply, fat content, protein content
Eurostat, EU Commission, ZMP, and national statistics
Structural excess supply for fat, protein and other solids
Quantities of subsidised domestic consumption and subsidised exports by product
Eurostat, COMTRADE, European Commission
Structural excess supply for milk equivalent
Estimates for milk constituent coefficients per unit of milk products for fat and protein
Technical information from dairy processing experts in order to recover milk-component coefficients
The judgement criteria involve verifying whether trends in the indicators remain constant throughout the
period, or whether these trends alter in the post-2003 period in line with expectations as set out in the
Intervention Logic and summarised below.
The 2003 dairy policy reform included the following changes, starting in mid-2004:
• Shift of income support from price to direct payment (dairy premium, subsequently decoupled from
milk),
• Reduction in intervention prices for butter and skim milk powder,
• Abolition of target price for milk.
These policy changes are expected to lower the market price for milk in the period starting in 2004/5,
which should affect components of structural excess supply as follows:
• Increase in unsubsidised internal demand
• Smaller price gap between domestic and world market prices, making it easier to export without
subsidy (or to export with a lower rate of subsidy).
Both these impacts would contribute to reducing structural excess supply. Therefore, the main
judgement criterion is whether these expectations are borne out by the calculated market balances.
The market turbulence experienced during the period 2007-2009 caused EU and world market prices to
rise, thereby masking the impacts of the policy changes agreed in 2003. It follows that the most reliable
evidence on the ceteris paribus impact of the policy changes is provided by what happened in 2004-
2006, although the data for the following years offer interesting insights into the impacts of a sudden
increase in world market demand on the EU milk sector. It should be noted that the increase of 2% in
milk quota in April 2008 (Regulation (EC) 248/2008) was in response to the increased worldwide demand
for milk products, which could have reduced the EU’s structural excess to zero and caused even higher
internal prices than those that occurred.
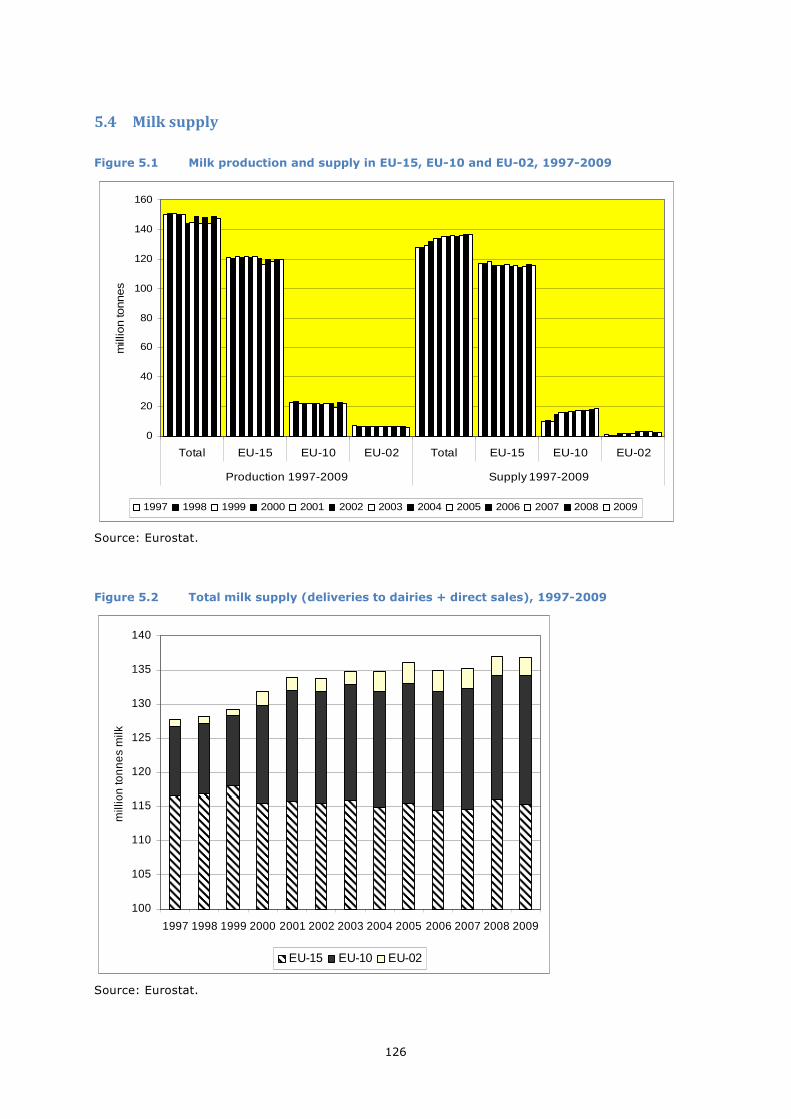
126
5.4 Milk supply
Figure 5.1 Milk production and supply in EU-15, EU-10 and EU-02, 1997-2009
0
20
40
60
80
100
120
140
160
Total EU-15 EU-10 EU-02 Total EU-15 EU-10 EU-02
Production 1997-2009 Supply 1997-2009
mill
ion
tonn
es
1997 1998 1999 2000 2001 2002 2003 2004 2005 2006 2007 2008 2009
Source: Eurostat.
Figure 5.2 Total milk supply (deliveries to dairies + direct sales), 1997-2009
100
105
110
115
120
125
130
135
140
1997 1998 1999 2000 2001 2002 2003 2004 2005 2006 2007 2008 2009
mill
ion
ton
nes
milk
EU-15 EU-10 EU-02
Source: Eurostat.
127
Figure 5.1 shows the evolution of domestic milk production and supply in the different parts of the EU. It
should be borne in mind when interpreting the amounts shown as ‘total’ (the sum of quantities over the
three country groups) that the countries of EU-10 entered the Union only in 2004 and those of EU-02 in
2007. Their participation in the CAP dates from the year of their accession, and prior to their entry their
production and supply were not part of the respective EU totals. The figures for their production and
supply are shown for the entire period in order to provide a perspective.
From 2004 onwards, EU-15 production and supply were on average about 2.2 million tonnes and 1.2
million tonnes lower, respectively, than in the 7-year period before 2004. The increasing supply of the
accession countries from 1997 onwards is due to the decline in subsistence milk production and the
increasing integration of milk production in these countries into organised supply chains.
Figure 5.2 presents figures on supply using the same conventions as adopted for Figure 5.1. Again, the
‘effective’ EU domestic supply up to the end of 2003 is that of EU-15, then there is an upward step as
EU-10 production is included from 2004 onwards, and finally for 2007-2009, EU supply is given by the
full height of the vertical bar.
Only the countries of EU-15 were regulated by the CAP for the entire period, and therefore the evolution
of their supply contains the most information about the impacts of dairy policy changes. Their evidence
also contains less ‘noise’ from other factors than the data for EU-10 and EU-02, which were undergoing
adjustment to EU membership in the first years after their accession.
EU-15 milk supply peaked in 1999 (at just over 118 million tonnes), and was stable at 115-116 million
tonnes over the next five years. Supply was below 115 million tonnes in 2006 and 2007. The question is
whether this is a lagged reaction to the lower price level for milk already recorded in 2005 and persisting
in 2006 (see evaluation question 2)34, or the combined effect of a short-run response to price plus
longer-run adjustments (herd closures, etc.) due to decoupling of the dairy premium and uncertainty
about the future of the quota scheme. A rigorous statistical analysis would be needed to determine the
relative importance of each of these policy-induced changes were as drivers of this behaviour. However,
in the absence of other explanations, we conclude that the lower EU-15 supply levels after 2003 and up
to 2007 resulted from the package of policy measures implemented after 2003. Lower EU-15 supply
during this period does not show up in the total supply for EU-27 because of an increase (+800 thousand
tonnes) in EU-10 supply.
The 2% quota increase in 2008 and the non-policy-related price spike of 2008 meant that EU-15 supply
was more than 1 million tonnes higher in 2008 than in the previous two years (Table 5.2). This masks
the continuing effect of the 2003 policy changes. It should be borne in mind that, starting in 2004, the
global EU milk quota was not met and that by 2009, total supply was about 10 million tonnes below the
EU ceiling (although five Member States were above their national ceilings).
Table 5.2 Summary of EU milk supply, averages in different sub-periods
1997-1999 2000-2002 2003 2004-2007 2008 2009
EU-15 117.18 115.50 116.01 114.93 116.13 115.32
EU-10 10.22 15.78 16.89 17.44 18.04 18.80
EU-02 0.97 1.88 1.90 3.00 2.81 2.69
Source: Eurostat.
The evidence shows that milk supply is responsive to policy signals, and that as quota limits cease to be
constraining, producers’ strategies will depend increasingly on rather than on what is permitted by quota
limits, indicating greater market orientation.
34 Although market price falls were ‘compensated’ by the dairy premium (calculated as a function of quota currently held) and then the decoupled payment (unrelated to current milk production) in these years, these direct income payments did not depend on the amount of milk produced, which therefore reacted to the price signal alone.

128
5.5 Structural excess supply and market surplus for fat, protein and other non-
fat solids
Table 5.3 presents the structural excess supply in terms of fat, protein and other non-fat solid
components and in raw milk equivalent.
Table 5.3 Market and structural excess supply for the milk components and milk equivalents, EU-15/25/27, 2000-2009, 1,000 t
2000 2001 2002 2003 2004 2005 2006 2007 2008 2009
Fat
Domestic supply 4,700 4,725 4,692 4,716 5,367 5,390 5,334 5,462 5,531 5,521
Imports 125 140 137 140 105 94 101 100 75 73
Aided consumption 453 465 449 452 470 469 458 172 15 10
Subsidised exports 266 246 344 359 391 356 292 140 1 233
Net change in stocks Public (intervention)
Private, aided by EU
6
-6
4
15
105 -21
26 -1
-53 -3
-34 -1
-47 -11
-53 13
0
-10
67 -9
Market surplus 719 730 877 836 804 790 692 272 6 301
Structural excess supply (SES) 719 711 793 811 861 824 750 312 16 243
SES as % of total supply 14.9 14.6 16.4 16.7 15.7 15.0 13.8 5.6 0.3 4.4
Protein
Domestic supply 7 3,875 3,868 3,893 4,432 4,455 4,405 4,541 4,605 4,596
Imports 115 115 116 125 85 68 78 69 57 59
Aided consumption 182 128 170 161 161 138 102 2 0 0
Subsidised exports 219 136 219 179 197 174 115 34 1 190
Net change in stocks Public (intervention)
Private, aided by EU
-64
0
-2 0
54
0
20
0
-49
0
-24
0
-1 0
-1 0
0 0
94
0
Market surplus 337 262 444 360 308 289 215 36 1 284
Structural excess supply (SES) 401 264 390 340 357 313 216 36 1 191
SES as % of total supply 10.1 6.6 9.8 8.5 7.9 6.9 4.8 0.8 0.0 4.1
Other non-fat solids
Domestic supply 6,345 6,366 6,347 6,381 7,258 7,316 7,253 7,439 7,534 7,525
Imports 54 42 51 67 21 8 16 10 8 6
Aided consumption 299 205 274 268 260 228 166 0 0 0
Subsidised exports 241 104 233 163 190 172 59 9 1 213
Net change in stocks Public (intervention)
Private, aided by EU
-109
0
-4 0
89
0
33
0
-81
0
-41
0
0 0
0 0
0 0
162
0
Market surplus 432 305 596 465 369 359 226 9 1 375
Structural excess supply (SES) 541 309 507 431 450 400 226 10 1 213
SES as % of total supply 8.4 4.8 7.9 6.7 6.2 5.5 3.1 0.1 0.0 2.8
Milk equivalent
Domestic supply 117,329 117,846 117,368 118,029 134,306 135,122 133,791 137,335 139,135 138,912
Imports 2,313 2,343 2,401 2,616 1,667 1,347 1,538 1,412 1,101 1,085
Aided consumption 7,359 6,284 7,037 6,938 7,018 6,574 5,714 1,375 120 81
Subsidised exports 5,719 3,827 6,273 5,518 6,117 5,529 3,669 1,440 19 5,015
Net change in stocks Public (intervention)
Private, aided by EU
-1,312
-47
-25 122
1,950 -168
625
-7
-1,446
-27
-774
-7
-378
-85
-423 107
0
-80
2,539
-74
Market surplus 11,719 10,208 15,091 13,074 11,662 11,322 8,920 2,499 59 7,561
Structural excess supply (SES) 13,078 10,111 13,310 12,456 13,135 12,102 9,383 2,815 139 5,096
SES as % of total supply 10.9 8.4 11.1 10.3 9.7 8.9 6.9 2.0 0.1 3.6
Notes: 1) For 2000-2003: EU-15, for 2004-2006: EU-25, and for 2007-2009: EU-27. 2) The data used for the calculations are presented in Table 2.49 for the disposal aid of butter, Figure 2.8 for the closing (public) intervention stocks. The change in private stocks aided by the EU for butter and SMP are taken from DG AGRI (various years). The subsidised exports refer to calendar years (DG AGRI, unpublished). The fat and protein composition of those products is taken from Eurostat. The non-fat solid composition is taken from IDF (2004).

129
Table 5.3 shows that the structural excess supply was positive in all years between 2000 and 2009 both
in milk equivalent and for fat, protein and other non-fat solids. Thus, given the level of policy-maintained
price support, the EU was producing more milk, and more of all the main milk components, than the
domestic and world market could absorb without the use of subsidies. The milk equivalent structural
excess supply peaked in 2002, but by 2004-2005 it was back at its 2000 level of between 8 and 9 million
tonnes. In 2006, structural excess supply of milk equivalent was lower than it had been since the
beginning of the decade, in 2007 it stood at less than 2 million tonnes, and was just 60 thousand tonnes
in 2008. Despite a considerable rise in 2009, this was the second-lowest level of the structural excess
supply in milk equivalent of the ten years shown. The changes after 2006 were primarily because of
changes in the structural excess supply of fat, and this was because of the higher unsubsidised
consumption and unsubsidised exports of butter.
Figure 5.3 Structural excess supply of fat, protein, other non-fat solids and milk-equivalent as % of total supply, 2000-2009
0
2
4
6
8
10
12
14
16
18
2000 2001 2002 2003 2004 2005 2006 2007 2008 2009
per
cent
Fat Protein Other non-fat solids Milk equivalent
Source: see footnote to Table 5.3.
Figure 5.3 emphasises that, relative to a situation of structural balance, fat is the milk component whose
structural excess supply relative to total supply was the greatest for most of the period. Its highest value
occurred in 2002, at over 16% of total supply. Other non-fat solids had consistently the smallest excess
structural supply relative to a situation of balance throughout the period. It is stressed that structural
excess supply must not be interpreted as showing an excess over self-sufficiency levels. Rather, they
reflect the excess over what the domestic and international markets can absorb without the use of
disposal measures.
Up to 2006, aid to domestic consumption was used to dispose of larger quantities of the excess supply
than export refunds, and its year to year use was more stable than that of export refunds (Figure 5.4).
Use of both these measures was at historically very low levels in 2007 and 2008, whereas in 2009 aid to
domestic consumption remained low (only 81 thousand tonnes of milk equivalent)35, whereas export
refunds were again quite extensively used (5 million tonnes of milk equivalent). Evidence presented in
evaluation question 2 shows that in 2007 and 2008 the world milk price equivalent (WMPE) (calculated
on the basis of world market prices for butter and SMP) was higher than the EU’s intervention milk price
equivalent (IMPE). Therefore, export refunds on butter and SMP were suspended, since to pay them
35 Disposal aid for butter and cream for use in manufacturing and for direct consumption was abolished in the Health Check (Regulation (EC) 72/2009).

130
would have involved support above the intervention price level, which is the intended floor price.
However, when the WMPE dipped below the IMPE in 2009, the option to resume export refunds re-
emerged.
Figure 5.4 Milk equivalent disposed of with domestic consumption aids and export subsidies, 2000-2009
0
1
2
3
4
5
6
7
8
2000 2001 2002 2003 2004 2005 2006 2007 2008 2009
mill
ion
ton
ne
s
Aided consumption Exports with refunds
Source: See note to Table 5.3.
5.6 Conclusions
Despite the continuation of the quota scheme throughout the period, domestic supply became more
responsive to price signals after the policy changes decided in 2003. Rather than national quotas always
being filled or over-filled as in the past, there was an increasing tendency for some Member States not to
reach the national quota ceiling as individual producers made more market oriented decisions and made
use of the greater freedom of choice due to decoupling of the dairy premium. National ceilings were
increased across the EU by 2% on 1 April 2008, in response to the surge in world market demand and
prices in 2007. The quota increase gave producers room to react to the higher prices, and meant that
EU-15 supply was more than 1 million tonnes higher in 2008 than in the previous two years. The collapse
of milk prices during 2008 and the first part of 2009 caused EU-15 supply to fall back in 2009, although
very little of the fall was transmitted to the behaviour of EU-27 supply because of an increase (+800
thousand tonnes) in EU-10 supply (because an increasing share of production was supplied
commercially). This evidence indicates that milk supply has become more responsive to price signals,
and that as quota limits become less constraining, producers’ strategies will depend on price as well as
on what is permitted by quota limits. The combination of instruments and policy changes driving this
development are: decoupling of the dairy premium, increase in quota, and lower intervention prices
together with the abolition of the target price.
The structural excess supplies of milk fat, protein, and other non-fat solids, as well as that of milk
equivalent, were positive throughout the period. Because of a temporary surge in world market demand,
these excess supplies fell sharply after 2006, almost reaching zero in 2008, but became positive again in
2009.
Regarding particular policy measures, three elements of the 2003 reform package − the shift of income
support from market price support to direct payment (dairy premium, subsequently decoupled from
milk), the reduction in intervention prices for butter and skim milk powder, and the abolition of target
price for milk − reduced the market price for milk and led to a lower structural excess supply at the

131
intended market price level in 2005-2006. This was the impact intended by the policy changes, and can
be attributed to them.
In 2007-2008, world market demand surged. The consequences were that, at first, maintaining internal
price levels resulted in a much smaller structural excess supply, and in the latter part of this episode,
when EU structural excess supply was almost zero, internal prices rose in response to rising domestic
prices and the 2% quota expansion. However, the movement in structural excess supply during 2007-
2009 was driven by external market forces, not EU policy changes, and should not be attributed to the
2003 reform package.
During 2000-2009, the structural excess supply was managed by domestic consumption aids and export
refunds. Therefore, the use of these policy measures follows very closely the evolution of the structural
excess supply. The use of these measures fell during 2005-2008, and rose again in 2009. Following the
above reasoning, the trend in the use of these measures during 2005-2006 can be attributed to the 2003
policy reforms, whereas during 2007-2008 it was the result of world market-induced developments. In
addition to these measures, public and private stockholding played a minor role in managing the market
surplus.
Summary of findings for each indicator, EQ1a
Indicator Expected result Evidence found
Milk production, supply Decoupling of the dairy premium, increase in quota, lower intervention prices and abolition of the target price would make supply more responsive to price signals. National quotas may not always be filled.
The expected effects were observed, earlier in some Member States than others, becoming generally visible by 2008-2009.
Structural excess supply (SES) for fat, protein and other non-fat solids
SES was expected to fall for all three milk components. Since the fall in the butter intervention price was greater than that for SMP, the SES for fat may fall relatively more.
The expected effects were found, starting in 2004. The SES of all components reacted with similar declines. It was not possible to observe the continuation of this process while holding other things constant, due to the disruption to markets in 2007-2009.
Structural excess supply for milk equivalent
SES for milk equivalent was expected to fall.
The expected effects were found, starting in 2004. It was not possible to observe the continuation of this process while holding other things constant, due to the disruption to markets in 2007-2009.

132
B. EQ1b: Production and supply to / demand by dairies (structural change)
To what extent have the CAP measures applicable to the dairy sector led to production restructuring?
5.7 Interpretation and comprehension of key terms of EQ1b
The ‘structure of milk production’ has various dimensions: (a) the way total milk output is allocated over
herds of different sizes, (b) the breakdown of herds according to whether they are located on farms that
specialise in milk production or on farms with a more diverse portfolio of production activities, and the
share of total milk output that comes from specialist dairy farms (c) the geographical distribution of
herds and milk output across the EU by Member State, and (d) the geographical distribution and extent
of regional concentration of herds and milk production within Member States. This evaluation question
examines whether any of these dimensions of production structure has changed as a result of the policy
changes under review. The following paragraphs briefly review the reasons why these aspects of
production structure are relevant to policy objectives, and to the performance of the dairy sector.
Herd size and economies of scale
It is well documented in the empirical economics literature that there are significant economies of scale
(declining unit production cost) in EU milk production up to herd sizes of 60-80 cows.36 To a large extent,
this is due to higher output per unit of fixed labour and, to a lesser extent, fixed capital. Thereafter, with
further scale expansion, unit costs fall much more slowly, then remain constant and – depending on the
study – may eventually start to rise very slowly.37 Therefore, structural change that leads to fewer,
larger herds and hence to a larger share of sectoral milk output being produced by these larger herds
lowers the average production cost across the sector, and improves its general economic performance.
There is a broad consensus that this process is slowed down by farm-level milk quotas when farms have
to obtain additional quota to expand (see, Rasmussen and Nielsen, 1985; Hennessy, 1995). A sectoral
quota ceiling means that individual farm growth is possible only if some farmers quit milk production
thereby freeing quota that permits other active dairy farms to grow (see Hüttel and Jongeneel, 2011).
As well as policy constraints, expansion can be limited by investment constraints. Generally, higher dairy
profit and a low-risk outlook for dairying facilitate herd expansion.
Specialist and non-specialist milk production
A ‘specialist dairy farm’ is defined in the EU Farm Typology Classification System as one for which two
thirds or more of the standard gross margins comes from the dairy activity. These farms generally
devote the greater part of their agricultural area to feed and fodder crops for the dairy enterprise, and/or
to grazing pasture. Management expertise is concentrated in milk production, which is also more likely to
be the priority activity for farm investment. Specialist dairy farmers, being less diversified, are less likely
to abandon milk production in the short run. Finally, specialist dairy farms are often in areas that do not
support other viable (non-livestock) farming activities, with the result that the continuation of farming in
the locality may well depend on the resilience of these farms as dairy farms. This combination of farming
and behavioural characteristics makes specialist dairy farms a core target group of EU dairy policy.
Geographical distribution of milk production between and within Member States
Over many decades, the geographical location of milk production has been the result of a compromise
between the advantages of proximity to local (liquid) milk markets and those of comparative advantage
36 See for example Burrell, 1990; Mukhtar and Dawson, 1990; Alvarez and Arias, 2003. 37 When more intensive production systems than are customary in Europe are used, economies of scale may still be available from expansion well beyond 1000 cows (this phenomenon is found, for example, in California).
133
in production due to agro-climatic conditions or to lower competition for land from other farming
activities. Already in the late 1990s, it was noted that over half of the EU-15 milk was produced in just
ten regions (Eck et al., 1996), including the Asturias and Galicia, Lower Normandy, Brittany, the
Netherlands, Lower Saxony, Denmark, Ireland and western England. These regions are situated in the
agro-climatic zone known as Atlantic (CEAS, 2000). Another 30% of milk production came from within
the so-called Continental zone (eastern France, central and southern Germany, the southern tip of
Sweden, northern Italy, and Austria). These two zones enjoy comparative advantage in milk production.
The evolution of modern road networks and refrigerated chains from the dairy parlour to the processing
dairy has greatly reduced the need for production to remain close to consumption centres. As a result,
the trade-off between proximity to the market and location where production costs are favourable has
not remained static.
However, the milk quota system has frozen production shares between Member States and, depending
on the national rules for quota reallocation, has tended – to a greater or lesser degree – to inhibit the
relocation of production within Member States. To the extent that this has happened, it has slowed down
structural change in general – both the shift of production from smaller to larger herds, and the
continuing concentration of production in specific geographic areas. There may, however, have been
environmental benefits from less production mobility, both when dairying has been retained in areas
where it can make a positive environmental contribution (such as in Less Favoured Areas) and when
more intense concentration of dairying (with the associated environmental problems of manure disposal,
heavy metal build up in soil and so on) has been avoided (see Baldock et al., 2008).
The dynamics of structural adjustment
Structural change usually occurs gradually. In the long run it is largely driven by external factors such as
technological change and the adaptation of structures to best exploit the advantages of new
technologies, cost and price developments in other competing sectors, and the general level of economic
development, which determine job and investment opportunities outside agriculture.
When structural change involves changes in the farm’s land holding, on-farm adjustments will depend on
land availability, which might be related to neighbouring farms going out of business. Moreover, exit
decisions are for the most part not reversible. Once milk production is abandoned, the probability of re-
entering milk production is low. Reversibility is costly because milking equipment is very specific, and
because it takes many years to rebuild a high performance herd. According to economic theory, firms
exit only when returns can no longer cover variable costs in the medium term. This means that it may be
economically rational for farms to continue for some years making negative net profit, but at the expense
of below-market returns to their owned assets (land and family labour). The literature suggests that the
closing down of a herd is also often prompted by factors like age, illness or absence of a successor etc.
5.8 Methodology used for answering the EQ1b: production restructuring
The methodology for addressing this evaluation question consists in choosing empirical indicators related
to each aspect of structural change identified above, and examining their evolution over time before and
after the 2003 reform. Changes in trends that occurred after 2003, or sudden discontinuities coinciding
with the introduction of a particular policy measure, will be interpreted as evidence of a policy-induced
impact. The basic steps in the methodology are defined below.
Most of the indicators are taken from official statistical collections (EU-FADN and Eurostat’s FSS).
However, we also exploit information gathered from the milk producers’ survey conducted in 13 case
study areas, in order to gain additional insights into the structural change process.
The information from the own survey is used merely to complement the official statistics, given the non-
representativeness and the small size of the samples involved. When answers within and across samples
tend to converge, this can be taken as providing meaningful information to support conclusions drawn
from the statistics. However, when respondents’ opinions are divided, the proportions given by the
survey replies should not be taken as representing the breakdown of views in the sector as a whole. All
that can be concluded is that there was no consensus among respondents.
134
5.9 Judgement criteria, indicators and information sources used for each
indicator
The indicators used to evaluate the impacts of policy changes on structural change are given in Table
5.4, together with their statistical sources. The indicators are grouped according to the various
dimensions of structural change identified above, beginning with a few general structural indicators.
The judgement criteria involve verifying whether trends in the indicators remain constant, or change in
the post-2003 period in line with expectations as summarised below.
• The shift from market price support to a decoupled payment, resulting in a lower market price and
the option for producers to exit dairying without losing the equivalent of the dairy premium, is
expected to increase the falling trend in the number of dairy cows and herds, whilst providing an
incentive for continuing producers to seek economies of scale through herd expansion and
specialisation.
• Quota expansion in 2008 is expected to slow down the falling trend in numbers of herds and cows.
• More liberal quota exchange rules at Member State level and quota expansion are expected to lead
to increased geographical mobility of production within Member States.
When verifying these expectations, it has to be borne in mind that structural change is a complex
phenomenon, involving many non-policy factors as well as policy stimuli, and that it occurs gradually
over the medium term. Therefore, it may not be possible to identify the above expected effects, even if
present, from the appraisal of annual indicators over a small number of years.
Table 5.4 Indicators, data requirements and information sources relating to production restructuring for EQ1b
Indicator Data requirement Information sources
Number of cows and herds
Dairy cows in the EU, total and by MS
Number of dairy cows in EU, total and by MS
Eurostat
Dairy herds in the EU, total and by MS
Number of farms with dairy cows Eurostat
Farmer’s strategic choices (exit, continuation, reduction and expansion of milk production)
Information from farmers' responses
Producer survey in selected case study regions
Herd size restructuring
Medium-term trend in EU herd size Average herd size by Member State
Eurostat
Herd-size distribution by MS Number of herds in different size classes over time
EU-FADN
Constraints on herd size expansion Farm profitability EU-FADN
Farmers’ use of high milk price Farmers’ responses Producer survey
Structure of specialisation
Share of specialist dairy farms in total milk production
Share of specialist dairy farms in total milk production
EU-FADN
Average herd size for specialist and non-specialist dairy farms
Average herd size for specialist and non-specialist dairy farms
EU-FADN
Geographical structure of production
Regional/national location of milk production
Quantity of milk production, EU and by MS
Eurostat
Geographical distribution of dairy cows by MS
Geographical distribution of dairy cows by MS
Eurostat

135
Table 5.5 Evolution of the number of dairy cows per MS over the period 1990-2010 (thousands)
*1990 2000 2001 2002 2003 2004 2005 2006 2007 2008 2009 2010 Average annual change (%)
‘90-10 '90-'00 '00-'03 '03-'06 '06-10
EU
-15
Austria 876 621 598 589 558 538 534 527 525 530 533 533 -2.5 -3.4 -3.5 -1.9 0.3
Belgium 831 629 611 591 572 571 548 532 524 518 518 518 -2.3 -2.7 -3.1 -2.4 -0.7
Denmark 769 644 628 613 589 569 558 555 551 566 574 573 -1.5 -1.8 -2.9 -2.0 0.8
Finland 436 358 352 343 328 318 313 309 296 288 286 284 -2.1 -2.0 -2.9 -2.0 -2.1
France 5,271 4,153 4,197 4,134 4,026 3,947 3,895 3,799 3,759 3,794 3,673 3,641 -1.8 -2.4 -1.0 -1.9 -1.1
Germany 6,355 4,564 4,475 4,373 4,338 4,287 4,164 4,054 4,087 4,229 4,169 4,182 -2.1 -3.3 -1.7 -2.2 0.8
Greece 242 180 172 152 149 150 152 168 150 154 145 144 -2.6 -2.9 -6.1 4.1 -3.8
Ireland 1,322 1,153 1,148 1,129 1,136 1,122 1,101 1,087 1,088 1,088 1,088 1,088 -1.0 -1.4 -0.5 -1.5 0.0
Italy 2,664 1,772 2,078 1,911 1,913 1,838 1,842 1,814 1,839 1,831 1,878 1,746 -2.1 -4.0 2.6 -1.8 -1.0
Luxembourg 59 44 44 42 41 41 41 46 40 46 46 46 -1.2 -2.9 -2.3 3.9 0.0
Netherlands 1,917 1,532 1,551 1,546 1,551 1,502 1,486 1,443 1,490 1,587 1,562 1,518 -1.2 -2.2 0.4 -2.4 1.3
Portugal 380 355 338 341 329 338 324 307 306 301 289 275 -1.6 -0.7 -2.5 -2.3 -2.7
Spain 1,575 1,141 1,182 1,154 1,118 1,057 1,018 942 903 888 828 845 -3.1 -3.2 -0.7 -5.5 -2.7
Sweden 550 426 425 403 404 401 391 385 366 366 354 349 -2.2 -2.5 -1.8 -1.6 -2.4 United Kingdom
2,891 2,339 2,203 2,230 2,207 2,054 2,007 2,005 1,977 1,903 1,864 1,847 -2.2 -2.1 -1.9 -3.1 -2.0
EU-15 26,138 19,910 20,002 19,551 19,257 18,732 18,375 17,974 17,900 18,088 17,807 17,588 -2.0 -2.7 -1.1 -2.3 -0.5
EU
-10
Cyprus 22 24 24 26 27 26 25 24 24 24 23 23 0.2 0.9 4.0 -3.9 -1.1
Czech Republic 529 496 464 449 429 437 417 407 400 384 375 -5.3 -2.4 -2.6
Estonia 281 131 129 116 117 117 113 109 103 100 97 96 -5.2 -7.3 -3.7 -2.3 -3.1
Hungary 491 355 345 338 310 304 285 268 266 263 248 239 -3.5 -3.2 -4.4 -4.7 -2.8
Latvia 535 205 209 205 186 186 185 182 180 170 166 164 -5.7 -9.1 -3.2 -0.7 -2.6
Lithuania 842 438 442 443 448 434 417 399 405 395 375 360 -4.2 -6.3 0.8 -3.8 -2.5
Malta 8 8 8 8 8 8 8 8 8 7 7 6 -1.4 0.0 0.0 0.0 -6.9
Poland 2,982 2,930 2,935 2,816 2,730 2,755 2,637 2,677 2,697 2,585 2,529 -1.9 -2.2 -1.0
Slovakia 243 230 230 215 202 199 185 180 174 163 159 -4.0 -4.9 -3.7
Slovenia 140 136 140 131 134 120 113 117 113 113 110 -2.2 -4.8 -0.7
EU-10 5,055 4,949 4,905 4,707 4,570 4,544 4,342 4,367 4,343 4,161 4,061 -2.3 -2.7 -1.7
EU
-02
Bulgaria 597 363 359 358 362 369 348 350 336 315 297 292 -3.5 -4.9 -0.1 -1.1 -4.4 Romania 1,620 1,620 1,620 1,627 1,597 1,566 1,625 1,639 1,573 1,483 1,419 1,191 -1.5 0.0 -0.5 0.9 -7.7
EU-27 26,947 26,929 26,441 25,922 25,237 24,891 24,305 24,176 24,229 23,682 23,132 -1.3 -2.1 -1.2
Notes: *Austria 1991, Finland 1991 (growth rates are corrected). Figure for Sweden is an estimate, based on the average change (1990-2000) for EU-15 without Sweden
Source: Eurostat.
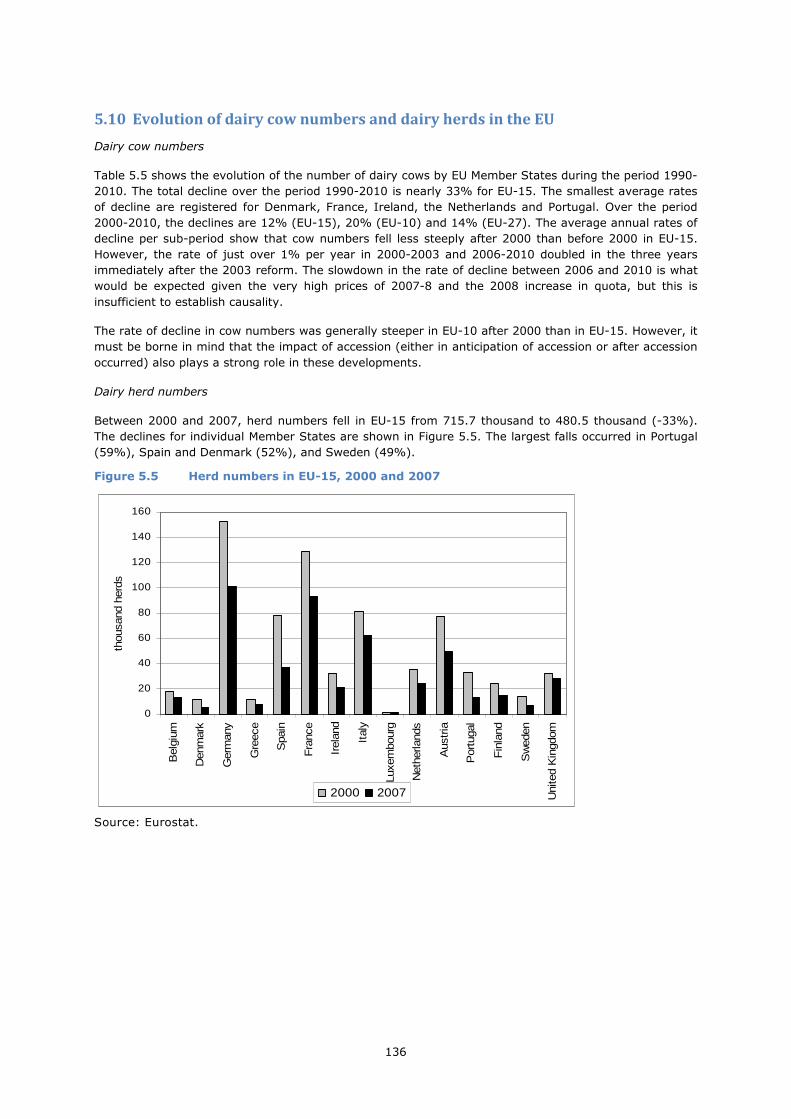
136
5.10 Evolution of dairy cow numbers and dairy herds in the EU
Dairy cow numbers
Table 5.5 shows the evolution of the number of dairy cows by EU Member States during the period 1990-
2010. The total decline over the period 1990-2010 is nearly 33% for EU-15. The smallest average rates
of decline are registered for Denmark, France, Ireland, the Netherlands and Portugal. Over the period
2000-2010, the declines are 12% (EU-15), 20% (EU-10) and 14% (EU-27). The average annual rates of
decline per sub-period show that cow numbers fell less steeply after 2000 than before 2000 in EU-15.
However, the rate of just over 1% per year in 2000-2003 and 2006-2010 doubled in the three years
immediately after the 2003 reform. The slowdown in the rate of decline between 2006 and 2010 is what
would be expected given the very high prices of 2007-8 and the 2008 increase in quota, but this is
insufficient to establish causality.
The rate of decline in cow numbers was generally steeper in EU-10 after 2000 than in EU-15. However, it
must be borne in mind that the impact of accession (either in anticipation of accession or after accession
occurred) also plays a strong role in these developments.
Dairy herd numbers
Between 2000 and 2007, herd numbers fell in EU-15 from 715.7 thousand to 480.5 thousand (-33%).
The declines for individual Member States are shown in Figure 5.5. The largest falls occurred in Portugal
(59%), Spain and Denmark (52%), and Sweden (49%).
Figure 5.5 Herd numbers in EU-15, 2000 and 2007
0
20
40
60
80
100
120
140
160
Bel
gium
Den
mar
k
Ger
man
y
Gre
ece
Spa
in
Fra
nce
Irel
and
Ital
y
Luxe
mbo
urg
Net
herla
nds
Aus
tria
Por
tuga
l
Fin
land
Sw
eden
Uni
ted
Kin
gdom
thou
sand
her
ds
2000 2007
Source: Eurostat.

137
Figure 5.6 Number of dairy herds in seven countries of EU-10, 2003 and 2007
0
5
10
15
20
25
Cyprus CzechRepublic
Estonia Hungary Malta Slovakia Slovenia
tho
usa
nd
he
rds
2003 2007
Source: Eurostat.
Figures 5.6 and 5.7 show the changes in herd size for the Member States of EU-10 and EU-02. Because
of the large differences in scale, these figures are presented in two different graphs. Despite the larger
scale in Figure 5.6, it is still too small to show the changes in Cyprus and Malta (from 250 for 240 herds
in Cyprus, and from 170 to 190 herds in Malta). The number of dairy herds increased in both Malta and
Slovenia between 2003 and 2007. In all other New Member States , the number of herds fell steeply over
this period. This should be interpreted as a general effect of adoption of the CAP and of becoming subject
to EU policies in all sectors (or, for Bulgaria and Romania, anticipation of membership), as well as the
effects of technological change and the incentive to achieve economies of size, and not as specifically due
to dairy policy. The largest falls in herd numbers in the New Member States between 2003 and 2007
occurred in Estonia and Hungary (declines of 51% and 45%, respectively).
Figure 5.7 Number of dairy herds in five countries of EU-10 and EU-02, 2003 and 2007
0
200
400
600
800
1,000
1,200
Latvia Lithuania Poland Bulgaria Romania
thou
sand
her
ds
2003 2007
Source: Eurostat.
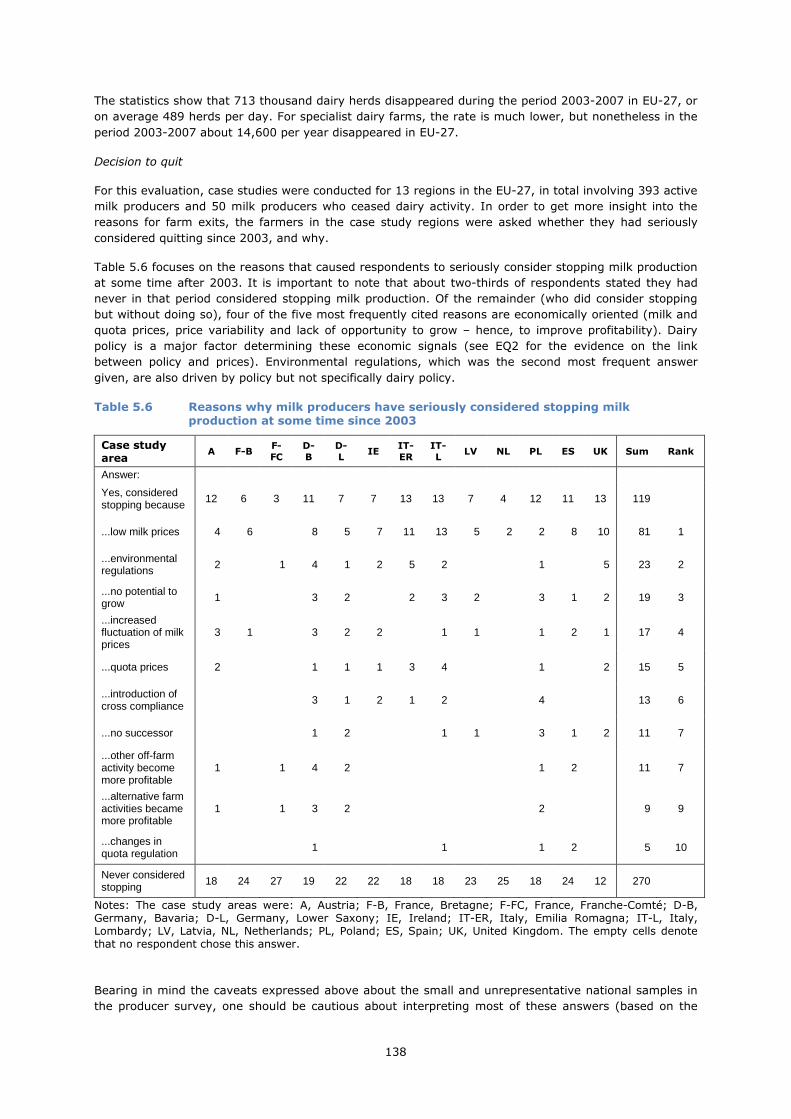
138
The statistics show that 713 thousand dairy herds disappeared during the period 2003-2007 in EU-27, or
on average 489 herds per day. For specialist dairy farms, the rate is much lower, but nonetheless in the
period 2003-2007 about 14,600 per year disappeared in EU-27.
Decision to quit
For this evaluation, case studies were conducted for 13 regions in the EU-27, in total involving 393 active
milk producers and 50 milk producers who ceased dairy activity. In order to get more insight into the
reasons for farm exits, the farmers in the case study regions were asked whether they had seriously
considered quitting since 2003, and why.
Table 5.6 focuses on the reasons that caused respondents to seriously consider stopping milk production
at some time after 2003. It is important to note that about two-thirds of respondents stated they had
never in that period considered stopping milk production. Of the remainder (who did consider stopping
but without doing so), four of the five most frequently cited reasons are economically oriented (milk and
quota prices, price variability and lack of opportunity to grow – hence, to improve profitability). Dairy
policy is a major factor determining these economic signals (see EQ2 for the evidence on the link
between policy and prices). Environmental regulations, which was the second most frequent answer
given, are also driven by policy but not specifically dairy policy.
Table 5.6 Reasons why milk producers have seriously considered stopping milk production at some time since 2003
Case study area
A F-B F-
FC
D-
B
D-
L IE
IT-
ER
IT-
L LV NL PL ES UK Sum Rank
Answer:
Yes, considered stopping because
12 6 3 11 7 7 13 13 7 4 12 11 13 119
...low milk prices 4 6 8 5 7 11 13 5 2 2 8 10 81 1
...environmental regulations 2 1 4 1 2 5 2 1 5 23 2
...no potential to grow 1 3 2 2 3 2 3 1 2 19 3
...increased fluctuation of milk prices
3 1 3 2 2 1 1 1 2 1 17 4
...quota prices 2 1 1 1 3 4 1 2 15 5
...introduction of cross compliance 3 1 2 1 2 4 13 6
...no successor 1 2 1 1 3 1 2 11 7
...other off-farm activity become more profitable
1 1 4 2 1 2 11 7
...alternative farm activities became more profitable
1 1 3 2 2 9 9
...changes in quota regulation
1 1 1 2 5 10
Never considered stopping 18 24 27 19 22 22 18 18 23 25 18 24 12 270
Notes: The case study areas were: A, Austria; F-B, France, Bretagne; F-FC, France, Franche-Comté; D-B, Germany, Bavaria; D-L, Germany, Lower Saxony; IE, Ireland; IT-ER, Italy, Emilia Romagna; IT-L, Italy, Lombardy; LV, Latvia, NL, Netherlands; PL, Poland; ES, Spain; UK, United Kingdom. The empty cells denote that no respondent chose this answer.
Bearing in mind the caveats expressed above about the small and unrepresentative national samples in
the producer survey, one should be cautious about interpreting most of these answers (based on the

139
pooled sample) as reliable evidence of policy impacts. At most, it can be said that there is consistent
evidence across nearly all the case study areas that low milk prices were seen as a significant ‘push-
factor’.38 The only exception to this was among the producers surveyed in Franche-Comté. However, it
must be borne in mind that in this particular sample, over half the dairy farms were cooperatively owned,
nearly all of them produced milk for a quality-label cheese, and for more than two-thirds of them, LFA
payments were seen as important or very important. Producers in the two French case study samples,
the Dutch one and the one in Spain stand out as being the most likely not to have considered
abandoning milk production since 2003. By contrast, this option was considered by over half the
respondents in the UK sample.
Impact of policy changes on milk production strategy
Table 5.7 shows that the impact of policy changes on farmers’ incentives to increase or reduce the scale
of their milk production, or to quit, was mixed. On the one hand, for four of the policy changes
mentioned, about half or more of the respondents considered that the policy changes were not relevant
and therefore had no impact on their strategic production decisions. On the other hand, other changes
affected behaviour more. The 2003 decision to maintain the quota scheme until 2015, and the later
decision to increase quota by annual amounts, provided incentives to expand for a significant share of
producers. The various policy payments had an expansionist effect for a smaller share of producers. The
switch from price support to a dairy premium to a decoupled payment (merged with the Single Farm
Payment) was seen by the majority of respondents either as irrelevant or simply as an incentive to
continue production unchanged. The decision to quit dairying was not made more attractive by any of the
policy changes for nearly all producers. However, it must be stressed that these respondents are
producers who did not quit.
Table 5.7 Effect of various policy changes on the incentive to decrease, continue, or expand dairy production (number of answers)
Policy/Policy change Number of
answers out of 393
not relevant stop decrease
continue at current level
increase
Decision taken in 2003 to maintain milk quotas until 2015 387 154 4 2 123 104
Introduction of dairy premium 390 190 2 3 130 65
Introduction of Single Farm Payments 389 165 3 2 150 69
Decoupling of dairy premium 389 226 6 4 113 40
Confirmation in 2008 to abolish milk quotas in 2015 357 167 10 4 92 84
Rural Development Aids 383 198 1 2 88 94
State Aids 386 208 3 0 99 76
Annual quota expansion 341 118 4 0 56 163
5.11 Herd size restructuring
Herd size
Figure 5.8 shows the average number of dairy cows per herd (all dairy herds) for EU-15 Member States
from 1991 to 2007.
38 This was also confirmed in the interviews with producers who had stopped. However, these samples of former milk producers are so small that they have anecdotal value only.
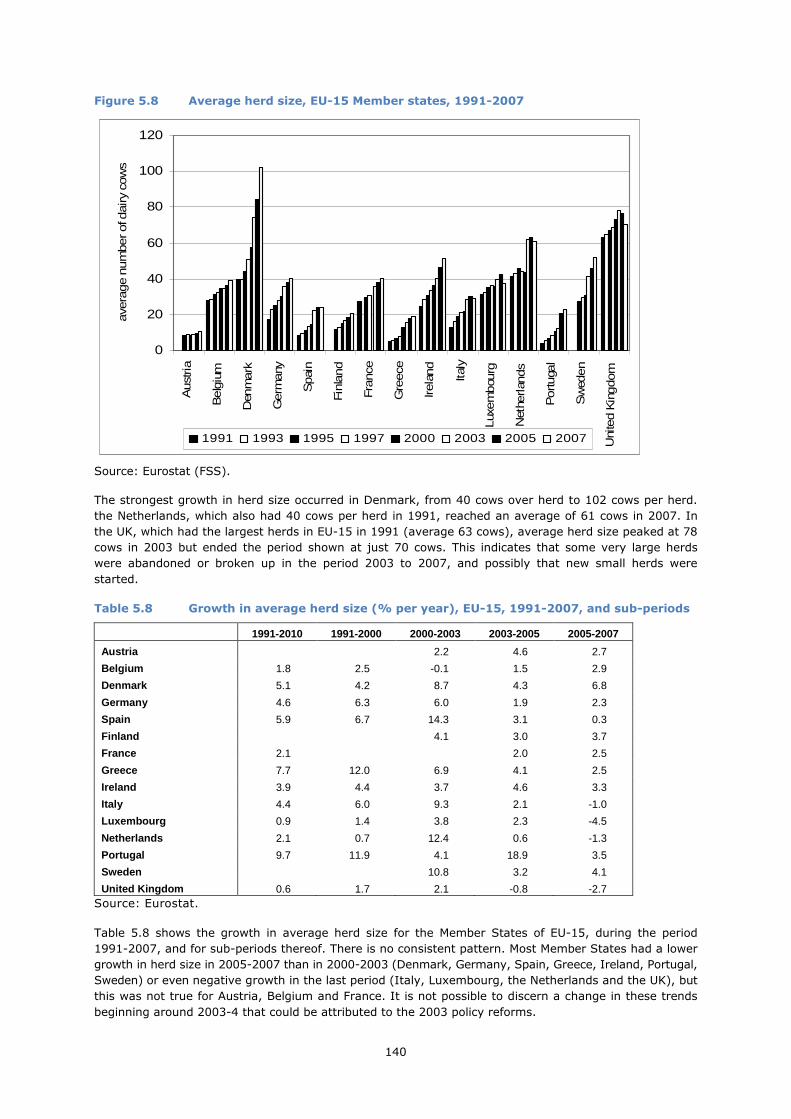
140
Figure 5.8 Average herd size, EU-15 Member states, 1991-2007
0
20
40
60
80
100
120
Aus t
ria
Belg
ium
Den
mar k
Germ
any
Spai
n
Fin
land
Fr a
nc e
Gre
ec e
I rela
nd
I ta l
y
Lux
em
bou
r g
Net
herlan
ds
Portuga
l
Sw
eden
Uni
ted K
ingdom
ave
rage n
um
ber of d
airy
cow
s
1991 1993 1995 1997 2000 2003 2005 2007
Source: Eurostat (FSS).
The strongest growth in herd size occurred in Denmark, from 40 cows over herd to 102 cows per herd.
the Netherlands, which also had 40 cows per herd in 1991, reached an average of 61 cows in 2007. In
the UK, which had the largest herds in EU-15 in 1991 (average 63 cows), average herd size peaked at 78
cows in 2003 but ended the period shown at just 70 cows. This indicates that some very large herds
were abandoned or broken up in the period 2003 to 2007, and possibly that new small herds were
started.
Table 5.8 Growth in average herd size (% per year), EU-15, 1991-2007, and sub-periods
1991-2010 1991-2000 2000-2003 2003-2005 2005-2007
Austria 2.2 4.6 2.7
Belgium 1.8 2.5 -0.1 1.5 2.9
Denmark 5.1 4.2 8.7 4.3 6.8
Germany 4.6 6.3 6.0 1.9 2.3
Spain 5.9 6.7 14.3 3.1 0.3
Finland 4.1 3.0 3.7
France 2.1 2.0 2.5
Greece 7.7 12.0 6.9 4.1 2.5
Ireland 3.9 4.4 3.7 4.6 3.3
Italy 4.4 6.0 9.3 2.1 -1.0
Luxembourg 0.9 1.4 3.8 2.3 -4.5
Netherlands 2.1 0.7 12.4 0.6 -1.3
Portugal 9.7 11.9 4.1 18.9 3.5
Sweden 10.8 3.2 4.1
United Kingdom 0.6 1.7 2.1 -0.8 -2.7 Source: Eurostat.
Table 5.8 shows the growth in average herd size for the Member States of EU-15, during the period
1991-2007, and for sub-periods thereof. There is no consistent pattern. Most Member States had a lower
growth in herd size in 2005-2007 than in 2000-2003 (Denmark, Germany, Spain, Greece, Ireland, Portugal,
Sweden) or even negative growth in the last period (Italy, Luxembourg, the Netherlands and the UK), but
this was not true for Austria, Belgium and France. It is not possible to discern a change in these trends
beginning around 2003-4 that could be attributed to the 2003 policy reforms.
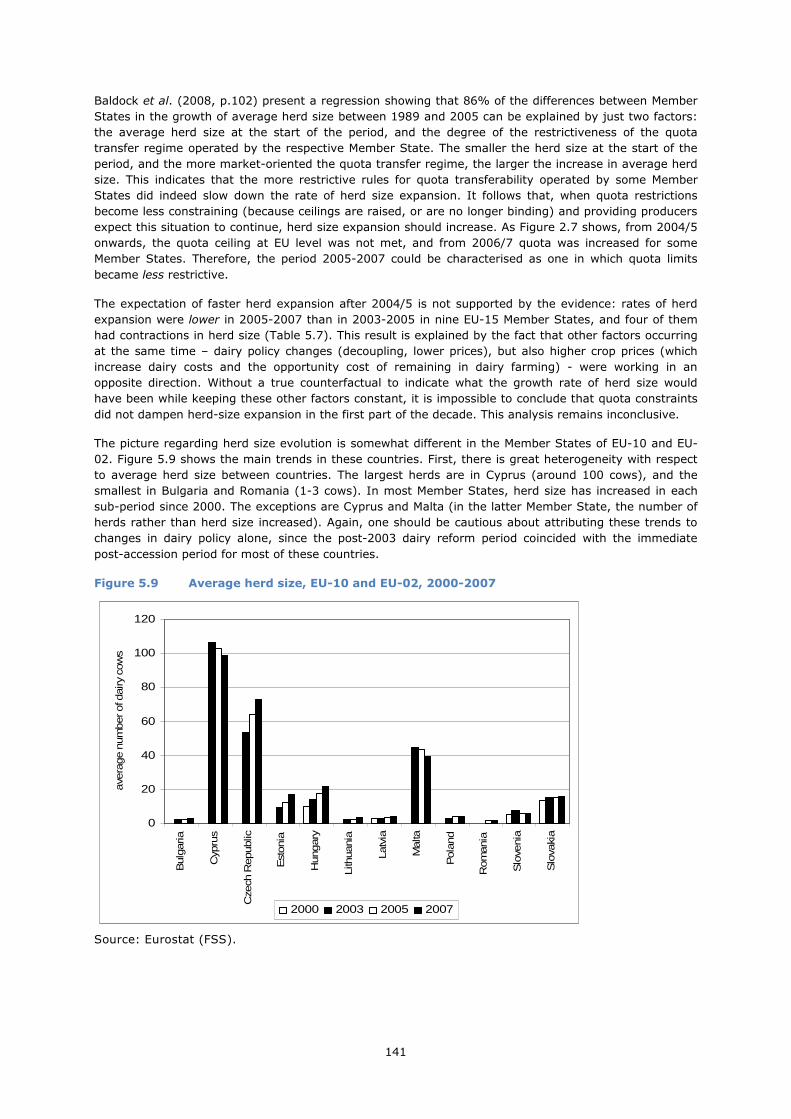
141
Baldock et al. (2008, p.102) present a regression showing that 86% of the differences between Member
States in the growth of average herd size between 1989 and 2005 can be explained by just two factors:
the average herd size at the start of the period, and the degree of the restrictiveness of the quota
transfer regime operated by the respective Member State. The smaller the herd size at the start of the
period, and the more market-oriented the quota transfer regime, the larger the increase in average herd
size. This indicates that the more restrictive rules for quota transferability operated by some Member
States did indeed slow down the rate of herd size expansion. It follows that, when quota restrictions
become less constraining (because ceilings are raised, or are no longer binding) and providing producers
expect this situation to continue, herd size expansion should increase. As Figure 2.7 shows, from 2004/5
onwards, the quota ceiling at EU level was not met, and from 2006/7 quota was increased for some
Member States. Therefore, the period 2005-2007 could be characterised as one in which quota limits
became less restrictive.
The expectation of faster herd expansion after 2004/5 is not supported by the evidence: rates of herd
expansion were lower in 2005-2007 than in 2003-2005 in nine EU-15 Member States, and four of them
had contractions in herd size (Table 5.7). This result is explained by the fact that other factors occurring
at the same time – dairy policy changes (decoupling, lower prices), but also higher crop prices (which
increase dairy costs and the opportunity cost of remaining in dairy farming) - were working in an
opposite direction. Without a true counterfactual to indicate what the growth rate of herd size would
have been while keeping these other factors constant, it is impossible to conclude that quota constraints
did not dampen herd-size expansion in the first part of the decade. This analysis remains inconclusive.
The picture regarding herd size evolution is somewhat different in the Member States of EU-10 and EU-
02. Figure 5.9 shows the main trends in these countries. First, there is great heterogeneity with respect
to average herd size between countries. The largest herds are in Cyprus (around 100 cows), and the
smallest in Bulgaria and Romania (1-3 cows). In most Member States, herd size has increased in each
sub-period since 2000. The exceptions are Cyprus and Malta (in the latter Member State, the number of
herds rather than herd size increased). Again, one should be cautious about attributing these trends to
changes in dairy policy alone, since the post-2003 dairy reform period coincided with the immediate
post-accession period for most of these countries.
Figure 5.9 Average herd size, EU-10 and EU-02, 2000-2007
0
20
40
60
80
100
120
Bulg
aria
Cyp
rus
Cze
ch R
epublic
Est
onia
Hungary
Lith
uania
Latv
ia
Malta
Pola
nd
Rom
ania
Slo
venia
Slo
vaki
a
ave
rage n
um
ber of d
airy
cow
s
2000 2003 2005 2007
Source: Eurostat (FSS).

142
Herd size distribution
Figure 5.10 Number of cows per size class in EU-15, 2000 and 2007
0
1
2
3
4
5
6
7
1-2 3-9 10-19 20-29 30-49 50-99 100−
mill
ion
da
iry
cow
s
2000 2007
Source: Eurostat (FSS).
Figure 5.11 Number of cows per size class in EU-10, 2003 and 2007
0
0.5
1
1.5
2
2.5
3
1-2 3-9 10-19 20-29 30-49 50-99 100−
mill
ion
da
iry
cow
s
2003 2007
Source: Eurostat (FSS).
Figures 5.10 and 5.11 show the shape and change in the herd size distribution over the period 2000-
2007 for the EU-15 and EU-10, respectively (for details at the Member State level see also section 2.3).
The majority of EU-15 dairy cows were kept in herds of 50 dairy cows and larger. In a striking contrast,
in the EU-10 most of the dairy cows were in herds of 10 dairy cows or less, even though the number of
dairy cows kept in relatively small herds declined substantially over time. In the EU-10 the herd size
distribution has a bimodal character. This is because many very small dairy herds are kept for the
purposes of the farm household’s own dairy consumption, either on subsistence farms or on farms that

143
are commercial farms with respect to other commodities, but which keep a few dairy cows for their own
consumption.
Between 2000 and 2007, only the largest herd size group (≥100 cows) in EU-15 acquired more cows. By
contrast, between 2003 and 2007, in EU-10 the total number of cows in all herd size groups with more
than 10 cows increased whereas the smallest herd sizes experienced a net reduction in cow numbers.
Tables 2.31 and 2.32 provide data on this process at Member State level. Regarding the distribution of
herds, in 2007 at least 25% of all herds in Denmark, Cyprus and the UK had 100 cows and more
although only 2% of all EU dairy herds had more than 100 cows or more. By contrast, more than 95% of
all dairy herds in Lithuania and Romania had fewer than 10 dairy cows. The points in the size distribution
where herd numbers are growing depend on the current (average) size of herds. For example, in the
Netherlands, where herds are already on average quite large, growth in herd numbers occurred only for
the largest size group (> 100 cows). By contrast, in Austria, the size group 30-49 cows was the smallest
to register a net increase in herd numbers. Regarding the distribution of dairy cows across size classes,
in 2007 51% of the EU dairy cow population was kept in herds of at least 50 head. In 2000 this share
was only 41%. Cyprus, Czech Republic, Denmark, Slovakia and the United Kingdom all had at least 90%
of their dairy cows in herds of 50 cows or more in 2007. By contrast, in Austria, Bulgaria, Lithuania,
Poland, Romania and Slovenia more than 60% of the dairy cow population was kept in herds of 19 or
fewer dairy cows.
Table 5.9 Share (%) of all farms with dairy cows having a positive net profit
2000 2001 2002 2003 2004 2005 2006 2007
Belgium 54 60 49 55 54 65 69 77
Denmark 16 8 12 12 10 19 28 46
Germany 22 22 18 17 33 43 44 65
Greece 45 46 54 57 73 85 83 92
Spain 53 67 65 65 55 61 61 59
France 33 34 46 40 43 48 45 54
Ireland 36 37 36 43 40 42 31 47
Italy 31 32 33 30 33 39 36 43
Luxembourg 49 55 42 54 57 67 57 71
Netherlands 32 37 33 29 30 43 40 57
Austria 26 34 30 20 26 34 34 41
Portugal 28 40 48 46 54 54 71 63
Finland 16 23 23 22 16 18 13 20
Sweden 5 5 8 8 0 7 8 18
United Kingdom 20 38 21 29 32 38 36 57
EU-15 30 34 34 32 37 44 43 53
Czech Republic 39 34 37 55
Estonia 48 40 33 43
Hungary 47 23 36 30
Lithuania 70 53 46 45
Latvia 44 52 43 45
Malta 0 42 50 48
Poland 26 26 29 33
Slovakia 52 37 18 39
Slovenia 27 14 14 22
EU-10 30 28 30 35
Bulgaria 67
Romania 20
EU-02 24
Source: EU-FADN.

144
The evidence on profitability presented in Table 5.9 sheds some light on the incidence of financial
constraints on herd size expansion. Following 2004, there was a marked increase in the share of EU-15
FADN farms with dairy herds that earned a positive net economic profit. This can be interpreted as an
indicator of the proportion of dairy herds that did not face severe financial constraints. However, this
increase could well be the effect of the larger than usual exit of farms in EU-15 during these years,
assuming that those leaving would have been mainly the less profitable herds. Moreover, it has to be
borne in mind that EU-FADN is not a fully representative sample, as it does not cover farms below the
minimum economic size threshold (which varies between Member States, tending to be higher in Member
States with larger average herd sizes) and is designed to reflect population shares according to the
dimensions ‘region’, ‘type of farming’ and ‘economic size class’ only.
The producer survey asked respondents how they used the extra revenue earned during the period of
high milk prices in 2007-2008. In particular, producers were asked whether the revenue was used
(among other options) for herd expansion (animals), to buy more quota and/or to finance investments
allowing expansion. The same questions were asked regarding any future hypothetical windfall returns
due to high prices. No clear picture emerges across the own survey. It is certainly not warranted to
conclude from respondents’ answers that producers were already expansion-minded and seized, or would
in the future seize, such a windfall opportunity to finance herd expansion.
5.12 Structure of specialisation
Figure 5.12 ranks Member States according to the share of total milk output coming from specialist dairy
farms.
Figure 5.12 Share (%) of total delivered milk coming from specialist dairy farms (2007) by Member State and change in this share (measured in percentage points), 2001-2007
0
20
40
60
80
100
Por
tuga
lM
alta
Fin
land
Irel
and
Net
herla
nds
Den
mar
kU
nite
d K
ingd
omS
pain
Ital
yS
wed
enE
ston
iaG
erm
any
Slo
veni
aLu
xem
bour
gB
ulga
riaF
ranc
eB
elgi
umR
oman
iaG
reec
eLa
tvia
Pol
and
Aus
tria
Lith
uani
aH
unga
ryC
zech
Rep
ublic
Slo
vaki
a
% s
ha
re o
f milk
-10
-5
0
5
10
15
pe
rce
nta
ge
po
ints
% of total milk output from specialised dairy farms, 2007 % change 2001-2007
Source: EU-FADN.
For 9 out of 27 Member States, more than 90% of the raw milk produced comes from specialist dairy
farms. In sixteen Member States, the share of specialist dairy farms increased between 2001 and 2007,
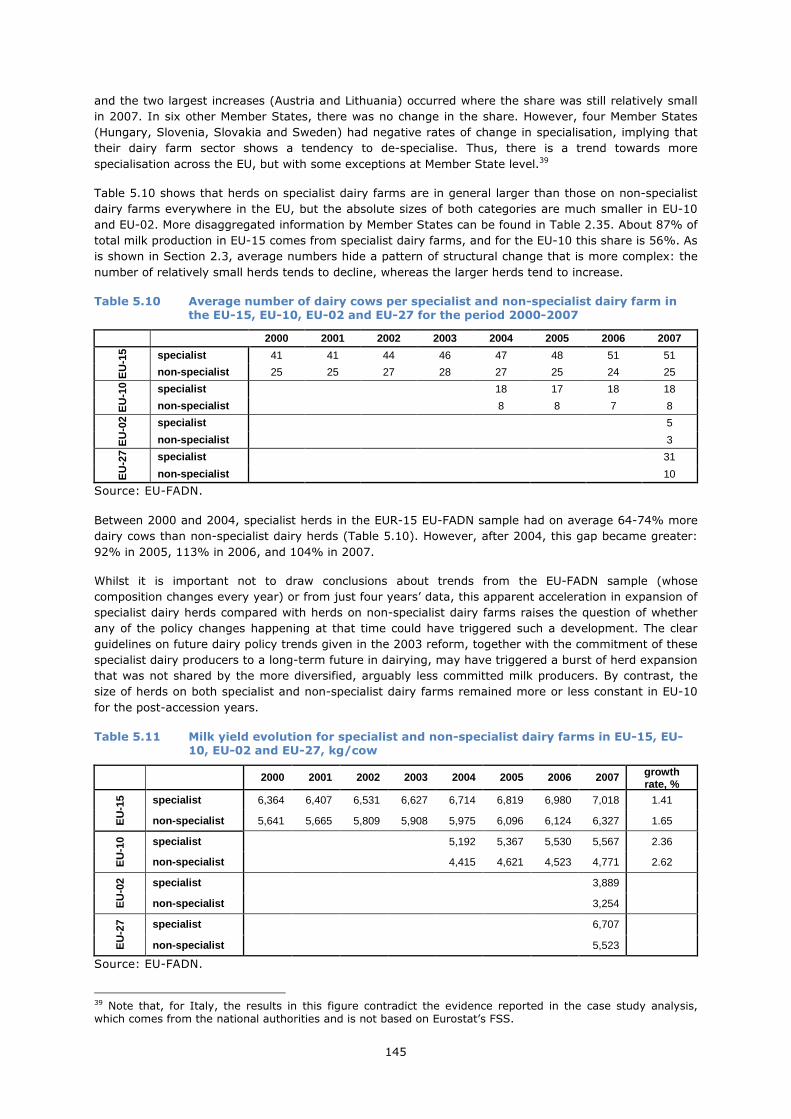
145
and the two largest increases (Austria and Lithuania) occurred where the share was still relatively small
in 2007. In six other Member States, there was no change in the share. However, four Member States
(Hungary, Slovenia, Slovakia and Sweden) had negative rates of change in specialisation, implying that
their dairy farm sector shows a tendency to de-specialise. Thus, there is a trend towards more
specialisation across the EU, but with some exceptions at Member State level.39
Table 5.10 shows that herds on specialist dairy farms are in general larger than those on non-specialist
dairy farms everywhere in the EU, but the absolute sizes of both categories are much smaller in EU-10
and EU-02. More disaggregated information by Member States can be found in Table 2.35. About 87% of
total milk production in EU-15 comes from specialist dairy farms, and for the EU-10 this share is 56%. As
is shown in Section 2.3, average numbers hide a pattern of structural change that is more complex: the
number of relatively small herds tends to decline, whereas the larger herds tend to increase.
Table 5.10 Average number of dairy cows per specialist and non-specialist dairy farm in the EU-15, EU-10, EU-02 and EU-27 for the period 2000-2007
2000 2001 2002 2003 2004 2005 2006 2007
EU
-15 specialist 41 41 44 46 47 48 51 51
non-specialist 25 25 27 28 27 25 24 25
EU
-10 specialist 18 17 18 18
non-specialist 8 8 7 8
EU
-02 specialist 5
non-specialist 3
EU
-27 specialist 31
non-specialist 10
Source: EU-FADN.
Between 2000 and 2004, specialist herds in the EUR-15 EU-FADN sample had on average 64-74% more
dairy cows than non-specialist dairy herds (Table 5.10). However, after 2004, this gap became greater:
92% in 2005, 113% in 2006, and 104% in 2007.
Whilst it is important not to draw conclusions about trends from the EU-FADN sample (whose
composition changes every year) or from just four years’ data, this apparent acceleration in expansion of
specialist dairy herds compared with herds on non-specialist dairy farms raises the question of whether
any of the policy changes happening at that time could have triggered such a development. The clear
guidelines on future dairy policy trends given in the 2003 reform, together with the commitment of these
specialist dairy producers to a long-term future in dairying, may have triggered a burst of herd expansion
that was not shared by the more diversified, arguably less committed milk producers. By contrast, the
size of herds on both specialist and non-specialist dairy farms remained more or less constant in EU-10
for the post-accession years.
Table 5.11 Milk yield evolution for specialist and non-specialist dairy farms in EU-15, EU-10, EU-02 and EU-27, kg/cow
2000 2001 2002 2003 2004 2005 2006 2007 growth rate, %
EU
-15 specialist 6,364 6,407 6,531 6,627 6,714 6,819 6,980 7,018 1.41
non-specialist 5,641 5,665 5,809 5,908 5,975 6,096 6,124 6,327 1.65
EU
-10 specialist 5,192 5,367 5,530 5,567 2.36
non-specialist 4,415 4,621 4,523 4,771 2.62
EU
-02 specialist 3,889
non-specialist 3,254
EU
-27 specialist 6,707
non-specialist 5,523
Source: EU-FADN.
39 Note that, for Italy, the results in this figure contradict the evidence reported in the case study analysis, which comes from the national authorities and is not based on Eurostat’s FSS.

146
Table 5.11 shows that the milk yields of herds on specialist dairy farms in the EU-FADN database are
consistently above those of herds on non-specialist dairy farms (around 12% higher on average in EU-
15, 18% higher in EU-10 and nearly 20% higher in EU-02). This finding highlights a major reason why
the share of herds on specialist dairy farms matter for the performance of the sector. Although measured
yield growth is slightly higher for non-specialist dairy herds, the difference is so small that this gap will
remain more or less constant in coming years.
5.13 Geographical structure of production
Since 1984, the milk quota scheme has fixed national quota ceilings on milk deliveries and direct sales
off farms. These ceilings have remained very stable over the years, with some occasional adjustments at
the same rate for all Member States accommodate enlargements, or for particular Member States for
exceptional reasons. Table 2.38 sets out the national quota ceilings for each year since 2000/1 up to
2014/15, when the quota scheme will end.
The structure of milk supply and of dairy herds at Member State level, which depends strongly on these
quota limits, has also been very stable. Table 5.12 shows the evolution of milk production shares at
Member State level. There is more movement in these shares in the post-reform period. However, it is
impossible to discern any regional bias. For example, Italy’s share increases but that of the other three
Mediterranean countries remains stable. The share of France trends down a little, but that of Germany
increases.
In 2009, 81% of EU-27 milk was produced in EU-15, about 15% in EU-10, and about 4% in EU-02.
Figure 5.13 shows the geographical distribution of dairy cows between EU-15, EU-10 and EU-02. The
impact of two enlargements is clear: initially there is a jump in cow numbers, but with increasing yields –
especially among the lower-yielding herds in new member countries - and with quota limits unchanged,
EU total cow numbers begin to fall again.
Figure 5.13 Number of dairy cows in EU regions, 2000-2010
0
5
10
15
20
25
2000 2001 2002 2003 2004 2005 2006 2007 2008 2009 2010
mill
ion
da
iry c
ow
s
EU-15 EU-10 EU-02
Source: Eurostat.

147
Table 5.12 Share (%) of each Member State’s milk output in total EU-27 milk production
2000 2001 2002 2003 2004 2005 2006 2007 2008 2009
Austria 2.2 2.2 2.3 2.2 2.1 2.2 2.1 2.2 2.2 2.2 Belgium 2.3 2.2 2.2 2.2 2.1 2.1 2.0 2.0 1.9 2.0 Denmark 3.2 3.0 3.2 3.2 3.1 0.0 3.1 3.2 3.1 3.3 Finland 1.7 1.7 1.8 1.7 1.7 1.7 1.6 1.6 1.6 1.6 France 16.7 16.5 17.5 17.0 16.5 17.1 16.5 16.2 16.3 15.8 Germany 18.9 18.8 19.3 19.7 19.0 19.7 18.9 19.7 19.3 19.8 Greece 0.5 0.5 0.5 0.5 0.5 0.5 0.5 0.5 0.5 0.5 Ireland 3.5 3.6 3.6 3.7 3.6 3.5 3.6 3.7 3.5 3.4 Italy 7.2 7.2 7.4 7.4 7.2 7.6 7.4 7.7 7.6 7.7 Luxembourg 0.2 0.2 0.2 0.2 0.2 0.2 0.2 0.2 0.2 0.2 Netherlands 7.3 7.5 7.4 7.6 7.3 7.5 7.4 7.7 7.8 8.0 Portugal 1.4 1.3 1.5 1.3 1.4 1.4 1.3 1.4 1.4 1.4 Spain 4.2 4.3 4.6 4.6 4.4 4.5 4.3 4.4 4.3 4.2 Sweden 2.2 2.2 2.3 2.2 2.2 2.2 2.1 2.1 2.0 2.0 United Kingdom 9.7 9.8 10.3 10.4 9.9 10.1 9.7 9.8 9.2 9.2
Cyprus 0.1 0.1 0.1 0.1 0.1 0.1 0.1 0.1 0.1 0.1 Czech Rep. 1.9 1.9 1.9 1.9 1.8 1.9 1.9 0.0 1.9 1.9 Estonia 0.4 0.5 0.4 0.4 0.4 0.5 0.5 0.5 0.5 0.5 Hungary 1.4 1.4 1.5 1.4 1.3 1.3 1.2 1.3 1.2 1.2 Latvia 0.5 0.6 0.6 0.5 0.5 0.6 0.5 0.6 0.6 0.6 Lithuania 1.1 1.1 1.2 1.2 1.2 1.3 1.3 1.3 1.3 1.2 Malta 0.0 0.0 0.0 0.0 0.0 0.0 0.0 0.0 0.0 0.0 Poland 7.9 7.9 8.2 8.2 8.0 8.3 8.1 8.4 8.4 8.4 Slovakia 0.7 0.8 0.8 0.8 0.7 0.8 0.7 0.7 0.7 0.6 Slovenia 0.4 0.4 0.5 0.5 0.4 0.5 0.4 0.5 0.4 0.4
Bulgaria 0.9 0.8 0.9 0.9 0.9 0.9 0.9 0.8 0.8 0.7 Romania 3.3 3.4 0.0 0.0 3.4 3.4 3.6 3.5 3.3 3.2
Total 100.0 100.0 100.0 100.0 100.0 100.0 100.0 100.0 100.0 100.0
Source: Eurostat.
Geographical mobility of quota within Member States has continued throughout recent decades, despite
some regional barriers to quota transferability between regions of certain Member States. Evidence
reported in Baldock et al. (2008) up to 2005/6 shows that regional reallocation was generally accompanied
by increases in average herd size in all regions, both those regions receiving a net gain in quota and
those with a net decline, but that there was usually a decline in herd numbers in those regions that lost
quota (and sometimes even in gaining regions). This emphasises that regional mobility is closely
associated with herd-size restructuring. Data could not be found for this report on the most recent trends
in regional shifts in the location of production. However, given that quota is now more mobile than it was
at the start of the century (because of a relaxation of regional restrictions, as for example in Germany,
or because it is now cheaper or ‘free’ on the market because national ceilings are no longer binding), we
can conclude that the regional shares of herds and production have become more dynamic because of
the policy changes.
Table 2.36 provides information about the geographical distribution of dairy cows over LFA and non-LFA
areas. In the period 2003-2007 the share of dairy cows in the total number of dairy cows that is kept in
LFA areas has increased for Bulgaria, Czech Republic, Estonia, Hungary, Lithuania, Poland, Romania,
Slovakia and Slovenia. Member States having a relatively large share of their dairy cow population in
mountainous LFS areas are Finland (76%), Austria (66%), Slovenia (50%) and Slovakia (46%). All of
Luxembourg is classified as a LFA.

148
Table 5.13 Average annual change (%) in number of dairy herds in different regions by
Member State
1995-20041 2005-2007
LFA mountainous LFA non-
mountainous non-LFA LFA mountainous LFA non-
mountainous non-LFA ALL
Austria -4.9 -4.5 -6.1 -4.8
Belgium -5.6 -6.5 -6.3
Bulgaria -11.0
Cyprus Czech Republic -15.1 6.2 -9.1 -9.0
Denmark -9.9 -9.9
Estonia -19.7 -17.7 -18.8
Finland -8.8 -7.5 -7.8
France -1.3 -1.0 -1.5 -6.5 -4.6 -5.2 -5.3
Germany -1.9 -2.0 -4.0 -3.6 -5.0 -4.3
Greece -12.1 -9.1 -5.3 -9.4
Hungary -18.1 -10.0 -13.5
Ireland -1.5 -2.3 -5.2 -5.7 -5.4
Italy -1.3 -1.7 9.9 0.7 0.5 1.4
Latvia -7.4 -7.4
Lithuania -15.1 -15.1 -15.1
Luxembourg 6.0 6.0
Malta 2.7 2.7
Netherlands -1.5 2.1 2.1
Poland -5.4 -8.1 -5.0 -5.4
Portugal -6.5 -9.6 -6.6 -7.7
Romania -5.5
Slovakia -5.3 -9.9 16.4 -7.4
Slovenia -2.0 1.2 -6.5 -1.3
Spain -2.4 -2.0 -2.9 -3.4 -5.4 -11.7 -6.2
Sweden -9.5 -10.1 -7.1 -8.9 United Kingdom -1.3 -1.7 4.4 2.9 3.4
Notes: 1) For the period 1995-2004, data are missing for all except seven Member States.
Source: Baldock et al., 2008; EU-FADN.
Table 5.13 summarises some evidence on changes in numbers of dairy farms (herds) in and outside Less
Favoured Areas. The rather sparse evidence on relative rates of change during 1995-2004 shows a
consistent pattern: dairy farm numbers declined relatively less steeply inside LFAs, suggesting that the
package of policy incentives provided to LFA farmers was able to counteract the pressures to quit. The
picture is much harder to read in the 2005-2007 period. In Austria, Belgium, Germany and Spain, for
example, the previous pattern of proportionately fewer exits in LFAs persists. In other Member States,
the rate of decline is greater for LFA dairy farms (e.g. Greece, Hungary, Poland), and in yet other
Member States, LFAs gained dairy farms (e.g. Italy, the UK). It is not possible to link these changes to
specific policy changes.
5.14 Conclusions
Number of dairy cows and herds
The long-term rate of decline in dairy cow numbers was slower in the early 2000s than during the 1990s.
In the period 2003-2006 the rate of decline in EU-15 compared with 2000-2003 was more than double.
It was also greater by at least 50% in the Member States of EU-10 and EU-02. However, as the period
2003-2006 includes the year of accession and the immediate post-accession period for the countries of
EU-10, other factors besides dairy policy changes also underlie these adjustments.

149
Between 2000 and 2007, 33% of dairy herds disappeared in EU-15. In Spain, Portugal, Sweden and
Denmark the loss was around 50% or more. Between 2003 and 2007, 713 thousand dairy herds ceased
operation in EU-27. This represents a massive restructuring and concentration of EU milk production. The
issue is whether it can be linked to the policy changes under review.
The producer survey (among producers still active in early 2011) indicated that about two-thirds of them
had not considered stopping milk production in the period since 2003, and those who had given this
option serious consideration tended to cite economic factors (in particular low milk prices) rather than
specific policy changes as the reason. The reduction in intervention prices, as decreed in the 2003
reform, was accompanied by a gradual lowering of milk prices during 2004-2006, and this lower level
reappeared in 2009 after the price spike due to high world demand in 2007-8. However, other factors
that the producers surveyed considered to be incentives for stopping production were environmental
regulations, insufficient potential to grow and greater volatility in milk prices.
In conclusion, structural evolution with respect to numbers of cows and herds was greater in the three
years 2004-2006 than in 2000-2003 in EU-15. The decline in EU-15 cow numbers almost ceased
between 2006 and 2010; data on the evolution of herd numbers for this latest period are not available.
Structural change is a complex and gradual process. The observed changes cannot be linked directly to
policy measures or policy changes.
Herd size restructuring
Rates of herd-size increase vary greatly between Member States. Many Member States in EU-15 had
lower growth in average herd size in 2005-2007 than 2000-2003, indicating that the higher rate of herd
decline in that sub-period was balanced by a higher rate of decline in cow numbers. There is no clear-cut
evidence linking these developments to specific policy changes. Prior empirical evidence of the effect of
quota restrictiveness on herd-size growth created the expectation that average herd size would increase
faster from 2004-2005 onwards, when quotas became less restrictive for a variety of reasons. However,
this expectation is not strongly supported by the data.
Herd sizes in EU-10 and EU-02 are generally much smaller than EU-15. The post-2003 period in these
countries is marked by a number of adjustments due to adopting the CAP as a whole and the pressures
of the single European market. Therefore, no conclusions about the impacts of specific dairy policy
changes can be based on the structural developments observed in the dairy sectors of these countries.
Structure of specialisation
After the 2003 reform, herds on specialist dairy farms in EU-15 continued to expand in size faster than
herds on other types of farm. Several factors contributed to this different trend. Among these factors is
the clarity about future dairy policy changes and the long-term horizon for the dairy sector that was set
out in the 2003 reform. Given the commitment of specialist dairy producers to a long-term future in
dairying, this perspective together with the fall in quota prices supported a faster rate of herd expansion
for specialist dairy herds than was observed for the more diversified, arguably less committed milk
producers on other types of farm. In EU-10, the size of herds on both specialist and non-specialist dairy
farms remained more or less constant. The share of total milk supply coming from specialist dairy farms
varies greatly across EU-27.
Geographical relocation of production
National quota ceilings establish upper limits to milk deliveries and therefore to production capacity, and
the shares of Member States national quota in the whole have changed only marginally. Since 2004/5,
there has been a little movement in national shares of milk supply, with a slight increases in Germany
and the Netherlands, slight falls in the UK over the period and in France in 2009-2010, but no clear
trends for EU-10 Member States.
A certain degree of geographical mobility of milk production and dairy capacity within Member States has
been maintained throughout the quota period. The lack of regional data makes it impossible to examine
whether this process has accelerated or become more responsive to market and policy signals since the
2003 reforms and their implementation. However, data on the percentage decline in dairy herds from
LFAs and non-LFAs suggest that the tendency, observed over 1995-2004, for dairy herds in LFAs to quit

150
less readily than those in non-LFAs appears to have been disrupted in the mid-2000s, leading to quite
heterogeneous patterns across Member States. It must be stressed that the data assembled here are
rather patchy for the earlier period, and that if there is a real change in the pattern, it is not necessarily
related to or solely due to the dairy policy changes under review here, although hypotheses to support
this view could be constructed.
Summary of findings for each indicator, EQ1b
Indicator Expected result Evidence found
Number of cows and herds
Dairy cows in the EU, total and by MS
The falling secular trend was expected to increase.
The falling trend accelerated, relative to 2000-2003. This continued up to 2007, when market conditions changed due to disruption from the world market.
Dairy herds in the EU, total and by MS
Continuation of secular decline was expected.
The expected result was observed.
Farmer’s strategic choices (exit, continuation, reduction and expansion of milk production)
It was expected that the decoupling of the dairy premium would create an incentive for milk producers to cease production.
Such an incentive was not reported, either by continuing producers or those who had quit since the policy changes were introduced.
Herd size restructuring
Medium-term trend in EU herd size
The secular trend in average herd size was expected to continue, and possibly accelerate (due to easier availability of quota, more price pressure, decoupled payment)
The secular trend continued. In some Member States, it accelerated after 2004.
Herd-size distribution by MS
Constraints on herd size expansion
Evidence was sought, no prior theory-based expectations were formed.
The proportion of profitable specialist dairy farms increased.
Farmers’ use of high milk price
Windfall returns were used in various ways. There is no clear indication that they helped to ease a financial constraint on herd expansion.
Structure of specialisation
Share of specialist dairy farms in total milk production
The pre-reform trend towards specialisation was expected to continue, and possibly accelerate.
The re-reform trend continued, but with marked differences between Member States.
Average herd size by specialist and non-specialist dairy farms
Average herd size was found to grow faster after 2003 for specialist dairy farms. It remained more or less constant for non-specialist dairy farms.
Geographical structure of production
Regional/national location of milk production
It was expected that MS shares will become less fixed as quota limits become less constraining and supply becomes more responsive to price.
The expected result is found after 2004-2005 in some Member States. No regional bias in these changing shares can be discerned.
Geographical distribution of dairy cows by MS
It was expected to observe more geographical mobility of productive capacity within MS.
The expectation is met in some MS, but not in others. No consistent pattern is found for the EU as a whole.
151
6 EQ2: Producer prices
To what extent have the CAP measures applicable to the dairy sector affected prices paid to producers,
the payment system (links to quantity and/or quality) and price stability.
6.1 Interpretation and comprehension of the key terms of the EQ2
The three key issues in this EQ are the effect of CAP measures applicable to dairy on the producer price
for milk (its level), on the payment system for milk and on the stability of producer prices.
The CAP measures that potentially affect price are (a) border measures, which support domestic market
prices above world market levels, (b) the target milk price (abolished following Regulation (EC)
1787/2003) and intervention prices (progressively lowered during the period since 2003), (c) private
storage aids (also progressively reduced or eliminated), (d) internal consumption aids, which stimulate
domestic demand for certain dairy products (also subject to reduction over the period, abolished for
butter and cream in 2009)) and (e) quotas on milk supply (deliveries and direct sales) from farms.
The payment system is interpreted as comprising (a) the process whereby the price received by milk
producers from purchasers (dairies) is established and (b) the factors that determine the level of price
paid. IN an operational sense, the payment system is the link between the milk price paid to producers
(which is an input cost for dairies) and the prices of processed products (determining the output revenue
generated from milk processing by dairies). When price changes in product markets are fully passed back
to milk producers (according to the share of milk in the value of the final product), backward price
transmission is said to be perfect. The price transmission relationship is important in that it determines
how effective policy measures applied to dairy product markets are for supporting the milk price, and yet
price transmission itself lies outside the scope or control of any policy measure.
CAP measures that can stabilise milk prices in the EU are the intervention system (temporary withdrawal
of products from the market) and the permanent disposal measures, export refunds and consumption
aids. In each case, it is the timing of the use of the measure that is important for price stabilisation, with
more supply being taken off the domestic market when prices are falling, and −in the case of
intervention− being returned to the market when prices are rising. In theory, the objective of the
intervention system was the stabilisation of within-year price and quantity movements caused by
seasonality in yields and production systems (which is quite pronounced in some EU regions) or, less
typically, to movements from one year to the next due to unusual meteorological variations. Stabilisation
measures applied in product markets are effective in stabilising producer prices for milk only to the
extent that corrections for instability in product prices are transmitted back up the chain to milk
producers.
6.2 Methodology used for answering the EQ2
6.2.1 Level of producer prices
This question is decomposed into two aspects: the impact of CAP dairy policy measures on the absolute
level of the producer milk price over time, and the extent to which these measures support the producer
prices for milk within the EU above the prices prevailing on world markets.
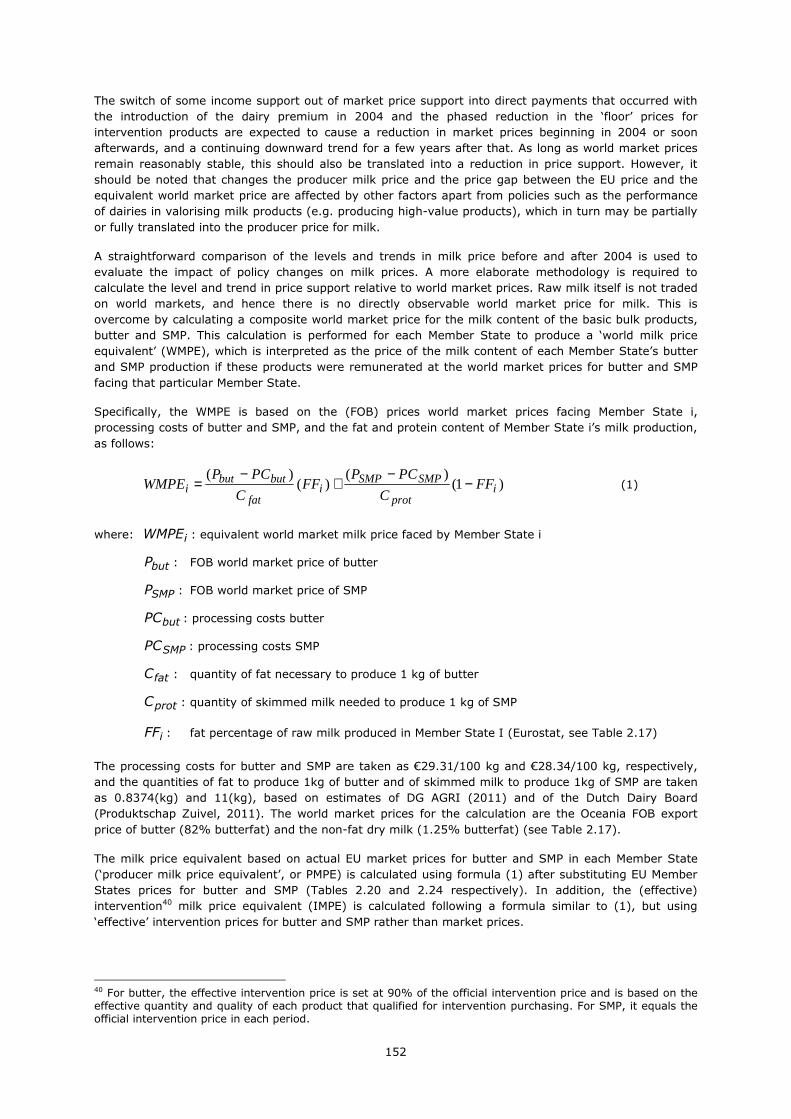
152
The switch of some income support out of market price support into direct payments that occurred with
the introduction of the dairy premium in 2004 and the phased reduction in the ‘floor’ prices for
intervention products are expected to cause a reduction in market prices beginning in 2004 or soon
afterwards, and a continuing downward trend for a few years after that. As long as world market prices
remain reasonably stable, this should also be translated into a reduction in price support. However, it
should be noted that changes the producer milk price and the price gap between the EU price and the
equivalent world market price are affected by other factors apart from policies such as the performance
of dairies in valorising milk products (e.g. producing high-value products), which in turn may be partially
or fully translated into the producer price for milk.
A straightforward comparison of the levels and trends in milk price before and after 2004 is used to
evaluate the impact of policy changes on milk prices. A more elaborate methodology is required to
calculate the level and trend in price support relative to world market prices. Raw milk itself is not traded
on world markets, and hence there is no directly observable world market price for milk. This is
overcome by calculating a composite world market price for the milk content of the basic bulk products,
butter and SMP. This calculation is performed for each Member State to produce a ‘world milk price
equivalent’ (WMPE), which is interpreted as the price of the milk content of each Member State’s butter
and SMP production if these products were remunerated at the world market prices for butter and SMP
facing that particular Member State.
Specifically, the WMPE is based on the (FOB) prices world market prices facing Member State i,
processing costs of butter and SMP, and the fat and protein content of Member State i’s milk production,
as follows:
)1()(
)()(
iprot
SMPSMPi
fat
butbuti FF
C
PCPFF
C
PCPWMPE −
−+
−= (1)
where: iWMPE : equivalent world market milk price faced by Member State i
butP : FOB world market price of butter
SMPP : FOB world market price of SMP
butPC : processing costs butter
SMPPC : processing costs SMP
fatC : quantity of fat necessary to produce 1 kg of butter
protC : quantity of skimmed milk needed to produce 1 kg of SMP
iFF : fat percentage of raw milk produced in Member State I (Eurostat, see Table 2.17)
The processing costs for butter and SMP are taken as €29.31/100 kg and €28.34/100 kg, respectively,
and the quantities of fat to produce 1kg of butter and of skimmed milk to produce 1kg of SMP are taken
as 0.8374(kg) and 11(kg), based on estimates of DG AGRI (2011) and of the Dutch Dairy Board
(Produktschap Zuivel, 2011). The world market prices for the calculation are the Oceania FOB export
price of butter (82% butterfat) and the non-fat dry milk (1.25% butterfat) (see Table 2.17).
The milk price equivalent based on actual EU market prices for butter and SMP in each Member State
(‘producer milk price equivalent’, or PMPE) is calculated using formula (1) after substituting EU Member
States prices for butter and SMP (Tables 2.20 and 2.24 respectively). In addition, the (effective)
intervention40 milk price equivalent (IMPE) is calculated following a formula similar to (1), but using
‘effective’ intervention prices for butter and SMP rather than market prices.
40 For butter, the effective intervention price is set at 90% of the official intervention price and is based on the effective quantity and quality of each product that qualified for intervention purchasing. For SMP, it equals the official intervention price in each period.

153
The difference between the PMPE in a given Member State and its WMPE then provides a measure of the
price support (P-SUP) of EU policy to dairy farmers for that Member State. P-SUP will be an over- or
under-estimate of the rate of price support depending on whether the price gap between domestic and
world market prices for higher-valued products (e.g. cheese and WMP) is larger or smaller than that of
the bulk products butter and SMP. However, if the prices of all these products move more or less in
parallel, then changes in the P-SUP ratio should capture changes in total price support. Note that P-SUP
is Member State-specific and year-specific (with time subscript left out for convenience). The formula, for
the i-th Member State, is given as
i
iii
WMPE
WMPEPMPESUPP
)( −=− . (2)
If P-SUP is greater than zero, then the CAP measures provide positive support to the milk price. For
example, if P-SUPi=0.25, then the CAP supports the price of the milk used for basic products of the i-th
Member State at a level that is 25% above the equivalent world market price level, and when P-SUPi=0,
then policies do not create any difference between the price of the milk used in the Member State for
butter and SMP production and its equivalent price on world markets. Other factors, such as transport
and handling costs from the location of measurement in the Member State to the nearest port for export
or import could lead to a non-zero P-SUP ratio, even when the effective support provided by the policy is
zero. This component is expected to be relatively minor, however, and constant over time, in which case
changes in P-SUP over time can be interpreted as very largely due to changing policy impacts.
The approach assumes that the underlying behaviour of farmers and processors, processing costs, and
yield coefficients, remain unchanged over time. Furthermore, it is assumed that the quantities and prices
of higher-value dairy products move proportionately with those for basic prices, and that world market
prices are not sensitive to changing policy impacts on EU dairy product markets.
6.2.2 Payment system
Since most of the EU dairy policy measures directly target the prices and/or markets of milk products
rather than the producer price for milk, understanding the payment system is important for gaining
insight into how prices are formed at the first link in the supply chain and, specifically, the degree of
price transmission from product markets back to the market for raw milk. Information on this issue is
based on three sources:
• Information on the typical structure of the payment system (factual information) from the case
studies (milk producer and dairy processor surveys);
• Information on whether, and if so how, the payment system was perceived to have changed due to
policy changes from the case studies;
• Literature research on price transmission (often based on econometric analysis of time series of
prices).
Information about the payment system is often considered by the dairies to be sensitive information.
Although some dairies report information on the general principles according to which they price the raw
milk they collect, how the system actually works in practice cannot necessarily be inferred from these
general principles.
6.2.3 Price volatility
The effects of the CAP measures on price stability are analysed by comparing volatility indicators for
monthly prices. When comparing volatility between Member States, the producer milk price is used.
However, when comparing volatility between the EU milk price and the world milk price, the comparison
is between the PMPE and the monthly world market milk price equivalent (WMPE). This is because, as
raw milk is hardly traded on the world market, there is no ‘world milk price’ as such.
No single indicator is universally used as a measure of volatility. Two approaches are offered here, in
order to appeal to both a non-technical and technical readership:

154
• non-technical analysis-measures such as the trend and ±10% band indicators (graphical analysis of
variability), and
• technical measures, i.e. specific statistics measuring variability in price series.
Variation from trend or price-band analysis: This non-technical method involves calculating a ±10%
band around the trend line and counting the share of observations within and outside this band (Keane
and O’Connor, 2009). The number of outlying observations since January 2004 is compared with the
number during the period of similar duration up to December 2003. Note that a wider or narrower band
width could be chosen. The appropriate width of the band outside which an observed price is considered
an ‘extreme’ observation depends on the extent of variability of the series in the pre-2004 period.
Statistical measures: we select two alternative statistics for measuring volatility: the coefficient of
variation, and the annualised standard deviation.
Coefficient of variation: The standard deviation (SD) of a variable measures the extent to which the
variable fluctuates around its mean. However, it is a poor measure of volatility between variables when
they do not have a common mean. In these circumstances, one must standardise the SD in relation to its
mean, and this produces the coefficient of variation (CV) for the variable. The CV expresses the SD as a
percentage of the mean, and is calculated as follows:
100×=x
SDCV , where SD is the standard deviation and x is the mean.
Annualised standard deviation: This statistic is commonly used to compute historic volatility
(O’Connor and Keane, 2011). The annualised standard deviation (ASD) is the standard deviation of the
logarithm of price multiplied by the square root of the number of measurement periods per year (which
in this case is 12, as monthly data are used). Converting the prices to logarithmic form allows variability
to be measured as a percentage of the (geometric) mean. This solves the problem of non-comparability
noted above for the SD of price levels. The ASD is given as follows:
12),...,(),...,( 11 ×= nn ppSDppASD (3)
where npp ,...,1 is a price series in logarithmic form, extending over n periods.
To the extent that data availability allows, the volatility analysis is done at Member State level. When
and where price information from key dairies is available, this information has also been used to do some
cross validation and check on the calculations based on average producer price for milk at MS level. As
regards the time horizon, the seven-year period before the Luxembourg Agreement 2003 and several
shorter periods thereafter are considered and compared.
In addition to the analyses described above, this EQ reports information from the milk producers’ and the
dairy processors’ survey regarding the impact of volatility. Milk producers were asked to assess how
increased price volatility had affected their willingness to remain in dairying or their decision to leave.
Processors were asked about the extent to which higher price volatility had led them to adjust their
payment system and their contracts with other segments of the supply chain. The aim of these questions
was to gain insight into the impacts of price volatility on dairy processors and dairy farms, on the extent
to which they can cope with volatility, and their reactions to it.
155
6.3 Judgement criteria, indicators and information sources used for each
indicator
Table 6.1 lists the indicators used to address this evaluation question, their data requirements and the
sources of these data.
Table 6.1 Indicators, data requirements and information sources for EQ2
Indicator Data requirements Information sources
Price support
Producer price for milk Farm-gate milk prices Eurostat
Price support MS prices of butter and SMP,
prices,
Milk fat content,
World market prices for butter and
SMP,
Estimated processing costs for
butter and SMP, quantity of fat to
produce 1kg of butter, quantity of
skimmed milk to produce 1kg of
SMP
Eurostat
ZMP, and national statistics
Eurostat
European Commission,
Productschap Zuivel (Netherlands)
Payment system
Perceptions of milk producers and
processors regarding the impact
of policy changes on the payment
system
Survey responses Milk producer and milk processor
surveys
Evidence on price transmission at
first link in the dairy supply chain
Econometric evidence Commission Staff Working
Document SEC (2009) 1450
Price stability
Comparison of measured price
volatility for the period before and
after 2003, based on:
• price band indicators
(graphical analysis of
variability)
• coefficient of variation
• annualised standard deviation
Same series as used above. Idem
The following judgement criteria are used:
• the level and the trend in producer milk price are both examined and in each case compared for the
periods before and after 2003. In particular, it is expected to find a decline in the milk price starting
in 2004 when some income support was shifted about of market price support into the dairy
premium. If this is found, it would indicate the expected impact of policy changes on price.
• the level and the trend (if any) in P-SUP (measured per year) are both measured and compared for
the years before 2003 and during the period in which the 2003 reforms were applied. If the level
remains more or less constant on average across the two periods, or if pre-2003 trend is maintained
post-2003, then this implies that the changes in CAP measures have not affected the degree of
underlying price support. Given the expectation that policy lowered the milk price from 2004
onwards, price support is also expected to be lower also, providing world market price conditions
remain stable. However, if world market prices are also changing, then this affects the measured
gap between domestic and world market equivalent milk price, and may mask the effect of lower
price. If price support remains constant while domestic price falls, this would mean that world
market prices were also falling.
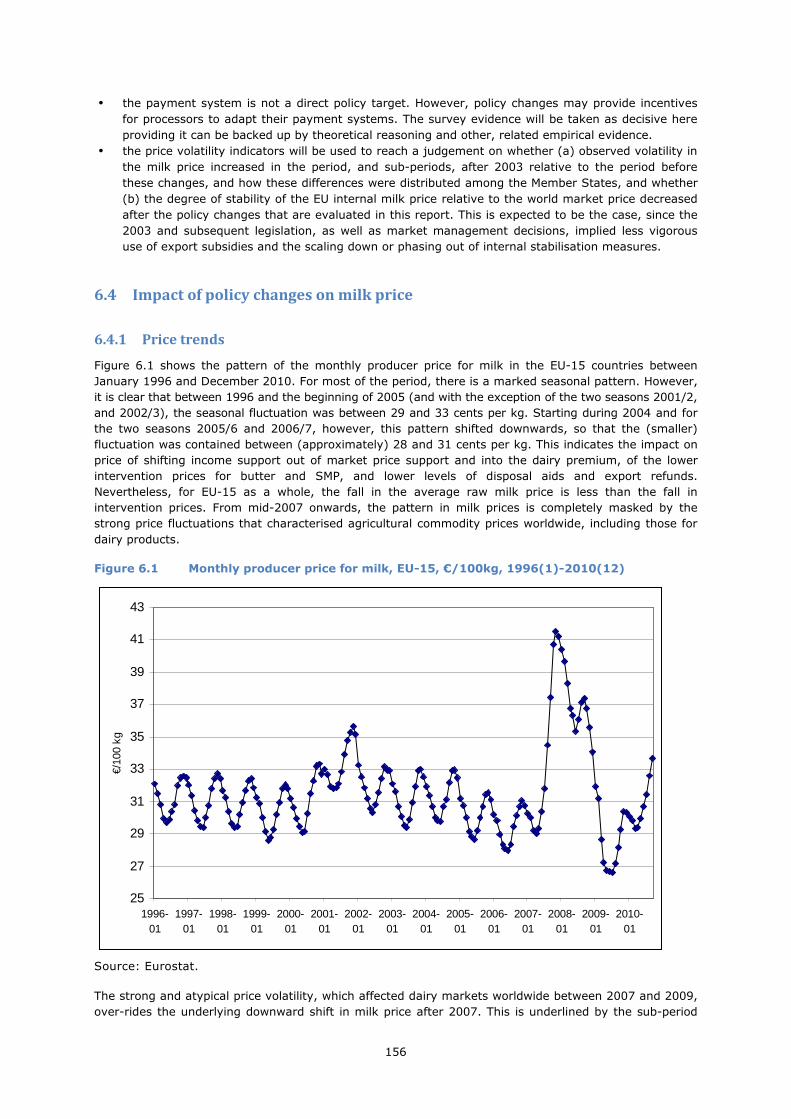
156
• the payment system is not a direct policy target. However, policy changes may provide incentives
for processors to adapt their payment systems. The survey evidence will be taken as decisive here
providing it can be backed up by theoretical reasoning and other, related empirical evidence.
• the price volatility indicators will be used to reach a judgement on whether (a) observed volatility in
the milk price increased in the period, and sub-periods, after 2003 relative to the period before
these changes, and how these differences were distributed among the Member States, and whether
(b) the degree of stability of the EU internal milk price relative to the world market price decreased
after the policy changes that are evaluated in this report. This is expected to be the case, since the
2003 and subsequent legislation, as well as market management decisions, implied less vigorous
use of export subsidies and the scaling down or phasing out of internal stabilisation measures.
6.4 Impact of policy changes on milk price
6.4.1 Price trends
Figure 6.1 shows the pattern of the monthly producer price for milk in the EU-15 countries between
January 1996 and December 2010. For most of the period, there is a marked seasonal pattern. However,
it is clear that between 1996 and the beginning of 2005 (and with the exception of the two seasons 2001/2,
and 2002/3), the seasonal fluctuation was between 29 and 33 cents per kg. Starting during 2004 and for
the two seasons 2005/6 and 2006/7, however, this pattern shifted downwards, so that the (smaller)
fluctuation was contained between (approximately) 28 and 31 cents per kg. This indicates the impact on
price of shifting income support out of market price support and into the dairy premium, of the lower
intervention prices for butter and SMP, and lower levels of disposal aids and export refunds.
Nevertheless, for EU-15 as a whole, the fall in the average raw milk price is less than the fall in
intervention prices. From mid-2007 onwards, the pattern in milk prices is completely masked by the
strong price fluctuations that characterised agricultural commodity prices worldwide, including those for
dairy products.
Figure 6.1 Monthly producer price for milk, EU-15, €/100kg, 1996(1)-2010(12)
25
27
29
31
33
35
37
39
41
43
1996-01
1997-01
1998-01
1999-01
2000-01
2001-01
2002-01
2003-01
2004-01
2005-01
2006-01
2007-01
2008-01
2009-01
2010-01
€/10
0 kg
Source: Eurostat.
The strong and atypical price volatility, which affected dairy markets worldwide between 2007 and 2009,
over-rides the underlying downward shift in milk price after 2007. This is underlined by the sub-period

157
averages in Table 6.2. The average EU-15 raw milk price (€30.32/100kg) was more than €1/100kg lower
in 2004-2005 than in 1997-2003, and rose to above €35/100kg in 2007-2008. After the high prices of
2007-2008, milk prices fell very steeply, beginning in late 2008 and reaching unusually low levels in mid-
2009. In 2009, the average EU-15 raw milk price was under €27/100kg for the months of May, June, and
July, whereas the average EU-27 price fell below €25/100kg in June and July.
Table 6.2 shows that there is considerable heterogeneity between Member States regarding raw milk
price. A few EU-15 Member States have a higher average for 2004-2006 than in 1997-2003, although for
the majority of them it is lower. Even during the market disruptions of 2007-2010, the same
heterogeneity is observed. The steepest price falls (between the average for 2007-2008 and the average
for 2009-2010) are observed in Luxembourg, Ireland, Spain, Hungary and Belgium, where the difference
between the averages for the two periods is greater than €6.50/100kg. In 2009-2010, average raw milk
prices fell back to a level lower than the average for 1997-2003, whilst for others it remained higher.
In the Member States of EU-10, the change on accession is an upward shift for six of the countries
shown, but a fall for three others (Cyprus is not included). However, they all experience a higher price in
2007-2008 but by less than the other EU Member States.
There is little evidence in Table 6.2 of convergence between milk prices in EU-15 Member States over the
period. The range (between the lowest and highest MS price) is wider in 2009-2010 than in 1997-2003 in
EU-15, but smaller in EU-10 (for the countries shown) than in 2003.
Table 6.2 Annual average milk price by Member State, four sub-periods, €/100kg
EU-15 1997-2003
2004-2006
2007-2008
2009-2010 EU-10 2003 2004-
2006 2007-2008
2009-2010
BE 29.65 27.83 33.33 26.47 CZ 23.83 26.20 31.21 24.94
DK 33.24 29.56 34.41 29.12 EE 18.51 24.56 28.29 23.85
DE 30.96 28.28 33.07 26.69 HU 27.39 24.66 30.37 23.28
EL 32.69 35.62 40.94 37.37 LT 13.93 19.02 24.90 21.00
ES 28.34 30.24 36.64 29.11 LV 13.52 20.71 27.01 21.39
FR 30.46 30.53 33.92 30.21 MT 41.28 24.97 * *
IE 27.85 28.17 35.24 27.26 PL 15.87 23.19 29.93 24.29
IT 36.11 33.61 35.88 31.91 SK 21.53 24.17 30.67 23.57
LU 32.88 31.19 36.86 27.92 SI 29.43 27.00 30.50 26.16
NL 32.10 28.64 34.37 28.52 EU-10 24.20 26.32 29.11 23.56
AT 29.93 29.68 36.40 29.97 EU-02
PT 30.72 29.78 33.99 28.59 BG 30.86 26.20 31.21 27.44
FI 33.82 35.28 41.65 38.09 RO 29.43 24.56 28.29 26.24
SE 34.07 30.08 33.63 29.00
UK 27.89 26.35 30.48 26.60
EU-15 31.58 30.32 35.39 29.79
Notes: * Average not shown because the series is incomplete.
Source: Eurostat.
6.4.2 Price support (P-SUP): Levels and trends
As the IMPE is determined by the effective EU intervention prices, the IMPE during the period 1997-2003
was quite steady at around €283/t milk (Figure 6.2). However, from 2004 onwards, the IMPE began to
decline, and by 2009 it was about €216/t, 22% below the level of the pre-2004 period.
In the first sub-period, the producer milk price equivalent (PMPE) based on butter and SMP prices was 4-
9% above the IMPE, depending on the year, except in 2001 and 2002 when it stood at 16-17% above
the IMPE. From 2004 onwards, the relative difference between the PMPE and the IMPE became
consistently greater, reaching 68% above the IMPE in 2007 but then falling to 44% in 2008 and 14% in
2009. This indicates that intervention prices were playing an increasingly minor role in setting the level
for producer bulk product prices, and that market forces (and especially those that caused the price spike
in 2008) were much more important.

158
From 1997-2003, there is a weak influence of world price on PMPE, but from 2003 to 2006 the effects of
reform mask this influence. The IMPE (EU) was between 40% and 120 % higher than the WMPE (world)
in the pre-2004 period; however, from a position of 62% higher in 2004, the IMPE fell relative to the
WMPE, and in fact in 2007 and 2008, it was 34% and 21% lower than the WMPE, respectively. In 2009,
it was just 17% higher.
The P-SUP ratio shows the net impact of these independent movements on the effective price support for
milk used for bulk products within the EU above the world market equivalent price. Not surprisingly,
there is considerable annual variation. However, it is noticeable that whereas this ratio exceeded 1 in two
years during the 1997-2003 period, indicating that milk price was more than double world market
equivalent price, from 2004 onwards this level was never again reached, and in the last five years, P-SUP
was 50% or far less of the WMPE. In 2007 and 2008, P-SUP was very low and the internal EU milk price
equivalent moved in parallel with the world market equivalent, as policy measures for managing internal
prices were rendered ineffective by the negative price gap between IMPE and WMPE.
Figure 6.2 Evolution of price support and milk price equivalents in EU-27
0
50
100
150
200
250
300
350
400
1997 1998 1999 2000 2001 2002 2003 2004 2005 2006 2007 2008 2009
IMP
E,
WM
PE
, P
MP
E,
€/
t
0.0
0.2
0.4
0.6
0.8
1.0
1.2
1.4
P-S
UP
(ra
tio
)
P-SUP IMPE WMPE PMPE
Note: PMPE is the domestic price of milk as used for butter and SMP; IMPE is the intervention milk price equivalent; WMPE is the world milk price equivalent based on (FOB) world market prices for butter and SMP.
Source: own calculations.
Table 6.3 EU and world market prices, EU price support, averages for sub-periods of 1997-2009
1997-2003 2004-2006 Change
relative to 1997-2003
2007-2008 Change
relative to 1997-2003
2009 Change
relative to 1997-2003
€/t €/t % €/t % €/t %
IMPE 283.24 258.59 -8.7 222.38 -21.5 216.15 -23.7
WMPE 167.29 184.93 10.5 309.02 84.7 184.89 10.5
PMPE 310.09 279.54 -9.9 347.41 12.0 247.31 -20.2
P-SUP 0.91 0.52 -43.0 0.13 -86.2 0.34 -62.9 Source: own calculations.

159
There are sharp year-to-year movements in some of the statistics shown in Figure 6.2. The four sub-
period averages shown in Table 6.3 smooth these fluctuations in order to summarise the general level of
these different variables in the years before and after the reduction in intervention prices and the
introduction of direct payments for milk. The summary shows clearly that in 2004-2006 policies provided
a much lower floor price for milk via the intervention mechanism, and that producer milk prices (PMPE)
on average fell by slightly more (-9.7%) in relative terms than the IMPE (-8.7%). During 2007-2008, the
PMPE cut loose from the IMPE and rose to a higher average level than in 1997-2003. By 2009-2010,
however, it had fallen –relative to its pre-2004 average– by nearly as much as the IMPE.
Table 6.4 shows the calculated P-SUP at Member State level. This ratio denotes the degree of support
given to the price of milk for bulk products, as a fraction of the equivalent world market price of milk for
bulk products. Although there are some marked differences between Member States and between years
for the same Member State, which we do not attempt to explain here, it is clear that the pattern at EU
level (namely, much lower effective price support from 2004 onwards) is repeated at Member State level.
In fact, in 2008 the P-SUP ratio was negative for Ireland, the Netherlands and Slovakia.
Table 6.4 Price support indicator (P-SUP) for the EU-27
2001 2002 2003 2004 2005 2006 2007 2008 2009 Austria 0.49 1.13 0.95 0.70 0.44 Belgium 0.38 1.02 0.90 0.68 0.36 0.49 0.20 0.06 0.32 Denmark 0.53 1.35 1.18 0.91 0.58 0.63 0.15 0.29 0.43 Finland 0.36 0.96 0.83 0.61 0.34 France 0.35 0.98 0.86 0.66 0.36 0.46 0.19 0.00 0.26 Germany 0.42 1.04 0.91 0.68 0.37 0.50 0.22 0.05 0.24 Greece Ireland 0.23 0.92 0.80 0.57 0.27 0.34 0.08 -0.06 0.18 Italy Luxembourg Netherlands 0.37 1.03 0.90 0.68 0.35 0.48 0.19 -0.02 0.27 Portugal 0.72 Spain 0.39 1.02 0.77 0.62 0.36 Sweden 0.38 1.33 1.14 United Kingdom 0.53 1.12 0.93 0.73 0.42 0.44 0.12 0.11 0.22
Cyprus Czech Rep. 0.57 0.34 0.40 0.02 0.06 0.18 Estonia 0.47 0.24 Hungary 0.47 0.31 0.32 -0.15 0.17 0.17 Latvia 0.47 0.30 0.47 0.11 0.42 0.53 Lithuania 0.34 0.32 Malta Poland 0.42 0.26 0.38 0.07 -0.03 0.18 Slovakia 0.47 0.36 0.48 0.12 0.28 0.57 Slovenia 1.25 0.96 Bulgaria Romania
EU-27 0.40 1.10 0.94 0.70 0.40 0.46 0.11 0.14 0.34
Notes: An empty cell means that not all data were available for performing the calculation.
Source: own calculations.
160
6.5 Information on the payment system
There is no standardised payment system across the EU. The way milk price is determined differs from
one Member State to another, and between the two main types of processing company (cooperatives
and private companies). However, the underlying principles are more or less the same in all systems.
There is a basic price, which depends on a standard fat and protein content. This price is then adjusted
according to:
• composition (actual fat and protein content),
• hygienic quality
• other quality criteria.
Fat and protein content are the dominant criteria (hence the name ‘component pricing’), as they are
decisive for the yield of the milk in terms of the processed product. However, other criteria that affect
the value-adding process or contribute to cost savings for the dairy are also subject to special bonuses,
including the milk’s freezing point, bacteria and somatic cell counts, seasonality, large-volume deliveries,
guarantee to be from dairy cows grazing out of doors and organic production.
Thus, the payment system acts as a powerful set of incentives for producers, encouraging them to
supply milk of the desired composition and quality, and at the times of the year that maximise the return
to the milk when it is sold on by processors in the form of dairy products. Most of these criteria are cost-
or consumer-oriented, and not directly affected by policy. An important exception is the return to fat and
protein themselves, which will depend (a) on the extent that butter and skim milk powder prices are
supported by export refunds and (b) the extent to which their price movements are smoothed by
intervention buying and selling. Moreover, (c) the relative incentives to produce fat rather than protein
will also be influenced by the management of export refunds and the extent of intervention for these two
basic products relative to each other. The other incentive criteria for adjusting milk prices are more
dependent on market signals and cost-reducing potential.
There are differences in the payment system between cooperatives and private dairies. The price paid by
the latter is the result of contractual negotiations between the individual milk producer or producer
organisation. It is difficult to obtain comprehensive empirical information on how much of the net value
added of the milk is captured by the primary producer in these negotiations. It depends very much on
the relative bargaining strengths of the two ‘sides’ of the market, and anecdotal evidence suggests that
this varies from country to country, and between dairies in the same country. In fact, unequal bargaining
power may be a very localised phenomenon, where one dairy is effectively the only downstream outlet
for a geographically determined group of producers. By contrast, milk producers delivering to a
cooperative have to be members of the cooperative, and the price paid depends on the economic success
of the cooperative. In theory, all the cooperative’s net value added is paid out to members. However,
cooperatives are obliged to collect all the milk offered by their members, whereas private dairies do not
have this obligation and instead they collect milk on a negotiated basis. This allows private firms more
flexibility as compared to cooperatives to adjust their milk intake as a function of their marketing
opportunities. Without this flexibility, cooperatives face higher risks compared to private dairies. In
addition, there is evidence in some countries that private companies are more innovative in product
design and have a more market-oriented product mix, so it is by no means a foregone conclusion that
cooperatives always pay higher milk prices than private companies.41
Market intervention is targeted to processed dairy products (butter and SMP) rather than to raw milk.
However, the range of dairy products determining the remuneration of milk fat and milk protein is much
wider than butter and SMP. The product mix usually also includes various high-value products (for
example, PDO/PGI cheeses and fresh dairy products) and the composition of the product mix is likely to
vary over Member States. The degree of self-sufficiency in the different derived dairy products and the
shares of the products going to domestic and foreign or export markets also play a role in determining
the level of the domestic prices.
41 This is confirmed by the annual International Milk Price Comparison (prices paid by individual milk processing entities) by LTO in the Netherlands.

161
None of the policy measures applied to the dairy sector target the bargaining process between milk
producer and processor at this first link of the chain. So, although the measures already mentioned can
influence the price of fat relative to protein, and even the absolute prices of these components that the
dairies receive for them, these policy measures do not have any leverage over the share of these prices
that is passed back to the milk producer. Moreover, less restrictive quota limits are thought to have
weakened producers’ bargaining power.
Good price transmission from processors to milk producers is a necessary condition for the payment
system to act an effective conduit for policy impacts to producers. Vertical price transmission involves
passing price shocks along the chain from primary producer to wholesale to retail levels, and vice versa.
The European Commission (2009b) analysed price transmission in several EU Member States (Austria,
Denmark, France, Germany, and Slovenia) and for several dairy products (among which drinking milk,
cheese, yogurts, butter). The study concluded that price transmission between producer and consumer
prices is weak (with price transmission coefficients for most countries and products well below 1) and
asymmetric (price rises more fully and more speedily passed forward down the chain than price falls, and
the reverse for backward transmission). However, this evidence relates to transmission between the
markets at each end of the chain, and does not necessarily hold for each link in the chain. There is some
evidence that vertical transmission between dairy wholesale prices and producer milk prices may be
more effective in some countries. For example, O’Connor (2006) found clear evidence of price
transmission between the composite product price series and the farm gate price for milk. However,
European Commission (2009b) reports that there has been a clear trend lately towards an increase in the
level of gross margins at processing level for some dairy products in some countries (e.g. UHT milk and
yogurt in France, and liquid milk and butter in Denmark). Milk prices are well documented, and retail
dairy prices are also collected but less systematically. However, wholesale prices for dairy products are
hard to observe and are not collected on a regular basis. This hampers the conduct of a rigorous
statistical analysis of price transmission between intermediate stages in the chain.
Table 6.5 summarises the main characteristics of the payment systems reported by the survey
respondents in the selected Member States where case studies were conducted. In all case, the fat and
protein components of the milk help to determine its price. This implies that, ceteris paribus, changes in
the prices for fat and protein, which are implicit in the prices of derived dairy products such as butter
(fat), SMP (protein), and cheese (fat and protein) should via the payment system induce changes in the
price of raw milk. Moreover, as already stressed above, market measures targeting the prices of butter
and SMP will potentially indirectly influence the milk price. As also stressed, the extent to which this
occurs depends on the relative bargaining strengths of milk producers and milk processors.
The evaluation question asks whether CAP measures have influenced the payment system regarding
links between price and the quantity of milk produced. The answer is negative. A preoccupation of CAP
dairy policy has been the need to achieve market balance by limiting supply, yet the payment system in
many countries rewards producers for larger deliveries because this reduces collection and testing costs.
Incidentally, this premium, which is motivated by the aim of dairies to reduce costs, provides an
incentive for structural change in the milk producing sector, which as explained earlier in the report, is a
policy objective. Thus, there is a positive impact from a market-motivated feature of the payment
system on a policy objective.
The evidence from the surveys on whether the changes in dairy policy since 2003 provoked changes in
payment systems can be broken down into two parts. Milk processors were asked this question directly,
and the answers were almost unanimously negative. The second type of evidence concerns whether the
production decisions of milk producers are in fact influenced by the payment system. A few respondents
said they were influenced by environmental or quality incentives, but there was no evidence that
producers’ decisions were influenced by the elements of the price system that might theoretically
(according to the discussion above) be responsive to policy changes. Thus, if policy changes have not
had an impact on the payment system, and if in any case features of the payment system do not for the
most part influence milk producers’ decisions, then there can be no causality via this link between policy
changes and the performance of the milk-producing sector.

162
Table 6.5 Selected characteristics of pricing for raw milk (apart from fat and protein) in
selected Member States
Country Characteristics
Austria • Premia for special qualities or other criteria like large milk deliveries or low bacteria.
• Prices depend on the quality of milk delivered, the financial situation of the respective
dairies and the costs of collecting milk
Germany
• Additional premiums for special qualities (S-class, GMO-free etc.), larger delivered
quantities and longer delivery intervals
• Four different pricing practices exist:
o Utilisation system: producer prices are calculated according to the gross utilisation
of the processed milk (very common for cooperatives)
o Reference price system: producer prices are based on the average milk prices paid
by other dairies in the same region (common in southern Germany)
o Negotiation system: producer prices are freely negotiated between the dairy and the
milk producer or the milk producer association (only for private dairy companies)
o Spot market (not common)
Italy
• Milk price in Lombardy is considered the reference price for Italy
• The prices are influenced by the cheese market and in particular by PDO/PGI cheese
(for which milk production has to fulfil special criteria)
• Agreements are reached on the trend in prices (this is linked to the ripening period of
the cheese)
• Additional premiums from dairies are paid based on volume of delivered milk
Ireland
• Different prices for manufacturing and liquid milk (whole year fresh milk products)
• About 90% is paid as manufacturing milk
France
• Milk prices depend on collective rules defined at a regional level (Centre Régional
Interprofessionel de l’Economie laitière, CRIEL) and the national level (by the Centre
National Interprofessionel de l’Economie Laitière, CNIEL).
• the CNIEL makes recommendations for the basic price to CRIEL based on indicators of
trends in dairy markets. In the future (decree December 2010), the CNIEL indicators
could serve as references for determining the basic contractual milk price.
• dairies grant premiums to encourage producers to supply milk with certain specific
qualities (in relation to industrial needs).
The Netherlands
• The milk price paid consists of a guaranteed price and a performance premium:
o The guaranteed price is based on a weighted average of milk price paid by other
dairy companies in the Netherlands and neighbouring countries.
o The performance premium is dependent from the profit.
Poland • Special premiums by dairies for: regular quality controls (regular controls of milk
parameters and cow yields, being certified by external organisation), longer delivery
terms, cooling milk or having contract with processor
• Use of endless contracts with 3 months renunciation period
Spain • Special premiums by dairies for: deliveries of higher volumes, fidelity
• Lack of written contracts between farmers and dairies
• Pricing in spot market limited
United Kingdom • Additional premiums for larger deliveries of milk and longer delivery intervals
• Many UK dairies manage their own milk pools, fewer and fewer rely on milk brokers to
supply their milk, and those that do are trying to reduce this dependency. This is
putting considerable pressure on those businesses that still act as milk brokers
• Milk price schedules are detailed and demanding. They spell out quality issues in some
detail, together with collection responsibilities, insurance requirements, etc.
Notes: In all Member States shown, price is also based on fat and protein content. To avoid repetition, this feature is not explicitly included in the table.
Source: Case Studies.
6.6 Price volatility
The questions addressed in this section are (a) whether observed volatility in the milk price increased in the
period after 2003 relative to the period before these changes, and how these differences were distributed
among the Member States, and (b) whether the degree of stability of the EU internal milk price relative
to the world market price decreased after the policy changes that are evaluated in this report.
First, several different indicators are used to assess what happened to price stability in the evaluation
period, which starts at 2003, as compared to a period of similar length before 2003.

163
6.6.1 Statistical analysis
First, we illustrate the price-band methodology, taking Germany as an example. This methodology is
then applied to all Member States in order to compare the pre- and post-2003 periods. For monthly
German data on the producer price for milk, the underlying trend is presented and a price band of ±10%
relative to this trend evolution is drawn. The number of times price falls outside this band, relative to the
total number of observations, is an indicator of the extent of ‘extreme’ price variation.
Figure 6.3 Price-band analysis for Germany
20
25
30
35
40
45
1997
m01
1997
m12
1998
m11
1999
m10
2000
m09
2001
m08
2002
m07
2003
m06
2004
m05
2005
m04
2006
m03
2007
m02
2008
m01
2008
m12
2009
m11
2010
m10
milk
pric
e ce
nt/li
tre
de Trend Plus 10% Minus 10%
Source: own calculations.
Figure 6.4 Results of price-band analysis by sub period for all Member States
0
10
20
30
40
50
60
be cz dk de ee el es fr ie it cy lv lt lu hu nl at pl pt si sk fi se uk
num
ber
of o
bser
vatio
ns o
utsi
de th
e pr
ice
band
97-03 04-10
Notes: 1) The width of the price-band around trend is ± 10%.
2) Data for EU-10 are available only for the second period. For Denmark, Greece and Spain, data were available for the first period but there were no values outside the bands, indicating price stability within the ±10% bounds in these countries in the earlier period.
3) Nominal prices are used (where necessary, conversion to euros used the contemporaneous exchange rate).
Source: own calculations.

164
Figure 6.3 shows the estimated trend line for Germany for 1997-2010 (central solid line). The higher
(dotted) line shows the long-run trend value plus 10%, and the lower (broken) line gives the long-run
trend value minus 10%. There are 9 observations outside the ±10% band between 1997-2003, and 36
observations outside between 2004-2010, clearly illustrating a major increase in producer price volatility
in Germany between the two sub-periods.
The results of applying this analysis to all Member States are presented in Figure 6.4. It is apparent that
there has been wide variation between countries in terms of change in volatility between the two periods.
A large majority of countries showed very substantial increases in volatility, e.g. Germany, Netherlands,
Sweden; however, there were also exceptions, in particular, Belgium, Finland, Italy and the UK.
6.6.2 Coefficient of variation (CV) for producer milk prices
Figure 6.5 reports the coefficients of variation of monthly producer prices for milk at Member State level
for four sub-periods.
Figure 6.5 Coefficient of Variation, EU-15 and EU-10
0
2
4
6
8
10
12
14
16
18
20
BE DK DE EL ES FR IE IT LU NL AT PT FI SE UK CZ EE HU LT LV MT PL SK SI EU15EU10
CV
%
cv 1997-2003 cv 2004-2006 cv 2007-2008 cv 2009-2010
Source: own calculations.
For all EU-15 Member States except Sweden, the coefficient of variation is highest in the period 2007-
2008. In Italy, volatility as measured by the CV is only 10% higher in 2007-2008 than in the period
1997-2003. By contrast, it is more than 4 times as high in Denmark. For the EU-15 average price, the CV
is 130% higher in 2007-2008 than in 1997-2003, and 10% lower in 2004-2006. Eleven of the EU-15
Member States had lower volatility in 2004-2006 than in the previous seven-year period.
The pattern in the Member States of EU-10 is a little different, with four Member States having
volatility as high or higher in the 2009-2010 period, than in the previous period. The coefficients of
variation for Poland, Latvia and Lithuania are among the highest for one of the sub-periods after the
reform, along with those for Belgium, Ireland and the Netherlands.
6.6.3 Annualised Standard Deviation
Figure 6.6 illustrates the annualised standard deviation methodology by applying it to price data for
Denmark and the Czech Republic. These two Member States are chosen as typical examples. The

165
absence of data for the earlier period explains the truncated nature of the Czech series. There is clearly
greater volatility in the later part of the second sub-period, although for Denmark an episode of less
extreme volatility also occurs during 2004.
Figure 6.6 Annualised Standard Deviation (Denmark and Czech Republic)
0
5
10
15
20
25
30
19
98
m0
1
19
99
m0
1
20
00
m0
1
20
01
m0
1
20
02
m0
1
20
03
m0
1
20
04
m0
1
20
05
m0
1
20
06
m0
1
20
07
m0
1
20
08
m0
1
20
09
m0
1
20
10
m0
1
cz dk
Source: own calculations.
Table 6.6 Mean Annualised Standard Deviation, countries of EU-25
1998-2004 2005-2010 % change Belgium 19.9 14.3 -28.2 Czech Republic 9.2 Denmark 6.4 12.4 93.9 Germany 10.1 12.1 20.2 Estonia 9.5 Greece 3.8 6.8 78.2 Spain 4.7 7.5 61.7 France 15.4 20.8 35.5 Ireland 12.9 17.1 32.5 Italy 3.1 6.3 105.3 Cyprus 7.8 Latvia 13.6 Lithuania 18.9 Luxembourg 17.1 14.3 -16.2 Hungary 15.2 Netherlands 17.1 29.1 70.6 Austria 8.8 11.8 33.6 Poland 12.4 Portugal 6.9 12.1 76.7 Slovenia 7.1 Slovakia 13.2 Finland 19.2 17.5 -8.8 Sweden 9.5 13.7 43.5 United Kingdom 19.2 15.1 -21.2
Source: own calculations.
Table 6.6 summarises the mean ASD in the two sub-periods for all Member States of EU-25. These
results confirm that, for the Member States where the comparison can be made, prices in the second
period have generally become more volatile over time, with four exceptions: Belgium, Finland,
Luxembourg and the UK. Whereas the indicators detect increased price volatility, they do not identify the
cause. An important issue is the relationship between the milk price volatility observed within the EU,
166
and the price volatility on global dairy markets in the same period. It raises the questions of whether EU
dairy measures helped to hold domestic price volatility below that observed in world markets, and
whether the relationship between volatility in the two markets shifted after 2003.
A comparison of the volatility in the WMPE and the PMPE between the two periods shows that the CV of
the EU monthly price series increased by 404% in the second period, whereas that of the world market
price equivalent increased by 126% (the ratio of the percentage changes is over 3:1). In the seven years
before end-2003, the CV of the PMPE was only 31% that of the WMPE; however, after end-2003 it was
66% as high. When the average of the annualised standard deviations is compared between EU prices
and world market equivalent prices, and between the two sub-periods, results of a similar order of
magnitude are found: the mean ASD of the EU monthly price series increased by 202% between the two
sub-periods, whereas that of the world market price equivalent increased by 42% (ratio of nearly 5:1).
In the seven years before the start of the evaluation period, the CV of the PMPE was only 34% that of
the WMPE; however, during the evaluation period, it was 76% as high.
The following conclusions can be drawn from these findings:
• Milk price volatility increased in both markets between the two periods, but the increase was much
greater within the EU than on the world market.
• Milk price volatility was nevertheless still less within the EU than that on the world market in the
second sub-period.
• Given the two previous findings, the source of the milk price volatility observed within the EU during the
evaluation period was clearly external (deriving from world market disturbances) but CAP policies after
2003 provided EU markets with less protection from these disruptions than was previously available. As
long as the IMPE is greater than the WMPE, world market price volatility can be smoothed by the
operation of export refunds and the intervention system. When WMPE rises above the IMPE, these
instruments can no longer function in the usual way, and the protection is lost. Thus, there is a
discontinuity at the point where WMPE=IMPE. The lower the intervention price, and the more susceptible
world market prices are to prices surges, then the more likely such conditions are to arise.
If there is good price transmission between processor and producer prices, then one might expect this
switch in the relationship between the domestic and world market prices for basic products to hold for
the milk price also. This is investigated in Figure 6.7.
Figure 6.7 Volatility of the WMPE, PMPE and the EU-15 producer milk price, 1997-2010
0
5
10
15
20
25
30
35
40
45
1998m
01
1999m
01
2000m
01
2001m
01
2002m
01
2003m
01
2004m
01
2005m
01
2006m
01
2007m
01
2008m
01
2009m
01
2010m
01
AS
D
PMPE WMPE EU producer milk price
Source: own calculations.
167
The annualised standard deviations of the PMPE, the WMPE and the monthly milk price received by
producers in EU-15 are depicted. The latter price series was used because a monthly milk producer price
series for EU-25 is available only from January 2003 onwards. It should be recalled that the WMPE and
PMPE are based on the prices of butter and skim milk powder only, whereas the price received by
producers for raw milk depends on the value of milk in all uses, to the extent that this is transmitted
back up the chain to milk producers from the downstream segments.
This figure shows that for most of the period up to 2007, volatility in the producer milk price was higher
than that of the PMPE, suggesting that only part of the stabilising effect of EU policies on the prices of
intervention products was reflected in the producer milk price. Indeed, for most of the period from mid-
2005 to end-2006, the volatility in the EU producer milk price is comparable to that of the WMPE. For
most of the period after 2007, volatility in the producer milk price is significantly higher than in the
previous period, but much less than that based on the milk price equivalents (EU and world market) for
just butter and SMP. The period of about 12 months when the EU PMPE shows more volatility than the
WMPE coincides with the period when world market prices exceeded EU intervention prices. making
export refunds irrelevant. This is also the period of maximum volatility in the producer price for milk. In
summary, the potentially lower protection against externally-generated volatility is due principally to the
lower safety net provided by the intervention system. From 2004 onwards, the intervention prices for
butter and SMP were gradually reduced by 25% and 15% respectively, and the ceiling for butter
intervention was reduced from 70 thousand tonnes in 2004 to 30 thousand tonnes in 2008 and onwards
(the ceiling for SMP remains unchanged at 109 thousand tonnes). In order to stabilise the milk price at
the safety net level as implied by the effective intervention prices for butter and SMP, the Commission
undertook special complementary measures, including an extension of the period and maximum duration
for private storage aid for butter, an extension of the intervention period beyond the normal August
closing date, and buying-in under tender (at prices close to the fixed buying-in price) of significant
quantities in excess of the fixed-price ceiling.42
The public intervention mechanism has trigger prices that act as a threshold below which intervention
purchasing can begin. This mechanism establishes a minimum price floor in the market. However, the
instrument primarily protects against downward price volatility, not against upward price swings. When
stocks have been accumulated in the past, the release of stocks can help to dampen price increases of
dairy products, but this option ceases once stock holdings are exhausted. Therefore, a lower trigger price
and a smaller ‘buffer’ intervention stock holding also reduces the possibility of smoothing sudden upward
price movements. The down-scaling of private storage aids also weakened another potential mechanism
for promoting stability that may have had a non-negligible consequence in a few Member States.
6.7 Conclusions
Prices paid to producers
• The shift of some income support out of price support (by reducing intervention prices beginning in
2004) and into a direct payment, produced a downward shift in the producer milk price for milk up
to the start of 2007. However, during 2007-2008, a continuation of this impact was masked by the
high prices transmitted to the EU milk market from the world commodity price boom.
• The average intervention milk price equivalent fell from about €283/t during 1997-2003 to
approximately €256/t (-9%) in 2004-2006 and to €216.15/t by 2009 (-23.7% relative to 1997-
2003). Thus, the greater reliance on direct payments and the reduction of the public intervention
price to a lower safety net level meant a substantially lower support level for milk prices.
• The milk price equivalent for butter and SMP followed the IMPE downwards during 2004-2006, but
became detached from it during the price boom of 2007-2008. During these years, it was
42 An extra 13 thousand tonnes of butter were taken into private storage during the extended time period, whereas intervention buying-in of butter and SMP effectively stopped in early September and early October, despite the extended open period for intervention. However, during the preceding regular intervention period, an additional 53.222 thousand tonnes of butter was bought into intervention beyond the 30-thousand-tonne fixed-price ceiling, and an additional 178.587 thousand tonnes of SMP was bought in beyond the 109-thousand-tonne fixed-price ceiling. The total quantities of butter and SMP bought into intervention during 2009 represent 4.5% and 27.4%, respectively, of their 2009 production.
168
determined entirely by market forces and was on average 12% above its value in 1997-2003.
During 2009 the milk price equivalent for butter and SMP again reached the intervention milk price
equivalent.
• Prices for butter and SMP were on average supported 90% above world market price levels during
1997-2003, and around 50% above in 2004-2006. In 2007 and 2008, as a result of very high world
market and EU prices, the internal price support offered by EU policies was very low, but at the
same time, EU milk producers received record high prices. In these extreme conditions, the EU dairy
market showed a high degree of integration with the world market, unprecedented since the start of
the CAP. In 2009, EU butter and SMP prices were supported at a level about one-third higher than
the world market price.
In conclusion, the changes to the market intervention measures (abolition of the target milk price, lower
intervention prices and ceilings, scaling down or elimination of private storage aids and internal disposal
aids, and relaxation of quota ceilings) enshrined in the 2003 reform or subsequent modifications
increased the convergence of internal and world market prices. When world market prices rose above the
internal supported price levels in 2007-8, EU market prices followed world market prices closely and the
two markets were quite strongly integrated.
Payment System
• The case study surveys show that the changes in CAP dairy measures did not influence the method
for calculating payments to milk producers. Processor respondents claimed that the payment system
is more or less independent of policy changes, and milk producers reported that their production
decisions are not affected by those particular features of the payment system that might depend on
policy changes. It is concluded that the policy changes under evaluation did not affect the
performance of the milk producing sector via an impact on the payment system.
Price stability
• Volatility increased in both the EU milk price and the world market milk price equivalent after 2003
relative to the preceding period, but the increase was much greater within the EU than on the world
market. Nonetheless, milk price volatility within the EU was still less than that of the world market
equivalent price, even during the world market commodity boom of 2007-8. The experience of milk
price volatility in individual Member States varies considerably. Among the reasons for this are
differences in the product portfolios of Member States (consumer products versus basic commodities
with related differences in price variations), different fat and protein production patterns and the
valuations of these components between countries, heterogeneous milk payments systems,
exchange rate movements (between Members States within and outside the euro zone) and
different milk price setting strategies used by dairies and related organisations in different countries.
• Raw milk prices reached very high levels in 2007-2008, but fell sharply in 2009. Average milk prices
in 2009-2010 relative to 2007-2008 were about 16% lower for EU-15 and 19% lower for EU-10.
• During 2003-2007, CAP measures (export refunds and intervention) provided greater protection
against world market price instability to the price of milk destined for butter and SMP than was
afforded to the producer price for milk averaged over all uses. The source of the milk price volatility
observed within the EU during 2007-9 was external (deriving from world market disturbances and
not internally generated). During the period of high world market prices (2007-2008), although
volatility in the EU producer price for milk was considerably higher than at any time since 1997, it
was less volatile than the EU milk price equivalent based on the prices of butter and SMP. More
details on this issue can be found in the analysis relating to evaluation question 5.
• During 2009, following the 2007-8 price spike, the monthly producer price for milk fell very rapidly
to a level (in nominal terms) that was at least €1.50/100kg lower than any price observed since 1996.
In 2009, the intervention system was complemented by additional measures with the intention of
providing a safety net for producers. However, although the EU milk price was successfully
stabilised at a considerably higher level than the world milk price equivalent of butter and SMP, the
need for adjustments and complementary measures suggest that the normal safety-net system may
not always provide a fully effective reaction to extreme events. Furthermore, given the parallel

169
increase in production costs, the sharp decline in milk price placed considerable pressure on
producers’ margins. This episode showed that setting the parameters of the intervention system
(trigger and buying-in prices, quantity ceilings) for the longer term in a multi-annual perspective
makes it less responsive to unforeseen short-term ‘crises’ where a more effective safety net might
be expected.
In conclusion, the policy measures that have been used in the past to stabilise internal milk prices (public
intervention and export refunds) were unable to perform this role during the demand-led commodity
price boom of 2007-2008 and the price slump that followed in 2009. Their inability to perform this role
has two aspects: as the price gap between internal and world market prices becomes narrower, the
probability that a price surge on the world market will cause world market prices to rise above internal
intervention price levels increases. As long as world market prices are above intervention price levels,
both intervention and flexible export refunds – which essentially are designed to provide a minimum
safety net price – are ineffective for dampening a price boom, and were not designed to perform this role
The second aspect is that, with the intervention system reduced to a lower ‘safety net’ level, a larger
internal price fall is needed than in the past before this stabilisation measure is triggered. Moreover, with
lower intervention ceilings, the effectiveness of intervention as a stabilising measure is more limited
when it has been triggered.
Summary of findings for each indicator, EQ2
Indicator Expected result Evidence found
Price support
Producer price for milk A fall, starting in 2004 and
continuing until 2006-7, was
expected.
The expected changes were found for
the milk price equivalent based on
intervention prices, and for the actual
milk price equivalent based on the
prices producers received for butter
and SMP. For 2007-8, the latter
increased again due to the dominance
of world prices.
Price support Price support was expected to fall
with the same timing as the fall in
the producer price for milk, but less
clear-cut/more erratic, because
price support also depends on
world market prices.
Price support fell after 2003, and by
more than the fall in internal prices
because world market prices were also
rising. Thus, the price gap was
squeezed from both sides.
Payment system
Milk producers’ and
processors’ perceptions of
the impact of policy changes
on the payment system
Evidence was sought without any a
priori expectation of what might be
found.
No change was perceived or signalled
by market participants.
Evidence on price
transmission at first link in
the dairy supply chain
There was no a priori expectation
about whether/how the degree of
price transmission might change as
a response to the policy changes.
The evidence on price transmission is
not unanimous (it depends on the
period studied, the product, and the
Member State). However, available
evidence shows transmission tends to
be weak at the first link in the chain.
Table continues on the next page
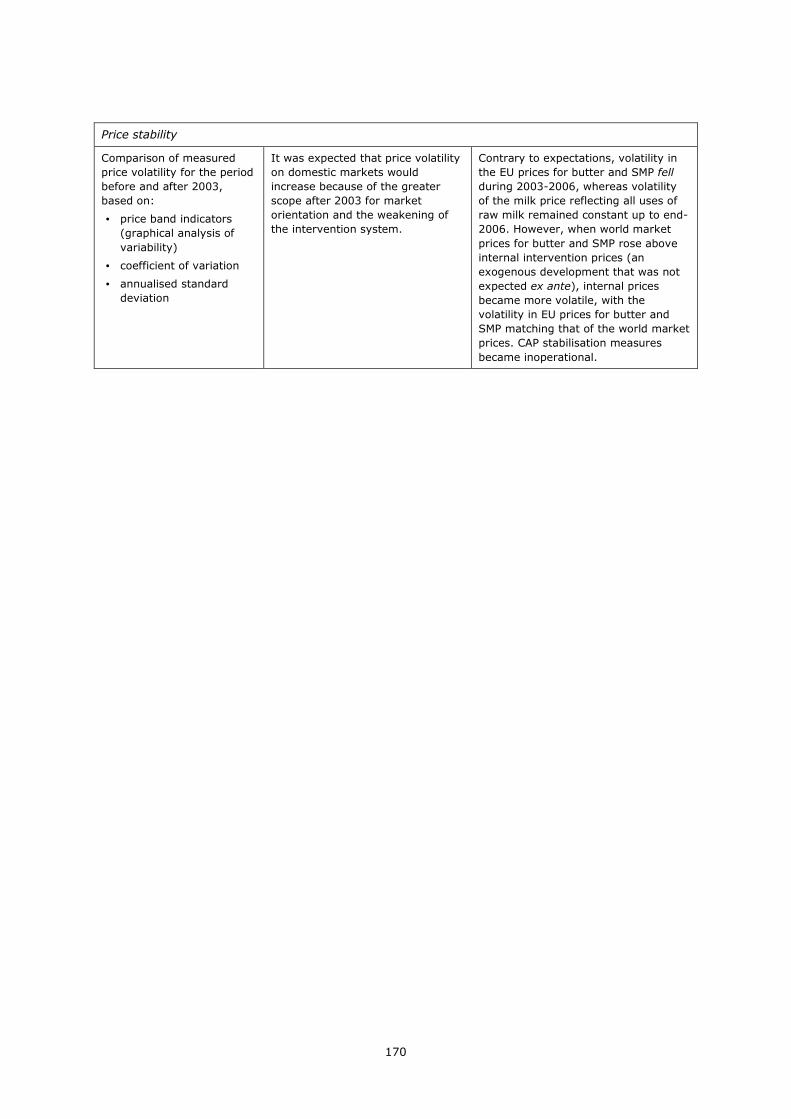
170
Price stability
Comparison of measured
price volatility for the period
before and after 2003,
based on:
• price band indicators
(graphical analysis of
variability)
• coefficient of variation
• annualised standard
deviation
It was expected that price volatility
on domestic markets would
increase because of the greater
scope after 2003 for market
orientation and the weakening of
the intervention system.
Contrary to expectations, volatility in
the EU prices for butter and SMP fell
during 2003-2006, whereas volatility
of the milk price reflecting all uses of
raw milk remained constant up to end-
2006. However, when world market
prices for butter and SMP rose above
internal intervention prices (an
exogenous development that was not
expected ex ante), internal prices
became more volatile, with the
volatility in EU prices for butter and
SMP matching that of the world market
prices. CAP stabilisation measures
became inoperational.

171
7 EQ3: Producers’ income
To what extent have the CAP measures applicable to the dairy sector contributed to maintaining /
increasing the farmers’ income?
7.1 Interpretation and comprehension of the key terms of the EQ3
Focal point of this EQ is the impact of the CAP dairy measures on farmers’ income. As explained in
Chapter 3, both direct and indirect effects have to be considered. CAP policy measures may affect
producer income in a direct way by means of direct producer payments (either being coupled or
decoupled from production). Indirect effects are the impact of CAP policy measures (e.g. setting of
intervention prices) on the farm gate price of raw milk and the way in which policy measures facilitate
structural change in the dairy sector.
Farmers’ income43 can be defined as revenues minus costs (with various specific definitions such as gross
margin, farm net value added, economic profit, etc., which mainly depend on the way costs are taken
into account). One component of farm revenues (which for specialist dairy farms is usually the main
component) is the revenues from milk sales (delivered to dairies or as direct sales). As already became
clear when discussing the impact of the EU’s dairy policy on producer prices (EQ2), the impact of the EU
dairy policy will affect farmers’ revenue (earnings from milk sales). Alongside this first indirect impact of
CAP policy measures on the income of dairy farmers, there is a direct effect coming from the payments a
dairy farmer receives. Payments can be directly related to the dairy activity (coupled payments, such as
the dairy premium before 2007) or be decoupled from the dairy production activity (e.g. the single farm
payment and the single area payment). Even when not attributable to the dairy activity, they have a
direct impact on farmers’ income. This also holds for additional aid to farmers, such as the
complementary national direct payments (CNDPs) that are made to dairy farmers in some of the Member
States that have entered the EU since 2004.
7.2 Methodology used for answering the EQ3
The analysis of the impact of the EU’s dairy policy measures on producer income is structured by first
presenting the developments in income, in particular farm net value added per agricultural work unit and
family farm income per family work unit. The focus of the analysis will be on specialist dairy farms, which
due to their specialization in dairy are the farms most dependent and most likely to be affected by policy
measures applicable to the EU dairy sector or changes therein.44 Non-specialist dairy farms are only
analysed in terms of their income, not in terms of their costs. Farm income is the result of income from
milk and from other products and the decoupled payments. The income indicator resulting depends on
43 Strictly speaking – and as we are evaluating dairy policy – income should be ‘income from dairying’ rather than ‘farm income’. However, it is difficult to separate income from dairying from income from other sources in the data sources we have used, in particular when farms are non-specialist. Although the main focus of this analysis is on specialist dairy farms, an income indicator for other farms with dairy herds will also be provided. With regard to the importance of specialist dairy farms in the total milk supply by Member State, the reader is referred to Figure 5.12. 44 According to the EU-FADN a farm is specialist in a certain activity as two third or more of its total revenues come from that specific activity. With respect to specialist dairy farms (TF 41) the criterion is that ¾ or more of the grazing livestock are dairy cows. In this analysis sometimes a broader definition will be followed (more than 50% of revenues coming from dairy activities) in order to ensure a larger share of the dairy cows in particular in the EU-10 and EU-02 Member States (in addition to the standard specialist dairy farm type (TF 41), occasionally also TF 43 (Cattle dairying, rearing and fattening combined, TF 71 (Mixed livestock, mainly dairying), and TF 81 (Field crops –grazing and livestock combined). See Commission (2010) for further details.

172
the specific margin (farm net value added/tonne45 or family farm income/tonne46) that is used and the
denominator that is used (agricultural work units or family work units). See the equation below:
The income indicators can be further decomposed. Income from milk is equal to the margin per tonne of
milk times the volume of milk produced. In a second step the margin will be further decomposed and
discussed, with a particular focus on specialist dairy farms and the income coming from dairy activities.
EQ3 not only refers to the level of income and its decomposition in terms of revenues and costs, but also
to the maintenance or increase, i.e. the evolution of income of dairy farmers over the evaluation period
(benchmark is income level preceding the evaluation period). In this respect also the evolution of income
of dairy farmers relative to that of other sectors is of importance (benchmark is income evolution in other
sectors of agriculture).
As regards the income decomposition the main focus will be on income coming from milk and on
specialist dairy farms. Since, in particular for specialist dairy farms, the milk margin per tonne plays a
major role, this is further decomposed into milk revenues per tonne and costs per tonne. The total
revenues from milk, include the direct returns on milk (milk price) and the coupled payments (from EU or
national origin). The total costs of production of milk can be decomposed into specific costs, non-specific
costs, depreciation, costs associated with external factors and imputed costs for family factors. Given the
interest to detect the impact of changes in the EU policy measures applicable to the dairy sector, the
decomposition will in particular focus on milk revenues, milk price, and coupled and decoupled payments.
The concepts used and their definitions are given in Table 7.1. Note that in order to have the complete
picture it is not only the milk margin, but also farm scale (volume of milk produced per AWU) that plays
an important role in understanding the income evolution. The latter provides the link between income
evolution and structural change. A separate section is devoted to this, in which also cross-references to
the discussion provided in EQ1.
The income results used are obtained from the EU-FADN database. The results on milk costs and margins
are from the estimation model that was developed in the EU-FADN47 unit of the European Commission.
The model has been slightly modified for this study by the von Thünen Institute in Braunschweig (vTI)
and applied to calculate costs and margins of milk production as well as income shares of dairy farms.
Reallocation of costs to the dairy sector is based on different shares, i.e. share of milk in total output or
share of dairy livestock units within total livestock units. The model only uses data from: specialist dairy
farms (TF 41); cattle dairying and rearing (TF 43); mixed livestock, mainly dairying (TF 71); and field
crops and grazing livestock combined (TF 81). In order to obtain reliable estimates of costs, revenues
and margins related to the dairying activity, special attention will be given to specialist dairy farms.
EU-FADN data for the years 2003 to 200748 are used, in which unbalanced samples of specialist farms
are selected.49 Calculations are based on the level of individual farms. The results are aggregated by
different criteria like Member State, farm size (expressed by the number of dairy cows). Since the
composition of the sample is not the same each year, one should be careful to draw any conclusions from
small changes in variables. When there are there are substantive changes in indicators, however, this
signals changes going beyond re-sampling-effects.
45 Farm net value added is equal to gross farm income (value of output minus total operating costs) less costs of depreciation. 46 Family farm income is equal to farm net value added less the costs associated with external factors (wages, rent and interest paid). 47 For further details about the concepts used see as a reference “European Commission, Agriculture and Rural Development: EU dairy farms report 2010 based on EU FADN”. http://ec.europa.eu/agriculture/rica/pdf/dairy_report_2010.pdf. 48 At the time of model analysis EU FADN data were only available until 2007. 49 Here there are many figures showing evolution over time. However because the data are taken over from EU FADN it could be that the sample changes over time. Whereas in the graphs in this section for convenience sake points are joined, the reader should be aware of the basic nature of the data and that small changes in data over time may be a statistical phenomenon related to the changes in the sample.

173
Table 7.1 Income, margin, revenues and cost concepts
Concept Definition
Income
Farm net value added/
annual work unit
Remuneration to the fixed factors of production (work, land and capital),
whether they be external or family factors. As a result, holdings can be
compared irrespective of their family/non-family nature of the factors of
production employed.
Family Farm Income/FWU
only for farms with family
labour (sub-sample of
farms)
Remuneration to fixed factors of production of the family (work, land and
capital) and remuneration to the entrepreneur’s risks (loss/profit) in the
accounting year per family working unit. Takes into account differences in
the family labour force to be remunerated per holding.
Gross farm income (before
taxes and subsidies)/
annual work unit
Value of output minus intermediate consumption plus balance of current
subsidies and taxes.
Margin
Gross margin over
operating costs/tonne of
milk
Milk and milk products revenues minus specific costs (feed, veterinary…)
and non-specific or other operating costs (upkeep of machinery, energy,
contract work, taxes on land and buildings…) Revenues (Returns)
Raw milk price/tonne of
milk
Ex farm gate price.
Total milk revenues in €/t Includes the value of sales of milk and milk products; the EU dairy
payments (11.81 €/t of quota in 2004, 23.65 €/t in 2005, 35.50 €/t in
2006 until its decoupling; the actual implementation date of the payments
depends on the Member State) and Article 69 payments for dairy (used in
Spain); the possible national dairy payments.50
Coupled payments/tonne of
milk
Payments that are linked to production (e.g. the dairy premium before it
has been decoupled, slaughter premia)
National aids/tonne of milk Payments received from national aid programs, of which the
Complementary National Direct Payments are a part.
Decoupled payments per
farm or per AWU
Payments received by farmers that are not linked to production (e.g. the
dairy premium after it has been decoupled from production, the Single
Farm Payment, the Single Area Payment and Additional Aid )
Costs
Total costs of milk/tonne of
milk
Includes total operating costs plus costs of external factors plus
depreciation plus imputed family factor costs
Specific costs of milk/tonne
of milk
Costs for milk production, covering purchased concentrates, purchased
coarse fodder, farm use of non-fodder crops, specific forage costs, milk
herd renewal costs, the milk levy and other specific livestock costs
(veterinary etc.)
Feed costs/tonne of milk Cost for purchased feed and forage feed
Non-specific costs/tonne of
milk
Includes upkeep of machinery and buildings, power (fuel and electricity),
contract work, taxes and other dues (excluding the milk levy), taxes on
land and buildings, insurance for farm buildings and other direct costs
(including water as regards the model for milk)
50 This means that the value of the calves and of the sales of cull dairy cows is not taken into account, because no satisfactory method has been found to estimate this value on the basis of the current data.

174
7.3 Judgement criteria, indicators and information sources used for each
indicator
In order to assess the contribution of changes in the CAP measures to maintaining and increasing farm
income, an assessment is made of the evolution of two key farm income indicators: Farm Net Value
Added per Annual Work Unit (FNVA/AWU) and Family Farm Income per Family Work Unit (FFI/FWU). The
analysis is primarily done in nominal terms. By this approach the introduction of additional price and cost
changes due to deflating the data by Member State-specific deflators is avoided. For the income indicator
FNVA/AWU, however, real values will also be presented. Where EQ3 refers to ‘maintaining’ or ‘increasing’
farm income, the farm income at the beginning of the evaluation period (2000-2003) will be taken as a
natural reference.
Table 7.2 summarises the indicators, the required data and their sources.
Table 7.2 Indicators, data requirements and information sources for EQ3
Indicator Data requirement Information
sources
Income (dairy
related and
general for
farming)
• Farm Net Value Added for specialist dairy farms per Annual Work Unit
• Farm Family Income/Family Work Unit • Income evolution (Farm Net Value Added per AWU including
coupled and decoupled payments and national aids) of all specialist dairy farms of type TF41 (measured as an index)
• Share of subsidies in gross farm income • Income (measured in terms of Farm Net Value Added) of dairy
farming relative to other agricultural sectors
EU-FADN
Sub-indicator:
milk margins
• Gross margin over operating costs for specialist EU dairy farms by Member State (excluding coupled payments and national aids), in €/t
• Gross margin over operating costs in euro per tonne
EU-FADN
Sub-indicator:
Composition of
costs of
production for
milk
• Specific costs of milk (€/tonne of milk) for specialist dairy farms • Average feed costs (including roughage) in € per tonne of milk for
specialist dairy farms • Non-specific costs of milk production (€/tonne) • Imputed costs (family labour and capital) measured in € per tonne
of milk for specialist dairy farms • Farm herd size and percentage coverage of costs by revenues
EU-FADN
(+ own
calculations)
Sub-indicator:
Milk returns
• Raw milk price as received by specialist dairy farmers in EU-15, EU-10 and EU-02 in the period 2000-2007
• Total milk revenues in €/t • Average coupled payments and national aid receipts per tonne of
milk and per average specialist dairy farm
EU-FADN
Indicator Data requirement Information
sources
Sub-indicator:
Development
in milk farm
size, structure
and
productivity
• Farm herd size • Dairy cows/AWU (EU-15, EU-10, EU-02) • Milk output/AWU (EU-15, EU-10, EU-02)
Eurostat
(FSS), EU-
FADN,
Evidence
from EQ2
Sub-indicator:
payments
• Subsidies to dairying • Dairy premium • Decoupled payment (SFP, SAPS)
EU-FADN
The judgement criteria used to answer EQ3 evaluates the evolution of farm income indicators relative to
this benchmark. When this is not possible (comparable data before 2004 and 2007 are not available for
EU-10 and EU-02, respectively), the judgement will be based on observed trends. The focus will be on
changes in the indicator variables and their causes including linkages with policy changes in the period

175
2003-2007 as compared to 2000-2003. In order to facilitate this analysis a decomposition of income in
terms of sub-indicators margin per tonne of milk and production of milk per annual work unit is made.
Subsequently the milk margin is further decomposed into revenues from milk, subsidies, and costs
(where the latter are decomposed into specific costs, non-specific costs, and other cost categories).
As a second judgement criterion, the farm income earned by specialist dairy farmers (measured in terms
of farm net value added per AWU) is related to a benchmark variable comprising a proxy for the average
evolution of producer income at MS level. This proxy variable is based on income indicators for mainly
specialist (other) farm types. This allows for an evaluation of the income evolution in the dairy sector
relative to that in other agricultural sectors.
A third judgement criterion is the share of direct payments and national aids in farm income, which
provides a measure indicating the importance of direct farm income support, relative to the part of farm
income (revenues from farm produce) which is supported via the milk price. In particular attention will
be paid to what extend direct payments and national aids have contributed to maintain or improve farm
incomes.
7.4 Dairy farm income
7.4.1 Farm net value added per annual work unit (FNVA/AWU)
A first income indicator to measure the economic performance of EU dairy farms is the Farm Net Value
Added per Annual Work Unit (FNVA/AWU). FNVA correspond to total output minus total operating costs
and depreciation. It is the amount available to remunerate labour, land and capital (see the EU dairy
report 2010). This indicator allows holdings to be compared irrespective of the family/non-family nature
of the production factors employed. A second indicator is family farm income per family farm working
unit, where family farm income is the income that remains after all costs and factors are paid except
those for the family workers.
Table 7.3 presents the Farm Net Value Added per Annual Working Unit (FNVA/AWU) for the average
specialist dairy farm by Member State (decoupled payments are excluded). Denmark had the highest
FNVA/AWU between 2000 and 2007, followed by the Netherlands, Belgium, the UK and Luxembourg,
which all have a FNVA/AWU over the whole period that is on average larger than €35,000. Romania has
the lowest average FNVA/AWU (€2,441). Other Member States having a relatively low FNVA/AWU are
Slovakia, Bulgaria, Slovenia, Latvia, Lithuania and Poland (their average FNVA/AWU is below €7,500).51
As can be seen from Table 7.3, the FNVA/AWU increased over the period 2000-2007 in the EU-15 as well
in the EU-10, although the increase is less pronounced for the latter EU region.52 In 2007 there was a
marked increase in the FNVA/AWU. In a following section it will be explained that when decomposing the
milk margin and production of milk, it is shown that even if a producer has a low margin per tonne,
he/she can still have a high income if the quantity produced is large (see Section 7.5). The increase of
the FNVA/AWU was more marked after 2003, which – as will be explained further in Section 7.6 – is to
an important extent related to the increase in coupled payments (dairy premium) received by dairy
farmers.
51 There is not only a wide spread over Member States, but also over farms within Member States. 52 To remind the reader, blank cells in tables denote non available data. Since for Cyprus nearly all values were missing, this Member State has been left out from the Tables.

176
Table 7.3 Farm net value added for specialist dairy farms, €/AWU
2000 2001 2002 2003 2004 2005 2006 2007
Belgium 38,398 42,245 38,398 41,883 38,828 42,155 44,788 55,567
Denmark 44,938 41,200 48,391 49,810 53,849 57,932 70,374 87,705
Germany 27,107 24,449 25,942 24,449 29,153 30,917 34,483 45,561
Greece 13,205 10,943 14,026 12,583
Spain 17,158 21,657 24,224 22,802 29,133 33,207 31,369 34,334
France 22,451 22,260 23,273 21,446 22,566 24,430 24,217 29,394
Ireland 24,116 27,636 25,687 30,590 31,467 33,003 30,445 41,358
Italy 22,972 26,890 30,106 31,132 30,797 41,126 38,921 41,126
Luxembourg 29,972 34,708 32,128 36,034 32,885 34,599 36,815 46,318
Netherlands 48,582 48,307 46,440 47,169 55,509 54,474 55,509 69,329
Austria 13,664 15,994 16,246 13,902 16,046 17,095 20,266 22,489
Portugal 8,366 8,734 10,340 10,426 12,456 12,452 13,409 14,260
Finland 15,674 18,680 18,688 18,680 19,251 18,579 17,424 21,358
Sweden 23,718 19,305 22,829 22,803 21,982 24,607 26,277 33,543
United Kingdom 29,935 39,265 33,695 38,178 36,522 38,178 37,738 49,705
EU-15 24,931 26,632 26,856 26,780 28,838 31,090 32,380 40,155
Czech Republic 9,227 10,317 10,750 12,743
Estonia 8,132 8,638 8,716 12,955
Hungary 9,728 11,026 12,643 13,354
Lithuania 6,911 6,709 5,978 9,011
Latvia 5,412 5,260 6,645 6,181
Malta
Poland 5,486 6,123 7,983 9,761
Slovakia 808 5,596 -1,758 5,133
Slovenia 2,479 4,086 4,407 5,983
EU-10 5,712 6,497 7,627 9,670
Bulgaria 3,255
Romania 2,441
EU-02 2,543
Source: EU-FADN.
Table 7.4 provides information on FNVA/AWU for non-specialist dairy farms. In the EU-15 the FNVA/AWU
for non-specialist dairy farmers was by €3,800 lower (average over 2000-2006) than for specialist dairy
farmers. In the year 2007 the difference became larger (about €8000): specialist dairy farms benefited
relatively more from the high raw milk prices than non-specialist dairy farms. In the EU-15, non-
specialist dairy farms in France and Luxembourg had consistently a higher FNVA/AWU than specialist
dairy farms. For Austria, non-specialist dairy farms did sometimes slightly better and sometimes not. The
FNVA/AWU of the specialist dairy farms of Poland, Slovakia and Slovenia was below the EU-10 average.
Similar to specialist dairy farms, the FNVA/AWU increased as well for the non-specialist dairy farms,
although on average not as quick. This implies that the divergence between specialist and non-specialist
dairy farms increased between 2000 and 2007 (this holds both before and after 2003). An increase in the
trend for the NVA/AWU could also be observed for the non-specialist farms, although less pronounced
than in the case of the specialist dairy farms. This is expected, given that the non-specialist dairy farms
also rely on other agricultural activities than dairy.

177
Table 7.4 Farm net value added for non-specialist dairy farms, €/AWU
2000 2001 2002 2003 2004 2005 2006 2007
Belgium 33,519 34,866 33,088 40,954 38,887 41,428 46,293 53,529
Denmark 42,493 39,279 35,489 41,854 45,670 44,432 67,108 72,077
Germany 24,463 23,693 23,224 23,150 28,862 28,542 30,442 38,464
Greece 8,557 8,305 8,128
Spain 22,887 18,645 25,921 25,343 21,884 19,277 15,253 19,140
France 27,674 27,220 28,295 26,825 27,735 28,801 29,728 37,320
Ireland 19,231 20,633 25,312 25,915 30,654 31,228 28,219 26,768
Italy 16,610 19,692 18,612 20,611 13,359 16,537 19,084 21,962
Luxembourg 38,926 40,863 38,040 38,457 38,131 47,646 41,482 47,911
Netherlands 33,880 32,751 67,226 42,783 44,022 78,324 55,271 61,067
Austria 15,096 16,512 15,935 15,211 16,252 17,950 18,215 21,050
Portugal 4,181 2,182 7,810 4,625 9,328 6,226 11,957 11,721
Finland 19,637 15,224 26,348
Sweden 14,849 15,938 20,209 21,693 14,452 36,576 30,512 26,115
United Kingdom 30,476 34,809 28,370 37,662 33,436 42,276 39,686 47,849
EU-15 22,287 22,955 23,426 23,805 25,247 26,302 26,604 32,145
Czech Republic 9,195 9,621 10,321 12,992
Estonia 7,849 8,253 6,017 13,538
Hungary 10,464 10,565 11,302 14,456
Lithuania 4,700 4,826 4,354 6,600
Latvia 2,959 3,853 4,351 6,014
Malta
Poland 7,810 4,625 9,328 6,226
Slovakia 3,595 5,254 212 6,690
Slovenia 3,916 14,153 3,599 4,726
EU-10 3,992 4,427 4,429 6,362
Bulgaria 2,946
Romania 1,533
EU-02 1,567
Source: EU-FADN.
7.4.2 Family farm income per family work unit (FFI/FWU)
Table 7.5 provides information on the development of family farm income per family working unit
(FFI/FWU) by Member State (including coupled payments, national aids and decoupled payments). As
compared to the NFVA/AWU, this indicator corrects for the external factors that have to be paid and
provides an indicator of how the family workers are remunerated. Member States with a relatively high
family farm income per family worker were Italy, the UK, and the Netherlands (average income was
larger than €30,000 per dairy farm). Note that in the last two countries, the size of the dairy farm
operations is relatively large as compared to most other Member States. Member States with relatively
low incomes were Slovenia, Poland, Latvia, Lithuania and Estonia (average over period 2003-2006 was
less than €10,000). For the EU-15, the general trend in FFI/FWU was positive: for most Member States
family farm income increased over 2000-2007 (exceptions are Finland and Ireland). Note that the
entrepreneurial risk (‘residual’ profits) is part of this income indicator. This implies that fluctuations in
profits affect the family farm income and might add to the fluctuations in this variable. Irrespective of the
observed fluctuations, however, an increasing trend could be still seen for the period 2003 2006 in the
EU-15 Member States. When analysing FFI/FWU in real terms, there was still a general improvement of
income in the period 2003-2006. When evaluating FFI/FWU in real terms, most Member States faced a
limited decline in FFI/FWU for the year 2006 (exceptions are Austria, Belgium, Denmark, Germany and
Finland).

178
Table 7.5 Family farm income per family farm working unit, €
2000 2001 2002 2003 2004 2005 2006 2007
Austria 13,114 15,202 14,628 12,648 13,710 15,563 17,752 19,334
Belgium 25,357 27,934 23,342 26,485 25,914 32,413 33,621 45,339
Denmark 18,608 11,510 12,112 14,796 16,785 23,224 33,522 40,713
Finland 13,824 15,228 16,240 17,072 17,365 16,484 15,017 19,085
France 17,681 16,606 17,228 15,831 16,406 18,208 17,626 21,640
Germany 19,558 18,008 16,794 15,190 20,157 23,422 26,046 38,701
Greece 13,627 11,318 11,738 15,873 19,731
Ireland 21,413 24,639 22,874 26,756 28,573 30,193 25,750 37,815
Italy 20,707 26,316 28,225 29,970 31,990 37,656 43,031 41,557
Luxembourg 26,079 26,123 24,640 29,148 26,630 30,067 31,913 40,843
Netherlands 31,192 28,326 25,092 25,317 27,695 37,441 33,180 44,960
Portugal 7,583 6,783 7,762 9,705 11,174 11,166 11,090 14,037
Spain 14,109 17,987 20,964 20,042 26,815 32,525 29,621 34,829
Sweden 12,815 8,764 10,166 10,327 9,467 16,383 15,269 22,511
United Kingdom 19,907 36,159 24,779 26,854 30,755 34,957 32,451 49,715
EU-15 18,372 19,393 18,439 19,734 21,674 25,693 25,708 33,649
Czech Rep. 9,167 11,974 13,624 16,201
Estonia 11,470 7,723 7,432 10,973
Hungary 15,900 12,197 14,258 16,536
Latvia 5,170 7,098 6,961 7,640
Lithuania 6,840 8,586 8,979 8,548
Malta 16,416 18,268 20,019
Poland 4,323 5,105 6,724 8,425
Slovakia 2,253 -2,099 -4,195 6,293
Slovenia 4,200 7,332 4,190 5,285
EU-10 6,592 8,259 8,471 11,102
Bulgaria 3,255
Romania 2,262
EU-02 3,029
Source: EU-FADN.
7.4.3 Income evolution (nominal and real)
Table 7.6 provides more insights into the evolution of FNVA/AWU (including both the coupled as well as
the decoupled payments) that specialist dairy farmers (TF-41) receive, with rates of change added for
different sub-periods. Although the decoupled payments are not specifically related to the dairy activity,
they are still part of the income a farmer receives. As can be deduced for all Member States in EU-27,
the farm net value added was either preserved or improved as compared to 2003 (index = 1) (and EU-
10 the comparison is with the year 2004). The market disturbance in 2007 created an exceptional
situation, with, relative to previous periods, extreme increases in FNVA/AWU (Italy being an exception).
For the EU-15 the annual growth rate (6.6%) in the period 2003-2006 was higher than that in 2000-
2003. For the EU-10 for the period 20004-2006 a comparable annual growth rate was found (6.3%).
Looking at the growth rates, it turns out that in the EU-15 the increase in farm net value added in
Ireland, Finland, Estonia and Lithuania was negative in the period 2003-2006. Luxembourg, France, and
the UK also showed relatively low income growth rates. As for the EU-10, Estonia, Lithuania and Slovakia
are the countries with declining in farm net value added over the period 2003-2006. Slovakia, Hungary,
Czech Republic and Latvia show relatively high rates of increase in the period 2003-2006.

179
Except for Finland, it holds that the indices presented in Table 7.6 increased faster in the period 2003-
2006 than in period 2000-2003. The year 2007 was influenced by the market disturbance that took place
and which lead to high milk prices (and a decline thereafter, which already started in 2008). All in all, the
performance of the dairy sector during the evaluation period (starting in 2003) was better than in the
preceding period. This is due to the additional payments, which compensated for the decline in the milk
price the farmers faced.
Table 7.6 Income evolution (farm net value added per AWU) of specialist dairy farms (index 2003 = 1)
2000 2001 2002 2003 2004 2005 2006 2007 annual growth rate (%)1
'00-'08 '00-'03 '03-'06 06-'07
Belgium 0.97 1.04 0.92 1.00 0.99 1.17 1.21 1.53 6.75 0.99 6.67 26.4
Denmark 0.89 0.83 0.96 1.00 1.08 1.15 1.43 1.75 10.09 3.85 12.62 22.5
Germany 1.15 1.10 1.06 1.00 1.18 1.30 1.43 1.90 7.42 -4.54 12.54 33.06
Greece 0.85 0.79 0.79 1.00 1.17 5.37 5.4
Spain 0.71 0.90 1.04 1.00 1.34 1.59 1.45 1.71 13.25 11.87 13.19 17.73
France 1.05 1.02 1.06 1.00 1.03 1.12 1.08 1.28 2.88 -1.7 2.73 18.45
Ireland 0.80 0.92 0.86 1.00 1.06 1.11 0.99 1.37 7.97 7.72 -0.27 37.9
Italy 0.74 0.90 0.98 1.00 1.07 1.22 1.37 1.35 9.1 10.79 11.0 -1.08
Luxembourg 0.89 0.93 0.88 1.00 0.89 0.95 1.02 1.26 5.03 3.85 0.59 23.68
Netherlands 1.03 1.02 1.02 1.00 1.04 1.22 1.18 1.47 5.24 -1.01 5.53 25.44
Austria 1.00 1.14 1.11 1.00 1.09 1.21 1.35 1.51 6.06 0.00 10.52 11.85
Portugal 0.90 0.80 0.90 1.00 1.25 1.21 1.20 1.49 7.42 3.54 6.21 24.06
Finland 0.83 0.91 0.97 1.00 1.02 0.99 0.93 1.16 4.92 6.56 -2.25 23.89
Sweden 1.02 0.85 1.01 1.00 0.97 1.20 1.27 1.54 6.06 -0.67 8.16 21.77
UK 0.86 1.15 0.97 1.00 1.07 1.13 1.09 1.43 7.51 5.07 2.79 31.75
EU-15 0.90 0.95 0.96 1.00 1.08 1.19 1.22 1.48 7.3 3.64 6.57 21.51
Czech Rep. 1.00 1.15 1.22 1.41 6.85 15.57
Estonia 1.00 1.00 0.93 1.43 -2.39 53.76
Hungary 1.00 1.14 1.25 1.44 7.72 15.2
Latvia 1.00 1.13 1.24 1.29 7.43 4.03
Lithuania 1.00 1.14 0.97 1.24 -1.01 27.84
Malta 1.00 1.06 1.14 7.55
Poland 1.00 1.20 1.61 1.93 17.2 19.88
Slovakia 1.00 3.57 0.79 5.32 -7.56
Slovenia 1.00 2.63 1.72 2.01 19.81 16.86
EU-10 1.00 1.55 1.2 1.58 6.23 31.79
Notes: 1) Annualized growth rates. For EU-10 growth rate ’04-’06 is used rather than ’03—’06. For EU-02 no evolution could be shown. No changes for Bulgaria and Romania could be detected since there data were included starting from 2007.
Source: EU-FADN.
Whereas in Table 7.6 the income evolution is presented in nominal terms, Table 7.7 shows the income
evolution in real terms (numbers deflated with an agricultural GDP deflator specific for each Member
State). The rates of change differ over Member States and over time. Member States having a relatively
high income improvement in the period 2003-2006 were Slovenia, Poland, Germany, Czech Republic,
and Denmark (the increase of FNVA/AWU was more than 30%). In Finland, Ireland, Luxembourg and
Latvia the real FNVA/AWU (taking into account all subsidy payments) declined in the period 2003-2006.
In the same period in the UK, France and Lithuania the real income (FNVA/AWU) stagnated. For other
Member States it increased. An unexpected increase was Slovakia in the extreme year 2007. Note that
the real FNVA/AWU in 2006 declined as compared to the year 2000 in France, Luxembourg and the
Netherlands; this has also been the case for Estonia, Lithuania and Latvia in comparison to 2004, their
year of entry into the EU.

180
Table 7.7 Income evolution in real terms (index FNVA/AWU, with 2003 = 1)
2000 2001 2002 2003 2004 2005 2006 2007
Austria 1.05 1.18 1.14 1.00 1.08 1.18 1.28 1.41
Belgium 1.03 1.08 0.95 1.00 0.97 1.12 1.13 1.40
Denmark 0.95 0.86 0.97 1.00 1.06 1.10 1.32 1.59
Finland 0.85 0.91 0.96 1.00 1.03 0.98 0.91 1.10
France 1.12 1.07 1.08 1.00 1.02 1.08 1.02 1.18
Germany 1.20 1.14 1.08 1.00 1.19 1.29 1.42 1.84
Greece 0.95 0.85 0.83 1.00 1.08
Ireland 0.91 0.99 0.89 1.00 1.04 1.07 0.92 1.25
Italy 0.80 0.94 1.00 1.00 1.03 1.15 1.27 1.23
Luxembourg 0.97 1.01 0.94 1.00 0.88 0.89 0.89 1.08
Netherlands 1.15 1.08 1.05 1.00 1.03 1.17 1.13 1.39
Portugal 1.00 0.86 0.93 1.00 1.22 1.15 1.11 1.35
Spain 0.81 0.98 1.09 1.00 1.29 1.48 1.28 1.46
Sweden 1.09 0.88 1.03 1.00 0.97 1.20 1.23 1.46
United Kingdom 0.93 1.22 0.99 1.00 1.04 1.07 1.01 1.29
EU-15 0.97 0.99 0.99 1.00 1.06 1.14 1.13 1.34
Czech Republic 1.00 1.16 1.21 1.35
Estonia 1.00 0.95 0.81 1.13
Hungary 1.00 1.12 1.18 1.27
Latvia 1.00 1.02 1.02 0.89
Lithuania 1.00 1.07 0.85 1.00
Malta
Poland 1.00 1.16 1.54 1.79
Slovakia 1.00 3.49 0.75 4.99
Slovenia 1.00 2.58 1.66 1.86
EU-10 1.00 1.57 1.13 1.79
Bulgaria 1.00
Romania 1.00
EU-02 1.00
Source: EU-FADN.
7.4.4 Dairy income relative to incomes of other agricultural sectors
In order to assess the performance of the dairy sector relative to that of other main sectors in EU
agriculture, for each MS the ratio has been calculated of the average farm net value added per dairy
farm over the average farm net value added realized per farm outside dairy. For this the income
evolution in specialist dairy farms (TF 8.5) is compared to a set of non-dairy farm activities (includes
farm types TF 8.1 (Field crops), TF 8.2 (Horticulture), TF 8.3 (Wine), TF 8.4 (Other permanent crops), TF
8.6 (Other grazing livestock), TF 8.7 (Granivore), and TF 8.8 (Mixed farms)). The results are presented
in Table 7.8. Considering the ratios over the period 2000-2007, it is shown that the income evolution in
the dairy sector lagged behind that of other agricultural sectors in Austria (average value is 0.81), France
(0.84) and Finland (0.88). In contrast, the farm net value added achieved in dairying was about twice
that of other types of agriculture in Ireland (2.15) and Portugal (1.97). Also the income of the dairy
sector evolved favourably in the Netherlands (1.44) and Spain (1.40) relative to that of other agricultural
sectors. The performance of the dairy sector relative to the rest of agriculture declined in Denmark,
France, Ireland, Luxembourg and Finland during the sub-period 2003-2006. For most Member States in
the EU-10 the relative income in dairy farming increases in the period 2004-2006, after which it shows a
decline in 2007 (exceptions are Estonia and Latvia). Member States showing an increasing relative
income trend are Germany, Belgium, Spain, the Netherlands and Italy. For most other Member States
the ratio is fluctuating, without a clear trend.

181
Table 7.8 Income of specialist dairy farming relative to other agricultural sectors
(measured in terms of FNVA/AWU)
2000 2001 2002 2003 2004 2005 2006 2007
Austria 0.84 0.84 0.85 0.73 0.74 0.81 0.84 0.81
Belgium 0.90 0.96 0.98 0.89 0.97 1.09 1.02 1.31
Denmark 0.94 0.85 1.37 1.32 1.29 1.16 1.20 1.66
Finland 0.77 0.84 0.82 0.93 0.98 0.93 0.81 0.70
France 0.84 0.80 0.86 0.83 0.83 0.92 0.81 0.81
Germany 1.02 0.98 1.07 0.94 0.95 1.08 1.09 1.30
Greece 1.34 1.25 1.09 1.41 1.48
Ireland 2.05 2.36 1.94 2.05 2.11 2.10 1.83 2.49
Italy 1.51 1.75 1.54 1.47 1.60 1.77 1.89 1.67
Luxembourg 1.01 1.09 1.06 1.26 1.09 1.17 1.19 1.35
Netherlands 1.39 1.21 1.45 1.24 1.45 1.56 1.29 1.83
Portugal 2.30 1.55 1.52 1.68 2.07 2.15 1.67 2.10
Spain 0.79 1.05 1.07 1.05 1.43 1.97 1.64 1.73
Sweden 1.61 1.05 1.15 1.17 1.09 1.13 1.18 0.80
United Kingdom 1.14 1.47 1.03 1.00 1.29 1.22 1.06 1.20
Czech Republic 0.86 0.97 0.92 0.86
Estonia 1.48 1.09 1.00 0.89
Hungary 1.00 1.20 1.27 1.10
Latvia 1.12 1.15 0.91 0.74
Lithuania 1.03 1.19 1.08 0.72
Malta 1.62 1.43 1.39
Poland 1.13 1.33 1.44 1.37
Slovakia 0.31 0.80 1.10 0.74
Slovenia 1.29 2.82 2.71 1.69
Bulgaria 0.88
Romania 1.32 Notes: Dairy farming follows TF8.5; other sectors included are TF8.1, TF8.2, TF8.3, TF8.4, TF8.6, TF8.7 and TF 8.8.
Source: EU-FADN.
7.5 Income from milk
Income from milk is the result of the milk margin times the production of milk. In this section milk
margin and milk production per annual working unit are further discussed.
7.5.1 Milk margin
Table 7.9 provides the gross margins on milk for the average specialist dairy farm by Member State over
the period 2000-2007. Italy, Belgium, Romania, Belgium and Luxembourg are Member States with
relatively high gross margins (average for period 2000-2007 was above €160/t). Slovenia, Estonia,
Finland, Czech Republic, Latvia, Hungary and Slovakia belong to the groups having relatively low gross
margins (average over the period 2000-2007 was less than €100/t). For the period 2004-2007 the
average gross margins in the EU-15 and EU-10 are, respectively, 128.51 and 106.47 euros per tonne
(difference €22.04/tonne of milk).
Except for Spain53, for all other EU-15 Member States the evolution of gross margin showed a declining
pattern since early 2000 (e.g. since 2002 or 2003), with a turning point in 2006, after which in 2007
53 When comparing the economic results of dairy farms based on information from the Farm Accountancy Data Network (FADN) for Spain and Galicia with those obtained from other regional networks in particular with that
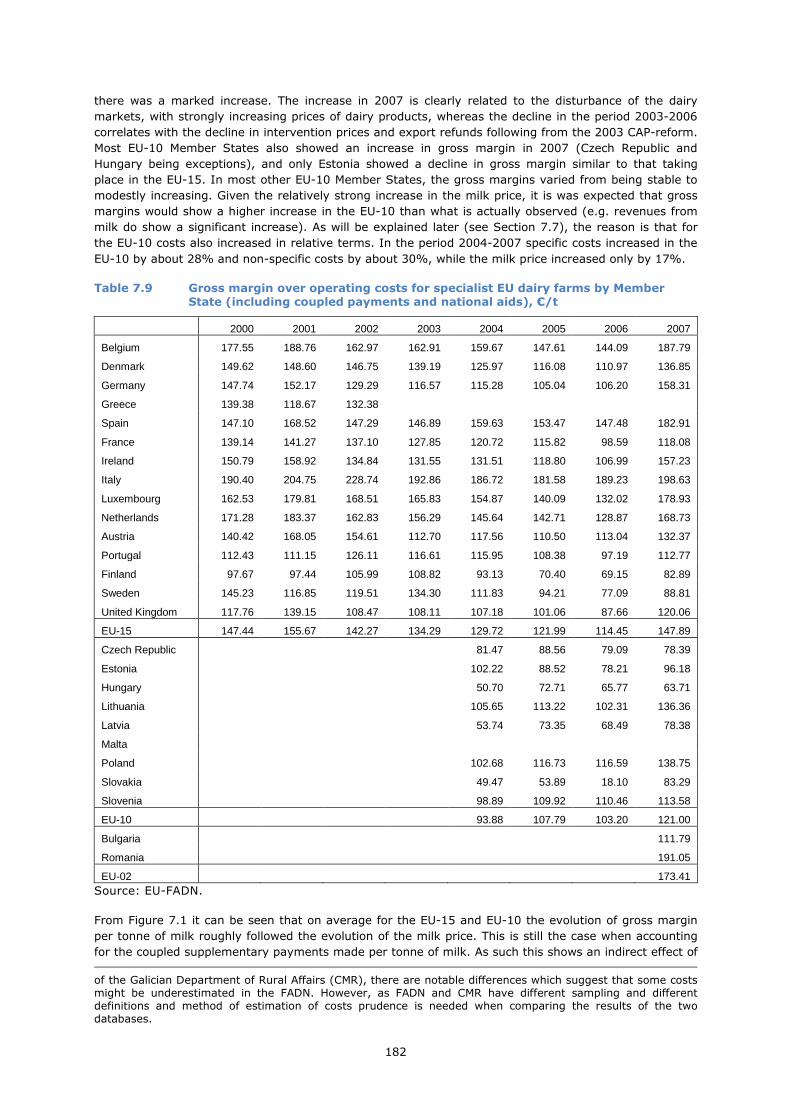
182
there was a marked increase. The increase in 2007 is clearly related to the disturbance of the dairy
markets, with strongly increasing prices of dairy products, whereas the decline in the period 2003-2006
correlates with the decline in intervention prices and export refunds following from the 2003 CAP-reform.
Most EU-10 Member States also showed an increase in gross margin in 2007 (Czech Republic and
Hungary being exceptions), and only Estonia showed a decline in gross margin similar to that taking
place in the EU-15. In most other EU-10 Member States, the gross margins varied from being stable to
modestly increasing. Given the relatively strong increase in the milk price, it is was expected that gross
margins would show a higher increase in the EU-10 than what is actually observed (e.g. revenues from
milk do show a significant increase). As will be explained later (see Section 7.7), the reason is that for
the EU-10 costs also increased in relative terms. In the period 2004-2007 specific costs increased in the
EU-10 by about 28% and non-specific costs by about 30%, while the milk price increased only by 17%.
Table 7.9 Gross margin over operating costs for specialist EU dairy farms by Member State (including coupled payments and national aids), €/t
2000 2001 2002 2003 2004 2005 2006 2007
Belgium 177.55 188.76 162.97 162.91 159.67 147.61 144.09 187.79
Denmark 149.62 148.60 146.75 139.19 125.97 116.08 110.97 136.85
Germany 147.74 152.17 129.29 116.57 115.28 105.04 106.20 158.31
Greece 139.38 118.67 132.38
Spain 147.10 168.52 147.29 146.89 159.63 153.47 147.48 182.91
France 139.14 141.27 137.10 127.85 120.72 115.82 98.59 118.08
Ireland 150.79 158.92 134.84 131.55 131.51 118.80 106.99 157.23
Italy 190.40 204.75 228.74 192.86 186.72 181.58 189.23 198.63
Luxembourg 162.53 179.81 168.51 165.83 154.87 140.09 132.02 178.93
Netherlands 171.28 183.37 162.83 156.29 145.64 142.71 128.87 168.73
Austria 140.42 168.05 154.61 112.70 117.56 110.50 113.04 132.37
Portugal 112.43 111.15 126.11 116.61 115.95 108.38 97.19 112.77
Finland 97.67 97.44 105.99 108.82 93.13 70.40 69.15 82.89
Sweden 145.23 116.85 119.51 134.30 111.83 94.21 77.09 88.81
United Kingdom 117.76 139.15 108.47 108.11 107.18 101.06 87.66 120.06
EU-15 147.44 155.67 142.27 134.29 129.72 121.99 114.45 147.89
Czech Republic 81.47 88.56 79.09 78.39
Estonia 102.22 88.52 78.21 96.18
Hungary 50.70 72.71 65.77 63.71
Lithuania 105.65 113.22 102.31 136.36
Latvia 53.74 73.35 68.49 78.38
Malta
Poland 102.68 116.73 116.59 138.75
Slovakia 49.47 53.89 18.10 83.29
Slovenia 98.89 109.92 110.46 113.58
EU-10 93.88 107.79 103.20 121.00
Bulgaria 111.79
Romania 191.05
EU-02 173.41 Source: EU-FADN.
From Figure 7.1 it can be seen that on average for the EU-15 and EU-10 the evolution of gross margin
per tonne of milk roughly followed the evolution of the milk price. This is still the case when accounting
for the coupled supplementary payments made per tonne of milk. As such this shows an indirect effect of
of the Galician Department of Rural Affairs (CMR), there are notable differences which suggest that some costs might be underestimated in the FADN. However, as FADN and CMR have different sampling and different definitions and method of estimation of costs prudence is needed when comparing the results of the two databases.
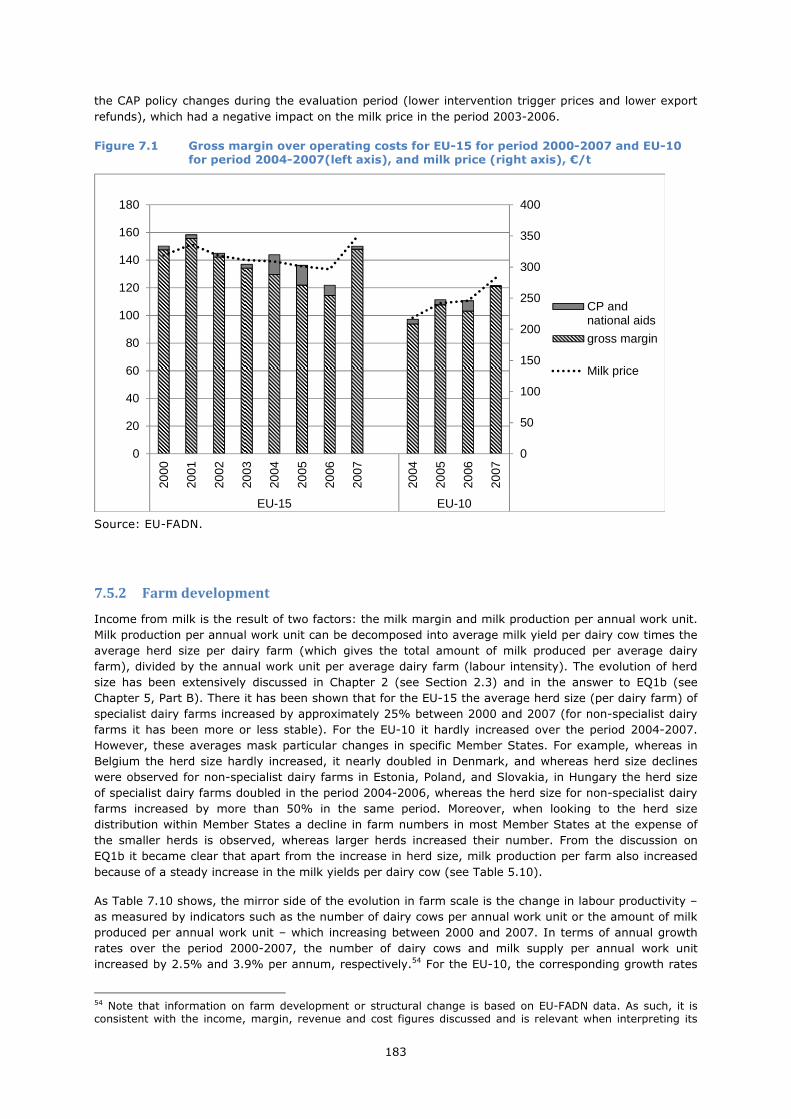
183
the CAP policy changes during the evaluation period (lower intervention trigger prices and lower export
refunds), which had a negative impact on the milk price in the period 2003-2006.
Figure 7.1 Gross margin over operating costs for EU-15 for period 2000-2007 and EU-10 for period 2004-2007(left axis), and milk price (right axis), €/t
0
50
100
150
200
250
300
350
400
0
20
40
60
80
100
120
140
160
180
2000
2001
2002
2003
2004
2005
2006
2007
2004
2005
2006
2007
EU-15 EU-10
CP andnational aids
gross margin
Milk price
Source: EU-FADN.
7.5.2 Farm development
Income from milk is the result of two factors: the milk margin and milk production per annual work unit.
Milk production per annual work unit can be decomposed into average milk yield per dairy cow times the
average herd size per dairy farm (which gives the total amount of milk produced per average dairy
farm), divided by the annual work unit per average dairy farm (labour intensity). The evolution of herd
size has been extensively discussed in Chapter 2 (see Section 2.3) and in the answer to EQ1b (see
Chapter 5, Part B). There it has been shown that for the EU-15 the average herd size (per dairy farm) of
specialist dairy farms increased by approximately 25% between 2000 and 2007 (for non-specialist dairy
farms it has been more or less stable). For the EU-10 it hardly increased over the period 2004-2007.
However, these averages mask particular changes in specific Member States. For example, whereas in
Belgium the herd size hardly increased, it nearly doubled in Denmark, and whereas herd size declines
were observed for non-specialist dairy farms in Estonia, Poland, and Slovakia, in Hungary the herd size
of specialist dairy farms doubled in the period 2004-2006, whereas the herd size for non-specialist dairy
farms increased by more than 50% in the same period. Moreover, when looking to the herd size
distribution within Member States a decline in farm numbers in most Member States at the expense of
the smaller herds is observed, whereas larger herds increased their number. From the discussion on
EQ1b it became clear that apart from the increase in herd size, milk production per farm also increased
because of a steady increase in the milk yields per dairy cow (see Table 5.10).
As Table 7.10 shows, the mirror side of the evolution in farm scale is the change in labour productivity –
as measured by indicators such as the number of dairy cows per annual work unit or the amount of milk
produced per annual work unit – which increasing between 2000 and 2007. In terms of annual growth
rates over the period 2000-2007, the number of dairy cows and milk supply per annual work unit
increased by 2.5% and 3.9% per annum, respectively.54 For the EU-10, the corresponding growth rates
54 Note that information on farm development or structural change is based on EU-FADN data. As such, it is consistent with the income, margin, revenue and cost figures discussed and is relevant when interpreting its
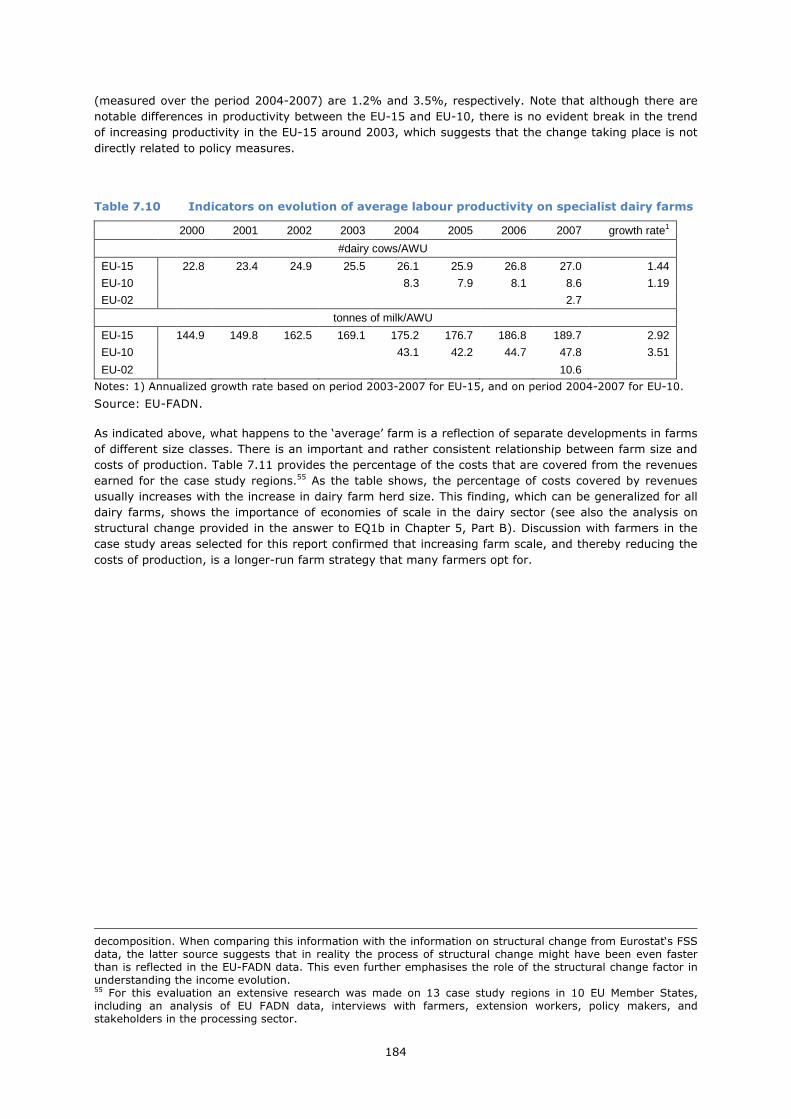
184
(measured over the period 2004-2007) are 1.2% and 3.5%, respectively. Note that although there are
notable differences in productivity between the EU-15 and EU-10, there is no evident break in the trend
of increasing productivity in the EU-15 around 2003, which suggests that the change taking place is not
directly related to policy measures.
Table 7.10 Indicators on evolution of average labour productivity on specialist dairy farms
2000 2001 2002 2003 2004 2005 2006 2007 growth rate1
#dairy cows/AWU
EU-15 22.8 23.4 24.9 25.5 26.1 25.9 26.8 27.0 1.44
EU-10 8.3 7.9 8.1 8.6 1.19
EU-02 2.7
tonnes of milk/AWU
EU-15 144.9 149.8 162.5 169.1 175.2 176.7 186.8 189.7 2.92
EU-10 43.1 42.2 44.7 47.8 3.51
EU-02 10.6
Notes: 1) Annualized growth rate based on period 2003-2007 for EU-15, and on period 2004-2007 for EU-10.
Source: EU-FADN.
As indicated above, what happens to the ‘average’ farm is a reflection of separate developments in farms
of different size classes. There is an important and rather consistent relationship between farm size and
costs of production. Table 7.11 provides the percentage of the costs that are covered from the revenues
earned for the case study regions.55 As the table shows, the percentage of costs covered by revenues
usually increases with the increase in dairy farm herd size. This finding, which can be generalized for all
dairy farms, shows the importance of economies of scale in the dairy sector (see also the analysis on
structural change provided in the answer to EQ1b in Chapter 5, Part B). Discussion with farmers in the
case study areas selected for this report confirmed that increasing farm scale, and thereby reducing the
costs of production, is a longer-run farm strategy that many farmers opt for.
decomposition. When comparing this information with the information on structural change from Eurostat‘s FSS data, the latter source suggests that in reality the process of structural change might have been even faster than is reflected in the EU-FADN data. This even further emphasises the role of the structural change factor in understanding the income evolution. 55 For this evaluation an extensive research was made on 13 case study regions in 10 EU Member States, including an analysis of EU FADN data, interviews with farmers, extension workers, policy makers, and stakeholders in the processing sector.
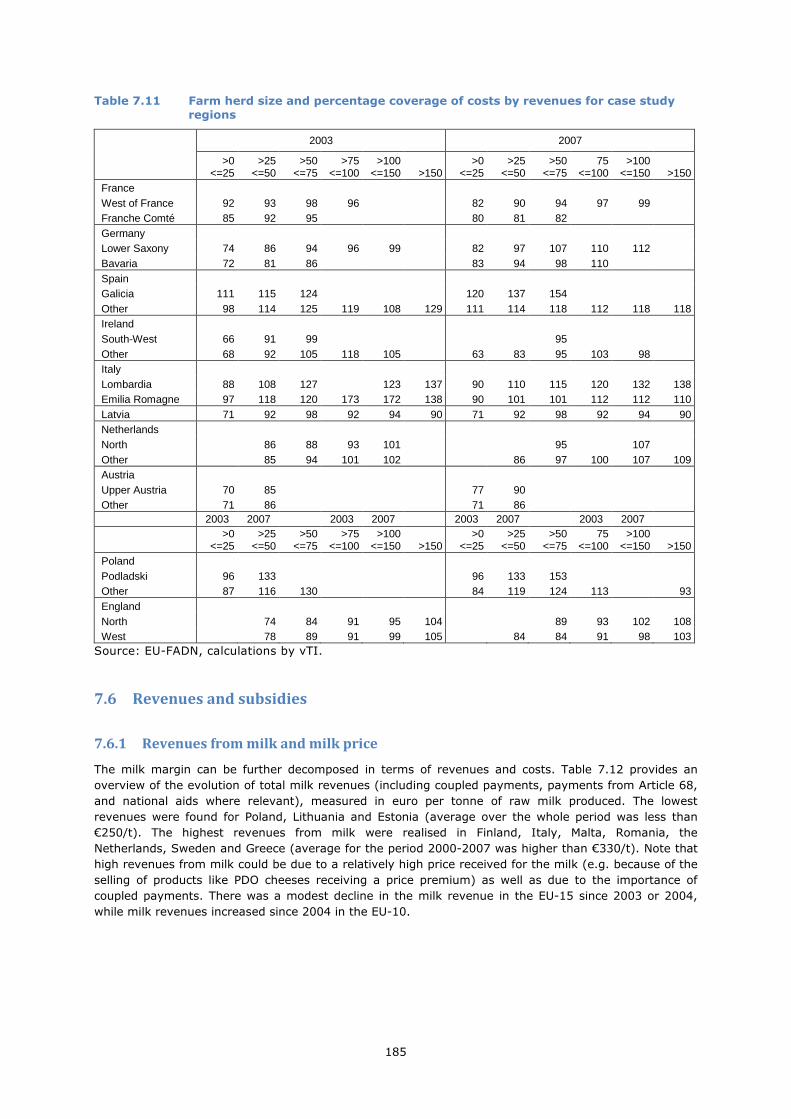
185
Table 7.11 Farm herd size and percentage coverage of costs by revenues for case study
regions
2003 2007
>0 <=25
>25 <=50
>50 <=75
>75 <=100
>100 <=150 >150
>0 <=25
>25 <=50
>50 <=75
75 <=100
>100 <=150 >150
France West of France 92 93 98 96 82 90 94 97 99 Franche Comté 85 92 95 80 81 82 Germany Lower Saxony 74 86 94 96 99 82 97 107 110 112 Bavaria 72 81 86 83 94 98 110 Spain Galicia 111 115 124 120 137 154 Other 98 114 125 119 108 129 111 114 118 112 118 118 Ireland South-West 66 91 99 95 Other 68 92 105 118 105 63 83 95 103 98 Italy Lombardia 88 108 127 123 137 90 110 115 120 132 138 Emilia Romagne 97 118 120 173 172 138 90 101 101 112 112 110 Latvia 71 92 98 92 94 90 71 92 98 92 94 90 Netherlands North 86 88 93 101 95 107 Other 85 94 101 102 86 97 100 107 109 Austria Upper Austria 70 85 77 90 Other 71 86 71 86 2003 2007 2003 2007 2003 2007 2003 2007
>0 <=25
>25 <=50
>50 <=75
>75 <=100
>100 <=150 >150
>0 <=25
>25 <=50
>50 <=75
75 <=100
>100 <=150 >150
Poland Podladski 96 133 96 133 153 Other 87 116 130 84 119 124 113 93 England North 74 84 91 95 104 89 93 102 108 West 78 89 91 99 105 84 84 91 98 103
Source: EU-FADN, calculations by vTI.
7.6 Revenues and subsidies
7.6.1 Revenues from milk and milk price
The milk margin can be further decomposed in terms of revenues and costs. Table 7.12 provides an
overview of the evolution of total milk revenues (including coupled payments, payments from Article 68,
and national aids where relevant), measured in euro per tonne of raw milk produced. The lowest
revenues were found for Poland, Lithuania and Estonia (average over the whole period was less than
€250/t). The highest revenues from milk were realised in Finland, Italy, Malta, Romania, the
Netherlands, Sweden and Greece (average for the period 2000-2007 was higher than €330/t). Note that
high revenues from milk could be due to a relatively high price received for the milk (e.g. because of the
selling of products like PDO cheeses receiving a price premium) as well as due to the importance of
coupled payments. There was a modest decline in the milk revenue in the EU-15 since 2003 or 2004,
while milk revenues increased since 2004 in the EU-10.
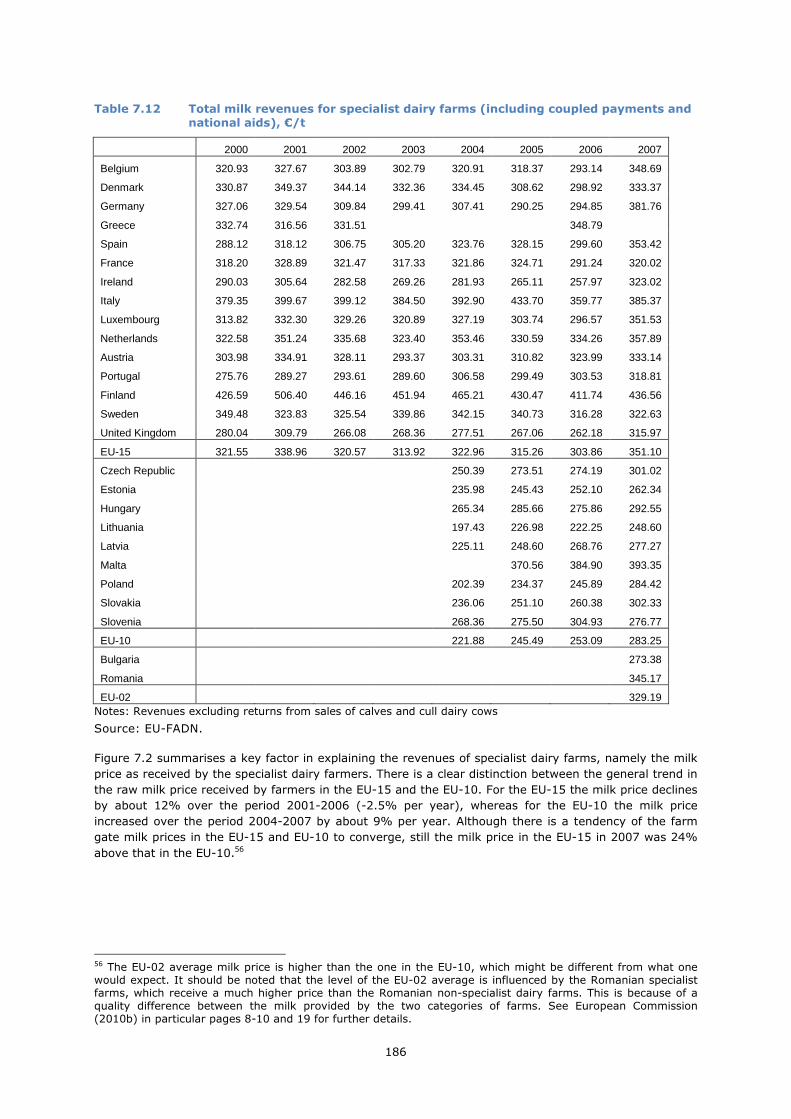
186
Table 7.12 Total milk revenues for specialist dairy farms (including coupled payments and
national aids), €/t
2000 2001 2002 2003 2004 2005 2006 2007
Belgium 320.93 327.67 303.89 302.79 320.91 318.37 293.14 348.69
Denmark 330.87 349.37 344.14 332.36 334.45 308.62 298.92 333.37
Germany 327.06 329.54 309.84 299.41 307.41 290.25 294.85 381.76
Greece 332.74 316.56 331.51 348.79
Spain 288.12 318.12 306.75 305.20 323.76 328.15 299.60 353.42
France 318.20 328.89 321.47 317.33 321.86 324.71 291.24 320.02
Ireland 290.03 305.64 282.58 269.26 281.93 265.11 257.97 323.02
Italy 379.35 399.67 399.12 384.50 392.90 433.70 359.77 385.37
Luxembourg 313.82 332.30 329.26 320.89 327.19 303.74 296.57 351.53
Netherlands 322.58 351.24 335.68 323.40 353.46 330.59 334.26 357.89
Austria 303.98 334.91 328.11 293.37 303.31 310.82 323.99 333.14
Portugal 275.76 289.27 293.61 289.60 306.58 299.49 303.53 318.81
Finland 426.59 506.40 446.16 451.94 465.21 430.47 411.74 436.56
Sweden 349.48 323.83 325.54 339.86 342.15 340.73 316.28 322.63
United Kingdom 280.04 309.79 266.08 268.36 277.51 267.06 262.18 315.97
EU-15 321.55 338.96 320.57 313.92 322.96 315.26 303.86 351.10
Czech Republic 250.39 273.51 274.19 301.02
Estonia 235.98 245.43 252.10 262.34
Hungary 265.34 285.66 275.86 292.55
Lithuania 197.43 226.98 222.25 248.60
Latvia 225.11 248.60 268.76 277.27
Malta 370.56 384.90 393.35
Poland 202.39 234.37 245.89 284.42
Slovakia 236.06 251.10 260.38 302.33
Slovenia 268.36 275.50 304.93 276.77
EU-10 221.88 245.49 253.09 283.25
Bulgaria 273.38
Romania 345.17
EU-02 329.19 Notes: Revenues excluding returns from sales of calves and cull dairy cows
Source: EU-FADN.
Figure 7.2 summarises a key factor in explaining the revenues of specialist dairy farms, namely the milk
price as received by the specialist dairy farmers. There is a clear distinction between the general trend in
the raw milk price received by farmers in the EU-15 and the EU-10. For the EU-15 the milk price declines
by about 12% over the period 2001-2006 (-2.5% per year), whereas for the EU-10 the milk price
increased over the period 2004-2007 by about 9% per year. Although there is a tendency of the farm
gate milk prices in the EU-15 and EU-10 to converge, still the milk price in the EU-15 in 2007 was 24%
above that in the EU-10.56
56 The EU-02 average milk price is higher than the one in the EU-10, which might be different from what one would expect. It should be noted that the level of the EU-02 average is influenced by the Romanian specialist farms, which receive a much higher price than the Romanian non-specialist dairy farms. This is because of a quality difference between the milk provided by the two categories of farms. See European Commission (2010b) in particular pages 8-10 and 19 for further details.

187
Figure 7.2 Raw milk price as received by specialist dairy farmers in EU-15, EU-10 and EU-
02 in the period 2000-2007, €/t
150
200
250
300
350
400
2000 2001 2002 2003 2004 2005 2006 2007
EU-15
EU-10
EU-2
Source: EU-FADN.
7.6.2 Coupled direct payments and national aid
The milk revenues presented in Table 7.12 include the revenues from EU coupled payments and national
aids. EU coupled payments refer to the dairy premium before it is being decoupled and also include
payments based on Article 69.57 National aids consist of various elements, including the coupled
Complementary National Direct Payments (for the EU-10)58, and additional payments for milk producers
(paid from the national envelope), as well as other kinds of state support if any.59 In total the
contribution of these payments varies between 2% and 7% of the raw milk price. Table 7.13 provides
details about the composition of these supplementary payments. Their importance gradually declined
over 2000 and 2007 for the EU-15, which is mainly due to the conversion of coupled payments (no later
than in 2007) into a decoupled payment (inclusion of the dairy premium in the single farm payment or
single area payment).60 Farmers then still receive direct payments, but these can be no longer linked to
milk production. As was noted earlier in Chapter 2 (see Section 2.4), the dairy premium was €8.15 per
tonne for the calendar year 2004, €16.31 per tonne for the calendar year 2005, and €24.49 per tonne for
the calendar years 2006 and 2007. Direct payments in the EU-10 increased after 2004, reflecting that
they are gradually phased in.
During the period 2005-2008 Hungary, Lithuania, Latvia and Slovenia (the latter only during 2005 and
2006) paid coupled Complementary National Direct Payments to their dairy farmers. The height of these
payments was equivalent with 3% to 15% of the milk price received.
Table 7.14 provides an overview of the subsidies specifically related to dairying, expressed in euro per
average specialist dairy farm.
57 The actual implementation date of decoupling the payments depends on the Member State. Article 69 payments for dairy were only used Spain. 58 EU-10 Member States applying CNDPs are Malta, Latvia, Hungary, Lithuania and Slovenia. Of the EU2 also Romania uses national aids. 59 In particular Finland applies such other national aids under the Articles 141 and 142 of the Act of Accession. In 2007 a new scheme of national aids was negotiated, which allows Finland to continue its national aids to the dairy sector till 2013 (European Commission, 2008). 60 See next Section on subsidies to dairying for more details on the dairy premium and information at Member State level.

188
Table 7.13 Average coupled payments and national aid receipts per tonne of milk and per
average specialist dairy farm
2000 2001 2002 2003 2004 2005 2006 2007 Coupled payments (€/t)
EU-15 0.00 0.00 0.00 0.00 11.00 11.80 5.40 0.10
EU-10 2.00 5.90 10.50 0.00
EU-02 0.00
Coupled payments (€/average farm)
EU-15 0.00 0.00 0.00 0.00 3499.75 3845.00 1911.53 50.59
EU-10 184.12 521.57 1024.17 0.00
EU-02 0.00
National aid (€/t)
EU-15 2.70 2.70 2.60 2.70 3.10 2.40 2.00 1.90
EU-10 3.30 3.20 6.90 0.70
EU-02 12.80
National aid (€/average farm)
EU-15 704.44 725.96 755.27 817.90 985.65 781.40 709.10 690.15
EU-10 298.09 282.98 672.21 68.19
EU-02 255.63
Source: EU-FADN.
Table 7.14 Subsidies with regard to dairy activity, €/farm
2000 2001 2002 2003 2004 2005 2006 2007
Belgium 0 0 0 0 3,427 6,888 0 0
Denmark 0 0 0 0 8,021 0 0 0
Germany 0 0 0 0 3,207 0 0 0
Greece 0 0 0 0 0 0 4,824 0
Spain 3 19 26 0 5,346 5,026 159 125
France 0 0 0 0 2,944 5,863 0 0
Ireland 0 0 0 25 2,727 7 3 0
Italy 0 0 0 0 3,205 6,208 0 0
Luxembourg 0 0 0 0 3,063 0 0 0
Netherlands 0 0 0 0 6,073 12,399 18,591 0
Austria 0 0 0 0 961 1,959 3,106 0
Portugal 561 496 328 568 3,085 3,601 6,177 2,410
Finland 12,796 13,810 15,182 15,643 20,951 21,156 15,919 16,141
Sweden 0 0 0 0 4,168 5,706 1,0035 0
United Kingdom 0 0 0 0 6,567 0 0 0
EU-15 679 712 687 722 4,370 4,356 2,646 753
Czech Republic 0 0 0 0 0 0 0 0
Estonia 0 0 0 0 0 0 4,745 0
Hungary 0 0 0 0 1,195 2,986 7,322 0
Lithuania 0 0 0 0 578 724 748 0
Latvia 0 0 0 0 2,220 1465 2103 540
Malta 0 0 0 0 0 12952 17588 11766
Poland 0 0 0 0 0 0 0 0
Slovakia 0 0 0 0 0 0 0 0
Slovenia 0 0 0 0 616 1208 2468 0
EU-10 0 0 0 0 307 440 735 57
Bulgaria 0 0 0 0 0 0 0 185
Romania 0 0 0 0 0 0 0 294
EU-02 0 0 0 0 0 0 0 281 Source: EU-FADN.
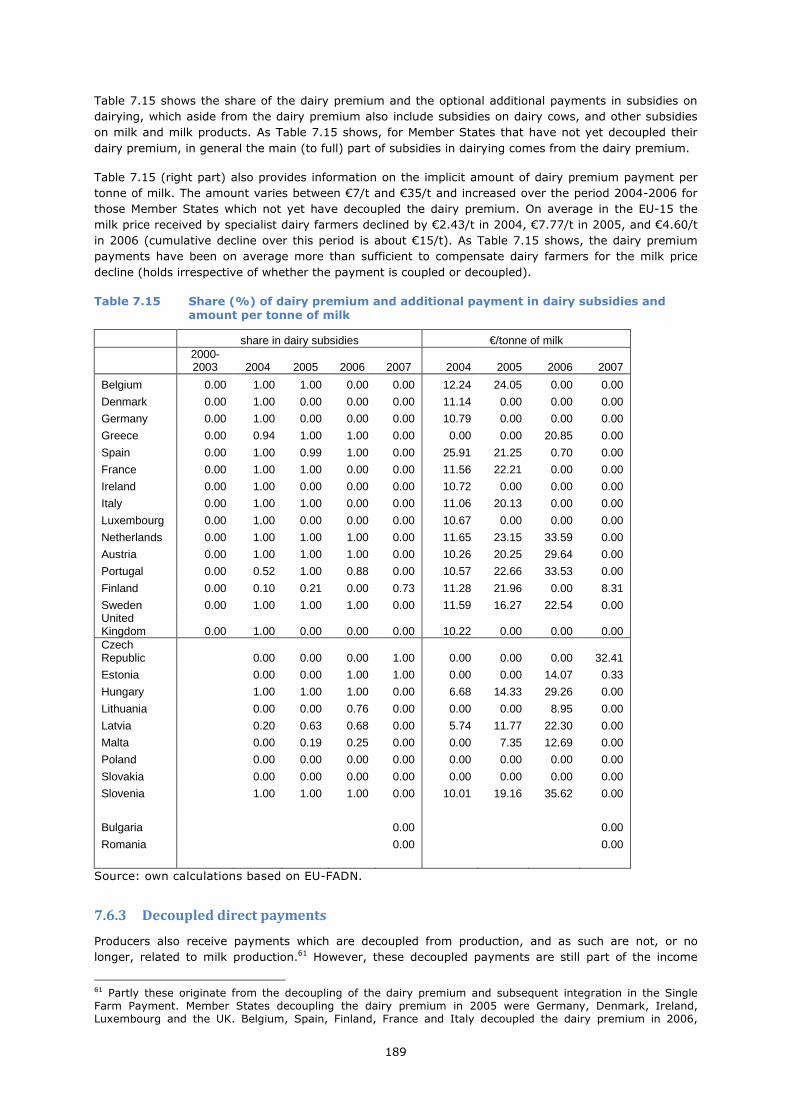
189
Table 7.15 shows the share of the dairy premium and the optional additional payments in subsidies on
dairying, which aside from the dairy premium also include subsidies on dairy cows, and other subsidies
on milk and milk products. As Table 7.15 shows, for Member States that have not yet decoupled their
dairy premium, in general the main (to full) part of subsidies in dairying comes from the dairy premium.
Table 7.15 (right part) also provides information on the implicit amount of dairy premium payment per
tonne of milk. The amount varies between €7/t and €35/t and increased over the period 2004-2006 for
those Member States which not yet have decoupled the dairy premium. On average in the EU-15 the
milk price received by specialist dairy farmers declined by €2.43/t in 2004, €7.77/t in 2005, and €4.60/t
in 2006 (cumulative decline over this period is about €15/t). As Table 7.15 shows, the dairy premium
payments have been on average more than sufficient to compensate dairy farmers for the milk price
decline (holds irrespective of whether the payment is coupled or decoupled).
Table 7.15 Share (%) of dairy premium and additional payment in dairy subsidies and amount per tonne of milk
share in dairy subsidies €/tonne of milk
2000-2003 2004 2005 2006 2007 2004 2005 2006 2007
Belgium 0.00 1.00 1.00 0.00 0.00 12.24 24.05 0.00 0.00
Denmark 0.00 1.00 0.00 0.00 0.00 11.14 0.00 0.00 0.00
Germany 0.00 1.00 0.00 0.00 0.00 10.79 0.00 0.00 0.00
Greece 0.00 0.94 1.00 1.00 0.00 0.00 0.00 20.85 0.00
Spain 0.00 1.00 0.99 1.00 0.00 25.91 21.25 0.70 0.00
France 0.00 1.00 1.00 0.00 0.00 11.56 22.21 0.00 0.00
Ireland 0.00 1.00 0.00 0.00 0.00 10.72 0.00 0.00 0.00
Italy 0.00 1.00 1.00 0.00 0.00 11.06 20.13 0.00 0.00
Luxembourg 0.00 1.00 0.00 0.00 0.00 10.67 0.00 0.00 0.00
Netherlands 0.00 1.00 1.00 1.00 0.00 11.65 23.15 33.59 0.00
Austria 0.00 1.00 1.00 1.00 0.00 10.26 20.25 29.64 0.00
Portugal 0.00 0.52 1.00 0.88 0.00 10.57 22.66 33.53 0.00
Finland 0.00 0.10 0.21 0.00 0.73 11.28 21.96 0.00 8.31
Sweden 0.00 1.00 1.00 1.00 0.00 11.59 16.27 22.54 0.00 United Kingdom 0.00 1.00 0.00 0.00 0.00 10.22 0.00 0.00 0.00 Czech Republic 0.00 0.00 0.00 1.00 0.00 0.00 0.00 32.41
Estonia 0.00 0.00 1.00 1.00 0.00 0.00 14.07 0.33
Hungary 1.00 1.00 1.00 0.00 6.68 14.33 29.26 0.00
Lithuania 0.00 0.00 0.76 0.00 0.00 0.00 8.95 0.00
Latvia 0.20 0.63 0.68 0.00 5.74 11.77 22.30 0.00
Malta 0.00 0.19 0.25 0.00 0.00 7.35 12.69 0.00
Poland 0.00 0.00 0.00 0.00 0.00 0.00 0.00 0.00
Slovakia 0.00 0.00 0.00 0.00 0.00 0.00 0.00 0.00
Slovenia 1.00 1.00 1.00 0.00 10.01 19.16 35.62 0.00
Bulgaria 0.00 0.00
Romania 0.00 0.00
Source: own calculations based on EU-FADN.
7.6.3 Decoupled direct payments
Producers also receive payments which are decoupled from production, and as such are not, or no
longer, related to milk production.61 However, these decoupled payments are still part of the income
61 Partly these originate from the decoupling of the dairy premium and subsequent integration in the Single Farm Payment. Member States decoupling the dairy premium in 2005 were Germany, Denmark, Ireland, Luxembourg and the UK. Belgium, Spain, Finland, France and Italy decoupled the dairy premium in 2006,
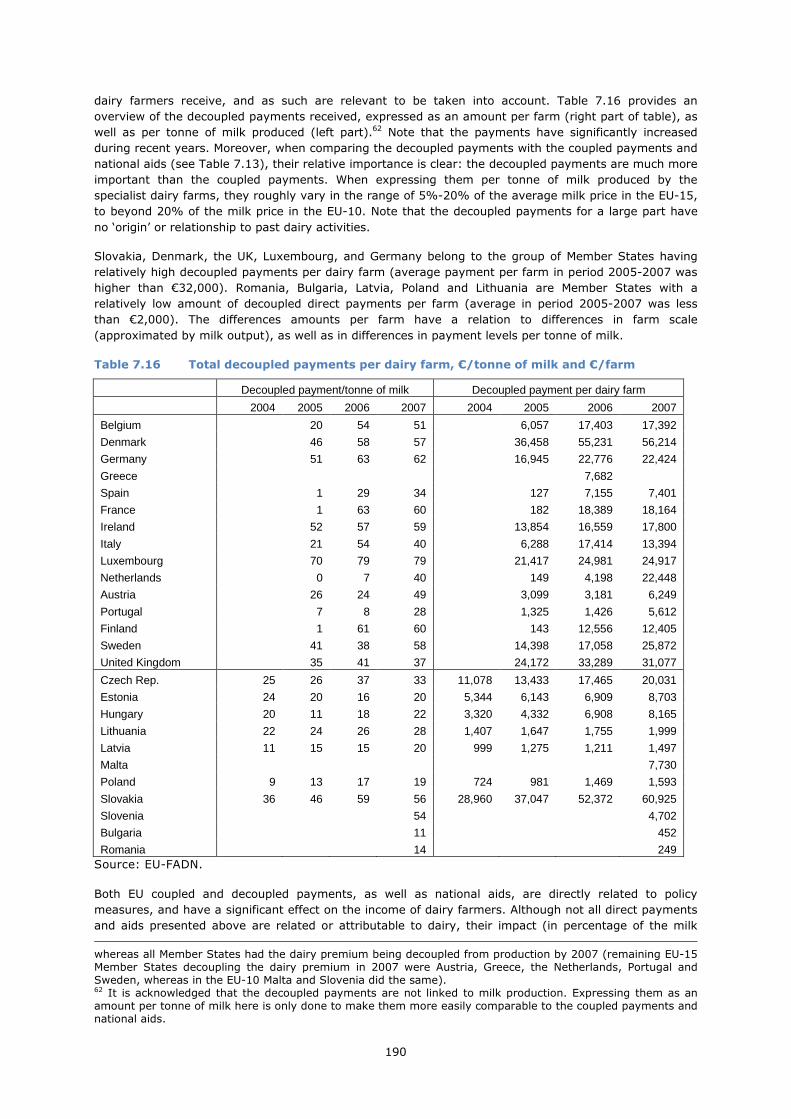
190
dairy farmers receive, and as such are relevant to be taken into account. Table 7.16 provides an
overview of the decoupled payments received, expressed as an amount per farm (right part of table), as
well as per tonne of milk produced (left part).62 Note that the payments have significantly increased
during recent years. Moreover, when comparing the decoupled payments with the coupled payments and
national aids (see Table 7.13), their relative importance is clear: the decoupled payments are much more
important than the coupled payments. When expressing them per tonne of milk produced by the
specialist dairy farms, they roughly vary in the range of 5%-20% of the average milk price in the EU-15,
to beyond 20% of the milk price in the EU-10. Note that the decoupled payments for a large part have
no ‘origin’ or relationship to past dairy activities.
Slovakia, Denmark, the UK, Luxembourg, and Germany belong to the group of Member States having
relatively high decoupled payments per dairy farm (average payment per farm in period 2005-2007 was
higher than €32,000). Romania, Bulgaria, Latvia, Poland and Lithuania are Member States with a
relatively low amount of decoupled direct payments per farm (average in period 2005-2007 was less
than €2,000). The differences amounts per farm have a relation to differences in farm scale
(approximated by milk output), as well as in differences in payment levels per tonne of milk.
Table 7.16 Total decoupled payments per dairy farm, €/tonne of milk and €/farm
Decoupled payment/tonne of milk Decoupled payment per dairy farm
2004 2005 2006 2007 2004 2005 2006 2007
Belgium 20 54 51 6,057 17,403 17,392
Denmark 46 58 57 36,458 55,231 56,214
Germany 51 63 62 16,945 22,776 22,424
Greece 7,682
Spain 1 29 34 127 7,155 7,401
France 1 63 60 182 18,389 18,164
Ireland 52 57 59 13,854 16,559 17,800
Italy 21 54 40 6,288 17,414 13,394
Luxembourg 70 79 79 21,417 24,981 24,917
Netherlands 0 7 40 149 4,198 22,448
Austria 26 24 49 3,099 3,181 6,249
Portugal 7 8 28 1,325 1,426 5,612
Finland 1 61 60 143 12,556 12,405
Sweden 41 38 58 14,398 17,058 25,872
United Kingdom 35 41 37 24,172 33,289 31,077
Czech Rep. 25 26 37 33 11,078 13,433 17,465 20,031
Estonia 24 20 16 20 5,344 6,143 6,909 8,703
Hungary 20 11 18 22 3,320 4,332 6,908 8,165
Lithuania 22 24 26 28 1,407 1,647 1,755 1,999
Latvia 11 15 15 20 999 1,275 1,211 1,497
Malta 7,730
Poland 9 13 17 19 724 981 1,469 1,593
Slovakia 36 46 59 56 28,960 37,047 52,372 60,925
Slovenia 54 4,702
Bulgaria 11 452
Romania 14 249 Source: EU-FADN.
Both EU coupled and decoupled payments, as well as national aids, are directly related to policy
measures, and have a significant effect on the income of dairy farmers. Although not all direct payments
and aids presented above are related or attributable to dairy, their impact (in percentage of the milk
whereas all Member States had the dairy premium being decoupled from production by 2007 (remaining EU-15 Member States decoupling the dairy premium in 2007 were Austria, Greece, the Netherlands, Portugal and Sweden, whereas in the EU-10 Malta and Slovenia did the same). 62 It is acknowledged that the decoupled payments are not linked to milk production. Expressing them as an amount per tonne of milk here is only done to make them more easily comparable to the coupled payments and national aids.

191
price) is so large that – when considered altogether – they are able to compensate for an equivalent milk
price decline varying between 5% to 25%. The importance of the payments in income was already
discussed in a previous section.
7.6.4 Contribution of subsidies to income
In order to see the importance of all subsidies (including coupled as well as decoupled payments), Table
7.17 gives their share in gross farm income (before taxes and superlevies). The role of subsidies in
farmers’ gross farm income substantially increased since 2003. There was already an increase in the
period 2000-2003, but after 2003 the trend changed into one with a stronger increase. This is clearly
related to the policy changes with respect to the direct payments, because payments were increased
since 2000 (e.g. dairy premium) in parallel to a gradual decrease in the milk intervention price. An
exception was 2007, when shares tended to go down, mainly due to an increase in gross income, while
the total amount of subsidies per farm could go up or down. Finland is the EU Member State with the
highest subsidy share (average over period 2003-2006 was approximately 50%, because of the high
level of national aids). Other Member States with relatively high subsidy shares (i.e. average for period
2003-2006 above 40%) are Latvia, Slovakia, Czech Republic, Sweden, Austria and Luxembourg. The
Member State with the lowest share of subsidies in gross farm income is Italy, followed by the
Netherlands and Spain (the average share over the period 2003-2006 is less than 15%).
Table 7.17 Share (%) of subsidies in gross income of specialist dairy farms (before taxes and levies)
2000 2001 2002 2003 2004 2005 2006 2007 Austria 32.2 35.6 35.8 42.4 44.5 43.8 42.0 38.1 Belgium 11.3 14.2 14.8 13.6 17.8 21.1 26.9 22.4 Denmark 18.1 20.2 21.5 20.6 27.8 26.7 29.5 24.7 Finland 72.0 72.1 71.9 69.6 73.4 79.2 75.7 72.4 France 21.7 24.9 27.0 29.7 32.6 35.5 39.9 34.8 Germany 18.3 20.5 26.4 28.1 30.7 33.1 36.6 28.4 Greece 13.6 14.5 32.2 24.0 44.0 Ireland 14.7 17.8 22.0 19.4 22.4 29.6 35.2 28.0 Italy 9.8 11.3 8.9 8.4 11.3 17.2 20.0 16.1 Luxembourg 30.9 36.7 36.7 40.1 43.2 42.4 44.9 38.6 Netherlands 3.7 5.8 6.7 7.0 12.3 17.0 22.9 18.7 Portugal 17.6 21.8 17.5 18.8 27.5 30.6 38.4 33.3 Spain 5.2 3.6 6.5 7.2 18.7 15.9 17.3 15.8 Sweden 34.9 40.0 39.8 36.0 41.3 49.6 54.3 49.1 United Kingdom 15.5 12.3 17.4 15.2 22.9 29.7 32.1 24.2 EU-15 21.3 23.4 25.7 25.3 30.5 33.7 37.3 31.7 Czech Republic 43.5 49.8 58.1 53.8 Estonia 32.1 37.3 43.1 36.8 Hungary 40.0 32.2 39.6 44.7 Latvia 58.4 49.5 65.1 58.0 Lithuania 34.6 32.8 37.8 29.5 Malta 0.0 54.0 52.4 76.1 Poland 20.2 17.5 26.6 21.6 Slovakia 42.9 55.7 64.7 54.3 Slovenia 37.3 25.3 36.4 37.7 EU-10 34.3 39.3 47.1 45.8 Bulgaria 12.9 Romania 24.8 EU-02 21.8
Source: EU-FADN.
In the period 2003-2006 in the EU-15 the share of subsidies in farmers gross income increased from
25% to 37% (value for 2000 was 20%), whereas for the EU-10 there was an increase from 34% in 2004
to 47% in 2006. In 2007 these shares fell back mainly due to the high milk prices.
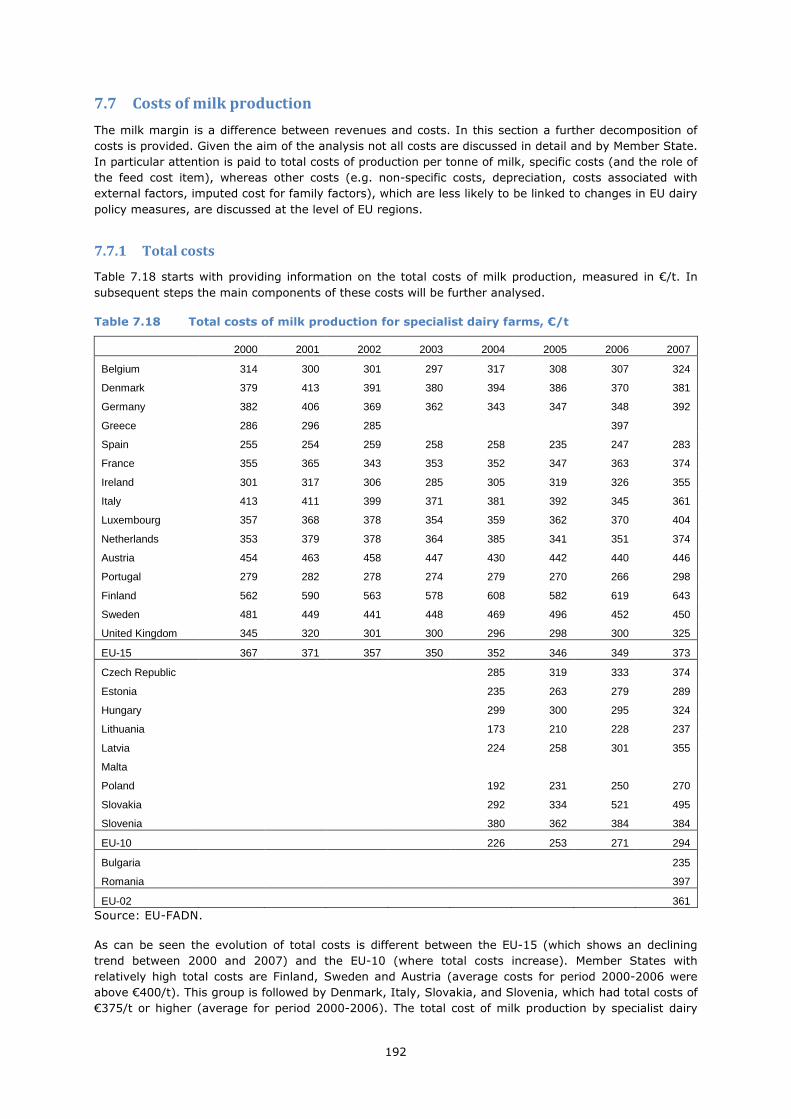
192
7.7 Costs of milk production
The milk margin is a difference between revenues and costs. In this section a further decomposition of
costs is provided. Given the aim of the analysis not all costs are discussed in detail and by Member State.
In particular attention is paid to total costs of production per tonne of milk, specific costs (and the role of
the feed cost item), whereas other costs (e.g. non-specific costs, depreciation, costs associated with
external factors, imputed cost for family factors), which are less likely to be linked to changes in EU dairy
policy measures, are discussed at the level of EU regions.
7.7.1 Total costs
Table 7.18 starts with providing information on the total costs of milk production, measured in €/t. In
subsequent steps the main components of these costs will be further analysed.
Table 7.18 Total costs of milk production for specialist dairy farms, €/t
2000 2001 2002 2003 2004 2005 2006 2007
Belgium 314 300 301 297 317 308 307 324
Denmark 379 413 391 380 394 386 370 381
Germany 382 406 369 362 343 347 348 392
Greece 286 296 285 397
Spain 255 254 259 258 258 235 247 283
France 355 365 343 353 352 347 363 374
Ireland 301 317 306 285 305 319 326 355
Italy 413 411 399 371 381 392 345 361
Luxembourg 357 368 378 354 359 362 370 404
Netherlands 353 379 378 364 385 341 351 374
Austria 454 463 458 447 430 442 440 446
Portugal 279 282 278 274 279 270 266 298
Finland 562 590 563 578 608 582 619 643
Sweden 481 449 441 448 469 496 452 450
United Kingdom 345 320 301 300 296 298 300 325
EU-15 367 371 357 350 352 346 349 373
Czech Republic 285 319 333 374
Estonia 235 263 279 289
Hungary 299 300 295 324
Lithuania 173 210 228 237
Latvia 224 258 301 355
Malta
Poland 192 231 250 270
Slovakia 292 334 521 495
Slovenia 380 362 384 384
EU-10 226 253 271 294
Bulgaria 235
Romania 397
EU-02 361 Source: EU-FADN.
As can be seen the evolution of total costs is different between the EU-15 (which shows an declining
trend between 2000 and 2007) and the EU-10 (where total costs increase). Member States with
relatively high total costs are Finland, Sweden and Austria (average costs for period 2000-2006 were
above €400/t). This group is followed by Denmark, Italy, Slovakia, and Slovenia, which had total costs of
€375/t or higher (average for period 2000-2006). The total cost of milk production by specialist dairy

193
farms in the United Kingdom, Ireland, Belgium, and Hungary was around €300/t throughout the period
2000-2007. Bulgaria, Poland and Lithuania belong to the lowest cost producers, having total costs of
€235/t or lower. As regards the EU-15 there was no clear change in total costs before and after 2003,
except for 2007 when from one year to another costs increased by 7%. In 2007 there was an extreme
situation in the world dairy markets, which also had its impact on the EU-dairy sector. This was an
external disturbance with no direct relation to policy, however. In the EU-10 total costs increase by about
9% per annum. This primarily related to the entry into the EU and the transition associated with that and
not the CAP dairy policy measures.
7.7.2 Specific costs
Costs of milk production can be decomposed into specific costs and non-specific costs. Specific costs
include feed costs (purchased plus home-grown), herd renewal purchases, milk superlevy and other
specific costs.
Table 7.19 Specific costs for specialist dairy farms, €/t
2000 2001 2002 2003 2004 2005 2006 2007
Belgium 95.93 89.37 90.84 91.60 95.16 90.81 92.92 101.90
Denmark 112.20 124.53 123.54 120.28 121.85 116.37 115.65 120.03
Germany 99.26 111.88 97.15 101.65 96.98 94.58 98.67 121.60
Greece 172.64 181.26 179.74 278.62
Spain 118.10 121.72 131.14 129.43 125.17 123.69 120.63 133.51
France 95.15 101.02 92.37 95.66 94.41 90.47 92.75 100.21
Ireland 88.00 94.78 100.88 96.10 97.63 99.64 105.05 112.93
Italy 131.99 139.75 127.58 149.78 150.15 157.20 123.96 139.68
Luxembourg 83.92 83.42 87.75 85.57 86.83 82.78 84.02 87.23
Netherlands 77.09 85.76 88.84 89.55 94.55 83.18 89.41 103.31
Austria 88.19 87.97 94.45 98.61 91.50 88.18 90.82 108.30
Portugal 122.61 138.90 127.45 132.11 131.32 128.64 127.46 149.72
Finland 133.83 153.50 136.49 136.99 138.29 136.93 136.01 141.43
Sweden 115.53 120.66 123.07 119.50 124.03 122.13 117.46 131.95
United Kingdom 108.53 114.92 105.84 104.88 103.39 104.37 113.89 131.62
EU-15 102.46 108.18 104.53 107.77 106.87 103.52 105.60 119.91
Czech Republic 91.90 97.41 99.77 113.38
Estonia 84.17 94.93 99.29 106.62
Hungary 136.64 128.91 106.31 152.82
Lithuania 51.12 59.05 62.28 62.35
Latvia 75.42 87.47 94.93 109.02
Malta 233.71 239.98 264.13
Poland 68.25 76.04 84.94 100.54
Slovakia 114.15 104.25 116.35 127.26
Slovenia 97.78 90.43 97.34 97.87
EU-10 81.66 84.27 88.91 105.60
Bulgaria 119.70
Romania 91.25
EU-02 97.58 Source: EU-FADN , calculations based on DG AGRI cost allocation model.
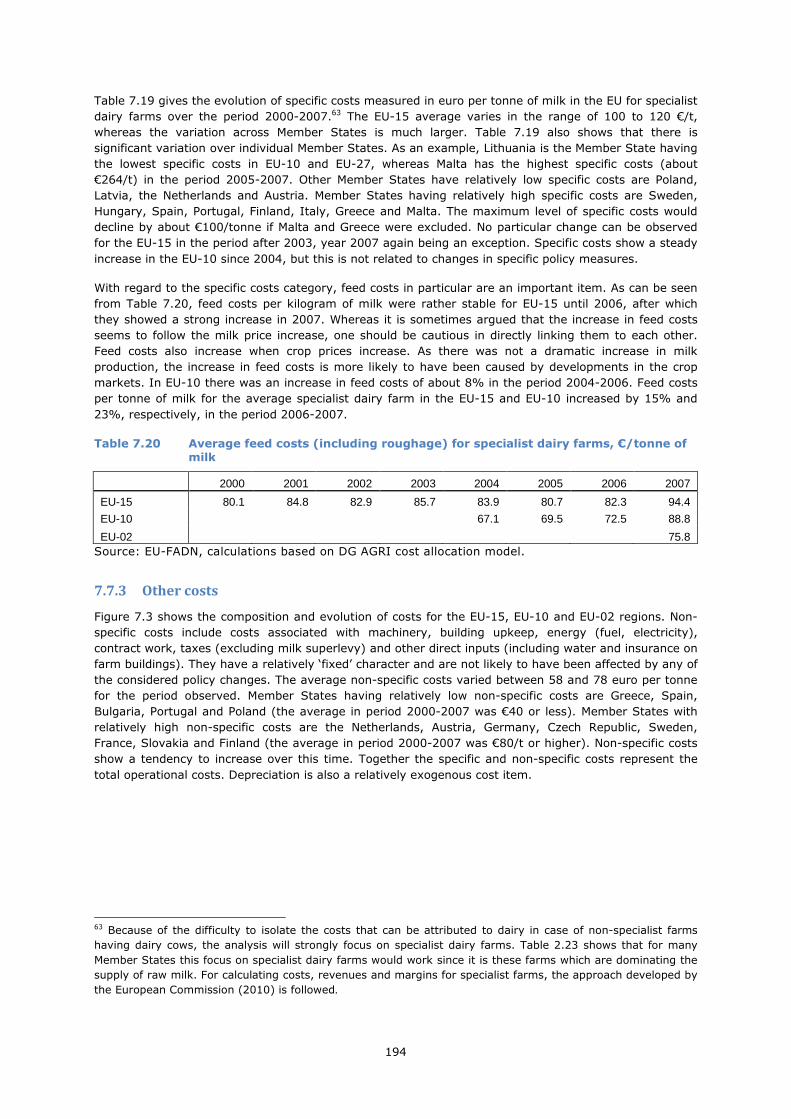
194
Table 7.19 gives the evolution of specific costs measured in euro per tonne of milk in the EU for specialist
dairy farms over the period 2000-2007.63 The EU-15 average varies in the range of 100 to 120 €/t,
whereas the variation across Member States is much larger. Table 7.19 also shows that there is
significant variation over individual Member States. As an example, Lithuania is the Member State having
the lowest specific costs in EU-10 and EU-27, whereas Malta has the highest specific costs (about
€264/t) in the period 2005-2007. Other Member States have relatively low specific costs are Poland,
Latvia, the Netherlands and Austria. Member States having relatively high specific costs are Sweden,
Hungary, Spain, Portugal, Finland, Italy, Greece and Malta. The maximum level of specific costs would
decline by about €100/tonne if Malta and Greece were excluded. No particular change can be observed
for the EU-15 in the period after 2003, year 2007 again being an exception. Specific costs show a steady
increase in the EU-10 since 2004, but this is not related to changes in specific policy measures.
With regard to the specific costs category, feed costs in particular are an important item. As can be seen
from Table 7.20, feed costs per kilogram of milk were rather stable for EU-15 until 2006, after which
they showed a strong increase in 2007. Whereas it is sometimes argued that the increase in feed costs
seems to follow the milk price increase, one should be cautious in directly linking them to each other.
Feed costs also increase when crop prices increase. As there was not a dramatic increase in milk
production, the increase in feed costs is more likely to have been caused by developments in the crop
markets. In EU-10 there was an increase in feed costs of about 8% in the period 2004-2006. Feed costs
per tonne of milk for the average specialist dairy farm in the EU-15 and EU-10 increased by 15% and
23%, respectively, in the period 2006-2007.
Table 7.20 Average feed costs (including roughage) for specialist dairy farms, €/tonne of milk
2000 2001 2002 2003 2004 2005 2006 2007
EU-15 80.1 84.8 82.9 85.7 83.9 80.7 82.3 94.4
EU-10 67.1 69.5 72.5 88.8
EU-02 75.8 Source: EU-FADN, calculations based on DG AGRI cost allocation model.
7.7.3 Other costs
Figure 7.3 shows the composition and evolution of costs for the EU-15, EU-10 and EU-02 regions. Non-
specific costs include costs associated with machinery, building upkeep, energy (fuel, electricity),
contract work, taxes (excluding milk superlevy) and other direct inputs (including water and insurance on
farm buildings). They have a relatively ‘fixed’ character and are not likely to have been affected by any of
the considered policy changes. The average non-specific costs varied between 58 and 78 euro per tonne
for the period observed. Member States having relatively low non-specific costs are Greece, Spain,
Bulgaria, Portugal and Poland (the average in period 2000-2007 was €40 or less). Member States with
relatively high non-specific costs are the Netherlands, Austria, Germany, Czech Republic, Sweden,
France, Slovakia and Finland (the average in period 2000-2007 was €80/t or higher). Non-specific costs
show a tendency to increase over this time. Together the specific and non-specific costs represent the
total operational costs. Depreciation is also a relatively exogenous cost item.
63 Because of the difficulty to isolate the costs that can be attributed to dairy in case of non-specialist farms
having dairy cows, the analysis will strongly focus on specialist dairy farms. Table 2.23 shows that for many
Member States this focus on specialist dairy farms would work since it is these farms which are dominating the
supply of raw milk. For calculating costs, revenues and margins for specialist farms, the approach developed by
the European Commission (2010) is followed.

195
Figure 7.3 Decomposition of costs of milk production in the EU
0
50
100
150
200
250
300
350
400
2000 2001 2002 2003 2004 2005 2006 2007 2004 2005 2006 2007 2007
EU-15 EU-10 EU-02
€/t
Specific costs Non-specific costs Depreciation External factors Imputed family factors
Source: EU-FADN.
The two last cost items regard external and family factors of production. The costs associated with
external factors for the EU-15 were on average €40/t, while in the EU-10 and EU-02 it was about half as
large. The higher costs in the EU-15 are related to a relative increase in reliance on external factors,
which is related to its farm scale, which is relatively large. Of the costs associated with the primary
production factor, labour, in particular (imputed) labour costs, is an important cost item worthwhile to be
considered further. Getting accurate estimates of the opportunity costs is not trivial, but is important for
making a comparison of full costs over Member States. The estimates used in this study are calculated
according to the methodology used by the European Commission.64 The imputed family factor costs
(family owned capital and family labour) in the EU-15 for the average specialist dairy farm significantly
declined over the period 2000-2007 (-26%), decreasing from €113.1/t to €83.9/t (the annual decline is
€4.37/tonne). This is related to the increase in farm scale (see discussion in Section 7.5.2). In contrast,
the imputed family costs in the EU-10 over the period 2004-2007 increased by 28%, from €53.9/t to
€68.7/t (an annual increase of €4.82/t). The level of imputed family factor costs per unit of milk in EU-15
and EU-10 quickly converge over time.
For no cost item has any evidence been found that costs have been affected in a way that could be linked
to the cross-compliance policy, introduced in 2005. From the survey among producers in the case study
areas, 220 out of 392 farmers indicated that cross compliance had an impact on costs, but no empirical
evidence was found.
7.8 Conclusions
Following the availability of EU-FADN data for all Member States, the period of analysis has been 2000-
2007.
Farm income, as approximated by the evolution of net farm added value per specialist dairy farm
increased by 21% in EU-15 over 2003-2006 and by 63% in EU-10 over the same period. This not only
holds in nominal terms, but for most Member States also in terms of a real increase in income
(exceptions are Ireland, Finland, Estonia, Latvia and Slovakia). For non-specialist dairy farms the income
increase was relatively lower.
The indicator of the family farm income per family worker showed that, family farm income stayed either
stable since 2003 (in nominal terms), or slightly increased (exceptions are Finland and Ireland). The year 64 See European Commission, 2010a, in particular Annex I, Methodology 2

196
2007 was unusual year, characterised by disturbances of dairy markets and very high prices for dairy
products and raw milk. This is reflected in the sharp increase of the family farm income per family
worker.
The relative position of dairy farming with respect to other agricultural sectors can be seen if one
compared the FNVA/AWU ratio of specialist dairy farms with this of non-dairy farms. On average the
relative income ratio increased between 2003-2006 by about 20% in EU-15 and by more than 40% in
EU-10, but results vary over Member States. As regards the EU-15 in Austria, France and Finland the
relative income growth in the specialist dairy sector lagged behind. The farm net value of specialist dairy
farms in Ireland and in Portugal was about twice of this of non-specialist farms. In the Netherlands and
in Spain the earned income of specialist farms developed relatively favourably relative to non-dairy
farms. In the EU-10 relative incomes in specialist dairy are lagging behind for Czech Republic, Estonia,
and Latvia.
The milk margin indicator (gross margin over operating costs per tonne of milk) showed that gross
margin declined in the period 2003-2006. In the same period the producer prices of raw milk in the EU-
15 declined, which is correlated with the decline in butter and SMP intervention prices65 (for the EU-10
milk producer prices increased on average because of the accession of these countries into the EU in
2004). The decline in the milk margin did not translate into a lower farm income, as measured by the
FNVA/AWU and FFI/FWU indicators. The reason is because the decline in margin was effectively
counteracted by increasing subsidies (consisting of coupled and decoupled direct payments as well as
national aids) and by an increase in farm scale and productivity. In detail, the dairy premium was on
average more than sufficient to compensate dairy farmers for the milk price decline they experienced.
The share of these subsidies in gross farm income (before taxes and levies) substantially increased
between 2003 and 2007. During the period 2003-2006 the share of subsidies in farmers gross income
increased in the EU-15 from 25% to 37% (value for 2000 was 20%) and in the EU-10 from 24% in 2004
to 47% in 2006. In 2007 these shares fell back because of the high milk prices.
The indicator on the share of subsidies in gross farm income shows that between 2000 and 2007 in the
EU-10 dairy farmers were more reliant for their income on coupled and decoupled direct payments and
national aids compared to the dairy farmers in EU-15. As regards costs of production, the indicators
showed that in particular imputed costs of family factors such as family labour and family owned capital
increased in EU-10 between 2004 and 2007, while they remained almost stable or slightly decreased in
the EU-15. This is attributed to the initial farm size structure and the relatively lower milk yields
compared to the EU-15.
The indicators on farm income show that the 2003 CAP reform on milk and milk products achieved the
objective or maintaining or even increasing the farmers’ income. The decline in intervention prices for
butter and SMP and consequent adjustments in export refunds rates and public buying in had a negative
impact on the milk price farmers received in the period 2003-2006, especially in the EU-15. The
percentage decline in the milk price received by farmers, however, was less than that of the intervention
prices for butter and SMP. The milk price decline negatively affected the gross margin per tonne, but not
farm income. Farm incomes developed positively because the dairy premium payments and the
decoupled payments more than offset the milk price decline experienced in the EU-15. As such the net
impact of the 2003 CAP policy measures for dairy products has been positive and more than sufficient to
maintain dairy farm incomes. In the EU-10 the milk price showed an increasing trend, which was also
translated in a positive evolution of gross margin.
Dairy farm incomes were not only maintained, but also showed an increase. The actually observed
increase in dairy farm incomes (per annual work unit) was partly due to the net impact of the policy
measures (affecting income via the milk price and direct payments), with in particular the direct
payments playing a crucial role. Dairy farm incomes have also been favourably affected by other factors
such as structural change (farm scale increase) and increase in productivity.
65 See the answer to EQ2 for a more detailed discussion about the linkage of the milk price farmers receive and the CAP policy measures applicable to dairy (see Chapter 6).
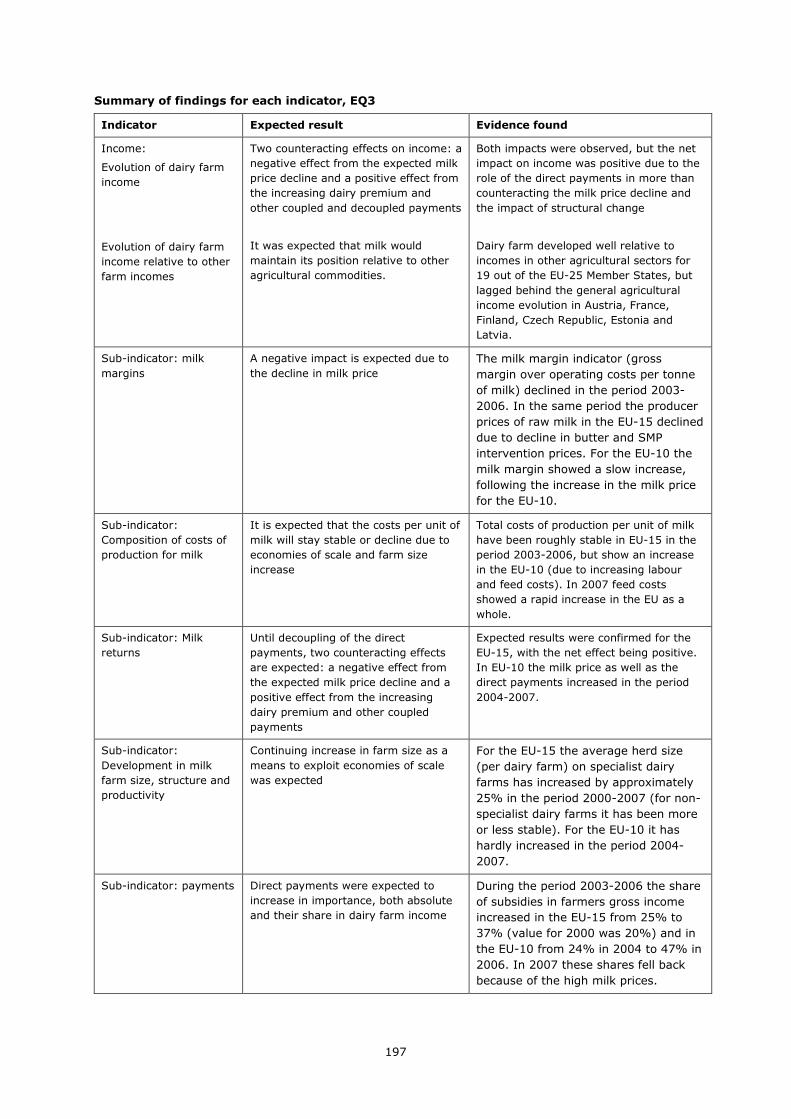
197
Summary of findings for each indicator, EQ3
Indicator Expected result Evidence found
Income:
Evolution of dairy farm
income
Evolution of dairy farm
income relative to other
farm incomes
Two counteracting effects on income: a
negative effect from the expected milk
price decline and a positive effect from
the increasing dairy premium and
other coupled and decoupled payments
It was expected that milk would
maintain its position relative to other
agricultural commodities.
Both impacts were observed, but the net
impact on income was positive due to the
role of the direct payments in more than
counteracting the milk price decline and
the impact of structural change
Dairy farm developed well relative to
incomes in other agricultural sectors for
19 out of the EU-25 Member States, but
lagged behind the general agricultural
income evolution in Austria, France,
Finland, Czech Republic, Estonia and
Latvia.
Sub-indicator: milk
margins
A negative impact is expected due to
the decline in milk price
The milk margin indicator (gross
margin over operating costs per tonne
of milk) declined in the period 2003-
2006. In the same period the producer
prices of raw milk in the EU-15 declined
due to decline in butter and SMP
intervention prices. For the EU-10 the
milk margin showed a slow increase,
following the increase in the milk price
for the EU-10.
Sub-indicator:
Composition of costs of
production for milk
It is expected that the costs per unit of
milk will stay stable or decline due to
economies of scale and farm size
increase
Total costs of production per unit of milk
have been roughly stable in EU-15 in the
period 2003-2006, but show an increase
in the EU-10 (due to increasing labour
and feed costs). In 2007 feed costs
showed a rapid increase in the EU as a
whole.
Sub-indicator: Milk
returns
Until decoupling of the direct
payments, two counteracting effects
are expected: a negative effect from
the expected milk price decline and a
positive effect from the increasing
dairy premium and other coupled
payments
Expected results were confirmed for the
EU-15, with the net effect being positive.
In EU-10 the milk price as well as the
direct payments increased in the period
2004-2007.
Sub-indicator:
Development in milk
farm size, structure and
productivity
Continuing increase in farm size as a
means to exploit economies of scale
was expected
For the EU-15 the average herd size
(per dairy farm) on specialist dairy
farms has increased by approximately
25% in the period 2000-2007 (for non-
specialist dairy farms it has been more
or less stable). For the EU-10 it has
hardly increased in the period 2004-
2007.
Sub-indicator: payments Direct payments were expected to
increase in importance, both absolute
and their share in dairy farm income
During the period 2003-2006 the share
of subsidies in farmers gross income
increased in the EU-15 from 25% to
37% (value for 2000 was 20%) and in
the EU-10 from 24% in 2004 to 47% in
2006. In 2007 these shares fell back
because of the high milk prices.

198
8 EQ4: Producers’ competitiveness and market orientation
To what extent have the CAP measures applicable to the dairy sector contributed to increasing farmers’
market orientation and competitiveness?
8.1 Interpretation and comprehension of the key terms of the EQ4
The key concepts in EQ4 are the market orientation and competitiveness of milk producers.
Market orientation
As explained in the Intervention Logic (Chapter 3), market orientation means the exposure of milk
producers to market price signals regarding the quality and quantity of milk demanded by final markets,
and their ability to respond to these signals in a rational and unconstrained way. This has several
dimensions. First, there is the issue of whether producers can receive clear signals from the market, or
whether these signals are distorted by policy interventions or elements of market failure that are not
related to policies. With respect to the policy changes implemented since 2003, the switch of some
income support out of price support into a direct payment for milk producers strengthens the primary
role of price as providing a market-determined incentive. A second aspect of producers’ market
orientation concerns their ability to react to market signals without constraints or conflicting incentives.
In this respect, the decoupling of the dairy premium and the gradual relaxation of quota limits remove
two major constraints on farmers’ reactions. As long as the dairy premium remained coupled to milk
production, producers could be inhibited from responding to a sustained decrease in the market price by
leaving the sector, as they would forfeit their claim to the direct payment coupled to milk. On the other
hand, when additional quota is scarce and therefore expensive, producers are unable to take advantage
of improved market prices to expand production. The relaxation of these two constraints (output-linked
payment and restrictive quota limits) has in theory allowed producers more flexibility to react rationally
to market signals.
Market signals concerning quality are transmitted to producers in the first instance via the payment
system that determines their milk price when they sell to a dairy (see EQ2). The payment system rewards
producers for the fat and protein components of their milk according to their relative value in final dairy
products. Historically, the relative value of fat and protein has been partly influenced by EU intervention
prices for butter and SMP, although it is argued in EQ2 that this relationship is now much weaker under
current intervention rules. Other quality-related price signals include the price differential for organic milk
and for PDO/PGI products (niche products). For the main volume of milk produced, however, the extent to
which a Member State’s milk production satisfies the standard quality criteria depends largely on the
share of the milk output that is delivered to dairies. Dairies aim to collect only milk that satisfies standard
quality criteria, and they incentivise producers to meet these criteria through adjustments to price.66
A further aspect of market orientation, related to the milk-producing sector as a whole, is whether the
market for raw milk can receive and react to price signals from world dairy markets. Milk is a perishable
and non-tradable product, but processed dairy products are traded on world markets. It follows that the
potential link between the domestic market for raw milk and world markets passes via the interlinked
66 Some milk not delivered to dairies is used for on-farm processing (farmhouse cheeses, ice cream, other specialty high-value products). It could be argued that this activity represents a very high degree of market orientation on the part of milk producers, who in many cases have created their own local market and must maintain close contact with their consumers’ requirements to ensure the survival of their business. However, the volume of milk handled in this way is relatively small, and is likely to be unaffected by the policy changes under evaluation. Therefore, it is ignored.
199
markets for dairy products and back up the vertical supply chain. The extent to which the local supply of
raw milk responds to market price signals generated by international dairy product markets is also an
element of market orientation. The question here is whether policy changes have reduced the insulation
of domestic dairy product markets from developments on world markets, and whether underlying
changes in demand and supply on world markets are transmitted to EU producers via prices. Here, it is
important to distinguish between short-term price movements generated by volatile world markets (dealt
with under EQ2) and medium–term price changes that reflect more durable shifts in the underlying
supply and demand conditions.
The EU is typically a net exporter of butter and SMP and uses export refunds and intervention purchasing
systems for both products. It is the tariff protection of the EU market that allows a price gap to persist
over the medium term, but it is the two instruments – refunds and intervention – that affect the extent
to which the price gap smoothes – or blocks - the transmission of price signals to the domestic market.
In a situation without either instrument, when the world market price falls whilst the internal EU price
remains unchanged, demand for unsubsidised EU exports would fall, and this downward pressure would
be transmitted to the domestic market as producers would try to sell more on the home market. Export
refunds could be used in this case to compensate for the fall in the world market price, thus allowing
export flows to be maintained and hence relieving the pressure on domestic prices. This action would
reduce the transmission of the world market price to the domestic market. Another possibility would be
for an intervention agency to buy the goods that now cannot be sold on the export market, store them
and sell them later when world market prices have recovered. This action also would shield domestic
price from the world market price fall. An intervention agency and an export refund system acting
together could in theory minimise the cost of this kind of price-smoothing, allowing the price gap to
widen and contract in such a way that domestic prices remain more or less constant. In this way,
domestic producers would be largely insulated from movements in world market prices.
The existence of a price gap per se affects market balance (dealt with in EQ1 and EQ6), but if it remains
more or less constant, it does not mask changes in world market prices. In practice, for butter and SMP,
perfect transmission from world market price movements to domestic price has tended to occur only
when world market price for the product concerned is above the EU intervention price (see EQ2). By
contrast, when world market price is lower than the intervention price, the adjustment of export
subsidies (with or without backing from intervention storage) partly insulates the EU price against world
market price changes. Changes in the use of these instruments (in particular, scaling down the size of the
refund per ton, the intervention price per ton, or the ceilings up to which these measures can be used) will
increase the transmission of world market price changes to EU producers.
Competitiveness
Competitiveness is a concept with both static and dynamic aspects, which can be linked to individual
dairy farms as well as to their position in the supply chain. When analysing competitiveness it is important
to look at longer-run trends in variables rather than at the value of an indicator in a specific year. The
competitiveness of the dairy industry as a whole depends on the performance of every segment of the
supply chain. In this evaluation question, the focus is on the competitiveness of primary milk production.
From a milk producer’s perspective, competitiveness is the ability to supply milk in the location, form and
place sought by buyers, at prices that are as good or better than those of other potential suppliers, while
at least covering the opportunity costs of resources used. As such, competitiveness depends strongly on
production costs relative to those of other market suppliers. This aspect of competitiveness holds in
particular for standardized products, where individual producers of an undifferentiated product face
competitive suppliers of the same product. Another aspect of competitiveness is the ability to command a
higher price by supplying high-value specialty or niche products for which there are no direct
competitors.
Furthermore, competitiveness can refer to the ability of one commodity sector to compete for resources
with other agricultural commodity sectors. The most important factor here is the profitability of milk
production relative to other commodity outputs. Finally, a further aspect of competitiveness is whether a
production sector in a country is able to compete on cost and quality with similar sectors in other
countries. For many less perishable dairy products, the market is global and hence the unit cost of milk
produced in the EU relative to that of competitors elsewhere in the world is very important.
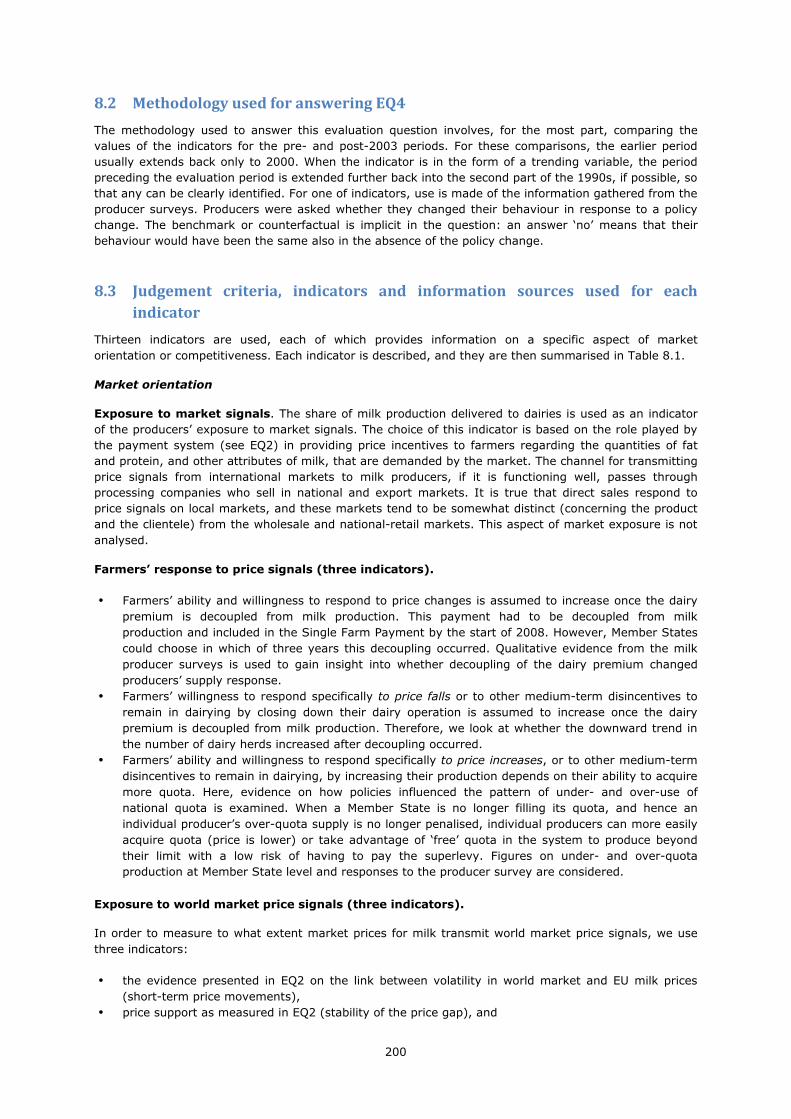
200
8.2 Methodology used for answering EQ4
The methodology used to answer this evaluation question involves, for the most part, comparing the
values of the indicators for the pre- and post-2003 periods. For these comparisons, the earlier period
usually extends back only to 2000. When the indicator is in the form of a trending variable, the period
preceding the evaluation period is extended further back into the second part of the 1990s, if possible, so
that any can be clearly identified. For one of indicators, use is made of the information gathered from the
producer surveys. Producers were asked whether they changed their behaviour in response to a policy
change. The benchmark or counterfactual is implicit in the question: an answer ‘no’ means that their
behaviour would have been the same also in the absence of the policy change.
8.3 Judgement criteria, indicators and information sources used for each
indicator
Thirteen indicators are used, each of which provides information on a specific aspect of market
orientation or competitiveness. Each indicator is described, and they are then summarised in Table 8.1.
Market orientation
Exposure to market signals. The share of milk production delivered to dairies is used as an indicator
of the producers’ exposure to market signals. The choice of this indicator is based on the role played by
the payment system (see EQ2) in providing price incentives to farmers regarding the quantities of fat
and protein, and other attributes of milk, that are demanded by the market. The channel for transmitting
price signals from international markets to milk producers, if it is functioning well, passes through
processing companies who sell in national and export markets. It is true that direct sales respond to
price signals on local markets, and these markets tend to be somewhat distinct (concerning the product
and the clientele) from the wholesale and national-retail markets. This aspect of market exposure is not
analysed.
Farmers’ response to price signals (three indicators).
• Farmers’ ability and willingness to respond to price changes is assumed to increase once the dairy
premium is decoupled from milk production. This payment had to be decoupled from milk
production and included in the Single Farm Payment by the start of 2008. However, Member States
could choose in which of three years this decoupling occurred. Qualitative evidence from the milk
producer surveys is used to gain insight into whether decoupling of the dairy premium changed
producers’ supply response.
• Farmers’ willingness to respond specifically to price falls or to other medium-term disincentives to
remain in dairying by closing down their dairy operation is assumed to increase once the dairy
premium is decoupled from milk production. Therefore, we look at whether the downward trend in
the number of dairy herds increased after decoupling occurred.
• Farmers’ ability and willingness to respond specifically to price increases, or to other medium-term
disincentives to remain in dairying, by increasing their production depends on their ability to acquire
more quota. Here, evidence on how policies influenced the pattern of under- and over-use of
national quota is examined. When a Member State is no longer filling its quota, and hence an
individual producer’s over-quota supply is no longer penalised, individual producers can more easily
acquire quota (price is lower) or take advantage of ‘free’ quota in the system to produce beyond
their limit with a low risk of having to pay the superlevy. Figures on under- and over-quota
production at Member State level and responses to the producer survey are considered.
Exposure to world market price signals (three indicators).
In order to measure to what extent market prices for milk transmit world market price signals, we use
three indicators:
• the evidence presented in EQ2 on the link between volatility in world market and EU milk prices
(short-term price movements),
• price support as measured in EQ2 (stability of the price gap), and

201
• the use of export refunds during the evaluation period (a measure that can be used to prevent the
(full) transmission of world market price falls to the domestic price).
Competitiveness
Production cost. If production cost is falling, then clearly the competitiveness of the milk-producing
sector is increasing, ceteris paribus. Therefore, the cost per ton of milk produced (including the imputed
costs for family labour, owned land, and capital) is a long-term indicator in the sense that only in the
long term are the fixed family-owned factors variable. However, this is not a conclusive indicator,
because clearly ceteris paribus does not hold over time. This cost has to be related to the price of milk
farmers receive: if market price is falling faster than cost is falling, or rising less rapidly than cost is
increasing, then competitiveness is decreasing. As a measure for assessing the competitiveness of dairy
farms in the short run (assuming family labour and land to be fixed factors, having little alternative
possibilities to be employed) is gross margin over operating cost per ton of milk. Operating costs consist
of specific costs (e.g. feed, herd renewal) and non-specific costs (e.g. machinery and building upkeep,
energy, contract work, insurance), and exclude external factors (e.g. depreciation, wages paid, rent
paid) and imputed family factors (e.g. family labour, family owned capital). The percentage of farms that
realise a positive net profit is also an indicator of the longer-term competitiveness of the sector. To
capture these various aspects of cost-competitiveness, the following indicators are used:
• Cost per tonne of milk production
• Gross margin over operating costs
• Percentage of farms with positive net profit
Competitive position within EU agriculture. To assess the strength of the dairy sector relative to
other agricultural, the profitability of the dairy sector relative to that of other agricultural sectors is
analysed. The indicator adopted is farm net value added per annual work unit relative to that of other
agricultural sectors.
International competitiveness (two indicators). The evolution of milk production cost in the EU
dairy sector relative to competitors in the world is examined. A second indicator relates to the
attractiveness of the EU market for imports, which is assessed by examining the fill rates of TRQs for
dairy products.
Table 8.1 summarises these indicators, along with the data required and the source used.
Table 8.1 Indicators, data requirements and information sources for EQ4
Indicator Data requirement Information sources
Market orientation
Producers’ exposure to market signals
Share of total milk delivered to dairies Data on deliveries and production of milk
EU-FADN, Eurostat
Producers’ response to decoupling of payments
Stated reaction of producers Farmer responses to survey questions
Producer survey
Willingness to respond to price falls Number of dairy herds Eurostat
Ability to respond to price increases Under-use of national quota DG AGRI
Exposure of markets to world market prices
Link between domestic & world market price volatility
Evidence presented in EQ2
Price support above world market levels Evidence presented in EQ2
Use of export refunds Table 2.48

202
Table 8.1 (continued) Indicators, data requirements and information sources for EQ4
Competitiveness
Production cost
� Cost per tonne of milk
� Gross margin over operating costs
� Share of farms with positive net profit
Data on revenues, specific and non-specific costs associated with dairy activity
EU-FADN
Competitive advantage relative to other sectors, countries
Profitability relative to other commodity sectors
Farm net value added per annual work unit of specialist dairy farms relative to other farm types
EU-FADN
Net economic margin (after own factors)
Sales of milk and milk products, operating costs, depreciation, external factors, imputed unpaid family factors
EU-FADN
International competitiveness
EU milk production cost relative to main international competitors
Data on costs of milk production in non-EU countries
IFCN, IDF
Competitiveness on the home market – fill rates of TRQs
Evidence presented in EQ10
The judgement criteria involve, in each case, an assessment of whether the indicator behaves as would
be expected, given the policy change that is linked to it according to the intervention logic. When it is
possible to link the behaviour of the indicator to changes in a particular policy instrument in a particular
year, then the year of the change marks the start of the post-change period, to be compared with years
prior to it. For some indicators, it is the general trend in their value after the 2003 reform relative to the
trend in the preceding period that is of interest. In these cases, the judgement criterion is whether the
trend changed as expected, according to the intervention logic.
8.4 Evidence on market orientation
8.4.1 Share of milk delivered to dairies
The share of all cows’ milk produced that is delivered to dairies increased gradually between 2003 and
2008 (see Figure 8.1). In 2009 (year of a sharp fall in milk price, the so-called ‘milk crisis’), this share
fell back a little. However, there is no reason not to expect that the former level will be regained when
normal conditions are restored. It is possible to compare the post-2003 situation with previous years for
EU-15 only. Despite an initially high delivered share (over 94% in 2002), the share continued to increase
after 2003. This supports the hypothesis of increasing exposure to market signals as they are channelled
via the payment system of dairies. It is also clear that the two successive enlargements reduced this
indicator to well below its level for EU-15 in the late 1990s. However, what is important here is that the
upward trend throughout the post-2003 period (except in 2009) is observed for EU-25 and EU-27. In
fact, the gap between the delivered share in EU15 and EU25 was closing, indicating that (not
surprisingly, given the ‘catching-up’ process) the share is rising faster in EU-10.67
Nevertheless, the evidence is inconclusive as to the role played specifically by policy changes in the
increasing exposure of producers to market signals as passed on to them by dairies. The rather smooth
trends shown in Figure 8.1 do not suggest any particular policy-related stimulus, and the sharper
increase between 2006 and 2007 is also hard to relate to any specific policy change. All that can be said
is that the trend has been rising throughout the period shown, except in the three last years.
67 In 2007, the ‘peak year’ for the deliveries share, the figures were: EU-15: 96.1%, EU-10: 76.2%, EU-2: 30.6%.

203
Figure 8.1 Share of total cows’ milk production delivered to dairies, EU-15, EU-25, EU-27
88
89
90
91
92
93
94
95
96
9719
97
1998
1999
2000
2001
2002
2003
2004
2005
2006
2007
2008
2009
per c
ent
EU-15 EU-25 EU-27
Source: Eurostat.
8.4.2 Producers’ response to decoupling of the dairy premium
The survey of milk producers in 13 case study areas (in each area, 30 active dairy farmers and up to five
who stopped milk production during the observation period) yielded over 450 respondents. The sample
selection process offers no guarantee that the sample is representative. However, the survey provides
some insights, especially when the answers are close to unanimous.
The active dairy farmers were asked about their response to both the introduction of the dairy premium
and its decoupling. First, the overwhelming majority said that the premium was not relevant to their
production decisions.68 Second, they generally considered that the decoupling of the premium also was
not relevant for their level of production.69 Among the small number of respondents who had already
ceased milk production, the year of departure was not linked to decoupling and the reasons given tended
to be linked to low prices and absence of a successor. It must be stressed that the number of former
milk producers was particularly small, and that from the statistical point of view the summary of their
answers cannot be relied upon.
In summary, one might have expected that producers who perceived the dairy premium to be coupled to
milk production, or those who wondered about whether it might be rebased according to a later year,
would - after its merging with the SFP - have felt freed from the incentive to produce milk in order to
receive the premium. However, this was not the case. Farmers either saw the decoupling as irrelevant or
responded to decoupling with an increase in milk production. This explanation fits with the observation
that milk production requires specific investments, implying that once a farmer has committed these
assets, he is not inclined, at least in the short run, to switch to other activities.
68 For a small minority, it led to an increase in production, suggesting an irrational perception that it was coupled to current output levels rather than to the amount of quota held at the end of the respective quota year. 69 Here too, those who gave a different answer mentioned that it led to an increase rather than a decrease in production.

204
8.4.3 Producers’ response to price falls
Figure 8.2 Number of EU dairy herds, 1990-2007
0
0.1
0.2
0.3
0.4
0.5
0.6
0.7
0.8
0.9
1
1.1
1.2
1.3
1990 1993 1995 1997 2000 2003 2005 2007
mill
ions
EU-12 EU-15 EU-10 EU-02
Notes: In 1990, the figures for Germany are for the 11 Länder, thereafter for the 16 Länder. Figures for Germany for 1995 and 1997 are estimates, obtained by linear interpolation.
Source: Eurostat.
Figure 8.2 shows the evolution of dairy herd numbers (measured as farms with dairy cows) in EU-12,
EU-15, EU-10 and EU-02 between 1990 and 2007. Although EU-12 as a group of countries has no
interest per se in this report, it is included in the figure in order to extend the trend back to 1990. The
graph shows a long-run secular decline in the number of herds in EU-12/EU-15, which is also reflected in
the shorter time series for EU-10 and EU-02. As EQ1b (Chapter 5) reports in detail, this has been
accompanied by a steady growth in herd size, which explains why the number of dairy cows has been
declining much more slowly than the number of herds.
The smooth downward trend in herd numbers in EU-15 accelerated strongly between 2003 and 2005,
and then slows down during 2005-07. The average annual rates of change for EU-15 between each of
the Farm Structure Surveys are: 1995-97: -5.6%, 1997-2000: -6.0%, 2000-2003: -6.7%, 2003-2005: -
16.3%, 2005-2007: -3.5%. In fact, between 2003 and 2005, 30% of dairy herds (178 thousand herds)
in EU-15 disappeared. This sudden acceleration in the trend supports the view that the 2003 dairy reform
package, with its promise of new policy instruments, price falls, cross compliance requirements and its
greater general emphasis on market orientation, provided a stimulus for producers who were less
committed to milk or whose herds’ performance was marginal to leave the sector rapidly, even before
most of these measures had been fully implemented. The slowing down of the decline in 2005-07
suggests that the higher rate of exit between 2003 and 2005 may indicate that for some herds, cessation
of production that would normally have happened later was simply brought forward by a few years.
However, it should also be noted that between 2005 and 2007, increases in the number of herds were
observed in four Member States (+2.9% in Italy, +12.4% in Luxembourg, +4.2% in the Netherlands and
+7.0% in the UK). This is the first time that net increases in herd numbers were observed at Member
State level between consecutive Farm Structure Surveys during the period from 1990 onwards. We note
the these increases occurred before the 2% increase in quota for most Member States in April 2008, and
is therefore most likely to be due to the combination of lower quota prices/greater quota availability in
some member States.

205
8.4.4 Ability to respond to price increases
Figure 2.7 presents the extent of over-run and under-use of quota across the EU. It shows that from
2004/05, the EU as a whole was in a situation of net under-use of quota, although a handful of Member
States still exceeded their national quota ceilings. By 2008/09, not only was the net under-use more
than 5 million tonnes, there was virtually no over-run at Member State level. This helps to explain how
the increase in dairy cows in 2007-2008 in some Member States, shown in Table 5.5, could be possible.
Moreover, it is worth noting that there was an increase in milk yield at EU-27 level (Table 2.4), which
could well indicate a (market-oriented) supply response to much higher prices – one that was facilitated
by the fact that production levels were below quota ceilings. Of course, annual weather variations might
also be a causal factor, so this interpretation of the evidence needs to be treated cautiously.
8.4.5 Exposure to world market prices
Table 6.3 shows that the price gap for the basic products butter and SMP fell from an average of 91% of
the world market prices in the period 1997-2003 to 52% in 2004-2006. The average during 2007-2008
was just 13% (and for some sub-periods in this interval, it disappeared) but it then rose to 34% in 2009.
Overall, internal prices were closer to world market prices after 2003 than before the reform, and part of
that convergence (that part which is observed in 2004-2006 and again in 2009) can be attributed to the
lower level of market price support due to lower intervention prices. Export refunds continued to be used
until 2006 more or less as before 2003 in order to dispose of excess supplies, until the higher world
prices in 2007-2008 caused them to be suspended (Table 2.48).
The evidence on price volatility presented in EQ2 (Chapter 6) shows clearly that short-term price
movements within the EU were strongly linked to world market price volatility during the years 2007-
2008 (see EQ5). In this period, export refunds and intervention (at its new lower safety-net level)
became ineffective as domestic price stabilisation instruments as the price gap for butter and SMP was
virtually zero. Here we see very clearly the separate roles of import tariffs and export refunds as
insulating border instruments. Tariffs (which allow the import entry price to move up and down with
world market price but at a much higher level) still performed their role of restricting imports onto the EU
market (except imports permitted within TRQs) but export refunds became irrelevant
This is further evidence of the high degree of market orientation achieved during this short period.
However, it was due to external developments rather than EU policy changes.
8.5 Results on competitiveness
8.5.1 Cost of production
Table 8.2 shows the average total cost of milk production by EU Member State. Total costs in EU-15
remained relatively stable over the period 2000-2007. The EU-15 average for the period was €358/t.
Average cost was above this level in 2000 and 2001, and again in 2007, whereas it remained below
average over the four years 2003-2006. The pattern of annual cost relative to the average for the period
was also observed at Member State level. One should be cautious about attaching too much significance
to the slight decrease in EU-15 costs in 2004-2005, relative to 2000-2001, since the EU-FADN sample
does not contain an identical set of farms each year, and an unknown share of this variation could be due
to changes in the composition of the sample.
There are also large differences in average cost between Member States, and these differences persist
over the entire period despite changes in the sample composition. The highest-cost producer is Finland,
with average cost at 50-80% above the EU-15 average (the next highest average-cost countries are
Sweden and Austria), and the lowest-cost producer is Spain, with average cost at 25-35% below the EU
average (the next lowest-cost producer is Portugal).
Regarding the impact of policy measures on average cost, this evidence supports the weak conclusion
that the policy changes post-2003 did not increase milk production costs in EU-15 (which was not
expected anyway) and that there is no discernible impact on cost-competitiveness.

206
Table 8.2 Total cost of milk production for specialist dairy farms, €/t
2000 2001 2002 2003 2004 2005 2006 2007 Belgium 314 300 301 297 317 308 307 324 Denmark 379 413 391 380 394 386 370 381 Germany 382 406 369 362 343 347 348 392 Greece 286 296 285 397 Spain 255 254 259 258 258 235 247 283 France 355 365 343 353 352 347 363 374 Ireland 301 317 306 285 305 319 326 355 Italy 413 411 399 371 381 392 345 361 Luxembourg 357 368 378 354 359 362 370 404 Netherlands 353 379 378 364 385 341 351 374 Austria 454 463 458 447 430 442 440 446 Portugal 279 282 278 274 279 270 266 298 Finland 562 590 563 578 608 582 619 643 Sweden 481 449 441 448 469 496 452 450 United Kingdom 345 320 301 300 296 298 300 325 EU-15 367 371 357 350 352 346 349 373 Czech Republic 285 319 333 374 Estonia 235 263 279 289 Hungary 299 300 295 324 Lithuania 173 210 228 237 Latvia 224 258 301 355 Malta Poland 192 231 250 270 Slovakia 292 334 521 495 Slovenia 380 362 384 384 EU-10 226 253 271 294 Bulgaria 235 Romania 397 EU-02 361
Source: EU-FADN.
By contrast, average production cost in EU-10 followed a marked upward trend between 2004 and 2007,
but was still well below the EU-15 level in 2007. Average production cost in EU-10 increased by 30%
between 2004 and 2007 (from €226/t to €294/t), with only Slovenia not sharing this trend. Given this
strong increase, one is on safer grounds concluding that it is a real effect and not due to sampling
variation. However, it is due largely to the post-accession transition to EU price levels throughout these
economies, and not to changes in CAP dairy measures.
8.5.2 Gross margin and share of ‘profitable milk’
Figure 8.3 presents some indicators of profitability for specialist dairy farms. Gross margin is equal to
[(milk revenue + direct payments related to dairy (e.g. Article 68) + national aids to milk) minus (specific
costs + non-specific costs)] per tonne of milk, whereas net economic margin is gross margin less costs paid
to external factors (rent, wages), + costs calculated for imputed family factors (family labour and own
labour unpaid costs)] per tonne of milk. Once the dairy premium is merged with the SFP, it no longer
shows up in these calculated margins as – theoretically – it is no longer related to the dairy activity.
The average gross margin in EU-15 showed a declining trend in the period 2001-2006, but increased in
2007 due to higher milk prices (see EQ2). The fall from 2001 to 2003 was as steep as that from 2004 to
2006. By contrast, the gross margin in EU-10 rose from 2004 to 2007. There is a strong contrast
between EU-15 and EU-10 in that, despite opposite trends in gross margin, the trends in net margin and
in the proportions of milk coming from farms with a positive net margin are similar, as is the share of
farms with a positive net margin. This indicates that fixed and imputed costs of family owned factors
were increasing in EU-10 faster than gross margins. The margins achieved in EU-10 are on average
below those of the EU-15, but they are converging over time with those of EU-15 (see also Section 7.5).
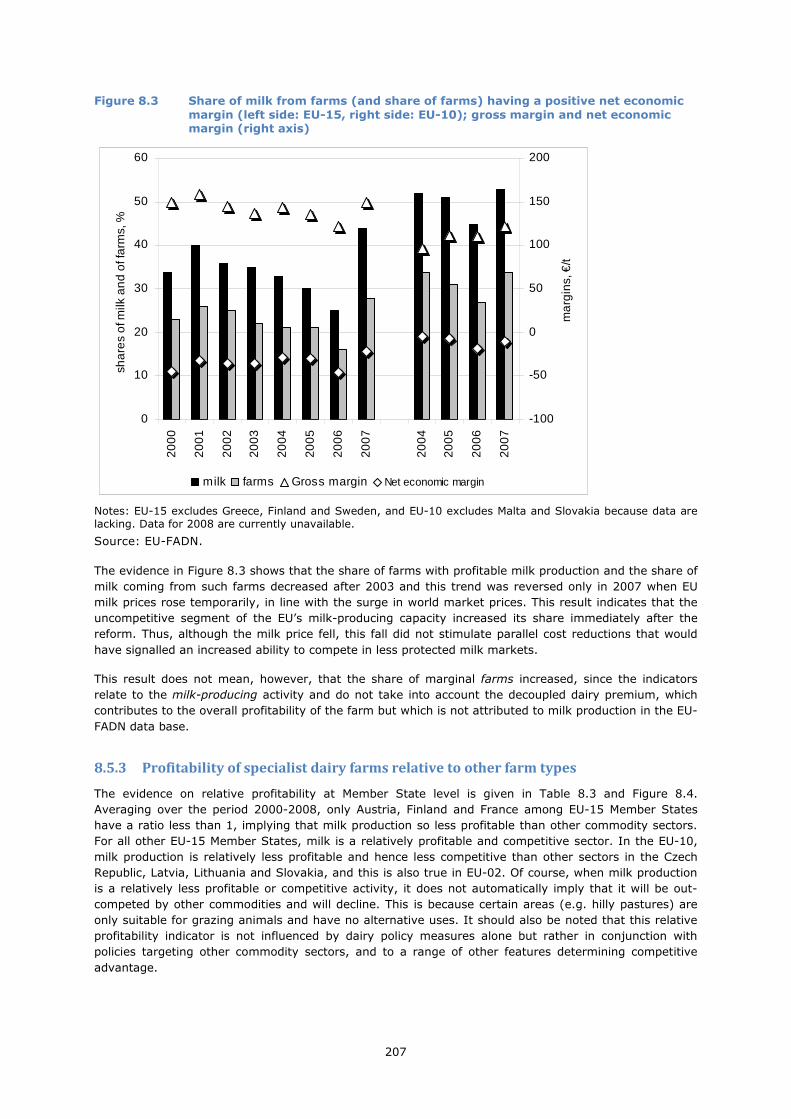
207
Figure 8.3 Share of milk from farms (and share of farms) having a positive net economic
margin (left side: EU-15, right side: EU-10); gross margin and net economic margin (right axis)
0
10
20
30
40
50
6020
00
200
1
200
2
200
3
200
4
200
5
200
6
200
7
200
4
200
5
200
6
200
7
sha
res
of m
ilk a
nd
of f
arm
s, %
-100
-50
0
50
100
150
200
ma
rgin
s, €
/t
milk farms Gross margin Net economic margin
Notes: EU-15 excludes Greece, Finland and Sweden, and EU-10 excludes Malta and Slovakia because data are lacking. Data for 2008 are currently unavailable.
Source: EU-FADN.
The evidence in Figure 8.3 shows that the share of farms with profitable milk production and the share of
milk coming from such farms decreased after 2003 and this trend was reversed only in 2007 when EU
milk prices rose temporarily, in line with the surge in world market prices. This result indicates that the
uncompetitive segment of the EU’s milk-producing capacity increased its share immediately after the
reform. Thus, although the milk price fell, this fall did not stimulate parallel cost reductions that would
have signalled an increased ability to compete in less protected milk markets.
This result does not mean, however, that the share of marginal farms increased, since the indicators
relate to the milk-producing activity and do not take into account the decoupled dairy premium, which
contributes to the overall profitability of the farm but which is not attributed to milk production in the EU-
FADN data base.
8.5.3 Profitability of specialist dairy farms relative to other farm types
The evidence on relative profitability at Member State level is given in Table 8.3 and Figure 8.4.
Averaging over the period 2000-2008, only Austria, Finland and France among EU-15 Member States
have a ratio less than 1, implying that milk production so less profitable than other commodity sectors.
For all other EU-15 Member States, milk is a relatively profitable and competitive sector. In the EU-10,
milk production is relatively less profitable and hence less competitive than other sectors in the Czech
Republic, Latvia, Lithuania and Slovakia, and this is also true in EU-02. Of course, when milk production
is a relatively less profitable or competitive activity, it does not automatically imply that it will be out-
competed by other commodities and will decline. This is because certain areas (e.g. hilly pastures) are
only suitable for grazing animals and have no alternative uses. It should also be noted that this relative
profitability indicator is not influenced by dairy policy measures alone but rather in conjunction with
policies targeting other commodity sectors, and to a range of other features determining competitive
advantage.

208
Table 8.3 Profitability of dairy farming relative to other agricultural sectors, 2000-2008,
FNVA/AWU
2000 2001 2002 2003 2004 2005 2006 2007 2008
EU
-15
Austria 0.84 0.84 0.85 0.73 0.74 0.81 0.84 0.81 0.88
Belgium 0.90 0.96 0.98 0.89 0.97 1.09 1.02 1.31 1.24
Denmark 0.94 0.85 1.37 1.32 1.29 1.16 1.20 1.66 1.90
Finland 0.77 0.84 0.82 0.93 0.98 0.93 0.81 0.70 1.21
France 0.84 0.80 0.86 0.83 0.83 0.92 0.81 0.81 0.89
Germany 1.02 0.98 1.07 0.94 0.95 1.08 1.09 1.30 0.90
Greece 1.34 1.25 1.09 1.41 1.48
Ireland 2.05 2.36 1.94 2.05 2.11 2.10 1.83 2.49 2.36
Italy 1.51 1.75 1.54 1.47 1.60 1.77 1.89 1.67
Luxembourg 1.01 1.09 1.06 1.26 1.09 1.17 1.19 1.35 1.66
Netherlands 1.39 1.21 1.45 1.24 1.45 1.56 1.29 1.83 1.56
Portugal 2.30 1.55 1.52 1.68 2.07 2.15 1.67 2.10 2.12
Spain 0.79 1.05 1.07 1.05 1.43 1.97 1.64 1.73 1.87
Sweden 1.61 1.05 1.15 1.17 1.09 1.13 1.18 0.80 1.10
United Kingdom 1.14 1.47 1.03 1.00 1.29 1.22 1.06 1.20 1.14
Average EU-15 1 1.23 1.20 1.19 1.20 1.28 1.36 1.25 1.41 1.35
EU
-10
Cyprus
Czech Republic 0.86 0.97 0.92 0.86 0.91
Estonia 1.48 1.09 1.00 0.89 1.34
Hungary 1.00 1.20 1.27 1.10 1.03
Latvia 1.12 1.15 0.91 0.74 0.74
Lithuania 1.03 1.19 1.08 0.72 0.74
Malta 1.62 1.43 1.39 2.15
Poland 1.13 1.33 1.44 1.37 1.35
Slovakia 0.31 0.80 1.10 0.74 0.76
Slovenia 1.29 2.82 2.71 1.69 1.84
Average EU-10 1 1.03 1.35 1.32 1.06 1.21
EU
-02 Bulgaria 0.88 0.86
Romania 1.32 0.56
Notes: 1) Arithmetic averages.
Source: EU-FADN.
Figure 8.4 Profitability of dairy farming relative to other agricultural sectors, 2000-2008, FNVA/AWU
1.15
1.20
1.25
1.30
1.35
1.40
1.45
1.50
2000 2001 2002 2003 2004 2005 2006 2007 2008
EU15 average EU25 average
Source: EU-FADN.
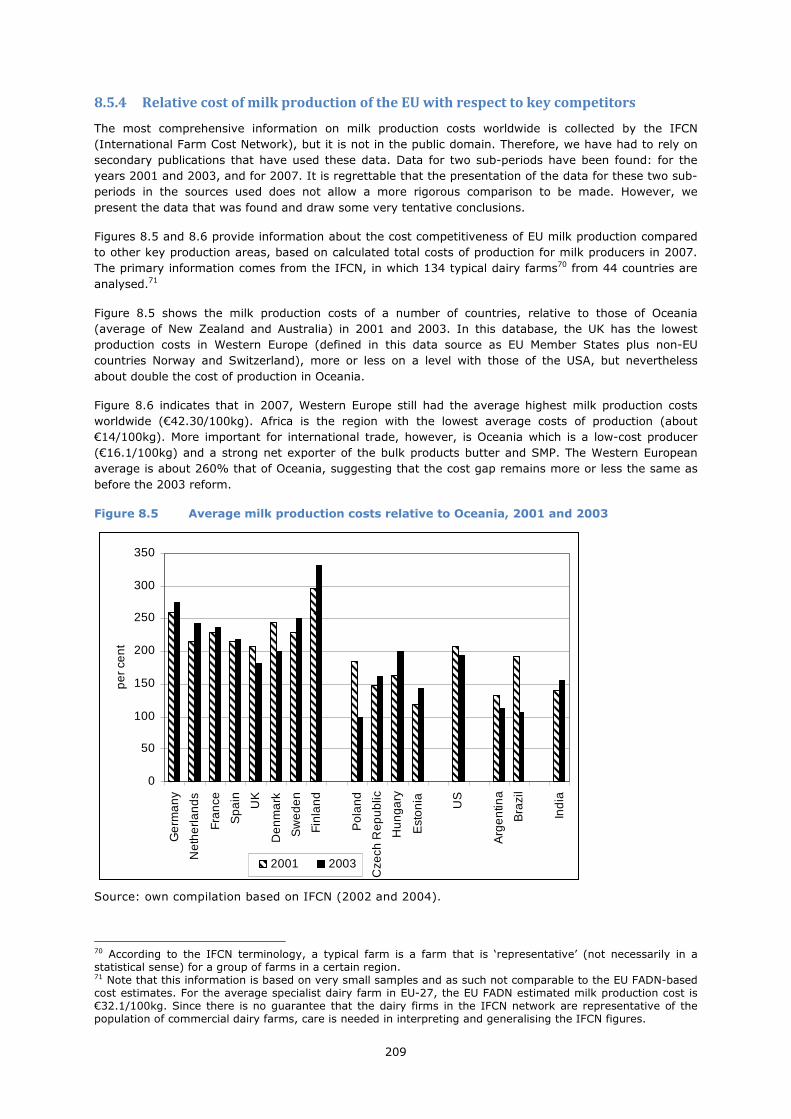
209
8.5.4 Relative cost of milk production of the EU with respect to key competitors
The most comprehensive information on milk production costs worldwide is collected by the IFCN
(International Farm Cost Network), but it is not in the public domain. Therefore, we have had to rely on
secondary publications that have used these data. Data for two sub-periods have been found: for the
years 2001 and 2003, and for 2007. It is regrettable that the presentation of the data for these two sub-
periods in the sources used does not allow a more rigorous comparison to be made. However, we
present the data that was found and draw some very tentative conclusions.
Figures 8.5 and 8.6 provide information about the cost competitiveness of EU milk production compared
to other key production areas, based on calculated total costs of production for milk producers in 2007.
The primary information comes from the IFCN, in which 134 typical dairy farms70 from 44 countries are
analysed.71
Figure 8.5 shows the milk production costs of a number of countries, relative to those of Oceania
(average of New Zealand and Australia) in 2001 and 2003. In this database, the UK has the lowest
production costs in Western Europe (defined in this data source as EU Member States plus non-EU
countries Norway and Switzerland), more or less on a level with those of the USA, but nevertheless
about double the cost of production in Oceania.
Figure 8.6 indicates that in 2007, Western Europe still had the average highest milk production costs
worldwide (€42.30/100kg). Africa is the region with the lowest average costs of production (about
€14/100kg). More important for international trade, however, is Oceania which is a low-cost producer
(€16.1/100kg) and a strong net exporter of the bulk products butter and SMP. The Western European
average is about 260% that of Oceania, suggesting that the cost gap remains more or less the same as
before the 2003 reform.
Figure 8.5 Average milk production costs relative to Oceania, 2001 and 2003
0
50
100
150
200
250
300
350
Ge
rma
ny
Net
he
rlan
ds
Fra
nce
Sp
ain
UK
De
nma
rk
Sw
ed
en
Fin
lan
d
Pol
an
d
Cze
ch R
epu
blic
Hu
nga
ry
Est
on
ia US
Arg
en
tina
Bra
zil
Ind
ia
pe
r ce
nt
2001 2003
Source: own compilation based on IFCN (2002 and 2004).
70 According to the IFCN terminology, a typical farm is a farm that is ‘representative’ (not necessarily in a statistical sense) for a group of farms in a certain region. 71 Note that this information is based on very small samples and as such not comparable to the EU FADN-based cost estimates. For the average specialist dairy farm in EU-27, the EU FADN estimated milk production cost is €32.1/100kg. Since there is no guarantee that the dairy firms in the IFCN network are representative of the population of commercial dairy farms, care is needed in interpreting and generalising the IFCN figures.
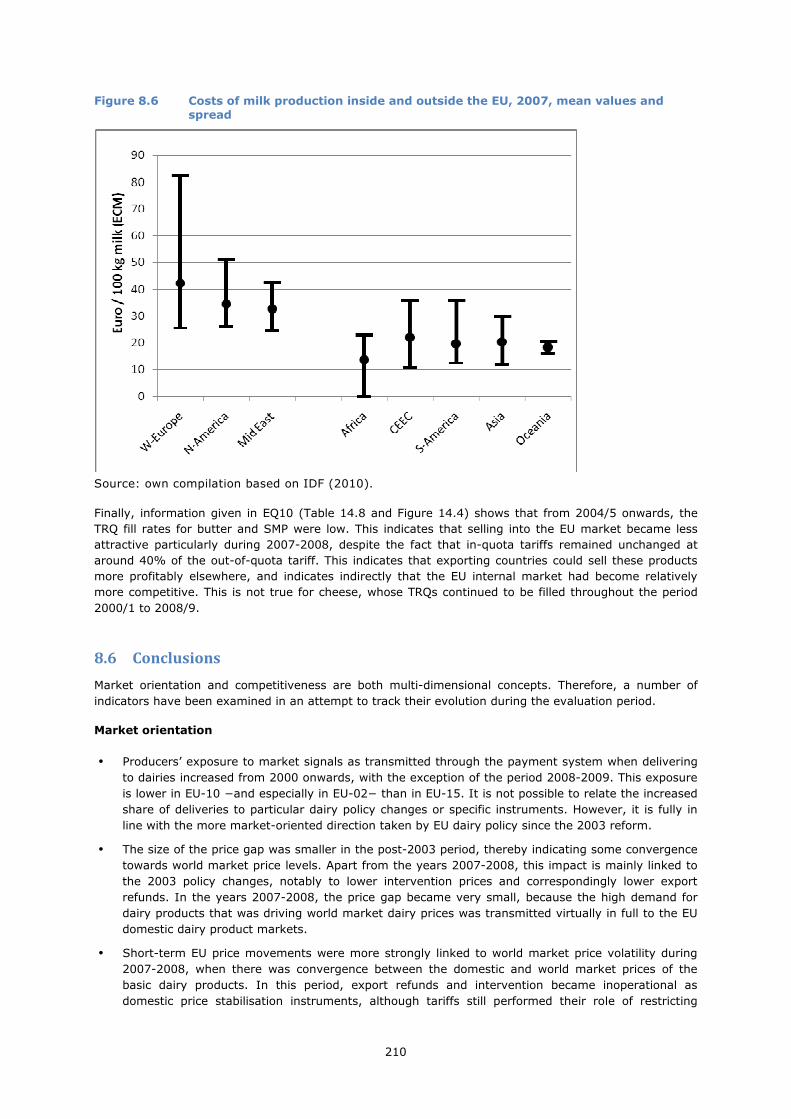
210
Figure 8.6 Costs of milk production inside and outside the EU, 2007, mean values and
spread
Source: own compilation based on IDF (2010).
Finally, information given in EQ10 (Table 14.8 and Figure 14.4) shows that from 2004/5 onwards, the
TRQ fill rates for butter and SMP were low. This indicates that selling into the EU market became less
attractive particularly during 2007-2008, despite the fact that in-quota tariffs remained unchanged at
around 40% of the out-of-quota tariff. This indicates that exporting countries could sell these products
more profitably elsewhere, and indicates indirectly that the EU internal market had become relatively
more competitive. This is not true for cheese, whose TRQs continued to be filled throughout the period
2000/1 to 2008/9.
8.6 Conclusions
Market orientation and competitiveness are both multi-dimensional concepts. Therefore, a number of
indicators have been examined in an attempt to track their evolution during the evaluation period.
Market orientation
• Producers’ exposure to market signals as transmitted through the payment system when delivering
to dairies increased from 2000 onwards, with the exception of the period 2008-2009. This exposure
is lower in EU-10 −and especially in EU-02− than in EU-15. It is not possible to relate the increased
share of deliveries to particular dairy policy changes or specific instruments. However, it is fully in
line with the more market-oriented direction taken by EU dairy policy since the 2003 reform.
• The size of the price gap was smaller in the post-2003 period, thereby indicating some convergence
towards world market price levels. Apart from the years 2007-2008, this impact is mainly linked to
the 2003 policy changes, notably to lower intervention prices and correspondingly lower export
refunds. In the years 2007-2008, the price gap became very small, because the high demand for
dairy products that was driving world market dairy prices was transmitted virtually in full to the EU
domestic dairy product markets.
• Short-term EU price movements were more strongly linked to world market price volatility during
2007-2008, when there was convergence between the domestic and world market prices of the
basic dairy products. In this period, export refunds and intervention became inoperational as
domestic price stabilisation instruments, although tariffs still performed their role of restricting
211
imports onto the EU market. Thus, a relatively high degree of market orientation was achieved
during this period, but it was due to external developments rather than EU policy changes.
• During the evaluation period, there was little change in the competition from imported dairy
products on the EU market, as tariffs and tariff rate quotas remained nearly constant (see Chapter
14).
Competitiveness
• There was a slight fall in the EU-15 unit costs of milk production after 2003 but the evidence is
weak, whereas production costs in the EU-10 increased quite strongly following their accession in
2004. There is no clear link between these findings and changes in dairy policy.
• The share of farms with profitable milk production and the share of milk coming from such farms
decreased after 2003. Evidence presented in EQ9, in which the decoupled dairy premium is included
in dairy income after decoupling to allow a valid comparison, shows that farm income levels were
maintained.
• On average, the EU-15 dairy sector was more viable relative to other agricultural commodity sectors
during 2000-2007; after 2003, its relative viability was higher in every year than before 2003, and
appeared to be following a rising trend. However, in Austria, Finland and France the dairy sector
remained less profitable than other sectors throughout the period. Overall, nonetheless, the policy
changes initiated in 2003 have maintained the position of dairying relative to other competing
commodity sectors. A rising, more variable trend was also observed in the EU-10 countries after
accession.
• Europe (including the EU) is a region with relatively high costs of production. This is in particular
relevant when the EU is compared with Oceania (New Zealand), its key competitor in world dairy
markets. The incomplete empirical evidence presented does not suggest that the cost differential
may be decreasing.
Summary of findings for each indicator, EQ4
Indicator Expected result Evidence found
Market orientation
Producers’ exposure to market signals
Share of total milk
delivered to dairies
The upward secular trend was
expected to continue.
The expected result was not found.
No change in the trend post-2003.
Producers’ response to decoupling of payments
Stated reaction of
producers
Producers were expected to
perceive decoupling as affording
them more freedom in making
production choices.
The expected result was not found.
Decoupling was considered
irrelevant to production decisions.
Willingness to respond to
price falls
It was expected that lower
prices, together with the
decoupling of the premium, could
accelerate the rate of herd
decline.
Lower prices were cited by active
and former producers as a
motivation for ceasing milk
production. However, trends in herd
numbers did not change in response
to lower prices after 2003.
Ability to respond to price
increases
Easier access to quota was
expected to facilitate supply
increases when prices increase.
The expected result was found
during the high-price period 2007-
2008.
Table continues on the next page.

212
Exposure of markets to world market prices
Link between domestic &
world market price
volatility
This link was expected to become
stronger with the weakening of
the intervention system.
The expected result was found only
during 2007-2008, when world
market prices increased to levels
well above EU intervention buying-in
prices.
Price support above world
market levels
The price gap between EU and
world market prices was
expected to become narrower
(partial convergence).
The expected result was found,
partly due to EU policy changes and
partly due to increases in world
market price levels.
Use of export refunds The use of export refunds was
expected to decline, starting in
2004, due to the shrinking price
gap.
The expected result did not occur
immediately. High world market
prices in 2007-2008 rendered export
refunds irrelevant.
Competitiveness
Production cost
� Cost per tonne of milk
� Gross margin over
operating costs
� Share of farms with
positive net profit
The production cost of individual
producers was not expected to
change due to policy changes.
However, average cost for the
sector as a whole could decline, if
the reforms induced lower-
performance herds to quit. If this
occurred, then improvements in
sectoral profitability would result.
The evidence on sectoral production
cost is weak. The share of
‘profitable’ milk and farms declined
immediately after 2003, showing
that lower prices did not stimulate a
countervailing efficiency
improvements among lower-
performing producers.
Competitive advantage relative to other sectors, countries
Profitability relative to
other commodity sectors
It was expected that milk would
maintain its position relative to
other agricultural commodities.
The expected results were found.
International competitiveness
EU milk production cost
relative to main
international competitors
International competitiveness
was expected to improve
providing average cost across the
sector became lower.
The evidence found was insufficient
to allow a conclusion to be drawn
Competitiveness on the
home market – fill rates of
TRQs
Lower internal prices were
expected to reduce the
attractiveness of the EU market
for imports.
Evidence found.

213
9 EQ5: Price stabilisation
To what extent have the CAP measures applicable to the dairy sector contributed to stabilising the
market prices for milk products?
9.1 Interpretation and comprehension of the key terms of the EQ5
The key terms in this evaluation question are ‘price stability’ and ‘stabilisation of prices’. Theoretically,
price stability means the absence of large, short-term fluctuations around the underlying trend in
prices.72 ‘Stabilisation’ involves reducing the amplitude and the frequency of these fluctuations until they
are within acceptable levels. Whether or not prices in a particular market can be considered ‘stabilised’ is
a matter of judgement, and the degree of stabilisation (or, inversely, the extent of ‘acceptable’
fluctuations) in one market may be considered inappropriate in another market. At the same time, price
movements contain important information for market participants about changes in underlying demand
and supply conditions. Removing all price movements prevents the transmission of this information.
Therefore, it is not desirable to remove all fluctuations or to dampen medium-term price variations that
contain useful market signals.
Milk is produced continuously. However, milk supply decisions are usually made on an annual basis.
Moreover, at the first link in the supply chain, most milk is sold under contract rather than in the spot
market, although contracts typically allow for price adjustments within the contract period. The dairy
processing industry can to an extent adjust its product mix more frequently than annually to respond to
differential movements in the market prices for individual products, although this is not true of al firms in
the industry. These considerations suggest that the desired degree of stabilisation and the amount of
price volatility that can be absorbed without economic damage, is not the same for all markets in the
supply chain or for all participants.
CAP measures that can play a role in stabilising market prices have two characteristics: a) they influence
the level of market price (b) they can be adjusted on a relatively short-term basis in order to counteract
short-run price movements. This rules out measures whose impacts on market price are small or
unpredictable, those that are more or less fixed in a longer-term perspective, and those whose effects
are lagged or distributed over time. The CAP measures that have the most potential for stabilising
market prices of dairy products are export refunds, the buying-in rate of intervention for butter and skim
milk powder, and to a much lesser extent certain disposal aids for intermediate and final consumption of
dairy products.73 Most of the latter were abolished in 2009.
Earlier chapters have already referred to the exceptional market conditions that occurred during the
period 2007-2009. In addition to the usual volatility of world market prices for dairy products, the
commodity boom of 2007-2008 produced an exceptionally high spike in their prices on the world market,
which was followed by a sharp fall –beginning at the end of 2008, reaching its lowest point (at levels
comparable with prices earlier in the decade), and then rising again, in some cases quite sharply,
towards the end of 2009. The analysis in this chapter will investigate the impacts of these external price
developments on internal EU prices, and assess the role played by CAP dairy measures in stabilising their
impact.
72 The ‘trend-value’ is the underlying smooth evolution of price around which actual price fluctuates. When a price temporarily undershoots or overshoots its trend value, it sends a misleading signal to market participants. 73 Although intervention thresholds, ceilings and rates are set out in the legislation, the Commission has discretion to vary them according to developments in the market. Ceilings (‘bindings’) for subsidised dairy exports and for expenditure on dairy export subsidies are laid down in the WTO schedules of the Uruguay round agreement on agriculture. Here too, however, within these limits management committees have discretion to vary the amounts and timing of export subsidies.

214
The official intervention buying-in periods for these products (carried over from earlier legislation by the
legislation in force, Regulation (EC) 1234/2007) are fixed as 1 March to 31 August. During this period,
public intervention is opened when market price falls below the corresponding effective intervention
buying-in price. Once the volume ceilings indicated in the legislation are reached, intervention at fixed,
guaranteed prices may be suspended and may be replaced by a tendering system. At other times of the
year, public intervention is officially closed for dairy products. This system has performed well in the past
in its intended role of smoothing internally generated, seasonal price fluctuations.
As already documented in Chapter 6 (answering EQ2), during 2009 the Commission supplemented the
intervention system with a set of special additional measures, including an extension of the period for,
and maximum duration of, private storage aid for butter, an extension of the intervention period beyond
the normal 31 August closing date, and buying-in under tender (at prices close to the fixed buying-in
price) of significant quantities in excess of the fixed-price ceiling. As a result of adopting these measures,
an extra 13 thousand tonnes of butter were taken into private storage during the extended time period
for this measure. By contrast, despite the extension of the open intervention period, intervention buying-
in of butter and SMP effectively stopped in early September and early October, respectively. This does
not, however, exclude that the extended availability of intervention sent a signal to the processing
industry that the safety net for these products would continue to be effective. Moreover, during the
preceding regular intervention period, an additional 53.222 thousand tonnes of butter beyond the 30-
thousand-tonne fixed-price ceiling were bought into intervention under tender, as was an additional
178.587 thousand tonnes of SMP beyond the 109-thousand-tonne fixed-price ceiling for SMP intervention
buying. The total quantities of butter and SMP bought into intervention during 2009 represent 4.5% and
27.4%, respectively, of their 2009 production. Our examination of EU price movements will indicate
whether these additional measures were sufficient and well timed.
The products involved in this evaluation question are butter, SMP, WMP, cheese, drinking milk and
cream. Export refunds can in theory be used for all these products (the categories for which WTO export
ceilings exist are butter, SMP, cheese and other dairy products (see Table 2.48)). Intervention buying
and selling applies only to butter and SMP. The extent to which stabilisation of the price in the market for
one product helps to stabilise prices in other markets, or merely displaces price volatility from one
market to another through the workings of substitution effects between products (on either the supply or
demand side), is beyond the scope of the analysis here. However, these inter-market effects
undoubtedly exist and need to be borne in mind when looking at the data.
9.2 Methodology used for answering EQ5
The effects of the CAP measures on price stability are analysed by comparing the levels and trends in EU
prices with those of world market prices, and by comparing volatility between domestic and world
markets and between the pre-2003 and post-2003 periods.
Volatility is measured by the annualised standard deviation (ASD). As explained in the methodology
section of EQ 2, it is the standard deviation of the logarithm of price multiplied by the square root of the
number of observation periods per year (here 12, because we use monthly data). It is calculated as:
12),...,(),...,( 11 ×= nn ppSDppASD (1)
where npp ,...,1 is a price series in logarithmic form, extending over n periods.
Converting prices to logarithmic form allows price variability to be captured as a percentage of the
(geometric) mean and in this way it resolves the problem of non-comparability between the standard
deviations of different prices either because they have means or trends of different sizes, or because
they are expressed in different currencies. The other volatility indicators presented in EQ2 are not
reported in this evaluation question, as they lead to the same general conclusions.
215
9.3 Judgement criteria, indicators and information sources used for each
indicator
Table 9.1 lists the indicators used to address this evaluation question, their data requirements and the
sources of these data. Both indicators shown in Table 9.1 are calculated for a representative monthly EU
producer price and the monthly world market price of butter, SMP, WMP and cheddar cheese (a cheese
that is heavily traded in world markets). The representative EU prices used for the first three products
are the Dutch producer prices of each commodity, and for cheddar cheese the German price. These
series were chosen in order to ensure sufficiently long time-series data of consistent and homogeneous
quality. The extent to which they are ‘representative’ of EU dairy product prices was carefully checked.
The work of O’Connor (2006), based on sophisticated statistical techniques, confirmed a high degree of
integration across the EU in dairy product markets; not only is the EU market for homogeneous products
very well integrated, functioning like a single market, but price movements are highly correlated between
Member States. For later years (1999 to 2010), we also compared the levels and movements of the
Dutch product prices used in this study with the Commission’s series of weighted average prices at EU
level (DG AGRI, unpublished). The series were found to be very close.74 These findings contrast
somewhat with the evidence on milk raw prices reported in Chapter 6, where a high degree of
heterogeneity between Member States was observed, with the Netherlands being one of the Member
States with the highest volatility, especially in the second part of the evaluation period (see Table 6.2
and Figure 6.5). However, it must be borne in mind that the wholesale product prices analysed in this
chapter are observed at the next link downstream in the supply chain, and for various reasons do not
necessarily exhibit the same characteristics as do prices of particular dairy products. The monthly world
market prices (Productschap Zuivel, various years) refer to the respective Oceania FOB prices. The
indicators span the period 1997–2010. The indicators for cream and drinking milk are not calculated
because reliable data were not available.
Table 9.1 Indicators, data requirements and information sources for EQ5
Indicator Data requirement Information sources
Comparison of movements in EU
market prices and world market
prices for individual dairy products
Representative producer prices
(monthly data)
World market prices (monthly data)
Agra Europe (2010a and b)
Productschap Zuivel (various years)
Comparison of measured price
volatility for the period before and
after 2003 measured by the
annualised standard deviation for
butter, SMP, WMP and cheese
Same series as above Idem
The following judgment criteria are used:
• The level and the trend of the EU producer prices for the above mentioned commodities is examined
for the periods before and after 2003. It is expected to find a decline in the EU prices in particular
for butter and SMP after 2004 because of the gradual reduction in the intervention prices. If this is
found, it would indicate the expected impact of policy changes on prices.
• The annualised standard deviation is used to reach a conclusion whether a) price volatility in the EU
increased in the period after 2003 relative to preceding period and whether b) the degree of stability
of the EU prices relative to the world market prices decreased after the policy changes that are
evaluated in this report. It is expected that stability will be lower because since 2003 market
intervention decisions implied less vigorous use of export subsidies and the scaling down of
intervention storage and disposal aids.
74 For example, for the weighted average series, the means for butter and SMP are €293.6/100kg and €221.3/100kg, respectively, with coefficients of variation 18% and 13%. The comparable figures for the corresponding Dutch prices are €293.1/100kg and €218.7/100kg, with coefficients of variation of 19% and 13%, respectively.

216
9.4 Results and analysis
9.4.1 Butter
Figure 9.1 shows the evolution of butter prices in the EU and in the world markets. The effective
intervention price (90% of the reference price) played a role in the evolution of the EU producer prices.
Until mid-2002 it acted as a floor price limiting the decrease of the EU butter price and maintaining a rather
stable gap between the EU and the world market prices. The gradual reduction of the intervention price,
which started in 2004 as agreed in the 2003 policy reform package, meant that the EU butter price could
fall lower than previously. Hence, after 2004 the gap between the world market price and the EU price
narrowed.
The period 2007-2009 was marked by imbalances worldwide and by sharp fluctuations in prices. For
some months during this period, the world market price for butter was higher than the effective
intervention price. During this period, export refunds and intervention buying were not relevant,
Therefore, EU dairy policy offered virtually no effective internal stabilisation instrument. Hence, the EU
butter price moved in parallel to the world market price. The same situation recurred in 2010.
For some months from late 2008 onwards, the EU price for butter was significantly below the effective
intervention price. This occurred during months when public intervention for butter is not open (see
Regulation (EC) 1234/2007) and so the intervention system did not act as a safety net.
Figure 9.1 Evolution of EU and world butter prices, 1997-2010
1.0
1.5
2.0
2.5
3.0
3.5
4.0
4.5
1997m
01
1998m
01
1999m
01
2000m
01
2001m
01
2002m
01
2003m
01
2004m
01
2005m
01
2006m
01
2007m
01
2008m
01
2009m
01
2010m
01
thousa
nd e
uro
s/to
nne
World price butter EU price butter EU intervention price butter
Notes: The world market price is the Oceania fob export price for butter (82% butterfat); the EU effective intervention price is 90% of the reference price; the EU butter price is a representative price and is based on the Dutch producer prices for butter.
Sources: Agra Europe (2010a and b); Regulations (EC) 1787/2003 and 1234/2007; Productschap Zuivel (various years).
Figure 9.1 shows that the EU representative butter price used was below the effective intervention price
for several months at the end of 2008 and for most of the first part of 2009, although intervention
buying-in of butter began in March 2009. In order to verify this finding, the monthly butter price at
Member State level was checked for those Member States whose data are available in the DG AGRI
(AgriView) data base. The findings are presented in Table 9.2.
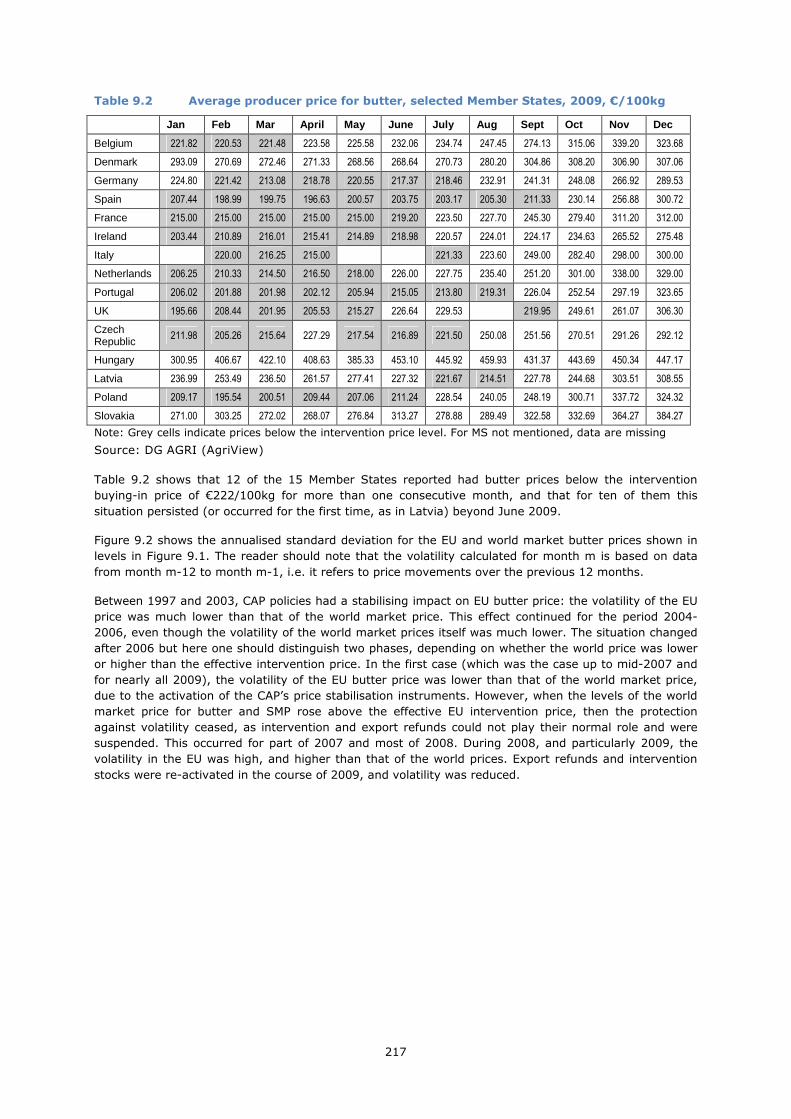
217
Table 9.2 Average producer price for butter, selected Member States, 2009, €/100kg
Jan Feb Mar April May June July Aug Sept Oct Nov De c
Belgium 221.82 220.53 221.48 223.58 225.58 232.06 234.74 247.45 274.13 315.06 339.20 323.68
Denmark 293.09 270.69 272.46 271.33 268.56 268.64 270.73 280.20 304.86 308.20 306.90 307.06
Germany 224.80 221.42 213.08 218.78 220.55 217.37 218.46 232.91 241.31 248.08 266.92 289.53
Spain 207.44 198.99 199.75 196.63 200.57 203.75 203.17 205.30 211.33 230.14 256.88 300.72
France 215.00 215.00 215.00 215.00 215.00 219.20 223.50 227.70 245.30 279.40 311.20 312.00
Ireland 203.44 210.89 216.01 215.41 214.89 218.98 220.57 224.01 224.17 234.63 265.52 275.48
Italy 220.00 216.25 215.00 221.33 223.60 249.00 282.40 298.00 300.00
Netherlands 206.25 210.33 214.50 216.50 218.00 226.00 227.75 235.40 251.20 301.00 338.00 329.00
Portugal 206.02 201.88 201.98 202.12 205.94 215.05 213.80 219.31 226.04 252.54 297.19 323.65
UK 195.66 208.44 201.95 205.53 215.27 226.64 229.53 219.95 249.61 261.07 306.30
Czech Republic
211.98 205.26 215.64 227.29 217.54 216.89 221.50 250.08 251.56 270.51 291.26 292.12
Hungary 300.95 406.67 422.10 408.63 385.33 453.10 445.92 459.93 431.37 443.69 450.34 447.17
Latvia 236.99 253.49 236.50 261.57 277.41 227.32 221.67 214.51 227.78 244.68 303.51 308.55
Poland 209.17 195.54 200.51 209.44 207.06 211.24 228.54 240.05 248.19 300.71 337.72 324.32
Slovakia 271.00 303.25 272.02 268.07 276.84 313.27 278.88 289.49 322.58 332.69 364.27 384.27
Note: Grey cells indicate prices below the intervention price level. For MS not mentioned, data are missing
Source: DG AGRI (AgriView)
Table 9.2 shows that 12 of the 15 Member States reported had butter prices below the intervention
buying-in price of €222/100kg for more than one consecutive month, and that for ten of them this
situation persisted (or occurred for the first time, as in Latvia) beyond June 2009.
Figure 9.2 shows the annualised standard deviation for the EU and world market butter prices shown in
levels in Figure 9.1. The reader should note that the volatility calculated for month m is based on data
from month m-12 to month m-1, i.e. it refers to price movements over the previous 12 months.
Between 1997 and 2003, CAP policies had a stabilising impact on EU butter price: the volatility of the EU
price was much lower than that of the world market price. This effect continued for the period 2004-
2006, even though the volatility of the world market prices itself was much lower. The situation changed
after 2006 but here one should distinguish two phases, depending on whether the world price was lower
or higher than the effective intervention price. In the first case (which was the case up to mid-2007 and
for nearly all 2009), the volatility of the EU butter price was lower than that of the world market price,
due to the activation of the CAP’s price stabilisation instruments. However, when the levels of the world
market price for butter and SMP rose above the effective EU intervention price, then the protection
against volatility ceased, as intervention and export refunds could not play their normal role and were
suspended. This occurred for part of 2007 and most of 2008. During 2008, and particularly 2009, the
volatility in the EU was high, and higher than that of the world prices. Export refunds and intervention
stocks were re-activated in the course of 2009, and volatility was reduced.

218
Figure 9.2 Annualised standard deviation (ASD) for butter prices
0
5
10
15
20
25
30
35
40
45
501998
m01
1999
m01
2000
m01
2001
m01
2002
m01
2003
m01
2004
m01
2005
m01
2006
m01
2007
m01
2008
m01
2009
m01
2010
m01
AS
D
World price butter EU price butter
Notes: The volatility in month m is calculated with data from month m-12 to month m-1.
Source: own calculations.
In summary, as long as the world market price was lower than the effective intervention price for butter,
then EU policies had a positive impact on price stability. However, lowering the effective intervention
price for butter after 2003 made it more likely that the world price could exceed the effective
intervention price. When this happened, from mid-2008 onwards, the volatility in the EU internal butter
price was similar to that of the world market price. Clearly, when the world market price lies above the
intervention buying-in price, then export refunds are irrelevant and lose their ability to reduce domestic
price fluctuations. In an episode like that of 2007-2008 when the usual stabilisation instruments are
inoperational, it is theoretically possible to use changes in domestic consumption aids to counteract internal
price movements, but in practice this would be difficult as these instruments were not designed to
counter short-term price movements and using them for this purpose could well have had a destabilising
effect on use of butter as an intermediate input in food processing. Most disposal aids were discontinued
in 2009.
9.4.2 SMP
Figure 9.3 shows the evolution of the EU producer price and world market price for SMP. As in the case
of butter, up to 2004 the intervention price for SMP was effective in keeping the EU producer price for
SMP above the world market price, except for several months at the end of 2001 when the two prices
coincided. After 2004, the role of the intervention price for SMP decreased both because of the gradual
decrease of the SMP intervention price and because of the increase of the world market price. Starting in
mid-2006, the world market SMP price was higher than the intervention price until the last months of
2008, whereas from late 2008 until late 2009, the EU producer price was below the intervention price by
more than at any other tie in the period covered in Figure 9.3. As was noted for butter, when the world
market price was higher than the intervention price, then the movements in the EU price are strongly
correlated with those of the world market price. The traditional stabilisation measures (export refunds
and intervention buying) are not operational in these conditions.
From late 2008 until late 2009, the EU price for SMP was well below the intervention price, despite the
fact that some of the months concerned coincided with the official ‘open’ buying-in period. Here too, as
was observed for butter, the intervention system did not provide an effective safety net.

219
Figure 9.3 Evolution of EU and world SMP prices, 1997-2010
1.0
1.5
2.0
2.5
3.0
3.5
4.0
1997m
01
1998m
01
1999m
01
2000m
01
2001m
01
2002m
01
2003m
01
2004m
01
2005m
01
2006m
01
2007m
01
2008m
01
2009m
01
2010m
01
thousa
nd e
uro
s/to
nne
World price SMP EU price SMP EU intervention price SMP
Notes: The world market price refers to Oceania FOB export price for non-fat dry milk (1.25% butterfat); the EU SMP price is a representative price and is based on the Dutch producer prices for SMP. The EU intervention price for SMP is the reference price.
Source: Agra Europe (2010a and b); Regulations (EC) 1787/2003, 1234/2007 and 361/2008; Productschap Zuivel (various years).
Figure 9.4 Annualised standard deviation for SMP prices
0
5
10
15
20
25
30
35
40
19
98
m0
1
19
99
m0
1
20
00
m0
1
20
01
m0
1
20
02
m0
1
20
03
m0
1
20
04
m0
1
20
05
m0
1
20
06
m0
1
20
07
m0
1
20
08
m0
1
20
09
m0
1
20
10
m0
1
AS
D
World price SMP EU price SMP
Notes: The volatility shown for month m is calculated with data from month m-12 to month m-1
Source: own calculations.

220
Figure 9.4 presents the annualised standard deviation of the EU producer price and the world market
price for SMP. The combined use of intervention and export refunds had a stabilising effect until 2004,
maintaining the volatility of the EU SMP price well below that of the world market price. This role
continued until mid-2006, even though the world price was rising and the price gap shrinking. However,
in the second half of 2006, the world market price rose above the SMP intervention price. Thereafter, the
volatility of the EU SMP producer price increased and was almost as high as that of the world market
price. This persisted as long as the world market price exceeded the intervention price. In 2009, the EU
market price for SMP was below the intervention price for some months because intervention was
suspended. Export refunds were re-activated during 2009 bringing volatility down a little, but it remained
well above the pre-2007 level.
Figure 9.3 shows that the ‘representative’ producer price for SMP remained below the intervention
buying-in price for many months, beginning at the end of 2008 and continuing until the end of the
summer 2009. Again, in order to check that this is a representative finding, the SMP producer prices at
Member State level from DG AGRI (AgriView) were examined. Table 9.3 presents the monthly results for
those Member States whose data are reported.
Table 9.3 Average producer price for SMP, selected Member States,2009, €/100kg,
Jan Feb Mar April May June July Aug Sept Oct Nov De c
Belgium 174.94 171.90 167.74 168.04 170.04 171.06 171.50 173.90 188.45 206.42 217.16 211.45
Denmark 186.05 183.42 174.59 178.30 187.99 179.32 183.57 180.68 185.66 189.07 206.14 209.24
Germany 161.50 165.00 166.50 167.50 167.50 167.50 167.50 171.50 182.50 197.00 211.70 210.00
France 172.00 168.25 164.70 165.50 166.50 166.80 167.00 168.80 180.10 201.00 219.40 213.40
Netherlands 151.25 160.33 164.00 164.25 165.00 165.00 165.00 166.40 179.00 197.00 218.00 213.75
UK 171.22 163.91 163.36 168.31 172.89 179.81 175.41 177.39 167.75 177.18 190.18 195.89
Czech Republic
157.73 152.34 156.54 154.15 158.53 162.86 168.62 162.51 166.15 169.10 174.44 192.71
Hungary 193.96 183.65 326.57 334.04 443.89 459.98 443.09
Latvia 321.01 277.79 293.50 276.25 206.09 236.33 190.78 192.26 198.55 165.41 181.70 229.09
Poland 142.58 139.54 146.77 155.34 155.70 154.40 161.85 165.82 164.09 171.85 189.40 192.52
Slovakia 279.24 237.83 247.55 175.94 176.43 213.98 181.20 181.04 185.78 180.44 219.68 254.06
Note: Grey cells indicate prices below the intervention price level. For MS not mentioned, data are missing
Source: DG AGRI (AgriView)
Table 9.3 indicates that a number of Member States had producer prices well below the intervention
buying-in price of €175/100kg for a number of months in 2009. The evidence in Tables 9.2 and 9.3
indicates that despite the additional measures adopted during 2009 to strengthen the safety-net role of
the intervention system, it was not able to keep prices above the minimum level. Moreover, unlike the
evidence for butter (where the situation in a number of Member States began slowly to improve once
intervention buying began) the low prices for SMP were more persistent and in six of the countries shown
it persisted until August (or beyond).
9.4.3 WMP
The EU market price of WMP is strongly related to the prices of SMP and butter. While there is no
intervention price for WMP, the intervention prices for butter and SMP indirectly affect the formation of
the EU WMP producer price.
Considering the relationship between the EU producer price and the world market price for WMP shown in
Figure 9.5, two periods can be distinguished. The first extends up to the first quarter of 2007, during
which the EU price was above the world market price, and the second period is from then on. In the first
period, there is a considerable price gap. Some of the fluctuations in the world market price are
transmitted to the EU price but with a smaller amplitude. In the second period, the EU and the world
market prices are almost the same, except that in 2009 the EU price did not drop as low as the world
market price. Thus, export refunds, which were the only CAP instrument available directly for stabilising
WMP prices, played a role in keeping the EU prices above the world market up to 2007. WMP prices
probably also benefited indirectly form the stabilising effect of intervention on butter and SMP prices.

221
Figure 9.5 Evolution of EU and world WMP prices, 1997-2010
1.0
1.5
2.0
2.5
3.0
3.5
4.0
1997m
01
1998m
01
1999m
01
2000m
01
2001m
01
2002m
01
2003m
01
2004m
01
2005m
01
2006m
01
2007m
01
2008m
01
2009m
01
2010m
01
thousa
nd e
uro
s/to
nne
World price WMP EU price WMP
Notes: The world market price refers to Oceania FOB export price for WMP (26% butterfat); the EU WMP price is a representative price and is based on the Dutch producer prices for WMP.
Source: Agra Europe (2010a and b); ProductschapZuivel (various years).
Figure 9.6 Annualised standard deviation for WMP prices
0
5
10
15
20
25
30
35
40
19
98m
01
19
99m
01
20
00m
01
20
01m
01
20
02m
01
20
03m
01
20
04m
01
20
05m
01
20
06m
01
20
07m
01
20
08m
01
20
09m
01
20
10m
01
AS
D
World price WMP EU price WMP
Notes: The volatility shown for month m is calculated with data from month m-12 to month m-1.
Source: own calculations.

222
The annualised standard deviation for WMP prices (Figure 9.6) shows that until late 2006 the EU
producer price for WMP was less volatile that the world market price. During 2006, the volatility of the
EU price increased and reached the volatility level of the world market prices. This confirms the
conclusion drawn on the basis of Figure 9.5. Although world market turbulence was greater in these last
years, an important factor is that the additional volatility of EU butter and SMP prices, due to the world
price being higher than the intervention price for these products, is transmitted via their substitutability
in production to the WMP price. Thus, indirectly the lowering of the intervention prices for the two
intervention products has also affected WMP price volatility.
9.4.4 Cheese
The EU cheese market is more heterogeneous than the markets for the commodities discussed so far.
We begin by analysing the volatility in the price of one widely consumed and traded cheese, cheddar
cheese, which is produced in a number of Member States. Figure 9.7 presents the average EU producer
price and the world market prices for cheddar, while Figure 9.8 shows the annualised standard deviation
for those two prices.
The EU cheddar price was higher than world market price until 2007. It had reached a peak in 2001,
after which it fell gradually. At the start of 2003 there was a sudden drop of about €500/t, after which it
remained at a steady level with a price gap that was never less than €500/t. After 2007, the world
market price for cheddar surged upwards, pushing the EU producer price for cheddar up almost to its
former 2001 peak.
The volatility of the EU price was for most of the period lower than that of the world market price, both
before and after the EU policy changes, with two exceptions - in 2000 and in 2001 (see Figure 9.8).
Although after 2007 the volatility of the EU price increased, it remained below that of the world market
price. The EU cheddar price was less volatile than other EU dairy product prices during the period of price
turbulence (2007-2008). This is partly because the CAP export refunds played a stabilising role. Another
factor is the structure of the European cheese market, which is characterised by many close substitutes.
Figure 9.7 Evolution of EU and world cheddar prices, 1997-2010
1.0
1.5
2.0
2.5
3.0
3.5
4.0
4.5
5.0
1997
m01
1998
m01
1999
m01
2000
m01
2001
m01
2002
m01
2003
m01
2004
m01
2005
m01
2006
m01
2007
m01
2008
m01
2009
m01
2010
m01
thousa
nd e
uro
s/to
nne
World price cheddar EU price cheddar
Notes: The world market price refers to Oceania FOB cheddar cheese price, 39% moisture; the EU cheddar price is a representative price and is based on the German producer prices for cheddar cheese.
Source: Agra Europe (2010a and b), ProductschapZuivel (various years).

223
Figure 9.8 Annualised standard deviation for cheddar cheese prices
0
5
10
15
20
25
30
35
40
45
50
199
8m
01
199
9m
01
200
0m
01
200
1m
01
200
2m
01
200
3m
01
200
4m
01
200
5m
01
200
6m
01
200
7m
01
200
8m
01
200
9m
01
201
0m
01
AS
D
World price cheddar EU price cheddar
Notes: The volatility in month m is calculated with data from month m-12 to month m-1.
Source: own calculations.
Figure 9.9 Monthly producer prices for Gouda, Emmentaler, Edammer and Cheddar cheese, 2006-2010
2.0
2.5
3.0
3.5
4.0
4.5
5.0
2006
m01
2006
m07
2007
m01
2007
m07
2008
m01
2008
m07
2009
m01
2009
m07
2010
m01
2010
m07
thou
sand
eur
os/t
onne
Gouda Germany Edammer Germany Emmentaler Germany
Cheddar UK Emmentaler Poland
Source: Productschap Zuivel (various years).
As the relative prices of different cheeses change and one price starts to get out of alignment with
others, shifts in demand between cheeses play a stabilising role. Cheddar is widely traded on
international markets. However, the EU has a large number of other substitutable cheeses that are not

224
traded to nearly the same extent, if at all, and whose prices can absorb some of the shock of price
volatility for the more heavily traded cheeses, which in turn moderates the volatility in these traded
cheeses.
Figures 9.9 and 9.10 give some examples of the price fluctuations for other more ‘domestic’ cheeses
during the second part of the 2000s. Prices of PDO cheeses, such as Parmigiano Reggiano, Grana
Padano, or Provolone hardly fluctuated between 2006 and 2010 (Figure 9.10) and were not influenced
either by the world market imbalances or by the CAP price stabilising instruments.
Figure 9.10 Producer prices for PDO cheeses, 2006-2010
4
5
6
7
8
9
10
11
2006
m01
2006
m07
2007
m01
2007
m07
2008
m01
2008
m07
2009
m01
2009
m07
2010
m01
2010
m07
thou
sand
eur
os/ton
ne
Parmigiano Italy Grana Padano Italy Provolone Italy
Source: Productschap Zuivel (various years).
9.4.5 Drinking milk and cream
The survey of dairy processors conducted for this evaluation confirmed that prices for drinking milk are
negotiated between the dairies and the retailers, and hence are considered by both parties to be sensitive
information, which for strategic reasons cannot be reported in any statistical report. Indeed, EU prices for
this link of the supply chain cannot be found anywhere in the public domain and only consumer prices
are ever reported (ILO, various years). Although the dairy companies participating in the survey refused
to give any data on drinking milk prices, they clearly stated that the level of the prices depends mainly
on the retailers’ market power. Therefore, CAP price stabilisation measures (intervention and exports
refunds for other products) and the changes in these measures since 2003 are not expected to affect the
prices of drinking milk directly. Any effects that might be detected will have been indirect only, and
simply because drinking milk competes with other dairy products for its raw material.
For cream, data are scarce and unreliable. This made it impossible to calculate any indicators. Our
survey respondents confirmed the existence of a link between the cream and the butter prices, implying
that the effects of the CAP reform go in same direction as for butter prices. One can assume that there
are also parallels between the volatility of cream prices and butter prices.
9.5 Conclusions
EU prices for dairy products were substantially above world market prices prior to 2003, and this
situation continued after the 2003 reform until late 2006-early 2007. The price gap was eliminated for
225
nearly two years thereafter, because of exceptionally high world market prices. The CAP policy changes
were not a direct casual factor in these changed market conditions, which were generated by events on
world markets.
EU dairy product prices became more volatile in the second part of the post-2003 period. Volatility began
to increase sharply during 2006 for butter and WMP (some months earlier for SMP and about a year
later, and much less markedly, for cheese) when world market price levels rose to very high levels,
considerably above EU intervention prices. From here on, export refunds and intervention became
inoperational as stabilisation instruments for butter and SMP. This phenomenon was caused by unstable
demand movements on world market. CAP policy changes were not direct causal factors, although lower
internal prices and a scaled-down intervention system increased the probability that such an episode
could occur.
During this episode of high world market prices, world market price volatility was transmitted without
impediment to EU prices for butter, SMP and WMP. The situation for cheese is somewhat different. The
EU produces a wide variety of cheeses, some of which −like Cheddar cheese− are heavily traded on
world markets whilst others are mainly consumed internally. Shifts in consumer demand between
cheeses on the EU market helped to smooth the volatility coming from the world market in the domestic
prices of the traded cheeses.
Clearly, the EU policy reform was not the cause of the increased volatility, which originated in the over-
heating of world commodity markets and the price spikes for many agricultural commodities, including
dairy products, on world markets. However, the episode has revealed three important properties of the
reformed CAP, namely that (a) when intervention prices are set at low ‘safety-net’ levels, there is a
greater probability of world market price exceeding intervention price and such a situation developing,
(b) when this happens, the CAP has no effective price stabilisation instrument to dampen upward price
surges and (c) when prices fall suddenly and steeply, as may easily happen after a price spike, even if
world market prices fall below intervention levels, the safety net may be slow to react (if this occurs
outside the regular intervention period and additional legislation is needed) and even when extra
measures are in place, it may be insufficient. Expectations play a role here: if processors are uncertain
that the safety net will be activated quickly enough or so as to receive a sufficient volume of intervention
products in the short run to deal with emergency conditions of this kind, they will be cautious about the
prices they offer for raw milk.
For both butter and SMP, the average internal price was below the intervention price for some months,
starting in late 2008 and extending into 2009. The official intervention buying-in periods for these
products (carried over from earlier legislation by the legislation in force, Regulation (EC) 1234/2007) are
fixed as 1 March to 31 August. During this period, public intervention is opened when market price falls
below the corresponding effective intervention buying-in price. Once the volume ceilings indicated in the
legislation are reached, intervention at fixed, guaranteed prices may be suspended and may be replaced
by a tendering system. At other times of the year, public intervention is officially closed for dairy
products.75 As described in section 9.1, the tendering system was activated during 2009 once the
intervention system had been opened at the normal time and the fixed-price ceilings were reached.
Other measures were taken. However, EU internal prices for SMP. WMP and cheddar did not start to
recover from their lowest level until the second half of 2009. Although the recovery in the butter price
began early in 2009 (possibly due to the earlier opening of private butters storage), it did not rise above
the effective intervention price until mid-2009. This was also the case for SMP. Evidence at Member State
level shows that this situation was experienced in a number of Member States and in some cases it
persisted over a period of months. This evidence suggests that the complementary measures were not
adopted quickly enough.
The exceptional market conditions occurring in late 2008-2009 highlight the fact that the parameters of
the intervention system for dairy products, particularly the fixed buying-in period which coincides with
the seasonal abundance of EU milk during the summer months, still reflects a context where EU dairy
markets were heavily insulated from world markets and price fluctuations were internally generated,
75 Regulation (EC) 1234/2007, Article 47, contains provision for special market measures in the cereal sector whereby, ‘where the market situation so dictates’, special intervention measures may be taken. These special measures would be triggered by disruptive falls (or the threat of such a fall) in the market price (in relation to the intervention price). However, no such mechanism exists for the dairy sector.

226
almost invariably by seasonal factors. However, in a more market-oriented context where EU dairy
markets are potentially exposed to exogenous price volatility coming from the world market, which can
occur in any period of the year, an intervention system calibrated on internally generated seasonality is
unable to provide a year-round safety net.
Summary of findings for each indicator, EQ5
Indicator Expected result Evidence found
Comparison of movements
in EU market prices and
world market prices for
individual dairy products
It was expected that more world
price volatility would become
transmitted to internal prices
after the fall in the price gap and
the weakening of the intervention
system.
EU butter price: volatility was lower
during 2004-7 than in the early
2000s, but was very high during
2008-9 – and for one year was
higher than the volatility of world
market prices.
EU SMP price: volatility was lower
during 2004-7 than in the early
2000s, but became much higher in
2008-9, comparable to that of world
market prices.
EU WMP price: volatility unchanged
until end-2007 relative to the early
2000s, but during 2008-9 it matched
that of world market prices.
EU Cheddar price: volatility during
2005-mid-2008 was lower than in
the early 2000s. It then increased
moderately, but remained well below
that of world market prices. This is
not a policy effect. It is explained by
the structure of the EU market,
where the volatility of world market
prices transmitted via the prices of
types of cheese that are heavily
traded on the world market is partly
absorbed (via substitution effects)
by prices of less traded cheese.
Comparison of measured
price volatility for the
period before and after
2003 measured by the
annualised standard
deviation for butter, SMP,
WMP and cheese
227
10 EQ6: Market balance
To what extent have the CAP measures applicable to the dairy sector contributed to balancing supply and
demand for milk products?
10.1 Interpretation and comprehension of the key terms of the EQ6
The interpretation of supply, demand and balance used in addressing this question is the same as that
set out in Evaluation Question 1 (see Chapter 5).
The milk products involved are listed in the Technical Specification of this project, namely:
• Butter
• Skimmed milk powder (SMP)
• Whole milk powder (WMP)
• Cheese
• Drinking milk
• Cream
The CAP instruments that potentially affect the demand of the above-mentioned products are a)
consumption aid schemes aiming to increase domestic consumption b) export refunds. Imported supply
depends on tariffs and tariff rate quotas (TRQs), which were rather constant over the period and are not
explicitly evaluated here. These measures increase the total market off-take of end-users of dairy
products (final demand). Domestic supply of dairy products depends on the total amount of milk
produced, the overall capacity of the processing industry, and (for individual products) decisions
concerning the relative shares of particular processed products in product mix. Total milk supply is
strongly influenced by milk quotas, and as has been established in EQ1, has since 2003 become more
responsive to the producer price of milk. There are no policy instruments that target the size or structure
of the processing sector. Clearly, the level of intervention prices provides an incentive for processors to
produce butter and SMP rather than products with higher value added. It is expected that, as
intervention prices have fallen, the share of these products in the total supply of dairy products has fallen
and it is expected that their structural surplus will also have fallen relative to that of other dairy
products. Two further CAP instruments, public intervention stock-holding and private storage of milk
products, also affect the market surplus in the short run, as they can be used to alter the timing of
disposal of the products to end-users.76
10.2 Methodology used for answering EQ6
A market is in balance when supply equals demand, i.e. when there is no surplus or deficit. As was
explained in Chapter 4, market balance is established more or less automatically in a market with perfect
competition where prices and quantities are free to adjust. However, if quantities and prices are not free
to adjust then market imbalances are likely to occur. When prices are supported at levels above the
market-clearing price, excess supply accumulates on the market. Policy measures are then needed to
deal with the resulting surplus.
76 For more detail on the CAP measures aiming to reduce the imbalance between supply and demand of milk products, see section 3.1.

228
The methodology for addressing this evaluation question (see also EQ1a, Chapter 5) distinguishes
between structural excess supply and market surplus. Structural excess supply is the excess of total
supply on the market and total unsubsidised final demand. Market surplus is structural excess supply
minus temporary demand for stocks (which will have to be returned to the market at a later time).
Structural balance for EU raw milk is given by equation (1):
Any subsidised final demand that increase domestic demand beyond its level without subsidies or exports
beyond what could be exported without subsidy are elements of the structural excess supply.
The structural excess supply is therefore defined as
In the analysis below, equation (2) is used to measure market imbalance and its evolution over time for
each of the dairy products concerned.
10.3 Judgement criteria, indicators and information sources used for each
indicator
The indicators and information sources necessary to analyse EQ1 are provided in Table 10.1.
Table 10.1 Indicators, data requirements and information sources for EQ6
Indicator Data requirement Information sources (2000-2009)
Structural excess supply of
Butter, SMP, WMP, cheese
Production in dairies
Subsidised exports
Change in intervention (public)
stocks
Change in subsidised private
stocks
Demand resulting from domestic
aids to consumption
DG AGRI (various years)
DG AGRI (unpublished)
The indicator is calculated for each of the four products shown in Table 10.1. It has not been possible to
calculate an indicator for drinking milk and cream for lack of data.
Production in dairies and trade flows for cheese, butter and SMP have been taken from DG AGRI’s annual
agricultural statistical report (various years). Figures on aided consumption and changes in intervention
stocks have been taken from the same source. Data on the quantities of butter, SMP, WMP and cheese
exported with refunds as agricultural products (i.e. not including non-Annex 1 subsidised amounts) have
been provided by DG AGRI (unpublished data).
The impact of the CAP policies and changes in those policies is judged by examining the trends in the
structural excess supply for each dairy product before and after the 2003 policy changes.
Structural balance occurs when
EU domestic supply + imports = unsubsidised EU consumption + unsubsidised exports (1)
Structural excess supply = subsidised EU consumption + subsidised exports (2)

229
10.4 Results and analysis
The structural excess supply is presented for each product separately. The figures on which the
reasoning is based refer to the EU within its boundaries in the year of observation. Thus, up to and
including 2003, the ‘EU’ refers to EU-15, and so on. The years shown in the tables are calendar years.
10.4.1 Butter
Table 10.2 shows the total supply (production + imports) and the structural excess supply of butter in
the EU. Two enlargements increased production capacity as new member States joined the EU. This
masks the fact that, after about 2004, the underlying trend in production in each of the regions of the EU
was slightly declining. Aided consumption was between about 530 and 600 thousand tonnes up to and
including 2006, but in 2007-2009 it was well below previous levels. From 2008 onwards all programmes
targeting domestic consumption of butter ended except those open to certain non-profit making bodies.
Exports with refunds were also lower in these years and no refunds were paid for butter in 2008 since
the world market price was higher than the EU’s effective intervention buying-in price. The years 2004 to
2007 were years of net selling-off of intervention stocks. In 2009, intervention stocks were accumulated
again. There was also de-stocking by private stockholders who benefited from storage subsidies during
most of the period.
The result of these various activities for the structural excess supply of butter is that it peaked in 2002,
fell very gradually until (and including) 2006 and then dropped quite steeply in the last three years
shown in Table 10.2.
Table 10.2 Structural excess supply for butter in the EU-15/25/27, 2000-2009, 1,000 t 1
2000 2001 2002 2003 2004 2005 2006 2007 2008 2009
Production in dairies 1,929 1,836 1,770 1,969 2,162 2,214 2,128 2,150 2,140 2,100
Imports 106 116 117 116 93 83 92 93 65 62
Subsidised consumption 538 551 533 535 600 564 607 235 18 12
of which:
Food processing 462 476 465 490 490 479 475 155 0 0
welfare schemes 32 32 27 3 27 34 45 24 0 0
non-profit making bodies 30 29 27 27 24 24 22 22 18 12
butter concentrate 14 14 14 14 15 15 15 5 0 0
Subsidised exports 187 176 276 303 339 306 236 131 0 163
Net change in stocks2
Public (intervention) Private, aided by EU
9
-7
4
18
124 -25
31 -1
-63
-4
-39
-1
-58 -13
-63 16
0
-12
77
-11
Structural excess supply (SES) 725 727 809 838 939 870 843 366 18 175
SES as % of total supply 35.6 37.2 42.9 40.2 41.6 37.9 38.0 16.3 0.8 8.1
Notes: 1) For 2000-2003: EU-15, for 2004-2006: EU-25, and for 2007-2009: EU-27. 2) The change is given as closing stocks minus beginning stocks.
Source: DG AGRI (various years and unpublished); own calculations.
10.4.2 SMP
Changes in the structural excess supply of SMP follow a similar pattern as those of butter and are shown
in Table 10.3. It increased until 2002, after which it started to decline. The decrease is associated with
the declining production of SMP from 2004 onwards, to the slight increase of non-aided consumption and
to a decrease of imports. The non-subsidised exports varied between the years but the total exports
remained rather unchanged.
The structural excess supply of SMP shows the impact of the 2003 reforms from 2005 onwards.
regarding market intervention measures. The subsidised consumption refers to the use of SMP in animal
feed (for calves), which was abolished from 2007. Subsidised exports and intervention stocks adjusted

230
downwards because they are linked to the intervention price for SMP, which was gradually reduced by
5% between 2004 and 2006 and was further reduced by 3% between 2007 and 2008 (Table 2.40).
Table 10.3 Structural excess supply for SMP in the EU-15/25/27, 2000-2009, 1,000 t1
2000 2001 2002 2003 2004 2005 2006 2007 2008 2009
Production in dairies 961 953 1,016 976 955 965 864 919 863 964
Imports 78 57 69 94 26 7 19 10 8 6
Subsidised consumption 476 326 436 426 414 362 264 0 0 0
Subsidised exports 287 86 270 182 222 190 21 0 1 255
Net change in stocks2
Public (intervention) Private, aided by EU
-173 0
-7 0
141 0
53 0
-129 0
-65 0
0 0
0 0
0 0
258 0
Structural excess supply (SES) 763 412 706 608 636 552 285 0 1 255
SES as % of total supply 73.4 40.8 65.1 56.8 64.8 56.8 32.3 0.0 0.1 26.3
Notes: 1) For 2000-2003: EU-15, for 2004-2006: EU-25, and for 2007-2009: EU-27. 2) The change is given as closing stocks minus beginning stocks.
Source: DG AGRI (various years and unpublished); own calculations.
10.4.3 WMP
Table 10.4 shows that, as there were no consumption aids for WMP, the entire structural excess supply
had to be exported. Up to and including 2006, a significant share (44-64%) of total supply of WMP was
exported with the aid of refunds. As for SMP, there is considerable annual variation in the SES for WMP.
Therefore, it is unwarranted to interpret the slightly lower figure in 2006 as the beginning of a downward
trend that might be attributed to the policy reforms. Instead, the behaviour of the structural excess
supply for WMP is best described as fluctuating around a stable level up to 2006, then disappearing in
2007 and 2008 due to a sharp increase in non-subsidised exports in 2007-2008, due to the world market
commodity boom.
Table 10.4 Market excess supply for WMP in the EU-15/25/27, 2000-2009, 1,000 t1
20002 20012 20022 2003 2004 2005 2006 2007 2008 2009
Production in dairies 891 836 799 793 858 849 788 796 878 790
Imports 3 5 9 8 4 3 2 2 1 1
Subsidised exports 497 398 518 446 443 420 349 0 0 91
Structural excess supply (SES) 497 398 518 446 443 420 349 0 0 91
SES as % of total supply 55.6 47.3 64.1 55.7 51.4 49.3 44.2 0.0 0.0 11.5
Notes: 1) For 2000-2003: EU-15, for 2004-2006: EU-25, and for 2007-2009: EU-27.2) The subsidised exports for those years have been estimated as 50% of the subsidised exports for the category ‘other milk products’.
Source: OECD-FAO (2011); own calculations.
Although there is no intervention for WMP, its price is linked closely to those of the intervention products
butter and SMP. When butter and SMP prices are low relative to that of WMP, some producers switch
their production away from the two intervention prices to WMP. The analysis of EQ 5 (see Chapter 9)
shows that, from early 2007 until the end of 2008, EU prices and world market prices for WMP virtually
coincided. This explains why the use of export subsidies for this product became irrelevant in these two
years. For much of that period, the EU intervention prices for butter and SMP were also below world
market price levels for those products.
10.4.4 Cheese
Table 10.5 shows the structural excess supply of cheese in the EU. Cheese production in the EU grew in
most years after 2000, even after the effect of two enlargements is taken into account. The structural
excess supply, which remained above 4% of total supply during 2000-2004, was significantly lower as a
share of supply in 2005 and 2006, and fell very sharply in 2007-2008 because of an increase in
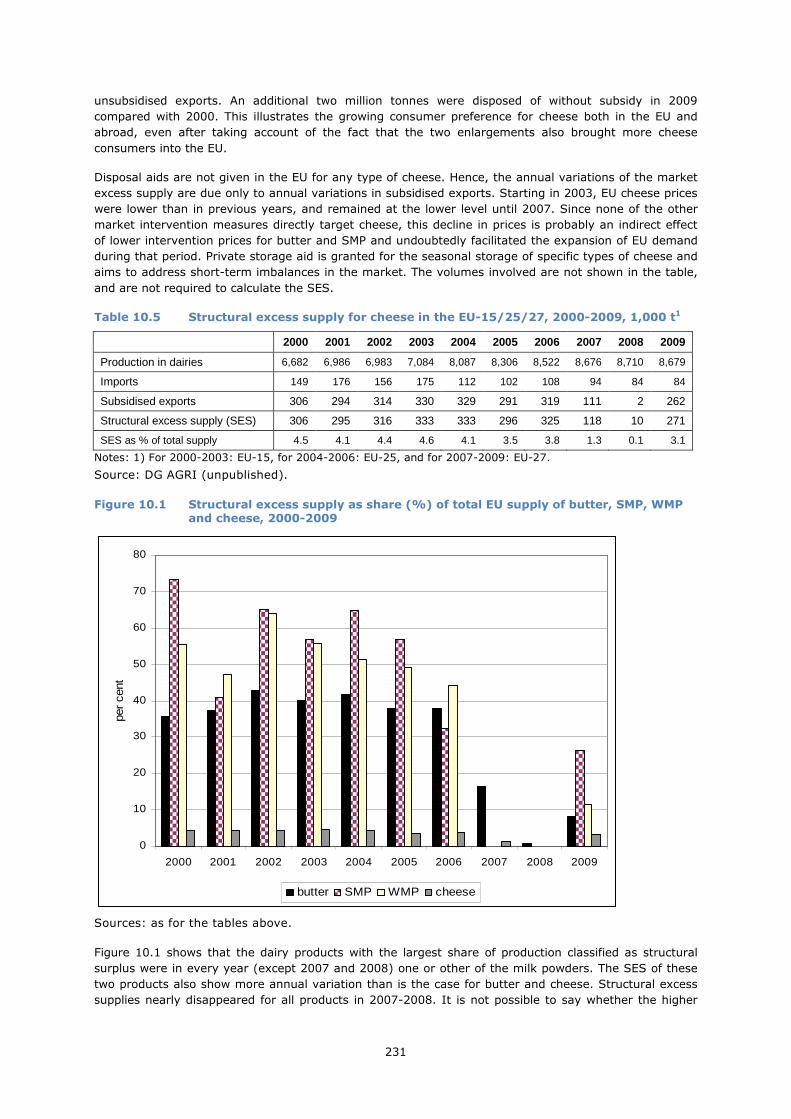
231
unsubsidised exports. An additional two million tonnes were disposed of without subsidy in 2009
compared with 2000. This illustrates the growing consumer preference for cheese both in the EU and
abroad, even after taking account of the fact that the two enlargements also brought more cheese
consumers into the EU.
Disposal aids are not given in the EU for any type of cheese. Hence, the annual variations of the market
excess supply are due only to annual variations in subsidised exports. Starting in 2003, EU cheese prices
were lower than in previous years, and remained at the lower level until 2007. Since none of the other
market intervention measures directly target cheese, this decline in prices is probably an indirect effect
of lower intervention prices for butter and SMP and undoubtedly facilitated the expansion of EU demand
during that period. Private storage aid is granted for the seasonal storage of specific types of cheese and
aims to address short-term imbalances in the market. The volumes involved are not shown in the table,
and are not required to calculate the SES.
Table 10.5 Structural excess supply for cheese in the EU-15/25/27, 2000-2009, 1,000 t1
2000 2001 2002 2003 2004 2005 2006 2007 2008 2009
Production in dairies 6,682 6,986 6,983 7,084 8,087 8,306 8,522 8,676 8,710 8,679
Imports 149 176 156 175 112 102 108 94 84 84
Subsidised exports 306 294 314 330 329 291 319 111 2 262
Structural excess supply (SES) 306 295 316 333 333 296 325 118 10 271
SES as % of total supply 4.5 4.1 4.4 4.6 4.1 3.5 3.8 1.3 0.1 3.1
Notes: 1) For 2000-2003: EU-15, for 2004-2006: EU-25, and for 2007-2009: EU-27.
Source: DG AGRI (unpublished).
Figure 10.1 Structural excess supply as share (%) of total EU supply of butter, SMP, WMP and cheese, 2000-2009
0
10
20
30
40
50
60
70
80
2000 2001 2002 2003 2004 2005 2006 2007 2008 2009
per
cent
butter SMP WMP cheese
Sources: as for the tables above.
Figure 10.1 shows that the dairy products with the largest share of production classified as structural
surplus were in every year (except 2007 and 2008) one or other of the milk powders. The SES of these
two products also show more annual variation than is the case for butter and cheese. Structural excess
supplies nearly disappeared for all products in 2007-2008. It is not possible to say whether the higher

232
excess supplies observed in 2009 mark a return to the situation prior to 2007 or merely a temporary
increase due to the depressed state of the EU milk sector in 2009.
10.4.5 Drinking milk
The production of drinking milk is reported in Table 2.22. Imports and exports of drinking milk are
limited. According to IDF (various issues), exports of drinking milk accounted on average over the period
2000 to 2005 only 0.5% of production, and in 2009 16,000t of drinking milk were imported (IDF, 2010).
This implies that almost all of the drinking milk produced in dairies is consumed domestically.
One CAP measure targets the consumption of drinking milk, namely the school milk programme. It has
not been possible to find time-series data on the quantity of milk that is disposed of in this programme.77
This policy is not evaluated in the present report. However, as they represent an item of assisted
consumption, they should be recognised as part of the support to the sector.
10.4.6 Cream
The annual production of cream during 2000-2009 was around 2 million tonnes (about 5% of total fresh
dairy products, according to DG AGRI, various years) and scarcely varied throughout this period. There is
hardly any trade in cream. Eurostat data show that exports from the EU over 2000-2009 were rather
stable, varying between 28,000 and 33,000 tonnes. Exceptions were the years 2003, 2009 and 2010,
when 40,000 tonnes were exported. The imports from third countries are very small and were the
highest in 2002 (4,750 tonnes). Thus, total consumption in the EU has been almost as high as the
production.
10.5 Conclusions
The EU’s structural excess supply for butter and cheese declined in 2005 and 2006, due to increases in
unsubsidised demand. The structural surpluses for SMP and WMP remained rather constant until 2005
(SMP) and 2006 (WMP), and then fell very sharply. Until 2005 or 2006 (depending on the product)
internal consumption aids and export refunds were maintained at levels comparable to the earlier part of
the decade. These measures made it possible over this period to release intervention stocks, which were
absorbed without disrupting the market. Clearly, these results imply that unsubsidised consumption
(internal and/or external) was rising.
The evidence that these falls in structural excess supplies were a direct result of CAP policy changes is
not strong. If the 2003 policy changes had caused significant falls in dairy product prices, it could be
argued that the increases in unsubsidised demand were a response to these lower prices, and the link
with policy reform would be established. However, the findings on EU price changes assembled for EQ5
shows that although the EU price for butter began to decline slowly from 2004 onwards, the prices for
the other three products were more or less stable during 2003-2006 (although the gap relative to the
world market price was gradually shrinking due to weak trends in the latter prices). Thus, it is not
warranted to conclude that the reduction in the structural surpluses of all dairy products was
systematically driven by lower prices as a result of the policy reforms. With the exception of butter, it is
hard to find support for a direct link between the policy changes underway after 2003 and the shrinking
structural surpluses after 2004.
The last three years examined – 2007-2009 – were marked by instability on world markets, and
dramatic changes in the relationship between EU and world market prices for the first three products
(see EQ5), which mask any internal policy impacts that may have also been present.
77 In the 2006/2007 school year, the equivalent of 305,000 tonnes of milk was distributed in schools in 22 Member States with Community expenditure of more than €50 million (DG AGRI website). Figure 13.4 gives some information about EU budget expenditure on this programme, but not the volumes of milk involved.

233
Summary of findings for each indicator, EQ6
Indicator Expected result Evidence found
Structural excess supply of
Butter, SMP, WMP, cheese
Structural excess supplies are
expected to decline as the
expected price falls stimulate
unsubsidised internal and
external demand.
The expected declines in SES were
found, starting earlier and more
gradual for butter and cheese,
starting a year or so later and
steeper for SMP and WMP. The main
factor driving these falls was an
increase in unsubsidised demands.
However, in the absence of lower
product prices (apart from weak
evidence regarding lower butter
prices), the link with policy changes
cannot be established.

234
11 EQ7: Structure of dairy industry
To what extent have the CAP measures applicable to the dairy sector influenced structural changes in the
processing sector?
11.1 Interpretation and comprehension of the key terms of EQ7
The question in EQ7 relates to structural change in the processing sector and how this has been changed
due to the 2003 CAP reform for milk and milk products evaluated in this project.
A first step to answer the question is to check whether there have been structural changes and a second
step is to check if they are related to the CAP reform.
Structural change is related to production capacities but also to the number of firms, entry and exit,
merging activities. In the long run the structure of an industry depends on a) the intensity of
competition, b) the nature of the goods, c) the size of the market and d) the characteristics of the
technology (Sutton, 1991).
The CAP measures that potentially affect supply and demand of milk products (analysed in EQ6) and
affected price stability (EQ5) in the milk processing sector can indirectly cause structural changes in the
dairy sector. This question aims in pointing out these indirect effects.
11.2 Methodology used for answering EQ7
11.2.1 Methodology
Structural changes in the processing sector are identified by looking at the evolution of the sector and
describing changes in the number of firms, their share in processing milk and in their concentration ratio.
The concentration ratio is used to show if the biggest dairy processing firms control the market. It has
been calculated for the biggest dairy processors and shows their market share (in %). It is given as
follows:
∑=m
im SCR (1)
Where: CR: concentration ratio Si: market share if firm i m: number of firms The concentration ration can range between 0 and 100% indicating perfect competition and monopoly
respectively. Changes of the concentration ratio as well suggest restructuring of the dairy processing
sector.
A survey developed for dairy processing firms gave more insights into how the CAP measures affected
and changed the structure of the interviewed firms. In total 42 processors in 10 Member States were
interviewed. It should be noted that these processors are the ones who accepted to answer the
questionnaire. The number of processors who have been approached was higher.

235
On a second step, changes in the structure are combined with the conclusions of the previous EQs and in
particular of EQ6 in order to synthesise and to link structural changes with the effects of the CAP reform
on the supply and demand of milk products.
11.2.2 Limitations and difficulties faced
Serious difficulties were faced in gathering the information for the survey to processors, and in several
cases also in the gathering of systematic information about factual changes.
The questionnaire consisted of 34 questions, which covered all the topics in the evaluation questions in
Theme 1 (raw milk) and Theme 2 (milk products). The questionnaire was not only extensive, but also
asked the respondents for detailed information about issues that are generally considered to be sensitive
and confidential. For example, information was asked about the payment system they were using and
the way in which this system was applied to determine the milk price. The processors were asked to
answer about how important they perceive competition with other dairies in the formation of the milk
price they pay to farmers. Moreover, information was asked on the response to market signals and policy
incentives in the dairy product markets, as well as on the strategic choices behind product mix
orientation and adjustments.
Pilot pre-testing interviews were done in the Netherlands and Germany in order to improve the
questionnaire, while additional stakeholders were consulted. The questionnaires were filled in during a
face to face interview with a high ranked employee of the dairy company. This was a necessary condition
because of the detailed information the questionnaire was asking. Interviews were done as much as
possible by senior interviewers, with an extended experience in the dairy sector.
The Commission provided a letter of recommendation which was sent to the dairies together with the
request for the interview informing them about the background of the research and the confidentiality of
information-use. The response rate was very low and as the dairies explained the questions were asking
for sensitive information. It appeared that it was not in the interest of the dairies to share this
information with third parties. In addition to this, the dairies also knew that a number of colleagues
would be asked the same questions. Most likely this added to the fear that sensitive information via this
process might come into the hands of competitors, although it was promised that confidentiality and
anonymity would be respected. Moreover, some dairies indicated that their position was so specific that it
would be impossible to guarantee anonymity because insiders in the sector would be able to trace back
their identity from the information on the firm’s structural characteristics, which was also part of the
questionnaire.
After a disappointing response in the first round in most of the Member States where case studies were
done, a second attempt was made where it was tried to more intensively utilise network relationships to
convince more (and other) dairies to participate. This helped to get a minimum of 2 or 3 participating
dairies per case study region.
It should be noted that when dairies accepted to participate, they could still decide (and they indeed did)
not to answer certain questions. Moreover, the sensitivity could make them behave in a strategic way,
which introduces potential biases in the responses obtained.
A protocol was made with respect to the gathering of factual information, aiming at generating
systematic and standardised information about the structure of the dairy industry in a case study
Member State. The efforts made in this respect include a detailed assessment of available national
statistics, contacts with national branch organisations, checks of annual reports of key dairies, and
interactions with dairy experts. Although this generated a lot of information, it turned out to be difficult
to create a systematic data base over Member States from this data (except for a number of rather
general indicators such the number of dairies and aggregated production and trade data).
The problems faced impose limits on the analysis and imply that where results are presented they should
be treated with care. For this reason no clear and absolute conclusions can be made based on the
information from the questionnaires (small, non-representative samples, potential of strategic
behaviour).
236
11.3 Judgement criteria, indicators and information sources used for each
indicator
Table 11.1 summarises the indicators and information sources used to address EQ7.
Table 11.1 Indicators, data requirements and information sources for EQ7
Indicator Data requirement Information sources
Overview of the EU dairy processing sector - Identification of structural change
- Evolution of the EU dairy
processing sector per Member
State
- Market share of EU dairy firms
worldwide
- Concentration ratio of the biggest
dairy firms per Member State
Number and size of dairy
enterprises per Member State
Processed milk by dairy
enterprises per Member State
Concentration ratio
EUROSTAT, Structural Business
statistics,
Productschap Zuivel (Netherlands)
IDF
Linkage of structural changes with CAP reform
- Answers of interviewed
processing companies
Answers from survey questions Processors survey
It should be noted that the CAP reform and in particular the decrease of the intervention price for butter
and SMP can have a positive effect in increasing competition among the dairy companies. This is because
of the associated decrease of the gap between the EU producer prices and the world market prices. A
more intense competition is suggested by a decrease in the number of firms and by an increase of the
concentration ratio.
11.4 Results and analysis
11.4.1 Evolution of the EU dairy processing sector
In 2009 there were 5,416 dairy processing enterprises78 in the EU, which processed 111 million tonnes of
milk (Table 11.2). The majority of them are located in the EU-15 and in particularly in Italy (25% of the
registered enterprises), Greece and Spain, but their production capacity is limited as they process only
13.6% of the total milk collected in the EU. France and the United Kingdom, two of EU´s biggest
producers of raw milk, follow in the fourth and fifth places in terms of numbers of enterprises, while
Germany, which had the highest milk supply to dairies in 2009, follows in the sixth place with 194
registered enterprises. In the Netherlands in 2009 16 enterprises processed 9.6% of the EU’s raw milk
supply to dairies.
In the EU-10 were located 9.8% of the EU’s enterprises and processed 12% of the EU’s raw milk supply.
Among the EU-10, in 2009 the Polish and Czech enterprises processed 7.4% and 1.8% of the EU’s raw
milk supply to dairies respectively. The number of enterprises was high in Romania (337) and in Bulgaria
(170) but their processing capacity was up to 1.3% of the EU’s total milk supply to dairies.
The total number of enterprises in the EU declined between 2003 and 2009 with the decline being higher in
Italy, the UK and France. The reasons for the decline are not the same for all Member States. In some Member
States also the average milk processed per enterprise decreased suggesting that fewer enterprises remained in
business (case of Austria and France). In Italy the average milk processed per enterprise increased pointing out
to a consolidation process towards less but bigger enterprises.
In other Member States, like Spain, Portugal, Greece, Hungary, Latvia and Slovakia, the number of
enterprises increased, but on average the enterprises processed less milk. One reason for this
78 In this section the term enterprise follows the definition of Council Regulation (EEC) No 696/93 and refers to milk processing firms that are identified as legal units. The reader should note that an enterprise may have one or more factories processing milk.
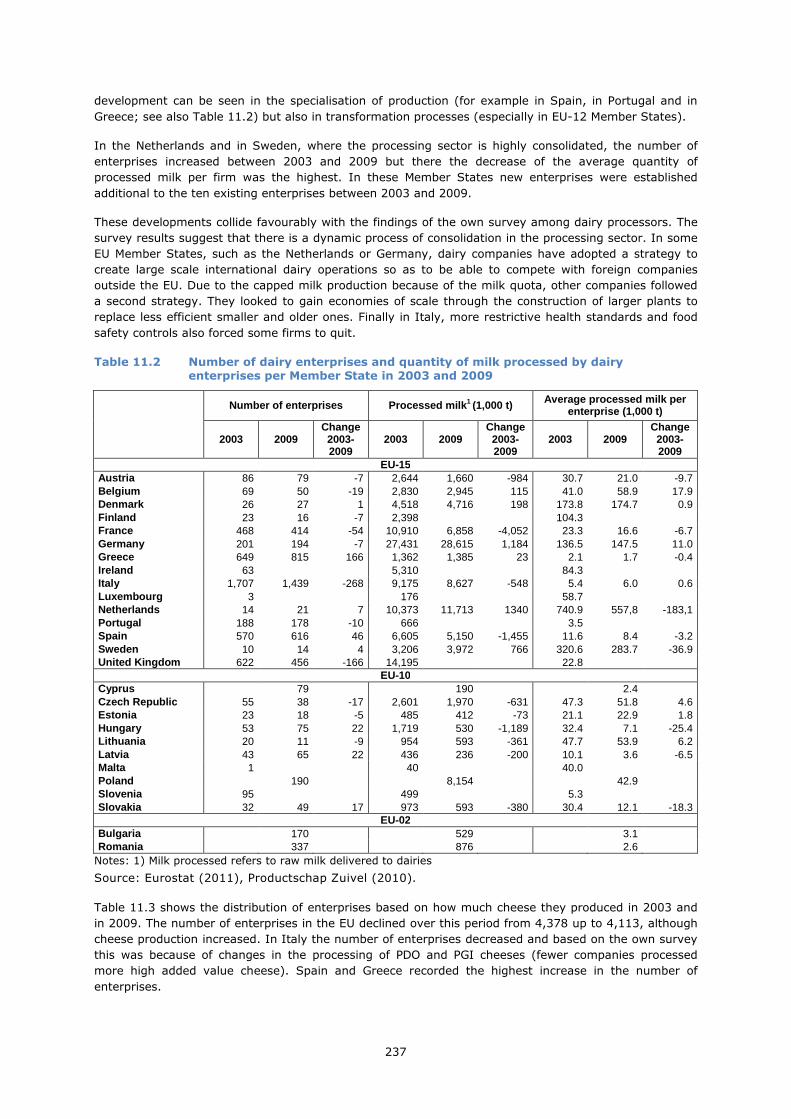
237
development can be seen in the specialisation of production (for example in Spain, in Portugal and in
Greece; see also Table 11.2) but also in transformation processes (especially in EU-12 Member States).
In the Netherlands and in Sweden, where the processing sector is highly consolidated, the number of
enterprises increased between 2003 and 2009 but there the decrease of the average quantity of
processed milk per firm was the highest. In these Member States new enterprises were established
additional to the ten existing enterprises between 2003 and 2009.
These developments collide favourably with the findings of the own survey among dairy processors. The
survey results suggest that there is a dynamic process of consolidation in the processing sector. In some
EU Member States, such as the Netherlands or Germany, dairy companies have adopted a strategy to
create large scale international dairy operations so as to be able to compete with foreign companies
outside the EU. Due to the capped milk production because of the milk quota, other companies followed
a second strategy. They looked to gain economies of scale through the construction of larger plants to
replace less efficient smaller and older ones. Finally in Italy, more restrictive health standards and food
safety controls also forced some firms to quit.
Table 11.2 Number of dairy enterprises and quantity of milk processed by dairy enterprises per Member State in 2003 and 2009
Number of enterprises Processed milk 1 (1,000 t) Average processed milk per
enterprise (1,000 t)
2003 2009
Change 2003-2009
2003 2009 Change 2003-2009
2003 2009 Change 2003-2009
EU-15 Austria 86 79 -7 2,644 1,660 -984 30.7 21.0 -9.7 Belgium 69 50 -19 2,830 2,945 115 41.0 58.9 17.9 Denmark 26 27 1 4,518 4,716 198 173.8 174.7 0.9 Finland 23 16 -7 2,398 104.3 France 468 414 -54 10,910 6,858 -4,052 23.3 16.6 -6.7 Germany 201 194 -7 27,431 28,615 1,184 136.5 147.5 11.0 Greece 649 815 166 1,362 1,385 23 2.1 1.7 -0.4 Ireland 63 5,310 84.3 Italy 1,707 1,439 -268 9,175 8,627 -548 5.4 6.0 0.6 Luxembourg 3 176 58.7 Netherlands 14 21 7 10,373 11,713 1340 740.9 557,8 -183,1 Portugal 188 178 -10 666 3.5 Spain 570 616 46 6,605 5,150 -1,455 11.6 8.4 -3.2 Sweden 10 14 4 3,206 3,972 766 320.6 283.7 -36.9 United Kingdom 622 456 -166 14,195 22.8
EU-10 Cyprus 79 190 2.4 Czech Republic 55 38 -17 2,601 1,970 -631 47.3 51.8 4.6 Estonia 23 18 -5 485 412 -73 21.1 22.9 1.8 Hungary 53 75 22 1,719 530 -1,189 32.4 7.1 -25.4 Lithuania 20 11 -9 954 593 -361 47.7 53.9 6.2 Latvia 43 65 22 436 236 -200 10.1 3.6 -6.5 Malta 1 40 40.0 Poland 190 8,154 42.9 Slovenia 95 499 5.3 Slovakia 32 49 17 973 593 -380 30.4 12.1 -18.3
EU-02 Bulgaria 170 529 3.1 Romania 337 876 2.6
Notes: 1) Milk processed refers to raw milk delivered to dairies
Source: Eurostat (2011), Productschap Zuivel (2010).
Table 11.3 shows the distribution of enterprises based on how much cheese they produced in 2003 and
in 2009. The number of enterprises in the EU declined over this period from 4,378 up to 4,113, although
cheese production increased. In Italy the number of enterprises decreased and based on the own survey
this was because of changes in the processing of PDO and PGI cheeses (fewer companies processed
more high added value cheese). Spain and Greece recorded the highest increase in the number of
enterprises.

238
Table 11.3 Distribution of enterprises by volume of annual production of cheese, 2003 and
2009, number of enterprises in 1000
<
100t 101t - 1,000t
1,001t - 4,000t
4,001t - 10,000t
> 10,000t
Sum 2003
< 100t
101t - 1,000t
1,001t - 4,000t
4,001t - 10,000t
> 10,000t
Sum 2009
2003 2009 EU-15
Austria 27 43 8 6 86 26 32 8 8 Belgium 48 8 57 0 0 4 5
Denmark 17 10 30 6 7 7 3 3 26
Finland 16 6 23 10 7 22
France 125 312 65 39 581 106 277 67 34 40 524
Germany 27 41 17 14 150 44 31 16 14 48 153
Greece 319 218 21 3 562 340 229 29 4 3 605
Ireland
Italy 847 1,005 172 33 2,066 733 860 195 41 10 1,839
Luxembourg 0 1 1 0 2 2
Netherlands 0 8 4 6
Portugal 150 50 8 5 213 134 52 7 4
Spain 266 153 32 5 462 333 154 34 6 7 534
Sweden 4 5 12 1 1 4 2 2 10
UK 45 35 24 112 127 19 14 5 8 173
EU-10 Cyprus 51 12 2 1 0 66 Czech Rep. 15 28 45 9 14 6 33
Estonia 15 7 22 6 5 3 4 0 18
Hungary 24 15 44 20 11 9 45
Latvia 14 7 36 0 13 7 1 0 24
Lithuania 29 5 20 3 4 3 3 3 13
Malta 0 1 1 0 0 0 0 0 0
Poland 37 117 70 25 258 13 80 55 27 12 187
Slovakia 8 5 13
Slovenia 13 15 31 10 9 0 27
EU-02 Bulgaria 75 91 18 0 Romania 188 129 12 1 0 330
Note: This table is based on a survey from Eurostat on the dairy processing sector in Member States. Gaps in the data may arise from incompleteness in response or non-response. Moreover, in order to ensure anonymity of the respondents no numbers are reported when the number of responding firms in a certain size class is less than a threshold.
Source: Eurostat.
Table 11.4 shows the distribution of the enterprises based on how much butter they produced in 2003
and in 2009. Here noticeable are changes in the evolution of the enterprises per size classes moving
from enterprises producing 100 tonnes or less to enterprises with a production capacity more than 1,000
tonnes.

239
Table 11.4 Distribution of enterprises by volume of annual production of butter, 2003 and
2009, number of enterprises
<
100t 101t - 1,000t
1,001t - 5,000t
5,001t - 10,000t
> 10,000t
Sum 2003
< 100t
101t - 1,000t
1,001t - 5,000t
5,001t - 10,000t
> 10,000t
Sum 2009
2003 2009 EU-15
Austria 54 8 7 0 70 47 4 5
Belgium 35 8 48 19 6 3 34
Denmark 9 5 15 10 4 1 0 1 16
Finland 11 2 14 3 2 0 8
France 162 23 20 4 222 130 14 17 11 173
Germany 30 38 17 9 109 35 16 12 6 16 85
Greece 73 3 0 0 76 85 3 0 0 0 88
Ireland
Italy 865 91 14 5 976 499 64 14 582
Luxembourg 1 0 1 0 2 2
Netherlands 0 0 0 3
Portugal 8 5 3 0 17 8 3 3 0
Spain 22 10 40 19 30
Sweden 0 3 1 0 2 0 1 4
UK 56 5 2 68 44 53
EU-10 Cyprus 1 0 0 0 0 1
Czech Rep. 16 12 29 5 9 0 17
Estonia 8 3 11 7 4 3 0 0 14
Hungary 16 4 20 7 8 0 0
Lithuania 23 8 5 2 0 0 15
Latvia 9 5 14 3 5 0 0 9
Malta 0 0 0 0 0 0
Poland 68 104 27 3 205 50 68 15 5 2 140
Slovenia 7
Slovakia 7 13 5 0 25 3 11 3 0 0 17
EU-02 Bulgaria 48 3 0 0 0 51
Romania 44 8 3 0 0 55
Note: This table is based on a survey from Eurostat on the dairy processing sector in Member States. Gaps in the data may arise from incompleteness in response or non-response. Moreover, in order to ensure anonymity of the respondents no numbers are reported when the number of responding firms in a certain size class is less than a threshold.
Source: Eurostat.
The enterprises are organised in two general forms: in private dairy companies and in cooperatives. The
main differences refer to the contractual arrangements.
A dairy cooperative business is owned, operated, and controlled by the dairy farmers who benefit from
its services. Members finance the cooperative and share in profits it earns in proportion to the volume of
milk they market through the cooperative. In cooperatives the relations between producer and
processors are based on the cooperative membership principle. Farmers are members of the cooperative.
Specific is the obligation of the dairy to buy all milk delivered from the farmer. Member-farmers are
obliged to deliver exclusively to the cooperative. Milk prices are determined by governing bodies of the
cooperative. The prices are ex-post indicative prices and the same for all members.
In private dairies the contractual relations are designed in such a way, that farmers deliver a fixed
quantity of raw milk. These contracts often have an annual character and have to be renegotiated each
year. Since private dairy businesses strive to maximize their own profits, they have an interest to pay a
relatively low price for the raw milk.
In 2009 about 58 % of raw milk produced in EU was delivered to cooperatives. About 20 % of the
delivered milk was based on individual contracts to private dairies (DG AGRI, 2009). The own survey
among dairy processors revealed differences between Member States. While in Latvia or Spain the share
of processed milk in the total milk processed by cooperatives was 6.1% and 21% respectively, it was

240
almost 100% in Ireland. Cooperatives have also a high presence in the Dutch dairy industry. In terms of
the amount of milk processed, their market share covers 80%.
Because of their specific nature, cooperatives are a vehicle to strengthen or increase the market power of
farmers vis a vis players in other stages of the supply chain (e.g. competing processors, retailers). Some
of the biggest dairy companies in the EU like FrieslandCampina, Nordmilch or Arla are organised as
cooperatives.
11.4.2 Market share of the EU’s dairy firms in world markets
The biggest European milk processors were in 2009 among the top 20 biggest milk processors worldwide and
covered 7% of the world production (Table 11.5). They are located in the Netherlands, in Sweden and in
Denmark. Friesland Campina from the Netherlands along with Arla from Sweden/Denmark covered 1.6%
and 1.2%, respectively, of the world´s processed milk. The French companies Lactalis and Danone are
operating plants internationally and processed a share of 1.3% and 1.0%, respectively, of the world´s
milk. Other European companies like Nordmilch (Germany), Bongrain (France), Parmalat (based in Italy
with plants internationally) and Glanbia (Ireland) are also included in the ranking. The ranking of the
European companies in this overview shows the dominant role of cooperatives in Europe. Cooperatives
like FrieslandCampina, Arla Foods and Nordmilch play an important role on the global markets.
The companies listed in Table 11.5 process in total 21% of the world’s milk intake.
Table 11.5 The world’s biggest dairy firms by milk intake in 2009
Company Legal Form Country Main location of processing plants
Milk intake (million milk equivalent)
Market share (% of world production)
Fonterra cooperative New Zealand International 18.6 2.7
Dairy Farmers of America cooperative USA USA 16.2 2.3
Nestlé public Switzerland International 12 1.7
Dean Foods - USA public USA USA 11.8 1.7
FrieslandCampina cooperative Netherlands Netherland s 11.3 1.6
Lactalis private France International 8.9 1.3
Arla Foods cooperative Sweden Denmark/Sweden 8.3 1. 2
California Dairies Inc. cooperative USA USA 7.7 1.1
Danone public France International 7.3 1
Kraft public USA International 6.7 1
Land O´Lakes cooperative USA USA 5.5 0.8
Saputo private Canada Canada/ USA 4.3 0.6
Nordmilch cooperative Germany Germany 4.2 0.6
Schreiber Foods private USA USA 3.7 0.5
Bongrain private France France 3.6 0.5
Parmalat public Italy International 3.5 0.5
Murray Goulburm cooperative Australia Australia 3.2 0.5
Northwest Dairy Assoc. cooperative USA USA 3.1 0.4
Mengniu Group public China China 2.9 0.4
Glanbia public Ireland Ireland/USA 2.8 0.4
Sum 145.6 20.8
Source: IFCN, 2009.
The biggest milk processing company worldwide in terms of milk intake was in 2009 Fonterra from New
Zealand, with plants located internationally and a market share of 2.7%. The ranking of Fonterra with
regard to turnover was in the same year behind the European Companies Danone, Lactalis and

241
FrieslandCampina. This is probably due to its specialisation in producing milk powder. The European
Companies are, in a relative sense, more and more focused in the production of higher valued cheese.
11.5 Concentration ratio
The concentration ratio has been calculated depending on data availability only for the Member States
where case studies have been conducted (Table 11.6).
The concentration ratio increased in the selected Member States apart from Germany suggesting a
restructuring process towards larger milk processing companies. The biggest increase was realised in
Italy, with a change in the CR of the four biggest companies of 74% over the period (to remind the
reader, Italy is the country with the highest number of milk processing enterprises). However the Italian
concentration ratio is still low compared with other Member States.
Table 11.6 Change of concentration between 2003 and 2009 in selected Member States
Member State
measure of concentration 2 2003 2008 2009 % change between
2003 and 2009
Spain CR3 27.5 30.4 10.5
Austria CR4 40 42.6 6.5
Italy CR4 7.7 13.4 74
Latvia CR4 57.3 66.6 16.2
Germany CR6 31.5 26.6 -15.6
Netherlands1 CR5 80
Hungary1 CR4 55
Notes: 1) based on European Commission (2011); 2) the concentration ratio is given for the three biggest companies in Spain, the four biggest companies in Austria, Italy, Latvia and Hungary, for the five biggest companies in the Netherlands and for the six biggest companies in Germany
Source: own calculations.
In the Netherlands the concentration ratio was particularly high with a CR5 of 80 in 2008. Also Hungary
shows a relatively high rate of concentration with a CR4 of 55 in 2008, although the number of
enterprises increased between 2003 and 2009 (see Table 11.2). This can be considered as evidence that
next to the four biggest enterprises, operate a great number of small and specialised enterprises.
11.6 Impact of dairy policy measures on structural change in the processing
sector
This section uses the information from the own survey among 42 processors in 10 Member States.
The interviewees were asked if there was a direct impact on the structural development of the dairy
processing sector because of CAP measures for milk and milk products of consumption aids for butter,
SMP and cream, export subsidies, national aids as well as rural development aids.
They generally confirmed that the CAP instruments had a limited impact on the structural development of
their dairies. They suggested that they rather responded to market signals and that they generally try to
respond to market competition and the demand of wholesalers. In many cases the degree of
competitiveness was indicated to be high, especially for those not operating in a niche market. This was
particularly stressed by the Italian processors, who expanded their processing units in order to respond
to increasing demand for high added value cheese. Investment strategies, innovation in dairy products,
quality of industrial processes and the business impact of competitors are the driving factors of any
restructuring of the dairies. Having larger plants allows them to reduce production costs per unit and to
increase the labour productivity.
They stated that the changes in the CAP measures were not of such a big magnitude so as to result into
restructuring of the processing sector.
242
In detail, regarding the reduction of the intervention price for butter and SMP since 2004 only in France
the processors agreed that this was the most important factor affecting negatively the prices but still
they did not consider that this affected price stability and recognised that price instability was mainly
imported. They concluded hence that the reduction of the prices because of the CAP policies did not
provoke any restructuring of the processing sector.
It should be noted that several of the interviewed processors did not export outside the EU and because
of this they had no direct experience with export refunds. Several other processors did not make any use
of private storage. Hence the downwards adjustment of subsidised exports and private storage did not
affect their production and marketing strategies.
While the gradual expansion of the quota did not lead to any structural changes, according to the
interviewed processors it is seen as positive because it keeps milk production in a certain region (in
particular when no free quota exchange is allowed, e.g. in LFAs such as Franché Comté). For the same
reason LFA payments, payments within Rural Development Programmes and national aids on milk
production were considered as positive by some processors and argued to be contributing to the
preservation of their resource base.
11.7 Conclusions
The limitations mentioned in Section 11.2.2 (notably limited response of the dairy processing industry to
the own survey among dairy processors, incomplete answers, potential bias in answers due to incentives
not to reveal sensitive information to third parties, non-representative and limited sample), do not allow
to draw any clear and absolute conclusions as to what extent the CAP measures applicable to the dairy
sector have influenced structural changes in the processing sector. Some tendencies however were
observed.
The first part of the analysis of this EQ (see Section 11.4.1) suggests that, in general, the number of
dairy enterprises declined during 2003 and 2009, while the remaining enterprises were larger and
processed more milk. However, the picture is heterogeneous among the Member States. In Italy, in
France and the UK a number of larger enterprises emerged and this can be because of increased
competition. In already highly consolidated Member States, such as the Netherlands, the number of
enterprises increased and simultaneously the milk intake per enterprise decreased.
The findings confirm an increase in competition in several Member States, but it is difficult to draw any
conclusion whether this is caused by the 2003 CAP Reform for milk and milk products, or whether it is
the result of a more progressive structural change. The interviewed processors did not confirm any direct
effect of the 2003 CAP reform on the structural development of their companies. However, it should be
noted that this result is based on a small, non-representative sample and hence cannot be considered as
an absolute statement. Moreover, structural change is a long-term process, implying that it might not
have been easy to link changes taking place in the industry in the observation period to changes in
policies or other factors. This might particularly hold for the EU-10 and EU-02, which when entering the
EU started to experience a general transition process, which still might not have stopped.

243
Summary of findings for each indicator, EQ7
Indicator Expected result Evidence found
Overview of the EU dairy processing sector - Identification of structural change
Evolution of the EU dairy
processing sector per Member
State
Decline in the number of
processing firms due to
continuing consolidation process
The number of dairy enterprises
declined in 11 Member States
(for 8 Member States the
information is incomplete). If so,
the size of the remaining
enterprises were larger and
processed more milk.
Market share of the EU dairy
firms worldwide
Concentration can lead to a few
large processing firms coexisting
alongside relatively large number
of small specialist dairy product
processors
European dairy firms are listed
among the biggest dairy firms
worldwide and are located in
France, the Netherlands,
Denmark/Sweden, Germany and
Italy. They still coexist with
relatively smaller processors, but
merging of companies lead to
fewer firms which process more
milk (e.g. in Italy, France and
the UK)
Concentration ratio of the
biggest dairy firms per Member
State
Concentration is expected to
increase as a response to more
intense competition
For 4 Member States(Spain,
Austria, Italy, Latvia) calculated
multi-annual concentration ratios
increased , suggest a
restructuring process towards
larger milk processing
companies.
Linkage of structural changes with CAP reform
Answers of interviewed
processing companies
Signals that competition has
increased and that specific policy
measures have had an effect on
structural change in specific
cases (for example butter
processing firms being
negatively affected by the
abolition of domestic
consumption aid on butter)
The interviewed processors did
not confirm any direct effect of
the 2003 CAP reform on the
structural development of their
companies. Incidentally specific
measures were mentioned but
given the small sample size
conclusion can be drawn.
244
12 EQ8: Competitiveness on international markets
To what extent have the CAP measures applicable to the dairy sector contributed to improved
competitiveness of milk products on international markets?
12.1 Interpretation and comprehension of the key terms of the EQ8
The keyword in EQ8 is competitiveness of EU dairy products on the international market. Whereas
competitiveness in general is a broad concept, the evaluation question targets on one aspect of it,
namely competitiveness of the EU dairy products on international markets. Since the EU is a net exporter
of dairy products, competitiveness is here linked to the potential of the EU to profitably export dairy
products to the world market, without being in need of any kind of support. Competitiveness is also
linked to being able to preserve or expand its position in the market.
Competitiveness is understood both in terms of quantities and of prices. As was shown in Chapter 4, both
are closely related to each other (see in particular Section 4.3). Being competitive with respect to prices
means selling in this price, which will enable to supply larger volumes. Furthermore, if a product loses
market share this is often related to non-competitive prices, in particular when products in the market
are homogeneous or standardised. An indicator of competitiveness is the evolution of the market shares
of the EU dairy products in the world markets. In particular when products are highly differentiated (e.g.
different types of cheese) it can be the case that in spite of a negative price gap, still a certain volume of
products can be exported without any subsidy. As such the evolution of unsubsidised exports is of
interest.
A further point to consider is the gap between EU prices for dairy products and the associated world
market prices (price-competitiveness). As discussed in Chapter 3, there is a link between the
competitiveness of EU dairy products and the CAP measures aiming in stabilising prices e.g. intervention
prices for butter and SMP, export refunds, the buying-in rate of intervention for butter and skim milk
powder, and to a much lesser extent certain disposal aids for intermediate and final consumption of dairy
products (see Chapter 9).
Another aspect of competitiveness is the degree of protection at the home market which is determined
by the level of import duties (e.g. import tariffs, tariff rate quotas). The trade policies as such did not
change after 2003, while the levels of the import duties have been only slightly adjusted (see Table
14.8). Therefore import tariffs and tariff rate quotas affected only slightly changes of the EU’s
competitiveness of milk products in international markets and are not the focal point of this Chapter.
It is important to note that competitiveness is related to longer term trends and not to incidental
situations. As such it is important not to draw strong conclusions from market disruptions, which may
have a large impact on the market and also on the export possibilities, but which have to be separated
from longer run structural changes happening in the dairy markets.
The milk products concerned in this question are butter, SMP, WMP and cheese. As shown in EQ6, the
extra-EU trade of drinking milk and cream is very limited and for those products rather the domestic
market and not the international is of interest. Hence, competitiveness on international market is not
relevant for cream and drinking milk.
245
12.2 Methodology used for answering the EQ8
Per product the evolution of the EU’s market share with respect to exports and imports is evaluated, and
linked to policy measures. Since exports and imports are part of the market balance, this evaluation
questions is linked to EQ6.
The following steps have been made in order to derive the characteristics of the EU’s dairy exporters’
competitiveness:
• The market share of the EU in world trade for the above mentioned dairy products is assessed and
related to policy measures;
• The evolution of unsubsidised exports and its share in EU’s total exports is discussed
• The evolution of the price-gap between EU and world market prices for dairy products is analysed
and linked to policy measures;
• Within the case study areas, dairy processing firms have been asked how they perceive EU policy
measures and changes therein to have affected their competitiveness. The information this
delivered with respect to competitiveness is used in this chapter.
Regarding the own survey, dairy processors were asked questions on how they perceived their
competitiveness in the international and home market. Questionnaires were answered by 42 processors
in 10 Member States. The processors were asked to what extent they see a link between changes in
competitiveness and the EU CAP policy measures which have been implemented since 2003 and have
been part of the 2003-reform. Also local stakeholders and experts were approached in order to get
complementary information on the processing sector in the case study countries. However, because of
the small sample and potential biases in answers to questions, the results are not representative.
Moreover, it also cannot be excluded that firms behave in a strategic manner and disclose information in
a selective way. Results based on this information should be treated carefully (see also Section 11.2.2 for
more details).
12.3 Judgement criteria, indicators and information sources used for each
indicator
Table 12.1 summarises the indicators and information sources that have been used to evaluate EQ8.
Table 12.1 Indicators, data requirements and information sources for EQ8
Indicator Data requirement Information sources
Share of EU in world trade of milk products by product
Imports and exports of milk products
Imports and exports of milk products (EQ6)
Share of unsubsidised exports in total EU exports by milk product
Volume of exports of dairy products without export refunds
DG AGRI
Price-gap between EU and world market prices for milk products (butter, cheese, SMP, WMP)
EU and world market price series for milk products;
Bound and applied tariffs for milk products (export refunds and import duties)
DG AGRI, EUROSTAT
Number of product innovations Information on product innovations
Information from questionnaire to processor on value added production, competitiveness, impact of policy measures on competitiveness
Processors survey (in case study regions)
246
The EU’s dairy industry is evaluated to be competitive or becoming more competitive, if:
• The share of the EU in world dairy product trade increased (without the use of refunds)
• The share of unsubsidised exports over the total exports was positive and/or increased
• The price difference between EU and the world market declined
• The imports of milk products into the EU from abroad decline relative to the domestic supply
(import substitution).
Moreover, based on information from the survey to processors, a qualitative assessment has been made
as to how:
• EU policy measures and changes therein affected the competitiveness of the dairy industry, with
specific attention for how different milk products may have been differently affected
• The (state) aid provisions contributed to improving the competitiveness of the dairy industry.
The reader should be warned that changes of the EU’s market share could also be due to the declining
fat and protein excess supply in the EU (see EQ1a and EQ6). The latter is a result of the still increasing
home demand in the EU for protein relative to the supply. The EU’s share in raw milk production declined
from 25.8% in 2000 to 21.6% in 2009 (e.g. Figure 2.2), with the milk quota being the main factor
explaining the limited growth of the EU’s milk supply. In the same period the domestic demand
(measured in terms of milk equivalent) increased by about 16% (1.7% per annum).
A further limitation of the market-share indicator for measuring competitiveness is that as long as
production quotas limit overall milk supply, then maximising sales worldwide (i.e. market share) is not
the main objective but instead the world market is a residual market for what is produced and cannot be
absorbed internally. How much is exported depends in this case more on the supply side than on the
demand side. Furthermore, it is the world market share of unsubsidised exports that counts – not total
exports. Finally, if the total of the world market trade is growing fast, with new exporters and importers
coming on the scene, it is inevitable that the EU will lose market share – but it would be premature to
conclude from this fact alone that this means loss of competitiveness. There are just simply more
competitors.
12.4 Market shares of EU dairy products in export and import markets
12.4.1 Butter
Figure 12.1 shows the evolution of the EU’s market share in world butter trade over the period 1997-
2009. The EU was a net exporter for butter. In absolute terms and focusing on the longer run trend the
EU’s market position did not change between 1997 and 2009. From 2000 to 2004 the EU increased its
market share in world butter exports and after 2004 this market share declined, suggesting lower market
competitiveness. Note also that whereas the subsidised consumption in the EU’s domestic market
strongly reduced since 2006 (decline being approximately 595 thousand tonnes; see Table 10.2) this did
not lead to a spill over in terms of increased exports to the international market in these years. The
decline in the EU’s total exports after 2004 is linked to the decrease of the subsidised exports. The
reduction of the subsidised exports is linked to the CAP 2003 reform and is in turn associated with the
reduction of the intervention prices.
The increase of the butter exports from 2000 to 2004 is linked to the need of the EU to export the fat
excess supply (with public buying in stocks being relatively high). Until 2006, during a period when
almost all exports were subsidised, the EU’s market share increased, while the shares of New Zealand
and Australia decreased (Table 2.9).
The imports were lower than the exports and showed a declining trend. The EU did not import more in
the years when it exported less because of the level of the world market prices and import tariffs.

247
While the extra-EU trade declined, in the same period the intra EU-trade increased (see Table 2.9),
suggesting that the relative competitiveness of the EU butter with respect to provisioning the home
market has increased since 2003.
Figure 12.1 EU-27 market share in world butter trade, 1997-2009, in %
30.0
20.0
10.0
0.0
10.0
20.0
30.0
40.0
50.0
1997
1998
1999
2000
2001
2002
2003
2004
2005
2006
2007
2008
2009
share in exports
share in imports
Source: own calculations based on COMTRADE.
Figure 12.2 shows the evolution of unsubsidised exports in the EU. Until 2006 unsubsidised exports were
relatively small (on average no more than 6% of the total exports) and increased sharply in 2007 and
2008 as a result of the strong increase of world market prices. At the same time the price of vegetable
oils peaked (basic ingredient of margarine and other spreads), which positively influenced the relative
competitiveness of butter. This made the EU butter temporarily more competitive, both at the
international and the domestic market.
Figure 12.2 Unsubsidised exports of butter, EU-27, in 1,000 tonnes
0
20
40
60
80
100
120
140
160
180
2000 2001 2002 2003 2004 2005 2006 2007 2008 2009
EU-15
EU-25
EU-27
Source: own calculations based on DG AGRI (various years and unpublished).
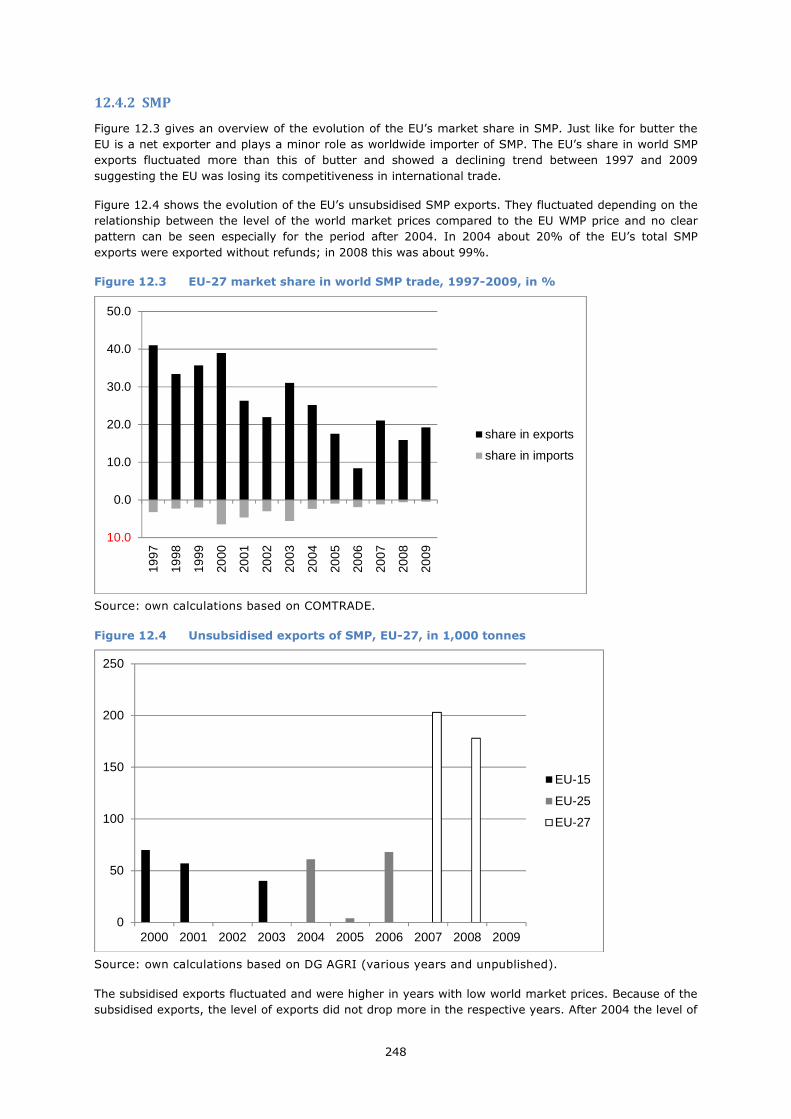
248
12.4.2 SMP
Figure 12.3 gives an overview of the evolution of the EU’s market share in SMP. Just like for butter the
EU is a net exporter and plays a minor role as worldwide importer of SMP. The EU’s share in world SMP
exports fluctuated more than this of butter and showed a declining trend between 1997 and 2009
suggesting the EU was losing its competitiveness in international trade.
Figure 12.4 shows the evolution of the EU’s unsubsidised SMP exports. They fluctuated depending on the
relationship between the level of the world market prices compared to the EU WMP price and no clear
pattern can be seen especially for the period after 2004. In 2004 about 20% of the EU’s total SMP
exports were exported without refunds; in 2008 this was about 99%.
Figure 12.3 EU-27 market share in world SMP trade, 1997-2009, in %
10.0
0.0
10.0
20.0
30.0
40.0
50.0
1997
1998
1999
2000
2001
2002
2003
2004
2005
2006
2007
2008
2009
share in exports
share in imports
Source: own calculations based on COMTRADE.
Figure 12.4 Unsubsidised exports of SMP, EU-27, in 1,000 tonnes
0
50
100
150
200
250
2000 2001 2002 2003 2004 2005 2006 2007 2008 2009
EU-15
EU-25
EU-27
Source: own calculations based on DG AGRI (various years and unpublished).
The subsidised exports fluctuated and were higher in years with low world market prices. Because of the
subsidised exports, the level of exports did not drop more in the respective years. After 2004 the level of
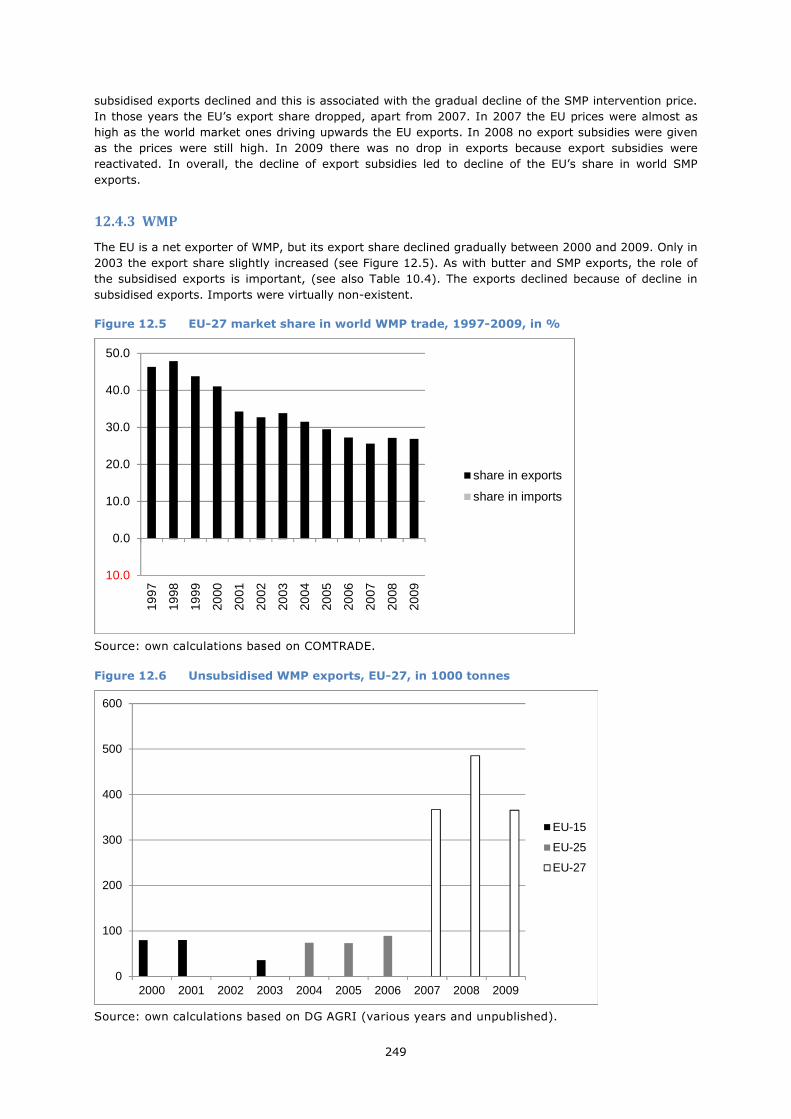
249
subsidised exports declined and this is associated with the gradual decline of the SMP intervention price.
In those years the EU’s export share dropped, apart from 2007. In 2007 the EU prices were almost as
high as the world market ones driving upwards the EU exports. In 2008 no export subsidies were given
as the prices were still high. In 2009 there was no drop in exports because export subsidies were
reactivated. In overall, the decline of export subsidies led to decline of the EU’s share in world SMP
exports.
12.4.3 WMP
The EU is a net exporter of WMP, but its export share declined gradually between 2000 and 2009. Only in
2003 the export share slightly increased (see Figure 12.5). As with butter and SMP exports, the role of
the subsidised exports is important, (see also Table 10.4). The exports declined because of decline in
subsidised exports. Imports were virtually non-existent.
Figure 12.5 EU-27 market share in world WMP trade, 1997-2009, in %
10.0
0.0
10.0
20.0
30.0
40.0
50.0
1997
1998
1999
2000
2001
2002
2003
2004
2005
2006
2007
2008
2009
share in exports
share in imports
Source: own calculations based on COMTRADE.
Figure 12.6 Unsubsidised WMP exports, EU-27, in 1000 tonnes
0
100
200
300
400
500
600
2000 2001 2002 2003 2004 2005 2006 2007 2008 2009
EU-15
EU-25
EU-27
Source: own calculations based on DG AGRI (various years and unpublished).
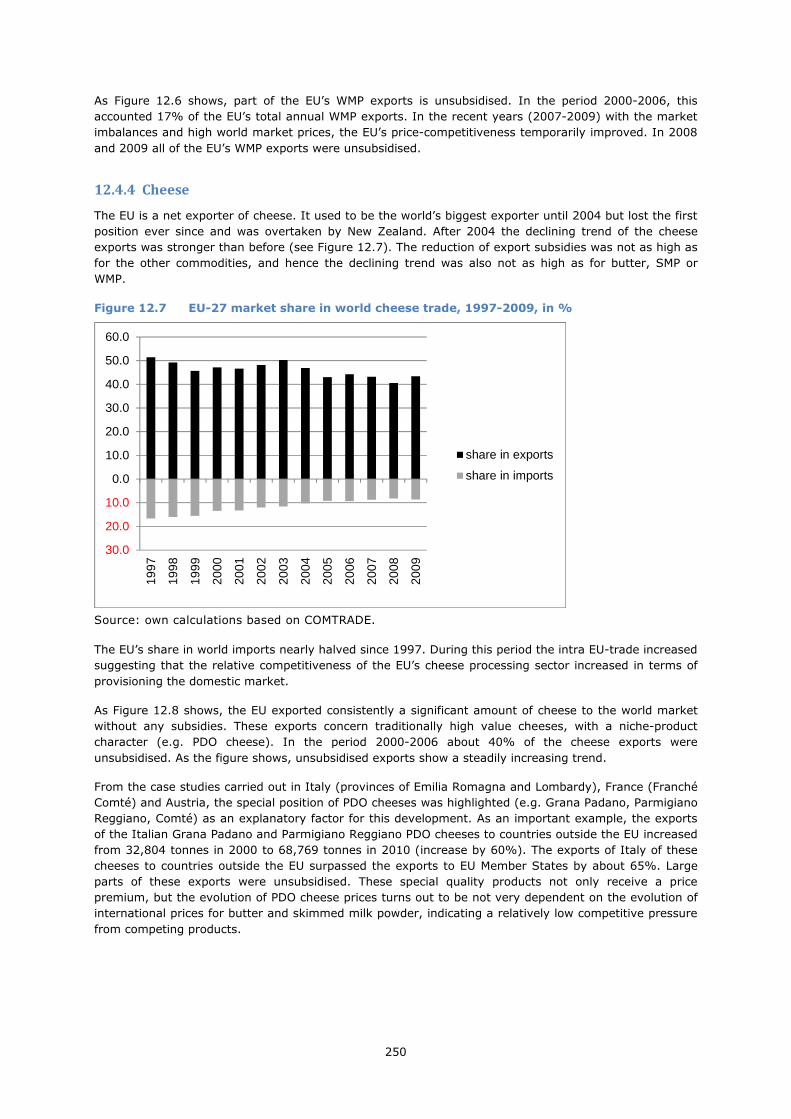
250
As Figure 12.6 shows, part of the EU’s WMP exports is unsubsidised. In the period 2000-2006, this
accounted 17% of the EU’s total annual WMP exports. In the recent years (2007-2009) with the market
imbalances and high world market prices, the EU’s price-competitiveness temporarily improved. In 2008
and 2009 all of the EU’s WMP exports were unsubsidised.
12.4.4 Cheese
The EU is a net exporter of cheese. It used to be the world’s biggest exporter until 2004 but lost the first
position ever since and was overtaken by New Zealand. After 2004 the declining trend of the cheese
exports was stronger than before (see Figure 12.7). The reduction of export subsidies was not as high as
for the other commodities, and hence the declining trend was also not as high as for butter, SMP or
WMP.
Figure 12.7 EU-27 market share in world cheese trade, 1997-2009, in %
30.0
20.0
10.0
0.0
10.0
20.0
30.0
40.0
50.0
60.0
1997
1998
1999
2000
2001
2002
2003
2004
2005
2006
2007
2008
2009
share in exports
share in imports
Source: own calculations based on COMTRADE.
The EU’s share in world imports nearly halved since 1997. During this period the intra EU-trade increased
suggesting that the relative competitiveness of the EU’s cheese processing sector increased in terms of
provisioning the domestic market.
As Figure 12.8 shows, the EU exported consistently a significant amount of cheese to the world market
without any subsidies. These exports concern traditionally high value cheeses, with a niche-product
character (e.g. PDO cheese). In the period 2000-2006 about 40% of the cheese exports were
unsubsidised. As the figure shows, unsubsidised exports show a steadily increasing trend.
From the case studies carried out in Italy (provinces of Emilia Romagna and Lombardy), France (Franché
Comté) and Austria, the special position of PDO cheeses was highlighted (e.g. Grana Padano, Parmigiano
Reggiano, Comté) as an explanatory factor for this development. As an important example, the exports
of the Italian Grana Padano and Parmigiano Reggiano PDO cheeses to countries outside the EU increased
from 32,804 tonnes in 2000 to 68,769 tonnes in 2010 (increase by 60%). The exports of Italy of these
cheeses to countries outside the EU surpassed the exports to EU Member States by about 65%. Large
parts of these exports were unsubsidised. These special quality products not only receive a price
premium, but the evolution of PDO cheese prices turns out to be not very dependent on the evolution of
international prices for butter and skimmed milk powder, indicating a relatively low competitive pressure
from competing products.
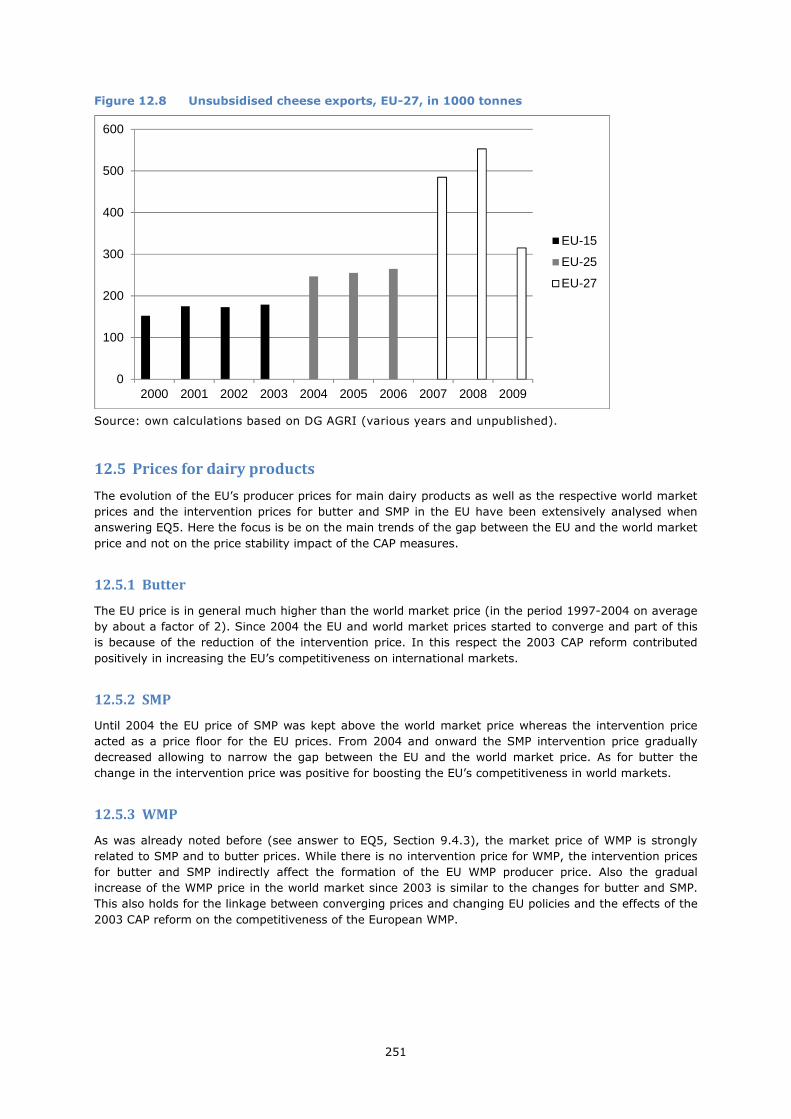
251
Figure 12.8 Unsubsidised cheese exports, EU-27, in 1000 tonnes
0
100
200
300
400
500
600
2000 2001 2002 2003 2004 2005 2006 2007 2008 2009
EU-15
EU-25
EU-27
Source: own calculations based on DG AGRI (various years and unpublished).
12.5 Prices for dairy products
The evolution of the EU’s producer prices for main dairy products as well as the respective world market
prices and the intervention prices for butter and SMP in the EU have been extensively analysed when
answering EQ5. Here the focus is be on the main trends of the gap between the EU and the world market
price and not on the price stability impact of the CAP measures.
12.5.1 Butter
The EU price is in general much higher than the world market price (in the period 1997-2004 on average
by about a factor of 2). Since 2004 the EU and world market prices started to converge and part of this
is because of the reduction of the intervention price. In this respect the 2003 CAP reform contributed
positively in increasing the EU’s competitiveness on international markets.
12.5.2 SMP
Until 2004 the EU price of SMP was kept above the world market price whereas the intervention price
acted as a price floor for the EU prices. From 2004 and onward the SMP intervention price gradually
decreased allowing to narrow the gap between the EU and the world market price. As for butter the
change in the intervention price was positive for boosting the EU’s competitiveness in world markets.
12.5.3 WMP
As was already noted before (see answer to EQ5, Section 9.4.3), the market price of WMP is strongly
related to SMP and to butter prices. While there is no intervention price for WMP, the intervention prices
for butter and SMP indirectly affect the formation of the EU WMP producer price. Also the gradual
increase of the WMP price in the world market since 2003 is similar to the changes for butter and SMP.
This also holds for the linkage between converging prices and changing EU policies and the effects of the
2003 CAP reform on the competitiveness of the European WMP.
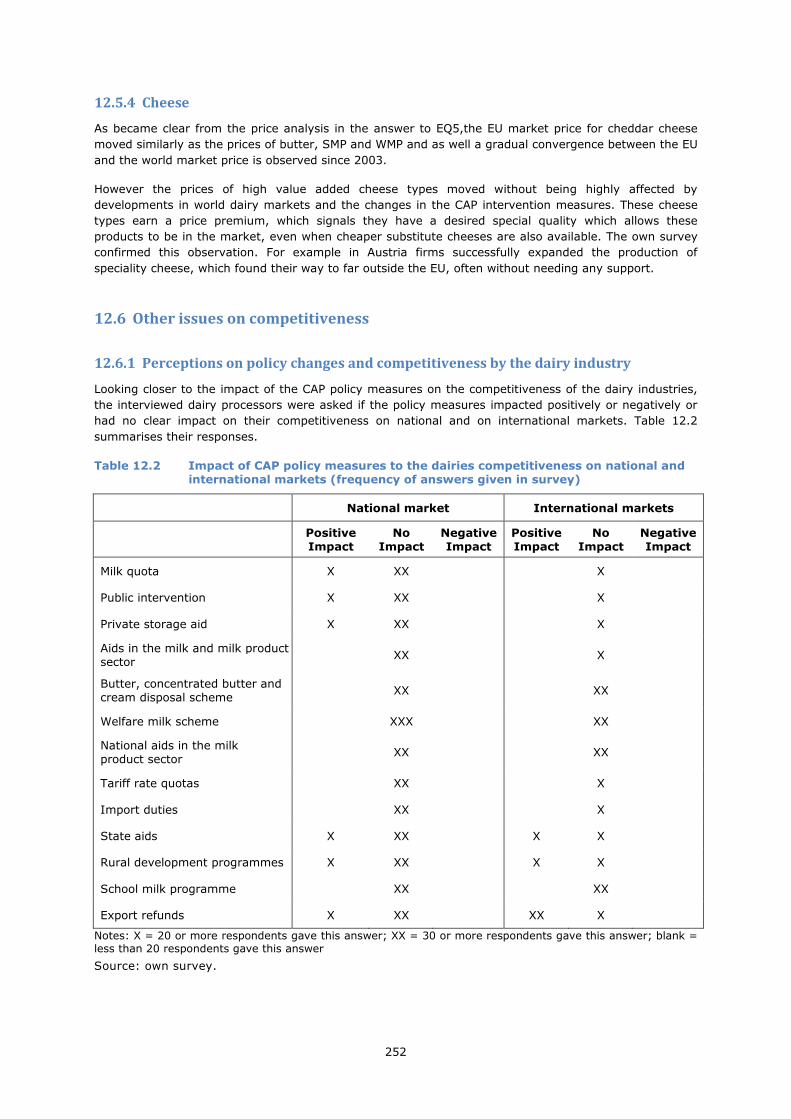
252
12.5.4 Cheese
As became clear from the price analysis in the answer to EQ5,the EU market price for cheddar cheese
moved similarly as the prices of butter, SMP and WMP and as well a gradual convergence between the EU
and the world market price is observed since 2003.
However the prices of high value added cheese types moved without being highly affected by
developments in world dairy markets and the changes in the CAP intervention measures. These cheese
types earn a price premium, which signals they have a desired special quality which allows these
products to be in the market, even when cheaper substitute cheeses are also available. The own survey
confirmed this observation. For example in Austria firms successfully expanded the production of
speciality cheese, which found their way to far outside the EU, often without needing any support.
12.6 Other issues on competitiveness
12.6.1 Perceptions on policy changes and competitiveness by the dairy industry
Looking closer to the impact of the CAP policy measures on the competitiveness of the dairy industries,
the interviewed dairy processors were asked if the policy measures impacted positively or negatively or
had no clear impact on their competitiveness on national and on international markets. Table 12.2
summarises their responses.
Table 12.2 Impact of CAP policy measures to the dairies competitiveness on national and international markets (frequency of answers given in survey)
National market International markets
Positive Impact
No Impact
Negative Impact
Positive Impact
No Impact
Negative Impact
Milk quota X XX X
Public intervention X XX X
Private storage aid X XX X
Aids in the milk and milk product sector
XX X
Butter, concentrated butter and cream disposal scheme
XX XX
Welfare milk scheme XXX XX
National aids in the milk product sector
XX XX
Tariff rate quotas XX X
Import duties XX X
State aids X XX X X
Rural development programmes X XX X X
School milk programme XX XX
Export refunds X XX XX X
Notes: X = 20 or more respondents gave this answer; XX = 30 or more respondents gave this answer; blank = less than 20 respondents gave this answer
Source: own survey.

253
In general the respondents found it often difficult to indicate a clear link between the changes in the
policy measures and their competitiveness. This is because several interviewed processors felt that the
day-to-day issues on competitiveness relate more to actions of other competing suppliers and of the
retailers. In fact they often stated that they considered the impacts of changes in CAP policy measures to
be indirect. Moreover, they referred to similar measures as being important for their competitiveness on
the home market as well as on the international market. This suggests that they are aware of the
interaction effects between developments affecting national and international markets.
As regards the milk quota, some processors argued that it contributed to preserving the resource base
(supply of raw milk by farmers), which could have not been the case if the quota would not have kept
the milk in the region by a constraint. Processors who gave this answer also had a tendency to refer to
the importance of direct payments and aids to keep milk production profitable in areas where there are
severe natural handicaps. Private storage aid was thought as helping to benefit from better market
opportunities. However, they said that the change in the milk quotas and market intervention (which are
subject to this evaluation) did not cause any additional effect on their competitiveness.
With respect to the competitive position on export markets, the respondents frequently mentioned the
importance of export subsidies as a necessity in order to be able to export. As such this answer indicates
that these respondents acknowledge that they are not competitive without them. Respondents leading
firms focusing on the production of speciality cheese did not refer to this argument, and confirmed that
product differentiation could be a successful alternative for coping with pressure from competition.
The importance of state aids was mentioned to be an important factor for smaller and medium sized
dairies as contributing to the modernisation of their business. Measures stimulating domestic demand
were mentioned as a factor positively influencing competitiveness: the additional demand created better
marketing possibilities.
12.7 Marketing strategies for dairies
There are different strategies dairy companies can follow in order to adapt to new policy and/or market
conditions. Five strategic types of innovation for strengthening the competitiveness of the dairy industry,
listed in the Oslo Manual (OECD, 2005) are product innovation, process innovation, marketing
innovation, organisational innovation, and the conquest of a new source of supply of raw materials or
semi-manufactured goods. From the case studies it appeared that a number of Austrian processors
recently developed a new product (whey milk) in order to improve their competitive position. There are
signals from the own survey among processors that, with the intervention mechanism being transformed
into a safeguard provision, they were stimulated to orient themselves in another direction (Table 12.3).
Table 12.3 Innovations in the dairy sector for selected Member States in 2009
France Germany Hungary Italy Nether lands Spain UK Total
Cheese 218 202 71 350 34 13 43 931
Creamers 11 17 18 18 2 0 12 78
Dairy alternative drinks
11 3 4 20 21 5 13 77
Dairy drinks 24 96 30 69 31 24 43 317
Other dairy products 1 7 2 3 0 0 0 13
Yoghurt 89 176 30 77 18 24 84 498
Total 354 501 155 537 106 66 195 191
4
Source: Bunte et al. (2011, p.93).
As an example the reduced attractiveness of intervention stimulated processors in Ireland to invest more
actively in switching to cheese production. In a recent study the number of new products introduced in
2009 was given for seven selected EU Member States. In these 7 Member States 1,914 innovations were
denoted in one year (approximately 35 per week). Table 12.3 also shows that most innovations took
place in cheese products, followed by fresh dairy products (yogurt) and dairy drinks. The focus to try to

254
innovate in these areas is confirmed by the case studies. According to Bunte et al. (2011), in general the
number of product innovations has increased since 2005, in dairy as in other sectors (exceptions for the
dairy sector are Spain and the UK).
Tacken et al. (2009) showed that product innovation is the most important strategy for dairy companies.
The main focus is on searching for new varieties of products and introducing new ingredients that
represent new functionalities of the product. The authors suggest that dairy companies more often
pursue a defensive or analytical strategy than a prospective strategy.
The next most frequent type of innovation is marketing innovation. This kind of innovation is
distinguished by its focus on reaching new groups of consumers by promotion activities, addressing
special target groups and approaching new markets.
Setting up organizational innovation is the third important topic. By this is meant the possibility to
benefit from cooperation, patenting, licensing and changing the market position.
Processing innovation comes as the fourth most important strategy. Innovating companies improve their
way of production or the production equipment. i.e. through improvements in technology. Tacken et al.
(2009) showed that this type of innovation positively affected labour productivity in particular.
Creating a ranking based on the number of innovations reported in the Innovation database, Arla ranks
in order of innovative output (from high to low) Danone, Dairy Crest, Campina, and Nestle. EU based
firms also ranked higher relative to key foreign dairy processors (e.g. Fonterra).
12.8 Conclusions
Competitiveness is linked both to quantities (supply, export and import volumes) as a prices (measured
by the distance between EU prices and world market prices).
The market share indicators show that the EU lost market share for SMP WMP, butter and cheese in the
period 2003-2006. In the preceding period (1997-2003) market shares for SMP and WMP declined, but
those for butter and cheese remained both more or less stable. In the period 2007-2009 export shares
remained stable (cheese) or increased (SMP, WMP), while for butter the market share continued to
gradually decline. The loss in market share may suggest a reduction in the EU’s competitiveness during
the evaluation period, as well as during the period before 2003. In interpreting this result it should be
noted however that the EU’s share in world raw milk production declined from 25.8% in 2000 to 21.6%
in 2009. Note that also the exports of dairy products (in milk equivalents) as a percentage of EU
domestic supply declined over the period 2003-2006. When evaluating the period 2000-2009 there is no
clear trend in share of EU exports of dairy products in total milk supply.
For most of the years between 2000 and 2009 the milk quota have been the main factor limiting the EU’s
supply growth of the raw milk. In the same period the domestic demand for dairy products (measured in
terms of milk equivalent) increased by about 16% (1.7% p.a.). Thus the evolution of the EU’s export
market shares are co-determined by these developments within the EU. As such indicators expressing
the EU’s export share in total world exports for dairy products have a limitation to measure changes in
competitiveness. A potential sharp growth in the world market and a continuous increase in the EU’s
domestic consumption of dairy products can both lead to a decline in the EU’s export share, without
reflecting a structural loss in competitiveness.
Export subsidies for butter SMP, WMP, cheese declined since 2003. After 2006 the increasing demand for
EU milk fat absorbed the excess supply (see also the discussion on the structural excess supply of fat in
Section 5.5). The increased demand for fat came from several directions: world market prices for fat
containing dairy products (e.g. butter, cheese, WMP) increased triggering EU (unsubsidised) exports in
these products. The simultaneous high increase in vegetable oil prices in the period 2006-2008, also
improved the relative competitive position of butter with respect to products based on vegetable oils
(margarine and other spreads) in international and domestic markets. Since these developments were
strongly driven by external factors there is no indication of a structural increase in competitiveness on
the world market.

255
The above analysis showed that until 2004 the EU markets for processed dairy products have been
affected more by the policies applied to the dairy sector (intervention prices, and in particular their
decrease, and adjustments in export subsidies) than by developments in international markets. This is
related to the often large price–gap between EU and world market prices, which in turn followed from the
high intervention prices in the EU relative to world market price levels. In such a situation the EU is
generally not competitive with respect to external markets since exports refunds are necessary for being
able to export and compete with foreign suppliers (a notable exception are differentiated cheese
products). This result was confirmed by the processors responding to the survey, who also pointed to the
importance of export refunds.
Since the 2003 CAP reform there is a clear linkage between the observed convergence between the EU
and the world market prices for dairy products and the reduction of the intervention prices for butter and
SMP and the increasing prices at the world markets. Both the intervention price decline and the world
market price increase have been equally important in reducing the price gap. This has as such improved
the relative price-competitive position of the sector: lower support amounts per unit of product are
needed to bridge the gap with the world market and export products; world market prices may more
frequently surpass EU prices and when so, the EU can export products. However, since in an absolute
sense prices for dairy products in the EU were still structurally above the world market level, the EU was
not competitive (being able to export without subsidies) for most dairy products (exceptions are niche
dairy products). The picture changed between 2007 and 2009: then developments at international
markets affected the EU’s domestic market and because of the high prices worldwide, the EU increased
its unsubsidised exports substantially.
As regards the indicator on the volume of unsubsidised exports, unsubsidised cheese exports increased
over the period 2000-2009, with 2007 and 2008 being exceptional years with very high unsubsidised
cheese exports. From the case study analyses (Italy, France, Austria) it was highlighted that exports of
PDO cheeses to outside the EU increased significantly (for example exports of two main Italian PDO
cheeses increased by 60% in the period 2000-2010). These high value, high quality products are not
very sensitive to competition from other dairy products due to their uniqueness and speciality character.
The unsubsidized exports of butter, SMP, and WMP had a more incidental character and lacked a clear
structural trend.
The share imports for butter, SMP and cheese in total world imports show a tendency to decline over the
period 2003-2009. For WMP this share has been close to zero for the whole period 1997-2009.
Summary of findings for each indicator, EQ8
Indicator Expected result Evidence found
Share of EU in world trade of
milk products by product
Evidence sought: counteracting
effects expected from declining
price gap and growing world
demand
The EU lost market share for SMP
WMP, butter and cheese, in the
period 2003-2006. In the preceding
period (1997-2003) market shares
for SMP and WMP also declined,
but those for butter and cheese
remained both more or less stable.
In the period 2007-2009 export
shares remained stable (cheese) or
increased (SMP, WMP), while for
butter the market share continued
to gradually decline
Share of unsubsidised exports
in total EU exports by milk
product
Expected increase for special
cheeses, but not for other dairy
products
The volume of unsubsidised cheese
exports showed a steady increase
over the period 2000-2009, with
2007 and 2008 being exceptional
years with very high unsubsidised
cheese exports. From the case
study analyses (Italy, France,
Austria) the role of PDO cheese
was highlighted.

256
Indicator Expected result Evidence found
Price-gap between EU and
world market prices for milk
products (butter, cheese,
SMP, WMP)
Price gap was expected to decline
due to the decline in EU
intervention prices, adjustments
in export refunds, and increasing
world demand
Since the 2003 CAP reform a
strong convergence of EU and the
world market prices for dairy
products has been observed, which
was partly due to the reduction of
the intervention prices for butter
and SMP and partly to the
increasing prices at the world
market. With the market
disturbance of 2007 the price gap
became even negative.
Number of product
innovations
An increase expected as a
response to mitigate the
increasing competitive pressure
There is some evidence that the
number of innovations has
increased since 2005
257
13 EQ9: Efficiency
13.1 Interpretation and comprehension of the key terms of EQ9
The objectives covered in this evaluation question are introduced and linked to their relevant legislative
sources in the Intervention Logic for this evaluation. They are: market balance and market stability, the
income of milk producers, the competitiveness and market orientation of the dairy sector, production
structures and structural change, and the simplification of dairy policy and its administration. Maintaining
or increasing consumption of dairy products was cited several times in the 1999 and 2003 legislation as a
policy aim, but has not been referred to in legislation since then. We have opted to interpret
consumption of dairy products as an aspect of the overall objective of improving market balance and not
as a final objective in its own right. This interpretation is more compatible with the strong emphasis in
the rest of the dairy legislation on market orientation, and with the general principle underlying EU food
policy of informed consumer choice and consumer sovereignty. Therefore, consumption levels and trends
will be considered relevant only in so far as they relate to market balance. Finally, several other
objectives were mentioned, namely environmental aspects and product quality, which will be referred to
in appropriate places, but will not be systematically taken into account.
Efficiency is defined as “The extent to which the desired effects are achieved at a reasonable cost. The
Financial Regulation (article 27(2)) defines efficiency as the best relationship between resources
employed and results achieved.”79 Guidance notes on this methodology from DG AGRI (2006) add that
efficiency concerns whether a greater impact “could have been obtained with the same budget or
whether the same effects could have been obtained at a lower cost" and suggests that “An indicator of
efficiency is calculated by dividing the budgetary inputs mobilised by the quantity of effects obtained”.80
We therefore interpret the criterion ‘reasonable cost’ to refer to budget (i.e. taxpayer) cost.
Although these definitions leave no doubt that, on a conceptual level, evaluating efficiency requires
comparing the achievement of impacts to the budgetary cost of achieving them, the practical
implementation of the concept poses several problems in the context of this evaluation. First, none of the
objectives of dairy policy during the evaluation period have been assigned a specific target, and even
less a quantified target. Budget costs, on the other hand, are quantifiable. In asking about the cost-
efficiency of particular measures in achieving their objectives, the evaluation question either assumes a
priori that objectives must have been met in full, or expects that it is possible a posteriori to quantify the
extent to which they have been met. By contrast, given the absence of quantifiable final targets, we can
only assess whether the policy has moved the sector or the outcome in the direction indicated by the
objective, or whether no effect can be discerned. Where an improvement going in the desired direction is
found, however, it is not necessarily possible to say whether a target has actually been reached and the
objective has been fully achieved, or whether only a part of what could have been achieved (or was
hoped to be achieved) has occurred. In the case of partial fulfilment only, it is inevitable that this must
have implications for the efficiency judgment. What is clear from the above is that it is generally not
possible to draw conclusions of the kind: “Objective A was fully reached at a budget cost of €B million”,
or that “Each additional €Z million of budget expenditure on export refunds per annum brought the
sector Y% closer to achieving the desired market balance”.
79 “Evaluating EU Activities: A Practical Guide for the Commission Services” (European Commission, 2004, p.104). 80 “Handbook on Common Monitoring and Evaluation Framework Guidance Document” (DG AGRI, 2006) Glossary (p.4).
To what extent have the CAP measures applied to the dairy sector been efficient with respect to achieving their objectives?
Have the 2003 CAP reform contributed to achieving a simplified and effective administration and management of the measures applied to the sector?

258
Second, the answers to evaluation questions 1-8 have already stressed that the second part of the
evaluation period (from roughly end-2006 onwards) was marked by strong turbulence on world dairy
product markets and world commodity markets generally, from which EU markets were not spared. The
severe failure of the ‘ceteris paribus’ conditions under which an indicator-based evaluation would ideally
be conducted brings two related difficulties. First, there is the challenge of separating out the effects of
the policy changes from the changes driven by unusual exogenous factors that were large enough to
mask those achieved by policies. This issue has already arisen when answering the first eight evaluation
questions. Second - and this issue arises for the first time here and in the following evaluation questions
- there is the problem of how to judge the policies themselves. From the vantage point of 2003, or even
early 2006, there was little indication of the turbulence to come, and as a consequence policies were not
designed to be ‘turbulence-proof’. However, it is possible that policies which would have been
appropriate for attaining sectoral objectives at reasonable cost in a turbulence-free context are less so in
a more turbulent world market context. When background conditions change dramatically, the evaluation
task faces the dilemma of whether to evaluate policies on the assumption that the expected exogenous
conditions that were those that prevailed (which requires some kind of counterfactual) or whether, using
the wisdom of hindsight, to assume that the policies should have been more ‘turbulence-proof’, and
therefore to evaluate them in the high-turbulence conditions that actually occurred. This evaluation does
attempt to choose between these options on a general level. In one case (see section 13.4.4),
calculations that attempt to remove the impact of the world market price surge in 2007-2008 on
producer support are used as a basis for the argumentation. Otherwise, we stay close to the evidence on
actual outcomes, whilst nevertheless trying to separate out policy impacts from the impacts of changing
exogenous conditions. No judgement is offered or implied regarding whether policy makers should have
foreseen the market disruptions of the 2007-2008 and anticipated them.
A third difficulty arises because of the multiplicity of inter-related objectives and instruments that
comprise the policy package to be evaluated. The complexity of these inter-relationships was already
exposed in the intervention logic. In most cases, where several instruments serve several goals
simultaneously, they are mutually reinforcing, in such as way that it is impossible to relate expenditure
on one instrument (say, export refunds) solely and exclusively to the achievement of one objective (say,
income support). An example of this complexity involves the link between instruments and
competitiveness. Not only is ‘competitiveness’ a multi-dimensional concept but a number of instruments
contribute potentially – and indirectly - to its improvement. For these reasons, the efficiency of achieving
the competitiveness objective is not directly assessed.
The way these three difficulties are handled when constructing and interpreting the indicators is
explained in Section 13.2 (Methodology).
Fourth, the first definition of efficiency quoted above refers simply to ‘cost’, which as already stated will
be interpreted as meaning ‘budget cost’. However, in the present context, this definition could lead to
misleading conclusions. In a policy evaluation of this kind, various definitions of cost could be considered.
The widest definition is that of social cost (this would be the relevant definition in a full cost-benefit
analysis), while the narrowest definition would focus on the costs incurred by just one of the interested
parties (e.g. budget cost, or private cost to farmers). The particular relevance of the choice between
definitions of ‘cost’ in this evaluation is discussed in the following paragraphs.
Table 13.1 sets out several alternative cost definitions. The concept of the PSE (total transfers from
consumers and taxpayers to producers) is clearly the broadest definition, even if it leaves out a number
of the items that would be included under ‘full social cost’ in a cost-benefit analysis. The PSE includes the
full cost to domestic consumers of paying the higher domestic prices for what they consume81 rather
than just counting the budget cost of all the measures, such as export refunds and consumption aids,
that maintain (inside a high tariff wall) the price gap between domestic and world market prices. This
consumer cost is typically far greater than the budget cost of the measures for maintaining the price gap,
because the higher prices are paid for all dairy products consumed, whereas the instruments maintaining
the price gap merely operate at the margin and affect a relatively small number of units.
Moving from left to right in Table 13.1, the definitions of cost become increasingly narrow and specific,
and less comprehensive.
81 Which is passed to the producing sector, but which may not all reach milk producers if price transmission back up the supply chain is weak.
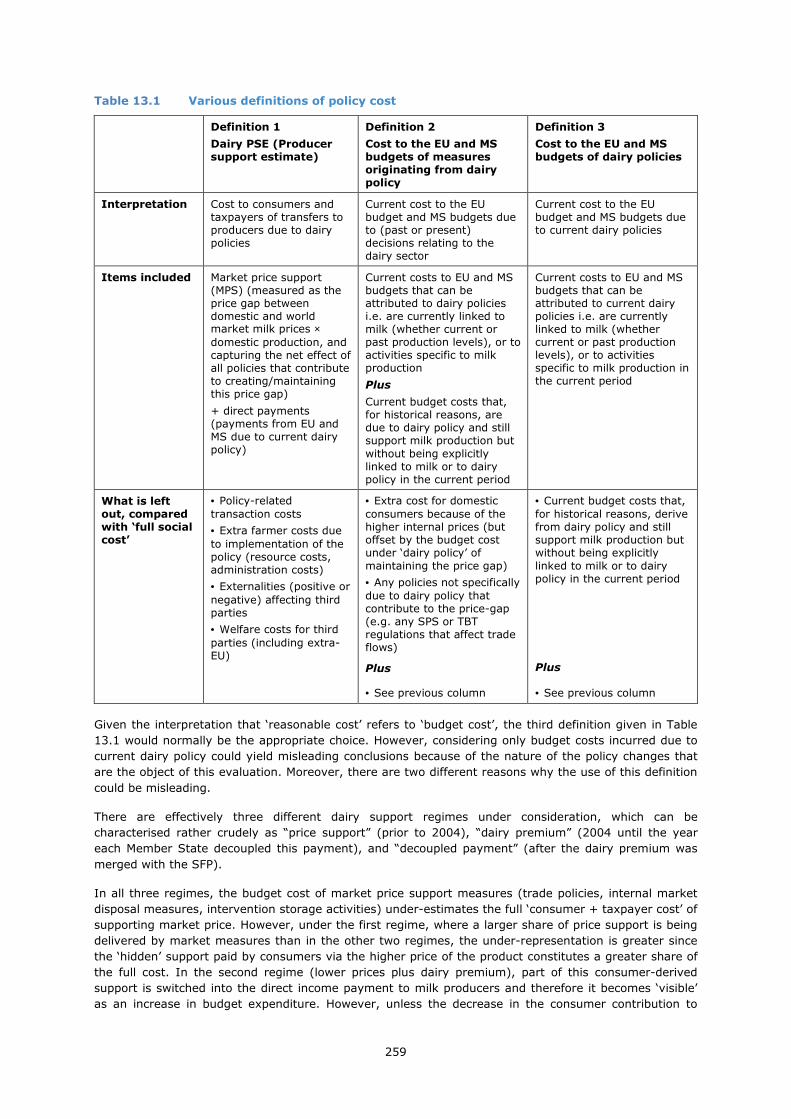
259
Table 13.1 Various definitions of policy cost
Definition 1
Dairy PSE (Producer support estimate)
Definition 2
Cost to the EU and MS budgets of measures originating from dairy policy
Definition 3
Cost to the EU and MS budgets of dairy policies
Interpretation Cost to consumers and taxpayers of transfers to producers due to dairy policies
Current cost to the EU budget and MS budgets due to (past or present) decisions relating to the dairy sector
Current cost to the EU budget and MS budgets due to current dairy policies
Items included Market price support (MPS) (measured as the price gap between domestic and world market milk prices × domestic production, and capturing the net effect of all policies that contribute to creating/maintaining this price gap)
+ direct payments (payments from EU and MS due to current dairy policy)
Current costs to EU and MS budgets that can be attributed to dairy policies i.e. are currently linked to milk (whether current or past production levels), or to activities specific to milk production
Plus
Current budget costs that, for historical reasons, are due to dairy policy and still support milk production but without being explicitly linked to milk or to dairy policy in the current period
Current costs to EU and MS budgets that can be attributed to current dairy policies i.e. are currently linked to milk (whether current or past production levels), or to activities specific to milk production in the current period
What is left out, compared with ‘full social cost’
• Policy-related transaction costs
• Extra farmer costs due to implementation of the policy (resource costs, administration costs)
• Externalities (positive or negative) affecting third parties
• Welfare costs for third parties (including extra-EU)
• Extra cost for domestic consumers because of the higher internal prices (but offset by the budget cost under ‘dairy policy’ of maintaining the price gap)
• Any policies not specifically due to dairy policy that contribute to the price-gap (e.g. any SPS or TBT regulations that affect trade flows)
Plus
• See previous column
• Current budget costs that, for historical reasons, derive from dairy policy and still support milk production but without being explicitly linked to milk or to dairy policy in the current period
Plus • See previous column
Given the interpretation that ‘reasonable cost’ refers to ‘budget cost’, the third definition given in Table
13.1 would normally be the appropriate choice. However, considering only budget costs incurred due to
current dairy policy could yield misleading conclusions because of the nature of the policy changes that
are the object of this evaluation. Moreover, there are two different reasons why the use of this definition
could be misleading.
There are effectively three different dairy support regimes under consideration, which can be
characterised rather crudely as “price support” (prior to 2004), “dairy premium” (2004 until the year
each Member State decoupled this payment), and “decoupled payment” (after the dairy premium was
merged with the SFP).
In all three regimes, the budget cost of market price support measures (trade policies, internal market
disposal measures, intervention storage activities) under-estimates the full ‘consumer + taxpayer cost’ of
supporting market price. However, under the first regime, where a larger share of price support is being
delivered by market measures than in the other two regimes, the under-representation is greater since
the ‘hidden’ support paid by consumers via the higher price of the product constitutes a greater share of
the full cost. In the second regime (lower prices plus dairy premium), part of this consumer-derived
support is switched into the direct income payment to milk producers and therefore it becomes ‘visible’
as an increase in budget expenditure. However, unless the decrease in the consumer contribution to

260
price support, which is part of the switch, is borne in mind, the budget increase could be wrongly
interpreted as a net increase in the social (welfare) cost of the policies. Although it is likely that budget
expenditure on market intervention is lower in the second regime, because the price gap is lower
(smaller refunds) and internal market prices are lower (lower expenditure on consumption aids), this
reduction in budget expenditure is still likely to under-represent the fall in the transfer from consumers,
which is paid on all the intra-marginal units of dairy products, whereas the market intervention
expenditure occurs at the margin for relatively small quantities (although the expenditure per unit of this
‘marginal’ product is higher). Thus, a narrow focus on budget cost alone may well lead to the conclusion
that the switch of some support from market price support to a direct payment has increased the
economic cost of dairy policy, whereas the opposite is more likely to be true.
A different kind of misrepresentation may occur with the switch from the second regime (“dairy
premium”) to the third regime (“decoupled payment”). With the decoupling of the dairy premium, this
payment to dairy producers loses its identity as a specific dairy policy payment. This poses a new
problem: if the decoupled payment is removed from the dairy policy cost figures, the impression is given
that a significant share of dairy policy expenditure has ceased and therefore the efficiency of dairy policy
has increased, even though (a) milk producers continue to receive support at levels comparable with
what they received in the second (“dairy premium”) regime, (b) the rationale for this payment lies in
past dairy policy and (c) this support continues to be paid from the EU budget under Pillar 1 in pursuit of
one of the objectives of dairy policy.
To deal with the second problem, analysis of this evaluation question will work with two definitions of
budget costs, namely the second and third cost definitions given in Table 13.1. The second definition
retains the equivalent of the decoupled dairy premium in the estimates of budget expenditure on dairy
right up to the end of the evaluation period.82 This is done in order to provide continuity and to prevent
wrong conclusions being drawn about the cost of attaining dairy policy objectives suddenly falling. The
methodology for estimating the equivalent decoupled payment (which is called in this text the ‘ex-dairy
premium’) to be included in the measured budget costs is explained in Section 13.2.
It is important to stress that the use of Definition 2 (which includes the ex-DP) in no way constitutes a
judgement or even a reservation that the DP may not have been effectively decoupled. The position
taken here is that the payment is fully decoupled in the way it operates, in the signals and incentives it
delivers to milk producers, and in its effects. Moreover, this is the correct way for producers and analysts
to perceive it. Keeping it in the figures for dairy budget support until the end of this evaluation period is
simply a device to avoid misleading statistical effects. We would expect that in subsequent evaluations,
which will not have to contend with a coupled payment specifically for milk becoming decoupled during
the period of evaluation, this payment will not be treated as part of dairy policy at all. Hence, the use of
this definition is a one-off expedient adopted for this evaluation.
The first possibility for misrepresentation (which arises with the shift of some sectoral support out of
market price support and into the DP) will not be tackled by using a third ‘cost’ definition (such as the
PSE) that is invariant with respect to the relative shares of consumer and taxpayers transfers in total
support to the sector. The main reason for not doing so is that it lies outside the mandated evaluation
methodology (which, as explained above, we interpret as relating policy effects to budget costs). The
OECD’s measure of market price support (estimated as part of the annual PSE calculations) will,
however, be used to shed light on two issues. First, in the second regime, when the dairy premium
replaces part of market price support and thereby adds to the budget cost, there should be a reduction in
the level of market price support as prices fall. The market price support component of the PSE will be
one of the indicators used to check this prediction. When interpreting differences in budget expenditure
before and after the start of 2004, any offsetting fall in price support coming directly from consumers
should be borne in mind as part of the wider context. Second, economic theory indicates that when the
proportion of a given amount of producer support being transferred in the form of a direct payment is
larger, its transfer efficiency (i.e. the share that actually reaches the producer rather than leaking away
(or being “captured”) by other related sectors such as upstream and downstream segments of the chain)
is higher. This prediction will also be checked using PSE concepts.
82 Note that such an adjustment is not made in the calculated PSE for dairy. The decoupled milk payment disappears from this estimate in its year of decoupling. However, it still remains in the taxpayer cost of support to the agricultural sector as a whole.
261
Finally, if the evaluation period had not contained this discrete shift from market price support to direct
income price support, the case for ignoring transfers from consumers altogether and looking only at
budget-financed expenditure would be stronger. However, given that minimising budget costs is not a
final goal in itself but always has to be viewed in the context of maintaining or improving social welfare,
if changes in budget expenditure alone are directly linked to changes in other indicators of welfare, the
latter need to be taken into account. To justify focusing only on changes in budget expenditure, it would
not be enough to know that there was no shift between consumer-financed support and budget support;
it would also have to be assumed that the amount of consumer-financed support remained more or less
constant regardless of changes in budget support. This is clearly not the case here. On the contrary, a
fall in the institutional price level and a smaller price gap were integral parts of the policy reform.
13.2 Methodology used for answering EQ9: efficiency
13.2.1 Estimating the SFP equivalent of the DP
The methodology for estimating the decoupled direct payment received by producers after decoupling of
the dairy premium (DP) differs between EU-15 and EU-12.
Member States of EU-15 began receiving the DP in 2004. In a year of their choosing, but not later than
2007, this payment had to be decoupled from milk and incorporated into the Single Farm Payment (SFP).
For the five Member States of EU-15 that decoupled in 2005, the quantity of milk approved for the DP in
2004 was multiplied by €16.31 in 2005, and by €24.49 for 2006 and subsequent years. For those five MS
that decoupled in 2006, the quantity of milk that was approved for the DP in 2005 was multiplied by
€24.49 in 2006 and subsequent years. For the remainder, the quantity of milk that was approved for the
DP in 2006 was multiplied by €24.49 in 2007 and subsequent years. In all cases, if the quantity of milk
produced in years after decoupling fell below the quantity produced in the last year for which the DP was
coupled, the amount of the SFP ‘attributed’ to previous dairy policy is reduced proportionately. This
adjustment is not applied if the quantity of milk in subsequent years rises above that of the last year
with decoupling.
Six of the twelve New Member States paid Complementary Direct National Payments to milk producers
during the period 2005 to 2008. Beyond this year, these payments were decoupled from milk and
absorbed into the Single Area Payment (SAP). Data on the total amount paid by each of the MS
concerned in 2008 are available, and are projected into subsequent years as that part of the SAP
‘inherited’ from former support for dairy, and with the same adjustment for a fall in production as
described for the countries of EU-15. This procedure involves a small degree of under-estimation, since
no allowance is made for the MS that, from the outset, treated the DP as decoupled and incorporated it
into the SAP.
13.2.2 Sources and estimates of other payments from the EU budget
Information on EU budget payments for market support measures (consumption aids, export refunds,
intervention storage aids, private storage aids) has been taken from budget figures, originating in DG
Budget and supplied by DG AGRI. Data on direct payments from the EU budget to the milk sector are
taken from the PSE data base (2011). These data are provided to the OECD by the European
Commission according to a standard methodology that systematically reports all policy-related payments
attributable to dairy policy. The figures from this source were cross-checked with budget data supplied
by the Commission.
For part of the period covered, levies paid to the EU budget by producers and dairies on over-quota
deliveries were substantial. Although the motivation for the super-levy was to dissuade over-quota
deliveries rather than to generate revenue in order to ‘self-fund’ dairy surplus disposal, these payments
are treated as offsets to expenditure on market support measures for dairy (rather than, say, as
‘administrative costs’) when calculating total budget expenditure, since there is a causal link between
over-quota production and higher costs of balancing the market.
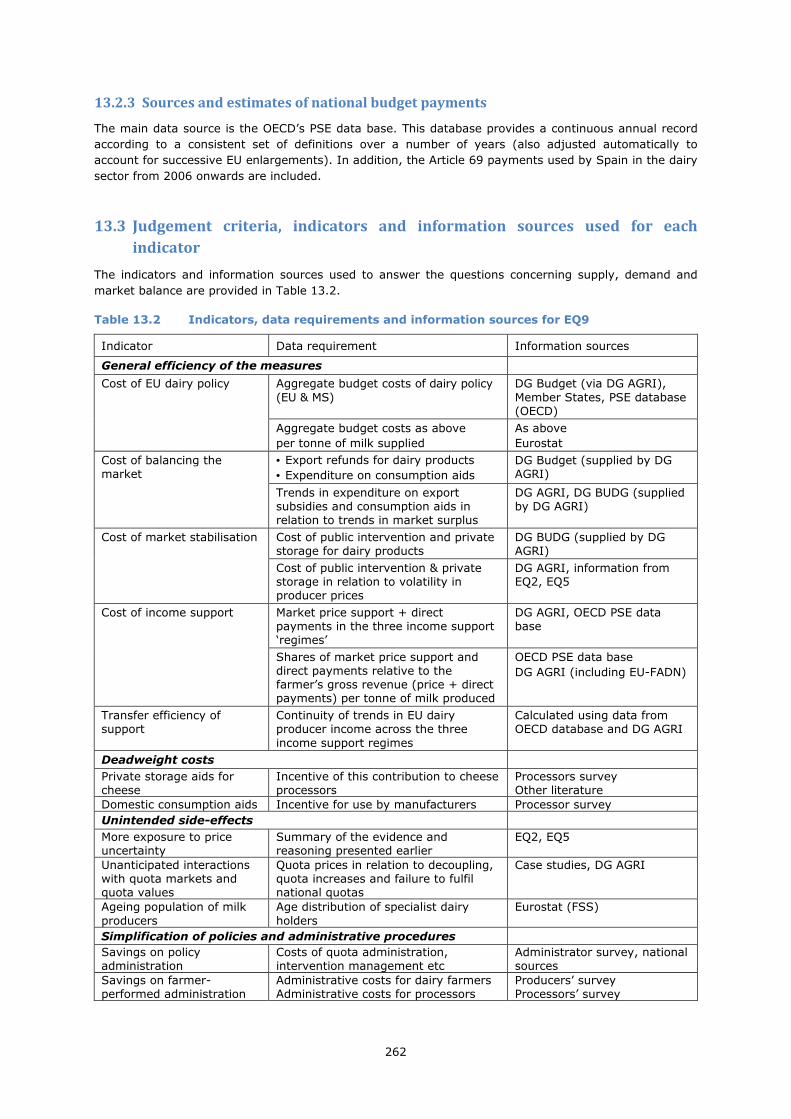
262
13.2.3 Sources and estimates of national budget payments
The main data source is the OECD’s PSE data base. This database provides a continuous annual record
according to a consistent set of definitions over a number of years (also adjusted automatically to
account for successive EU enlargements). In addition, the Article 69 payments used by Spain in the dairy
sector from 2006 onwards are included.
13.3 Judgement criteria, indicators and information sources used for each
indicator
The indicators and information sources used to answer the questions concerning supply, demand and
market balance are provided in Table 13.2.
Table 13.2 Indicators, data requirements and information sources for EQ9
Indicator Data requirement Information sources
General efficiency of the measures
Cost of EU dairy policy Aggregate budget costs of dairy policy (EU & MS)
DG Budget (via DG AGRI), Member States, PSE database (OECD)
Aggregate budget costs as above
per tonne of milk supplied
As above
Eurostat
Cost of balancing the market
• Export refunds for dairy products
• Expenditure on consumption aids
DG Budget (supplied by DG AGRI)
Trends in expenditure on export subsidies and consumption aids in relation to trends in market surplus
DG AGRI, DG BUDG (supplied by DG AGRI)
Cost of market stabilisation Cost of public intervention and private storage for dairy products
DG BUDG (supplied by DG AGRI)
Cost of public intervention & private storage in relation to volatility in producer prices
DG AGRI, information from EQ2, EQ5
Cost of income support Market price support + direct payments in the three income support ‘regimes’
DG AGRI, OECD PSE data base
Shares of market price support and direct payments relative to the farmer’s gross revenue (price + direct payments) per tonne of milk produced
OECD PSE data base
DG AGRI (including EU-FADN)
Transfer efficiency of support
Continuity of trends in EU dairy producer income across the three income support regimes
Calculated using data from OECD database and DG AGRI
Deadweight costs
Private storage aids for cheese
Incentive of this contribution to cheese processors
Processors survey Other literature
Domestic consumption aids Incentive for use by manufacturers Processor survey
Unintended side-effects
More exposure to price uncertainty
Summary of the evidence and reasoning presented earlier
EQ2, EQ5
Unanticipated interactions with quota markets and quota values
Quota prices in relation to decoupling, quota increases and failure to fulfil national quotas
Case studies, DG AGRI
Ageing population of milk producers
Age distribution of specialist dairy holders
Eurostat (FSS)
Simplification of policies and administrative procedures
Savings on policy administration
Costs of quota administration, intervention management etc
Administrator survey, national sources
Savings on farmer-performed administration
Administrative costs for dairy farmers Administrative costs for processors
Producers’ survey Processors’ survey

263
The judgement criteria in most cases are based on the following principle. First, evidence is assembled
on how the cost of various measures or of achieving various objectives has evolved over time, and is
then matched with the impact on desired objectives. As far as is possible, these judgements will be
based on a relevant comparison between the periods before and after the policy changes under
evaluation. Various possibilities may arise, as shown in Table 13.3.
Table 13.3 Stylised classification of the range of judgements
Level of attainment of objective
Cost Improvement No change Deterioration
Decreasing No change Increasing
Objectives that fall in the cells with solid shading represent an increase in efficiency: there is either the
same level of attainment at lower cost, or a better level of attainment with lower or unchanged cost.
Cases that fall in the cells with diagonal shading represent a reduction in efficiency: there is a lower level
of attainment despite constant or increasing policy costs, or the same level of attainment but at a higher
cost. Cases falling on the rising (turquoise) diagonal will be discussed on a case-by-case basis with the
aim of reaching a more case-specific judgement. The concluding section of this evaluation question will
summarise the findings using this approach.
13.4 General efficiency of the measures
13.4.1 Cost of EU dairy policy
Table 13.4 summarises the average budget cost per year for the three sub-periods that correspond
approximately to the three regimes “price support”, “dairy premium”, and “decoupled payment” as
described in Section 13.2. It should be recalled that during the second of these sub-periods, decoupling
of the dairy premium was not synchronised across Member States: in EU-15, five Member States
decoupled in 2005, another five in 2006, and by 2007 decoupling in EU15 was complete. In EU-10, four
Member States incorporated payments to milk into the Single Area Payment from 2004, while the other
six did so starting only in 2009. The expenditure totals without the estimated decoupled dairy premium
correspond to Definition 3 in Table 13.1, and the totals that include the estimated decoupled dairy
premium correspond to Definition 2.
Table 13.4 Total budget expenditure, annual averages by sub-period
Total, million euros Per tonne of milk supplied,
euros
1995-2003
2004-2006
2007-2010
1997-2003
2004-2006
2007-20101
Budget expenditure (EU only) (w'out decoupled DP) 3,130.7 2,803.3 332.4 24.47 21.19 2.44
Budget expenditure (EU only) (incl decoupled DP) 3,130.7 3,861.1 3,106.4 24.47 29.19 22.71
Budget expenditure (EU + MS) (w'out decoupled DP) 3,366.8 3,038.0 775.6 26.79 22.97 5.67
Budget expenditure (EU + MS) (incl decoupled DP) 3,366.8 4,095.8 3,549.6 26.79 30.97 25.94
Notes: 1) Supply for 2010 provisional.
Sources: DG BUDG, Eurostat.
The summary in Table 13.4 shows that the greater part of the budget costs fall on the EU budget and the
Member States’ contribution is small. Moreover, whether or not the estimated cost of the decoupled dairy
premium is included in the figures for the EU budget makes a crucial difference.
The EU budget cost according to Definition 3 is lower in the second, “transition” regime by about 10%
only: payment of the DP began in 2004 (although at the reduced rate of 33%) yet prices did not begin to
fall effectively until 2005, and surplus disposal costs were still high in 2004, declining gradually
thereafter. In the third sub-period, however, with stocks and use of market management measures at a

264
historically very low levels, and with the DP that originated in dairy policy having been fully removed
from the dairy budget, annual expenditure was on average only about 10% of what it had been during
the period 1995-2003. However, when an estimate of the cost of the decoupled dairy premium, now
removed to another part of the budget, is included in the total EU budget cost (Definition 2), the picture
changes. Average annual expenditure peaked during the transition period, but settled back to a level
comparable with what it had been during the period 1995-2003. When this expenditure is standardised
by the volume of milk supply (deliveries plus direct sales), the annual cost per tonne of milk is 7% lower
in 2007-2010 than in 1997-2003 (supply being roughly 20 million tonnes higher due to enlargements).
The evolution of the different cost totals, as well as that of production and supply, is shown in Figure
13.1.
Figure 13.1 Total budget costs (EU and Member States), 1995-20101
0
500
1,000
1,500
2,000
2,500
3,000
3,500
4,000
4,500
5,000
1995 1996 1997 1998 1999 2000 2001 2002 2003 2004 2005 2006 2007 2008 2009 2010
mill
ion
euro
s
0
20
40
60
80
100
120
140
mill
ion
tonn
es
Budget expenditure (EU + MS) (incl decoupled DP) Budget expenditure (EU + MS) (w 'out decoupled DP)
Budget expenditure (EU only) (incl decoupled DP) Budget expenditure (EU only) (w 'out decoupled DP)
EU production (right-hand axis) EU supply (right-hand axis)
Notes: 1) 2010 figures are provisional.
Sources: DG BUDG, OECD PSE database, Eurostat.
The fall in budget costs attributed to current dairy policy after 2004 is dramatic. Examination of more
disaggregated indicators later in this chapter will provide the explanation for this fall. Once decoupling is
complete, the estimated cost of the ex-dairy premium, which is included in the points joined by dotted
lines, comes to €2.7-2.8 billion, and constitutes the lion’s share of cost as calculated according to
Definition 2. This is roughly comparable to what was being spent on market support measures in the
period 1998-2003.
13.4.2 Cost of balancing the market
The measures used during the period for dealing with the structural excess supply of milk and milk
products are export refunds and aids to domestic consumption. In the period up to 2003, Figure 13.2
shows that expenditure on export refunds followed movements in structural excess supply with a lag of
about one year.83 This confirms that excess supply on the domestic market is one of the causal factors
83 The budget figures for export refunds are given for split years (e.g. 1994/95). To compare them with data in calendar years, they have been allocated to the first of the two years. Thus, expenditure in 1994/95 is allocated

265
behind changes in export refund activity. Refund expenditure began to fall sharply after 2004, reaching
very low levels in 2008 with the over-heating of world dairy markets, but started to rise again in 2009 as
the milk surplus increased again.
Figure 13.2 Export refund expenditure and structural excess supply, 1995-2009
0
500
1,000
1,500
2,000
2,500
3,000
19951996 199719981999 20002001 2002 20032004 200520062007 20082009
mill
ion
euro
s
0
2.5
5
7.5
10
12.5
15
mill
ion
tonn
es m
ilk e
quiv
alen
t
Agricultural products Non-Annex 1 refunds
Structural excess supply (right-hand axis) Total export refunds
Notes: See note at the foot of the page for definitions of agricultural goods and non-Annex 1 goods.
Source: DG BUDG.
Figure 13.3 shows the breakdown of expenditure over products for the period 1995-2009. The scale of
the graph is too small to show clearly the breakdown for 2008 and 2009. In 2008, over 60% of refund
expenditure was on butter and butter oil, and the rest largely on non-Annex 184 products and condensed
milk, whereas in 2009 whole milk powder attracted a large share of the refunds (over 40%) with the rest
allocated over the other products. Indeed, over the period as a whole, the largest individual share of
expenditure went on export refunds for whole milk powder. It is noticeable that export refunds for
cheese have been in gradual decline over the period shown. Although the EU’s world market share for
cheese was between 40 and 50% over the period (on average slightly lower after 2004 than before
2004) (see Table 2.6), an increasing share of cheese exports is finding its way to export destinations
without payment of a refund.
to 1994. This means that the true lag between a movement in the surplus and a related movement in refund expenditure one year later is somewhat greater than a year. 84 Annex 1 of the WTO Agreement on Agriculture of the 1994 Uruguay Round Agreement defines agricultural products according to their codes in the harmonised system of product classification. The CAP refund system also covers (according to the share in their composition of an agricultural ingredient) various goods manufactured from these agricultural products, such as sugar confectionery, preparations of malt extract, pasta products, bread, pastries, biscuits, sauces and soups. These goods are referred to as 'Non-Annex I goods'.

266
Figure 13.3 Composition of export refunds by product type, 1995-2009
0
500
1000
1500
2000
2500
3000
19
95
19
96
19
97
19
98
19
99
20
00
20
01
20
02
20
03
20
04
20
05
20
06
20
07
20
08
20
09
milli
on e
uros
SMP Butter and butter oil WMP Cheese Condensed milk and other sweetened non-Annex 1
Source: DG BUDG.
Figure 13.4 Expenditure on aids to domestic consumption (SMP, butter and school milk)
0
100
200
300
400
500
600
700
800
900
1995 1996 1997 1998 1999 2000 2001 2002 2003 2004 2005 2006 2007 2008 2009
mill
ion
euro
s
0
5
10
15
mill
ion
tonn
es m
ilk e
quiv
alen
t
SMP Butter Structural excess supply (right-hand axis) School milk
Source: DG BUDG, own calculations.
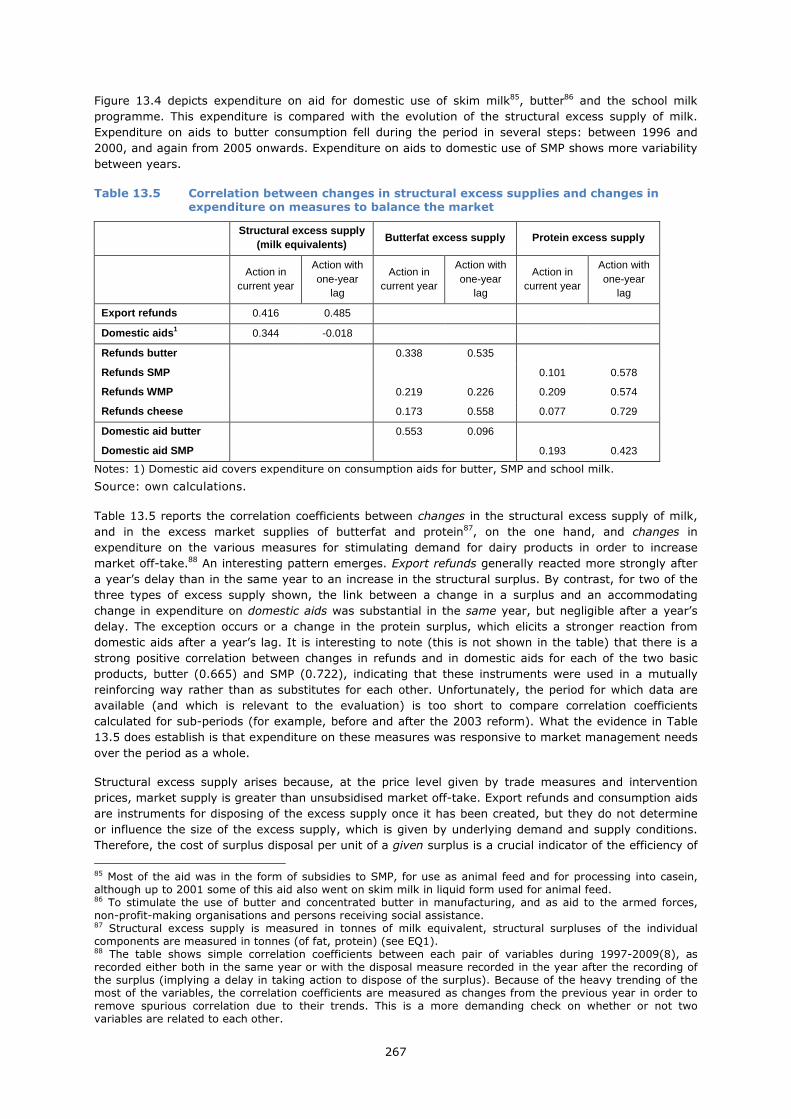
267
Figure 13.4 depicts expenditure on aid for domestic use of skim milk85, butter86 and the school milk
programme. This expenditure is compared with the evolution of the structural excess supply of milk.
Expenditure on aids to butter consumption fell during the period in several steps: between 1996 and
2000, and again from 2005 onwards. Expenditure on aids to domestic use of SMP shows more variability
between years.
Table 13.5 Correlation between changes in structural excess supplies and changes in expenditure on measures to balance the market
Structural excess supply (milk equivalents)
Butterfat excess supply Protein excess supply
Action in
current year
Action with one-year
lag
Action in current year
Action with one-year
lag
Action in current year
Action with one-year
lag
Export refunds 0.416 0.485
Domestic aids 1 0.344 -0.018
Refunds butter 0.338 0.535
Refunds SMP 0.101 0.578
Refunds WMP 0.219 0.226 0.209 0.574
Refunds cheese 0.173 0.558 0.077 0.729
Domestic aid butter 0.553 0.096
Domestic aid SMP 0.193 0.423
Notes: 1) Domestic aid covers expenditure on consumption aids for butter, SMP and school milk.
Source: own calculations.
Table 13.5 reports the correlation coefficients between changes in the structural excess supply of milk,
and in the excess market supplies of butterfat and protein87, on the one hand, and changes in
expenditure on the various measures for stimulating demand for dairy products in order to increase
market off-take.88 An interesting pattern emerges. Export refunds generally reacted more strongly after
a year’s delay than in the same year to an increase in the structural surplus. By contrast, for two of the
three types of excess supply shown, the link between a change in a surplus and an accommodating
change in expenditure on domestic aids was substantial in the same year, but negligible after a year’s
delay. The exception occurs or a change in the protein surplus, which elicits a stronger reaction from
domestic aids after a year’s lag. It is interesting to note (this is not shown in the table) that there is a
strong positive correlation between changes in refunds and in domestic aids for each of the two basic
products, butter (0.665) and SMP (0.722), indicating that these instruments were used in a mutually
reinforcing way rather than as substitutes for each other. Unfortunately, the period for which data are
available (and which is relevant to the evaluation) is too short to compare correlation coefficients
calculated for sub-periods (for example, before and after the 2003 reform). What the evidence in Table
13.5 does establish is that expenditure on these measures was responsive to market management needs
over the period as a whole.
Structural excess supply arises because, at the price level given by trade measures and intervention
prices, market supply is greater than unsubsidised market off-take. Export refunds and consumption aids
are instruments for disposing of the excess supply once it has been created, but they do not determine
or influence the size of the excess supply, which is given by underlying demand and supply conditions.
Therefore, the cost of surplus disposal per unit of a given surplus is a crucial indicator of the efficiency of
85 Most of the aid was in the form of subsidies to SMP, for use as animal feed and for processing into casein, although up to 2001 some of this aid also went on skim milk in liquid form used for animal feed. 86 To stimulate the use of butter and concentrated butter in manufacturing, and as aid to the armed forces, non-profit-making organisations and persons receiving social assistance. 87 Structural excess supply is measured in tonnes of milk equivalent, structural surpluses of the individual components are measured in tonnes (of fat, protein) (see EQ1). 88 The table shows simple correlation coefficients between each pair of variables during 1997-2009(8), as recorded either both in the same year or with the disposal measure recorded in the year after the recording of the surplus (implying a delay in taking action to dispose of the surplus). Because of the heavy trending of the most of the variables, the correlation coefficients are measured as changes from the previous year in order to remove spurious correlation due to their trends. This is a more demanding check on whether or not two variables are related to each other.

268
these measures. Figure 13.5 plots the expenditure on refunds and consumption aids per tonne of
structural excess supply over the period 1996-2009. There is considerable annual variation. The linear
trend line indicates that, on average, annual disposal expenditure fell by about €11 per tonne per year in
nominal terms over the period, indicating improving efficiency.
Figure 13.5 Budget cost of export refunds and consumption aids per tonne of structural excess supply
y = -11.367t + 276.8
0
50
100
150
200
250
300
1996 1997 1998 1999 2000 2001 2002 2003 2004 2005 2006 2007 2008 2009
euro
s per to
nne
Expenditure per tonne of SES (ME) Linear trend line
Source: own calculations.
13.4.3 Cost of market stabilisation
Figure 13.6 Budget cost of public and private intervention stocks, 1995-2009
-300
-200
-100
0
100
200
300
1995 1996 1997 1998 1999 2000 2001 2002 2003 2004 2005 2006 2007 2008 2009
milli
on e
uros
Public intervention butter Private storage butter Public intervention SMP Private storage cheese
Source: DG BUDG.

269
Figure 13.6 shows the net annual cost of intervention purchase, sales and storage (public intervention)
and storage (private intervention) over the period 1995 to 2009. The subsidies to private storage follow
a declining trend, but with very little variability around this trend. Clearly, these stocks were not used
primarily for market stabilisation between years, although they may have played a role in stabilising
seasonal market variations within each year (this cannot be verified from the annual budget data). By
contrast, the figures on public intervention emphasis the role played in stabilising markets between years
by intervention stockholding and market trading in and out of intervention storage for butter and SMP. In
years where public intervention expenditure is negative, this means that net destocking over the year
was sufficiently important to more than offset the costs of storage and depreciation.
Table 13.6 summarises the average annual budget cost of public and private stockholding activities in
different sub-periods. It should be recalled that the net cost of public intervention includes buying and
selling as well as storage costs, and therefore in some years is negative, whereas budget expenditure on
private stocks covers only the storage subsidy which is always positive. The sustained running down of
public stocks during the period 2004-2006 shows up strongly in these figures, as does the gradual
decline in subsidies to private stocks. The figure shows considerable cost savings on these two items of
budget expenditure since 2003.
Table 13.6 Average annual expenditure (€ million) on intervention stocks by sub-period, 1995-2009
1995-1999 1999-2003 2004-2006 2007-2009
Public intervention 54.39 87.17 -84.97 -1.81
Private intervention 114.69 98.71 58.54 37.50 Source: DG BUDG.
Since the primary purpose of intervention stockholding measures is to stabilise markets, their efficiency
has to be examined in relation to this objective. As long as the level of achievement of the objective has
been maintained or enhanced, the evidence in Table 13.6 can be interpreted as a strong increase in the
efficiency of these measures.
As already stated, it is not possible to discern in the annual data what role the private stockholding
measures played in smoothing seasonal fluctuations. Regarding public intervention, it is appropriate to
examine its role in relation to annual variation in the structural excess supply (trigger for action) and in
the degree of price stability achieved (impact of action). Therefore, the evaluation of these measures
should relate them to the achievement of this objective.
Figure 13.7 shows that public intervention activity has been responsive to annual changes in structural
excess supply (measured in milk equivalents). There were generally net increases in stocks in those
years when the difference between supply and unsubsidised demand increased, and net decreases in
years when the structural economic surplus was falling. Thus, public intervention measures were used
appropriately in order to counteract changes in market imbalance.
Figure 13.8 attempts to shed light on the results achieved in terms of price stability. This figure shows
the absolute value of the net budget impact (such that in years when budget costs were negative they
are measured with a positive sign). Thus, the variable as shown can be interpreted as a proxy for the
extent of intervention activity (whether positive or negative) in an attempt to smooth year-to-year
market instability. Unfortunately, the annual data at our disposal do not allow the development of a
proxy for within-year stabilisation activity. Figure 13.8 shows that up to and including 2006, intervention
activity was successful in keeping the volatility of domestic milk prices low (and well below that of world
market prices, see EQ2). However, from 2007 onwards, when the world market milk price equivalent for
the basic products butter and cheese rose above the internal EU intervention milk price equivalent, there
was no point in EU intervention buying (the world market price was more attractive to suppliers). This
situation was more likely to occur because of the reduction in intervention price levels due to the 2003
reform.
At the same time, the role for export subsidies on these two products also disappeared (as the price gap
was negative). Hence, the two measures in the dairy policy portfolio that normally serve to stabilise
domestic prices were rendered ineffective. As a consequence, the volatility of the EU milk price rose to
what was historically a very high level.

270
Figure 13.7 Cost of public intervention relative to movements in structural excess supply
-250
-150
-50
50
150
250
350
199
5
199
6
199
7
199
8
199
9
200
0
200
1
200
2
200
3
200
4
200
5
200
6
200
7
200
8
200
9
mill
ion
euro
s
-10
-5
0
5
10
15
mill
ion
tonn
es
Net costs of public intervention
Structural excess supply (milk equivalents)(right-hand axis)
Source: DG BUDG, own calculations made for EQ1.
Figure 13.8 Intervention activity and milk price volatility, 1995-2009
0
50
100
150
200
250
300
350
400
1995
1996
1997
1998
1999
2000
2001
2002
2003
2004
2005
2006
2007
2008
2009
2010
mill
ion
euro
s
7
8
9
10
11
12
13
14
15
AS
D (
annu
al)
Net costs of public intervention (absolute value) Volatility producer milk price milk (right-hand axis)
Source: DG BUDG, own calculations for EQ2.
The conclusions that can be drawn regarding the efficiency of the intervention system are the following.
First, intervention activities have been a diminishing item in the EU agricultural budget, and have been
used appropriately to deal with variations in the market conditions. Second, up to and including 2006,
this activity was effective in stabilising the internal milk price. However, from 2007, the high level of

271
world market prices rendered intervention ineffective for stabilising internal prices, and this allowed the
unusually high level of world market price volatility to be transmitted to domestic prices.
Evaluating the efficiency of a measure involves assessing “the extent to which the desired effects are
achieved at a reasonable cost”. In this case, the desired effects were not achieved in 2007 to mid-2009.
At the same time the cost of the measure was also very low because it was hardly used, because the
prevailing conditions were inappropriate for its use. Thus, the decision not to use it can be viewed as
“efficient”. Most importantly, this episode reveals a gap in the measures available within the dairy CAP to
deal with such a situation. If it is considered that this situation is likely to occur more frequently in the
future, then additional means have to be put in place either to reduce the transmission of price volatility
from world markets, or to shield producers (or help them to protect themselves) from the consequences
from greater price volatility.
13.4.4 Cost of producer income support
CAP dairy policy involves transfers from both consumers (via higher market prices) and taxpayers
(through direct payments from the EU and Member States’ budgets). This evaluation question focuses on
the efficiency of budget expenditure in achieving policy goals. However, because the evaluation period
has witnessed a shift of support away from consumer transfers and towards budget transfers, the
evaluation would be incomplete if the efficiency of this shift itself were not examined. It is almost certain
that the shift of some support out of market prices and into direct payments will cause an increase in
budget expenditure, even after the lower budget costs of supporting market prices are taken into
account. But this does not necessarily mean that dairy policy has become more onerous to the economy
as a whole. The reduction in the burden on consumers has also to be taken into account when judging
the overall efficiency of the policy change.
Data on budget expenditure are readily available. Information on transfers from consumers has to be
estimated, and there is more than one way of doing so. In this analysis, the approach taken by the OECD
is used. According to this methodology, market price support (the non-budget element of support to a
commodity sector due to the policies targeting that sector) is measured as the gap between domestic
and world market (border) prices (i.e. the price paid at point of entry of an import before duties), times
the volume of domestic production.89 The underlying assumption is that, without the intervention of dairy
policy, consumers would pay world market prices for dairy products, and that these prices would remain
unchanged at their current values if all dairy measures were abolished. Of course, given the size of the
EU and its share of world markets for dairy products, it is inevitable that world market prices would be
higher than at present if EU dairy policies were abandoned. Therefore, the estimate of market price
support obtained using this methodology should be treated as an upper limit of the true size of the
transfer if it could be measured using a more accurate counterfactual.
This section examines the change in consumer transfers relative to the change in budget expenditure
after the 2003 policy reform, with and without taking account of the ex-dairy premium budget payment
(i.e. that part of the SFP that was formerly the dairy premium before it was decoupled). It first examines
the evidence based on actual estimates of market price support (MPS). Then, in order to allow for the
fact that in the years 2007-2009 the price gap became very small due to exceptionally high world market
prices90, the question is re-examined using estimates of the price gap that would be expected if world
prices had stayed at their 2004-2006 level, and if EU domestic prices had remained above world market
prices but gradually tracked downwards following the reductions in intervention prices.
89 The net transfer from consumers (‘consumer transfers’) is measured as market price support less any subsidies on consumption that result from sectoral policy. This is the difference between what domestic consumers pay for agricultural production and what they would pay if there were no policies supporting agriculture. It is important to note that the consumer transfer measures the cost to consumers, not necessarily what is received by producers. Much of this transfer is absorbed by other stakeholders, such as input suppliers, who supply inputs at above cost and landowners whose rent is higher than it would be if agriculture were not supported. For the EU milk sector, net transfers from EU dairy consumers have risen from around 87% of market price support in the mid-1990s to nearly 100% in 2010. 90 The analysis of evaluation question 2 shows that in 2007 and 2008, the world milk price equivalent based on world market prices of butter and SMP was well above the EU’s milk price equivalent based on intervention prices of these basic dairy products.

272
Figure 13.9 shows the evolution of consumer and taxpayer transfers to the EU dairy sector. The ‘EU’
relates to its territorial configuration in the year in question. Thus, underlying these figures there is an
increase of over 20 million tonnes of milk production between 2003 and 2004 caused by the accession of
ten new Member States. Changes in the MPS before 2004 are caused largely by variations in the price
gap due to changes in world market prices and exchange rates. From 2004 onwards, the price gap is
squeezed from both sides: falling domestic prices (due to the 2003 reform) and rising world market
prices. The years 2004, 2005 and 2006 see a marked increase in budget transfers to the sector because
of the dairy premium, which disappears from the category of budget expenditure due specifically to dairy
policy from 2007 onwards following decoupling. The grey-shaded segment of each bar is our estimate of
this budget item after decoupling. Even taking into account the value of the decoupled dairy premium, it
is obvious from Figure 13.9 that the rate at which budget payments (taxpayers) replaced MPS
(consumers) was roughly €5 of MPS less for €1 more of direct payment. This implies (but subject to a
number of caveats) that each euro of the additional budget expenditure resulting from the switch from
market price support to direct income support was about five times more efficient in supporting income
than when that euro was paid through higher market prices. Clearly, this vastly over-estimates the
efficiency gain due to the policy change, since part of the reduction in the price gap in 2007-2009 was
due to rising world prices (independent of EU policies), and not policy-induced falls in EU domestic prices.
In the coming years, given the degree of EU border protection, a price gap is likely to re-emerge.
Figure 13.9 Total support to milk production, 1995-2009
0
5
10
15
20
25
1995 1996 1997 1998 1999 2000 2001 2002 2003 2004 2005 2006 2007 2008 2009
bill
ion e
uro
s
Market price support Dairy policy budget transfers to producers Estimated ex-DP after decoupling
Source: OECD database, DG BUDG, own calculations.
Figure 13.10 shows support (MPS as actually measured, plus budget expenditure due to dairy policy,
plus the estimate of the ex-dairy premium) relative to the farm-gate value of production per tonne
(including the estimated value of on-farm use of milk). The share of production value coming from
support is historically very low in 2007-2009 (10% or less), but as already indicated, a considerable part
of this is due to the surge in world market prices rather than to EU policies.

273
Figure 13.10 Support from consumers and taxpayers relative to production value, 1995-2009
0
50
100
150
200
250
300
350
1995 1996 1997 1998 1999 2000 2001 2002 2003 2004 2005 2006 2007 2008 2009
euro
s pe
r to
nne
0
10
20
30
40
50
60
per
cent
Market value of production at farm gate per tonne
Producer support per tonne of milk produced
Share of support (%) in production value (right-hand axis)
Sources: OECD PSE database, DG BUDG.
The extreme world market conditions of 2007-2009 meant that for the greater part of that period the
price gap between EU prices and world market prices for intervention products was negative (hence set
to zero in the PSE database), and also that EU producer prices were strongly influenced by world market
prices, recording an unprecedentedly high peak (see EQ 2). This means that the movement in the MPS
shown in Figure 13.9 is strongly affected by events that are unrelated to EU policy changes.
In order to remove the impact of these external events and obtain an estimate of how the MPS would
have changed if world market conditions had remained as they were in 2004-2006, the MPS has been
recalculated from 2005 onwards assuming that border prices remained at their 2004-2006 average, and
that EU prices continued to be relatively insulated from world market price movement so that the gradual
decline in domestic price intended by the policy changes (lowering of intervention prices) dominated. The
EU internal price has been reduced linearly between the prices recorded in 2004 and 2008 to converge
on the value observed for 2009, rather than following the price spike that was actually observed over
that period. It must be emphasised that this calculation is based on rather crude assumptions, but
nevertheless the calculations give an idea of the order of magnitude of the change in MPS due to EU
policy changes alone. The evolution of the MPS derived under these assumptions (denoted MPS*), and
the total support figures incorporating this estimated MPS are shown in Figure 13.11.

274
Figure 13.11 Support from consumers and taxpayers (assuming ‘normal’ market conditions
in 2007-2009)
0
5
10
15
20
25
199
5
199
6
199
7
199
8
199
9
200
0
200
1
200
2
200
3
200
4
200
5
200
6
200
7
200
8
200
9
billio
n eu
ros
Market price support MPS* MPS*+ BT MPS*+ BT+ex-DP
Notes: MPS* is the estimate of MPS assuming the world market prices remained at their 2004-2006 average; BT is budget transfers to producers as a result of dairy policy (in PSE jargon ‘producer single commodity transfers’), and ex-DP is the estimated value of the former dairy premium, now absorbed into the SFP.
Sources: OECD database, DG BUDG, own calculations.
Table 13.7 summarises the averages of the series shown in Figure 13.11 for various sub-periods of
interest.
The analysis shows that, even when the ex-dairy premium is accounted for as part of the budget
expenditure going to the dairy sector, the total transfer from consumers and taxpayers due to dairy
policy and those inherited from past dairy policy is lower in the post-reform period than in the
period leading up to the 2003 reform, once the fall in ‘normal’ MPS is accounted for. On average,
this support was already 5% lower in the transition ‘dairy premium regime’ (2004-2006) and would
have been about 22% lower in the period 2007-2009 without the turbulence in world dairy markets.
Table 13.7 Levels of support to dairy according to different measures in various sub-periods, 1995-2009
Averages per sub-period
billion euros 1995-1999 1999-2003 2004-2006 2007-2009
MPS (based on real data) 18.76 15.60 10.96 3.35
MPS* (estimated under ‘normal’ world and EU market conditions) 18.79 15.60 12.36 9.35
MPS*+BT for dairy (latter as recorded) 18.94 15.89 14.05 9.61
MPS*+BT for dairy +ex-DP* (last item as estimated) 18.94 15.89 15.11 12.41
Percentage difference relative to 1999-2003 19.2 0.0 -4.9 -21.9
Source: own calculations.
Whether the lower total cost (to consumer and taxpayers) means that dairy policy has become more
efficient depends on whether the level of attainment of the policy objectives has been maintained or
enhanced, or whether policy objectives have suffered. Analysis presented in the answers to earlier
evaluation questions indicates that, in the post-reform period, market balance has improved and that
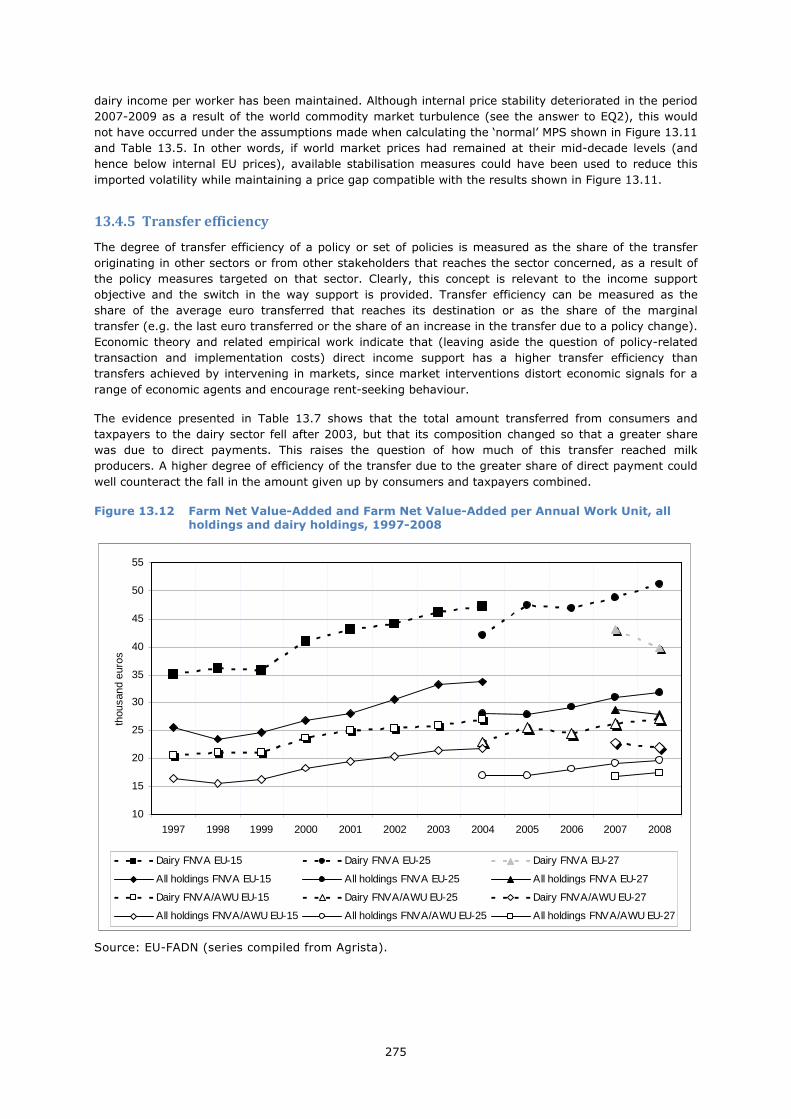
275
dairy income per worker has been maintained. Although internal price stability deteriorated in the period
2007-2009 as a result of the world commodity market turbulence (see the answer to EQ2), this would
not have occurred under the assumptions made when calculating the ‘normal’ MPS shown in Figure 13.11
and Table 13.5. In other words, if world market prices had remained at their mid-decade levels (and
hence below internal EU prices), available stabilisation measures could have been used to reduce this
imported volatility while maintaining a price gap compatible with the results shown in Figure 13.11.
13.4.5 Transfer efficiency
The degree of transfer efficiency of a policy or set of policies is measured as the share of the transfer
originating in other sectors or from other stakeholders that reaches the sector concerned, as a result of
the policy measures targeted on that sector. Clearly, this concept is relevant to the income support
objective and the switch in the way support is provided. Transfer efficiency can be measured as the
share of the average euro transferred that reaches its destination or as the share of the marginal
transfer (e.g. the last euro transferred or the share of an increase in the transfer due to a policy change).
Economic theory and related empirical work indicate that (leaving aside the question of policy-related
transaction and implementation costs) direct income support has a higher transfer efficiency than
transfers achieved by intervening in markets, since market interventions distort economic signals for a
range of economic agents and encourage rent-seeking behaviour.
The evidence presented in Table 13.7 shows that the total amount transferred from consumers and
taxpayers to the dairy sector fell after 2003, but that its composition changed so that a greater share
was due to direct payments. This raises the question of how much of this transfer reached milk
producers. A higher degree of efficiency of the transfer due to the greater share of direct payment could
well counteract the fall in the amount given up by consumers and taxpayers combined.
Figure 13.12 Farm Net Value-Added and Farm Net Value-Added per Annual Work Unit, all holdings and dairy holdings, 1997-2008
10
15
20
25
30
35
40
45
50
55
1997 1998 1999 2000 2001 2002 2003 2004 2005 2006 2007 2008
thou
sand
eur
os
Dairy FNVA EU-15 Dairy FNVA EU-25 Dairy FNVA EU-27
All holdings FNVA EU-15 All holdings FNVA EU-25 All holdings FNVA EU-27
Dairy FNVA/AWU EU-15 Dairy FNVA/AWU EU-25 Dairy FNVA/AWU EU-27
All holdings FNVA/AWU EU-15 All holdings FNVA/AWU EU-25 All holdings FNVA/AWU EU-27
Source: EU-FADN (series compiled from Agrista).

276
Evidence from EU-FADN indicates that the income of specialist dairy farms continued to follow previous
trends during the three regimes and that the switch of some income support out of market price support
into a decoupled payment did not perturb these trends. Figure 13.12 shows the trends in Farm Net
Value-added and Farm Net Value-added per Annual Work Unit between 1997 and 2008 for all holdings
and for dairy holdings. Since the raw data do not come from constant EU-FADN samples, the trends have
to be interpreted with some caution. Nevertheless, one can conclude that at the level of aggregation
depicted, the transition between regimes cannot be detected in these figures. Figure 13.12 shows that
Farm Net Value-added is consistently higher on dairy farms than for agricultural holdings as a whole.
Farm Net Value-Added per annual work unit is also higher on FADN dairy farms despite the fact that
dairying tends to be one of the more labour-intensive types of farming. The figures shown for just two
years for EU-27 appear to be strongly influenced by ‘transition’ behaviour in the two new entrant
countries, which pull the results in a different direction from that shown by the EU-25 results. It is
unwarranted to attribute the downward movement in the EU-27 figures between 2007 and 2008 to the
dairy policy changes under evaluation here.
Table 13.8 summarises the growth rates of two income definitions for sub-periods during 1997-2008
using the same data as displayed in Figure 13.12. Average annual income growth tended to be either
similar or (generally) higher for dairy farms throughout the period except over the sub-period 2001-
2004, when the rate of dairy income growth was slower than in the periods before or afterwards. One
may suspect that the average growth rate for 2004-2008 was biased upwards by the unusually high
prices of 2008. On the contrary, income growth between 2007 and 2008 was close to the average for the
period, and the greatest year-to-year change was between 2004 and 2005.
Table 13.8 Average annual income growth (%), all holdings and dairy holdings, 1997-2008
FNVA FNVA/AWU
1997-2004
1997-2000
2001-2004
2004-2008
Average level, 2008, € thousand
1997-2004
1997-2000
2001-2004
2004-2008
Average level, 2008, € thousand
All holdings
EUR-15 4.1 1.7 6.5 4.1 3.8 3.5
EUR-25 3.4 31.89 3.9 19.67
Dairy holdings
EUR-15 4.3 5.3 3.1 3.9 4.8 2.4
EUR-25 5.0 51.12 4.2 27.15
Notes: 1) A continuous series has been formed from data tabulated for 2 or 3 years. For overlapping years (different samples), the average has been taken. 2) FNV=Farm Net Value-added. FNV/AWU=Farm Net Value-added per Annual Work Unit.
Source: EU-FADN (DG AGRI, Agrista, various years).
Figure 13.13 provides evidence at a more disaggregated level, based on the EU-FADN results reported in
Table 7.9 (EQ3). The definition of gross revenue used in these figures includes coupled payments and
national aids, but no decoupled payments. The Member States of EU-15 have been grouped according to
the year in which the dairy premium was decoupled. In the figure, the data point representing the last
year before decoupling is distinguished by a ‘hollow’ symbol rather than an opaque one. In each case, it
is clear that gross revenue declines quite markedly in the first year of decoupling, and the fall is greater
the later the decoupling occurs, since the amount of the dairy premium (first paid in 2004) was adjusted
upwards in 2005 and again in 2006.
However, when decoupled payments are included in the income measure, this decoupling impact
disappears. Figure 13.14 depicts the trends in Farm Net Value-added per Family Work Unit (from Table
7.5 of EQ3), relative to the EU-15 average. These income figures include decoupled payments as well as
coupled payments and national aids. It is clear that the “decoupling effect” has disappeared, indicating
that for these farms that continuity of income delivery was maintained during the switch from the second
to the third support regime.
Figures 13.12 to 13.14 and Table 13.8 provide strong evidence that the reduction in the consumer plus
taxpayer cost of supporting dairy incomes does indeed represent an improvement in transfer efficiency,
since the total cost of support has fallen without detriment to the objective of maintaining producer

277
incomes. However, it has to be borne in mind that the total budget cost of support considered separately
did not fall by very much if one takes into account that some support was effectively removed from the
commodity-specific dairy budget and placed in another budget category, and that the fall in total support
cost takes into account the lower support burden paid by consumers.
Figure 13.13 Gross revenue relative (excluding decoupled payments) to the EU-15 average, specialist dairy farms, for MS groups according to the year of decoupling
0.90
0.95
1.00
1.05
1.10
1.15
1.20
2000 2001 2002 2003 2004 2005 2006 2007
Average for MS decoupling in 2005 Average for MS decoupling in 2006
Average for MS decoupling in 2007
Source: EU-FADN, based on evidence presented in EQ3.
Figure 13.14 Family Farm Income per FWU relative to the EU-15 average, specialist dairy farms, for MS groups according to the year of decoupling
0.70
0.80
0.90
1.00
1.10
1.20
1.30
2000 2001 2002 2003 2004 2005 2006 2007
Average for MS decoupling in 2005 Average for MS decoupling in 2006
Average for MS decoupling in 2007
Source: EU-FADN, based on evidence presented in EQ3.

278
13.5 Deadweight
The Glossary of terms used in the Common Monitoring and Evaluation Framework defines deadweight as
“Changes observed in the situation of beneficiaries following the public intervention, or reported by direct
addressees as a consequence of the public intervention, that would have occurred, even without the
intervention.”
The concept of deadweight is relevant to both effectiveness and efficiency. If an outcome would have
occurred in any case without the intervention, then it should not be interpreted as an impact of the
intervention and cannot be claimed as indicating that the intervention was effective. Moreover, in this
case the efficiency of the intervention instrument is low or zero, since the outcome would have occurred
without expenditure on the instrument.
The analysis of the effectiveness of policy measures conducted in the first eight evaluation questions
indicates that they have generally been effective, although to varying degrees. The two instruments
where the case looks weakest are private storage aids of cheese, and certain domestic consumption aids.
These two cases will be examined in turn.
The rates of private storage aid paid for specific types of cheese during the evaluation period are set out
in Table 2.47. Private storage aid for these cheeses was originally introduced to balance the distribution
of CAP dairy support more equitably over Member States, which explains why it targeted the production
of long-storage cheeses in southern European Member States (principally, Italy) whose overall milk
deficit situation meant they did not benefit from the intervention system for butter and SMP. Private
storage aid for cheese was discontinued in 2009 (Regulation 72/2009) on the grounds that “the buoyant
situation in the cheese market no longer justifies storage aid”.
The processors’ survey asked several questions about the impact of this storage aid and its removal. A majority of the respondents considered that its discontinuation had no impact on the prices or supply of
any dairy products. Half the respondents thought the abolition of storage aid had no impact on the price
of cheese itself, whereas others even considered its removal decreased cheese prices rather than
increasing them. Some respondents had regularly used private storage aid for cheese in the past (on
average, for about 60% of their production). As to the specific effects of its abolition on their firm’s
operations, several mentioned the squeezing of profit margins, another remarked that it would reduce
the ageing period, and there were comments about loss of competitiveness. However, it has to be
recognised are most of the cheeses that qualified for this aid are PDO/PGI cheeses, whose minimum
ageing time is closely specified in the designation of the product. Moreover, they are high-quality
cheeses produced for a market that values their specific product characteristics and is willing to pay the
premium for them. In the international market place, although there may be imitators there are no close
competitors given the strong identity that the name and origin confers on the product. Price
competitiveness in this context does not play a determining role as it does in the case of basic products
like SMP or butter. Even for cheese where the ageing time is not governed by a geographical product
designation, there is a market for older cheeses where consumers who prefer them will pay more for this
attribute.
Published evidence from the JRC-IPTS project “Food Quality Assurance and Certification Schemes
Managed within an Integrated Supply Chain” 91 indicates that the contribution of EU private storage aid to
ripening costs of these cheeses was of minor importance. For example, in 2005, EU storage aid covered a
little over 4% of the ripening cost for Grana Padano cheese and just 3% for Parmigiano Reggiano (PR)
cheese, and this aid was about 7% and 2% of net profit at wholesale level. These orders of magnitude
confirm the views expressed by the respondents to the processors’ survey.
A relevant question is whether some of this aid was passed back to milk producers, thereby enhancing
the income support objective of CAP dairy policy. The JRC-IPTS project referred to above provides
evidence that farmers producing milk for PR cheese (in the mid-2000s) received a milk price that was
about 20% above the average milk price for Italy, and that this was reflected in a gross margin about
40% higher than that earned by producing drinking milk. However, it should be borne in mind that milk
production for PR cheese, and PDO cheeses generally, involves much higher total costs (due, for example
to prescribed stocking rates, feeding regimes and so on) much of which is not reflected in the gross
91 http://foodqualityschemes.jrc.ec.europa.eu/en/documents/Casestudies_8-ParmigianoReggiano.pdf

279
margin calculation and has yet to be deducted before arriving at a net income figure. In any case, if
these cheeses would be produced anyway and in the same volumes without the storage aid, the benefit
to milk producers should also remain unchanged and cannot be attributed to the storage subsidy.
The conclusion of this analysis is that the private storage aid for cheese was for some time a redundant
measure, and its discontinuation has removed a source of deadweight from CAP dairy policy.
Regarding the possible deadweight arising from domestic consumption aids, such as the aid for
processing SMP into casein and caseinates (which became discretionary in 2009) or the disposal aid for
butter, concentrated butter and cream (which was discontinued in 2009), the issue is not whether they
were still needed in 2009. As the relevant recitals in Regulation 72/2009 state, by that time their
abolition or their change in status to optional could be justified by the current market conditions and in
particular by the greatly reduced need to dispose of structural excess supplies. Rather, the relevant
question is whether, in years prior to 2009 when they were in operation, the same level of off-take of
these products for the designated subsidised uses would have occurred even without the subsidy.
In April 2007, the disposal aid to butter and butterfat was set to zero. Figures published by the European
Court of Auditors (ECA) (ECA, 2009, p.27) show that the total off-take by the domestic market in 2008
was in line with that of 2006, when the consumption of 722 thousand tonnes of butter was subsidised at
a cost of €183 million. This indicates that already by then the use of this measure was redundant. The
evidence provided by the ECA on whether unsubsidised consumption replaced that of subsidised
consumption of SMP after aid measures were set to zero in October 2006 is less persuasive, which
undoubtedly explains why this measure was merely made optional and retained for discretionary use by
the Commission in the 2009 legislation. The view that internal disposal aids have been redundant in
recent years was also expressed by a strong majority of the respondents to the processors’ survey, who
considered that the schemes had generally had no impact on the supply or demand for dairy products,
on their prices, or on market and price stability.
In conclusion, we have been unable to find evidence that these aids have played a role in stimulating
additional demand for the aided products during the evaluation period whilst weak evidence to the
contrary is available for the second part of that period. Hence their role in achieving market balance
during that time was negligible. As for whether they have increased consumption of dairy products by
specific social groups (deprived persons, school children) over and above what it would have been
without subsidy, no evidence is available.
13.6 Unintended side-effects
The policies under review were designed to affect production and marketing decisions, that is,
operational decisions governing the performance of the sector, and outcomes following from these
decisions.
The side-effects of the policy changes that are briefly analysed in this section concern indirect
consequences due to interaction with circumstances that are completely unforeseen, or – because they
take longer to develop and may not be easily perceived – may be ignored or seen as easily correctible
because of their slower development. Three issues are raised here: first, an increase in price uncertainty
faced by milk producers in the post-2003 policy context; second, possible unforeseen complications due
to the interaction between the package of policy changes and quota markets; and third, implications of
the policy reforms for the incentive to enter or remain in dairying, and hence with net impacts on the age
distribution of farmers.
13.6.1 Increased price uncertainty
Evaluation questions 2 and 5 analyse the behaviour of prices during the evaluation period in considerable
depth, and reach the conclusion that in periods when world market prices of intervention products are
above the safety-net levels, then the stabilising potential of current policies against upward price
movements occurring on the world market, and against short term volatility of prices generated in world
markets level, is severely weakened. In these circumstances, domestic internal prices become much
more closely linked to world market prices than during periods when world market prices for basic
280
products are below the EU safety net levels, and short-term world market price movements are more
easily transmitted to domestic prices. This situation occurred in 2007-8. It had not been anticipated by
policy-makers or by market participants. The price upswing increased raw material costs for processors
dramatically, whilst the downswing in 2009 was unsettling and damaging for milk producers. During the
months when prices remained high, the short term volatility on the world market created extra
uncertainty for all participants. During this period, price transmission along the chain appears to have
worked imperfectly92, so that the windfall gains and losses were not shared in an orderly way among
chain participants, nor was there equitable sharing of the higher level of risk that the chain as a whole
was exposed to.
Two questions arise from this experience. First, if milk producers now expect more price volatility and
have less certainty about future price levels, regardless of whether similar conditions actually do occur
more frequently in the future than in the past, what will be the consequences for the sector? Milk
production is an activity that benefits from long-term stability, which provides ideal conditions for
building up high-performance herds and maintaining good levels of investment in technology and skills.
The extent to which producer confidence has suffered and (if there has been a loss of confidence)
whether there will be any lasting effects, cannot be judged at this moment. However, the milk producer
survey shed some light on this issue. Only a small minority of past milk producers who had given up milk
production gave increased price volatility as a reason. Moreover, in the much larger sample of producers
still involved in milk production, less than 5% gave it as a reason for having seriously considered giving
up milk production in recent years. However, producers clearly indicated that uncertainty impacts on
their production strategies. About three out of five respondents considered that since 2003 they had
been constrained or dissuaded from expanding herd size as much as they would have liked. Three out of
ten of these respondents gave uncertainty about future EU policy as a reason, and over half of them said
that milk price uncertainty had been a disincentive. By contrast, lack of quota availability or the high cost
of quota was given as a reason by far fewer (also about three out of ten).
Second, if similar episodes are expected to be more frequent in the future, should there be a policy
response, and what should it be? Within a more market-oriented CAP, a number of potential policy
options for protecting producers from imported price volatility are ruled out. It is now quite difficult to
frame policies for insulating domestic prices from external volatility that are also consistent with post-
2003 reforms. It is more promising to examine options for helping producers to deal with greater price
risk.
13.6.2 Unforeseen interactions with quota markets and quota values
The amount of quota held by a producer determines how much milk he can deliver without risk of paying
the superlevy. Under EU rules, the risk of a producer having to pay superlevy depends on the probability
that his dairy and his Member State will reach their respective quota limit. Thus, as long as this
probability is perceived to be high, quota has an economic value to the quota holder, as it enables him to
earn a return by selling milk. Even for producers who have never traded in quota, their quota holding has
an asset value as long as these conditions prevail. That value is equal to the discounted future flow of
economic benefits deriving from owning the quota, i.e. being able to sell milk.
In the short term, when production factors are fixed, the value per kilogramme of extra milk quota is
equal to the gross margin on the marginal kilogramme of milk produced. In the longer run, when herd
expansion and changes in production factors can be undertaken, its value is equal to the net value added
earned on the marginal kilogramme. The first valuation perspective determines the prices paid to lease
quota, whereas the second reasoning (together with the cost of capital and the producer’s perception of
future uncertainty) determines the purchase price. Most Member States have operated or allowed some
kind of quota trading system, and many milk producers have incurred debts in order to finance quota
purchases, on the assumption that they could be repaid out of future milk profits. This has always
constituted an argument against the abrupt abolition of EU milk quotas.93
92 European Commission (2009). Analysis of price transmission along the food supply chain in the EU. Commission Staff Working Document, COM(2009) 591. 93 This argument does not apply symmetrically. The abrupt introduction of quotas in 1984 appeared to create windfall asset values for all quota recipients, although it was soon understood that much of the value that became attached to quota had merely been transferred from the value of other dairy-specific fixed assets,
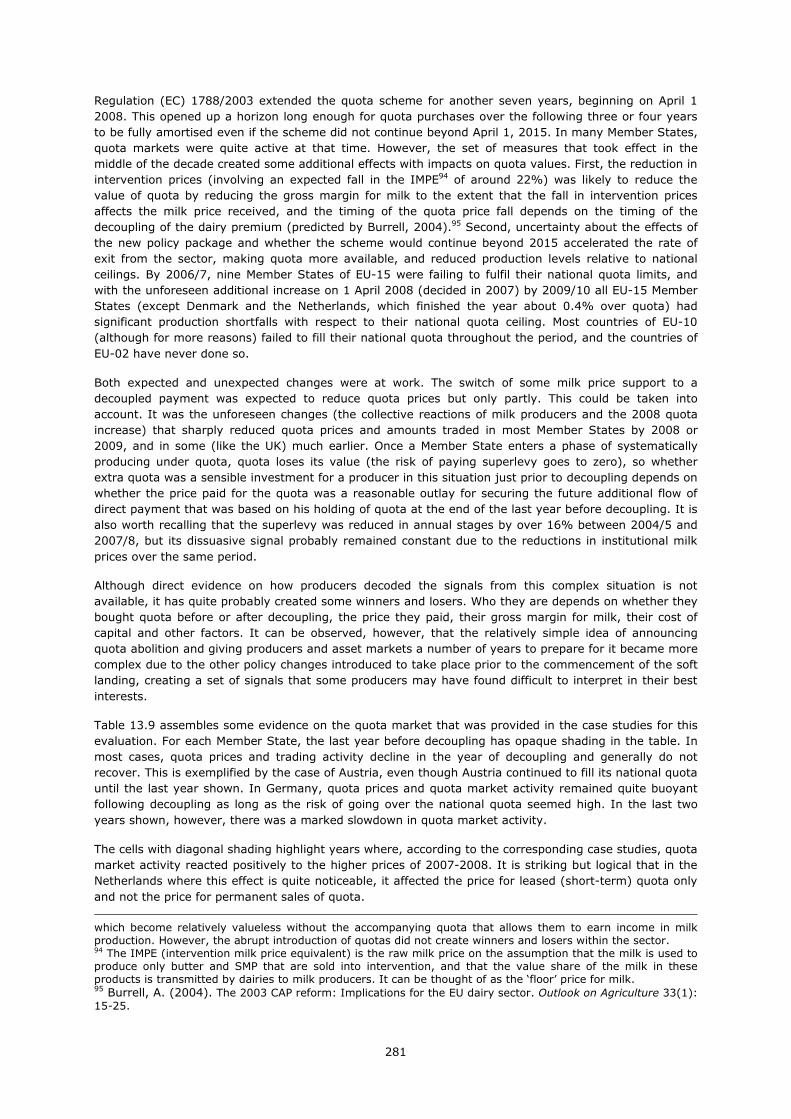
281
Regulation (EC) 1788/2003 extended the quota scheme for another seven years, beginning on April 1
2008. This opened up a horizon long enough for quota purchases over the following three or four years
to be fully amortised even if the scheme did not continue beyond April 1, 2015. In many Member States,
quota markets were quite active at that time. However, the set of measures that took effect in the
middle of the decade created some additional effects with impacts on quota values. First, the reduction in
intervention prices (involving an expected fall in the IMPE94 of around 22%) was likely to reduce the
value of quota by reducing the gross margin for milk to the extent that the fall in intervention prices
affects the milk price received, and the timing of the quota price fall depends on the timing of the
decoupling of the dairy premium (predicted by Burrell, 2004).95 Second, uncertainty about the effects of
the new policy package and whether the scheme would continue beyond 2015 accelerated the rate of
exit from the sector, making quota more available, and reduced production levels relative to national
ceilings. By 2006/7, nine Member States of EU-15 were failing to fulfil their national quota limits, and
with the unforeseen additional increase on 1 April 2008 (decided in 2007) by 2009/10 all EU-15 Member
States (except Denmark and the Netherlands, which finished the year about 0.4% over quota) had
significant production shortfalls with respect to their national quota ceiling. Most countries of EU-10
(although for more reasons) failed to fill their national quota throughout the period, and the countries of
EU-02 have never done so.
Both expected and unexpected changes were at work. The switch of some milk price support to a
decoupled payment was expected to reduce quota prices but only partly. This could be taken into
account. It was the unforeseen changes (the collective reactions of milk producers and the 2008 quota
increase) that sharply reduced quota prices and amounts traded in most Member States by 2008 or
2009, and in some (like the UK) much earlier. Once a Member State enters a phase of systematically
producing under quota, quota loses its value (the risk of paying superlevy goes to zero), so whether
extra quota was a sensible investment for a producer in this situation just prior to decoupling depends on
whether the price paid for the quota was a reasonable outlay for securing the future additional flow of
direct payment that was based on his holding of quota at the end of the last year before decoupling. It is
also worth recalling that the superlevy was reduced in annual stages by over 16% between 2004/5 and
2007/8, but its dissuasive signal probably remained constant due to the reductions in institutional milk
prices over the same period.
Although direct evidence on how producers decoded the signals from this complex situation is not
available, it has quite probably created some winners and losers. Who they are depends on whether they
bought quota before or after decoupling, the price they paid, their gross margin for milk, their cost of
capital and other factors. It can be observed, however, that the relatively simple idea of announcing
quota abolition and giving producers and asset markets a number of years to prepare for it became more
complex due to the other policy changes introduced to take place prior to the commencement of the soft
landing, creating a set of signals that some producers may have found difficult to interpret in their best
interests.
Table 13.9 assembles some evidence on the quota market that was provided in the case studies for this
evaluation. For each Member State, the last year before decoupling has opaque shading in the table. In
most cases, quota prices and trading activity decline in the year of decoupling and generally do not
recover. This is exemplified by the case of Austria, even though Austria continued to fill its national quota
until the last year shown. In Germany, quota prices and quota market activity remained quite buoyant
following decoupling as long as the risk of going over the national quota seemed high. In the last two
years shown, however, there was a marked slowdown in quota market activity.
The cells with diagonal shading highlight years where, according to the corresponding case studies, quota
market activity reacted positively to the higher prices of 2007-2008. It is striking but logical that in the
Netherlands where this effect is quite noticeable, it affected the price for leased (short-term) quota only
and not the price for permanent sales of quota.
which become relatively valueless without the accompanying quota that allows them to earn income in milk production. However, the abrupt introduction of quotas did not create winners and losers within the sector. 94 The IMPE (intervention milk price equivalent) is the raw milk price on the assumption that the milk is used to produce only butter and SMP that are sold into intervention, and that the value share of the milk in these products is transmitted by dairies to milk producers. It can be thought of as the ‘floor’ price for milk. 95 Burrell, A. (2004). The 2003 CAP reform: Implications for the EU dairy sector. Outlook on Agriculture 33(1): 15-25.

282
Table 13.9 Evidence on quota transfers and prices from six Member States
Region 1999 /00 2000 /01 2001 /02 2002 /03 2003 /04 2004 /05 2005 /06 2006 /07 2007 /08 2008 /09 2009 /10
Austria Share of quota filled, per cent
Upper Austria 99.5 103.4 104 102.7 100.4 101.9 102.9 103.2 100.8 100.8
Austria 105.3 104.9 105.1 103.6 101.8 103.4 103.5 103.4 101.6 99.8
Quota prices, in €/kg
Upper Austria 1.1 1.0 1.0 1.0 1.0 1.0 0.8 0.6 0.2 0.2 0.19
Austria 1.1 1.0 1.0 1.0 1.0 1.0 0.8 0.6 0.2 0.2 0.19
Amount traded, thousand tonnes
Upper Austria 29.9 26.5 25.2 23.1 25.9 22.2 31.3 27.9 17.7 17.9 14.6
Austria 77.2 68.8 66.6 73.7 84.3 67.5 82.7 69.5 49.4 50.8 47.5
Germany Share of quota filled, per cent
Germany
- - 100.5 99.7 101.3 101.5 99.3 100.03 101.3 99.1 97.9
quota price €/kg
0.57 0.72 0.72 0.47 0.43 0.43 0.48 0.37 0.34 0.18 0.1
Amount traded, NOT over the exchange, thousand tonnes
Bavaria 196.5 197.3 231.2 284.4 316.2 269.4 326.7 233.9 307.9 218.1
Lower Saxony 80.4 181.3 293.6 266.7 288.9 301.3 404.9 309.5 197.3
Amount traded over the exchange, thousand tonnes
18.5 227.5 225.2 448.6 543.9 410.2 522.5 641.6 485.7 536.3
Ireland Share of quota filled, per cent
99.8 100.5 100.8 98.2 99.7 100.7 97.5 90
Quota price, cents/kg
31 31 17.5 12 10-28 12-45 10-40 6-18
Quota traded or transferred, thousand tonnes
174.3 166.2 178.1 14.7 200 124 55 46
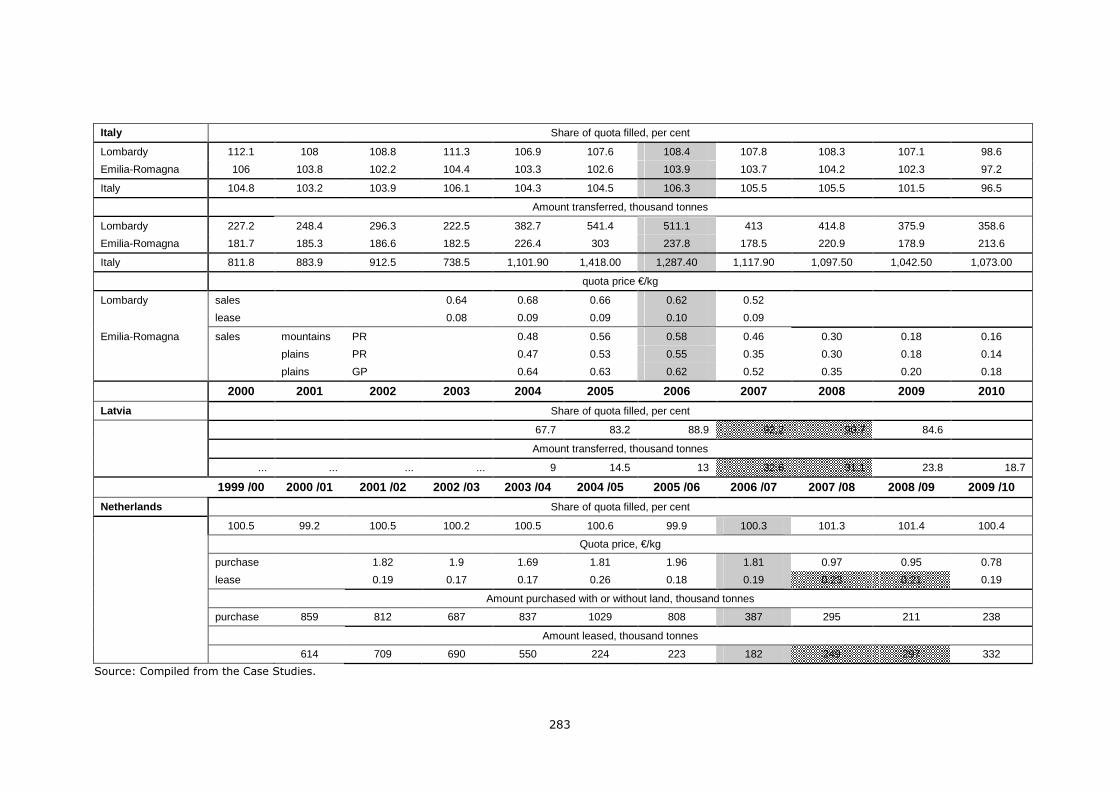
283
Italy Share of quota filled, per cent
Lombardy 112.1 108 108.8 111.3 106.9 107.6 108.4 107.8 108.3 107.1 98.6
Emilia-Romagna 106 103.8 102.2 104.4 103.3 102.6 103.9 103.7 104.2 102.3 97.2
Italy 104.8 103.2 103.9 106.1 104.3 104.5 106.3 105.5 105.5 101.5 96.5
Amount transferred, thousand tonnes
Lombardy 227.2 248.4 296.3 222.5 382.7 541.4 511.1 413 414.8 375.9 358.6
Emilia-Romagna 181.7 185.3 186.6 182.5 226.4 303 237.8 178.5 220.9 178.9 213.6
Italy 811.8 883.9 912.5 738.5 1,101.90 1,418.00 1,287.40 1,117.90 1,097.50 1,042.50 1,073.00
quota price €/kg
Lombardy sales 0.64 0.68 0.66 0.62 0.52
lease 0.08 0.09 0.09 0.10 0.09
Emilia-Romagna sales mountains PR 0.48 0.56 0.58 0.46 0.30 0.18 0.16
plains PR 0.47 0.53 0.55 0.35 0.30 0.18 0.14
plains GP 0.64 0.63 0.62 0.52 0.35 0.20 0.18
2000 2001 2002 2003 2004 2005 2006 2007 2008 2009 2010
Latvia Share of quota filled, per cent
67.7 83.2 88.9 92.2 90.7 84.6
Amount transferred, thousand tonnes
... ... ... ... 9 14.5 13 32.6 31.1 23.8 18.7
1999 /00 2000 /01 2001 /02 2002 /03 2003 /04 2004 /05 2005 /06 2006 /07 2007 /08 2008 /09 2009 /10
Netherlands Share of quota filled, per cent
100.5 99.2 100.5 100.2 100.5 100.6 99.9 100.3 101.3 101.4 100.4
Quota price, €/kg
purchase 1.82 1.9 1.69 1.81 1.96 1.81 0.97 0.95 0.78
lease 0.19 0.17 0.17 0.26 0.18 0.19 0.23 0.21 0.19
Amount purchased with or without land, thousand tonnes
purchase 859 812 687 837 1029 808 387 295 211 238
Amount leased, thousand tonnes
614 709 690 550 224 223 182 249 297 332
Source: Compiled from the Case Studies.

284
13.6.3 Implications for the age structure of milk producers
Milk production is a demanding full-time activity on a year-round basis. In Europe it has traditionally
attracted relatively younger farm operators and has had a smaller proportion of producers in the over-65
age group than most other types of farming.
Table 13.10 compares the evolution of the age structure over time of specialist dairy holders with that of
all holders over a 22-year period. In interpreting the figures in the table, it is important to bear in mind
that the number of years over which changes are recorded are very unequal.
Table 13.10 Changes in the age structure of specialist dairy farmers, 1985-2007
Share younger than 35 (%) Change in share younger t han 45 (percentage points)
1995 2007 1985-1995 1995-2000 2000-2005 2005-2007
All holdings EU-15 7.9 5.0 0.9 -1.7 -2.4 EU-25 7.1 -1.9 EU-27 6.1 -1.7
Specialist dairy holdings EU-15 15.1 9.0 1.7 -1.2 -3.2 EU-25 9.8 -2.7 EU-27 8.4 -1.7 Austria 18.9 11.4 2.6 -0.8 -3.7
Belgium 21.0 8.5 8.5 1.4 -5.8 -1.3
Denmark 10.0 9.5 -3.0 15.7 -7.3 -4.0
Finland 19.0 9.7 45.9 -3.5 -4.5 -2.3
France 18.7 13.8 16.2 -4.8 3.1 -1.2
Germany 19.8 8.5 10.2 2.4 -5.3 -4.3
Greece 6.6 18.1 5.5 17.6 8.2 2.7
Ireland 15.4 8.4 6.5 4.0 -3.3 -4.3
Italy 10.4 7.4 8.3 4.9 2.5 -8.3
Luxembourg 15.3 6.3 9.6 -5.7 -7.6 -3.4
Netherlands 7.4 3.9 -2.5 1.0 8.3 -3.4
Portugal 11.6 6.6 31.8 3.4 -6.5 -2.7
Spain 10.1 10.1 26.9 9.1 -4.0 -0.4
Sweden 10.7 4.8 36.3 -4.1 -6.5 -1.3
United Kingdom 6.5 3.3 -4.8 1.2 -5.5 -1.9
Cyprus 8.3 -5.8
Czech Republic 8.0 -1.3
Estonia 3.3 -1.6
Hungary 8.3 -0.5
Latvia 5.5 -7.8
Lithuania 4.5 -11.3
Malta 10.0 -6.4
Poland 15.8 -0.6
Slovak Republic 2.6 -2.9
Slovenia 4.6 0.8
Bulgaria 4.9 -0.7
Romania 4.0 -2.2
Source: Eurostat (FSS).
The period 1985-1995 saw a marked rejuvenation of the milk producer population as a result of the
imposition of quotas in 1984 and the quota buy-out programmes (largely EU-funded) that were
subsequently operated in many Member States. For example, in France the share of the age group ‘less
than 45 years of age’ increased from 28.9% to 45.1% (an increase of 16.2 percentage points), due
largely to the high rate of exit of older farmers but also to the French policy of favouring new entrants in
the re-allocation of abandoned quota. Between 1995 and 2000, the share of holders under 45 years of
age increased its share at the level of all EU-15 holdings (+0.9 percentage points), but to a greater
extent on specialist dairy holdings (+1.7 percentage points). Between 2000 and 2005, the share of this
age group fell in EU-15 agriculture as a whole, but somewhat less in specialist milk production than the

285
sector average. Between 2005 and 2007, however, the reduction in the share of this age group was
much stronger for dairy producers than for agriculture as a whole. It lost ground in all countries except
Greece, and in seven Member States of EU-15 the loss (in percentage points) was over 3% over these
two years alone.
It should be recalled that, between 2000 and 2007, EU-15 lost 33% of its dairy herds. Table 13.10
therefore indicates that the age group under 45 years old has shrunk at an even faster rate. This is
mainly due to lower entry rates and higher exits from the sector of discouraged under-45 farmers who
felt young enough to embark on a different activity.
In summary, the cumulative effect of changes between 1995 and 2007 (compare the first two columns)
indicate a considerable ageing of the milk producer population, a large share of which has occurred since
2000, and especially between 2005 and 2007. The reader is warned that correlation should not be
confused with causality. However, the changes in trends that had persisted for a number of years prior to
the reform period, together with the absence of any other shock of comparable importance that would
constitute a competing explanation, provide grounds for concluding that recent changes in the age
distribution are almost certainly due to the policy reforms that brought a new outlook for dairying,
characterised by greater market uncertainty and the perception of higher risk in the sector.
This aspect of restructuring needs greater attention. High quit rates and lower recruitment to the sector
permit farm growth and the herd expansion of established, ongoing dairy enterprises, which enable
economies of scale to be realised. However, the age of those quitting, and the failure to recruit young
dairy farmers, can have negative consequences for the performance of the sector in the future. In a
more market-oriented environment, the qualities usually associated (perhaps without real justification)
with younger entrepreneurs will be needed more than in the past.
13.7 Simplification of policies and administrative procedures
The CAP legislation relating to the dairy sector was simplified in a number of respects during the period
under evaluation. Specifically, the target price for milk was abolished (Reg 1787/2003), the distinction
between milk deliveries and direct sales off milk and milk products off farms was simplified (Reg
1788/2003), various rules relating to Member States’ management of quotas were rationalised to bring
greater flexibility (Reg 1782/2003), the dairy premium was merged with the Single Farm Payment
(between 2005 and 2007), the intervention system was scaled down, and various existing regulations on
aid to special categories of butter, concentrated butter and cream consumption were repealed and
replaced with a new regulation (Reg 1898/2005) in the interests of harmonisation between products or
because they had not been used for some time. At the same time, on-farm inspection costs for cross
compliance have undoubtedly risen, but the costs of monitoring dairy farmers’ compliance will not be
registered under the heading ‘dairy’, but rather under general CAP administration costs.
The expected impacts of these changes (apart from their direct policy impacts) are lower budget costs
and/or policy transaction costs, better understanding of the policy package by stakeholders and greater
flexibility at Member State level. Therefore, it should be examined whether these objectives were
achieved, in particular whether the costs of administering the CAP were reduced, and whether
stakeholders were aware of a simplification in their policy environment. It is also relevant to evaluate the
choice and the timing of the changes undertaken with this objective. In some cases, it may be asked
whether changes made in the name of ‘simplification’ resulted in budget or administrative savings being
outweighed by extra costs borne by producers or consumers.
In general, it was impossible to obtain information from public administrations (DG AGRI or Member
State ministries) on the administrative cost of EU dairy policies, or their perception of trends in this cost.
Similarly, the perception of public administrators on the degree to which administration may have been
simplified was not obtainable. Information has been received regarding administration costs from two
Member States: the Netherlands and Germany. The following paragraphs summarise the findings.
Expenditure estimates obtained from several sources by the Dutch Landbouw Economisch Institut (LEI)
fill a small part of this information gap. The evolution of expenditure on operating EU dairy policy in the
Netherlands is shown in Figure 13.15. The costs of operating import controls and of administering the
SFP, are not included in these figures. Total expenditure varied between €6 million and €8 million during

286
the period 1996 to 2011, with the highest costs arising in the period 2004-2006. The largest share of the
expenditure goes on the administration of the quota scheme, including quota trade, and coupled
payments. The sharp fall in 2008 is in fact largely due to the decoupling of the dairy premium after which
the administrative costs of delivering direct payments to Dutch dairy farmers no longer show up in the
administrative budget for dairy. The suspension of export refunds during 2007-2008 also played a role in
this fall. The share of this large item in total expenditure fell from around 93% to 83% over the period.
The other items of expenditure and their shares of the total in 2010 were the cost of managing the
intervention system (13%), administration of quality regulations (12%) and management overheads
(6%). These other items were growing at a rate of about 5% per year over the period.
Figure 13.15 Expenditure on operation of EU dairy policy in the Netherlands, 1996-2011
6
6.5
7
7.5
8
8.5
9
9.5
10
1996 1997 1998 1999 2000 2001 2002 2003 2004 2005 2006 2007 2008 2009 2010 2011
mill
ion
eu
ros
78
80
82
84
86
88
90
92
94
pe
r ce
nt o
f to
tal
total operating cost of EU dairy policy, million euros
management of quota and coupled payments, % of total (right-hand axis)
Source: data compiled by LEI.
The estimated administrative cost per tonne of milk supplied to the market was about 0.61 cents/t at the
start of the decade, rose to well over 0.70 cents/t in the middle part of the decade and finished in 2010
at about 0.55 cents/t. This is the experience of one Member State and should not be generalised to
others, or to the EU as a whole. However, it is indicative of what could be expected.
Administration of dairy policy in Germany is shared among three national public entities: the Federal
Ministry for Food, Agriculture and Consumer Protection (BMELV), the Federal Agency for Agriculture and
Food (BLE))) and the Federal Ministry of Finance (BMF), and various state-level administrations and
agencies. The first of these bodies is responsible for legislation, assistance in legal disputes and
reporting, the second takes care of public and private storage, statistical collection and reporting, and
trade licences, and the third is responsible for regulations pertaining to trade and milk quotas. Various
bodies at the level of the Länder (federal states) are responsible for the implementation of the milk quota
regulations and the school milk programme.96
In 2009, the total number of person-days required for dairy policy administration in Germany was 172,
at a cost of €625,280, of which 3% was incurred by BMELV, 26% by BLE, 21% by BMF and 51% by
96 Agricultural agencies, the chambers of agriculture, state administrations and other state-level bodies. The figures quoted in the text for the costs at provincial level are based on estimates for the state of Nordrhein-Westfalen.
287
state-level entities. This amounts to about 2.2 cents per tonne of milk supplied.97 In 2010, there were
considerable savings relative to 2009 because no storage subsidies or export refunds were paid so the
time spent on administration fell to 141 person-days (-18%) and the total cost was €522,693 (-16.4%).
The administrative savings under these two headings were €72,707 and €39,990, respectively. All the
savings from the non-use of these measures accrued to BE and BMF, so that the shares of the smaller
total expenditure borne by the different organisations were then 4% (BMELV), 16% (BLE), 18% (BMF)
and 62% (state bodies). The time-cost of the on-going administrative tasks remained constant in person-
days, but the financial costs increased slightly due to inflation. This evidence provides some orders of
magnitude concerning the administrative cost of different types of dairy measure. The abolition of most
private storage implies that the corresponding administrative cost savings will be permanent, whereas
the use of public intervention and export refunds can be resumed and costs can be expected to rise again
as a result. The evidence supports the more general conclusion that the abolition or suspension of a
specific type of policy measure can result in administrative savings. It is inconclusive on whether
simplifications in on-going measures (with the aim, for example, of making them more easily understood
by farmers) result in any appreciable saving in the cost of administering them.
It is also relevant to consider whether the 2003 policy reform brought savings in the administrative
burden borne by other stakeholders. The milk producer questionnaire asked respondents how many
hours they spent on administrative tasks in 2010 due to EU policy requirements, and whether there had
been an increase in this time commitment since 2003. The average time spent per farm was 185 hours
per year, but the range was very wide. An increase in time for administration was reported by 65% of
respondents, no change by 29% and a decrease by 6%.
Most farmer respondents whose policy-related administrative workload increased gave a least one reason
for it. Non-specific causes (like “more bureaucracy”, “it is more complicated”) were cited by 38% of
respondents. Environmental regulations (especially arising from cross compliance, keeping fertiliser
records and so on) were given in 22% of cases, a larger total number of regulations in 15% of cases,
paperwork arising from cattle movements, cattle registration, veterinary and other hygiene regulations in
14% of cases, and ‘other reasons’ (as diverse as more on-farm certification processes and investment in
renewable energy production) in 6% of cases. The switch to the SFP and expansion or restructuring of
the farm accounted for 3% each. A recurrent comment was that the increased time spent on
administration was partly because greater care was needed in order to maximise payments or to avoid
inaccuracies that could lead to a farm inspection. The much smaller number of farmers reporting a
decrease in time spent on policy-related administration often gave computerisation of their record-
keeping as the reason, along with the use of dedicated software or special databases. Another factor
occasionally mentioned was their growing familiarity with the tasks and, in a few cases, the outsourcing
of part of the administrative burden to experts.
A similar question was also asked in the processors’ survey. Here, the reported time commitments varied
enormously with the size and specific activities of the company and, one assumes, also with the
respondents’ interpretation of the question. Answers were given in terms of hours per year or per month,
or the number of full-time employees assigned to the task. Given this diversity, and also because of the
non-randomness and small size of the sample selected, we make no attempt to find an average or
central value for this variable. What is more interesting for the purposes of this evaluation is whether
respondents thought there had been a change in the time taken by policy-related administrative
requirements. The proportions of processor respondents falling into the three categories (increase, no
change and decrease) are very different from those of the farmer respondents when asked the same
question. Half the processors’ representatives considered there had been no change, whilst the others
were divided equally between those who thought it had increased and those who perceived it as being
lower. Among those reporting an increase in administrative time due to EU policies, non-specific reasons
(more burdensome in general) were most often given, just as among the farmers. Other more specific
reasons were (local) increases in quota mobility, traceability requirements and other quality issues.
Those who thought the administrative burden had become lower attributed it to there being fewer
instruments, less bureaucracy in general and to the suspension of export refunds (implying that this
policy measure does impose an administrative burden when in normal operation).
97 Comparison with the figure per tonne calculated for the Netherlands should be avoided, as the items included under administration costs are not standardised and the methodologies for estimating the costs differ.

288
The survey among administrators and experts shed very little light on this question. One respondent
characterised the administrative burden imposed by EU policy on food producers and processors as the
price to be paid for the competitive advantage of the EU “brand” in terms of quality and food safety.
In conclusion, it is true that some policy measures and procedures have been simplified or discontinued.
The evidence obtained from two member States on the costs to public administrations due to dairy policy
suggests that the total cost of administering dairy policies has been stabilised in those two Member
States, and has been responsive to the abolition/suspension or scaling down of specific policy measures.
At the same time, the general trend towards more complex and more targeted policies continues. The
introduction in the 2003 reform of cross compliance for farmers as a condition for receiving direct income
payments coincided with the more market-level policy simplifications described above. It is not surprising
that milk producers have a different perspective on the issue of policy simplification than either
administrators or processors. Policies are evolving and becoming more targeted. Therefore, simplification
and rationalisation of existing policies should be a permanent aim accompanying this trend, so that the
total policy burden on any group of stakeholders should not increase or, more optimistically, should be
reduced.
13.8 Conclusions
The overall conclusion is that the efficiency of CAP dairy policy has improved since the 2003 reform. This
conclusion is stronger if the fall in ‘consumer transfers’ to producers is taken into account along with the
direct budget costs of the policies.
Where efficiency gains in budget expenditure are concerned, the beneficiaries are taxpayers, or those
citizens who benefit from programmes that these budget saving are used to fund. Regarding savings in
consumer transfers, however, the beneficiaries are not so easily identified. The question is whether final
consumers actually benefit in full from the fall in milk prices and wholesale prices of dairy products (i.e.
the smaller ‘consumer transfer’), or whether some of these efficiency gains are absorbed somewhere else
in the chain. This question lies outside the remit of the present evaluation. It is, however, extremely
pertinent to an overall cost-benefit assessment of these policy changes.
Table 13.11 summarises the findings of this evaluation question. The major policy changes can be
classified above the rising diagonal, which indicates efficiency improvement. The last cell in the first
column indicates improved attainment of an objective but at higher cost. These costs, however, fall
outside the budget for dairy policy per se since they relate to the SFP generally.
Table 13.11 Classification of the range of judgements
Level of attainment of objective
Cost Improvement No change Deterioration
Decreasing Market balance (disposal aids, export refunds)
Policy simplification (administration costs) – verified in two Member States only
Producer income level (budget costs of dairy policy much lower, but the saving is much smaller if the cost of the ex-dairy premium is also considered)
Price stability (intervention costs lower)
No change Market orientation
Structural change
(These items have no direct costs, but benefit from changes shown elsewhere in the table)
Competitiveness
(no conclusive evidence found that milk or dairy products had become more competitive)
Increasing Environmental standards (farmer administration costs, monitoring costs for cross compliance)

289
14 EQ10: Coherence
14.1 Interpretation and comprehension of the key terms of EQ10
Coherence is defined as “The extent to which complementarity or synergy can be found within a
programme and in relation to other programmes. The internal coherence refers to the correspondence
between the resources allocated to a programme and its objectives. The external coherence refers to the
adequacy between the evaluated programme and other related programmes”.98 The way the questions
are posed, and the explicit references to rural development (RD) measures, state aid (aid provided at
Member-State level) and the overall principles of the 2003 reform, leads us to interpret ‘coherence’ as
external coherence, i.e. the compatibility of EU dairy measures with these other separately formulated
although related policy frameworks.
14.2 EQ10.1: Coherence with rural development measures
This question analyses the extent to which the CAP measures applicable to the dairy sector have been
consistent with the RD measures and the state aids granted in accordance with relevant EU rules. It
focuses on whether and if so how, dairy policy interventions work in the same direction as, or at least do
not contradict, rural development policy interventions that may also impinge on dairy farmers, on
regions where dairying is undertaken or on structural change in the dairy sector, including the rate of
exits. It must be stressed that rural development policies are very largely horizontal policies that do not
target any specific commodity sector, whereas dairy policy by definition aims to affect decisions and
outcomes for those producing, processing or trading milk and dairy products. Therefore, there is no
direct match between measures within the two sets of policies. However, it is possible to identify the
incidence of RD payments by type of farm, and evidence on this is provided.
As a generalisation, dairy policy within the CAP focuses on market management and impacts on dairy
farmers in their role as producers and suppliers of milk to the market, whereas the first two axes of rural
development policy take a more farm-level approach, viewing farmers as managers of fixed natural
resources and farm capital. However, at a higher, more general level of impacts, there is overlap
between certain objectives, especially economic viability (of the dairy sector, in one case, of the rural
economy including farming, on the other) and sustainability. It may also be asked whether certain global
impacts might be achieved better by sectoral (i.e. commodity-specific) policies or horizontal policies.
14.2.1 Methodology used for answering EQ10.1: coherence with RD measures
In a first stage to evaluating this question, the types of measures listed in the Rural Development
Regulation (RDR) are examined at a conceptual level for potential conflicts and synergies with the
objectives or instruments of CAP dairy policy, and likewise the objectives and instruments of dairy policy
are examined to identify potential synergies and conflicts with those of RD policy. State aid schemes are
identified according to objective, and a conceptual analysis is made of their coherence with the objectives
of CAP dairy policy.
98 “Handbook on Common Monitoring and Evaluation Framework Guidance Document” (DG AGRI, 2006) Glossary (p.2).
EQ 10.1: To what extent have the CAP measures applicable to the dairy sector been coherent with the rural development measures and the national aid granted in accordance with the relevant EU rules on state aid?
EQ 10.2: To what extent have the CAP measures applicable to the dairy sector after the 2003 CAP reform been coherent with the overall concept and principles of the 2003 reform of the CAP?

290
At the ex post stage of the analysis, problems of heterogeneity and complexity arise. The RDR (EC
1698/2005) defines the headings under which Member States may opt to design and implement policies.
However, not all Member States opt for all types of measure, and the specific measures adopted are
(intentionally) quite region-specific. This is fully in line with the principle of subsidiarity that motivates
Pillar 2, and is intended to improve the efficiency of Pillar 2 measures. However, it means that precise
empirical analysis of the interactions between specific RD measures and CAP dairy policy would have to
be conducted at a detailed level. Therefore, no attempt will be made to investigate interactions between
specific RD measures and dairy policy. Instead, the approach taken to this question is to examine to
what extent dairy policies under Pillar 1 of the CAP have contributed to the main aims of the Rural
Development Programme.
This approach gives rise to the ex post indicators set out in Table 14.1. In most cases (except those
relying on the own survey, where a single ‘snapshot’ will be presented), trends in these indicators over
the evaluation period will be shown, or (where data do not permit this), a comparison between a period
closely before the 2003 CAP reform and the later part of the evaluation period.
14.2.2 Judgement criteria, indicators and information sources used for each indicator
Table 14.1 Judgement criteria and indicators for EQ10.1
Indicator Data requirement Information sources
Economic viability
� Economic viability of dairying
Evolution of farm profitability over time
Farm income data (at MS and case study level)
EU-FADN
Changes in gross margins Data on farm revenues and (variable) costs (at MS and case study level)
EU-FADN
Share of specialist dairy farms having a non-negative income
To be calculated from EU-FADN data EU-FADN
� Contribution of dairy farming to the rural economy
Integration of dairy farms in the local economy
Other economic activities by dairy farmers and spouses
Producer survey
Rural employment
Number of dairy farms Data on dairy farm holdings EU-FADN and Eurostat (FSS)
Number of AWE related to dairy Data on own and external labour input in dairying
EU-FADN
Impact of dairy policy on continuation of dairying
Importance of various policy instruments for producer’s decision to stay in dairy farming
Producer Survey
Support for modernisation and investment
Use of higher milk revenues for farm investment
Frequency of positive responses to this question
Producer Survey
State aid provided to dairy farmers
Quantitative and qualitative data about state aid given to or received by farmers
Producer Survey
State aid provided to dairy processors
Quantitative and qualitative data about state aid given to or received by dairy processors
Processor Survey
Contribution to/constraints from sustainability
Receipt of Pillar 2 agri-environmental payments
Frequency of positive response to this question
Producer Survey
Compatibility between production plans and environmental restrictions
Frequency of producers who have not expanded their herd more since 2003 due to environmental restrictions
Producer Survey
Organic milk production Trend in production of organic milk Eurostat

291
14.3 Ex ante analysis of EQ10.1
The period for this evaluation spans two Rural Development Programmes: the 2000-2006 Programme,
laid down in Council Regulation (EC) No 1257/1999 and the 2007-2013 Programme is set out in Council
Regulation (EC) No 1698/2005. The state aids to be considered are the 22 aid schemes relating to the
dairy sector that are registered with the Commission by 11 Member States for some part of the
evaluation period. They are listed in Table 2.44. These three sets of legislation will be compared, first in
terms of their aims and areas of focus, and second (more selectively) in terms of specific measures.
The main objectives of the CAP policies for dairy are market balance, market and price stability, the
income of milk producers, the competitiveness and market orientation of the dairy sector, and production
structures and structural change. The objectives of rural development policy are more heterogeneous
and more diffuse, but can nevertheless be summarised under several main themes. In Regulation
1257/1999, these objectives are articulated as follows:
• the improvement of structures in agricultural holdings and structures for the processing and
marketing of agricultural products,
• the conversion and reorientation of agricultural production potential, the introduction of new
technologies and the improvement of product quality,
• the encouragement of non-food production,
• sustainable forest development,
• the diversification of activities with the aim of complementary or alternative activities,
• the maintenance and reinforcement of viable social fabric in rural areas,
• the development of economic activities and the maintenance and creation of employment with the
aim of ensuring a better exploitation of existing inherent potential,
• the improvement of working and living conditions,
• the maintenance and promotion of low-input farming systems,
• the preservation and promotion of a high nature value and a sustainable agriculture respecting
environmental requirements,
• the removal of inequalities and the promotion of equal opportunities for men and women.
In Regulation 1698/2005, most of these aims reappear, together with some new ones, as do most of the
more specific objectives and descriptions of measures. They are, however, now grouped under four
‘axes’: Axis 1 has as its aim to improve the competitiveness of the agricultural and forestry sector, Axis 2
to improve the environment and the countryside, Axis 3 looks beyond the farm to target the quality of
life in rural areas and the diversification of the rural economy, while Axis 4 aims to promote local or
grass roots initiatives and associations proposing an integrated rural development strategy (Leader
initiatives). The first two axes are more relevant to the following discussion.
The state aid schemes under consideration include 12 schemes relating to serious cattle diseases
(eradication, monitoring and/or compensation), 5 schemes supporting organisations concerned with
breeding and improving the genetics of the national herd, 2 schemes relating to the marketing of
agricultural products99, one to improve on-farm storage of milk100, one supporting cessation of livestock
production, and one supporting production and pro mille (land-tax) funds. These are nearly all areas
where EU legislation and programmes exist. Indeed, the two schemes described in the footnotes, in
objective although perhaps not in the specific of their operation, fit well with Axis 1of the RDP. However,
it can be inferred from their description that these aid schemes have been set up in response to
nationally or locally specific needs, and are more logically pursued at that level. Seven of the 11 Member
States, and 15 of the 22 schemes, involve New Member States.
There is one common theme across the three sets of legislation, and that is the aim of improving
competitiveness. However, whereas the CAP dairy measures focus largely on the competitiveness of
markets and market functioning, the RD emphasis is on the competitiveness of individual holdings and
farming operations through modernisation and improving structure and resource use at farm level, and
the state aid schemes aim to increase competitiveness by supporting the catching up of national
99 N108/2010 (Bulgaria): State aid under the Temporary Framework to agricultural holdings active in primary production, processing and marketing of agricultural products. 100 N90/210 (Bulgaria): Investment aid to agricultural holdings to meet the quality requirements on the production and storage of raw milk laid down in Regulation (EC) 853/2004.

292
standards with wider EU standards (particularly as regards animal health and genetics). Thus, regarding
the aim of competitiveness, the three approaches are fully compatible and potentially synergistic. The
state aid schemes appear to fill gaps where specific local needs are not met by either of the CAP pillars.
Until the 2003 CAP reform, EU dairy policy focused very largely on market management measures
(border measures, intervention, disposal aids and so on). The only major dairy measure to impinge
directly on farms was the milk quota regime, which – although in design a market management tool –
could only function rationally if it distributed the responsibility for market supply control over individual
producers. Clearly, there is little in the way of synergy between this measure and the farm-focused
measures eligible for the RDP. However, neither is there lack of coherence, since the aims and specific
measures targeting farms under Axes 1 and 2 are just as relevant in a context of supply control, and
perhaps more so.
The 2003 legislation, by creating the dairy premium and attaching to it the same environmental cross
compliance requirements for individual producers as in the other agricultural commodity sectors, brought
part of the focus of dairy policy under Pillar 1 closer to that of Pillar 2. It is in the areas of environmental
protection and sustainability that one must examine the question of coherence most closely, and where
there is a greater likelihood of finding potential conflicts. Indeed, one might ask whether the potential
conflicts might be more properly described as internal to Pillar 1 rather than as between CAP dairy policy
and RD.
A potential dilemma is that, in promoting greater economic efficiency and market orientation, dairy policy
measures may create incentives that do not give much weight to “non-market” costs and benefits, which
are at the heart of “environmental accounting”. It is precisely to balance this tendency that the cross
compliance requirements within Pillar 1 are needed, as is the strong environmental axis within Pillar 2. If
this construction works well, the two pillars will be self-balancing so that market orientation and greater
efficiency can be pursued in an environmentally sustainable way.
However, the cross compliance requirements apply to individual farm practices and leave out a number
of factors that are targeted in the RD legislation. One example concerns the geographical location of milk
production. The support of sustainable farming in less favoured areas (which helps to maintain the
environmental benefits due to low-intensity livestock production) is an objective of rural development
policy in both the previous and the current programme, yet evidence reviewed in EQ1 of this report
suggests that market orientation incentives are putting pressure on dairy production to leave some LFA
locations despite this support. Another example concerns the quality and continuity of the dairy
workforce and the renewal of human capital, whose benefits are recognised in the RD Programmes. Both
Programmes contain measures for supporting the setting up of new entrants, and for the early
retirement of farmers who are 55 year of age or older. These are not social programmes – they come
under the heading “Investment in Agricultural Holdings” in the 2000-2006 Programme, and within Axis 1
(Competitiveness) in the 2007-2013 Programme, and thus acknowledge the importance of young
farmers as a productive resource. However, EQ9 shows that the exposure of the dairy sector to stronger
market forces in recent years may have −at least temporarily− dissuaded young farmers from taking up
dairying at rates similar to the past, and that the age structure is shifting towards older age groups.
These two examples illustrate areas where potentially self-balancing measures are not in place.
Cross compliance requirements that aim to promote environmentally respectful farm practices, for which
individual farmers can be held to account, are obviously not able to keep in check either of tendencies
just described or to ensure that the two RD objectives concerned are not dominated by market-
orientated incentives. At the worst, the two sets of incentives will come into conflict, and RD funds will be
spent to counteract the fall-out, or even some of the desired impacts, of dairy policy measures. More
optimistically the two pillars will keep each other in check. The regionally-specific nature of RD policies is
an advantage here: implicit “zoning” may enable highly market-oriented farms to develop with relatively
few constraints in areas where the opportunity cost in terms of rural development values is low, whilst
these values are preserved in areas where they can be achieved at lower cost in terms of production and
economic competitiveness. How much public support there would be for this kind of solution is not
known.
It is worth noting two specific RDP initiatives that could be potentially beneficial to the dairy sector by
filling gaps left by EU dairy policy. They are, first, the measure ‘Producer groups’ with its objective “to
facilitate the setting up and administrative operation of producer groups for the purposes of (a) adapting

293
the production and output of … members of such groups to market requirements; (b) jointly placing
goods on the market, including preparation for sale, centralisation of sales and supply to bulk buyers; (c)
establishing common rules on production information, with particular regard to harvesting and
availability” (Regulation 1698/2005, Article 35)101, and the measure ’Cooperation for development of new
products, processes and technologies in the agricultural and food sector‘, which aims “to promote the
cooperation between primary producers in agriculture and forestry, the processing industry and/or third
parties” with a view to developing new products, processes and technologies (Regulation 1698/2005,
Article 29). These two initiatives – to promote cooperation between producers and other segments in the
chain to facilitate the organisation of producer market power – are very pertinent to the dairy sector.
Recent public discussion has emphasised the need to improve the functioning of the dairy supply chain as
a whole, and to move away from its characterisation as a set of mutually antagonistic segments who
tolerate each other while aiming to maximise their own self-interest. Although the RD measures will be
“small” and may only be taken up by Member States where the climate is already conducive to success,
it will be interesting to see whether initiatives emerge within the RDP that could lead the way towards
more generalised institutional structures and solutions to what is currently an unsolved problem.
In conclusion, the state aids examined are small in scope and seem highly complementary to both the
CAP measures for dairy and rural development measures. The coherence between CAP dairy measures
and RD measures is potentially high, with room for complementarity and some scope for synergies.
Nevertheless, there are areas where the two pillars could find themselves at cross purposes.
14.4 Ex post analysis of EQ10.1
This section assembles some empirical evidence on how CAP dairy measures have contributed to rural
development goals and vice versa.
14.4.1 Economic viability
Tables 7.3 and 7.4 show that, after a few years without growth at the start of the decade, Farm Net
Value-added per Annual Work Unit (FNVA/AWU) (both for specialist dairy farms and for non-specialist
dairy farms with a dairy herd) has maintained a strong positive trend from 2004 onwards. This picture is
confirmed by the figures for Family Farm Income per Family Work Unit in Table 7.5 (perhaps a better
indicator of what can be spent by farming families while keeping the productive capacity of the farm
constant), and this trend is particularly strong for the Member States of EU-10, although not for all new
entrant Member States. Thus, the contribution of the milk-producing sector to rural income generation
has become healthier, and as already concluded, this can be attributed to CAP dairy policies.
The data in Table 7.9 on gross margins for specialist dairy farms shows that, for EU-15, this indicator has
regained its 2000 level, after being somewhat lower for some of the intervening years, and has increased
considerably at EU-10 level. This indicator is useful because it shows family farm income before the
deduction of depreciation (the imputed cost of maintaining the same of level of farm investments over
the longer-term). Given the flexible nature of investment decisions, which can be postponed in difficult
times, it is a useful indicator of resilience in the short-term, and the ability of farms to withstand the
impact of a few bad years.
A comparison of Tables 7.3 and 7.4 indicates that average FNV/AWU is consistently higher on specialist
dairy farms than on farms with dairy herds that are not specialised in milk production. However, these
are Member State averages and do not indicate how much the income of individual specialist dairy farms
varies around the average.
Table 14.2 shows that the proportion of specialist dairy farms that earn a positive net economic profit
(that is, Farm Net Value Added minus the returns to all family-owned productive resource including
family labour) varies greatly between the Member States of EU-15, and to a lesser extent between EU-10
Member States. This income definition is very informative about the long-run survival potential of the
farm. In the shorter term, the farmer and his family may be willing to accept non-economic returns on
their family-owned assets (particularly if these assets are rather dairy-specific and not easily shifted to
101 A similar measure was already offered in the previous RDP, see Regulation 1257/1999, Title V.

294
another economic use), but in the long run a persistent negative net economic profit will drive operators
out of the sector. It is noticeable that this indicator is highest in Spain, Portugal and Greece (countries
with lower average income), and lowest in Finland and Sweden (high-income countries).
Table 14.2 Share of specialist dairy farms with positive net economic profit, 2000-2007
2000 2001 2002 2003 2004 2005 2006 2007
Belgium 0.54 0.60 0.49 0.55 0.54 0.65 0.69 0.77
Denmark 0.16 0.08 0.12 0.12 0.10 0.19 0.28 0.46
Germany 0.22 0.22 0.18 0.17 0.33 0.43 0.44 0.65
Greece 0.45 0.46 0.54 0.57 0.73 0.85 0.83 0.92
Spain 0.53 0.67 0.65 0.65 0.55 0.61 0.61 0.59
France 0.33 0.34 0.46 0.40 0.43 0.48 0.45 0.54
Ireland 0.36 0.37 0.36 0.43 0.40 0.42 0.31 0.47
Italy 0.31 0.32 0.33 0.30 0.33 0.39 0.36 0.43
Luxembourg 0.49 0.55 0.42 0.54 0.57 0.67 0.57 0.71
Netherlands 0.32 0.37 0.33 0.29 0.30 0.43 0.40 0.57
Austria 0.26 0.34 0.30 0.20 0.26 0.34 0.34 0.41
Portugal 0.28 0.40 0.48 0.46 0.54 0.54 0.71 0.63
Finland 0.16 0.23 0.23 0.22 0.16 0.18 0.13 0.20
Sweden 0.05 0.05 0.08 0.08 0.07 0.08 0.18
United Kingdom 0.20 0.38 0.21 0.29 0.32 0.38 0.36 0.57
EU-15 0.30 0.34 0.34 0.32 0.37 0.44 0.43 0.53
Czech Republic 0.39 0.34 0.37 0.55
Estonia 0.48 0.40 0.33 0.43
Hungary 0.47 0.23 0.36 0.30
Lithuania 0.70 0.53 0.46 0.45
Latvia 0.44 0.52 0.43 0.45
Malta
Poland 0.26 0.26 0.29 0.33
Slovakia 0.52 0.37 0.18 0.39
Slovenia 0.27 0.14 0.14 0.22
EU-10 0.30 0.28 0.30 0.35
Bulgaria 0.67
Romania 0.20
EU-02 0.24
Source: EU-FADN.
Dairy farmers are also involved in other income-generating activities. Over 70% of the respondents to
the producer survey had household revenue from productive activities apart from the sale of milk. About
30% had revenues from crop production, 15% from beef or other livestock activities. Nearly 15% were
producing renewable energies, including biogas, whilst over 3% were involved in farm tourism, and
smaller proportions were involved in direct selling of milk and farmhouse cheese, vineyards and forestry.
The receipt of off-farm transfer payments (e.g. pensions) and spouse’s income were mentioned by under
10% of respondents. Despite the statistical non-representativeness of this survey, it gives a snapshot of
other kinds of economic activities undertaken by dairy households that contribute to rural development.
In so doing, it reinforces the conclusion that policies for maintaining a thriving and active dairy activity in
a region contribute to its economic development.
14.4.2 Rural employment
Rural employment is considered an aim of rural development in its own right, since by keeping rural
workers and their families in the countryside it helps to maintain viable population centres and networks
of sufficient population density to sustain basic services (schools, health and transport services, and so
on). Here we explicitly address the issue of the number of workers involved in dairying in Europe.
Figure 14.1 shows the trends in annual work units on EU specialist dairy farms between 1990 and 2008.
Up to and including 1994, the figures are for EU-12, and thereafter for EU-15. It is clear that the
majority of dairy labour is family labour, although the proportions of family and hired labour vary

295
considerably between Member States. In 2008, the average family labour per farm was 1.54 units in EU-
15 and 1.71 units in EU-10, whereas for hired labour the coefficients are 0.25 units per farm for EU-15
and 0.39 for EU-10. In EU-15, the highest rate of family labour per specialist dairy farm is in Finland
(1.83) and the lowest in Denmark (1.25), whilst the extremes for hired labour are found in Denmark
(1.04) and the UK (0.89) on the one hand, and in Belgium (0.02) and Spain (0.1) on the other hand. The
herd numbers in the figure relate to specialist dairy herds only, but non-specialist dairy herds are likely
to tell a similar story.
It is clear that dairy labour has been falling faster than the number of herds, due to economies of labour
use with herd size expansion. What cannot be ascertained from these figures is whether the number of
local jobs off farms related to or depending on dairying has been increasing, with more outsourcing of
tasks.
Figure 14.1 Labour on farms with dairy herds, EU-15, 1990-2008
0
100
200
300
400
500
600
700
800
19
90
19
91
19
92
19
93
19
94
19
95
19
96
19
97
19
98
19
99
20
00
20
01
20
02
20
03
20
04
20
05
20
06
20
07
20
08
thou
san
d la
bou
r u
nits
100
150
200
250
300
350
400
450
500
tho
usa
nd
farm
s
Hired labour on EU dairy farms
Family labour on EU dairy farms
Number of specialist dairy farms (right-hand side axis)
Source: EU-FADN.
The total contribution made by agriculture to the local economy is reduced if dairy farmers quit and are
replaced by other types of farm that generate less employment (for example, crop farms). In regions
where dairying is the only viable agricultural activity and is not replaced by other farming types,
cessation of dairy activity is even more serious for rural depopulation. As reported in Table 5.6, low milk
prices were the most important reason given by respondents to the producers’ survey as to why they
had considered giving up in recent years. That response was almost certainly coloured by the experience
of the low milk prices of 2009 and needs to be put in the perspective of upward-trending dairy farm
income statistics. The producer survey also asked producers whether the planned increases in quota
were a factor that encouraged them to remain in dairying, and if so how important it was. Nearly 22%
said it was a positive incentive to remain in dairying, and for 7% it was a very positive incentive. These
results show that the dairy policy changes under review are working to slow down the exodus from
dairying and thereby enhance the objectives of rural development.
14.4.3 Support for modernisation and investment
The timing of farm investment and how to finance it are important decisions for farmers. The two Rural
Development Programmes within the evaluation period both have provision for various investment aids
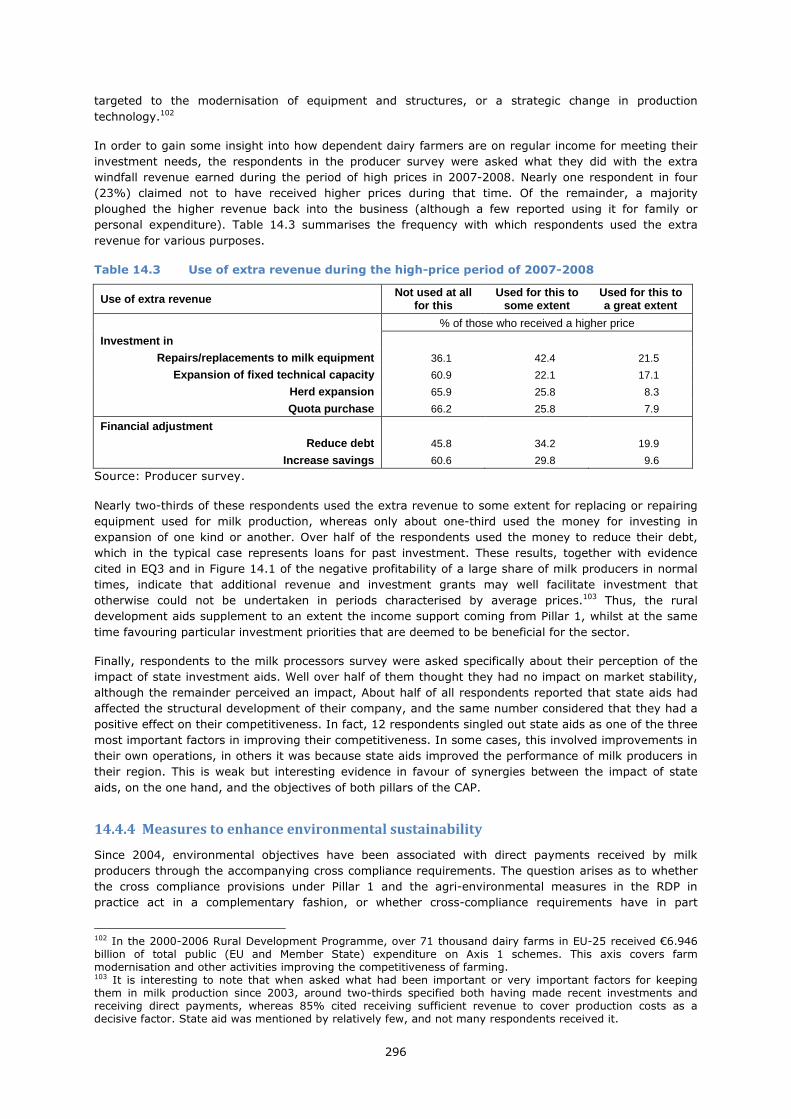
296
targeted to the modernisation of equipment and structures, or a strategic change in production
technology.102
In order to gain some insight into how dependent dairy farmers are on regular income for meeting their
investment needs, the respondents in the producer survey were asked what they did with the extra
windfall revenue earned during the period of high prices in 2007-2008. Nearly one respondent in four
(23%) claimed not to have received higher prices during that time. Of the remainder, a majority
ploughed the higher revenue back into the business (although a few reported using it for family or
personal expenditure). Table 14.3 summarises the frequency with which respondents used the extra
revenue for various purposes.
Table 14.3 Use of extra revenue during the high-price period of 2007-2008
Use of extra revenue Not used at all for this
Used for this to some extent
Used for this to a great extent
% of those who received a higher price
Investment in
Repairs/replacements to milk equipment 36.1 42.4 21.5
Expansion of fixed technical capacity 60.9 22.1 17.1
Herd expansion 65.9 25.8 8.3
Quota purchase 66.2 25.8 7.9
Financial adjustment
Reduce debt 45.8 34.2 19.9
Increase savings 60.6 29.8 9.6
Source: Producer survey.
Nearly two-thirds of these respondents used the extra revenue to some extent for replacing or repairing
equipment used for milk production, whereas only about one-third used the money for investing in
expansion of one kind or another. Over half of the respondents used the money to reduce their debt,
which in the typical case represents loans for past investment. These results, together with evidence
cited in EQ3 and in Figure 14.1 of the negative profitability of a large share of milk producers in normal
times, indicate that additional revenue and investment grants may well facilitate investment that
otherwise could not be undertaken in periods characterised by average prices.103 Thus, the rural
development aids supplement to an extent the income support coming from Pillar 1, whilst at the same
time favouring particular investment priorities that are deemed to be beneficial for the sector.
Finally, respondents to the milk processors survey were asked specifically about their perception of the
impact of state investment aids. Well over half of them thought they had no impact on market stability,
although the remainder perceived an impact, About half of all respondents reported that state aids had
affected the structural development of their company, and the same number considered that they had a
positive effect on their competitiveness. In fact, 12 respondents singled out state aids as one of the three
most important factors in improving their competitiveness. In some cases, this involved improvements in
their own operations, in others it was because state aids improved the performance of milk producers in
their region. This is weak but interesting evidence in favour of synergies between the impact of state
aids, on the one hand, and the objectives of both pillars of the CAP.
14.4.4 Measures to enhance environmental sustainability
Since 2004, environmental objectives have been associated with direct payments received by milk
producers through the accompanying cross compliance requirements. The question arises as to whether
the cross compliance provisions under Pillar 1 and the agri-environmental measures in the RDP in
practice act in a complementary fashion, or whether cross-compliance requirements have in part
102 In the 2000-2006 Rural Development Programme, over 71 thousand dairy farms in EU-25 received €6.946 billion of total public (EU and Member State) expenditure on Axis 1 schemes. This axis covers farm modernisation and other activities improving the competitiveness of farming. 103 It is interesting to note that when asked what had been important or very important factors for keeping them in milk production since 2003, around two-thirds specified both having made recent investments and receiving direct payments, whereas 85% cited receiving sufficient revenue to cover production costs as a decisive factor. State aid was mentioned by relatively few, and not many respondents received it.
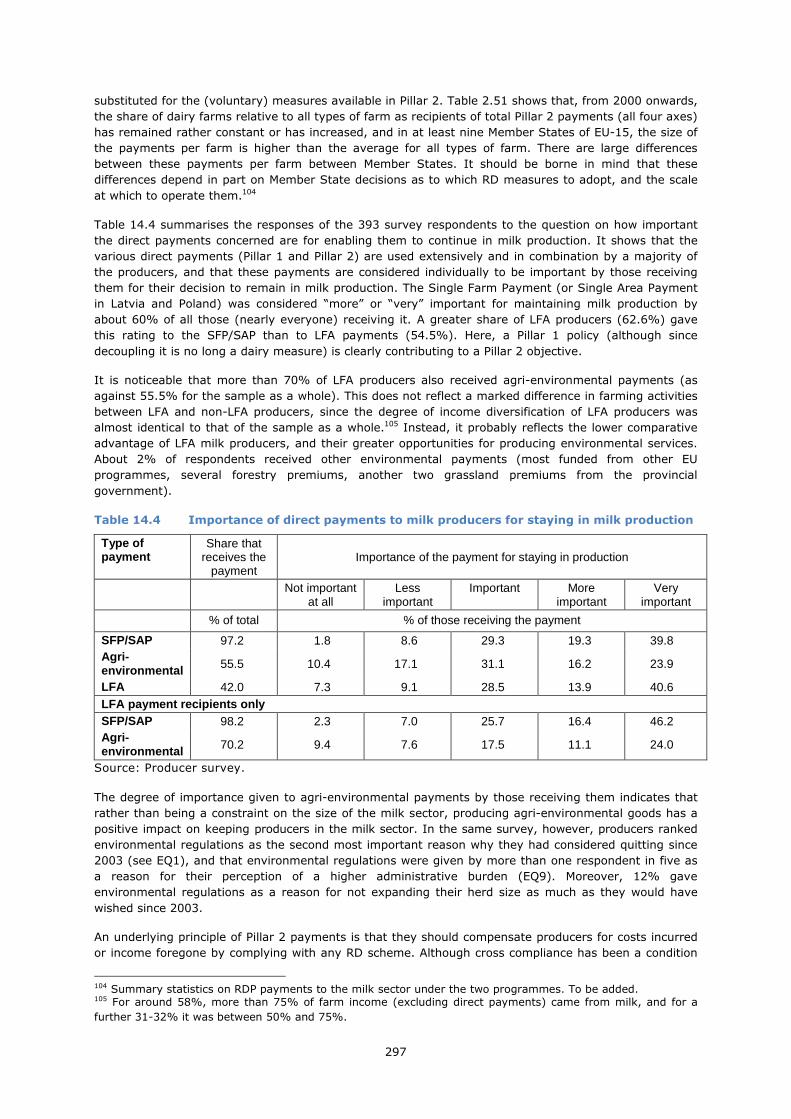
297
substituted for the (voluntary) measures available in Pillar 2. Table 2.51 shows that, from 2000 onwards,
the share of dairy farms relative to all types of farm as recipients of total Pillar 2 payments (all four axes)
has remained rather constant or has increased, and in at least nine Member States of EU-15, the size of
the payments per farm is higher than the average for all types of farm. There are large differences
between these payments per farm between Member States. It should be borne in mind that these
differences depend in part on Member State decisions as to which RD measures to adopt, and the scale
at which to operate them.104
Table 14.4 summarises the responses of the 393 survey respondents to the question on how important
the direct payments concerned are for enabling them to continue in milk production. It shows that the
various direct payments (Pillar 1 and Pillar 2) are used extensively and in combination by a majority of
the producers, and that these payments are considered individually to be important by those receiving
them for their decision to remain in milk production. The Single Farm Payment (or Single Area Payment
in Latvia and Poland) was considered “more” or “very” important for maintaining milk production by
about 60% of all those (nearly everyone) receiving it. A greater share of LFA producers (62.6%) gave
this rating to the SFP/SAP than to LFA payments (54.5%). Here, a Pillar 1 policy (although since
decoupling it is no long a dairy measure) is clearly contributing to a Pillar 2 objective.
It is noticeable that more than 70% of LFA producers also received agri-environmental payments (as
against 55.5% for the sample as a whole). This does not reflect a marked difference in farming activities
between LFA and non-LFA producers, since the degree of income diversification of LFA producers was
almost identical to that of the sample as a whole.105 Instead, it probably reflects the lower comparative
advantage of LFA milk producers, and their greater opportunities for producing environmental services.
About 2% of respondents received other environmental payments (most funded from other EU
programmes, several forestry premiums, another two grassland premiums from the provincial
government).
Table 14.4 Importance of direct payments to milk producers for staying in milk production
Type of payment
Share that receives the
payment Importance of the payment for staying in production
Not important at all
Less important
Important More important
Very important
% of total % of those receiving the payment
SFP/SAP 97.2 1.8 8.6 29.3 19.3 39.8 Agri-environmental 55.5 10.4 17.1 31.1 16.2 23.9
LFA 42.0 7.3 9.1 28.5 13.9 40.6 LFA payment recipients only SFP/SAP 98.2 2.3 7.0 25.7 16.4 46.2 Agri-environmental 70.2 9.4 7.6 17.5 11.1 24.0
Source: Producer survey.
The degree of importance given to agri-environmental payments by those receiving them indicates that
rather than being a constraint on the size of the milk sector, producing agri-environmental goods has a
positive impact on keeping producers in the milk sector. In the same survey, however, producers ranked
environmental regulations as the second most important reason why they had considered quitting since
2003 (see EQ1), and that environmental regulations were given by more than one respondent in five as
a reason for their perception of a higher administrative burden (EQ9). Moreover, 12% gave
environmental regulations as a reason for not expanding their herd size as much as they would have
wished since 2003.
An underlying principle of Pillar 2 payments is that they should compensate producers for costs incurred
or income foregone by complying with any RD scheme. Although cross compliance has been a condition
104 Summary statistics on RDP payments to the milk sector under the two programmes. To be added. 105 For around 58%, more than 75% of farm income (excluding direct payments) came from milk, and for a
further 31-32% it was between 50% and 75%.

298
for receiving direct income payments since 2003, these payments existed in other commodity sectors
before 2003 without any compliance conditions attached. Therefore, they tend not to be perceived as
payments for rendering environmental services, are not linked to compliance costs and can impact rather
differently on producers depending on their farm size and farm characteristics. It follows that the
associated costs and administration are less well accepted. One has to conclude that farmers are more
willing to adopt agri-environmental measures voluntarily when they see it as generating additional farm
income, and see these measures more positively than the compulsory cross compliance requirements.
Table 14.5 summarises evidence from the producer survey on the impact of cross compliance on their
costs. Producers were asked to name one or two of the cross compliance areas that had increased their
costs the most.106 The shares of respondents selecting different options are shown. It is not possible to
distinguish from the replies given between initial costs due to investment and adaptation, and on-going
costs.
Table 14.5 Impact of specific types of cross compliance on costs, % of respondents
Perception of increased costs due to cross compliance
Increased costs due to measures with respect to
Animal welfare
standards
Animal identification & registration
On-farm pesticide use and residues
Protecting groundwater
from pollution by dangerous substances
Protecting waters from
nitrates used in
agriculture
Protection of the
environment from animal
sewage sludge
Other
56 28 32 13 18 22 1 7
Source: Producer survey.
Two groups of survey participants (in Franche-Comté, France, and Galicia, Spain) also mentioned their
receipt of payments under Article 68 of Reg (EC) 73/2009. The French recipients (half of those sampled
in Franche-Comté) qualified for Article 68 payments as milk producers in mountain areas (receiving €20/t
of milk for the first 100 000 kg), whilst nearly all respondents in the Galician sample received an Article
68 payment targeted on milk producers in disadvantaged areas who belong to a PDO or PGI
organisation, or some other quality certification system, or who produce organically. These are the only
two Member States who currently apply the Article 68 provision to dairy farms. Spain was the only
Member State to provide coupled payments to dairy producers under Article 69 of Reg (EC) 1782/2003,
which preceded Article 68 of 2009. In that scheme, aid at €3.80/t of quota (up to a maximum of 500 t of
quota per farm) could be paid to all milk-producing farms engaged in a programme to improve milk
quality. Given the very wide parameters defining quality improvement in that scheme, nearly all milk
producers met the requirement. This motivated a tighter definition of eligibility for the Article 68
payment.107 It is outside the scope of this report to analyse the effectiveness or the efficiency of these
payments, which would require a dedicated study. However, as regards coherence, it is clear that their
objectives are highly compatible with those of the Rural Development Programme.
Another area where there is reciprocal synergy between the objectives and impacts of CAP dairy
measures and RD measures concerns organic milk production. Organic production has been defined in EU
legislation since 1991, and since then has attracted various conversion and production aids. Under both
the 2000-2006 and 2007-2013 Rural Development programmes, aid for the conversion of milk
production to organic principles has been available.
Table 14.6 illustrates the growth of organic milk capacity for some EU Member States (empty cells mean
that data were not available, or in a few cases, were rejected as unreliable). It is not known to what
extent the increases shown are due to conversions of existing conventional herds as opposed to growth
of established organic herds, or what role the conversion aid has played, although anecdotal evidence
suggests it has been significant. Organic production yields environmental benefits. In addition, organic
milk obtains a higher price (see information on the pricing system in EQ2), and hence it contributes to
milk revenue and to the income objective of CAP dairy policy.
106 For the specific legislation underlying the cross compliance requirements associated with Pilllar 1 payments, see Council Regulation (EC) No 73/2009, especially Annex II. 107 Article 69 payments to Spanish milk producers totalled €18.6 mill (2006), €18.1 mill (2007), €19.8 mill (2008) and €19.8 mill (claimed, 2009).

299
Table 14.6 Number of dairy cows on certified-organic farms, thousand, 1998-2009
1998 1999 2000 2001 2002 2003 2004 2005 2006 2007 2008 2009
Austria 86.90 81.05 81.38 81.56 85.11 91.04
Belgium 6.70 7.45 9.28 8.99 7.89 7.99 4.67 8.30 7.73 8.31 11.35
Denmark 36.87 51.10 66.01 64.36 61.54 56.43 53.12 52.03 53.13 56.56 62.12
Finland 3.65 3.56 4.54 4.99 5.05 4.60 4.62 4.76 5.04 4.89
France 46.56 55.20 58.94 62.49 66.12 59.73 59.18 61.39 62.58
Germany Greece 0.55 0.40 0.48 0.00 0.31 1.28 1.40
Ireland 0.75 0.85 1.00 1.10 1.40
Italy 30.97 40.75 38.28 57.09 58.44 59.40 47.52 44.31
Luxembourg 0.24 0.44
Netherlands 10.59 13.41 16.97 17.18 16.51 15.89 15.63 15.90 16.18 17.47 18.55 24.00 Portugal
Spain 2.28 2.53 2.79
Sweden 22.22 21.89 22.32 24.14 34.12
Un’d Kingdom 90.14 83.25 58.58 145.10
Cyprus Czech Republic
2.87 0.00 4.32 4.48 4.95 2.61
Estonia 2.58 3.23 2.68 2.72 3.05 Hungary 3.44
Latvia 3.45 7.59 3.14 3.79 4.46 5.47
Lithuania 3.05 1.79 6.27 7.96 9.40 8.31
Malta
Poland 12.78 19.41 Slovakia 1.27 1.55 3.08 5.00 5.00 4.42 4.41
Slovenia 1.00 0.97 0.92 1.23 1.09 1.17
Bulgaria 0.07 0.17 Romania 8.24 4.89 4.30 4.30
Source: Eurostat.
In summary, this review of the ex post evidence suggests that concrete synergies have been obtained
between CAP dairy measures and rural development measures.
14.5 Conclusions to EQ10.1
On the whole, there is a good degree of coherence between the CAP dairy measures on the one hand,
and rural development measures and state aids on the other hand. In terms of their objectives, they are
strongly compatible, although in the ex ante review in section 14.3 the possibility for conflict between
impacts of dairy policy measures and more specific targeted objectives of rural development measures
were noted.108
An important difference between the three sets of measures is the level at which they operate: uniformly
across the EU, EU-wide but on a regionally selective basis, and within individual Member States. Their
targets – markets (their functioning and balance), individual farms and rural economies, and specific
national problems or priorities – are also quite distinct (although the move of CAP dairy measures into
the domain of individual farm operations with the advent of cross compliance within Pillar 1 is noted).
This relative compartmentalisation has several consequences. First, these three sets of measures can
generally be seen as complementary rather than duplicating each other. Second, the effectiveness of the
RDP measures and the state aids is not so visible to sector participants if they are removed from the
immediate sphere of impact of these measures. This should not be taken as evidence of low
effectiveness. It is not within the scope of this evaluation to ascertain their effectiveness, which requires
separate study.
108 This possibility has been identified in a particular context, namely where the drive for greater market orientation could have collateral effects that run counter to current RD objectives.

300
Summary of findings for each indicator, EQ10.1
Indicator Expected result Evidence found
Economic viability
� Economic viability of dairying
Evolution of farm
profitability over time
It was expected that the fall in
dairy farm income, if any, once
the increase in SFP as a result of
decoupling the dairy premium is
taken into account, would be
much less than the fall in the
milk price. The actual fall in
income was to be verified from
the data.
The evidence indicates that dairy
farm incomes have not suffered. The
trend over time in various income
definitions has been more or less
maintained, as has the position of
dairy farms relative to other types of
farming.
Changes in gross margins
Share of specialist dairy
farms having a non-
negative income
� Contribution of dairy farming to the rural economy
Integration of dairy farms
in the local economy
No prior expectations. Evidence from the producer survey
shows the diversification of dairy
farms into other income-generating
activities in the local economy.
Rural employment
Number of dairy farms The number of farms with dairy
cows, and the number of
specialist dairy farms, were
expected to continue falling due
to structural change. A possible
increase in this trend following
2003 was expected.
Evidence was found to support the
expected result.
Number of AWU related to
dairy
Due to economies of scale, which
are labour-saving in dairying,
dairy labour was expected to fall
somewhat faster than the
number of dairy farms.
Evidence was found for specialist
dairy herds. This result is also likely
to hold for all dairy herds.
Impact of dairy policy on
continuation of dairying
It was expected that the reforms
could well encourage and
facilitate the departure of
marginal or less committed dairy
farms.
Evidence from the producer survey
does not support the expectation.
Evidence provided in Chapter 13
even shows a positive net increase
in herd numbers in a few Member
States in the last few years. It is
many years since this has been
observed. Producers considered
SFP/SAP, AE and LFA payments to
be important for helping them to
stay in production.
Table continues on the next page.

301
Support for modernisation and investment
Use of higher milk
revenues
The use of higher milk revenues
for farm investment was
expected.
Evidence was found. Producers took
the opportunity of windfall higher
prices in 2007-8 to engage in
investment activities. This implies an
‘investment constraint’ in normal
years, and hence that RD
investment grants do not produce
deadweight.
State aid provided to dairy
farmers
No firm expectation. No incidence was observed and no
judgement was provided by the
producer survey.
State aid provided to dairy
processors
No firm expectation. Some processors surveyed
considered state aid to be a useful,
supplementary contribution.
Contribution to/constraints from sustainability
Receipt of Pillar 2 agri-
environmental payments
Since these programmes are
voluntary, it was expected that
only producers who could
accommodate them into their
farm plans would subscribe.
A significant share of producers,
particularly in LFAs, opted for these
programmes and were generally
positive about them.
Compatibility between
production plans and
environmental restrictions
It was expected that frictions
with production decisions were
more likely regarding cross
compliance than Pillar 2
programmes.
Evidence was found to support the
expectation. Over half of
respondents considered that cross
compliance led to increased costs.
Organic milk production The stimulation of organic milk
production under Pillar 2 was
expected to be attractive to some
producers, but no expectations
were formed about whether the
trend would continue or be
affected by the policy reforms.
There has been a steady increase in
the share of organically produced
milk.
14.6 EQ10.2: Coherence with the principles of the 2003 reform
The 2003 reform was based on the following principles:109
• greater market orientation of EU agriculture and its increased competitiveness,
• maintenance of overall income support at the current level,
• fairness (a ‘fair’ standard of living for the agricultural community),
• more sustainable production,
• maintenance of rural areas,
• simplification of policies and their administration.
At this level of generality, these principles coincide with the global objectives already identified for CAP
dairy policy in Section 14.3. However, in examining whether the impacts of CAP dairy policy have been
coherent with the principles, some additional assumptions are needed.
109 Please see Table 3.1 for the relevant legislation, and specific recitals in this legislation, in which these principles are enunciated.
302
First, the principle of maintaining overall income support at the current level could be understood in two
ways, either “maintaining the support provided” or “maintaining the support received”. It turns out that
it makes a difference to the evaluation judgement which interpretations is used.
Second, the concept of a ‘fair’ standard of living or ‘fair’ producer incomes embodies a societal value
judgement, which makes it hard to evaluate in an objective ex post analysis. The criteria used in attempting
to make a value-free assessment of the impact of CAP dairy measures according to this objective need some
discussion. ‘Fairness’ of a policy outcome can be defined in terms of what stakeholders expect given what has
happened in the past, and in terms of the guarantees or promises received from policy makers. It is also
conditioned by how they view their situation in relation to other similar groups, and whether any acute
problems they have as a group that are not experienced by others are recognised sympathetically by the
policy process. This leads to the formulation of three criteria: continuity with the past, policy response to
emergent issues, and assessment of the position relative to other farming sectors. The first criterion –
continuity with the past – corresponds very closely to the second of the CAP reform principles listed
above. The fact that the legislation states ‘maintenance of overall income support at the current level’ as
a key principle of the reform has reinforced producers’ expectations of this outcome. Given the events
that occurred during the evaluation period, the second criterion (handling of emerging special issues) has
to focus on the issue of price volatility. The third criterion is straightforward: dairy farming has always been
one of the better rewarded farming sectors, given its high requirements of management and husbandry skills,
and capital inputs. Erosion of this relative position would be considered ‘unfair’ by the stakeholders involved.
Third, discussion of the sustainability of agriculture usually emphasises its impact on the environment
and natural resource conservation. However, a second important aspect of agriculture’s sustainability is
its socio-economic and demographic viability. For this reason, we propose indicators of both these
aspects of sustainability. Given the multi-dimensional nature of the second aspect, many indicators could
have been chosen. The selection is limited here to several indicators of the attractiveness of dairy
farming for young farmers or new entrants, which can be interpreted as a proxy for a number of related
characteristics.
Many of the trends discussed in this evaluation question have already been investigated in the course of
answering earlier evaluation questions. Where this is the case, the indicators already used and the
findings reported are adopted here, although they are interpreted in a different context. In other cases,
new indicators are proposed. This is clarified in Table 14.6 describing the indicators.
Table 14.7 sets out the indicators to be used for examining this question.
Table 14.7 Judgement criteria and indicators for EQ10.2
Indicator Data requirement Information sources
More market oriented and
competitive agriculture
• Market outcomes
Comparison of internal and international prices
Price series dairy products
Production costs for milk
EQ3, EQ5
EQ4
Levels of import tariffs and export refunds
Tariff rates and export refund rates for specific dairy products (EU market level)
Eurostat
Presence of imported dairy products on EU market
Percentage of TRQs for dairy products that are filled
Eurostat
Share of dairy exports without export refund
Trade data on total and subsidised exports of dairy products (EU market level)
Eurostat
EU presence on world market EU’s share of the world market for the main dairy exports
Descriptive Chapter (COMTRADE)
• Structures
Economies of scale in milk production
EQ1b, EQ3
Economies of scale in milk processing
EQ7
Extent of specialisation Share of milk coming from specialised dairy farms EU-FADN
Table continues on the next page.

303
Maintenance of income support at current level
Evolution of total support to producers
Market price support + direct payments index
EQ9
Fair producer incomes
Annual income trends Farm income per AWU over time (at MS level)
EQ3
Variability of milk price Volatility index EQ2
Stabilising effect of direct payments on dairy income
Share of direct payments in income of specialist dairy farms
FADN
Relative income Dairy income relative to all types of farm income
EQ3
Sustainability of agriculture
•••• Environmental sustainability Environmental footprint of aggregate milk production
Trends in dairy cow numbers, yields and average herd sizes
Descriptive Chapter, EQ1b
Production intensity Intensity of milk production per hectare of fodder area for specialised dairy farms
FADN
Dairy farmers’ participation in agri-environmental schemes
Participation of dairy farmers in AES Descriptive Chapter, EQ10.1
Milk production in LFAs Qualitative information Descriptive Chapter, EQ1b, Producer Survey
• Socio-economic sustainability
Human capital in dairy farming Age structure of farmers on specialised dairy farms
EQ9
Presence of successors on dairy farms Producers’ & ex-producers’ survey
Administrative simplification
Trend in administrative input Qualitative information EQ9
14.6.1 More market-oriented agricultural markets and a more competitive agriculture
Market orientation
Analysis reported for EQ3 shows that, for EU-15, the total costs of milk production in euros per tonne on
specialist dairy farms fell by 4.6% between 2000 and 2003, and rose by 6% between 2004 and 2007,
For EU-10, the increase between 2004 and 2007 was 30%, but this figure includes the more general
effects of adopting the CAP and entering the Single European Market. Although various factors lie behind
these trends in costs before and after the 2003 reforms, the trends themselves do not indicate that more
market-oriented policy environment led to greater cost competitiveness.
EQ5 documents the price competitiveness of EU dairy products on the world market. Figures 9.1, 9.3,
9.5 and 9.7 show the monthly evolution of the price gap between these two prices for butter, SMP, WMP
and cheddar cheese for the period 1997-2010. For all four products, this period can be conveniently
divided into three sub periods. Up to 2003, the price gap is substantial, with the EU internal price for
butter and WMP between 50% and 100% higher than the world market price, slightly less for SMP and
more than twice as high for cheddar cheese. The price gap narrows considerably for both SMP and WMP
prices during an 18-month period in 2000-2001, when world market prices increase sharply and a much
smaller rise is transmitted to internal prices. From 2004 to end-2006/start-2007, the price gap narrows
for all four products, in most cases because world market prices are rising, although for butter world
market prices remain rather steady and it is the internal prices, nudged downwards by the intervention
price for butter, that reduces the price gap. The third sub-period coincides with the world market
turbulence referred to already in a number of the EQs. During this period, the price gap closes almost
completely for all four products, in a few cases becoming negative for some months, and with the
internal price closely tracking movements in the world market price. From this evidence, it can be
concluded that the 2003 reforms together with rising world market prices made EU dairy products more
competitive on the world market during the period 2004-2006, but this trend was then completely over-
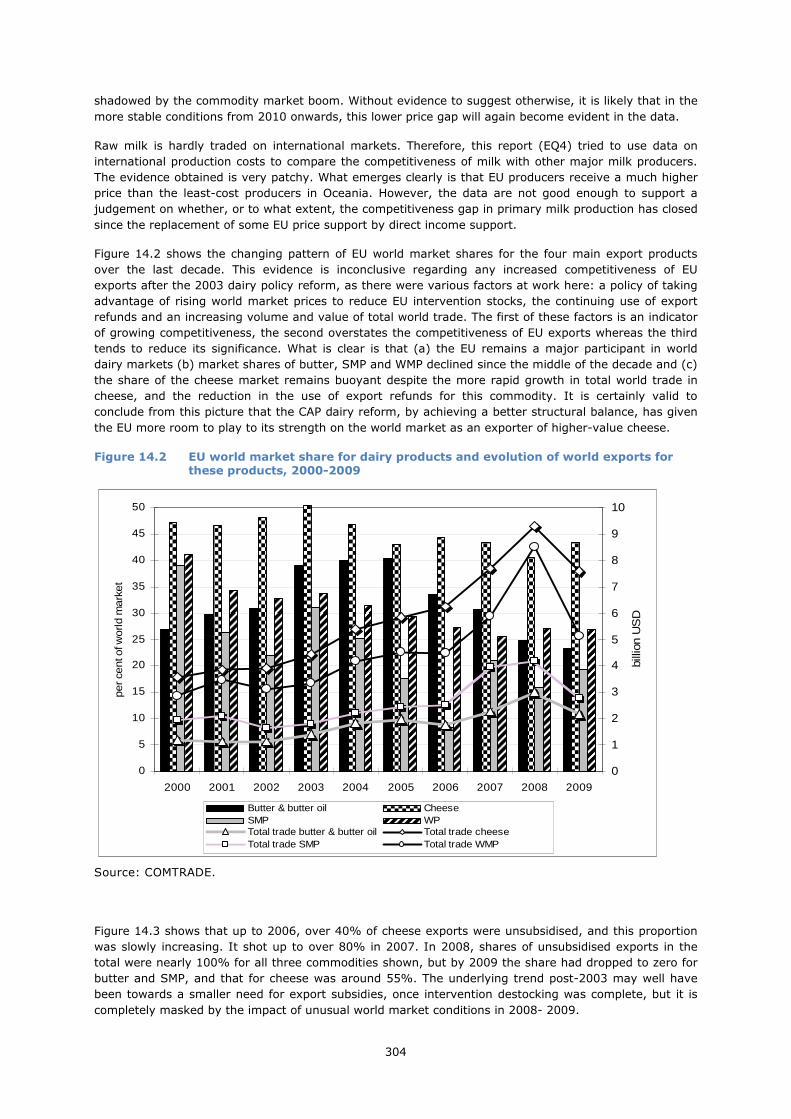
304
shadowed by the commodity market boom. Without evidence to suggest otherwise, it is likely that in the
more stable conditions from 2010 onwards, this lower price gap will again become evident in the data.
Raw milk is hardly traded on international markets. Therefore, this report (EQ4) tried to use data on
international production costs to compare the competitiveness of milk with other major milk producers.
The evidence obtained is very patchy. What emerges clearly is that EU producers receive a much higher
price than the least-cost producers in Oceania. However, the data are not good enough to support a
judgement on whether, or to what extent, the competitiveness gap in primary milk production has closed
since the replacement of some EU price support by direct income support.
Figure 14.2 shows the changing pattern of EU world market shares for the four main export products
over the last decade. This evidence is inconclusive regarding any increased competitiveness of EU
exports after the 2003 dairy policy reform, as there were various factors at work here: a policy of taking
advantage of rising world market prices to reduce EU intervention stocks, the continuing use of export
refunds and an increasing volume and value of total world trade. The first of these factors is an indicator
of growing competitiveness, the second overstates the competitiveness of EU exports whereas the third
tends to reduce its significance. What is clear is that (a) the EU remains a major participant in world
dairy markets (b) market shares of butter, SMP and WMP declined since the middle of the decade and (c)
the share of the cheese market remains buoyant despite the more rapid growth in total world trade in
cheese, and the reduction in the use of export refunds for this commodity. It is certainly valid to
conclude from this picture that the CAP dairy reform, by achieving a better structural balance, has given
the EU more room to play to its strength on the world market as an exporter of higher-value cheese.
Figure 14.2 EU world market share for dairy products and evolution of world exports for these products, 2000-2009
0
5
10
15
20
25
30
35
40
45
50
2000 2001 2002 2003 2004 2005 2006 2007 2008 2009
per ce
nt o
f world
mark
et
0
1
2
3
4
5
6
7
8
9
10
billi
on U
SD
Butter & butter oil CheeseSMP WPTotal trade butter & butter oil Total trade cheeseTotal trade SMP Total trade WMP
Source: COMTRADE.
Figure 14.3 shows that up to 2006, over 40% of cheese exports were unsubsidised, and this proportion
was slowly increasing. It shot up to over 80% in 2007. In 2008, shares of unsubsidised exports in the
total were nearly 100% for all three commodities shown, but by 2009 the share had dropped to zero for
butter and SMP, and that for cheese was around 55%. The underlying trend post-2003 may well have
been towards a smaller need for export subsidies, once intervention destocking was complete, but it is
completely masked by the impact of unusual world market conditions in 2008- 2009.

305
Figure 14.3 Unsubsidised and total exports of butter, SMP and cheese, 2000-2009
0
100
200
300
400
500
600
2000 2001 2002 2003 2004 2005 2006 2007 2008 2009
tho
usa
nd
ton
ne
s
0
100
200
300
400
500
600
tho
usa
nd
ton
ne
s
Butter exports without subsidy SMP exports without subsidy
Cheese exports without subsidy Butter total exports
SMP total exports Cheese total exports
Source: DG AGRI (various years and unpublished).
Regarding imports of dairy products, the applied tariff structure offers high protection against imports
from outside the EU. With a reduced intervention system and the disappearance of most internal disposal
aids, maintaining these border controls is a crucial element in the management of the EU dairy market,
and one that has remained intact throughout the decade.
Given this level of protection, it follows that virtually all imported dairy products enter the EU under tariff
rate quotas, which specify limits (ceilings) up to which specific tariff lines can enter at a lower rate of
tariff. Table 14.8 shows the most important bilateral and erga omnes tariff rate quotas for butter, cheese
and SMP over the period 2000-2009. There is only a very slight increase in total bilateral TRQ capacity
during the period. However, it is striking that the fill rates for the bilateral TRQs for butter and SMP
dropped markedly in 2004, due to reducing EU prices (this was the first year of the cuts in intervention
prices) and somewhat higher world prices, and have remained lower than prior to 2004. Not only has this
helped marginally to improve internal market balance, but it is also an indication that exporting countries
find the EU market, with its lower prices, less attractive. By implication, they now face more
domestically-generated competition within the EU than in some other export destinations.

306
Table 14.8 Applied tariffs for imports into the EU (GATT years) (all quantities in thousand
tonnes, all tariffs in €/100kg)
Country or origin 2000/1 2001/2 2002/3 2003/4 2004/5 2005/6 2006/7 2007/8 2008/9
Butter (HS 040510)
New Zealand TRQ quantity 76.667 76.667 76.667 76.667 76.667 76.667 74.693 74.693 74.693
in-quota tariff 86.88 86.88 86.88 86.88 84.88 84.88 70 70 70
erga omnes TRQ quantity 10.00 10.00 10.00 10.00 10.00 10.00 11.36 11.36 11.36
in-quota imports 9.23 9.84 9.91 10.00 5.61 2.76 5.68 5.78 0.00
in-quota tariff 94.8 94.8 94.8 94.8 94.8 94.8 94.8 94.8 94.8
erga omnes
out-of quota tariff 231.3 231.3 231.3 231.3 231.3 231.3 231.3 231.3 231.3
Cheese cheddar (HS 04069021)
New Zealand TRQ quantity 7 7 7 7 7 7 7 7 7
in-quota tariff 17.06 17.06 17.06 17.06 17.06 17.06 17.06 17.06 17.06
Australia TRQ quantity 3.25 3.25 3.25 3.25 3.25 3.25 3.25 3.25 3.25
in-quota tariff 17.06 17.06 17.06 17.06 17.06 17.06 17.06 17.06 17.06
Canada TRQ quantity 4 4 4 4 4 4 4 4 4
in-quota tariff 13.75 13.75 13.75 13.75 13.75 13.75 13.75 13.75 13.75
erga omnes
TRQ quantity 15.00 15.00 15.00 15.00 15.00 15.00 15.01 15.01 15.01
in-quota imports 14.73 14.91 14.94 15.00 15.00 15.00 15.01 15.01 15.01
in-quota tariff 21 21 21 21 21 21 21 21 21
erga omnes out-of quota tariff 167.10 167.10 167.10 167.10 167.10 167.10 167.10 167.10 167.10
SMP (HS 04021019)
erga omnes
TRQ quantity 68.00 68.00 68.00 68.00 68.00 68.00 68.00 68.54 68.54
in-quota imports 49.48 34.67 51.90 57.18 1.34 0.00 16.51 0.19 0.10
in-quota tariff 47.5 47.5 47.5 47.5 47.5 47.5 47.5 47.5 47.5
out-of quota tariff 118.8 118.8 118.8 118.8 118.8 118.8 118.8 118.8 118.8
Source: WTO notifications and TARIC.
Figure 14.4 shows the evolution of total imports of the four main dairy products over the same period.
Three main periods can be distinguished: up to and including 2003, when imports were are their highest
levels, 2004-2007 when there was a downward shift in the underlying level, and then 2008-9. The
downward shift between the first and second period is more marked for cheese than for butter, which is
consistent with the observation in Chapter 6 that cheese prices reacted more to the 2003 reform than
those for the other dairy products. This information adds further support to the evidence provided in
Table 14.8 based on the fill rates of a number of specific TRQs, that the EU internal market offered less
of a ‘preference margin’ to other trading countries after the reform. This is indirect evidence of more
competitive internal prices and supplies.
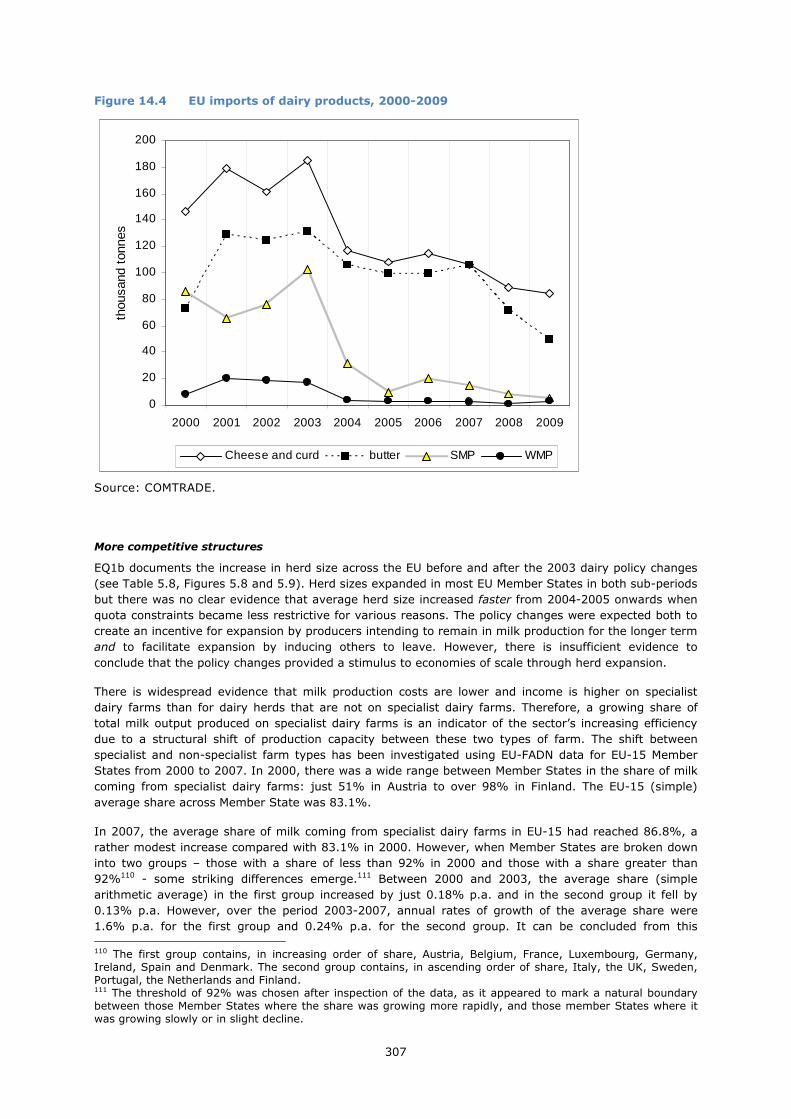
307
Figure 14.4 EU imports of dairy products, 2000-2009
0
20
40
60
80
100
120
140
160
180
200
2000 2001 2002 2003 2004 2005 2006 2007 2008 2009
thou
sand
ton
nes
Cheese and curd butter SMP WMP
Source: COMTRADE.
More competitive structures
EQ1b documents the increase in herd size across the EU before and after the 2003 dairy policy changes
(see Table 5.8, Figures 5.8 and 5.9). Herd sizes expanded in most EU Member States in both sub-periods
but there was no clear evidence that average herd size increased faster from 2004-2005 onwards when
quota constraints became less restrictive for various reasons. The policy changes were expected both to
create an incentive for expansion by producers intending to remain in milk production for the longer term
and to facilitate expansion by inducing others to leave. However, there is insufficient evidence to
conclude that the policy changes provided a stimulus to economies of scale through herd expansion.
There is widespread evidence that milk production costs are lower and income is higher on specialist
dairy farms than for dairy herds that are not on specialist dairy farms. Therefore, a growing share of
total milk output produced on specialist dairy farms is an indicator of the sector’s increasing efficiency
due to a structural shift of production capacity between these two types of farm. The shift between
specialist and non-specialist farm types has been investigated using EU-FADN data for EU-15 Member
States from 2000 to 2007. In 2000, there was a wide range between Member States in the share of milk
coming from specialist dairy farms: just 51% in Austria to over 98% in Finland. The EU-15 (simple)
average share across Member State was 83.1%.
In 2007, the average share of milk coming from specialist dairy farms in EU-15 had reached 86.8%, a
rather modest increase compared with 83.1% in 2000. However, when Member States are broken down
into two groups – those with a share of less than 92% in 2000 and those with a share greater than
92%110 - some striking differences emerge.111 Between 2000 and 2003, the average share (simple
arithmetic average) in the first group increased by just 0.18% p.a. and in the second group it fell by
0.13% p.a. However, over the period 2003-2007, annual rates of growth of the average share were
1.6% p.a. for the first group and 0.24% p.a. for the second group. It can be concluded from this
110 The first group contains, in increasing order of share, Austria, Belgium, France, Luxembourg, Germany, Ireland, Spain and Denmark. The second group contains, in ascending order of share, Italy, the UK, Sweden, Portugal, the Netherlands and Finland. 111 The threshold of 92% was chosen after inspection of the data, as it appeared to mark a natural boundary between those Member States where the share was growing more rapidly, and those member States where it was growing slowly or in slight decline.

308
comparison that in those Member States with a lower degree of specialisation in 2000, the post-2003
period coincides with a shift in capacity from non-specialist to specialist herds. This was undoubtedly
achieved by a faster rate of exit of non-specialist herds, and was most likely stimulated by the policy
changes. It is not surprising that in the second group of countries the increase in the share is smaller
than that of the first group after 2003, since they were already much closer to the upper boundary of
100% at the start of the period.
The EU-FADN data on the shares of specialist and non-specialist dairy farms for EU-10 Member States
starts only in 2004. In that year, there was even greater heterogeneity between countries than in EU-15,
with Slovakia and the Czech Republic having shares of only 23.9% and 24.3%, respectively, and
Slovenia registering a share of 88.6%. In the years following accession, there is no clear pattern of
development. In some of these countries, the share fell, in others it appears to oscillate and in a few
there was a steady increase.
The evidence presented in EQ7 on structural adaptation in the processing sector is also mixed. Although
in aggregate the number of dairy enterprises fell and the average throughput per enterprise increased in
EU-15 between 2003 and 2009, there is an increase in the total number of enterprises over the EU-10
Member States (where data are available) (see Table 11.2). Even within EU-15, the trends differ
between Member States. The general pattern is that the observed consolidation of dairy enterprises
tends to occur in countries where there were more, smaller operations, and hence gains from economies
of scale to exploit, whereas the increase in the number of enterprises occurred in countries where the
industry was already highly rationalised and hence it probably caused little deterioration in average
efficiency. However, even if on balance structural changes in the processing industry did lead to
increased economies of scale after the policy reforms, there is no evidence that it was due to these
reforms. The comments of respondents in the processors’ and experts’ survey stress that the industry
downstream of farming is driven strongly by market forces, horizontal competition and pressure from
retailers to lower prices, rather than by CAP dairy policy.
14.6.2 Maintenance of income support at current levels
This question was addressed in depth in EQ9. The following conclusions were reached:
� The amount of support going to producers, both from the budget and via ‘hidden’ transfers from
consumers, declined very considerably between 2002-3 and 2009. However, this was at least in part
due to the extremely high prices on world markets, which rendered export subsidies and
intervention storage redundant and eliminated the price gap between domestic and world market
prices for the basic dairy products (see Figure 13.10).
� Estimates of what would have happened under ‘normal’ conditions shows that the policy changes
would still have caused a fall in total support (from consumers and from the EU budget under the
heading “current dairy policy”) (see Figure 13.11).
� Even when it is taken into account that some continuing budget support has been renamed and
moved to another part of the budget (fully in line with the new conceptual basis and delivery
mechanism for that support), the total cost of annual support would still have been about 22%
lower in 2007-2009 than in 1999-2003 (see Table 13.7).
How these results are evaluated depends on which interpretation of the corresponding reform principle is
chosen. If this principle implies that the total burden of support falling on consumers and the budget
should be maintained, then clearly the CAP dairy reform has overshot the target, since dairy support
costs the rest of the economy less than before. If it means that the amount of support received by
producers should be maintained, then it depends on whether under the new policies the transfers from
other parts of the economy to the dairy sector are made more efficiently. Lower support cost is
compatible with maintaining the level of support received if the transfer efficiency of delivering the
support improves, i.e. a greater share what consumers and taxpayers give up in order to support dairy
incomes actually reaches the intended beneficiaries. According to this interpretation, the evidence shows
that the outcomes of the CAP dairy policy changes are fully coherent with the 2003 reform principle.
Moreover, they go in the direction of the aim associated with this principle “to increase the effectiveness
of direct income aid, while leaving the actual amounts paid to farmers unchanged” (recital 24, Regulation

309
(EC) 1782/2003), although in this case it is more a question of replacing some (less effective) market
price support with some (more effective) direct income support, which can be done at a rate less than
one-for-one while maintaining support received.
14.6.3 Fair producer incomes
Trends in milk producer incomes (various definitions) before and after the policy changes are extensively
documented in other evaluation questions (see Tables 7.3, 7.4, 7.6, 13.8 and Figure 13.12). Farm Net
Value-Added per Annual Work Unit (FNVA/AWU) for EU-15 specialist dairy farms was 48% higher in
nominal terms in 2007 relative to 2003 (with all Member States showing a healthy increase), and 58%
higher in nominal terms for EU-10 relative to 2004. In real terms, these increase amount to 34% and
79%, respectively. Thus, up to 2007, expectations of the continuity of past income trends were met.
Unfortunately, the EU-FADN data base is not yet finalised for the following two years, which would permit
the picture to be extended right through the period of the price spike and collapse.
It is not possible to examine the variability of farm income using the more sophisticated techniques that
were used to measure the volatility of prices in EQ2 and EQ5. This is because agricultural income is an
annual concept, and in order to have enough observations to apply this methodology with justification,
one would have to extend the evaluation period for several decades or more into the past, which makes
no sense. Moreover, the essential concept here is the variability at the level of the individual farm
business, which cannot be easily examined using the EU-FADN database using the simpler price band
method because of the frequently changing composition of the sample. Therefore, two other indicators
are used. First, the indicator of milk price volatility calculated for EQ2, and second, the share of direct
payments in Farm Net Value-Added. As a caveat, it is recalled that the variability of farm income
depends on variability in output price, production cost per unit, and the amount of output produced. At
farm level, output quantities can vary considerably depending on weather conditions over the year, and
(partly in relation to these same factors) production costs also have a degree of variability (see Table
7.18). Thus, not all income variability can be traced to price variability.
The use of the second indicator relies on the fact that the direct payments in question are for the most
part either fixed independently of dairy variables like market prices or farm output, depending instead on
a historic reference, or - during the sub-periods were the dairy premium was still coupled to milk - they
depended on the amount of quota held at the end of the year which, again, is relatively stable from year
to year and not affected by short-term market phenomena. The higher the share of these fixed payments
in total income, the more stable income will be from year to year, since the part of income that is
vulnerable to price, cost and output variability is a smaller share of the total. Since these payments are
policy-determined, a growing share of this stabilising component in producer income over time can be
attributed directly to policy.
Figure 6.7 shows that the volatility of the EU producer price for milk doubled during 2007, and for most
of the following two years it remained at historically very high levels. The reasons for this are analysed in
EQ2. EQ5 compares the volatility of EU domestic prices for butter, SMP, WMP and cheeses with that of
the corresponding world prices, and reports similar findings. For all these products except cheese, prices
were much more volatile from end-2006/early 2007 onwards until around early 2010. This was a new
phenomenon for the sector, and particularly for the milk producer. Milk returns were strongly affected
both in the upward and downward phase of the price spike. EQ2 and EQ5 explain why this phenomenon
occurred. It required the combined interaction of a lower intervention safety net and extremely high (as
opposed to merely volatile) world market prices to produce it.
As explained in EQ2, this unexpected development reveals a missing element in the set of measures
available for achieving internal stability in such conditions. However, Figure 14.5 shows that, because the
direct payment component of dairy farm income is now much higher than before the reform, incomes are
less affected by such turbulence than they would have been without these payments.

310
Figure 14.5 Share of direct payments in FNVA, EU-15, 1995-20081
0
10
20
30
40
50
60
70
1995 1996 1997 1998 1999 2000 2001 2002 2003 2004 2005 2006 2007 2008
per
cent
of
FN
VA
/AW
U
Austria Belgium Denmark Finland
France Germany Greece Ireland
Italy Luxembourg Netherlands Portugal
Spain Sweden United Kingdom
Notes: 1) The series are shown in the form of 3-year moving averages so that trends emerge more clearly.
Source: EU-FADN.
By 2007-2008, ten Member States of EU-15 had an average share of direct payments in FNVA of
between 20 and 40%, which was much higher than for the pre-2003 period. The case of Finland is an
anomaly, since the figures shown include an additional national subsidy.112
Finally, regarding dairy income relative to other farming sectors, EQ3 (Table 7.8) shows that for the
majority of EU-15 Member States, FNVA/AWU is higher than in other key farming sectors, and that in
many Member States the relative position has improved or remain rather constant since the early 2000s.
Therefore, apart from the emerging issue of price volatility, where a solution is still being sought within
the reformed CAP for dairy, the selected indicators for the concept of ‘fair producer income’ show that
CAP dairy measures are coherent with this principle of the CAP reform. One aspect of fairness regarding
producer income support under the CAP that has not been addressed yet relates to the inequality in the
distribution of support between holdings, based as it still is on the size of the holding.113 Clearly, this is
an issue that involves the Single Payment System generally, and cannot be dealt with by dairy policy
alone. However, it is a remnant of the earlier support philosophy, which was based on commodities and
was production-linked (and hence largely determined by farm size), with larger farms getting much more
support than smaller farms.
112 In 2007, the region-specific subsidy was paid at the rate of €0.03-0.09/litre (Lehtonen, 2007). 113 See, for example, Keeney (2000).

311
14.6.4 Sustainability of agriculture
Environmental sustainability
Dairy cows are highly polluting production units, in terms of their greenhouse gas emissions and their
waste products.114 However, higher-yielding dairy management systems result in lower emissions per
unit of milk produced. Moreover, technologies for the efficient handling of manure become more
economic with larger herd sizes that can exploit technological economies of scale or justify advanced
technologies such as anaerobic digestion of waste for renewable energy production. For these reasons, a
key indicator of the sustainability of milk production is the number of dairy cows in the sector in relation
to their yields, the total amount of milk produced and average herd size. The evolution of these
parameters has been discussed already in different evaluation questions and is summarised here.
After reaching a peak in 2001, dairy cow numbers in EU-15 have fallen in most years since then, and in
2010 were 8.7% below the numbers of 2003. Rates of decline have been faster in the Member States of
EU-10 since their accession (EQ1b, Table 5.5). Yield growth for EU-15 accelerated after 2003. The
underlying trend in milk yields has been positive everywhere, more so in EU-10 than in EU-15 (Table
2.4). Aggregate production for the current 27 Member States has remained more or less constant (EQ1a,
Figure 5.1). Average herd sizes have been increasing in the EU as a whole since the 2003 reform,
although there were decreases in a few Member States in the transitional years around the year of
decoupling (EQ1b, Table 5.5). These trends lead to the conclusion that since 2003 the aggregate
environmental footprint of the EU dairy sector has declined somewhat faster than the previous trend.
The impact of dairying on the environment depends also on the intensiveness with which land is used.
Land use intensity is reported with the indicator “milk per tonne of forage area” in Table 14.9. For
Member States of EU-15, sufficient data points are available to draw the conclusion that the medium-
term upward trend continued after the reform as before. At first sight, this runs counter to expectations:
the switch to the dairy premium followed by decoupling means that less of the return to milk is related to
the current quantity of production, and therefore the incentive to maximise yield is reduced. However,
although the trend has continues upwards, for EU-15 the annual rate of growth appears to have slowed
down (1.4% p.a. between 2000 and 2003, as against a little over 0.8% p.a. between 2003 and 2007).
Given the margin of error with time series from FADN, this difference should be treated with caution.
The most intensive production methods are found in Denmark, the Netherlands, Spain, Italy and a little
behind them, Portugal. The upward trend in production intensity is also most marked in these countries.
For EU-12 Member States, it is uncertain whether clear trends can be discerned from only four data
points (or fewer), and possible adjustments due to EU entry should also be borne in mind. It is striking
that for the three Baltic countries and the Slovak Republic, this indicator of production intensity is less
than 20% the level observed in the Member States with the most intensive production methods. The
average trend for EU-10 is downwards over the four years, clearly influenced by the sharp fall in Poland.
It is also noteworthy that the trend is flat or has declined in the Czech Republic and Slovakia.
In summary, the policy changes have not lessened the incentives towards increasing production intensity
in EU-15 Member States. Along with evidence of geographical concentration in some of these countries,
we conclude that the environmental burden of milk production may have become greater locally in some
of the major milk-producing countries. However, the adoption of cross compliance requirements with the
dairy premium means that producers must adapt production methods and resource use in order to avoid
a range of specific environmental impacts (see Table 14.5). Moreover, dairy farmers’ participation in
agri-environmental schemes is strong (see Table 14.4). Thus, in principle, these off-setting policies
should contain the impacts of further intensification. The extent to which these measures off-set any
potential environmental degradation through greater intensification needs in-depth empirical study.
114 See FAO (2010). Greenhouse gas emissions from the dairy sector: A life cycle assessment. FAO, Animal Production and Health Division, Rome. This study estimates the average global emissions from milk production, processing and transport to be 2.4 CO2-equivalents per kg of fat and protein corrected milk at farm gate, and that the overall contribution of the global milk production, processing and transportation to total anthropogenic emissions is 2.7%. Of this total, 93% of the life-cycle emissions are due to on-farm activities (the share is 78-83% in industrialised countries and 90-99% in developing countries).

312
Table 14.9 Milk per hectare of forage area (tonnes/hectare), 2000-2007
2000 2001 2002 2003 2004 2005 2006 2007
Belgium 7.45 7.69 7.87 7.98 8.18 8.02 8.20 8.63
Denmark 10.20 9.92 10.71 10.77 11.01 12.71 12.54 12.20
Germany 7.13 6.54 7.15 7.20 7.33 7.30 7.58 7.53
Greece n.a. n.a. n.a. n.a. n.a. n.a. n.a. n.a.
Spain 10.82 12.32 12.39 12.24 12.20 12.39 12.94 13.26
France 4.85 4.79 4.99 4.83 4.85 5.09 4.96 5.08
Ireland 4.90 4.94 5.08 5.27 5.55 5.35 5.65 5.51
Italy 9.60 10.61 10.55 12.87 11.89 11.23 12.94 12.64
Luxembourg 4.46 4.58 4.73 4.86 4.75 4.67 4.65 4.54
Netherlands 12.68 12.16 12.33 12.62 12.03 12.57 12.73 12.64
Austria 3.57 3.61 4.05 4.25 4.31 4.31 4.68 4.73
Portugal 8.80 10.26 9.05 10.48 9.39 10.61 10.58 11.59
Finland 5.89 5.72 6.53 6.41 6.73 6.99 6.85 6.79
Sweden 5.65 5.57 5.80 5.48 5.35 5.10 5.83 6.24
United Kingdom 7.70 7.93 8.33 7.86 8.27 7.90 8.75 8.97
EU-15 7.03 7.05 7.22 7.43 7.39 7.45 7.68 7.75
Czech Republic 3.56 3.42 3.45 3.47
Estonia 2.04 2.30 2.69 2.74
Hungary 5.82 5.53 6.83 6.87
Lithuania 2.16 2.43 2.48 2.59
Latvia 1.87 1.92 1.96 1.81
Malta
Poland 8.36 5.99 6.18 6.23
Slovakia 1.94 2.10 1.46 1.57
Slovenia 5.24 5.66 5.92 6.10
EU-10 5.11 4.62 4.44 4.55
Bulgaria 6.02
Romania 5.61
EU-02 5.70
Source: EU-FADN.
Milk production in less favoured areas tends to be less intensive and compatible with higher
environmental values. Table 2.36 shows that a very significant share of milk producing capacity
(although inevitably, because of less intensive production, a smaller share of output) occurs in these
areas. Between 2003 and 2007, the share of EU-15 dairying in these areas has slightly increased in some
Member States and slightly decreased in others, but there is no decisive trend.115 This is confirmed by
figures on rates of herd closure in LFAs relative to non-LFAs in Table 5.13. For the Member States of EU-
10, a comparison is not possible since official LFA-zoning in these countries dates only from their
accession. This indicator is relevant not only to the CAP reform principle of environmental sustainability,
but also to the principle of maintaining rural areas.
Socio-economic sustainability
Here the focus is on the changes in the age structure of milk producers, and the outlook for the
replacement of current producers. Table 13.10 shows that since 2000 but particularly since 2005,
specialist dairy producers have on average become older and the age groups under 45 years of age have
declined more than older age groups. The loss of attractiveness of the sector to younger new entrants
since the 2003 policy changes came into force is a negative feature of the dairy sector, although whether
it will become a longer-term trend is yet unclear.
Table 14.10 summarises evidence on succession plans obtained from the milk producer survey. For a
little less than half of the sample, succession is not yet an issue mainly because the current producer
115 It is of interest that, in the producer survey, LFA respondents were on average younger (46 years old) compared to non-LFA respondents (49 years old), although their herds were much smaller (average 59 cows as opposed to 105 cows). Despite the smaller average size, only 2 of the 173 LFA said their farms would close down when they retired, whereas this answer was given by 10 of the 220 non-LFA respondents. Moreover, all the farms where it was known that the successor would cease milk production were in non-LFA areas.

313
considers he is too far away from retirement. For over one quarter of the farms, the successor is already
known, and in most of these cases he intends to continue with milk production (on average, the herds in
this sub-group are the largest). But not all successors’ plans are known yet, and in a few cases it is
known that the successor will not continue with milk. This leaves nearly one in four cases where
succession arrangements have not been determined, or (a small minority) where it is already known that
the farm will close down. When a successor cannot be found from within the family, the farm is sold, in
which case it may or may not be amalgamated with another farm, and its milk-production capacity may
or may not continue to be exploited. Whatever the outcome, it is less likely to be bought by a young would-
be milk producer because of the capital needed for farm purchase. The question of inter-generational
succession within farming families is always relevant partly because this arrangement facilitates the
take-over of the productive resources by the next generation, as well as often dealing with the
retirement needs of the out-going generation. It is usually also the best way of maintaining continuity of
production and maintaining the knowledge base about the specific characteristics of the farm.
Table 14.10 Outlook on farm succession
Whole sample
Succession is not clear
Succession is not yet an
issue
Farm will close down
Successor is found
Total Successor will continue
with milk
Successor will stop with milk
Successor’s plans are unknown
Share of sample, %
100.0 22.1 47.3 3.1 27.5 23.2 1.0 3.3
Average age of producer
47 50 43 56 53 53 60 54
Average herd size (dairy cows)
85 73 79 51 106 118 62 28
Source: Producer survey.
The information presented in Table 14.10 was gathered at the start of 2011 and for lack of data cannot
be compared with the outlook on this issue in the pre-reform period. This means that it contains little
information of direct relevance to the impact of the policy changes - but much food for thought.
14.6.5 Simplification of policies and procedures
Other sections have spelled out in detail the simplifications of CAP dairy policy that have been put in
place since 2003. First, the rationalisation of quota rules, the harmonisation of dairy income support with
that of the other main agricultural commodities through merging the dairy premium with the SFP,
abolition of most internal disposal aids, and a reduced role for the intervention system. These changes
should have lowered the administrative cost of managing these polices both at EU level and in Member
States. Evidence from two Member States was given in EQ9. At the same time, the administrative
burden has increased for milk producers. This is not because an existing burden was somehow
transferred from bureaucracies onto the shoulders of farmers, but rather because the nature of the
reform – moving away from market management policies towards more targeted incentives to individual
stakeholders – typically increases the need for record-keeping and form-filling for the latter.
14.7 Conclusions to EQ10.2
Table 14.11 summarises the findings of this section on the coherence of CAP dairy policy measures with
the general principles of the 2003 CAP reform. The columns relate the main principles of the reform. The
rows refer to the main objectives of the changes in CAP dairy policy measures since 2002, with sub-
headings for particular policies. The coding can range from three minuses to three pluses, indicating
complete lack of coherence, not very coherent, slightly incoherent (or incoherent in unusual
circumstances), neutral (i.e. unrelated, independent ), somewhat coherent, coherent, and very coherent.

314
Table 14.11 Coherence between CAP reform principle and changes in CAP dairy policy
Overall principles of the 2003 CAP reform
Change in CAP dairy policy
More market orientation
More competitive agriculture
Better production structures
Maintenance of current
support levels
Fair producer incomes
Maintenance of rural areas
Environ-mental
sustainability
Socio-economic
sustainability
Policy simplification
Switch from market price support to dairy payment
++ + ++ +++ + + ++/- + +/-
Reduction of intervention prices
++ ++ + + 0/- - 0/- +/- 0 ++
Decoupling of dairy payment
+++ ++ ++ +++ ++ -/+
+/- -/+ +++
Introduction of cross compliance
0 0/- 0 0/- 0/- + +++ 0 - -
Gradual increase of quota
++ ++ +++ + + +/- +/- + +
Simplification of policies (removal of redundant
measures)
++ + 0 + 0 0 0 +/- ++
Key: complete lack of coherence=- - -, not very coherent = --, slightly incoherent = -, neutral (i.e. unrelated, independent ) = 0, somewhat coherent = +,
coherent = ++, very coherent = +++. Where two symbols are given separated by a ‘/’, this means that the coherence rating may be one or the other, depending on circumstances.
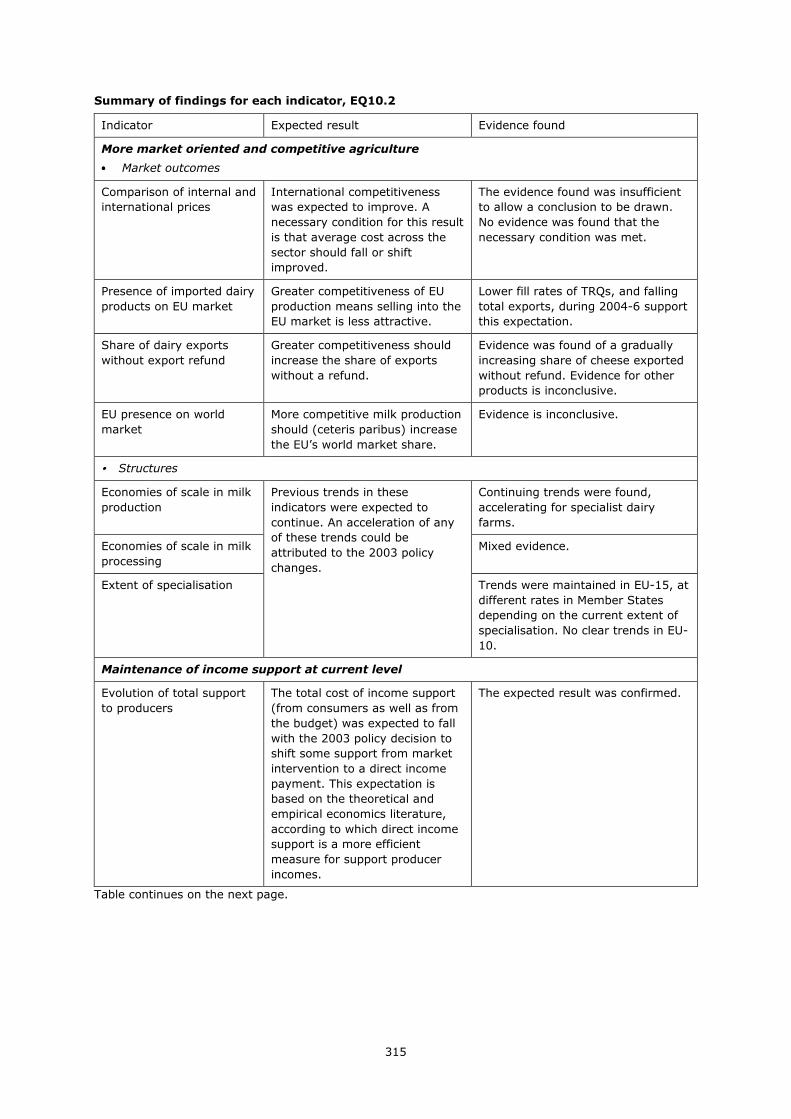
315
Summary of findings for each indicator, EQ10.2
Indicator Expected result Evidence found
More market oriented and competitive agriculture
•••• Market outcomes
Comparison of internal and
international prices
International competitiveness
was expected to improve. A
necessary condition for this result
is that average cost across the
sector should fall or shift
improved.
The evidence found was insufficient
to allow a conclusion to be drawn.
No evidence was found that the
necessary condition was met.
Presence of imported dairy
products on EU market
Greater competitiveness of EU
production means selling into the
EU market is less attractive.
Lower fill rates of TRQs, and falling
total exports, during 2004-6 support
this expectation.
Share of dairy exports
without export refund
Greater competitiveness should
increase the share of exports
without a refund.
Evidence was found of a gradually
increasing share of cheese exported
without refund. Evidence for other
products is inconclusive.
EU presence on world
market
More competitive milk production
should (ceteris paribus) increase
the EU’s world market share.
Evidence is inconclusive.
• Structures
Economies of scale in milk
production
Previous trends in these
indicators were expected to
continue. An acceleration of any
of these trends could be
attributed to the 2003 policy
changes.
Continuing trends were found,
accelerating for specialist dairy
farms.
Economies of scale in milk
processing
Mixed evidence.
Extent of specialisation Trends were maintained in EU-15, at
different rates in Member States
depending on the current extent of
specialisation. No clear trends in EU-
10.
Maintenance of income support at current level
Evolution of total support
to producers
The total cost of income support
(from consumers as well as from
the budget) was expected to fall
with the 2003 policy decision to
shift some support from market
intervention to a direct income
payment. This expectation is
based on the theoretical and
empirical economics literature,
according to which direct income
support is a more efficient
measure for support producer
incomes.
The expected result was confirmed.
Table continues on the next page.

316
Fair producer incomes
Annual income trends
In order to fulfil the criteria
chosen for assessing fairness,
income trends, and income
relative to other types of farm
should be maintained.
The evidence shows that income
trends continued unchanged post-
2003.
Variability of milk price There was little change in price
volatility during 2004-2006. In
2007-2008, large increase in milk
price volatility were observed, due to
the combination of exogenous
events and new conditions created
by the 2003 reforms.
Stabilising effect of direct
payments on dairy income
Favourable evidence reported,
slightly reducing the impact of more
volatile market price on income.
Relative income Dairy income relative to that of
other farm types has been
maintained.
Sustainability of agriculture
• Environmental sustainability
Environmental footprint of
aggregate milk production
Expected to fall, due to structural
changes and yield increases.
Expectation confirmed.
Production intensity Expected to fall, since the
decoupled payment reduces the
incentive to maximise yields.
An increasing trend towards
intensification was found, but at a
slightly slower rate post-2003.
Dairy farmers’
participation in agri-
environmental schemes
No prior expectation. Strong evidence of dairy farmers’
participation in agri-environmental
schemes was found, especially in
LFAs.
Milk production in LFAs Expected to come under pressure
from more market-oriented
policies, but this pressure to be
counteracted by LFA payments.
Evidence was found to support the
expectation, but not in all regions.
• Socio-economic sustainability
Human capital in dairy
farming (entry of young
farmers)
No prior expectations: lower
quota values could offer more
favourable conditions for young
dairy farmers to start, whereas
lower milk prices and greater
uncertainty could act as a
deterrent.
Strong evidence was found of a
lower rate of entry of young dairy
farmers, and increasing age
structure, particularly since 2005.
Administrative simplification
Trend in administrative
input
It was expected that savings
would result from (a) the
abolition or suspension of some
measures, and possibly (b) the
simplification of on-going
measures.
Evidence was available from only
two Member States. It confirmed
expectation (a), but could not shed
light on expectation (b). The
available evidence is insufficient to
support a general conclusion
applicable to all EU Member States.
317
15 EQ11: Relevance
15.1 Approach to answering EQ11
15.1.1 Interpretation and comprehension of the key terms of EQ11
This question requires the CAP measures applicable to the dairy sector to be evaluated with respect to
the needs and problems of the main stakeholder groups influenced by dairy policy.
As explained in the evaluation methodology, questions of relevance are important in ex ante evaluations
where strategic issues and how they are mapped into policy instruments are under discussion and can be
modified.116 In a retrospective evaluation it is possible to examine whether the needs and the problems
of the main stakeholder groups have actually been addressed by the policy. The initial step is therefore
to identify the stakeholder groups and to list their concerns. Such a list is derived here partly from the
recitals in the legislation, or what is implicit in the recitals, and also in part from extensive background
knowledge about the sector and the dairy policy context. Based on this list, the analysis explores to what
extent the policy impacts have delivered results in response to these needs, and whether particular
stakeholder groups have grounds for being more satisfied with the outcomes than others. This involves
designating one or more indicators that reflect policy outcomes and are also associated with specific
stakeholder concerns.
The question explicitly mentions farmers, processors and consumers as the groups most involved.
However, in order to encompass all the objectives and the changes realised, several other groups
(taxpayers, and ‘beneficiaries of the environment’ – that is, current and future citizens of the EU and
beyond) should also be mentioned.
For the purposes of this evaluation, four stakeholder groups are therefore distinguished: milk producers,
milk processors, consumers of dairy products, and ‘society’ (comprising people in their roles other than
dairy product consumer, namely as taxpayer and citizen). For each of these groups, a number of
commonly expressed concerns are identified, namely:
Milk producers: level and stability of income, administrative burden, constraints on production choices,
constraints on expansion,
Dairy processors: milk prices, availability and stability of raw milk supplies,
Dairy product consumers: consumer prices,
‘Society’: environmental sustainability, animal welfare, GHG emissions and climate change, food
security, cost of the CAP, cost of agricultural policies.
It is clear that there are trade-offs between different stakeholder needs (in certain cases, maximising the
perceived needs of one group may be incompatible with doing the same with respect to other needs of a
different group). There are also limits to what can be delivered by policies. For example, consumers want
cheaper food, many also want higher-quality food, whereas others (and maybe some of the previous
groups), in their role as ‘citizens’, also want their food to be produced in a more environment- and
animal-friendly way. If the most recent changes in dairy policy have not been able to deliver undisputed
improvements with respect to all these needs, it may not be because the policies lack relevance but
116 “Handbook on Common Monitoring and Evaluation Framework Guidance Document” (DG AGRI, 2006) Glossary (p.14).
To what extend have the CAP measures applicable to the dairy sector been relevant with respect to the needs and problems of farmers, processors and consumers?
318
perhaps because the internal constraints linking these objectives make it impossible to maximise across
them all at the same time. Similar trade-offs exist between the commonly perceived needs of producers
and processors, and there are limits to what dairy policy can deliver with respect to curbing the methane
emissions of dairy cows, without which there would be no dairy products at all.117 When interpreting the
findings relating to relevance, these issues need to be taken into account.
15.1.2 Methodology used for answering EQ11
The methodology adopted here consists in assembling all the evidence presented in earlier EQs,
structuring it according to the stakeholder groups and their particular concerns, and making a synthetic
summary in table form. Very few new indicators are used and little new material is provided. This
methodology is entirely appropriate for addressing the issue of relevance ex post. If material on the
effectiveness and efficiency of CAP dairy policy were not adequate or not appropriate for assessing the
extent that the policies have met relevant needs, then a priori this would indicate a poor match between
the objectives, instruments and impacts of the policy on the one hand, and the needs and problems of
the stakeholder groups on the other.
15.1.3 Judgement criteria, indicators and judgement criteria used for each indicator
The indicators used to answer this EQ are set out in Table 15.1.
Table 15.1 Judgement criteria and indicators for EQ11
Indicator Data requirement Information sources
Milk producers
Level and stability of income Evidence presented for EQ2, EQ3, EQ5 and EQ10.2
This report
Administrative burden Evidence presented in EQ9 This report Constraints on production choices
Evidence on cross compliance costs presented in EQ10.1
Impact of decoupling
This report
Constraints on expansion Future evolution of the quota scheme (Table 2.38, EQ9)
This report
Processors
Milk prices Product prices
Evidence presented in EQ2 and EQ5
This report
Stability of raw milk supplies Evidence presented in EQ1 This report
Consumers
Consumer price Reduction in support coming from consumers
Evidence on price transmission
EQ9
DG AGRI report on price transmission
‘Society’ (citizens, taxpayers etc)
Environmental sustainability Indicator(s) calculated for EQ10.2
This report
GHG emissions Dairy cow trends (EQ10.2) This report Cost of the CAP Evidence from EQ9 This report
Administrative costs of agricultural policies
Conclusion reached in EQ9 This report
New judgement criteria will not be used for each indicator separately. Instead, the judgement already
reached regarding the indicator when used earlier in the report will be carried over to this EQ. The
judgement criteria for assessing the overall impact on stakeholder need and problems involve
considering all the main changes in terms of their ability to meet stakeholder concerns, and drawing
conclusions from the picture that emerges.
117 However, it would still be within the scope of dairy policy to create incentives for producers to adopt production and feeding systems, dairy breeds, etc., that minimise these emissions, given the current state of our technological knowledge.
319
15.2 Milk producers
15.2.1 Level and stability of income
Evidence presented in EQ3 shows that trends in producer income have been maintained and that the
position of dairy farmers relative to other types of farming has not deteriorated.
As argued in EQ10.1 based on evidence from EQ2, EQ3 and EQ5, the post-2003 configuration of policy
measures revealed itself inadequate for shielding EU markets from the world market turbulence of 2007-
2008. Prices for raw milk and for dairy products in wholesale markets rose close to or at times above
world market price levels, and the volatility of these prices on a monthly basis was comparable with that
of world market prices. However, the increased share of direct payments in the income of farmers from
2004 onwards (fully achieved by 2007) meant that a smaller proportion of their income was vulnerable
to this volatility. Clearly, the ‘cushioning’ provided by direct payments was not enough to meet milk
producers’ expectations or to allay their fears, and they expressed their concerns very forcefully,
particularly during the sharp downturn in prices in 2009.. If a similar episode of high and volatile world
market prices should occur again, the same impacts are likely to be felt in the EU dairy sector.
15.2.2 Administrative burden
The administrative burden for milk producers due to the CAP has increased. This was to be expected,
given the way policies have been evolving (in particular, the shift away from price support and towards
targeted transfers to particular groups who have to justify their eligibility for payments and their
compliance with the payment conditions). This increase was confirmed by the producer survey (see
EQ9). Much of the perceived increase has been due to environmental restrictions (mainly associated with
cross compliance) and relatively little of it (according to respondents) from the payment mechanism
associated with the SPS/SAPS.
15.2.3 Constraints on production choices
The issue here is whether cross compliance places new constraints on production methods or
technologies. Producers were asked about the costs of cross compliance, and virtually all replies
concerned investment costs (adaptation of buildings, waste storage, animal eartags and so on) but
virtually nothing about costs of being obliged to produce in milk on a different way. A question asking
specifically about this potential effect was not directly asked in order to avoid any bias that may have
arisen by appearing to expect or solicit the reporting of such an effect. Instead, a more general and
open-ended question was asked about the “costs of cross compliance”, which allowed producers
themselves to identify the costs they had faced. In the replies given to this question, there was no
mention of constraints on production methods.
As regards constraints on the choice of what to produce, it is clear a priori that the decoupling of the
dairy premium removes a constraint on producers’ choices, as it is no longer necessary for them to hold
quota at the end of the current year in order to receive the payment. There was little evidence that this
acted as an incentive to quit dairying, although common sense suggests that if there are other reasons
for wanting to quit, the decoupling of the payment may facilitate the decision. There are also no signs
whatsoever that the decoupling has acted as an incentive for milk producers to continue to produce milk
but at a lower level, whilst diversifying into other commodities. On the contrary, all the signs are that
milk producers are still seeking economies of scale through herd-size expansion, and that the share of
milk coming from specialist dairy farms (i.e. those for whom more than two-thirds of their gross margin
comes from dairying) is increasing. However, it is also true that decoupling has removed a (potential)
constraint on producer choices that may be relevant for a minority of producers.
15.2.4 Constraints on expansion
Table 2.38 shows the planned levels of national quota ceilings up to abolition in 2015. It shows that
already (since 2008) quota ceilings are higher and that across the EU quota will become even more
available before 2015. In 2010, all but two Member States had delivery levels below their national
320
ceilings, indicating that at national levels for that year, quota availability was no longer a constraint on
production. Despite this development, even in 2009/2010, there was still a small price for quota
purchase (see Table 13.9) by producers not wanting to face the risk of having to pay the superlevy when
expanding production. Overall, however, many producers in different parts of the EU are already
operating without an effective quota constraint, as a result of the changes decided in the 2003 dairy
policy reform or subsequently.
15.3 Processors
15.3.1 Milk prices
The switch of some producer income support out of the milk price and its replacement by a direct
payment has undoubtedly lowered the price that processors need to pay for raw milk, ceteris paribus.
Figure 6.1 shows that the underlying trend in milk price between 2004 and 2006 was indeed downwards
(following the phased reductions in intervention prices). In the following period (2007-9), price levels
and movements were severely disrupted by market instability. However, one can expect that the
advantage to processors of lower milk prices will persist in more normal conditions. This observation was
made by some of the respondents to the processor survey.
15.3.2 Product prices
Product prices were expected to be affected in a downward direction by the lowering of intervention
prices. This has turned out to be the case for butter (see Figure 9.1). However, the price of the other
intervention product, SMP, remained rather steady during 2004-2006, as did that of WMP which often
serves as an alternative on the production side to butter and SMP (see Figures 9.3 and 9.5). In the case
of cheddar cheese (chosen as a representative cheese), prices did fall slightly during 2004-2006. It
should be noted that between 2003 and 2006, there was a noticeable decline in expenditure on cheese
export refunds (see Figure 13.3), which could explain the slightly declining internal price.
15.3.3 Availability and stability of raw milk supply
In principle, the dairy policy changes under review should improve the availability of raw milk for
processing, for the same reasons given in section 15.2.4 above. Of course, whether this occurs will
depend on the milk price and whether it is high enough to keep production at current levels and to
encourage producers to expand further when they are no longer constrained by quota. If this does not
happen (indeed, some models suggest that after quota abolition prices may fall low enough that the
production increase will be quite limited118), then local shortages could develop. Recent discussions have
focussed on a possible imbalance of bargaining power between producers and milk processors in various
EU Member States. To the extent that this occurs, the milk price may be forced below its level would be
in competitive conditions, and both market and policy signals received by producers are distorted. As the
sector becomes more market-oriented, the role played by price becomes more important, so that if
processors find they are facing a tight market for raw milk supplies, they will have to use price increases
to secure the supplies they need.
Regarding stability of supply, the recent reduction in supply in some Member States has prompted the
question as to whether they are ‘cyclical’ variations or one-off, irreversible reactions to the combination
of policy changes and market turbulence of recent years. In general, it can be expected that, as
constraints are removed and the dairy sector becomes more market-oriented, total supply becomes less
predictable than it was before the 2003 reforms. Here again, processors can make greater use of proven
mechanisms (such as long-term contracts) to remedy the situation. A potential concern is that if market
power is unequally distributed between processors and producers, the terms of such contracts may be
unfavourable to producers. It is therefore important that forms of contract are used that preserve
producers’ access to a share of any income gain due to higher prices in product markets in return for
bearing the risk of loss from variability of milk production conditions.
118 See for example Witzke and Tonini, 2008.

321
In general, given the nature of the production processes involved and the specificity of the investments
in milk production, large year-on-year variations in supply are very unlikely. It is interesting to note that
respondents to the processors’ survey did not consider that any of the policy changes relating directly to
dairy farmers would impact on stability of supply.
15.4 Consumers
15.4.1 Consumer price
Since the dairy policy measures under review do not directly target consumer markets, none of the
indicators used for other EQs can shed light directly on the extent to which the 2003 reforms have
responded to the consumer’s wish for reasonable product prices. What has been established is that some
income support has been shifted out of wholesale product prices into direct payments by reducing the
support to intervention products (this was called in EQ9 a reduction in the ‘consumer transfer’).
However, it is not guaranteed that the lower wholesale price was transmitted to the price paid by final
consumers.
A recent study119 of price transmission along the supply chains for a number of food products in some
Member States concludes that the dairy supply chain is one of the cases where price transmission works
least well. Among the conclusions of this report is the finding of “asymmetric behaviour across the dairy
chain where dairy consumer prices have been fast to increase, but slow to decline in the wake of the
sharp drop in milk producer prices (e.g. Slovenia, United Kingdom, Denmark, Lithuania). Furthermore
(this) price transmission pattern in the dairy sector has significantly strengthened since the commodity
price surge in 2007” (p.56). Moreover, for some dairy products, the typical delay between a fall in milk
price and a downward reaction of consumer price could be 12 months, and tends to be longer in the EU-
12 countries examined than for the EU-15 countries considered.
It is an integral part of the objective to improve market orientation that all segments of the chain should
share in the benefit from the resulting efficiency gains. In fact, it is inconsistent with the principle of
market orientation that price transmission between any particular segments of the chain should be
impeded.
This is an unresolved issue where not only more empirical analysis is needed but also more attention to
effective policy design. To understand and measure the extent of price transmission (in either direction)
along the entire length of the supply chain between primary producer and final consumer requires a
perspective that embraces the whole chain. Such a whole-chain perspective is also needed in order to
formulate appropriate policies about price transmission or to make recommendations for ensuring its
smooth functioning. Given that price transmission along the supply chain is not part of the remit of CAP
dairy policy, this issue is not directly addressed in the present evaluation study. However, in this
evaluation question, where the relevance of EU dairy policy to the main stakeholder groups in society is
under discussion, it is very important to point out that price transmission is one of the two crucial links
between policies targeting the milk-producing sector (both as regards their objectives and the
instruments used) and the interests of consumers.120 If price transmission is not working well, two
negative consequences of direct relevance to this evaluation may arise. First, instruments that operate at
intermediate stages in the chain downstream from milk producers (such as the intervention system) but
which are intended to affect outcomes in the milk-producing sector may be prevented from achieving
their aims. This issue has already been discussed in Chapters 4 and 6. Second, consumers may not
benefit from efforts to achieve greater efficiency in milk production, whether these efforts are market- or
policy-driven.
119 European Commission (2009). Analysis of price transmission along the food supply chain in the EU. Commission Staff Working Document, SEC(2009) 1450. 120 The other link concerns product quality, and the preservation of its integrity, as regulated at the raw milk stage, along the entire chain to consumers. Quality issues are not the focus of this evaluation, and it assumed throughout that this aspect of consumer concerns presents no issues product quality

322
15.5 Society
15.5.1 Environmental sustainability
In EQ10.2, several indicators relating to the incentives for environmental sustainability provided by CAP
dairy measures were assembled. A priori, when some income support is shifted from price (which means
total income support is less dependent on the quantity produced) and is paid as a guaranteed fixed
amount, this should lessen the incentive to push for yield increases and to intensify the use of fixed
resources (cows, land, labour). Nevertheless, the evidence reviewed suggests that the policy changes
have not lessened the incentive to produce more intensively in EU-15 Member States, and that there was
a risk of increasing environmental problems in areas where dairying becomes more concentrated. At the
same time, cross compliance requirements and the relatively high participation rate of dairy farmers in
agri-environmental schemes may help to off-set any potential environmental degradation that might
occur because of greater intensification.
15.5.2 GHG emissions
In contrast to the general concern about resource use and the environment, EQ10.2 concluded that
although the level of milk output has remained relatively constant, emissions of methane per tonne of
milk produced have fallen thanks to the on-going decline in the number of dairy cows in EU27. This is
largely due to the secular increase in milk yields. Establishing a link between this trend and the 2003
policy reform would involve demonstrating a link between the new policy signals, a growth in the share
of milk coming from specialist dairy farms (where milk yields are higher) and the rather small increase in
the rate of decline of dairy cows since 2003. As already demonstrated in earlier chapters, the empirical
evidence supporting this causal chain is weak.
15.5.3 Cost of the CAP
The evidence presented in EQ9 shows that the total cost to society of dairy support has been falling, and
this is true even when the decoupled ‘ex-dairy premium’ (now part of the SFP) is also included in the
calculation. However, the conclusion relies on the savings in the ‘consumer transfer’ component of total
cost being acknowledged, and for this fall to be shared widely across social groups it requires that
consumers should benefit from the market price reductions for dairy products at the wholesale level. In
order for the wider societal benefit of the 2003 dairy reform to be appreciated, not only does the shift
from more costly support (in social terms) via the market to more efficient support via direct payments
need to be explained to the wider public, but more importantly the lower prices on which this benefit
rests actually have to reach final milk consumers. This point is closely linked to the argument presented
in 15.4.1.
15.5.4 Administrative costs of agricultural policy
Examination of the cost of public administration relating to dairy policy in EQ9 was based on the
experience of only two Member States121, and therefore had to remain inconclusive as regards the EU as
a whole. In the two cases examined, the tentative conclusion was reached that public administrative
savings through the simplification of policies and their implementation had been delivered by the 2003
reforms. However, other stakeholder groups (farmers, milk processors) also bear part of the policy
implementation cost in the form of (unpaid) administrative tasks. The milk producer survey found that
farmers perceived the administration burden of dairy policy to have increased since 2003, whereas the
perception of milk processors was mixed depending on the type of marketing activities (e.g. exporting or
producing solely for the domestic market) or product mix (e.g. focus on basic (intervention) products, or
on PDO cheese) undertaken by the firm.
The difficulty experienced by the evaluation team in finding more extensive hard evidence on public
administration costs of these policies is symptomatic of the lack of transparency surrounding this item of
121 The relevant administrations in Member States where case studies were performed were contacted with the request to provide information on administration costs. Despite follow-up approaches, only two Members States provided information that could be used to address this part of the evaluation question.

323
policy cost. Unfortunately, this lack of transparency can provide fertile ground for the propagation of
unrepresentative anecdotes alleging administrative inefficiency in implementing CAP procedures, which
may lead to a perception of inefficiency that is largely unfounded. The general public (taxpayer and
citizen), as well as the image of the CAP, would benefit from more transparency and more rigorous
measurement of administrative costs than seems to exist at present.
15.6 Conclusions
Table 15.2 gives a summary of the points raised in this section. The scoring conventions used are those
adopted for Table 14.11 in EQ10.2. The scores and the density of the remarks in the table suggest that
milk producers and society at large are the two groups most affected by CAP dairy measures. However, it
needs to be borne in mind that for society, what happens in the EU dairy sector is just one of many other
pressing and not so pressing concerns, whereas for milk producers it is an important factor in
determining their livelihood, the future for their families, the way they spend their working time, and is
clearly of utmost importance to them.
Table 15.2 Summary of CAP dairy policy measures according to how their outcomes have responded to stakeholder concerns
Stakeholder Group
Policy change Milk producers Processors Consumers S ociety
Package of changes involved in switching from market price support to a decoupled payment (including lower prices and more visible support through budget payments)
+++ (income levels
maintained)
++ (more flexible
production choices without losing
support entitlement)
+ (lower prices for raw milk, but also potentially lower
prices for processed products)
++ (potentially lower
prices, BUT receiving them
depends on price transmission along
the chain)
+++ (the package is more efficient)
- (cost becomes
more visible as a budget item and
hence needs to be properly explained)
Introduction of cross compliance requirements for milk producers
- - (investment costs,
greater administrative
burden)
0
0
++ (makes dairying
more environment-ally friendly, helps to gain support for
the CAP among the wider public)
Gradual increase and then abolition of quotas
++ (more scope for expansion, scale
economies)
+
(more abundant milk supplies)
0
? (fear of negative
environmental consequences,
disappearance of dairy farming in mountain areas/
family farms)
Reduction of intervention to a safety net
- - (greater risk of price instability)
- (greater risk of price instability)
0
+ (large intervention stocks often seen
negatively by society)
Simplification of policies
- Milk producers
perceive greater complexity rather than simplification
+ (depends on the
type of activities of the company)
0
?
Difficult to obtain a balanced picture,
more transparency needed
Key: ---, --, and – indicate that the outcome has been contrary to one or more of the concerns of a particular stakeholder group, with the number ‘–‘s indicating the degree to which this has occurred; 0 indicates that the outcome of the particular measure has been largely unrelated to the concerns of the corresponding stakeholder group; +, ++, +++ indicate that the outcome has been met or been supportive of one or more concern of the stakeholder group. ‘?’ indicates that conflicting tendencies, or insufficient evidence to conclude.

324
Consumers are the stakeholder group with the fewest impact items, and yet the one issue registered for
them (price falls and their transmission to final consumers) is crucial. Milk and dairy products are
consumed daily by most people, and the expenditure of a typical family on dairy products over the year
is significant. Although all the stakeholder groups score at least one ‘+’ in the first row of the table
(switch in delivery mechanism of income support), this element of the policy package can only be
considered an unqualified success if the benefit of the increased efficiency reaches consumers at the end
of the chain.

325
16 Conclusions and recommendations
The evaluation examines the effectiveness, efficiency and relevance in relation to their objectives of CAP
measures applied to the dairy sector since the 2003 CAP reform. The main conclusions, organised by
objective, by evaluation question and by instrument (with respect to effectiveness) are presented below.
More details can be found in the conclusions provided at the end of each chapter. Recommendations are
made at the end of this chapter.
16.1 Conclusions with respect to policy objectives
The policy objectives of the CAP on milk and dairy products are summarised as: (1) market performance
(market balance and market stability), (2) producer income, (3) competitiveness and market orientation,
(4) structures and structural change, (5) policy simplification, and (6) other objectives (environmental
standards, product quality, maintenance of rural areas, rural employment). Table 16.1 provides an
overview of the impact the 2003 CAP reform on those objectives.
Table 16.1 Summary of findings with respect to the policy objectives
Policy objective Result achieved
1 Market performance
1a Market balance • Domestic supply became more responsive to milk prices
• The structural excess supply of both milk and dairy
products declined from 2004 onwards. This can be
attributed to the shift of income support from price to
direct payments, the reduction in intervention for butter
and skim milk powder and the abolition of the target price
for milk
1b Prices and price stability • Prices for dairy products stayed relatively stable during
2003-2006, with the exception of the butter price, which
started to decline after 2004
• The raw milk price declined during 2003-2006, following
(less steeply) the decline in intervention prices.
• The high prices in world dairy markets during 2007-2008
led to elimination of the price gap
• The increasing turbulence of world market prices during
2007-2009 increased the volatility of EU milk and dairy
prices
• The traditional stabilisation measures (export refunds and
intervention buying) are no longer operational when the
EU internal prices converge with the world market prices,
and in this context, ensuring price stability is more difficult
• The scaled-down intervention system, with its basic
structure designed to cope with seasonal imbalances, did
not act sufficiently quickly or effectively as a safety net
during the period late-2008 to late-2009, despite extra
measures adopted during 2009
2 Producer income • Milk producer income has been maintained and continues
to follow its longer run trend
• The profitability of dairying relative to other commodity
sectors has developed favourably
Table continues on next page
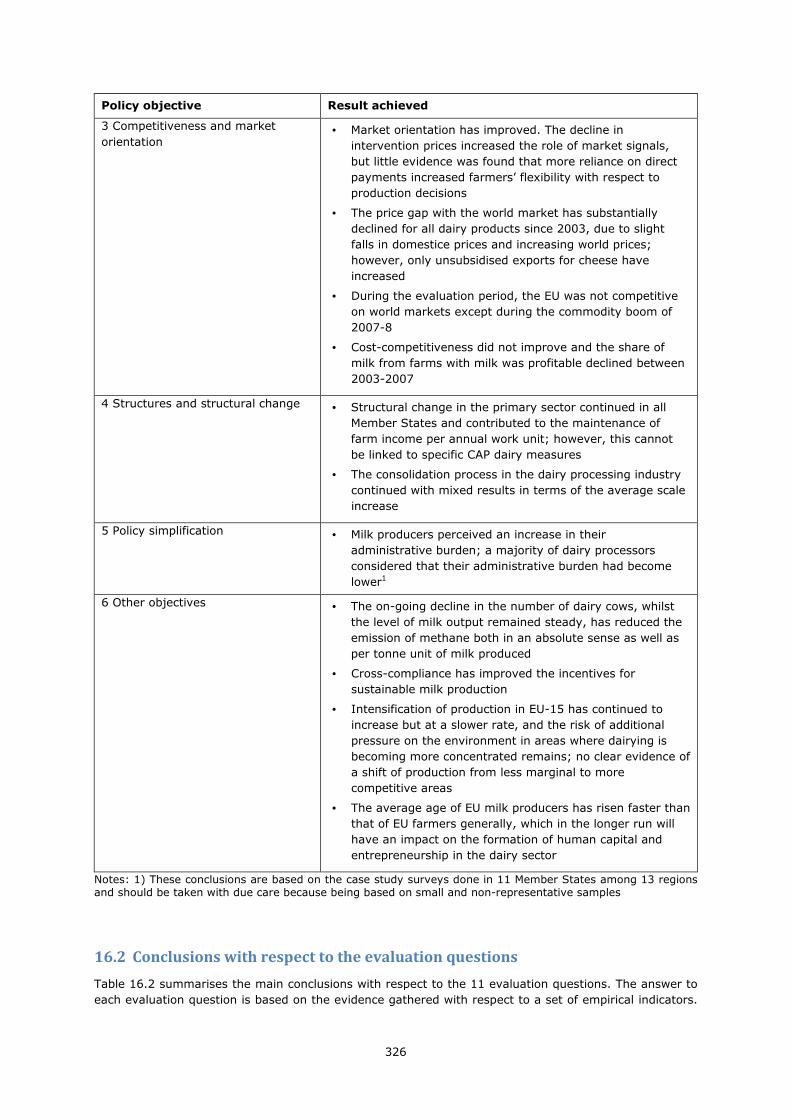
326
Policy objective Result achieved
3 Competitiveness and market
orientation • Market orientation has improved. The decline in
intervention prices increased the role of market signals,
but little evidence was found that more reliance on direct
payments increased farmers’ flexibility with respect to
production decisions
• The price gap with the world market has substantially
declined for all dairy products since 2003, due to slight
falls in domestice prices and increasing world prices;
however, only unsubsidised exports for cheese have
increased
• During the evaluation period, the EU was not competitive
on world markets except during the commodity boom of
2007-8
• Cost-competitiveness did not improve and the share of
milk from farms with milk was profitable declined between
2003-2007
4 Structures and structural change • Structural change in the primary sector continued in all
Member States and contributed to the maintenance of
farm income per annual work unit; however, this cannot
be linked to specific CAP dairy measures
• The consolidation process in the dairy processing industry
continued with mixed results in terms of the average scale
increase
5 Policy simplification • Milk producers perceived an increase in their
administrative burden; a majority of dairy processors
considered that their administrative burden had become
lower1
6 Other objectives • The on-going decline in the number of dairy cows, whilst
the level of milk output remained steady, has reduced the
emission of methane both in an absolute sense as well as
per tonne unit of milk produced
• Cross-compliance has improved the incentives for
sustainable milk production
• Intensification of production in EU-15 has continued to
increase but at a slower rate, and the risk of additional
pressure on the environment in areas where dairying is
becoming more concentrated remains; no clear evidence of
a shift of production from less marginal to more
competitive areas
• The average age of EU milk producers has risen faster than
that of EU farmers generally, which in the longer run will
have an impact on the formation of human capital and
entrepreneurship in the dairy sector
Notes: 1) These conclusions are based on the case study surveys done in 11 Member States among 13 regions and should be taken with due care because being based on small and non-representative samples
16.2 Conclusions with respect to the evaluation questions
Table 16.2 summarises the main conclusions with respect to the 11 evaluation questions. The answer to
each evaluation question is based on the evidence gathered with respect to a set of empirical indicators.
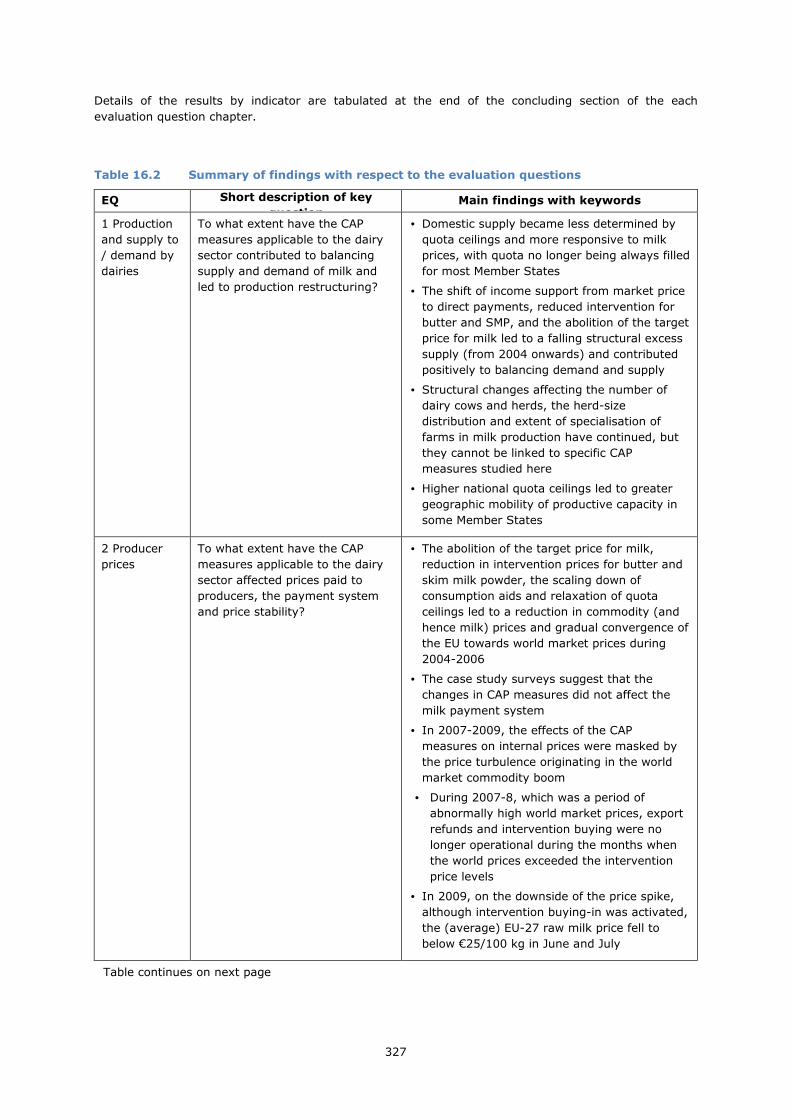
327
Details of the results by indicator are tabulated at the end of the concluding section of the each
evaluation question chapter.
Table 16.2 Summary of findings with respect to the evaluation questions
EQ Short description of key
question Main findings with keywords
1 Production
and supply to
/ demand by
dairies
To what extent have the CAP
measures applicable to the dairy
sector contributed to balancing
supply and demand of milk and
led to production restructuring?
• Domestic supply became less determined by
quota ceilings and more responsive to milk
prices, with quota no longer being always filled
for most Member States
• The shift of income support from market price
to direct payments, reduced intervention for
butter and SMP, and the abolition of the target
price for milk led to a falling structural excess
supply (from 2004 onwards) and contributed
positively to balancing demand and supply
• Structural changes affecting the number of
dairy cows and herds, the herd-size
distribution and extent of specialisation of
farms in milk production have continued, but
they cannot be linked to specific CAP
measures studied here
• Higher national quota ceilings led to greater
geographic mobility of productive capacity in
some Member States
2 Producer
prices
To what extent have the CAP
measures applicable to the dairy
sector affected prices paid to
producers, the payment system
and price stability?
• The abolition of the target price for milk,
reduction in intervention prices for butter and
skim milk powder, the scaling down of
consumption aids and relaxation of quota
ceilings led to a reduction in commodity (and
hence milk) prices and gradual convergence of
the EU towards world market prices during
2004-2006
• The case study surveys suggest that the
changes in CAP measures did not affect the
milk payment system
• In 2007-2009, the effects of the CAP
measures on internal prices were masked by
the price turbulence originating in the world
market commodity boom
• During 2007-8, which was a period of
abnormally high world market prices, export
refunds and intervention buying were no
longer operational during the months when
the world prices exceeded the intervention
price levels
• In 2009, on the downside of the price spike,
although intervention buying-in was activated,
the (average) EU-27 raw milk price fell to
below €25/100 kg in June and July
Table continues on next page
328
EQ Short description of key
question Main findings with keywords
3 Producer’s
income
To what extent have the CAP
measures applicable to the dairy
sector contributed to maintaining
/ increasing the farmers’ income?
� Trends in dairy farm income, measured by
FNVA/AWU, was maintained
� The profitability of dairying relative to other
commodity sectors was maintained
� Maintenance of dairy incomes despite lower
institutional prices is largely due to the role of
direct payments
� Structural change (farm size expansion) was
also a positive factor contributing to dairy
farmers’ income
4 Producer’s
competitivene
ss and market
orientation
To what extent have the CAP
measures applicable to the dairy
sector contributed to increasing
farmers’ market orientation and
competitiveness?
� Market orientation improved due a reduction
in the price gap between the EU and world
markets, weaker quota constraints and hence
stronger supply response to price signals
� Cost-competitiveness did not improve, and the
share of milk from ‘profitable’ milk enterprises
declined after 2003 until the sharp price
increase in 2007
5 Prices of
milk products
To what extent have the CAP
measures applicable to the dairy
sector contributed to stabilising
the market prices for milk
products?
� EU dairy product prices remained stable until
2006 due to export refunds and public
intervention
� Volatility increased after 2007 due to a
commodity boom on world markets
6 Market
balance
To what extent have the CAP
measures applicable to the dairy
sector contributed to balancing
supply and demand for milk
products?
� Structural excess supply declined for the main
dairy products after 2003
� The main factor driving these falls was an
increase in unsubsidised demand
� Because of the absence of lower product
prices (apart from weak evidence regarding
butter), only a limited impact of policy
changes could be identified
7 Structure of
processing
industry
To what extent have the CAP
measures applicable to the dairy
sector influenced structural
changes in the processing sector?
� No strong conclusions could be drawn with
respect to policy impacts
� Concentration and consolidation of firms
increased in some Member States
8
Competitive-
ness on
international
markets
To what extent have the CAP
measures applicable to the dairy
sector contributed to improved
competitiveness of milk products
on international markets?
� Price gap relative to the world market declined
due to lower intervention prices for butter and
SMP, and increasing world market prices
� The volume of unsubsidised exports of cheese
increased (this holds in particular for quality
and PDO/PDI cheeses)
� During the evaluation period, the EU was not
competitive at world market prices for all
products, but for some products its
competitiveness has improved
Table continues on next page

329
EQ Short description of key
question Main findings with keywords
9 Efficiency To what extent have the CAP
measures applied to the dairy
sector been efficient with respect
to their objectives?
� Efficiency has generally increased
� The total cost of dairy support policy declined
whilst market balance improved and producer
income levels were maintained
� Market orientation and sector structure
improved without any related increase in
policy costs
� There was no marked change in the
competitiveness of milk or dairy products
� Dairy production became more sustainable but
at an additional cost
� Price stability deteriorated, largely due to
external factors, whereas costs of intervention
and export refunds declined
10.1
Coherence -
Rural
Development
Programmes
To what extent have the CAP
measures applicable to the dairy
sector been coherent with the
rural development measures and
the national aid granted in
accordance with relevant EU rules
stated?
� Good degree of coherence between the CAP
dairy measures, and rural development
measures and state aids
� Pillar 1, RDP and national aid measures
operate at different levels and scales, giving
them a complementary character
� Several synergies and one source of potential
conflict between CAP dairy measures and RDP
objectives were identified
10.2
Coherence –
Overall CAP
objectives
To what extent have the CAP
measures applicable to the dairy
sector been coherent with the
overall concepts and principles of
the 2003 reform of the CAP?
� A high degree of coherence was found ex post
� Market orientation and competitiveness
improved to an extent
� Income support was maintained at pre-2003
levels and income trends continued unchanged
post-2003
� Environmental sustainability increased
� Socio-economic sustainability in question due
to a fall in the rate of entry of young dairy
farmers
11 Relevance To what extent have the CAP
measures applicable to the dairy
sector been relevant with respect
to the needs and problems of
farmers, processors and
consumers?
� Milk producers’ concerns over income,
production flexibility and expansion are met,
but at the cost of a heavier administrative
burden and more exposure to price risk
� Processors also face more price and market
risk
� Society benefits from increased efficiency, and
more focus on environmental sustainability
� Consumers face potentially lower product
prices, but this benefit is conditional on the
transmission lower milk prices along the
supply chain
16.3 Conclusions with respect to the effectiveness of the instruments
The instruments of CAP dairy policy typically affect more than one objective, and in many cases more
than one objective is affected by the same instrument. The examination of the effectiveness of these

330
measures as presented in the evaluation questions is structured by target area (producer incomes, price
stability) rather than by instrument. Consequently, a number of instruments appear in more than one
evaluation question and their effectiveness in each evaluation question tends to be examined with
respect to only one of their multiple impacts. Table 16.3 reassembles the evidence on instrument
effectiveness instrument by instrument, and for some of them attempts to reach an overall assessment
of how effective they have been. The ‘average score’ is a subjective assessment based on the distribution
of the scores reported for each objective of the corresponding instrument.
Table 16.3 Summary of instrument effectiveness
Instruments Expected effects Evidence Success (scale 0 - √√√√√√√√√√√√)
Milk quota system and modifications to it
Market balance EQ1a √√√
Greater confidence for processors (stability of supply, investment
decisions etc)
EQ7 √√
Relaxation of quota limits improves market orientation
EQ4 √
Average score √√√√√√√√
Unintended side-effects
Impedes structural change
Creates winners and losers from quota trading in periods of policy
transition
Investigated in EQ1b
Investigated in EQ9
Not found
Some evidence found
Public intervention measures for butter and skimmed milk powder and changes thereto
Use of intervention stocking → milk price stabilisation
EQ2 √√
(as long as intervention prices are higher than world market prices for butter and
SMP and there is good price transmission from
processors to producers)
Use of intervention stocking → dairy product price stabilisation
EQ5 √√
( as long as intervention prices are higher than world market prices for butter and
SMP)
Lower intervention prices → lower milk price
EQ2 √√√
Lower milk price → reduction of structural surplus
EQ1, EQ6 √√√
Lower milk price → improvement in international competitiveness
EQ4, EQ8 √
Average score √√√√√√√√
Unintended consequence
Lower safety-net increases the probability of periods of high volatility
transmission from world market to domestic prices
EQ2, EQ5, EQ9
Strong evidence found
Table continues on the next page

331
Instruments Expected effects Evidence Success (scale 0 - √√√√√√√√√√√√)
Mandatory and optional aid for private storage for butter, skimmed milk powder and cheese
Private storage → market stabilisation
EQ4, EQ5 0
Deadweight
Impacts would have happened anyway
EQ9 Evidence found
Disposal aids for butter and cream, SMP (manufacturing, persons, animal feed)
Well targeted to disposing of the surplus?
EQ1, EQ6, EQ9 √√
Licence system, tariff rate quotas, import duties and export refunds
Export refunds as disposal mechanism for surpluses
EQ1a, EQ6 √√√
Export refunds as an instrument for price stabilisation of
Dairy products
Raw milk
EQ2, EQ5 √√√
(as long as intervention prices are higher than world market prices for butter and SMP and (for raw milk) there
is good price transmission from processors to
producers)
Tariffs and tariff rate quotas as a precondition for maintaining higher
domestic price
EQ2
√√√
Export refunds as means of improving international
competitiveness
EQ4 √√
Export refunds as a price stabilising mechanism EQ2, EQ5
√√√
(providing domestic prices > world market prices)
Average score √√√√√√√√
Single Payment Scheme (SPS) and Single Area Payment Scheme (SAPS) (with respect to beneficiaries in the dairy sector)
Effectiveness in maintaining producers incomes despite the
lowering of the milk price
EQ3, EQ9
√√√
Dairy premium and additional payment
Effectiveness in compensating producers for the milk price reduction
EQ9 √√√
Effect on structural change and the exit rate
EQ1b √
(not included in the average score)
Improved market orientation EQ4 √
Average score √√√√√√√√
Additional payments granted in the framework of Art. 69 of Council Regulation 1782/2003 and Art. 68 of Council Regulation 73/2009
Allocation by MS to the dairy sector EQ10 Art 69 (only one MS), Art 68 (two MS)
Uptake by producers EQ10 Partial evidence of strong uptake
Effectiveness in attaining specific objectives at MS level
Not assessed

332
The in-depth evaluation of the policy changes has focused extensively on those measures that were
introduced for the first time, or significantly adapted, in the 2003 reform and subsequent regulations.
Since there have been no fundamental changes in trade policies during the evaluation period, relatively
little analysis has been made of the performance of these measures. Only the role of export refunds for
disposing of structural excess supply and stabilising internal prices has been well documented. However,
the role of the full set of border measures (tariffs, licenses, tariff rate quotas and export refunds) should
not be underestimated. The successful switch of some price support into direct income support was
achieved in a context of insulation against import competition by means of tariffs and TRQs. A future
Doha Round agreement can be expected to reduce this insulation significantly.
Export refunds were suspended during the high-price period 2007-8, but resumed during some months
of 2009 with the re-emergence of structural excess supply. This also contributed to redressing the price
slump on internal markets. However, with a future Doha Round Agreement, export refunds will also
probably be abolished.
It is clear that the protection afforded by trade measures has provided a relatively stable and protected
space that has facilitated the implementation of significant reforms and the sector’s adjustment to them.
A WTO Doha Round agreement would imply less border protection. This in turn would create new internal
conditions that could prove to be less conducive to the orderly implementation of further reforms, but
where further reforms might become more necessary.
16.4 Recommendations
It is assumed the EU will continue to pursue the same policy objectives as those that motivated the
policy changes reviewed, and to maintain those measures that were found to have had some success in
promoting these objectives. The recommendations made below are based on conclusions drawn from this
evaluation regarding gaps or inadequacies in the current set of policy measures.
1. In a rapidly changing global market context with shocks potentially occurring in any period of the
year, intervention price levels, buying-in periods and ceilings set some years previously in a multi-
annual framework and on the assumption of internally generated (seasonal) price movements are
not necessarily able to provide an effective year-round safety net. In order to operate a safety net
that is relevant for a more market-oriented sector facing greater exogenously produced price
volatility, a more flexible safety net is required. To this end, we recommend the adoption of
more flexible intervention mechanisms so that they can respond more quickly at any time
of the year to sharp falls in market price reaching abnormally low levels.
2. Under the reformed CAP, the probability of fluctuating prices has significantly increased. Price
volatility above a certain level creates uncertainty in the market, which inhibits investment, and
hampers market orientation, as farmers can no longer appropriately distinguish ‘noise’ from changes
in underlying market fundamentals. Therefore, it is recommended that private or public risk
management tools for farmers (individually or collectively) are facilitated and/or
developed that aim to enable farmers to cope with higher levels of market price volatility,
so as to counteract its negative effects on sector performance.
3. The effective operation of the EU’s dairy policy with respect to its objectives relies heavily on
backward price transmission in the dairy supply chain. A better balance of market power between
the various actors along the supply chain, particularly between milk producers and processors, is
likely to become more important with the abolition of the quota scheme. Therefore, it is
recommended that the available options for redressing power imbalances in bargaining
power be actively studied. To counteract market power imbalances, several options can be
envisaged. They include creating countervailing power (within the limits allowed by competition
policy), legislating for more competitive behaviour in the price formation process within the chain, or
restricting the build-up of market power concentration at local and national level downstream in the
supply chain using new legislation to safeguard competition in the vertical dimension.

333
References
Agra Europe (2010a). Milk products. Newsletter, various issues, Kent: Agra Informa Ltd Tunbridge Wells.
Agra Europe (2010b). Preserved milk. Newsletter, various issues, Kent: Agra Informa Ltd Tunbridge
Wells.
Alvarez, A. and C. Arias (2003). Diseconomies of Size with Fixed Managerial Ability. American Journal of
Agricultural Economics 85 (1): 134–142.
Baldock, D., J. Bartley, A. Burrell, D. Colman, K. Hart, P. Pointereau, and P. Silcock (2008). Evaluation of
the Environmental Impact of Milk Quotas. Study prepared by IEEP for the European Commission, DG
AGRI (contract N°30-CE-0067379/00-89, AGRI-2006-0040).
Bouamra Mechemache, Z. and V. Réquillart (2000). Analysis of the EU dairy policy reform. European
Review of Agricultural Economics 27 (4): 409-430.
Bouamra-Mechemache, Z., R. Jongeneel and V. Réquillart (2008). Impact of a gradual increase in milk
quotas on the EU dairy sector. European Review of Agricultural Economics 35 (4): 461-491.
Burrell, A. (1990). Les coûts de production laitière au Royaume Uni. Economie Rurale, 195: 21-26.
Burrell, A. (1997). Economic Aspects of Milk Production in the European Union. EUROSTAT. Luxembourg.
Burrell, A. (2004). The 2003 CAP reform: Implications for the EU dairy sector. Outlook on Agriculture 33
(1): 15-25.
CEAS (2000). The Environmental Impact of Dairy Production in the EU: Practical Options for the
Improvement of the Environmental Impact: Final Report. CEAS 1779/BDB. Centre for European
Agricultural Studies (Wye, UK) and the European Forum on Nature Conservation and Pastoralism.
http://ec.europa.eu/environment/agriculture/pdf/dairy.pdf, 11/2010.
Colman, D., M. Burton, D. Rigby and J. Franks (2002). Structural change and policy reform in the UK
dairy sector. Journal of Agricultural Economics 53 (3): 645–663.
COMTRADE (various years): United Nations Commodity Trade Database. United Nations.
DG AGRI (various years). Agriculture in the EU, Statistical and Economic Information Report various
years. Directorate-General, Agriculture and Rural Development, European Commission, European Union,
Brussels.
DG AGRI (2006). Handbook on Common Monitoring and Evaluation Framework Guidance Document.
Directorate-General Agriculture and Rural Development, European Commission, European Union,
Brussels. http://ec.europa.eu/ agriculture/rurdev/eval/guidance/document_en.pdf, 05/2011.
DG AGRI (2011). Oral information on calculating the raw milk equivalent price. Directorate-General,
Agriculture and Rural Development, European Commission, European Union, Brussels.
DG AGRI (unpublished). Information on budget expenditure and export subsidies. Directorate-General,
Agriculture and Rural Development, European Commission, European Union, Brussels.
DG AGRI AgriView (various years). EU market prices for representative products. Directorate-General
Agriculture and Rural Development, European Commission, European Union, Brussels.
http://ec.europa.eu/ agriculture/markets/prices/eu_market_prices_for_representative_products_en.pdf,
05/2011.
DG BUDG (various years). EU budget. Directorate-General for Budget, European Commission, European
Union, Brussels.
334
Elbersen, B and R. Jongeneel (eds.) (2010). Final report of CCAT project results (Deliverable 2.8).
ALTERRA-WUR. Wageningen. http://www.ccat.wur.nl/NR/rdonlyres/14A64131-DD4E-46FD953E986DDD
B2AEC1/113043/D2_8_Final_ report_V5_compr.pdf, 03/2011.
EU-FADN (various years). Farm Accountancy Data Network, Database. Directorate-General, Agriculture
and Rural Development, European Commission, European Union, Brussels.
European Commission (2004). Evaluating EU Activities: A Practical Guide for the Commission Services.
Directorate-General for Budget, European Union, Brussels. http://ec.europa.eu/dgs/secretariat_general
/evaluation/docs/eval_activities_en.pdf, 05/2011.
European Commission (2006). EC External Services Evaluation Unit, Outcome and Impact Level
Intervention Logic & Indicators: Methodological Approach. Directorate-General Development and
Cooperation – EuropeAid, European Union, Brussels. http://ec.europa.eu/europeaid/evaluation/
methodology/methods/mth_log_en.htm, 05/2011.
European Commission (2008). Milk sector –(5) Impact on milk margins of a price reduction;
Complements on national aids. Unit on Microeconomic analysis of EU agricultural holdings, Directorate-
General Agriculture and Rural Development, European Union, Brussels.
European Commission (2009a). Contractual relations between milk producers and dairies – Summary of
contributions and tentative conclusions. MK D(2009), Directorate-General Agriculture and Rural
Development, European Union, Brussels. http://ec.europa.eu/agriculture/markets/milk/hlg/com2_ms_
contrib_contract_en.pdf, 05/2011.
European Commission (2009b). Analysis of price transmission along the food supply chain in the EU.
Commission staff working document SEC(2009) 1450, European Union, Brussels. http://ec.europa.eu/
economy_finance /publications/publication16067_en.pdf, 05/2011.
European Commission (2010a). Report from the European Commission and the European Parliament and
the Council: Evolution of the Market Situation and the Consequent Conditions for Smoothly Phasing Out
the Milk Quota. COM (2010) 727 final. European Union, Brussels.
European Commission (2010b). EU dairy farms report 2010 based on FADN data. Unit L3 D(2010).
Directorate L. Economic analysis perspectives and evaluations, Directorate-General Agriculture and Rural
Development, European Union, Brussels. http://ec.europa.eu/agriculture/rica/pdf/dairy_report_2010.pdf,
05/2011.
European Commission (2010c). Register of State Aid Cases. Directorate-General Competition, European
Union, Brussels. http://ec.europa.eu/competition/state_aid/register/, 05/2011.
Eurostat (various years). Database on Agricultural Statistics, Milk and Milk Products.
http://epp.eurostat.ec.europa.eu/portal/page/portal/agriculture/data/database, 05/2011.
Eurostat FSS (various years). Farm Structure Survey Statistics. Eurostat.
FAPRI (2011). World Agricultural Outlook. Food and Agricultural Research Institute, Iowa State
University, Iowa.
FAO (2010). Greenhouse gas emissions from the dairy sector: A life cycle assessment. FAO, Animal
Production and Health Division, Rome.
Hanf, C. H. (1989). The impact of milk quotas on milk production and milk processing in Germany: some
selected aspects. In Burrell, A. (ed.), Milk Quotas in the European Community. CAB International: 75-88.
Hennessy, D.A. (1995). Quotas, Alternative Technologies and Immiserisation. Canadian Journal of
Agricultural Economics 43: 203-208.
Holt, M. T. and S. V. Aradhyula (1990). Price Risk in Supply Equations: An Application of GARCH Time-
Series Models to the US Broiler Market, Southern Economic Journal, 57 (1): 230-242.

335
Hüttel, S. and R. Jongeneel (2011). How has the EU milk quota affected patterns of herd-size change?
European Review of Agricultural Economics 38: 407-527.
IDF (2010). Methods for calculating milk equivalents. Bulleting of the IDF 390: 4-15.
IDF (2009). Bulletin of the International Dairy Federation 438/2009.
ILO (various years). Labour Statistics Database. International Labour Organisation, Geneva.
Ingco, M. (1996). Tariffication in the Uruguay Round: How much liberalisation? The World Economy:
434-5.
Jongeneel, R. and A. Tonini (2009). The impact of quota rent and supply elasticity estimates for EU dairy
policy evaluation: a comparative analysis. Agrarwirtschaft 58 (5/6): 269-278.
Jongeneel, R. and A. Tonini (2008). Dairy Quota and Farm Structural Change: A Case Study on the
Netherlands. In: Proceedings of the 107th EAAE Seminar, 29 January – 1 February, Seville, Spain.
Jongeneel, R., F. Brouwer, M. Farmer, R. Müssner, K. de Roest, X. Poux, G. Fox, A. Meister, Z. Karaczun,
J. Winsten and C. Ortéga (2007). Compliance with mandatory standards in agriculture; A comparative
approach of the EU vis-à-vis the United States, Canada and New Zealand., Rapport 6.07.21, LEI, The
Hague. http://www.lei.dlo.nl/publicaties/PDF/2007/6_xxx/6_07_21.pdf, 05/2011.
Jongeneel, R., N. Longworth and S. Hüttel (2005). Dairy Farm Size Distribution in East and West:
Evolution and Sensitivity to Structural and Policy Variables: Case-Studies of the Netherlands, Germany,
Poland, and Hungary. Paper presented at the 107th Seminar of the European Association of Agricultural
Economists (EAAE), 29 January – 1 February, Seville, Spain.
JRC-IPTS (2006). Project “Food Quality Assurance and Certification Schemes Managed within an
Integrated Supply Chain”, Case study on Parmigiano Reggiano. Institute for Prospective Technological
Studies, Joint Research Centre, European Commission, Seville. http://foodqualityschemes.
jrc.ec.europa.eu/en/documents/Casestudies_8-ParmigianoReggiano.pdf, 07/2011.
Keane, M. and D. O’Connor (2009). Price volatility in the EU dairy industry: Causes, consequences and
coping mechanisms. Report prepared for the European Dairy Association, Brussels, http://www.
euromilk.org/upload/docs/Homepage/Volatility%20Report_FINAL_091005%5B1%5D.pdf, 05/2011.
Keeney, M. (2000). The distributional impact of direct payments on Irish farm incomes. Journal of
Agricultural Economics, 51 (2): 252-263.
Lehtonen, H. (2007). Impact of Phasing out Milk Quotas on Structure and Production of Finnish Dairy
Sector. MTT Agrifood Research Finland, Economic Research. Paper presented at the 107th Seminar of the
European Association of Agricultural Economists (EAAE), January 29 – February 1, Seville, Spain.
LTO (2003, 2005, 2009). LTO International Milk Price Comparison. LTO Nederland.
Mukhtar, S. M. and P. J. Dawson (1990). Herd Size and Unit Costs of Production in the England and
Wales Dairy Sector. Journal of Agricultural Economics 41: 9-20.
O’Connor, D. (2006). Price Transmission in the EU Dairy Industry, Unpublished Doctoral Thesis UCC.
O’Connor, D. and M. Keane (2011). Empirical issues relating to dairy commodity price volatility. In: Piot-
Lepetit, I. and R. M’Barek (eds) Methods to analyse agricultural price volatility. Springer, New York,
Dordrecht, Heidelberg and London.
OECD (2005). Guidelines for Collecting and Interpreting Technological Innovation Data, The Oslo Manual,
3rd Edition. Organisation for Economic Cooperation and Development, Paris.
OECD (2010). Price Volatility and Price Transmission. In: OECD (ed.) OECD-FAO agricultural outlook
2010-2019. Organisation for Economic Cooperation and Development (Paris) and Food and Agricultural
Organisation of the United Nations (Rome).
336
OECD-FAO (2011). OECD-FAO agricultural outlook 2011-2020. Organisation for Economic Cooperation
and Development (Paris) and Food and Agricultural Organisation of the United Nations (Rome).
Petit, M., M. de Benedictis, D. Britton, M. de Groot, W. Henrichsmeyer and F. Lecchi (1987). Agricultural
policy formation in the European community: The birth of milk quotas and CAP reform. New York:
Elsevier.
Productschap Zuivel (2011). Oral information on calculating the raw milk equivalent price.
Rasmussen, S. and A. H. Neilsen (1985). The Impact of Quotas on the Optimal Adjustment of Milk
Production at the Farm Level. European Review of Agricultural Economics 12(4): 351-64.
Réquillart, V., Z. Bouamra-Mechemache and R. Jongeneel (2008). Economic analysis of the effects of the
expiry of the EU milk quota system – Final Report. Institut d’economie industrielle.
Richards, T. and S. Jeffrey (1997). The effect of supply management on herd size in Alberta dairy.
American Journal of Agricultural Economics 79: 555–565.
Sutton, J. (1991). Sunk Costs and Market Structure, Price Competition, Advertising, and the Evolution of
Concentration. Cambridge, Maas: MIT Press.
Tacken, G. M. L. (2009). Competitiveness of the EU dairy industry. Report 2009-011. LEI Wageningen
UR, The Hague.
TARIC (various years). Integrated Community Tariff Database. Electronic Database, Taxation and
Custom Union, European Commission, European Union.
Tonini, A. and R. Jongeneel (2009). The distribution of dairy farm size in Poland: a Markov approach
based on information theory, Applied Economics 41 (1): 55-69.
Weiss, C.R. (1999). Farm Growth and Survival: Econometric Evidence for Individual Farms in Upper
Austria, American Journal of Agricultural Economics 81: 103-116.
Witzke, H.P. and A. Tonini (2008). Dairy reform scenario’s with CAPSIM acknowledging quota rent
uncertainty. Paper presented at the XIIth Congress of the European Association of Agricultural
Economists (EAAE), 26-29 August, Ghent, Belgium.
WTO (various years). Notifications on export subsidy commitments of the European Communities.
Committee on Agriculture, World Trade Organisation, Geneva.
Vavra, P. and B. K. Goodwin (2005). Analysis of Price Transmission Along the Food Chain. OECD Food
Agriculture and Fisheries Working Papers No. 3, Organisation for Economic Cooperation and
Development, Paris.
Zimmermann, A. and T. Heckelei (2010). Structural change of European dairy farms – a cross regional
analysis. Paper presented at the 114th Seminar of the European Association of Agricultural Economists
(EAAE), 15-16 April, Berlin, Germany.
Zimmermann, A., T. Heckelei, and I. Pérez Domínguez (2009). Modelling farm structural change for
integrated ex-ante assessment: review of methods and determinants. Environmental Science & Policy 12
(5): 601-618.
USDA (2010). Dairy World markets and trade. USDA Foreign Agricultural Service, December.
USDA (2007). Dairy World markets and trade. USDA Foreign Agricultural Service, December.


![Dairy sector review 2011 [PDF 2.3MB]](https://static.fdocuments.net/doc/165x107/5868c4631a28ab12578bb5e3/dairy-sector-review-2011-pdf-23mb.jpg)