Evaluation of Candidate Linear Variable Displacement .../67531/metadc930760/m2/1/high... ·...
67
The INL is a U.S. Department of Energy National Laboratory operated by Battelle Energy Alliance INL/EXT-09-16972 Evaluation of Candidate Linear Variable Displacement Transducers for High Temperature Irradiations in the Advanced Test Reactor D. L. Knudson J. L. Rempe J. E. Daw September 2009
Transcript of Evaluation of Candidate Linear Variable Displacement .../67531/metadc930760/m2/1/high... ·...

The INL is a U.S. Department of Energy National Laboratory operated by Battelle Energy Alliance
INL/EXT-09-16972
Evaluation of Candidate Linear Variable DisplacementTransducers for High Temperature Irradiations in the Advanced Test Reactor
D. L. Knudson J. L. Rempe J. E. Daw
September 2009

INL/EXT-09-16972
Evaluation of Candidate Linear Variable Displacement Transducers for High Temperature Irradiations in the
Advanced Test Reactor
D. L. Knudson J. L. Rempe
J. E. Daw
September 2009
Idaho National Laboratory Idaho Falls, Idaho 83415
http://www.inl.gov
Prepared for the U.S. Department of Energy Office of Nuclear Energy
Under DOE Idaho Operations Office Contract DE-AC07-05ID14517

DISCLAIMER
This information was prepared as an account of work sponsored by anagency of the U.S. Government. Neither the U.S. Government nor anyagency thereof, nor any of their employees, makes any warranty, express orimplied, or assumes any legal liability or responsibility for the accuracy,completeness, or usefulness of any information, apparatus, product, or pro-cess disclosed, or represents that its use would not infringe privately ownedrights. References herein to any specific commercial product, process, orservice by trade name, trademark, manufacturer, or otherwise, does notnecessarily constitute or imply its endorsement, recommendation, or favor-ing by the U.S. Government or any agency thereof. The views and opinionsof authors expressed herein do not necessarily state or reflect those of theU.S. Government or any agency thereof.


iii INL/EXT-09-16972
CONTENTSCONTENTS ......................................................................................................................... iii
FIGURES .............................................................................................................................. v
TABLES .............................................................................................................................. vii
1. INTRODUCTION ................................................................................................................. 1
2. BACKGROUND ................................................................................................................... 3
2.1. Description .................................................................................................................... 3
2.2. Candidate LVDTs ......................................................................................................... 4
2.3. Evaluation Objectives ................................................................................................... 5
3. INTERFERENCE TESTING ................................................................................................ 7
3.1. Fixturing Tests .............................................................................................................. 7
3.2. LVDT Proximity Tests ................................................................................................. 10
3.3. Summary .................................................................................................................... 12
4. CALIBRATION ................................................................................................................... 13
4.1. Setup .......................................................................................................................... 13
4.2. Results ........................................................................................................................ 15
4.3. Summary .................................................................................................................... 18
5. LONG DURATION TESTING ............................................................................................ 19
5.1. Setup .......................................................................................................................... 19
5.2. Results ........................................................................................................................ 21
5.3. Summary .................................................................................................................... 22
6. CURIE POINT EVALUATION ............................................................................................ 25
6.1. Setup .......................................................................................................................... 25
6.2. Heatup Test Results ................................................................................................... 27
6.3. Summary .................................................................................................................... 30
7. GAMMA HEATING EVALUATION .................................................................................... 31
7.1. ABAQUS Model and Input .......................................................................................... 31
7.2. Results ........................................................................................................................ 32
7.3. Summary .................................................................................................................... 34
8. CONCLUSIONS AND RECOMMENDATIONS .................................................................. 37
9. REFERENCES .................................................................................................................. 39
APPENDIX A - FIXTURE INTERFERENCE CALIBRATION DATA ................................. A-1
APPENDIX B - CALIBRATION DATA .............................................................................. B-1

INL/EXT-09-16972 iv

v INL/EXT-09-16972
FIGURES2-1. Principle design of a Linear Variable Displacement Transducer. ..................................................... 3
2-2. Evaluated LVDTs. ............................................................................................................................. 6
3-1. LVDT calibration fixture. ................................................................................................................. 7
3-2. LVDT long duration fixture. ............................................................................................................. 8
3-3. Vendor A LVDT 1096 room temperature calibration results. .......................................................... 8
3-4. Vendor A LVDT 1097 room temperature calibration results. .......................................................... 9
3-5. Vendor B LVDT 1444 room temperature calibration results. .......................................................... 9
3-6. Vendor B LVDT 1449 room temperature calibration results. ........................................................ 10
3-7. LVDT proximity configurations and combinations. ....................................................................... 11
4-1. Schematic of the calibration test configuration. .............................................................................. 13
4-2. Calibration test configuration. ......................................................................................................... 14
4-3. Calibration data for Vendor A LVDT 1097 (or LVDT A1) at 500 °C. .......................................... 15
4-4. Calibration data for Vendor B LVDT 1449 (or LVDT B1) at 500 °C. ........................................... 16
4-5. Comparison of LVDT sensitivities as a function of temperature. .................................................. 17
4-6. Comparison of LVDT insulation resistances as a function of temperature. ................................... 18
5-1. Schematic of the long duration test configuration. ......................................................................... 19
5-2. Long duration test configuration. .................................................................................................... 20
5-3. Comparison of LVDT response during long duration testing. ........................................................ 21
5-4. Comparison of the response of LVDTs A1 and B1 during long duration testing. .......................... 23
5-5. Comparison of LVDT cores following the long duration test at 500 °C (where bothVendor B cores are shown centered between the Vendor A cores). ............................................... 23
6-1. Lindberg horizontal split tube furnace used in Curie point heatup tests. ........................................ 26
6-2. Data acquisition system used in Curie point heatup tests. .............................................................. 26
6-3. Insulating blocks as used to prevent fixture/heating element contact in Curie point heatup tests. ..................................................................................................................................... 27
6-4. Heatup test 1 in the Curie point evaluation. .................................................................................... 28
6-5. Heatup test 2 in the Curie point evaluation. .................................................................................... 28
6-6. Heatup test 3 in the Curie point evaluation. .................................................................................... 29
6-7. Heatup test 4 in the Curie point evaluation. .................................................................................... 29
7-1. LVDT body and core with automatically generated finite element mesh. ..................................... 32
7-2. Gamma heating rates as a function of axial position for the ATR center flux trap. ....................... 33
7-3. Radial temperature profiles at maximum heat generation. ............................................................. 33
7-4. Maximum temperature of the LVDT body in center flux trap. ....................................................... 34

INL/EXT-09-16972 vi
7-5. Maximum temperature of the LVDT core in center flux trap. ........................................................ 35
7-6. Maximum temperatures observed within LVDT body for different flux traps. ............................. 35

vii INL/EXT-09-16972
TABLES2-1. Desired LVDT characteristics for use in ATR. ................................................................................. 5
2-2. LVDT materials. ............................................................................................................................... 6
3-1. Sensitivity results at room temperature. .......................................................................................... 11
4-1. Sensitivity results. ........................................................................................................................... 16
6-1. Curie point evaluation summary. .................................................................................................... 30
7-1. Surface coolant conditions. ............................................................................................................. 32
A-1. Set 1 interference calibration outside all fixtures. ......................................................................... A-1
A-2. Set 1 interference calibration inside calibration fixture. ............................................................... A-2
A-3. Set 1 interference calibration inside long duration fixture. ........................................................... A-3
A-4. Set 2 interference calibration outside all fixtures. ......................................................................... A-4
A-5. Set 2 interference calibration inside calibration fixture. ............................................................... A-5
A-6. Set 2 interference calibration inside long duration fixture. ........................................................... A-6
B-1. Set 1 data at 200ºC. ....................................................................................................................... B-1
B-2. Set 1 data at 300ºC. ....................................................................................................................... B-2
B-3. Set 1 data at 400ºC. ....................................................................................................................... B-3
B-4. Set 1 data at 500ºC. ....................................................................................................................... B-4
B-5. Room temperature data for Set 1 after high temperature calibration. ........................................... B-5
B-6. Room temperature data for Set 2 before high temperature calibration. ........................................ B-6
B-7. Set 2 data at 200ºC. ....................................................................................................................... B-7
B-8. Set 2 data at 300ºC. ....................................................................................................................... B-8
B-9. Set 2 data at 400ºC. ....................................................................................................................... B-9
B-10. Set 2 data at 500ºC. ..................................................................................................................... B-10
B-11. Room temperature data for Set 2 after high temperature calibration. ......................................... B-11

INL/EXT-09-16972 viii

1 INL/EXT-09-16972
1. INTRODUCTION
The United States (U.S.) Department of Energy (DOE) designated the Advanced Test Reactor (ATR)as a National Scientific User Facility (NSUF) in April 2007 to promote nuclear science and technology inthe U.S. Given this designation, the ATR is supporting new users from universities, laboratories, andindustry as they conduct basic and applied nuclear research and development to advance the nation'senergy security needs. A fundamental component of the ATR NSUF program is to develop in-pile instru-mentation capable of providing real-time measurements of key parameters during irradiation experiments.
Dimensional change is a key parameter that must be monitored during irradiation of new materialsbeing considered for fuel, cladding, and structures in next generation and existing nuclear reactors. Suchmaterials can experience significant changes during high temperature irradiation. Currently, dimensionalchanges are determined by repeatedly irradiating a specimen for a defined period of time in the ATR andthen removing it from the reactor for evaluation. The time and labor to remove, examine, and return irradi-ated samples for each measurement makes this approach very expensive. In addition, such techniques pro-vide limited data (i.e., only characterizing the end state when samples are removed from the reactor) andmay disturb the phenomena of interest.
To address these issues, the Idaho National Laboratory (INL) recently initiated efforts to evaluate can-didate linear variable displacement transducers (LVDTs) for use during high temperature irradiation exper-iments in typical ATR test locations. Two nuclear grade LVDT vendor designs were identified forconsideration - a smaller diameter design qualified for temperatures up to 350 °C and a larger design withcapabilities to 500 °C. Initial evaluation efforts include collecting calibration data as a function of temper-ature, long duration testing of LVDT response while held at high temperature, and the assessment ofchanges in performance that may be introduced as a result of high temperature operation in a radiationenvironment. The performance assessment focuses on the potential for any changes or degradation in sen-sitivity and/or electrical resistance. After initial testing, additional testing was completed for the morepromising design to detect the changes that occur when some of its components are subjected to their Curietemperature. Results from this study are provided as the first step in qualifying these sensors for possibleATR use. (Note that this report will be submitted to the Institute for Energy at the Halden Reactor Project{IFE-HRP} for confirmation of appropriate test procedures. Furthermore, this report will be updated dur-ing fiscal year 2010 to include results from the evaluation of “developmental” LVDTs to be provided byIFE-HRP.)
This document presents results from laboratory evaluations and results from scoping calculations com-pleted to assess the possible effects of gamma heating during irradiation for the most promising LVDTdesign. Section 2 of this document provides background information related to LVDT operation and bothdesigns evaluated in this effort. Section 3 contains a description of tests needed to ensure that LVDT out-puts will not be adversely affected by fixturing and/or the proximity of other LVDTs during this evalua-tion. Results from calibration evaluations are provided in Section 4 and results from long duration tests arepresented in Section 5. Curie temperature evaluation results are documented in Section 6. Scoping calcula-tions to assess the impact of gamma heating during LVDT irradiation are presented in Section 7. Recom-mendations from these evaluations are documented in Section 8. References cited in this report are listed inSection 9.

INL/EXT-09-16972 2

3 INL/EXT-09-16972
2. BACKGROUND
The use of LVDTs to measure linear displacement is a relatively mature technology. LVDTs are reliedupon because they are accurate, very reliable, simple in terms of design and operation, and relatively inex-pensive. However, as discussed below, options for use in the ATR are limited when considering LVDTvendors with sensor operating histories in a nuclear reactor environment. This section provides back-ground information related to LVDT operation and the designs evaluated in this effort.
2.1. Description
LVDTs have been used for many decades for the accurate measurement of displacement and withinsystems for positioning control. In its simplest form, an LVDT consists of one primary (center) coil andtwo (outer) secondary coils wrapped around a coil former (which is a hollow non-conducting cylinder). Aferromagnetic core attached to the object whose position is to be measured moves inside the coil formerbased on displacement of the object of interest. (See Figure 2-1a.) An alternating current is driven throughthe primary, causing a voltage to be induced in each secondary, which is proportional to its mutual induc-tance in the primary. The frequency is typically between 1 and 10 kHz. As the core moves, these mutualinductances change, causing the voltages induced in the secondaries to change. The coils are connected inreverse series, so that the output voltage is the difference between the two secondary voltages. When thecore is in its central (or “null”) position, equidistant between the two secondaries, equal but opposite volt-ages are induced in these two coils and the output voltage is zero (see Figure 2-1b). One important advan-tage of using an LVDT is that the moving core does not make contact with the coil former or any othercomponents of the assembly. The absence of friction between sensor components results in high reliabilityand long life.
Figure 2-1. Principle design of a Linear Variable Displacement Transducer.
a. b.

INL/EXT-09-16972 4
IFE-HRP is one of the pioneers in LVDT development for in-pile testing. In an IFE-HRP LVDTdesign,1 the primary coil is activated by a 400 Hz constant current generator and the position of the corecan be measured with an accuracy of ±1 �m. Since the IFE-HRP began making in-core measurements,more than 2200 LVDTs of different types have been installed in different test rigs in their Halden BoilingWater Reactor (HBWR). Failure rates of less than 10% after 5 years of operation is expected for theirLVDTs operating in BWR, PWR or CANDU conditions.
Using LVDTs as a base instrument, the IFE-HRP has developed specialized sensors that allow on-linemonitoring of a wide-range of parameters, such as fuel stack or tensile specimen elongation, cladding elon-gation, fuel centerline temperature, and fuel rod pressure. One example of note is an HRP-developed diam-eter gauge that enables on-line measurement of cladding diameter changes due to pellet claddinginteraction, creep, and/or crud deposition. Recently, IFE-HRP has explored several improvements forLVDTs. For example, the IFE-HRP staff has collaborated with the French Commissariat a l’EnergieAtomique (CEA) to improve the accuracy of their LVDTs when they pass through their Curie temperature.Currently, IFE-HRP staff are collaborating with INL to investigate the use of alternate coil wires anddesign modifications that would improve the performance of LVDTs at higher temperatures.
2.2. Candidate LVDTs
An INL survey revealed that, with minor modifications, two candidate nuclear grade LVDT vendordesigns could meet the ATR-specific customer requirements listed in Table 2-1. Specifically, one supplier,hereafter identified as Vendor A,1 can currently provide LVDTs qualified to a maximum operating temper-ature of only 350 ºC while another supplier, hereafter identified as Vendor B, can currently provide onlyLVDTs with diameters exceeding listed ATR design limits. Note that the Vendor A temperature limitationwas established primarily because of instabilities associated the sensor response as its coils pass through amaterial-specific Curie temperature at approximately 360 ºC. However, including the Vendor A LVDTwas deemed appropriate because alternate materials, that are not susceptible to the Curie temperatureeffects, could be incorporated into their design. (For example, components used in LVDTs developed forINL’s Loss of Fluid Test were found to produce stable signals up to 500 ºC.2) Likewise, Vendor B indi-cated that alternate materials could be used in their sensor in order to reduce its size. In both cases, limiteddate were available to verify either manufacturer’s claims regarding their performance at high tempera-tures. Hence, INL deemed that evaluations were needed prior to incorporating either design into ATR irra-diations experiments. The sensors procured by INL for evaluation here are shown in Figure 2-2.
In addition to the obvious physical differences shown in the figure, a number of differences exist in thematerials used in these LVDTs as indicated in Table 2-2. In this table, materials used in past designs forINL-specific tests2 are compared to materials used by Vendors A and B. Of particular note, Vendor A usesa nickel clad wire for primary and secondary coils that is subject to a Curie temperature effect at ~360 °C.In addition, Vendor B uses a lava core form, which is a primary factor contributing to the relatively-largediameter of their sensor. In both cases, the table indicates other materials are available that could be used toeliminate these design issues.
1. After reviewing results presented in this document, Vendor A indicated that it was acceptable for them to be identi-fied. Vendor A is the Institute for Energy Technology at the Halden Reactor Project.
5 INL/EXT-09-16972
2.3. Evaluation Objectives
As noted above, two candidate LVDT designs were identified as having the potential to meet ATRcustomer test conditions. However, limited data were available to verify their performance and there wereconcerns with each design’s ability to meet some ATR test conditions. Hence, INL completed several tasksto compare candidate design performance. First, laboratory calibration tests were completed to comparecandidate LVDT response at temperatures up to 500 ºC. Second, LVDT stability and reliability wereassessed through long duration testing for 1000 h at 500 ºC. After these initial evaluations, a superiordesign was selected for additional evaluations. First, additional assessments were completed near 360 ºC toassess any instabilities that may occur when the preferred LVDT design was exposed to its Curie tempera-ture. Second, finite element analyses were completed to verify the impact of gamma heating on LVDT per-formance. Results from these evaluations are presented in Sections 4 through 7 of this document. (It shouldbe noted that a comprehensive series of interference tests were completed before LVDT candidates wereevaluated. These tests, which are described in Section 3, were needed to ensure that LVDT outputs werenot adversely affected by fixturing and/or the proximity of other LVDTs.)
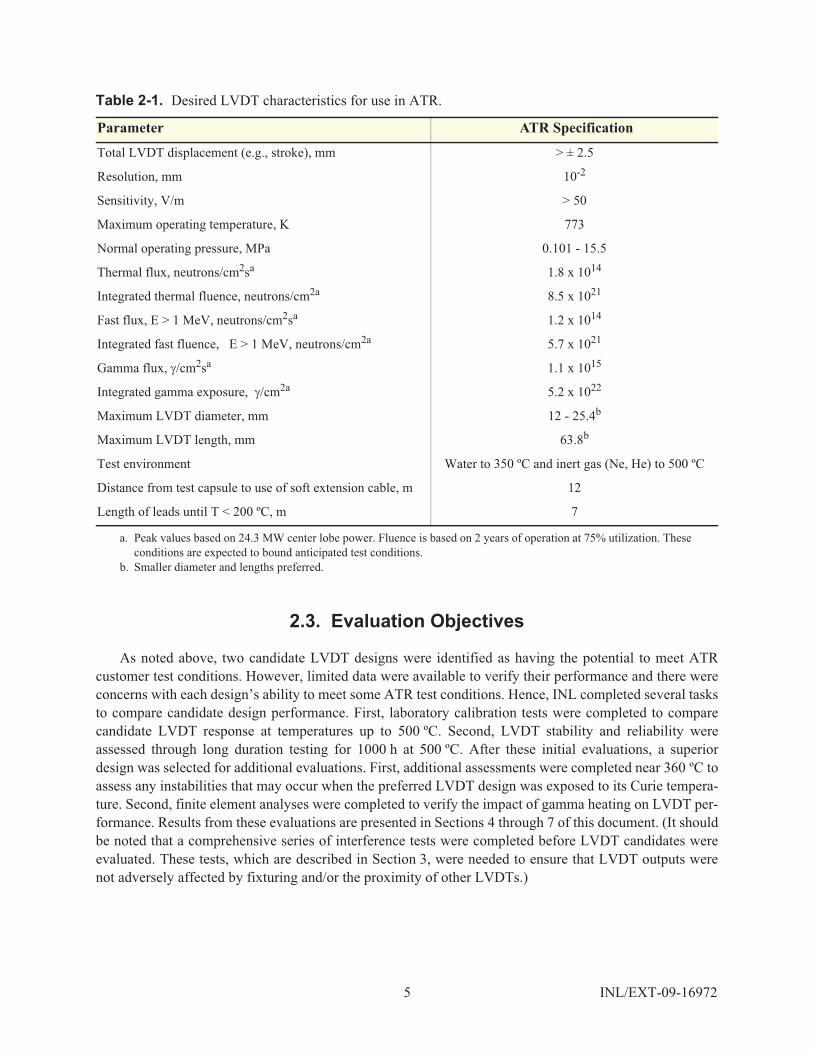
Table 2-1. Desired LVDT characteristics for use in ATR.
Parameter ATR Specification
Total LVDT displacement (e.g., stroke), mm > ± 2.5
Resolution, mm 10-2
Sensitivity, V/m > 50
Maximum operating temperature, K 773
Normal operating pressure, MPa 0.101 - 15.5
Thermal flux, neutrons/cm2sa 1.8 x 10¹⁴
Integrated thermal fluence, neutrons/cm2a 8.5 x 10²¹
Fast flux, E > 1 MeV, neutrons/cm2sa 1.2 x 10¹⁴
Integrated fast fluence, E > 1 MeV, neutrons/cm2a 5.7 x 10²¹
Gamma flux, ��cm2sa 1.1 x 10¹⁵
Integrated gamma exposure, ��cm2a 5.2 x 10²²
Maximum LVDT diameter, mm 12 - 25.4b
Maximum LVDT length, mm 63.8b
Test environment Water to 350 ºC and inert gas (Ne, He) to 500 ºC
Distance from test capsule to use of soft extension cable, m 12
Length of leads until T < 200 ºC, m 7
a. Peak values based on 24.3 MW center lobe power. Fluence is based on 2 years of operation at 75% utilization. These conditions are expected to bound anticipated test conditions.
b. Smaller diameter and lengths preferred.

INL/EXT-09-16972 6
Figure 2-2. Evaluated LVDTs.
Table 2-2. LVDT materials.
Component INLa Vendor A Vendor BCore 17-4PH SS Inconel 600 Vanadium Permendurb
Housing 304 SS Inconel 600 304 SS
Coil form 304 SS Inconel 600, plasma sprayed with Al2O3
Lava (Alumino Silicate)
End caps 304 SS Inconel 600 304 SS
Magnetic shield / bore liner Silicon steel-AMS 7714M36 Fe-Si-Foil 410 SS
Coil wireAlloy 406c with Type E
high temperature insulation
Nickel clad Copperd with vitreous enamel film
Alloy 406c with high temperature insulation
Primary / secondary signal cable SS sheath, with nickel-clad copper
Inconel 600 sheath with Al2O3 insulation and
nickel wires
28 AWG solid nickel with MgO insulation in SS
sheath
Cements (for coils, after forming) Yellow cerro ceramic cement
None required (because core is thermally sprayed)
ADH Ceramic silica base 918 25
a. As used in past designs for INL-specific programs.2b. Soft magnetically-permeable alloy containing 2% vanadium, 49% cobalt and 49% iron.c. Silver wire, currently manufactured by California Fine Wires, contains silver, magnesium, zinc, lead, palladium,
indium, manganese, and nickel.d. Some loss of accuracy occurs temporarily at the Curie temperature of ~360 °C.
Vendor B LVDT 1449 (or LVDT B1)
Vendor B LVDT 1444 (or LVDT B2)
Vendor A LVDT 1097 (or LVDT A1)
Vendor A LVDT 1096 (or LVDT A2)
7 INL/EXT-09-16972
3. INTERFERENCE TESTING
Specialized fixturing (to secure LVDT bodies relative to the movement of LVDT cores) was needed tocomplete this evaluation of candidate LVDTs. In addition, candidate LVDTs may be operated in closeproximity to each other in various stages of this evaluation. Therefore, testing was completed to ensure thatLVDT outputs were not adversely affected by the fixturing and/or the close proximity of other LVDTs.Otherwise, results and conclusions from this evaluation could not be considered reliable.
This section contains a description of the tests completed to ensure the absence of any LVDT outputinterference. For convenience, these tests were divided into two categories: (1) configurations that could bedirectly affected by the use of specialized test fixtures and (2) configurations associated with LVDTs oper-ating in close proximity to each other. Those categories are discussed in the remainder of this section.
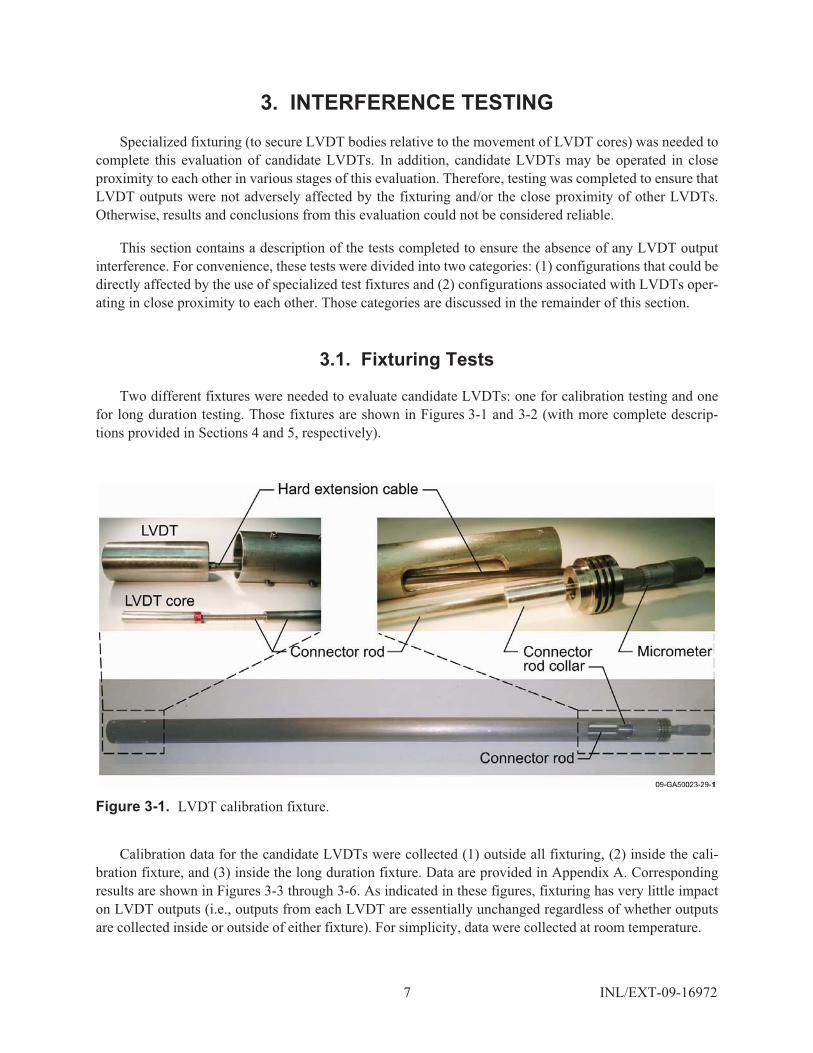
3.1. Fixturing Tests
Two different fixtures were needed to evaluate candidate LVDTs: one for calibration testing and onefor long duration testing. Those fixtures are shown in Figures 3-1 and 3-2 (with more complete descrip-tions provided in Sections 4 and 5, respectively).
Calibration data for the candidate LVDTs were collected (1) outside all fixturing, (2) inside the cali-bration fixture, and (3) inside the long duration fixture. Data are provided in Appendix A. Correspondingresults are shown in Figures 3-3 through 3-6. As indicated in these figures, fixturing has very little impacton LVDT outputs (i.e., outputs from each LVDT are essentially unchanged regardless of whether outputsare collected inside or outside of either fixture). For simplicity, data were collected at room temperature.
Figure 3-1. LVDT calibration fixture.

INL/EXT-09-16972 8
Figure 3-2. LVDT long duration fixture.
Figure 3-3. Vendor A LVDT 1096 room temperature calibration results.
-6
-4
-2
0
2
4
6
-3 -2 -1 0 1 2 3
outside all fixturesinside calibration fixtureinside long duration fixture
Out
put (
Vdc
)
Displacement (mm)

9 INL/EXT-09-16972
Figure 3-4. Vendor A LVDT 1097 room temperature calibration results.
Figure 3-5. Vendor B LVDT 1444 room temperature calibration results.
-6
-4
-2
0
2
4
6
-3 -2 -1 0 1 2 3
outside all fixturesinside calibration fixtureinside long duration fixture
Out
put (
Vdc
)
Displacement (mm)
-6
-4
-2
0
2
4
6
-3 -2 -1 0 1 2 3
outside all fixturesinside calibration fixtureinside long duration fixture
Out
put (
Vdc
)
Displacement (mm)

INL/EXT-09-16972 10
Results shown in Figures 3-3 through 3-6 are also summarized in Table 3-1 in terms of LVDT sensi-tivities. (The sensitivity of an LVDT is expressed in terms of electrical output developed for a given dis-placement. This key metric, generally given in terms of an absolute value, is equivalent to the linear slopeof a calibration curve.) As indicated in the table (and in comparisons of Figures 3-3 through 3-6), the larg-est deviations associated with use of either fixture were reflected in results for Vendor B LVDT 1449. Spe-cifically, the output of this LVDT is ~2.5% lower inside the long duration fixture than it is outside thefixture. For purposes of this evaluation, this difference (and other differences listed in the table) are consid-ered insignificant. Consequently, these results indicate there is no concern regarding LVDT output inter-ference associated with use of either of the specialized fixtures.
3.2. LVDT Proximity Tests
It was necessary to determine if LVDT output could be affected by a second LVDT operating in closeproximity. The potential for such interference was evaluated for 3 different configurations including (1)LVDTs lying “head-to-head”, (2) LVDTs lying “head-to-tail”, and (3) LVDTs lying “across” each other.Furthermore, the potential for interference in these configurations was needed for 3 different LVDT com-binations including (1) Vendor A versus Vendor A, (2) Vendor B versus Vendor B, and (3) Vendor A ver-sus Vendor B. A summary of all configurations for all LVDT combinations is shown in Figure 3-7.
In this figure, the top row represents all configurations considered for Vendor A versus Vendor ALVDT combinations. Similarly, the middle row represents all configurations for Vendor B versusVendor B LVDT combinations. And finally, the bottom row represents all configurations for Vendor A
Figure 3-6. Vendor B LVDT 1449 room temperature calibration results.
-6
-4
-2
0
2
4
6
-3 -2 -1 0 1 2 3
outside all fixturesinside calibration fixtureinside long duration fixture
Out
put (
Vdc
)
Displacement (mm)

11 INL/EXT-09-16972
Table 3-1. Sensitivity results at room temperature.
LVDT
Vendor A Vendor B
1096 1097 1444 1449
Sensitivities (mV/mm)
Vendor value 1640.7 1649.0 na na
Measured
Outside all fixtures 1647.8 1639.3 2077.7 2028.7
Inside calibration fixture 1644.6 1645.0 2067.2 1995.5
Inside long duration fixture 1641.0 1642.5 2060.6 1977.2
Measured deviations (%)
Relative to vendor value
Outside all fixtures 0.433 -0.588 na na
Inside calibration fixture 0.238 -0.243 na na
Inside long duration fixture 0.018 -0.394 na na
Relative to value outside all fixturesInside calibration fixture -0.194 0.348 -0.505 -1.637
Inside long duration fixture -0.413 0.195 -0.823 -2.539
Figure 3-7. LVDT proximity configurations and combinations.

INL/EXT-09-16972 12
versus Vendor B combinations. The following steps were completed for each LVDT configuration/combi-nation. (For simplicity, these steps were completed at room temperature.)
1. LVDT cores were inserted into the LVDT bodies to locations near their “null” positions. (Outputfrom each LVDT was checked independently to verify cores were properly positioned.)
2. Output from the first LVDT was obtained while the second LVDT remained de-energized.3. The second LVDT was then energized to see if there was any impact on the output of the first
LVDT. If energizing the second LVDT changed the output of the first LVDT, the induced changewas recorded.
4. Output from the second LVDT was noted (while both LVDTs were energized). Then, the firstLVDT was de-energized to see if there was any impact on the output of the second LVDT. If de-energizing the first LVDT changed the output of the second LVDT, the induced change wasrecorded.
5. LVDT cores were then re-positioned to locations in the “positive” direction near the limits of lin-ear travel (or +2.5 mm from the “null” positions).
6. Steps 2 through 4 were repeated.7. LVDT cores were then re-positioned to locations in the “negative” direction near the limits of lin-
ear travel (or -2.5 mm from the “null” positions).8. Steps 2 through 4 were repeated.
After completing the steps above for all LVDT configurations/combinations, it was determined thatoutputs from Vendor A and Vendor B LVDTs were not affected by other LVDTs that may be operating inclose proximity (i.e., operation of one LVDT does not induce a change in output of a nearby LVDT). Thisresult, along with the fact that Vendor A and Vendor B outputs are unaffected by fixturing, means thatinterference effects are not of concern in these LVDT evaluations.
3.3. Summary
A comprehensive series of tests were completed (at room temperature) to ensure that LVDT outputsare not adversely affected by the use of specialized fixturing and/or the close proximity of other operatingLVDTs. The results indicate that LVDT outputs are essentially unchanged regardless of whether outputsare collected inside or outside of the specialized fixtures. In addition, it was determined that the operationof one LVDT does not induce a change in output of nearby LVDT. Consequently, interference effects arenot a concern in these LVDT evaluations, assuming that room temperature results also apply to higher tem-peratures.

13 INL/EXT-09-16972
4. CALIBRATION
LVDTs must be calibrated for the temperatures where they will be deployed. This evaluation consistsof collecting calibration data for two Vendor A LVDTs and two Vendor B LVDTs at temperatures up to500 °C, which is expected to cover the range of temperatures of current interest in potential ATR applica-tions. Identifying any changes or degradation in sensitivity and/or electrical resistance as a function of tem-perature is the primary focus of this evaluation. LVDTs should produce consistent trends in sensitivity andelectrical resistance as a function of temperature in order to be considered for use in ATR in-pile experi-ments.
4.1. Setup
A schematic of the test configuration is provided in Figure 4-1. As indicated, this test required use of aspecialized fixture, a tube furnace, LVDT-specific signal conditioners, and a computerized data acquisitionsystem (DAS). The specialized fixture, labeled “SS capsule” in the figure, was fabricated at the INL fromstainless steel tubing. The fixture provides a means for securing an LVDT body at one end and a microme-ter at the opposite end. The tubing was of a length sufficient to allow positioning of the LVDT at the centerof a high temperature tube furnace with the micrometer outside the furnace (and thereby unaffected by thefurnace temperature). A stainless steel rod was used to connect the micrometer to the LVDT core, whichwas initially placed at the null position relative to the LVDT body. The micrometer then provided themechanism for precise movement of the core (with respect to the body) for calibration purposes. Detailsfor both ends of this fixture and its configuration relative to the tube furnace are shown in Figure 4-2. Inthis case, a three-zone, horizontal Carbolite furnace with a maximum temperature of 1700 °C was used.
Figure 4-1. Schematic of the calibration test configuration.

INL/EXT-09-16972 14
Note that a comprehensive set of tests, as described in detail in Section 3, was conducted prior to thisevaluation to ensure that the LVDTs would not be affected by operating in close proximity to each other.Tests were also completed to ensure that LVDT response was not altered through use of the specializedfixture. In addition to supporting the validity of this evaluation, these tests provide important insights thatwill ultimately be needed in the design of ATR in-pile test configurations.
Figure 4-2. Calibration test configuration.
Carbolite tube furnace

15 INL/EXT-09-16972
4.2. Results
Calibration data (i.e., output voltage versus displacement) were collected at 200, 300, 400, and 500 °Cfor two Vendor A LVDTs and two Vendor B LVDTs. In addition, data were collected at room temperatureboth before and after the higher temperature calibration. Appendix B provides all of the correspondingDAS file names (where raw data actually resides) as well as supporting information associated with thecalibration. Linear curve fits for the data at each temperature over the design range (of ± 2.5 mm for allcandidate LVDTs) were successfully determined. Results for Vendor A LVDT 1097 (also designated asA1) at 500 °C are shown in Figure 4-3.
LVDT response data, a linear fit through that data, and the deviation of the data relative to the linear fitare all shown in the figure. Note that LVDT A1 has a maximum deviation of less than ± 0.02 mm (or± 0.8%) over its design range of ± 2.5 mm. Furthermore, its linear deviation is symmetric with respect toits null position. This is evident in that its deviation is ~0 at a displacement of 0 and the (absolute value of)deviations are approximately equal for equal but opposite displacements from null. These results are typi-cal of those for all other Vendor A LVDTs.
Corresponding results for Vendor B LVDT 1449 (also designated as B1) are shown in Figure 4-4.There are several notable differences apparent through comparison of Figures 4-3 and 4-4. Specifically,the maximum linear deviation of LVDT B1 (at more than 0.044 mm, or more than 1.8%, over its designrange of ± 2.5 mm) is more than twice the LVDT A1 maximum deviation. Furthermore, the linear devia-tion of LVDT B1 is not symmetric with respect to its null position. In fact, its deviation is ~0 at a displace-ment of ~1.2 mm. Deviations at ± 2.5 mm are ~0.017 and 0.044 mm, respectively. Although there are no
Figure 4-3. Calibration data for Vendor A LVDT 1097 (or LVDT A1) at 500 °C.
-6
-4
-2
0
2
4
6
-0.06
-0.03
0
0.03
0.06
-3 -2 -1 0 1 2 3
500 C outputlinear outputdeviation
Out
put (
V)
Deviation from
linear (mm
)
Displacement (mm)

INL/EXT-09-16972 16
ATR symmetry specifications, symmetric behavior is desirable. Both LVDTs should be capable of resolu-tion in the 0.010 mm range, which is an ATR specification. However, LVDT A1 would be expected tohave a lower degree of uncertainty (as compared to LVDT B1) because its deviation from linearity is rela-tively small.
The sensitivity of an LVDT is expressed in terms of electrical output developed for a given displace-ment. This key metric is equivalent to the linear slope of a calibration curve (like the linear curves shownin Figures 4-3 and 4-4). Sensitivities, (generally given in terms of an absolute value), for all LVDTs at alltemperatures are summarized in Table 4-1.
Figure 4-4. Calibration data for Vendor B LVDT 1449 (or LVDT B1) at 500 °C.
Table 4-1. Sensitivity results.
Condition
LVDT Sensitivities (mV/mm) for
Vendor A Vendor B
1096 1097 1444 1449
Room temperature (before higher temperature calibration) 1638.8 1645.0 2078.3 1995.5
200 °C 1690.4 1696.2 2176.5 2067.1
300 °C 1703.4 1706.5 2221.8 2096.7
400 °C 1782.7 1788.7 2187.0 2094.5
500 °C 1796.3 1800.7 1672.5 1750.6
Room temperature (after higher temperature calibration) 1637.3 1645.4 2039.4 1993.0
-6
-4
-2
0
2
4
6
-0.06
-0.03
0
0.03
0.06
-3 -2 -1 0 1 2 3
500 C outputlinear outputdeviation
Out
put (
V)
Deviation from
linear (mm
)
Displacement (mm)

17 INL/EXT-09-16972
LVDTs A1 and B1, with sensitivities at 500 °C of 1800 and 1750 mV/mm, respectively, easily exceedthe ATR specification of 50 mV/mm (listed in Table 2-1). However, the effects of temperature on sensitiv-ity are of interest given the cyclic nature of ATR operations. This temperature dependence for LVDTs A1and B1 is presented in Figure 4-5.
LVDT A1 sensitivity was found to increase (somewhat linearly) with temperature as shown in the fig-ure. This increasing trend is beneficial in that sensor resolution is favorably affected. Furthermore, the sen-sitivity of LVDT A1 was found to return to its room temperature value following calibration attemperatures as high as 500 °C. These results provide some evidence that Vendor A LVDTs are robustthrough temperature cycling up to the design specification. In contrast, LVDT B1 sensitivity increased(almost) linearly with temperature only up to ~300 °C. Thereafter, the sensitivity decreased sharply asshown. Although LVDT B1 sensitivity at 500 °C exceeds ATR specifications, the sharply decreasing trendis not favorable. Relative to LVDT A1, LVDT B1 pre- and post-calibration room temperature sensitivitiesdiffered noticeably. Again, this LVDT B1 result is not favorable (as compared to results for LVDT A1).
Electrical resistance is one factor that could affect LVDT sensitivities. In this study, the resistance of(both primary and secondary) loop windings was found to increase with temperature in LVDTs from bothvendors, which was expected. Insulation resistance, however, generally tends to decrease with tempera-ture. Insulation resistance measurements relative to primary and secondary windings for LVDTs A1 andB1 are shown in Figure 4-6 as a function of temperature. (Note that 1x10⁸ ohms was a limitation of themeter used in this study.)
Figure 4-5. Comparison of LVDT sensitivities as a function of temperature.
1600
1700
1800
1900
2000
2100
2200
2300
0 100 200 300 400 500 600
A1 calibrationafter A1 calibrationB1 calibrationafter B1 calibration
Sen
sitiv
ity (m
V/m
m)
Calibration temperature (C)

INL/EXT-09-16972 18
As indicated in Figure 4-6, the primary to secondary insulation resistance for LVDT B1 showed asharp decrease after 300 °C. This trend appears to be consistent with the decreasing trend in sensitivityshown in Figure 4-5. A value of ~40 ohms, as measured at 500 °C for LVDT B1, seems unreasonably low.In contrast, temperatures exceeded 400 °C before any decreases in the corresponding insulation resistancefor LVDT A1 were measured. Furthermore, the decrease for LVDT A1 was relatively small, yielding avalue in excess of 1x10⁶ ohms at 500 °C. These results clearly favor the Vendor A LVDT design for use inATR irradiation experiments.
4.3. Summary
LVDTs must be calibrated for the temperatures where they will be deployed. For that reason, calibra-tion was completed for two Vendor A LVDTs and two Vendor B LVDTs at temperatures up to 500 °C,which is expected to cover the range of temperatures of current interest in potential ATR applications. Theresults clearly favor the Vendor A LVDT design for use in ATR irradiation experiments. Vendor ALVDTs show relatively small deviations from linear behavior (compared to Vendor B LVDTs) and theirdeviations are symmetric (where Vendor B LVDT deviations are not). Sensitivities of Vendor A LVDTsincrease (nearly linearly) with temperature. In contrast, Vendor B LVDT sensitivities increase with tem-perature to ~300 °C and sharply drop thereafter. Furthermore, Vendor A LVDT pre- and post-calibrationroom temperature sensitivities are essentially equivalent while Vendor B pre- and post-calibration sensitiv-ities differ appreciably, indicating a lack of robustness in the Vendor B design. Finally, Vendor B LVDTinsulation resistances drop to unreasonably low values at high temperatures while Vendor A resistances donot. For these reasons, Vendor B LVDTs would not be acceptable for use in the ATR.
Figure 4-6. Comparison of LVDT insulation resistances as a function of temperature.
101
102
103
104
105
106
107
108
0 100 200 300 400 500 600
A1 insulation: primary to secondaryafter A1 calibrationB1 insulation: primary to secondaryafter B1 calibration
Res
ista
nce
(ohm
)
Calibration temperature (C)

19 INL/EXT-09-16972
5. LONG DURATION TESTING
LVDTs must operate reliably for extended periods at elevated temperatures in order to be useful inATR in-pile experiments. For that reason, LVDT testing for a period of 1000 h at 500 °C was needed. Theselected temperature of 500 °C is within the operating range (that extends to 600 °C) for Vendor B LVDTsand Vendor A (IFE-HRP) LVDTs have successfully reached that temperature according to user reports. Inaddition, the selected period of 1000 h represents a minimum requirement given current ATR operatingcycles that typically run from 6 to 8 weeks.
An assessment of changes in performance that may be introduced as a result of high temperature oper-ation was the primary focus of this test. Performance was assessed through the evaluation of any changesor degradation in sensor output stability.
5.1. Setup
A schematic of the test configuration is provided in Figure 5-1. As indicated, this test required use of aspecialized fixture, a tube furnace, LVDT-specific signal conditioners, and a computerized DAS. The spe-cialized fixture, labeled “SS capsule” in the figure, was fabricated at the INL from a solid block of stainlesssteel to allow the simultaneous testing of 4 LVDTs (although only 2 LVDTs are shown for clarity). Thefixture provides a means for securing each LVDT relative to its associated core and connecting rod as wellas positions for 2 TCs to monitor test temperatures independently of the furnace temperature controller.LVDT bodies were secured at one end of the specialized fixture while connecting rods were secured at theopposite end. Connecting rods were of a length sufficient to place LVDT cores as close as possible to nullpositions relative to the LVDT bodies. Holding the resulting assembly at a constant temperature will revealany tendency for LVDT signal degradation or oscillation over time.
Figure 5-1. Schematic of the long duration test configuration.

INL/EXT-09-16972 20
The specialized fixture prior to loading the LVDTs is shown in the lower right inset of Figure 5-2. Thesmallest holes accommodate TCs, Vendor A LVDTs fit in the medium size holes, and the largest holes arefor Vendor B LVDTs. The loaded fixture is also shown prior to insertion into the furnace muffle tube. Inthis case, a three-zone, horizontal Carbolite furnace with a maximum temperature of 1700 °C was used.
Figure 5-2. Long duration test configuration.
Carbolite tube furnace
21 INL/EXT-09-16972
Note that a comprehensive set of tests, as described in detail in Section 3, was conducted prior to thisevaluation to ensure that the LVDTs would not be affected by operating in close proximity to each other.Tests were also completed to ensure that LVDT response was not altered through use of the specializedfixture. In addition to supporting the validity of this evaluation, these tests provide important insights thatwill ultimately be needed in the design of ATR in-pile test configurations.
5.2. Results
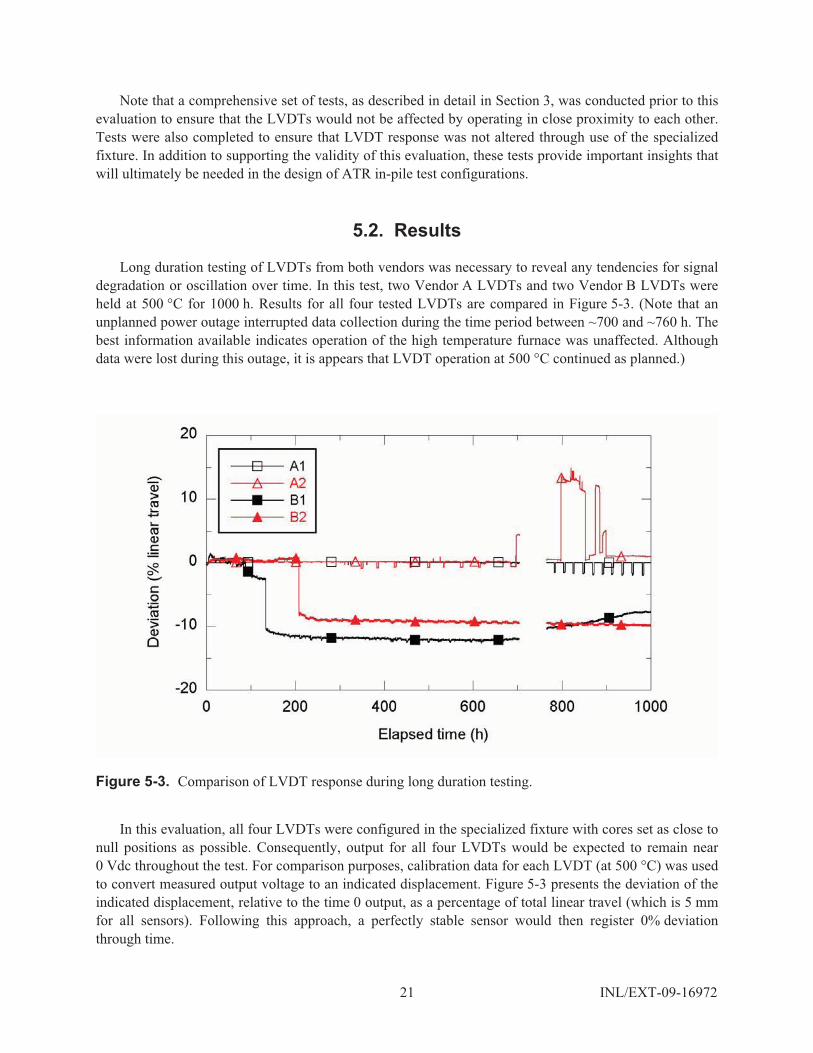
Long duration testing of LVDTs from both vendors was necessary to reveal any tendencies for signaldegradation or oscillation over time. In this test, two Vendor A LVDTs and two Vendor B LVDTs wereheld at 500 °C for 1000 h. Results for all four tested LVDTs are compared in Figure 5-3. (Note that anunplanned power outage interrupted data collection during the time period between ~700 and ~760 h. Thebest information available indicates operation of the high temperature furnace was unaffected. Althoughdata were lost during this outage, it is appears that LVDT operation at 500 °C continued as planned.)
In this evaluation, all four LVDTs were configured in the specialized fixture with cores set as close tonull positions as possible. Consequently, output for all four LVDTs would be expected to remain near0 Vdc throughout the test. For comparison purposes, calibration data for each LVDT (at 500 °C) was usedto convert measured output voltage to an indicated displacement. Figure 5-3 presents the deviation of theindicated displacement, relative to the time 0 output, as a percentage of total linear travel (which is 5 mmfor all sensors). Following this approach, a perfectly stable sensor would then register 0% deviationthrough time.
Figure 5-3. Comparison of LVDT response during long duration testing.

INL/EXT-09-16972 22
As indicated Figure 5-3, Vendor A LVDTs were found to be very stable through ~330 h. Their maxi-mum deviation during that period is equivalent to a displacement of ~0.004 mm relative to their time 0position. (Note that ~25 h were set aside for stabilization at 500 °C before marking time 0.) However,some periodic fluctuations in the response of Vendor A LVDTs began to appear after ~330 h. Those fluc-tuations, primarily affecting LVDT A2, remained relatively small for more than 350 h. Just before theunplanned power outage (at ~700 h), LVDT A2 fluctuations dramatically increased in both magnitude andduration. Shortly thereafter, LVDT A1 signal fluctuations increased; with relatively frequent oscillationsuntil the end of the 1000 h test.
Although the reason (or reasons) for the behavior of Vendor A LVDTs during the later part of the longduration test are still under investigation, the vendor has indicated that they have observed similar trends asa result of insulation degradation. Furthermore, Vendor A has indicated that they believe they can correctthe long term behavior through alteration of the LVDT heat treatment process.
Results for Vendor B LVDTs differ significantly compared to Vendor A. Specifically, Vendor BLVDTs show substantial oscillation (starting at time 0) in addition to (as yet unexplained) dramatic stepchanges in indicated deviations (near 130 h for LVDT B1 and near 210 h for LVDT B2). In fact, theLVDT B1 step change is equivalent to a displacement of ~0.6 mm, indicating a reduction in stability by afactor of ~150 compared to Vendor A LVDTs during the first 330 h of the test.
Further differences between the initial LVDT responses from the two vendors are illustrated in finerdetail in Figure 5-4. As indicated, the LVDT A1 response remains very flat with only minor perturbations.In contrast, LVDT B1 shows considerable oscillation during the entire displayed period. The more or lessperiodic oscillations produced by LVDT B1 are approximately equivalent to a displacement of 0.007 to0.010 mm; representing values that were not exceeded by Vendor A LVDTs during the first 330 h of thelong duration test. In addition, perturbations in LVDT B1 outputs near 83 and 84.8 h represent unexpectedoutput deviations that are three times larger (approaching 0.03 mm).
To date, Vendor B has not provided their evaluation or interpretation of their long duration results.However, considerable oxidation of the Vendor B LVDT cores occurred during the long duration test asindicated in Figure 5-5. This discovery was unexpected given that all LVDTs were calibrated at 500 °Cwithout showing any evidence of oxidation. Furthermore, Vendor B cores were reported to be stainlesssteel, which should not have oxidized at the test temperature. Note the nearly pristine condition of all otherpictured components subjected to the same conditions.
Although it is unclear whether oxidation had an adverse impact on Vendor B LVDT response duringthe long duration test, oxidation is not a desirable outcome. This oxidation and the perturbations observedduring the test clearly favor the Vendor A LVDT design for use in ATR irradiation experiments. However,some additional evaluation of the Vendor A LVDT behavior may be needed to resolve instabilities for longduration use at high temperatures.
5.3. Summary
LVDTs must operate reliably for extended periods at elevated temperatures in order to be useful inATR in-pile experiments. For that reason, LVDT testing for a period of 1000 h at 500 °C was completed.Results from this testing clearly favor the Vendor A (IFE-HRP) LVDT design. Specifically, Vendor ALVDTs were found to be very stable at 500 °C for ~300 h. In contrast, Vendor B LVDTs show consider-

23 INL/EXT-09-16972
Figure 5-4. Comparison of the response of LVDTs A1 and B1 during long duration testing.
Figure 5-5. Comparison of LVDT cores following the long duration test at 500 °C (where both Vendor B cores are shown centered between the Vendor A cores).

INL/EXT-09-16972 24
able noise, oscillation, and (as yet unexplainable) step changes in output during long duration testing.Based on these long duration results, Vendor B LVDTs would not be acceptable for use in the ATR.
Some additional testing of Vendor A LVDTs is needed to resolve stability issues that were observed inthe later portion of the long duration test. Based on a review by Vendor A, these issues may be related todegradation of the LVDT insulation, which may be resolved through modification of heat treatmentapplied during fabrication. Furthermore, testing is needed to evaluate the effects of a material-specificCurie temperature transition, which is described in the next section of this report.

25 INL/EXT-09-16972
6. CURIE POINT EVALUATION
Based on calibration and long duration results (provided in Sections 4 and 5, respectively), LVDTsmanufactured by IFE-HRP (or Vendor A) were found to be the preferred design for use in the ATR.Although these LVDTs have been successfully deployed at the Halden Boiling Water Reactor (HBWR) fordecades, there are questions that must be addressed prior to their use in the ATR. In particular, there areconcerns because current generation LVDTs manufactured by IFE-HRP are known to experience an abruptchange in their output signal near 360 °C. In this case, the output signal change corresponds with passingthrough the Curie point of the nickel coating on the wire used in the primary and secondary coils.
Calibration and long duration evaluations have demonstrated that IFE-HRP LVDTs function asexpected both above and below the Curie point. In addition, there appears to be no impact relative to out-put repeatability as a result of passing through the Curie point. (See Sections 4 and 5, respectively.) Conse-quently, it would seem that the existence of this output signal change would be of concern only if a IFE-HRP LVDT was operated at (or very near) its Curie temperature.
An evaluation of this effect was needed, however, because LVDTs may be used in ATR test loopsoperating at pressurized water reactor conditions (or ~15 MPa and ~300 °C). As reported in Section 7,gamma heating under these conditions could increase LVDT temperatures to levels of concern (dependingon the in-core position). The Curie point temperature, the affected temperature range, and the magnitude ofthe output signal change were of primary interest in this evaluation, which is described in the remainder ofthis section.
It should be noted that IFE-HRP is sending INL several “developmental” LVDTs for further evalua-tion that will have a silver alloy wire in the primary and secondary coils. This silver alloy wire should befree of the Curie point issues of their current generation of LVDTs. Results from this evaluation (of thecurrent generation of LVDTs), and the related evaluation of LVDTs with silver alloy wire (when thoseinstruments become available), will be useful in determining the importance of implementing a formalLVDT modification using an alternative wire that is free from Curie point effects.
6.1. Setup
A series of heatup tests were conducted to determine the Curie point temperature, the affected temper-ature range, and the magnitude of the output signal change. All heatup tests were conducted using IFE-HRP LVDT 1095 in a Lindberg horizontal split tube furnace as shown in Figure 6-1. (Note that the Lind-berg furnace was used because its temperature controller is relatively stable.)
As indicated in this figure, the calibration fixture was inserted from the right to position the LVDT atthe furnace centerline. (The LVDT body, core, and extension rod were assembled and connected to themicrometer in the calibration fixture as described in Section 4). This arrangement left the micrometer out-side the furnace (and therefore unaffected by furnace heatup). A Type K thermocouple was inserted in thefixture to monitor LVDT temperature independently of the furnace controller. Leads for the thermocouplecan be seen leaving the furnace on the right while LVDT leads can be seen leaving the furnace on the left.All leads were routed to a computerized DAS as shown in Figure 6-2. Insulating blocks were used through-out testing to support the calibration fixture (and the LVDT) thereby preventing direct contact with furnaceheating elements as shown in Figure 6-3.

INL/EXT-09-16972 26
Figure 6-1. Lindberg horizontal split tube furnace used in Curie point heatup tests.
Figure 6-2. Data acquisition system used in Curie point heatup tests.
Furnace
Furnace controller
TC leads
LVDT leads
Calibration fixture
Micrometer
Monitor
National Instrument panels
Multimeters
CPU
LVDT signal conditioner

27 INL/EXT-09-16972
6.2. Heatup Test Results
Four heatup tests were completed. Each test began after a stabilization period at a temperature between300 and 330 °C. Stabilization was considered adequate (or complete) when changes in the Type K thermo-couple remained within ±1 °C for a period of ~5 minutes. At that time, heatup was initiated by setting thefurnace controller to 450 °C. Data, in the form of temperature from the Type K thermocouple and outputvoltage from the LVDT, were collected during the heatup at a frequency of 0.1 Hz. Corresponding resultsare plotted in Figures 6-4 through 6-7.
Results have been summarized in Table 6-1 relative to the Curie point temperature, the affected tem-perature range, and the magnitude of the output signal change. In this table, the Curie point temperaturewas taken to be the temperature corresponding with the largest LVDT output signal change observed dur-ing heatup. (From Figure 6-4, the largest output signal change clearly occurs at a temperature of ~402 °C.)The affected temperature range starts and ends where the LVDT output voltage change starts and ends.(From Figure 6-4, the affected temperature range is between ~398 and ~406 °C.) And finally, the magni-tude of the output signal change is calculated relative to the output signal just before Curie point effectsbegin. (From Figure 6-4, there is a output signal change of ~32%, which is estimated as 100 x [-1.240-{-1.632}/-1.240].)
Results from Table 6-1 indicate that the Curie temperature lies between ~380 and ~400 °C. This dif-fers from the estimate of ~360 °C provided by IFE-HRP.3 The fact that the Type K thermocouple willrespond faster than the LVDT is the most likely reason for this discrepancy. As heatup progresses, the rel-
Figure 6-3. Insulating blocks as used to prevent fixture/heating element contact in Curie point heatup tests.
Insulating block
Heating element (1 of 4)Calibration fixture
LVDT

INL/EXT-09-16972 28
Figure 6-4. Heatup test 1 in the Curie point evaluation.
Figure 6-5. Heatup test 2 in the Curie point evaluation.
-2.0
-1.8
-1.6
-1.4
-1.2
-1.0
380 390 400 410 420
Heatup 01
Out
put v
olta
ge (V
)
Temperature (C)
-0.80
-0.60
-0.40
-0.20
360 370 380 390 400
Heatup 02
Out
put v
olta
ge (V
)
Temperature (C)

29 INL/EXT-09-16972
Figure 6-6. Heatup test 3 in the Curie point evaluation.
Figure 6-7. Heatup test 4 in the Curie point evaluation.
-1.0
-0.80
-0.60
-0.40
370 380 390 400 410
Heatup 03
Out
put v
olta
ge (V
)
Temperature (C)
-0.80
-0.70
-0.60
-0.50
-0.40
-0.30
360 370 380 390 400
Heatup 04
Out
put v
olta
ge (V
)
Temperature (C)

INL/EXT-09-16972 30
atively massive LVDT will take longer to heat than the (1.6 mm OD) thermocouple. Therefore, the indi-cated temperature at the maximum signal change (as based on the Type K thermocouple reading) willprobably be higher than the actual temperature of the LVDT. The effect of this problem could be mini-mized (or eliminated) if the heatup rate was reduced to a point where all heated components remain inquasi-thermal equilibrium throughout the tests. However, there are no provisions to control the heatup rateof the Lindberg furnace that was used in this evaluation.
Although Table 6-1 temperatures at the maximum signal change will be higher than the actual Curiepoint, the temperature range associated with the Curie effect and the magnitude of the output signal changeare probably better estimates. There should be less error associated with the temperature range simplybecause it is the result of a difference (in temperature) as opposed to being tied to an absolute value. There-fore, it may be reasonable to assume that the Curie effect could impact LVDT response over a temperaturerange of ~4 °C as indicated in Table 6-1. Like the temperature range, the signal change associated with theCurie point is also the result of a difference (in output signals). As such, it may be reasonable to assumethat the Curie effect could alter the LVDT output by as much as ~60%. Although the impact of such anoutput variation may be considered unacceptable, it should be noted that this effect would only be realizedif the LVDT was used within ±2 °C of the actual Curie point. In addition, a higher data sampling frequencymay lead to some reduction in the affected temperature range. These results tend to support the assumptionthat the existence of the Curie point would be of concern only if a IFE-HRP LVDT was operated at (orvery near) its affected temperature.
6.3. Summary
An evaluation of IFE-HRP LVDTs was needed before use in the ATR because the current generationof these instruments are known to experience an abrupt change in their output signal due the effects ofpassing through the Curie point. The evaluation, which consisted of a series of four heatup tests, wasdesigned to determine the Curie point temperature, the affected temperature range, and the magnitude ofthe output signal change. Each test consisted of the collection of LVDT output voltage and temperaturewhile heating from ~300 to ~450 °C. The results indicate the Curie point occurs at a temperature between~380 and ~400 °C, which is somewhat higher than the IFE-HRP estimate of ~360 °C. This discrepancycould be minimized (or eliminated) if the heatup rate was reduced to a point where all heated componentsremain in quasi-thermal equilibrium throughout the tests. In addition, results indicate the Curie effect couldalter the LVDT output by as much as ~60%, although the impact of such an output variation would only berealized if the LVDT was used within ±2 °C of the actual Curie point. These results tend to support theassumption that the existence of the Curie point would be of concern only if a IFE-HRP LVDT was oper-ated at (or very near) its affected temperature.
Table 6-1. Curie point evaluation summary.
Test Temperature at maximum signal change (°C)
Temperature range of signal change (°C)
Signal change (% relative to lowest unaffected temperature)
1 402 8 (406-398) -32
2 379 4 (381-377) -64
3 389 4 (390-386) -10
4 379 4 (381-377) -51

31 INL/EXT-09-16972
7. GAMMA HEATING EVALUATION
Based on calibration and long duration results (provided in Sections 4 and 5, respectively), LVDTsmanufactured by IFE-HRP (or Vendor A) were found to be the preferred design for use in the ATR.Although these LVDTs have been successfully deployed at the Halden Boiling Water Reactor (HBWR) fordecades, there are questions that must be addressed prior to their use in the ATR. In particular, there areconcerns about the impact of the higher testing temperatures and power levels in the ATR with the corre-sponding impact of higher gamma heating.
This section contains a thermal analysis completed to evaluate the potential impact on LVDT tempera-tures due to gamma heating. To bound the potential impact, the analysis was completed assuming that theLVDTs will be placed in ATR flux traps. The analysis was based on the use of ABAQUS, Version 6.8-2.4
(Note that a core physics evaluation could be performed which would allow scaling of these results to rep-resent the thermal effects that could be expected if the LVDTs were placed in any of the lower flux irradi-ation locations available in the ATR.)
7.1. ABAQUS Model and Input
The LVDT core (with an OD of 3.2 mm) was modeled as a cylinder concentric with the LVDT body(with an ID of 4 mm and an OD of 14 mm). Standard metric units (kg, W, °C, s) were used, except thatmillimeters were used for length. This is because when meters were used, the mesh becomes problematic(elements do not meet geometric requirements for validity). The corresponding finite-element mesh, asshown in Figure 7-1, was automatically generated by ABAQUS based on a global seed size of 0.2 mm.
In this analysis, the LVDT (core and body) was modeled as stainless steel. Temperature dependentthermal properties for the steel were inputs in the simulation. Those properties were taken fromReference 5 over the range of 200 to 1000 °C.
A gap exists between the core and body of the LVDT. Conduction and radiation heat transfer weremodeled in this gap. Gap conductivity was estimated as that of helium at 450 °C (which was assumed to benear the expected gas temperature).6 Emissivities of the surfaces were varied from 0.2 (polished steel) to0.8 (heavily oxidized) to represent different levels of oxidation that may be present.6
Cooling by fluid flow along the outer LVDT body was modeled using a convection film condition.This film condition was based on calculations using the in-pile tube and coolant conditions (in-pile tubediameter, coolant temperature, flow velocity, etc.) listed in Table 7-1. Coolant thermal properties (at350 °C) were taken from Reference 6. (Note that 350 °C, which is near the saturation temperature for anATR flux trap, was selected as a way to bound LVDT gamma heating. However, some degree of subcool-ing would actually be required in practice.)
Gamma heat generation varies according to position in the core. Gamma heating rates for stainlesssteel (in W/g) as a function of axial position in the center flux trap for a peak power 27.6 MW are shown inFigure 7-2.7 Under the same conditions, the northeast and northwest traps provide a peak power of 18 MWwhile the southeast and southwest traps provide a peak power of 25 MW. Sensitivity calculations were per-formed to evaluate maximum LVDT temperatures for a range of power. (In all cases, heating rates wereconverted to W/mm3 using the stainless steel density, as ABAQUS requires a volumetric heat load.)

INL/EXT-09-16972 32
7.2. Results
Radial temperature profiles of the LVDT core and body calculated by ABAQUS are shown inFigure 7-3 for a position in the center flux trap (with a peak power of 27.6 MW) at the mid-plane of thecore. These temperatures were validated using hand calculations and equations from Reference 6.
Figure 7-3 results indicate that the assumed emissivities had little impact on predicted body and coretemperatures. It was also observed that surface cooling coefficient had negligible effect on temperatures
Figure 7-1. LVDT body and core with automatically generated finite element mesh.
Table 7-1. Surface coolant conditions.
Condition Magnitudes Considered
Temperature 350 °C
Flow velocity 3 to 6 m/s
Pressure 15.9 MPa
In-pile tube diameter 44 cm and 102 cm
In-pile tube and LVDT surface roughness 0.002 mm6

33 INL/EXT-09-16972
Figure 7-2. Gamma heating rates as a function of axial position for the ATR center flux trap.
Figure 7-3. Radial temperature profiles at maximum heat generation.
0.00
2.00
4.00
6.00
8.00
10.00
12.00
�50.0 �40.0 �30.0 �20.0 �10.0 0.0 10.0 20.0 30.0 40.0 50.0
Inches�from�Core�Mid�Plane
Watts�per�Gram
340
360
380
400
420
440
460
480
0 1 2 3 4 5 6 7
�������������
Distance from LVDT Center, mm

INL/EXT-09-16972 34
(either within the LVDT body or at the center of the LVDT core), thus the simulation was carried out usingthe minimum cooling coefficient value. Convection within the gas gap was calculated and observed to benegligible when compared to radiant and conductive heat transfer.
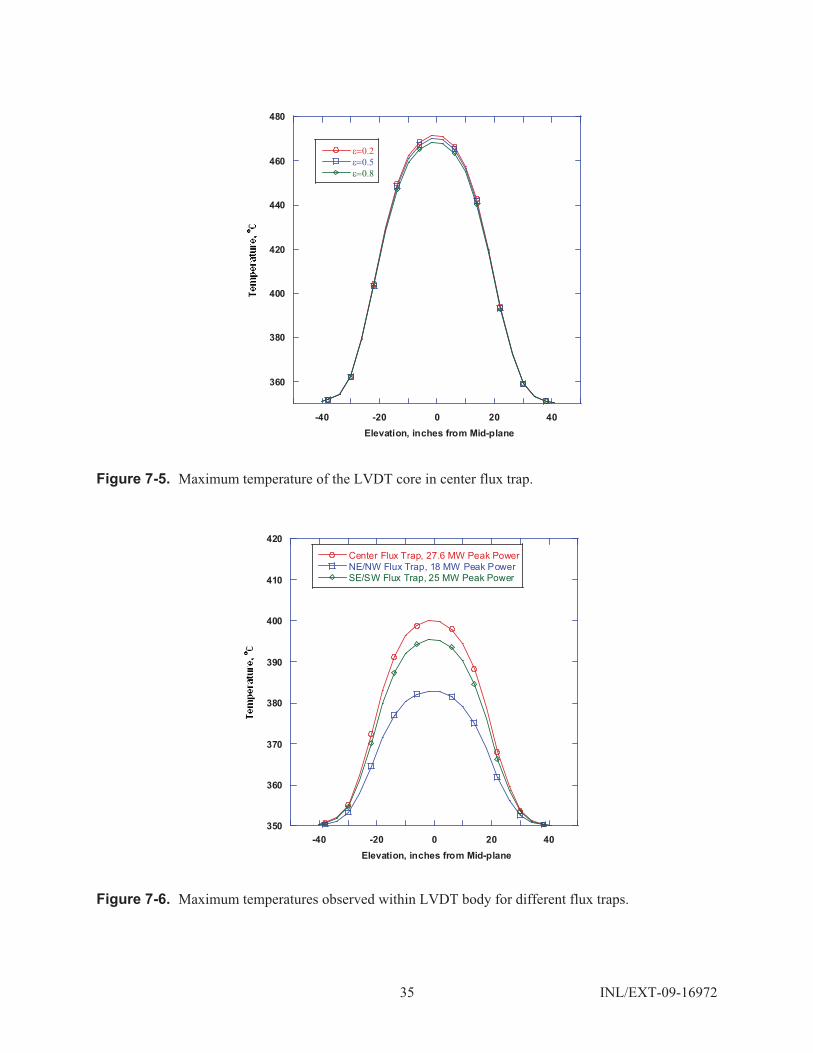
Maximum LVDT body temperatures, in the center flux trap, as a function of reactor core elevation areshown in Figure 7-4. As expected (due to the cylindrical geometry, internal heat generation, and insulatinggas gap), the maximum temperature observed within the body was along the inner wall, opposite the core.The maximum temperature observed within the LVDT body was 400 °C. This value was constant for allemissivity values. Maximum temperatures observed within the LVDT core are shown in Figure 7-5.
The temperature data shown in the preceding figures were produced using power levels seen in theATR center flux trap. Other flux traps may be used for irradiation testing with lower peak power levels.The northeast and northwest traps typically run with peak powers of 18 MW, while the southeast andsouthwest traps typically run with peak power levels of 25 MW. Maximum temperatures observed in theLVDT body (emissivity = 0.2 for all cases) are compared in Figure 7-6. As shown in this figure, peak tem-peratures can be decreased by over 20 °C.
7.3. Summary
To assess the impact on gamma heating on LVDT temperatures, calculations were performed assum-ing that these sensors were placed at several irradiation locations in the ATR. Results presented inSection 7.2 indicate that peak LVDT temperatures will remain very close to 400 °C. As noted in
Figure 7-4. Maximum temperature of the LVDT body in center flux trap.
350
360
370
380
390
400
410
-40 -20 0 20 40
�������������
Elevation, inches from Mid-plane
35 INL/EXT-09-16972
Figure 7-5. Maximum temperature of the LVDT core in center flux trap.
Figure 7-6. Maximum temperatures observed within LVDT body for different flux traps.
360
380
400
420
440
460
480
-40 -20 0 20 40
�������������
Elevation, inches from Mid-plane
350
360
370
380
390
400
410
420
-40 -20 0 20 40
Center Flux Trap, 27.6 MW Peak PowerNE/NW Flux Trap, 18 MW Peak PowerSE/SW Flux Trap, 25 MW Peak Power
Elevation, inches from Mid-plane
INL/EXT-09-16972 36
Section 7.1, IFE-HRP LVDTs have run for long durations in the HBWR at 350 °C without experiencingdegradation. Therefore, the predicted temperatures of 400 °C (due to gamma heating) may not be of con-cern. Furthermore, these results are well below the temperature of 500 °C where HTTL tests have shownthat LVDT signals can degrade if the sensors are exposed for prolonged periods.8 Note that efforts areunderway to improve IFE-HRP LVDT long duration performance at temperatures up to 500 °C (and possi-bly higher).
These results were based on an assumed coolant temperature of 350 °C, which was selected to boundpossible LVDT temperatures. However, a coolant temperature of ~300 °C would be more likely given theneed for subcooling in the ATR flux traps. In that case, peak LVDT temperatures would be expected todecrease by ~50 °C, which would mean that parts of the LVDT body could be very near the Curie temper-ature of ~360 °C. Clearly, the possibility of operating near the Curie temperature would require furtherevaluation before actual ATR testing occurs to ensure that LVDT response is not adversely affected. Suchevaluation would need very specific data relative to power levels, sensor position, and coolant conditions.

37 INL/EXT-09-16972
8. CONCLUSIONS AND RECOMMENDATIONS
Initial evaluations of candidate LVDTs have been completed at INL as a first step in establishing suit-ability for use during ATR high temperature irradiation experiments. Two nuclear grade LVDTs were con-sidered - a smaller diameter design (from Vendor A or the IFE-HRP) qualified for temperatures up to350 °C and a larger design (from Vendor B) with capabilities to 500 °C. Initial evaluation efforts includedcollecting calibration data as a function of temperatures up to 500 °C and long duration (1000 h) testing ofthe output response while LVDTs were held at high temperature (500 °C). A comprehensive series of testswere conducted before these evaluations to ensure that LVDT outputs were unaffected by use of special-ized fixtures and unaffected by the operation of other nearby LVDTs. The evaluation then focused on thepotential for any changes or degradation in sensitivity and/or electrical resistance that may develop as aresult of high temperature operation. After calibration and long duration evaluations, additional testing wascompleted for the more promising design to detect the changes that occur when some of its components aresubjected to their Curie temperature. Furthermore, analyses were completed to determine the potentialimpact of gamma heating on temperatures of the most promising LVDT design.
Calibration results clearly favor the Vendor A (IFE-HRP) LVDT design for use in ATR irradiationexperiments. Vendor A LVDTs show relatively small deviations from linear behavior (compared toVendor B LVDTs) and their deviations are symmetric (where Vendor B LVDT deviations are not). Sensi-tivities of Vendor A LVDTs increase (nearly linearly) with temperature. In contrast, Vendor B LVDT sen-sitivities increase with temperature to ~300 °C and sharply drop thereafter. Furthermore, Vendor A LVDTpre- and post-calibration room temperature sensitivities are essentially equivalent while Vendor B pre- andpost-calibration sensitivities differ appreciably, indicating a lack of robustness in the Vendor B design.Finally, Vendor B LVDT insulation resistances drop to unreasonably low values at high temperatureswhile Vendor A resistances do not. For these reasons, Vendor B LVDTs would not be acceptable for use inthe ATR.
Long duration results clearly favor the Vendor A (IFE-HRP) LVDT design. Specifically, Vendor ALVDTs were found to be very stable at 500 °C for ~300 h. In contrast, Vendor B LVDTs show consider-able noise, oscillation, and unexplainable step changes in output during long duration testing. Some addi-tional testing of Vendor A LVDTs is needed to resolve stability issues that were observed in the laterportion of the long duration test. Based on a review by IFE-HRP, these issues may be related to degrada-tion of the LVDT insulation, which may be resolved through modification of heat treatment applied duringfabrication. Based on these long duration results, Vendor B LVDTs would not be acceptable for use in theATR.
A Curie point evaluation for Vendor A (IFE-HRP) LVDTs was completed because they are the mostpromising design for use in the ATR and because these LVDTs are known to undergo a step change in sig-nal output when passing through the Curie temperature. The results indicate the Curie point occurs at atemperature between ~380 and ~400 °C, which is somewhat higher than the IFE-HRP estimate of ~360 °C.This discrepancy could be minimized (or eliminated) if the heatup rate was reduced to a point where allheated components remain in quasi-thermal equilibrium throughout the tests. In addition, results indicatethe Curie effect could alter the LVDT output by as much as ~60%, although the impact of such an outputvariation would only be realized if the LVDT was used within ±2 °C of the actual Curie point. Theseresults tend to support the assumption that the existence of the Curie point would be of concern only if aIFE-HRP LVDT was operated at (or very near) its affected temperature.

INL/EXT-09-16972 38
Calculations were also performed to assess the potential impact of gamma heating on Vendor A (IFE-HRP) LVDT temperatures. Results indicate that peak LVDT body temperatures should not exceed 400 °Cassuming LVDT placement at the highest flux trap location at a power level of ~28 MWt with an assumedcoolant temperature of 350 °C. Although long duration tests have shown that LVDT signals degrade if thesensors are exposed to 500 °C temperatures for over 700 hours, efforts are underway to improve their per-formance to allow long duration use at temperatures up to 500 °C (and possibly higher). Lower tempera-tures would be expected with reduced power levels, LVDT placement at lower flux level positions, and/orlower coolant temperatures. The assumed coolant temperature of 350 °C, which is near the saturation tem-perature for an ATR flux trap, would most likely be closer to ~300 °C to address the need for subcooling.In that case, the peak LVDT body temperature could drop from 400 °C to ~350 °C, which would mean thatparts of the LVDT body could be very near the Curie temperature of ~360 °C. Clearly, the possibility ofoperating near the Curie temperature would require further evaluation before actual ATR testing occurs toensure that LVDT response is not adversely affected. Such evaluation would need very specific data rela-tive to power levels, sensor position, and coolant conditions.
Efforts to improve long duration high temperature performance include modified heat treatments dur-ing LVDT fabrication to stabilize insulation materials. Furthermore, IFE-HRP will ship “developmental”LVDTs to INL for additional evaluation that use a silver alloy wire in primary and secondary coils. Thismodification should yield an LVDT design that is not subject to the Curie temperature effect. Assessmentof these refinements will be completed and reported in a 2010 revision of this document. Associated resultswill be provided as the first step in qualifying these sensors for possible ATR use.

39 INL/EXT-09-16972
9. REFERENCES
1. Solstad, S., and R. V. Nieuwenhove, “Instrument Capabilities and Developments at the Halden Reac-tor Project,” Proceedings of the ANS NPIC HMIT 2009 Topical Meeting on Nuclear Plant Instru-mentation, Controls, and Human Machine Interface Technology, Knoxville, TN, April 2009.
2. Wolf, J. R., “The Linear Variable Differential Transformer and its Uses for In-Core Fuel Rod Behav-ior Measurements,” International Colloquium on Irradiation Tests for Reactor Safety Programmes,Petten, The Netherlands, June 25-28, 1979.
3. IFE-HRP email to J. Rempe, INL, 2008.
4. ABAQUS/CEA, Version 6.8-2, Providence, Rhode Island, USA: Dassault Systèmes, 2008.
5. Touloukian, Y. S., et al., Thermophysical Properties of Matter, IFI/Plenum Publishing, New York,New York, 1973.
6. Cengel, Y. A., Heat Transfer, A Practical Approach, Second Edition, McGraw Hill, 2003.
7. Parry, J., INL, email to D. Knudson, INL, April 28, 2009.
8. Knudson, D. L., and J. L. Rempe, “LVDT Evaluations for ATR Irradiations,” Proceedings of theANS NPIC HMIT 2009 Topical Meeting on Nuclear Plant Instrumentation, Controls, and HumanMachine Interface Technology, Knoxville, TN, April 2009.

INL/EXT-09-16972 40

A-1 INL/EXT-09-16972
APPENDIX A - FIXTURE INTERFERENCE CALIBRATION DATA
Table A-1. Set 1 interference calibration outside all fixtures.
Date 9-16-2008 & 9-29-2008 Tester signatureCalibration at room temperature Furnace setpoint naLVDT
Vendor A 1097 (core 1060) Vendor B 1449
Secondary Coil Resistancesa
a. LVDT resistance measurements using Fluke 8808A, serial number 9556082.
Loops Wire colors Resistance ( ) Loops Wire colors Resistance ( )A+B red/white 392.7 A+B green/red 122.3
A black/red 646.3B black/white 646.7
Insulation Resistance ( ) Insulation Resistance ( )shield-wire >100e6 shield-wire >100e6
primary-secondary >100e6 primary-secondary >100e6
Primary Coil Resistancesa
Loop Wire colors Resistance ( ) Loop Wire colors Resistance ( )red/white 91.7 black/white 41.57
Insulation Resistance ( ) Insulation Resistance ( )shield-wire >100e6 shield-wire >100e6
Displacement Data
Micrometer (in)b
b. Uncorrected relative to the “null” position at “0”.
Output(decreasing Vdc)
Output(increasing Vdc) Micrometer (in)b
Output(increasing Vdc)
Output(decreasing Vdc)
.142 9.118 9.120 .100 -9.734 -9.734
.167 7.850 7.850 .125 -8.654 -8.658
.192 6.602 6.604 .150 -7.525 -7.524
.217 5.397 5.398 .175 -6.345 -6.347
.242 4.230 4.230 .200 -5.126 -5.115
.267 3.106 3.107 .225 -3.874 -3.864
.292 2.035 2.037 .250 -2.598 -2.601
.317 1.007 1.010 .275 -1.305 -1.295
.342 -.001 .005 .300 -.001 -.001
.367 -1.003 -.998 .325 1.305 1.301
.392 -2.026 -2.021 .350 2.599 2.608
.417 -3.095 -3.088 .375 3.882 3.879
.442 -4.207 -4.200 .400 5.139 5.139
.467 -5.371 -5.365 .425 6.368 6.366
.492 -6.580 -6.575 .450 7.561 7.561
.517 -7.825 -7.824 .475 8.711 8.712
.542 -9.093 -9.093 .500 9.813 9.813
� �
� �
� �
� �

INL/EXT-09-16972 A-2
Table A-2. Set 1 interference calibration inside calibration fixture.
Date 9-17-2008 & 9-29-2008 Tester signature
Calibration at room temperature Furnace setpoint naLVDT
Vendor A 1097 (core 1060) Vendor B 1449
Secondary Coil Resistancesa
Loops Wire colors Resistance ( ) Loops Wire colors Resistance ( )A+B red/white 392.7 A+B green/red 122.3
A black/red 646.3B black/white 646.7
Insulation Resistance ( ) Insulation Resistance ( )shield-wire >100e6 shield-wire >100e6
primary-secondary >100e6 primary-secondary >100e6
Primary Coil Resistancesa
Loop Wire colors Resistance ( ) Loop Wire colors Resistance ( )red/white 91.7 black/white 44.57
Insulation Resistance ( ) Insulation Resistance ( )shield-wire >100e6 shield-wire >100e6
Displacement Data
Micrometer (in)bOutput
(decreasing Vdc)Output
(increasing Vdc) Micrometer (in)bOutput
(increasing Vdc)Output
(decreasing Vdc).097 9.125 9.112 .100 -9.581 -9.587.122 7.853 7.843 .125 -8.522 -8.529.147 6.608 6.599 .150 -7.405 -7.409.172 5.401 5.392 .175 -6.254 -6.249.197 4.238 4.230 .200 -5.056 -5.051.222 3.116 3.106 .225 -3.824 -3.820.247 2.044 2.032 .250 -2.570 -2.564.272 1.009 1.004 .275 -1.297 -1.303.297 -.004 -.006 .300 -.006 -.011.322 -1.012 -1.015 .325 1.266 1.272.347 -2.043 -2.043 .350 2.540 2.548.372 -3.109 -3.110 .375 3.800 3.798.397 -4.224 -4.223 .400 5.041 5.039.422 -5.388 -5.386 .425 6.255 6.245.447 -6.597 -6.592 .450 7.430 7.419.472 -7.841 -7.837 .475 8.561 8.552.497 -9.111 -9.111 .500 9.643 9.643
a. LVDT resistance measurements using Fluke 8808A, serial number 9556082.b. Uncorrected relative to the “null” position at “0”.
� �
� �
� �
� �

A-3 INL/EXT-09-16972
Table A-3. Set 1 interference calibration inside long duration fixture.
Date 9-30-2008 Tester signature
Calibration at room temperature Furnace setpoint naLVDT
Vendor A 1097 (core 1060) Vendor B 1449
Secondary Coil Resistancesa
Loops Wire colors Resistance ( ) Loops Wire colors Resistance ( )A+B red/white 392.7 A+B green/red 122.3
A black/red 646.3B black/white 646.7
Insulation Resistance ( ) Insulation Resistance ( )shield-wire >100e6 shield-wire >100e6
primary-secondary >100e6 primary-secondary >100e6
Primary Coil Resistancesa
Loop Wire colors Resistance ( ) Loop Wire colors Resistance ( )red/white 91.7 black/white 44.57
Insulation Resistance ( ) Insulation Resistance ( )shield-wire >100e6 shield-wire >100e6
Displacement Data
Micrometer (in)bOutput
(decreasing Vdc)Output
(increasing Vdc) Micrometer (in)bOutput
(increasing Vdc)Output
(decreasing Vdc).100 9.124 9.124 .100 -9.456 -9.451.125 7.854 7.856 .125 -8.404 -8.396.150 6.611 6.610 .150 -7.298 -7.291.175 5.405 5.404 .175 -6.151 -6.145.200 4.244 4.244 .200 -4.962 -4.958.225 3.126 3.121 .225 -3.744 -3.738.250 2.057 2.050 .250 -2.500 -2.497.275 1.024 1.022 .275 -1.240 -1.234.300 .015 -.011 .300 .029 .028.325 -.994 -.998 .325 1.301 1.309.350 -2.019 -2.032 .350 2.562 2.569.375 -3.087 -3.090 .375 3.811 3.811.400 -4.198 -4.197 .400 5.037 5.045.425 -5.359 -5.359 .425 6.235 6.231.450 -6.551 -6.563 .450 7.395 7.401.475 -7.793 -7.790 .475 8.514 8.513.500 -9.064 -9.064 .500 9.586 9.586
a. LVDT resistance measurements using Fluke 8808A, serial number 9556082.b. Uncorrected relative to the “null” position at “0”.
� �
� �
� �
� �

INL/EXT-09-16972 A-4
Table A-4. Set 2 interference calibration outside all fixtures.
Date 9-17-2008 & 9-25-2008 Tester signature
Calibration at room temperature Furnace setpoint naLVDT
Vendor A 1096 (core 1059) Vendor B 1444
Secondary Coil Resistancesa
Loops Wire colors Resistance ( ) Loops Wire colors Resistance ( )A+B red/white 385.8 A+B green/red 129.6
A black/red 635.8B black/white 636.2
Insulation Resistance ( ) Insulation Resistance ( )shield-wire >100e6 shield-wire 27e6
primary-secondary >100e6 primary-secondary 19e6
Primary Coil Resistancesa
Loop Wire colors Resistance ( ) Loop Wire colors Resistance ( )red/white 92.7 black/white 42.63
Insulation Resistance ( ) Insulation Resistance ( )shield-wire >100e6 shield-wire 27e6
Displacement Data
Micrometer (in)bOutput
(decreasing Vdc)Output
(increasing Vdc) Micrometer (in)bOutput
(increasing Vdc)Output
(decreasing Vdc).110 9.143 9.145 .106 -9.924 -9.925.135 7.873 7.875 .131 -8.841 -8.842.160 6.630 6.629 .156 -7.697 -7.695.185 5.424 5.423 .181 -6.495 -6.494.210 4.261 4.261 .206 -5.251 -5.251.235 3.139 3.137 .231 -3.969 -3.969.260 2.056 2.055 .256 -2.664 -2.663.285 1.022 1.021 .281 -1.336 -1.346.310 .011 .009 .306 .000 .000.335 -1.000 -1.000 .331 1.334 1.337.360 -2.030 -2.029 .356 2.656 2.659.385 -3.097 -3.096 .381 3.971 3.966.410 -4.212 -4.210 .406 5.257 5.256.435 -5.374 -5.373 .431 6.510 6.501.460 -6.578 -6.576 .456 7.719 7.710.485 -7.821 -7.818 .481 8.887 8.886.510 -9.087 -9.087 .506 9.999 9.999
a. LVDT resistance measurements using Fluke 8808A, serial number 9556082.b. Uncorrected relative to the “null” position at “0”.
� �
� �
� �
� �

A-5 INL/EXT-09-16972
Table A-5. Set 2 interference calibration inside calibration fixture.
Date 9-17-2008 & 9-29-2008 Tester signature
Calibration at room temperature Furnace setpoint naLVDT
Vendor A 1096 (core 1059) Vendor B 1444
Secondary Coil Resistancesa
Loops Wire colors Resistance ( ) Loops Wire colors Resistance ( )A+B red/white 385.8 A+B green/red 129.6
A black/red 635.8B black/white 636.2
Insulation Resistance ( ) Insulation Resistance ( )shield-wire >100e6 shield-wire 27e6
primary-secondary >100e6 primary-secondary 19e6
Primary Coil Resistancesa
Loop Wire colors Resistance ( ) Loop Wire colors Resistance ( )red/white 92.7 black/white 42.63
Insulation Resistance ( ) Insulation Resistance ( )shield-wire >100e6 shield-wire 27e6
Displacement Data
Micrometer (in)bOutput
(decreasing Vdc)Output
(increasing Vdc) Micrometer (in)bOutput
(increasing Vdc)Output
(decreasing Vdc).100 9.126 9.122 .100 -9.877 -9.874.125 7.855 7.853 .125 -8.797 -8.793.150 6.609 6.608 .150 -7.651 -7.652.175 5.401 5.398 .175 -6.458 -6.458.200 4.238 4.235 .200 -5.217 -5.217.225 3.116 3.114 .225 -3.944 -3.944.250 2.039 2.037 .250 -2.644 -2.643.275 1.004 1.005 .275 -1.322 -1.322.300 -.005 -.006 .300 .007 .008.325 -1.012 -1.015 .325 1.340 1.339.350 -2.040 -2.040 .350 2.654 2.662.375 -3.108 -3.106 .375 3.962 3.951.400 -4.220 -4.217 .400 5.236 5.228.425 -5.382 -5.379 .425 6.479 6.474.450 -6.590 -6.586 .450 7.689 7.689.475 -7.833 -7.831 .475 8.846 8.835.500 -9.101 -9.101 .500 9.943 9.943
a. LVDT resistance measurements using Fluke 8808A, serial number 9556082.b. Uncorrected relative to the “null” position at “0”.
� �
� �
� �
� �

INL/EXT-09-16972 A-6
Table A-6. Set 2 interference calibration inside long duration fixture.
Date 9-30-2008 & 9-25-2008 Tester signature
Calibration at room temperature Furnace setpoint naLVDT
Vendor A 1096 (core 1059) Vendor B 1444
Secondary Coil Resistancesa
Loops Wire colors Resistance ( ) Loops Wire colors Resistance ( )A+B red/white 385.8 A+B green/red 129.6
A black/red 635.8B black/white 636.2
Insulation Resistance ( ) Insulation Resistance ( )shield-wire >100e6 shield-wire 27e6
primary-secondary >100e6 primary-secondary 19e6
Primary Coil Resistancesa
Loop Wire colors Resistance ( ) Loop Wire colors Resistance ( )red/white 92.7 black/white 42.63
Insulation Resistance ( ) Insulation Resistance ( )shield-wire >100e6 shield-wire 27e6
Displacement Data
Micrometer (in)bOutput
(decreasing Vdc)Output
(increasing Vdc) Micrometer (in)bOutput
(increasing Vdc)Output
(decreasing Vdc).100 9.089 9.084 .106 -9.825 -9.825.125 7.815 7.814 .131 -8.753 -8.752.150 6.575 6.570 .156 -7.616 -7.616.175 5.370 5.365 .181 -6.428 -6.424.200 4.212 4.216 .206 -5.192 -5.189.225 3.102 3.107 .231 -3.921 -3.920.250 2.034 2.039 .256 -2.626 -2.622.275 1.001 1.008 .281 -1.311 -1.307.300 -.010 -.004 .306 .014 .016.325 -1.013 -1.013 .331 1.331 1.343.350 -2.042 -2.040 .356 2.657 2.658.375 -3.105 -3.105 .381 3.951 3.960.400 -4.217 -4.215 .406 5.232 5.225.425 -5.373 -5.372 .431 6.466 6.464.450 -6.576 -6.576 .456 7.665 7.663.475 -7.815 -7.815 .481 8.817 8.817.500 -9.079 -9.079 .506 9.929 9.929
a. LVDT resistance measurements using Fluke 8808A, serial number 9556082.b. Uncorrected relative to the “null” position at “0”.
� �
� �
� �
� �

B-1 INL/EXT-09-16972
APPENDIX B - CALIBRATION DATA
Table B-1. Set 1 data at 200ºC.
Date 10-28-2008 Tester signature
Calibration at ~200ºC Furnace setpoint 170ºC
LVDTsVendor A 1097 (core 1060) Vendor B 1449
(Uncorrected) Null Settings0.301” 0.295”
Voltage & Calibration Temperature (using a Type K TC)a
a. TC voltage measurements using Agilent 34420A, serial number SG42000457.
Voltage (mV) Temperature (ºC)
Minimum 8.1054951 199 based on
Maximum 8.2128890 202 6133
Average 8.1518400 200 readings
Standard deviation 31.545929e-3 na
Secondary Coil Resistancesb
b. LVDT resistance measurements using Fluke 8808A, serial number 9556082.
Loops Wire colors Resistance ( ) Loops Wire colors Resistance ( )
A+B red/white 425.8 A+B green/red 131.7
A black/red 654.1
B black/white 655.3
Insulation Resistance ( ) Insulation Resistance ( )
shield-wire >100e6 shield-wire ~64e6
primary-secondary >100e6 primary-secondary >100e6
Primary Coil Resistancesb
Loop Wire colors Resistance ( ) Loop Wire colors Resistance ( )
red/white 108.5 black/white 44.76
Insulation Resistance ( ) Insulation Resistance ( )
shield-wire >100e6 shield-wire >100e6
DAS File Names (containing LVDT voltage as a function of core position)c
c. LVDT voltage measurements using VI Logger 2.0.1 with NI-DAQmx 8.0.0f0.
VI logger: 10/28/2008 2:00:28.602 PM 200-01 C
Windows: 200.01-10_28_2008 2_00_28.602 PM.txt
� �
� �
� �
� �

INL/EXT-09-16972 B-2
Table B-2. Set 1 data at 300ºC.
Date 11-4-2008 Tester signature
Calibration at ~300ºC Furnace setpoint 304ºC
LVDTsVendor A 1097 (core 1060) Vendor B 1449
(Uncorrected) Null Settings0.301” 0.292”
Voltage & Calibration Temperature (using a Type K TC)a
Voltage (mV) Temperature (ºC)
Minimum 11.963034 294 based on
Maximum 12.167573 299 3107
Average 12.021332 295 readings
Standard deviation 60.520309e-3 na
Secondary Coil Resistancesb
Loops Wire colors Resistance ( ) Loops Wire colors Resistance ( )
A+B red/white 447.4 A+B green/red 138.1
A black/red 674.1
B black/white 674.7
Insulation Resistance ( ) Insulation Resistance ( )
shield-wire >100e6 shield-wire >100e6
primary-secondary >100e6 primary-secondary >100e6
Primary Coil Resistancesb
Loop Wire colors Resistance ( ) Loop Wire colors Resistance ( )
red/white 119.6 black/white 46.95
Insulation Resistance ( ) Insulation Resistance ( )
shield-wire >100e6 shield-wire >100e6
DAS File Names (containing LVDT voltage as a function of core position)c
VI logger: 11/4/2008 1:37:58.610 PM 300-01 C
Windows: 300.01-11_4_2008 1_37_58.610 PM.txt
a. TC voltage measurements using Agilent 34420A, serial number SG42000457.b. LVDT resistance measurements using Agilent 34420A, serial number SG42000457.c. LVDT voltage measurements using VI Logger 2.0.1 with NI-DAQmx 8.0.0f0.
� �
� �
� �
� �

B-3 INL/EXT-09-16972
Table B-3. Set 1 data at 400ºC.
Date 11-5-2008 Tester signature
Calibration at ~400ºC Furnace setpoint 397ºC
LVDTsVendor A 1097 (core 1060) Vendor B 1449
(Uncorrected) Null Settings0.302” 0.289”
Voltage & Calibration Temperature (using a Type K TC)a
Voltage (mV) Temperature (ºC)
Minimum 16.008503 391 based on
Maximum 16.217540 396 3932
Average 16.102343 393 readings
Standard deviation 65.112813e-3 na
Secondary Coil Resistancesb
Loops Wire colors Resistance ( ) Loops Wire colors Resistance ( )
A+B red/white 466.5 A+B green/red 143.2
A black/red 683.8
B black/white 684.5
Insulation Resistance ( ) Insulation Resistance ( )
shield-wire >100e6 shield-wire >1e6
primary-secondary >100e6 primary-secondary ~0.52e6
Primary Coil Resistancesb
Loop Wire colors Resistance ( ) Loop Wire colors Resistance ( )
red/white 130.4 black/white 49.01
Insulation Resistance ( ) Insulation Resistance ( )
shield-wire >100e6 shield-wire ~0.52e6
DAS File Names (containing LVDT voltage as a function of core position)c
VI logger: 11/5/2008 12:41:24.637 PM 400-01 C
Windows: 400.01-11_5_2008 12_41_24.637 PM.txt
a. TC voltage measurements using Agilent 34420A, serial number SG42000457.b. LVDT resistance measurements using Agilent 34420A, serial number SG42000457.c. LVDT voltage measurements using VI Logger 2.0.1 with NI-DAQmx 8.0.0f0.
� �
� �
� �
� �

INL/EXT-09-16972 B-4
Table B-4. Set 1 data at 500ºC.
Date 11-10-2008 Tester signature
Calibration at ~500ºC Furnace setpoint 495ºC
LVDTsVendor A 1097 (core 1060) Vendor B 1449
(Uncorrected) Null Settings0.301” 0.267”
Voltage & Calibration Temperature (using a Type K TC)a
Voltage (mV) Temperature (ºC)
Minimum na na based on
Maximum 20.739981 502 3937
Average na na readings
Standard deviation na na
Secondary Coil Resistancesb,c
Loops Wire colors Resistance ( ) Loops Wire colors Resistance ( )
A+B red/white 488.4 (488.2) A+B green/red 147.6 (144.9)
A black/red 671.9 (695.0)
B black/white 672.9 (696.0)
Insulation Resistance ( ) Insulation Resistance ( )
shield-wire ~2e6 (~1e6) shield-wire ~4.5e6 (~0.87e6)
primary-secondary ~3e6 (~1e6) primary-secondary 43.68 (48.98)
Primary Coil Resistancesb,c
Loop Wire colors Resistance ( ) Loop Wire colors Resistance ( )
red/white 142.2 (142.5) black/white 51.21 (50.88)
Insulation Resistance ( ) Insulation Resistance ( )
shield-wire ~3e6 (~1e6) shield-wire ~4.5e6 (~0.9e6)
DAS File Names (containing LVDT voltage as a function of core position)d
VI logger: 11/10/2008 10:55:58.152 AM 500-01 C
Windows: 500.01-11_10_2008 10_55_58.152 AM.txt
a. TC voltage measurements using Agilent 34420A, serial number SG42000457.b. LVDT resistance measurements using Fluke 8808A, serial number 9556082.c. LVDT resistance measurements using Agilent 34420A, serial number SG42000457, also (data in parenthesis).d. LVDT voltage measurements using VI Logger 2.0.1 with NI-DAQmx 8.0.0f0.
� �
� �
� �
� �

B-5 INL/EXT-09-16972
Table B-5. Room temperature data for Set 1 after high temperature calibration.
Date 11-11-2008 Tester signature
Calibration at room temperature (after calibration) Furnace setpoint 0ºC
LVDTsVendor A 1097 (core 1060) Vendor B 1449
(Uncorrected) Null Settings0.299” 0.291”
Voltage & Calibration Temperature (using a Type K TC)a
Voltage (mV) Temperature (ºC)
Minimum 1.1869131 30 based on
Maximum 1.2140678 30 2711
Average 1.2036601 30 readings
Standard deviation 8.074181e-3 na
Secondary Coil Resistancesb,c
Loops Wire colors Resistance ( ) Loops Wire colors Resistance ( )
A+B red/white 392.8 (392.4) A+B green/red 122.8 (122.8)
A black/red 645.8 (645.8)
B black/white 646.2 (646.2)
Insulation Resistance ( ) Insulation Resistance ( )
shield-wire >100e6 (>1e6) shield-wire >100e6 (>1e6)
primary-secondary >100e6 (>1e6) primary-secondary >100e6 (>1e6)
Primary Coil Resistancesb,c
Loop Wire colors Resistance ( ) Loop Wire colors Resistance ( )
red/white 91.82 (91.57) black/white 41.84 (41.78)
Insulation Resistance ( ) Insulation Resistance ( )
shield-wire >100e6 (>1e6) shield-wire >100e6 (>1e6)
DAS File Names (containing LVDT voltage as a function of core position)d
VI logger: 11/11/2008 11:20:50.425 AM RT-AC01
Windows: RT.AC-11_11_2008 11_20_50.425 AM.txt (on backup CD)RT.AC01-11_11_2008 11_20_50.425 AM.txt (on tc1)
a. TC voltage measurements using Agilent 34420A, serial number SG42000457.b. LVDT resistance measurements using Fluke 8808A, serial number 9556082.c. LVDT resistance measurements using Agilent 34420A, serial number SG42000457, also (data in parenthesis).d. LVDT voltage measurements using VI Logger 2.0.1 with NI-DAQmx 8.0.0f0.
� �
� �
� �
� �

INL/EXT-09-16972 B-6
Table B-6. Room temperature data for Set 2 before high temperature calibration.
Date 11-12-2008 Tester signature
Calibration at room temperature (before calibration) Furnace setpoint 0ºC
LVDTsVendor A 1096 (core 1059) Vendor B 1444
(Uncorrected) Null Settings0.3” 0.3”
Voltage & Calibration Temperature (using a Type K TC)a
Voltage (mV) Temperature (ºC)
Minimum 0.77247841 19 based on
Maximum 0.78928736 20 2161
Average 0.78249929 20 readings
Standard deviation 4.808777e-3 na
Secondary Coil Resistancesb,c
Loops Wire colors Resistance ( ) Loops Wire colors Resistance ( )
A+B red/white 386.1 (385.4) A+B green/red 129.5 (129.4)
A black/red 636.1 (635.5)
B black/white 636.5 (635.8)
Insulation Resistance ( ) Insulation Resistance ( )
shield-wire >100e6 (>1e6) shield-wire ~15e6 (>1e6)
primary-secondary >100e6 (>1e6) primary-secondary ~15e6 (>1e6)
Primary Coil Resistancesb,c
Loop Wire colors Resistance ( ) Loop Wire colors Resistance ( )
red/white 92.69 (92.33) black/white 42.71 (42.62)
Insulation Resistance ( ) Insulation Resistance ( )
shield-wire >100e6 (>1e6) shield-wire ~22e6 (>1e6)
DAS File Names (containing LVDT voltage as a function of core position)d
VI logger: 11/12/2008 9:21:03.358 AM RT-BC02
Windows: RT.BC02-11_12_2008 9_21_03.358 AM.txt
a. TC voltage measurements using Agilent 34420A, serial number SG42000457.b. LVDT resistance measurements using Fluke 8808A, serial number 9556082.c. LVDT resistance measurements using Agilent 34420A, serial number SG42000457, also (data in parenthesis).d. LVDT voltage measurements using VI Logger 2.0.1 with NI-DAQmx 8.0.0f0.
� �
� �
� �
� �

B-7 INL/EXT-09-16972
Table B-7. Set 2 data at 200ºC.
Date 11-12-2008 Tester signature
Calibration at ~200ºC Furnace setpoint 171ºC
LVDTsVendor A 1096 (core 1059) Vendor B 1444
(Uncorrected) Null Settings0.302” 0.296”
Voltage & Calibration Temperature (using a Type K TC)a
Voltage (mV) Temperature (ºC)
Minimum 7.9415689 195 based on
Maximum 8.0727560 198 3073
Average 7.9852914 196 readings
Standard deviation 40.794915e-3 na
Secondary Coil Resistancesb,c
Loops Wire colors Resistance ( ) Loops Wire colors Resistance ( )
A+B red/white 422.5 (422.3) A+B green/red 139.8 (139.7)
A black/red 646.3 (654.4)
B black/white 646.8 (655.0)
Insulation Resistance ( ) Insulation Resistance ( )
shield-wire >100e6 (>1e6) shield-wire ~15e6 (>1e6)
primary-secondary >100e6 (>1e6) primary-secondary ~13e6 (>1e6)
Primary Coil Resistancesb,c
Loop Wire colors Resistance ( ) Loop Wire colors Resistance ( )
red/white 111.2 (111.0) black/white 46.06 (45.98)
Insulation Resistance ( ) Insulation Resistance ( )
shield-wire >100e6 (>1e6) shield-wire ~21e6 (>1e6)
DAS File Names (containing LVDT voltage as a function of core position)d
VI logger: 11/12/2008 1:24:02.311 PM 200-02 C
Windows: 200.02-11_12_2008 1_24_02.311 PM.txt
a. TC voltage measurements using Agilent 34420A, serial number SG42000457.b. LVDT resistance measurements using Fluke 8808A, serial number 9556082.c. LVDT resistance measurements using Agilent 34420A, serial number SG42000457, also (data in parenthesis).d. LVDT voltage measurements using VI Logger 2.0.1 with NI-DAQmx 8.0.0f0.
� �
� �
� �
� �

INL/EXT-09-16972 B-8
Table B-8. Set 2 data at 300ºC.
Date 11-13-2008 Tester signature
Calibration at ~300ºC Furnace setpoint 302ºC
LVDTsVendor A 1096 (core 1059) Vendor B 1444
(Uncorrected) Null Settings0.303” 0.294”
Voltage & Calibration Temperature (using a Type K TC)a
Voltage (mV) Temperature (ºC)
Minimum 12.031264 296 based on
Maximum 12.113978 298 3494
Average 12.077739 297 readings
Standard deviation 24.272541e-3 na
Secondary Coil Resistancesb
Loops Wire colors Resistance ( ) Loops Wire colors Resistance ( )
A+B red/white 443.0 A+B green/red 146.1
A black/red 678.3
B black/white 679.0
Insulation Resistance ( ) Insulation Resistance ( )
shield-wire >100e6 shield-wire ~10e6
primary-secondary >100e6 primary-secondary ~2.3e6
Primary Coil Resistancesb
Loop Wire colors Resistance ( ) Loop Wire colors Resistance ( )
red/white 121.9 black/white 48.36
Insulation Resistance ( ) Insulation Resistance ( )
shield-wire >100e6 shield-wire ~12e6
DAS File Names (containing LVDT voltage as a function of core position)c
VI logger: 11/13/2008 10:58:15.471 AM 300-02 C
Windows: 300.02-11_13_2008 10_58_15.471 AM.txt
a. TC voltage measurements using Agilent 34420A, serial number SG42000457.b. LVDT resistance measurements using Fluke 8808A, serial number 9556082.c. LVDT voltage measurements using VI Logger 2.0.1 with NI-DAQmx 8.0.0f0.
� �
� �
� �
� �

B-9 INL/EXT-09-16972
Table B-9. Set 2 data at 400ºC.
Date 11-17-2008 Tester signature
Calibration at ~400ºC Furnace setpoint 399ºC
LVDTsVendor A 1096 (core 1059) Vendor B 1444
(Uncorrected) Null Settings0.303” 0.292”
Voltage & Calibration Temperature (using a Type K TC)a
Voltage (mV) Temperature (ºC)
Minimum 16.199025 395 based on
Maximum 16.368181 399 3060
Average 16.297141 398 readings
Standard deviation 43.924133e-3 na
Secondary Coil Resistancesb
Loops Wire colors Resistance ( ) Loops Wire colors Resistance ( )
A+B red/white 464.0 A+B green/red 152.3
A black/red 657.6
B black/white 658.3
Insulation Resistance ( ) Insulation Resistance ( )
shield-wire ~24e6 shield-wire ~8.6e6
primary-secondary ~57e6 primary-secondary ~0.23e6
Primary Coil Resistancesb
Loop Wire colors Resistance ( ) Loop Wire colors Resistance ( )
red/white 133.9 black/white 50.35
Insulation Resistance ( ) Insulation Resistance ( )
shield-wire ~44e6 shield-wire ~8.8e6
DAS File Names (containing LVDT voltage as a function of core position)c
VI logger: 11/17/2008 1:26:33.618 PM 400-02 C
Windows: 400.02-11_17_2008 1_26_33.618 PM.txt
a. TC voltage measurements using Agilent 34420A, serial number SG42000457.b. LVDT resistance measurements using Fluke 8808A, serial number 9556082.c. LVDT voltage measurements using VI Logger 2.0.1 with NI-DAQmx 8.0.0f0.
� �
� �
� �
� �

INL/EXT-09-16972 B-10
Table B-10. Set 2 data at 500ºC.
Date 11-18-2008 Tester signature
Calibration at ~500ºC Furnace setpoint 490ºC
LVDTsVendor A 1096 (core 1059) Vendor B 1444
(Uncorrected) Null Settings0.302” 0.285”
Voltage & Calibration Temperature (using a Type K TC)a
Voltage (mV) Temperature (ºC)
Minimum 20.317019 492 based on
Maximum 20.566795 498 3044
Average 20.383596 494 readings
Standard deviation 73.772418e-3 na
Secondary Coil Resistancesb
Loops Wire colors Resistance ( ) Loops Wire colors Resistance ( )
A+B red/white 485.3 A+B green/red 157.7
A black/red 663.7
B black/white 664.7
Insulation Resistance ( ) Insulation Resistance ( )
shield-wire ~2.5e6 shield-wire ~4.9e6
primary-secondary ~5.5e6 primary-secondary ~34e3
Primary Coil Resistancesb
Loop Wire colors Resistance ( ) Loop Wire colors Resistance ( )
red/white 145.1 black/white 52.29
Insulation Resistance ( ) Insulation Resistance ( )
shield-wire ~8.5e6 shield-wire ~4.8e6
DAS File Names (containing LVDT voltage as a function of core position)c
VI logger: 11/18/2008 1:07:22.179 PM 500-02 C
Windows: 500.02-11_18_2008 1_07_22.179 PM.txt
a. TC voltage measurements using Agilent 34420A, serial number SG42000457.b. LVDT resistance measurements using Fluke 8808A, serial number 9556082.c. LVDT voltage measurements using VI Logger 2.0.1 with NI-DAQmx 8.0.0f0.
� �
� �
� �
� �

B-11 INL/EXT-09-16972
Table B-11. Room temperature data for Set 2 after high temperature calibration.
Date 11-24-2008 Tester signature
Calibration at room temperature (after calibration) Furnace setpoint 0ºC
LVDTsVendor A 1096 (core 1059) Vendor B 1444
(Uncorrected) Null Settings0.3” 0.298”
Voltage & Calibration Temperature (using a Type K TC)a
Voltage (mV) Temperature (ºC)
Minimum 0.68498692 17 based on
Maximum 0.71033406 18 2137
Average 0.70841235 18 readings
Standard deviation 1.434235-3 na
Secondary Coil Resistancesb
Loops Wire colors Resistance ( ) Loops Wire colors Resistance ( )
A+B red/white 385.5 A+B green/red 129.6
A black/red 635.8
B black/white 636.2
Insulation Resistance ( ) Insulation Resistance ( )
shield-wire >100e6 shield-wire ~15e6
primary-secondary >100e6 primary-secondary ~14e6
Primary Coil Resistancesb
Loop Wire colors Resistance ( ) Loop Wire colors Resistance ( )
red/white 92.45 black/white 42.86
Insulation Resistance ( ) Insulation Resistance ( )
shield-wire >100e6 shield-wire ~22e6
DAS File Names (containing LVDT voltage as a function of core position)c
VI logger: 11/24/2008 11:13:41.330 AM RT-AC02
Windows: RT.AC02-11_24_2008 11_13_41.330 AM.txt
a. TC voltage measurements using Agilent 34420A, serial number SG42000457.b. LVDT resistance measurements using Fluke 8808A, serial number 9556082.c. LVDT voltage measurements using VI Logger 2.0.1 with NI-DAQmx 8.0.0f0.
� �
� �
� �
� �