Evaluation of Biometric Systems: A Study of Users ...
27
HAL Id: hal-00984024 https://hal.archives-ouvertes.fr/hal-00984024 Submitted on 26 Apr 2014 HAL is a multi-disciplinary open access archive for the deposit and dissemination of sci- entific research documents, whether they are pub- lished or not. The documents may come from teaching and research institutions in France or abroad, or from public or private research centers. L’archive ouverte pluridisciplinaire HAL, est destinée au dépôt et à la diffusion de documents scientifiques de niveau recherche, publiés ou non, émanant des établissements d’enseignement et de recherche français ou étrangers, des laboratoires publics ou privés. Evaluation of Biometric Systems : A Study of Users’ Acceptance and Satisfaction Mohamad El-Abed, Romain Giot, Baptiste Hemery, Christophe Rosenberger To cite this version: Mohamad El-Abed, Romain Giot, Baptiste Hemery, Christophe Rosenberger. Evaluation of Biomet- ric Systems : A Study of Users’ Acceptance and Satisfaction. International Journal of Biometrics, Inderscience, 2012, pp.1-27. 10.1504/IJBM.2012.047644. hal-00984024
Transcript of Evaluation of Biometric Systems: A Study of Users ...

HAL Id: hal-00984024https://hal.archives-ouvertes.fr/hal-00984024
Submitted on 26 Apr 2014
HAL is a multi-disciplinary open accessarchive for the deposit and dissemination of sci-entific research documents, whether they are pub-lished or not. The documents may come fromteaching and research institutions in France orabroad, or from public or private research centers.
L’archive ouverte pluridisciplinaire HAL, estdestinée au dépôt et à la diffusion de documentsscientifiques de niveau recherche, publiés ou non,émanant des établissements d’enseignement et derecherche français ou étrangers, des laboratoirespublics ou privés.
Evaluation of Biometric Systems : A Study of Users’Acceptance and Satisfaction
Mohamad El-Abed, Romain Giot, Baptiste Hemery, Christophe Rosenberger
To cite this version:Mohamad El-Abed, Romain Giot, Baptiste Hemery, Christophe Rosenberger. Evaluation of Biomet-ric Systems : A Study of Users’ Acceptance and Satisfaction. International Journal of Biometrics,Inderscience, 2012, pp.1-27. �10.1504/IJBM.2012.047644�. �hal-00984024�

Int. J. Biometrics, Vol. x, No. x, xxxx 1
Evaluation of biometric systems: a study of users'acceptance and satisfaction
Mohamad El-Abed*, Romain Giot,Baptiste Hemery and Christophe Rosenberger
Université de Caen Basse-Normandie,UMR 6072 GREYC, F-14032 Caen, France
and
ENSICAEN, UMR 6072 GREYC,F-14050 Caen, France
and
CNRS, UMR 6072 GREYC,F-14032 Caen, FranceE-mail: [email protected]: [email protected]: [email protected]: [email protected]*Corresponding author
Abstract: This paper presents a modality-independent evaluationmethodology to study users’ acceptance and satisfaction of biometricsystems. It uses a survey questionnaire for data collection, and somedata-mining tools for their analysis. We have applied it on two biometricsystems developed in our research laboratory. The results from thissurvey show the necessity of taking users’ point of view when designingand evaluating biometric systems. A panel of 100 volunteers was moresatisfied from the keystroke system than the face one. Users surprisinglyconsidered that its perceived performance was also better, even if theused face system has a better performance with an EER of 8.76%than the keystroke one with an EER of 17.51%. The robustness of asystem against attacks, computation time required during the verificationphase and its easiness to use have been identified as important factorsinfluencing their opinions regarding the tested systems.
Keywords: biometrics; evaluation; users’ acceptance and satsifaction;Kruskal-Wallis test; Bayesian networks; decision trees.
Reference to this paper should be made as follows: El-Abed, M. and Giot,R. and Hemery, B. and Rosenberger, C. (xxxx) ‘Evaluation of biometricsystems: a study of users’ acceptance and satisfaction’, Int. J. Biometrics,Vol. x, No. x, pp.xxx–xxx.
Biographical notes: Mohamad El-Abed is an Assistant Professor atENSICAEN. He obtained his PhD from the University of Caen Basse-Normandie in 2011. He belongs to the GREYC laboratory in the e-payment and biometrics research unit. His research interests includebiometrics, especially the evaluation of biometric systems.
Copyright © 2012 Inderscience Enterprises Ltd.

2 El-Abed et al.
Romain Giot obtained his Master of Science from ENSICAEN in 2008.He has been a Research Engineer in the GREYC laboratory during twoyears. His research interests include biometrics, especially the definitionof keystroke dynamics biometric and multibiometrics systems. He is nowa PhD Student at the University of Caen Basse-Normandie and workson template update strategies for biometric systems.
Baptiste Hemery is an Assistant Professor at ENSICAEN. He obtainedhis PhD from the University of Caen Basse-Normandie in 2009.He belongs to the GREYC laboratory in the e-payment and biometricsresearch unit. His research interests concern image interpretationevaluation and biometric systems.
Christophe Rosenberger is a Full Professor at ENSICAEN. He obtainedhis PhD from the University of Rennes I in 1999. Since 2007, he belongsto the GREYC laboratory where he leads the e-payment and biometricsresearch unit. His research interests concern the definition of biometricsystems, their evaluation and the protection of biometric templates.
1 Introduction
Biometrics is considered as a promising solution among traditional methods basedon “what we own” (such as a key) or “what we know” (such as a password).It is based on “what we are” and “how we behave”. Biometric authenticationsystems have many applications (Jain et al., 2004): border control, e-commerce,etc. The main benefits of this technology are to provide a better security, and tofacilitate the authentication process for a user. Also, it is usually difficult to copythe biometric characteristics of an individual than most of the other authenticationmethods such as passwords.
Different biometric modalities have been proposed in the literature, which canbe categorised into three kinds of modalities:
• biological
• behavioural
• morphological modalities.
Biological modalities are known to be the most expensive owing to the computationtime, and the specific materials required to verify the user’s identity. Performanceof behavioural modalities provides a lower quality than the others because theydepend a lot on user’s feelings at the moment of the data acquisition: user maychange his/her way of performing tasks owing to its stress, tiredness, concentrationor illness. A survey of the literature on behavioural modalities is given byYampolskiy and Govindaraju (2008). Each modality has its own advantages anddrawbacks. A previous work (Mahier et al., 2008) summarises a comparativestudy of biometric modalities in terms of universality, uniqueness, permanency,collectability, acceptability and performance.

Evaluation of biometric systems 3
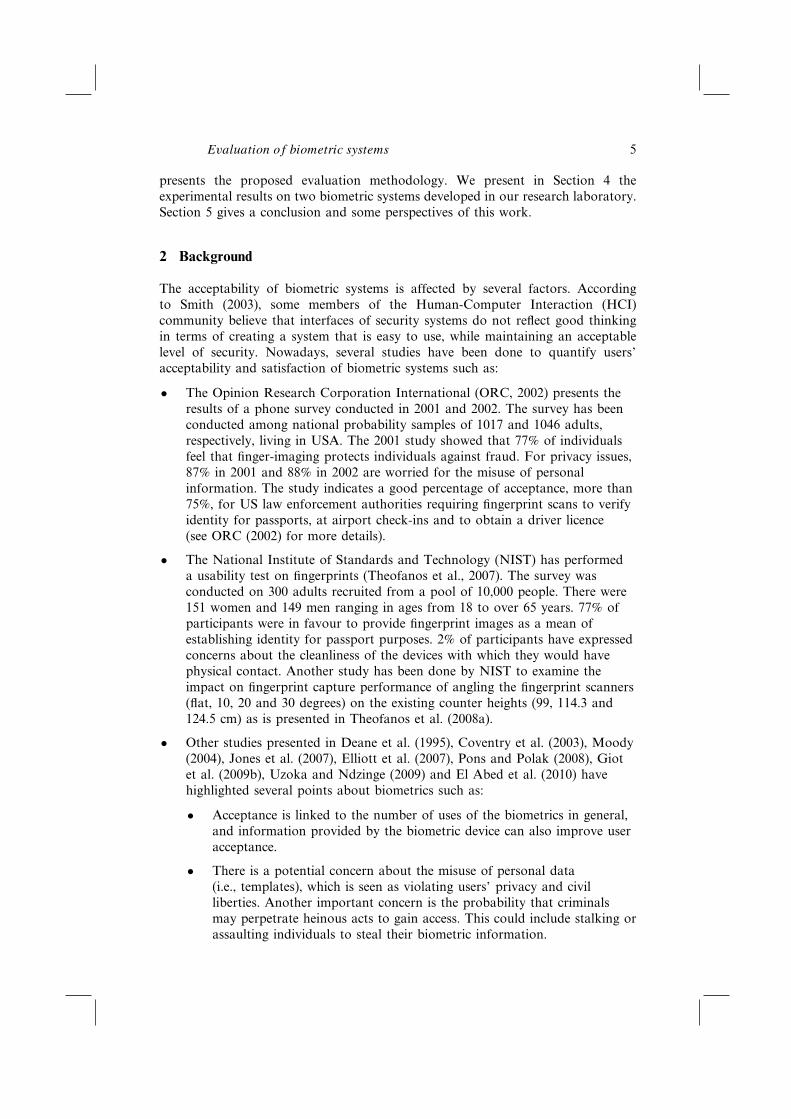
Despite the obvious advantages of biometric systems, their proliferation was notas much as attended. To be used in an industrial context, the quality of a biometricsystem must be precisely quantified. We need a reliable evaluation methodologyto put into obviousness the benefit of a new biometric system. Nowadays, severalstudies have been done in the literature to evaluate biometric systems. It is generallyrealised within three aspects as illustrated in Figure 1:
Figure 1 Evaluation aspects of biometric systems
1 Data quality: Measures the quality of the biometric raw data (Tabassi andWilson, 2005). Using quality information, the bad-quality samples can beremoved during enrolment or rejected during verification. Such informationcould also be used in soft biometrics or multimodal approaches (Kryszczuket al., 2009). Such type of assessment is generally used to enhance the systemperformance, and could be used to quantify the quality of biometric sensors.
2 Usability: According to the international standard ISO 13407:1999[ISO 13407:1999], usability is defined as “The extent to which a product can
be used by specified users to achieve specified goals with effectiveness,
efficiency, and satisfaction in a specified context of use”.
• Efficiency, which means that users must be able to accomplish the taskseasily and in a timely manner. It is generally measured as a task time.
• Effectiveness, which means that users are able to complete the desiredtasks without too much effort. It is generally measured by commonmetrics including completion rate and number of errors such asFailure-To-Enrol rate (FTE) as (ISO/IEC 19795-1, 2006).
• User satisfaction, which measures users’ acceptance and satisfactionregarding the system. It is generally measured by studying severalproperties such as easiness to use and trust, etc.
3 Security: Measures the robustness of a biometric system (algorithms,architecture and devices) against attacks. Such type of assessment
4 El-Abed et al.
is important since several works in the literature (such as Ratha et al., 2001)show the vulnerabilities of biometric systems.
Traditional evaluation methods have worked well to evaluate emergingtechnologies, new biometric modalities and algorithm revisions. Many databaseshave been collected (such as ENSIB face database (Hemery et al., 2007)), manycompetitions (such as Fingerprint Verification Competition (Maio et al., 2004)) andplatforms have been proposed (such as BioSecure (Petrovska and Mayoue, 2007))whose objective is mainly to compare enrolment and verification/identificationalgorithms in the literature. Many metrics have been defined by the InternationalOrganisation for Standardization (ISO/IEC 19795-1, 2006) in terms of errorcomputations, time computation, memory allocations, etc. These statisticalmeasures allow in general a precise performance characterisation of a biometricsystem. Nevertheless, these works are dedicated to quantify the system performance(algorithms, processing time, etc.) without taking into account user’s view withinthe evaluation process. However, the biometric process is considered as a two-wayinteraction, between the user and the system. Jain et al. (2004) categorise thefundamental barriers in biometrics into three main categories:
• accuracy in terms of errors
• scale or size of the database
• usability in terms of easiness to use, acceptability, etc.
One government can decide that an individual would be identified through abiometric data embedded in the passport. For logical or physical access controlin a company, it is more difficult to impose a system that would not be acceptedby users. As for example, DNA analysis is one of the most efficient techniquesto verify the identity of an individual or to identify him/her. Nevertheless, itcannot be used for logical or physical access control not only for time computationreasons, but also because nobody would be ready to give some blood to make theverification. Therefore, taking into account user’s view when designing biometricsystems is considered as a crucial requirement to the widespread of use of thistechnology.
Nowadays, there is a lack of a generic evaluation methodology that takes intoaccount users’ acceptance within the evaluation process, which constitutes one ofthe main drawbacks for biometric systems proliferation. To contribute to solve thisproblem, we propose in this paper a modality-independent evaluation methodologyto study users’ acceptance and satisfaction of biometric systems. Such kind ofevaluation will:
• increase system performance (Kukula et al., 2009)
• improve the accuracy of the optimistic results provided by biometric systemdesigners in terms of errors (e.g., EER)
• reduce product complexity and increase user satisfaction (Theofanos et al.,2008b).
The plan of the paper is organised as follows: Section 2 presents related previousresearch on users’ acceptance and satisfaction of biometric systems. Section 3
Evaluation of biometric systems 5
presents the proposed evaluation methodology. We present in Section 4 theexperimental results on two biometric systems developed in our research laboratory.Section 5 gives a conclusion and some perspectives of this work.
2 Background
The acceptability of biometric systems is affected by several factors. Accordingto Smith (2003), some members of the Human-Computer Interaction (HCI)community believe that interfaces of security systems do not reflect good thinkingin terms of creating a system that is easy to use, while maintaining an acceptablelevel of security. Nowadays, several studies have been done to quantify users’acceptability and satisfaction of biometric systems such as:
• The Opinion Research Corporation International (ORC, 2002) presents theresults of a phone survey conducted in 2001 and 2002. The survey has beenconducted among national probability samples of 1017 and 1046 adults,respectively, living in USA. The 2001 study showed that 77% of individualsfeel that finger-imaging protects individuals against fraud. For privacy issues,87% in 2001 and 88% in 2002 are worried for the misuse of personalinformation. The study indicates a good percentage of acceptance, more than75%, for US law enforcement authorities requiring fingerprint scans to verifyidentity for passports, at airport check-ins and to obtain a driver licence(see ORC (2002) for more details).
• The National Institute of Standards and Technology (NIST) has performeda usability test on fingerprints (Theofanos et al., 2007). The survey wasconducted on 300 adults recruited from a pool of 10,000 people. There were151 women and 149 men ranging in ages from 18 to over 65 years. 77% ofparticipants were in favour to provide fingerprint images as a mean ofestablishing identity for passport purposes. 2% of participants have expressedconcerns about the cleanliness of the devices with which they would havephysical contact. Another study has been done by NIST to examine theimpact on fingerprint capture performance of angling the fingerprint scanners(flat, 10, 20 and 30 degrees) on the existing counter heights (99, 114.3 and124.5 cm) as is presented in Theofanos et al. (2008a).
• Other studies presented in Deane et al. (1995), Coventry et al. (2003), Moody(2004), Jones et al. (2007), Elliott et al. (2007), Pons and Polak (2008), Giotet al. (2009b), Uzoka and Ndzinge (2009) and El Abed et al. (2010) havehighlighted several points about biometrics such as:
• Acceptance is linked to the number of uses of the biometrics in general,and information provided by the biometric device can also improve useracceptance.
• There is a potential concern about the misuse of personal data(i.e., templates), which is seen as violating users’ privacy and civilliberties. Another important concern is the probability that criminalsmay perpetrate heinous acts to gain access. This could include stalking orassaulting individuals to steal their biometric information.

6 El-Abed et al.
• Individuals complain that once the biometric template is stolen, it iscompromised forever.
• There are also concerns about hygiene with touching such devices andhealth risks for more advanced technologies such as iris or retina.According to our knowledge, no paper has emphasised physical harm tousers of these systems. But despite of this, several concerns werehighlighted along this interaction. Anecdotally, some users of biometricshave complained that hand geometry systems dry their hands, whilemilitary aviators participating in an experimental programme voicedconcern that retinal scanning would damage their vision with extendeduse over time.
Most of the works done on evaluating biometric systems have focused on theperformance aspect. Limited research has focused on usability issues relating tohow users perceive and use biometric systems. However, most of the studiesin this area are modality-dependent (such as the usability study presentedby Theofanos et al. (2008a)). Hence, it could not be applied to any kind ofbiometric system. In addition, these studies are based on statistical answers toa questionnaire, but no mature data analysis is conducted for understandingrespondents’ answers to identify reasons. To contribute to solve this problem, wepropose a modality-independent methodology that studies users’ acceptance andsatisfaction of biometric systems. As for us, taking into account users’ point of viewwithin the biometric process (hardware, software and instructional design) is notonly beneficial to the end-users, but it will also help to improve the performanceand effectiveness of a system.
3 Proposed method
The proposed methodology was designed to quantify users’ acceptance andsatisfaction when using biometric systems. To accomplish this objective,we developed a survey instrument for data collection. These kinds of surveys enableto gather information to be statistically analysed. The proposed methodologyprinciple is as follows: It collects the data using a survey questionnaire(see Appendix). This step is followed by a pre-processing phase to extract thesignificant knowledge (Section 3.2). Then, the Kruskal-Wallis (KW) test (Higgins,2003) is performed to determine if there is a significant relationship betweendemographic characteristics and respondents’ answers (Section 3.3). Data-miningtools are used to explain these answers, to determine the reasons that influence theiracceptance and satisfaction of biometric systems (Section 3.4).
3.1 Data collection
The first step of the proposed method consists of creating a satisfactionquestionnaire. Existing works presented in Section 2 highlighted different importantfactors impacting their acceptance of biometric systems such as:
• Socio-demographic factors: Such as age and gender

Evaluation of biometric systems 7
• Learnability and memorability: They mainly concern how rapidly a user canuse the system after instruction or training.
• Confidence or trust: Indicates how the performance of the system is perceivedby users. It depends mainly on feedbacks from users and their experience.
• Easiness to use: Depends on the quality of the biometric sensor and theergonomic interface. It may also depend on the time required for verificationor identification. For example, if the biometric system takes several minutesbetween the acquisition of the required data and user identification, usersmay feel that the biometric system is not easy to use.
• Privacy issues: There is a potential risk concerning the misuse of the personalcollected data, which is seen as violating user’s privacy and civil liberties.Many debates have been conducted over the central storage of biometrictemplates vs. holding the personal template on a smart card where theverification is locally processed.
• Physical invasiveness: The acquisition of biometric data requires a userinteraction with the biometric sensor. Depending on the used method,the acquisition of the biometric raw data is performed with or withoutcontact with the biometric sensor.
• Cultural issues: The acceptability denotes the way how users perceive thebiometric system and interact with it. Acceptability is highly dependent onthe culture of users. As for example, cultures with an aversion to touch publicsurfaces would prefer to use biometric systems with contactless sensors(e.g., iris or palm veins).
The developed questionnaire (see Appendix) aims to extract these factors to studyusers’ acceptance and satisfaction of biometric systems. It was designed tocollect demographic, experiential and attitudinal characteristics that might havean impact on or a relationship to respondents’ views on the use of biometrics.The questionnaire was created owing to the results of extensive desk researchpresented in the literature. We took into account these studies and we addednew questions to complete it. It also noted unsolicited questions that we foundit valuable when collecting two biometric databases (Hemery et al., 2007; Giotet al., 2009a) (both databases are publicly available to the biometric community),during the recent usability studies of biometric systems presented in previousworks (Giot et al., 2009b; El Abed et al., 2010), and the opinions of two expertsworking in the social psychology research topic. This help was important especiallyfor the wording and ordering of the questions. Indeed, the question must be asneutral as possible to avoid bias answers. A 4-point Likert-type scale is usedto evaluate respondents answers on the satisfaction questions. This scale requiresfor the respondent to make a positive or negative choice, which avoids to manyneutral answers. The survey questionnaire contains 18 questions divided intotwo sets:
• General perception of biometric systems (Appendix, part B), which contains7 questions aiming to understand users’ experience on biometric technology.

8 El-Abed et al.
• Perception of the tested system (Appendix, part C), which contains11 questions aiming to measure users’ acceptance and satisfaction ofthe tested system.
In addition to these questions, we request some information on the individualsuch as gender (Appendix, part A). These demographic characteristics are requestedto determine if there are significant relationships between them and respondents’answers on biometric technology and the tested system. We also request thequestion 16 (Appendix, part C) to identify where the use of the tested system wouldbe appropriate for the user.
3.2 Data pre-processing
Before analysing the pilot data, we use a technique to enhance the accuracy andthe reliability of the extracted knowledge. It consists of deleting answers having apredefined number of questions without answers.
3.3 Respondent demographics analysis
To determine whether there is a significant relationship between demographiccharacteristics and respondents’ answers on biometric technology and the testedsystem, we use the KW test. It is a non-parametric (distribution free) test, whichis used to decide whether K independent samples are from the same population.In other words, it is used to test two hypothesis given by equation (1) the nullhypothesis H0 assumes that samples originate from the same population (i.e., equalpopulation means) against the alternative hypothesis H1 which assumes that thereis a statistically significant difference between at least two of the subgroups.
{
H0 : µ1 = µ2 = · · · = µk
H1 : µi �= µj ∃ (i, j) with i �= j(1)
The KW test statistic H is given by equation (2), and the p-value is calculated usinga χ2 distribution with k − 1 degrees of freedom. The decision criterion to choosethe appropriate hypothesis is given in equation (3).
H =12
N(N + 1)
g∑
i=1
nir2i. − 3(N + 1) (2)
where ni is the number of observations in group i, rij is the rank of observation jfrom group i and N is the total number of observations across all groups.
r2i. =
∑ni
j=1 rij
niand r =
1
2(N + 1)
{
p-value ≥ 0.05 accept H0
otherwise reject H0
(3)

Evaluation of biometric systems 9
3.4 Data-mining analysis
To analyse respondents’ answers, we use two types of classifiers: Bayesian networks
(Friedman et al., 1997) and decision trees (Breiman et al., 1984). They are formalgraphical tools for representation of decision scenarios requiring reasoning underuncertainty. We present in sections 3.4.1 and 3.4.2 the Bayesian networks and thedecision trees, respectively. Section 3.4.3 presents its performance evaluation tochoose the best decision model.
3.4.1 Bayesian networks
A Bayesian network (BS , BP ) is a probabilistic graphical model that representsa set of random variables U = {x1, x2, . . . xn} and their conditional independencies.The Bayesian structure BS is a Directed Acyclic Graph (DAG) where nodesrepresent propositional variables in a domain, and the arcs between nodes representthe dependency relationships among the variables. The Bayesian probabilitydistributions BP is a set of probability tables BP = {p(u | pa(u))|u ∈ U} wherepa(u) is the set of parents of u in BS .
The method used to learn the Bayesian network structure BS is based onconditional independence tests as described in Bouckaert et al. (2009). This methodmainly stem, from the goal of uncovering causal structure. The assumption isthat there is a network structure that exactly represents the independencies in thedistribution that generated the data. The method is divided into two stages:
• Find a skeleton: Starting with a complete undirected graph, the method triesto find conditional independencies {x → y} ∪ ∀z ∈ Zz → y in the data. If anindependency is identified, the edge between x and y is removed from theskeleton. We use the following conventions to identify counts in the databaseD of a network structure BS :
• Let ri (1 ≤ i ≤ n) be the cardinality of the variables xi.
• We denote by qi the cardinality of the parent set of xi in the networkstructure BS . Hence, qi can be calculated as the product of cardinalitiesof nodes in pa(xi), qi =
∏
xj∈pa(xi)rj .
• We denote by Nij(1 ≤ i ≤ n, 1 ≤ j ≤ qi) the number of records in D forwhich pa(xi) takes its jth value.
• We denote by Nijk(1 ≤ i ≤ n, 1 ≤ j ≤ qi, 1 ≤ k ≤ ri) the number ofrecords in D for which pa(xi) takes its jth value and for which xi takesits kth value. Hence, Nij =
∑ri
k=1 Nijk.
• We use N to denote the number of records in D.
To test whether variables x and y are conditionally independent given a set ofvariables Z, a network structure with arrows ∀z ∈ Zz → y is compared withone with arrows {x → y} ∪ ∀z ∈ Zz → y. A test is performed by using apredefined score metric. In this study, we use four score metrics asdefined here
10 El-Abed et al.
• Entropy metric H(BS , D) defined as
H(BS , D) = −N
n∑
i=1
qi∑
j=1
ri∑
k=1
Nijk
Nlog
Nijk
Nij
(4)
• Akaike Information Criterion metric QAIC(BS , D) defined as
QAIC(BS , D) = H(BS , D) + K (5)
where K =∑n
i=1(ri − 1) · qi
• Minimum Description Length metric QMDL(BS , D) defined as
QMDL(BS , D) = H(BS , D) +K
2log N (6)
• Bayesian metric QBayes(BS , D) defined as
QBayes(BS , D) =
n∏
i=0
qi∏
j=1
(ri − 1)!
(ri − 1 + Nij)!
ri∏
k=1
Nijk! (7)
• Direct acyclic graph (DAG): the second stage consists in directing all theedges in the skeleton to get a DAG. The first step in directing arrows is tocheck for every configuration x − −z − −y where x and y not connected inthe skeleton whether z is in the set Z of variables that justified removingthe link between x and y. If z /∈ Z, we can assign direction x → z ← y. Then,a set of rules (presented in Bouckaert et al., 2009) is applied to direct theremaining edges.
3.4.2 Decision trees
Introduced by Breiman et al. (1984), decision trees are one of the few knowledgerepresentation schemes, which are easily interpreted and may be inferred by verysimple learning algorithms (Baldwin and Xie, 2005). A decision tree is a tree inwhich:
• each internal node tests an attribute
• each branch corresponds to an attribute value
• each leaf node assigns a classification. Decision trees are powerful predictorsand provide an explicit concept description for a data set.
Nowadays, several methods have been proposed for learning decision trees.For this study, we have used the most well known and used methods in theliterature: C4.5 developed by Quinlan (1993) and CART (Breiman et al., 1984)algorithms. The learning algorithms of decision trees contain three main functions:
• deciding if a node is a leaf
• selecting an attribute for a test node

Evaluation of biometric systems 11
• associating a label to a leaf.
Before presenting the used algorithms, we introduce the following notions. For adatabase of observations D, a target variable C = {1, . . . , c} and a decision tree t,we define for each position p in the tree t:
• N(p) is the cardinality of the set of observations associated to the position pin the database D.
• N(k/p) is the cardinality of the set of observations associated to the positionp belonging to the class k.
• P (k/p) is defined as:
P (k/p) =N(k/p)
N(p)(8)
• The diversity functions used as a splitting criterion are the informationcontent (IC) and the Gini index defined as follows:
IC(p) = −
c∑
k=1
P (k/p) × log(P (k/p)) (9)
Gini(p) = 1 −
c∑
k=1
P (k/p)2 (10)
3.4.2.1 CART algorithm
CART method, introduced by Breiman et al., consists of learning binary decisiontrees. The CART learning algorithm consists of:
1 Deciding if a node is a leaf: A node p is a leaf if Gini(p) ≤ i0 or N(p) ≤ n0,where i0 and n0 are initial parameters of the learning algorithm.
2 Selecting an attribute for a test node: For a position p, the algorithm selectsthe attribute that maximises the gain defined in equation (11) using the Giniindex as a splitting criterion.
Gain(p, test) = Gini(p) − (Pleft × Gini(p1) + Pright × Gini(p2)) (11)
where Pleft (respectively Pright) represents the proportion of the elementsassociated to position p and going to the node in position p1 (respectively, p2).
3 Associating a label to a leaf: The majority rule is used to label each leaf inthe decision tree.
3.4.2.2 C4.5 algorithm
C4.5 is an extension of the ID3 (Quinlan, 1986) algorithm developed by RossQuinlan in 1986. C4.5 builds decision trees from a set of training data using theconcept of information content defined in equation (9). At each node of the tree,C4.5 chooses one attribute of the data that most effectively splits its set of samples

12 El-Abed et al.
into subsets enriched in one class or the other. Its criterion is based on the gainratio, defined in equation (12), that results from choosing an attribute for splittingthe data. The attribute with the highest gain ratio is chosen to make the decision.The C4.5 algorithm then recurses on the smaller sublists.
GainRatio(p, test) =Gain(p, test)
SplitInfo(p, test)(12)
where Gain(p, test) and SplitInfo(p, test) are defined as:
Gain(p, test) = IC(p) −n
∑
i=1
Pi × IC(pi) (13)
SplitInfo(p, test) = −
n∑
i=1
P ′(i/p) × log(P ′(i/p)) (14)
where test is the test attribute having n values, P ′(i/p) is the proportion of elementsin D at position p and satisfying the ith test attribute value.
3.4.3 Performance metrics
Classifiers are useful tools, which are commonly used in decision analysis, to helpidentifying a strategy most likely to reach a goal (Edwards et al., 2008). Theyprovide a highly effective and simple structure that can be explored to makepredictions and decisions. Despite the obvious advantages of these tools, they donot provide a 100% accuracy result. Because of this inaccuracy, several performancecriteria have been proposed in the literature (Rakotomalala, 1997) to identify thequality of a classifier. The main criteria used are:
• Accuracy: Denotes the percentage of the correctly classified instances.
• Area under the ROC curve (AUC): It is equal to the probability thata classifier will rank a randomly chosen positive instance higher thana randomly chosen negative one. In this study, AUC is estimated usingMann-Whitney statistic test as presented by Ling et al. (2003). The AUCof a classifier G is defined as:
AUC =S0 − n0(n0 + 1)/2
n0n1(15)
where n0 and n1 are the numbers of positive and negative examplesrespectively, and S0 =
∑
ri, where ri is the rank of the ith positive examplein the ranked list. Ling et al. (2003) suggest that its use should replaceaccuracy when measuring and comparing classifiers: the best classifieris the one with the largest AUC value.
• Comprehensibility: Qualifies the exploitability of the produced model.For example, in a Bayesian network, the important number of a node’sparents affects the identification of its strong relations with them.

Evaluation of biometric systems 13
4 Experimental results
In this section, we detail the experimental protocol and the results we obtained.We present first the test protocol and test materials used in this study, followedby the pre-processing phase prior to the data analysis. Then, we present thedata analysis phase to study users’ acceptance and satisfaction of the two testedbiometric systems (GREYC-Keystroke (Giot et al., 2009a) and GREYC-Face(Hemery et al., 2010)) developed in the GREYC research laboratory.
4.1 Test protocol
The pilot study was distributed on a paper sheet to a sample of 100 volunteers,including students (70% of the population) coming from different countries andemployees. Tests have been conducted in public places over a 3-month period.It consists in testing both systems (enrolment then multiple verification attemptsplaying the role of an impostor and a legitimate user). Then, they were requestedto answer a questionnaire (see Appendix): part A, part B and two times part C(one for each tested system). Volunteers completed the survey voluntarily andreceived none remuneration. During the tests, volunteers were informed about thepurpose of the study, and their responses would be confidential and anonymous.The age and gender distribution of the volunteer crew are shown in Figure 2.
Figure 2 Age and gender distribution of the volunteer crew
4.2 Test materials
In this study, we have used two biometric verification systems developedin our research laboratory: GREYC-Keystroke and GREYC-Face. The firstis a behavioural-based analysis, while the second is a morphological-based analysis.We have chosen to illustrate the proposed methodology on these two biometricsystems for many reasons. First, we would like to quantify the acceptability ofour developed systems to improve them (in terms of performance and ergonomicinterface based on users feedbacks). We are mainly interested of these modalitiessince they belong to the possible candidates that may be implemented in anAutomated Teller Machine (ATM), and can be used for e-commerce applications.Second, it would be important to test which kind of modality (morphologicalor behavioural) is better perceived by the volunteers. Obviously, we have to
14 El-Abed et al.
include other types of systems (e.g., iris verification) to test in an accurateway this hypothesis. Third, we would like to see which type of modality isbetter perceived to be used to manage physical (e.g., border control) or logical(e.g., e-commerce) access. Finally, evaluation results provided by these two verydifferent biometric systems should be also as different as possible. Therefore,we believe that it is a good choice to illustrate this evaluation methodology onthese systems. The performances of tested systems are calculated with capturesprovided by our volunteer crew. We plot their Detection Error Trade-off (DET)curves in Figure 5:
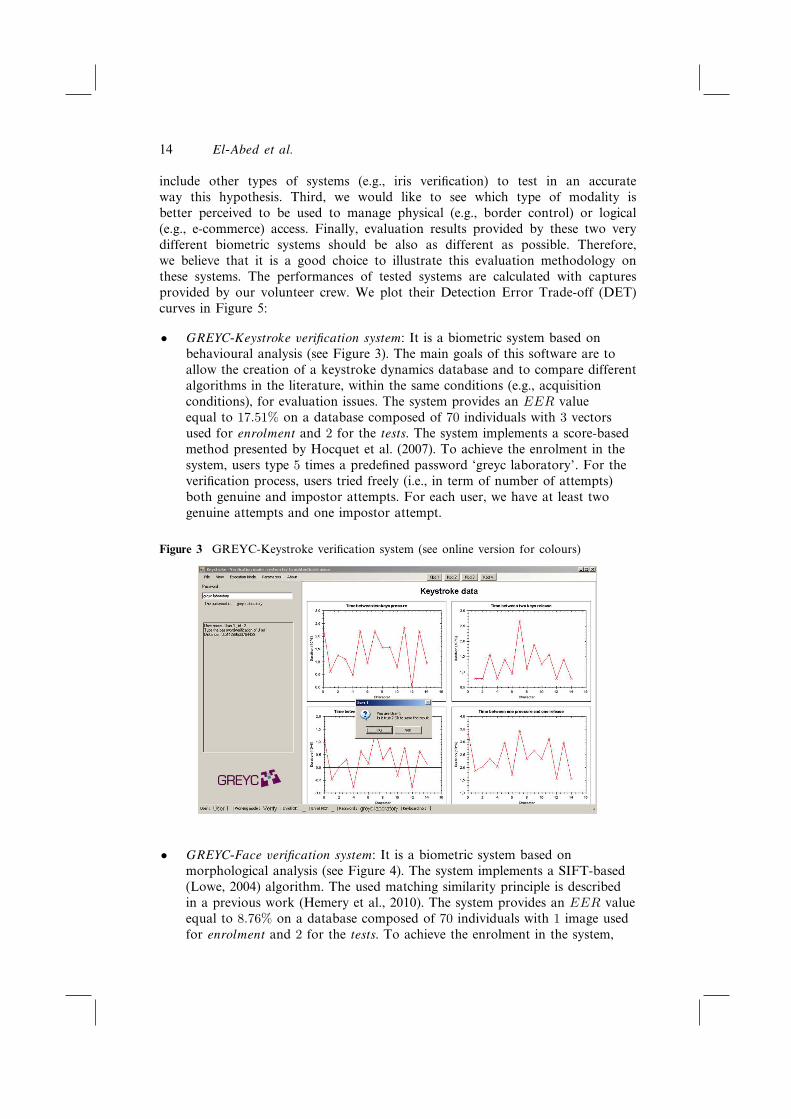
• GREYC-Keystroke verification system: It is a biometric system based onbehavioural analysis (see Figure 3). The main goals of this software are toallow the creation of a keystroke dynamics database and to compare differentalgorithms in the literature, within the same conditions (e.g., acquisitionconditions), for evaluation issues. The system provides an EER valueequal to 17.51% on a database composed of 70 individuals with 3 vectorsused for enrolment and 2 for the tests. The system implements a score-basedmethod presented by Hocquet et al. (2007). To achieve the enrolment in thesystem, users type 5 times a predefined password ‘greyc laboratory’. For theverification process, users tried freely (i.e., in term of number of attempts)both genuine and impostor attempts. For each user, we have at least twogenuine attempts and one impostor attempt.
Figure 3 GREYC-Keystroke verification system (see online version for colours)
• GREYC-Face verification system: It is a biometric system based onmorphological analysis (see Figure 4). The system implements a SIFT-based(Lowe, 2004) algorithm. The used matching similarity principle is describedin a previous work (Hemery et al., 2010). The system provides an EER valueequal to 8.76% on a database composed of 70 individuals with 1 image usedfor enrolment and 2 for the tests. To achieve the enrolment in the system,

Evaluation of biometric systems 15
a single picture is captured per user. For the verification process, users triedthe face system using the same process than the previous one.
Figure 4 GREYC-Face verification system. An example of a matching attempt resultingfrom a genuine user (see online version for colours)
Figure 5 DET curves for the two tested biometric systems (see online version for colours)
4.3 Data pre-processing
The first step of the proposed methodology consists in the deletion of respondents’answers that did not answer a certain number of questions of the questionnaire.For three unanswered questions, two vectors of answers (one from each system)have been eliminated from this study. Therefore, the results presented in the nextsubsections are done using 99 vectors of answers on both systems.

16 El-Abed et al.
4.4 Respondent demographics analysis
We study in this section the relationship, on each system, between respondents’demographic characteristics and their answers on biometric technology andsatisfaction questions (Appendix, parts B and C). Table 1 shows the results fora confidence degree equal to 95%. Bold values indicate significant relationshipsbased on the criterion defined in equation (3). From this table, we can put intoobviousness these significant relationships:
• Age was significantly related to their answers about keystroke’s robustnessagainst attacks: aged respondents (≥ 28) considered that the system is lessrobust against attacks than youngest ones.
• For keystroke system, education level was significantly related to thedisturbed, threats to privacy, verification quickness and correct answerfactors:
• high school graduate respondents were less disturbed than the others.
• none graduated respondents have expressed much more concerns abouttheir privacy than the others.
• high school graduate respondents considered that the computation timeduring the verification phase is faster than the college graduaterespondents.
• keystroke performance was perceived better by the high school graduaterespondents than the college graduate respondents.
Table 1 Respondents’ answers and demographic factors, Kruskal-Wallis analysis: lineswith two p-values correspond to systems’ specific questions (face/keystroke)
p-value
Questions Gender Age Education Profession
Biometric technology knowledge 0.089 0.652 0.134 0.911
Awareness about fraud identity 0.247 0.831 0.14 0.578
Secret-based against fraud 0.482 0.804 0.213 0.778
Biometric-based against fraud 0.71 0.324 0.74 0.546
Disturbed 0.419/0.385 0.509/0.473 0.096/0.007 0.696/0.428
Threats to privacy 0.206/0.556 0.65/0.649 0.196/0.044 0.756/0.36
Easiness to use 0.145/0.438 0.063/0.522 0.012/0.392 0.46/0.406
Verification quickness 0.135/0.144 0.226/0.294 0.195/0.039 0.095/0.202
Correct answer 0.982/0.075 0.779/0.717 0.78/0.034 0.369/0.058
System can be easily attacked 0.276/0.226 0.492/0.02 0.558/0.204 0.405/0.22
Use in the future 0.079/0.48 0.604/0.883 0.721/0.821 0.33/0.255
Trust 0.414/0.689 0.469/0.218 0.709/0.947 0.372/0.068
General appreciation 0.078/0.129 0.984/0.873 0.3/0.768 0.459/0.917

Evaluation of biometric systems 17
• Education level was significantly related to the use of face system: collegegraduated respondents found it more complicated (in term of easiness to use)than the others.
4.5 Comparative study of the studied systems
In this section, we present respondents’ knowledge about biometric technology,and a comparative analysis between the studied systems based on a statisticalanalysis of their answers. A Kruskal-Wallis test was performed to identify thesignificant differences among this comparison. Table 2 shows the results for aconfidence degree equal to 95%. Bold values indicate significant relationships basedon the criterion defined in equation (3). From the respondents’ answers andTable 2, we can put into obviousness some interesting points:
• Most of the respondents (74.8%) have already heard before our study ofbiometric authentication systems, and less than half of them (40.4%) havealready used a biometric system.
• 38.4% of the respondents have expressed a good knowledge about biometrictechnology.
• Using Kruskal-Wallis test (p-value <0.01), respondents considered thatbiometric technology (90.9% agree) is much more appropriate thansecret-based solutions (33.3% agree) against fraud.
• There were no significant differences on easiness to use, verification quickness,use in the future and trust factors: 24.2% of the respondents have found thatface system is not easy to use and 14.1% for keystroke one. 10.1% found thatthe computation time during the verification phase of face system is not fastand 14.1% for keystroke one. 22.2% of the participants hesitate or refusethe use of face system in the future and 17.2% for keystroke one. For theirperception about trust, 32.3% do not trust face system and 20.2% forkeystroke one.
• There were significant differences on disturbed, threats to privacy, correctanswer, system can be easily attacked and general appreciation factors:respondents were much more disturbed while using face system (25.3%) thankeystroke one (16.2%). Respondents have expressed much more concernsabout their privacy while using face system (47.5%) than keystroke one(13.1%). They found that keystroke performance is better than the face one.They found that keystroke system (53.5%) is more robust against attacksthan face one (34.3%). For their general appreciation, they were moresatisfied from the use of keystroke system (88.9%) than face one (75.8%).
• Finally, 23.2% prefer to use the face system and 62.6% for keystroke one formanaging logical access, 41.4% prefer to use the face system and 14.1% forkeystroke one for physical access, 31.3% prefer to use the face system and21.2% for keystroke one for both kinds of access. This indicates that thekeystroke system is more requested to be used for managing logical access,while the other system for physical access (which is of course an expectedresult).

18 El-Abed et al.
Table 2 Comparative analysis of acceptance and satisfaction between the studied systems,Kruskal-Wallis analysis
Mean ratings of the studied systems
Satisfaction questions Face system Keystroke system p-value
Disturbed 1.916 1.67 0.034
Threats to privacy 2.427 1.626 << 0.05
Easiness to use 3.133 3.242 0.355
Verification quickness 3.329 3.357 0.611
Correct answer 3.176 3.51 0.007
System can be easily attacked 2.659 2.3 0.005
Use in the future 2.989 3.112 0.238
Trust 2.84 3 0.176
General appreciation 2.823 3.175 0.0021
4.6 Discussion
The results of this study and the statistical analysis of answers brought manyinteresting information. We found a surprising high rate (47.5%) concerning theirconcerns about privacy issues while using face system. The results also broughtsurprising rates concerning the perceived performance of the tested systems, andtheir general appreciation. Respondents found that keystroke performance (with anEER = 17.51%) is better than the face one (with an EER = 8.76%), and they weremore satisfied from the keystroke system (88.9%) than the face one (75.8%).
Therefore, it would be important to explain respondents’ answers to moreunderstand these rates, and the significant differences among the studied systems.This is what we present in the next section.
4.7 Data-mining analysis
The purpose of this section is to study the dependences between satisfactionquestions (Appendix, parts B and C except Q16) to understand respondents’answers. We would also like to more understand the surprising rates provided bythe previous section. Owing the nature of construction of Bayesian networks anddecision trees (i.e., the target question should be a nominal attribute), we proceedas follows:
1 Since the target question should be nominal, we divide the satisfactionquestions into two sets (SCause and SEffect), according to the Cause andEffect relationship. We consider that the questions inSCause = {Qi/i = 4, 5, 6, 7, 11, 12, 14} set are numerical attributes, whilequestions in SEffect = {Qi/i = 9, 10, 13, 15, 17, 18} set are nominal attributes.For example, we put concerns about privacy issues question (Q10) in SEffect
set, since we would like to explain why we have a high rate (47.5%)concerning privacy issues while using face system.
2 To generate the Bayesian networks and decision trees models, missing values(i.e., questions without answers) are handled for both kinds of attributes.

Evaluation of biometric systems 19
For nominal attributes, they are replaced by the most frequent choice. Whilefor numerical attributes, they are replaced by the average value.
Using Bayesian networks and Decision Trees, several points can be concluded:
• Using Table 3, respondents’ concerns about their privacy while using the facesystem can be explained by their perception about its robustness againstattacks. From the respondents who have expressed concerns about theirprivacy while using face system, more than half of them (66%) found thatit can be easily attacked. Since more than half of the respondents (51.5%) donot found the face system robust against attacks, this explains why a lot ofrespondents (47.5%) have expressed such concerns. Using both clauses C1 andC2 (Table 3), we can also deduce that the easiness to use face system is ananother possible candidate having impact on respondents’ concerns abouttheir privacy.
Table 3 Excerpt from decision tree explaining respondents’ answers for privacy issuesof the face verification system. Bold rules indicate important ones
• Respondents’ perception about keystroke performance (Table 4) was relatedto the robustness of the system against attacks, and its easiness to use. Fromthe respondents who found that keystroke performance is important, 23.5%of them considered that the system is quite easy to use, and 24.7% found thatthe system is robust against attacks. For the face system (Table 5), it wasrelated to their perception about its robustness against attacks, and theirawareness about fraud identity. From the respondents who do not found thatface performance important, 15% of them found that their awareness aboutfraud identity is not at all important, and 20% considered that the system isnot robust against attacks. From these results, we find that the robustness ofthe system against attacks is a possible candidate having impact on theirperception about the performance of both systems. Since respondentssignificantly (with a p-value = 0.005) considered that the robustness of

20 El-Abed et al.
keystroke system against attacks is better than the face system, and most ofthem (85.9%) considered that keystroke system is easy to use, this clearlyexplains why respondents found the performance of the keystroke system isbetter than the face one.
Table 4 Excerpt from decision tree explaining respondents’ answers of the keystrokeperformance. Bold rules indicate important ones
Table 5 Excerpt from decision tree explaining respondents’ answers of the faceverification performance. Bold rules indicate important ones
• Respondents’ general appreciation on both systems (Tables 6 and 7) wasrelated to the robustness of the system against attacks, and its easiness to use.From the respondents who were not satisfied while using face verificationsystem, 57.1% of them do not found the system is robust against attacks, and14.3% considered that it is not easy to use. From the respondents who weresatisfied from keystroke system, at least 12.5% of them found that keystrokesystem is robust against attacks, and almost 40.9% found that the system is

Evaluation of biometric systems 21
easy to use. In addition, the computation time during the verification phaseof keystroke system is also considered as a possible candidate having impacton respondents’ general appreciation. Therefore, we find that respondents’perception about the robustness of the system against attacks is the majorreason explaining why they were more satisfied from keystroke system thanface one.
Table 6 Excerpt from decision tree explaining respondents’ answers for their generalappreciation of the face verification system. Bold rules indicate important ones
Table 7 Excerpt from decision tree explaining respondents’ answers for their generalappreciation of the keystroke system. Bold rules indicate important ones
5 Conclusion and perspectives
The study of users’ acceptance and satisfaction of biometric systems is consideredas an important factor to take into account when designing and evaluating suchsystems (Theofanos et al., 2008b). Despite this, existing studies in the literature are

22 El-Abed et al.
very few in comparison with performance ones. However, most of the studies in thisarea are modality-dependent (such as the usability study presented by Theofanoset al. (2008a)). In addition, these studies are based on statistical answers to aquestionnaire, but no data analysis is conducted for understanding respondents’answers to identify reasons. To contribute in more taking into account users’ pointof view when designing biometric systems, we proposed in this paper a modality-independent evaluation methodology to study users’ acceptance and satisfaction ofbiometric systems. The methodology is based on a survey questionnaire for datacollection. It uses
• the Kruskal-Wallis test to extract significant relationships betweendemographical characteristics and satisfaction questions
• two data-mining tools, Bayesian networks and decision trees, that illustratedependencies to analyse respondents’ answers and behaviours.
The main advantage of the proposed methodology is twofold. First, it isindependent from the tested modality. Hence, it could be applied to any kindof biometric systems. Second, it uses data-mining tools to explain respondents’answers. Such kind of analysis would determine the possible candidates that mayinfluence their acceptance and satisfaction in a specified context of use and atarget population. We have illustrated the proposed methodology on a crew of100 volunteers, using two biometric systems developed in our research laboratoryfor clarifying its benefits. The first system is a morphological-based analysis (faceverification with an EER equal to 8.76%), the second one is a behavioural-basedanalysis (keystroke dynamics with an EER equal to 17.51%). The main resultsoutlined from this study are:
• Respondents considered that biometric-based technology is more appropriatethan secret-based solutions against fraud.
• Socio-demographic characteristics have influenced their answers on somesatisfaction questions.
• Both systems are acceptable and respondents were more satisfied with thekeystroke system (88.9%) than the other one (75.8%).
• The robustness of a system against attacks, its easiness to use and thecomputation time during the verification phase are identified as importantfactors influencing respondents acceptance and satisfaction.
• Finally, from the volunteers who have willingness to use the studied systemsin the future, the keystroke system was more requested to be used to managelogical access and the other system for physical access.
These findings clearly show that users’ acceptance and satisfaction should betaken into account when developing and evaluating biometric systems. Even ifthe performance of a biometric system outperformed another one, this will notnecessarily mean that it will be more operational or acceptable. In our opinion,there is a lack of an evaluation methodology that more take into account users’point of view when designing and evaluating biometric systems, which constitutesone of the main drawbacks of biometric systems proliferation.

Evaluation of biometric systems 23
For the perspectives, we intend to develop a web-based software to comparedifferent types of biometric systems (fingerprint, iris, keystroke dynamics, signaturedynamics and face verification), and to have a much larger population.
Terms and definitions
Authentication: Security measure designed to establish the validity of atransmission, message, or originator, or a means of verifying an individual’sauthorisation to receive specific categories of information.
Biometric: Any specific and uniquely identifiable physical human characteristic(e.g., of the retina that may be used to validate the identity of an individual).
enrolment: The process of collecting biometric samples from a person and thesubsequent preparation and storage of biometric reference templates representingthat person’s identity.
False Acceptance Rate (FAR): Rate at which an impostor is accepted by anauthentication system.
False Rejection Rate (FRR): Rate at which the authorised user is rejected from thesystem.
Equal Error Rate (EER): This error rate equates to the point at which the FARand FRR cross (compromise between FAR and FRR).
Vulnerability: A weakness in the system that can be exploited to violate its intendedbehaviour.
Threat: A potential event that could compromise the security integrity of thesystem.
Acknowledgement
The authors thank the Basse-Normandie Region and the French Research Ministryfor their financial support of this work.
References
Baldwin, J.F. and Xie, D. (2005) Intelligent Information Processing II, Chapter Simple
fuzzy logic rules based on fuzzy decision tree for classification and prediction problem,
Springer-Verlag, pp.175–184.
Bouckaert, R.R., Frank, E., Hall, M., Kirkby, R., Reutemann, P., Seewald, A. and Scuse, D.
(2009) Weka Manual, Technical report, Department of Computing Science, University
of Waikato, New Zealand.
Breiman, L., Friedman, J.H., Olshen, R.A. and Stone, C.J. (1984) Classification and
Regression Trees, Wadsworth International Group, 359 pages.
Coventry, L., De Angeli, A. and Johnson, G. (2003) ‘Honest it’s me! self service
verification’, The ACM Conference on Human Factors in Computing Systems (CHI),
pp.1–4.
24 El-Abed et al.
Deane, F., Barrelle, K., Henderson, R. and Mahar, D. (1995) ‘Perceived acceptability of
biometric security systems’, Computers & Security, Vol. 14, pp.225–231.
Edwards, B., Zatorsky, M. and Nayak, R. (2008) ‘Clustering and classification of
maintenance logs using text data mining’, Seventh Australasian Data Mining
Conference (AusDM 2008).
El Abed, M., Giot, R., Hemery, B. and Rosenberger, C. (2010) ‘A study of users’ acceptance
and satisfaction of biometric systems’, International Carnahan Conference on Security
Technology (ICCST), pp.170–178.
Elliott, S.J., Massie, S.A. and Sutton, M.J. (2007) ‘The perception of biometric technology:
A survey’, Automatic Identification Advanced Technologies, pp.259–264.
Friedman, N., Geiger, D. and Goldszmidt, M. (1997) ‘Bayesian network classifiers’,
Machine Learning, Vol. 29, pp.131–163.
Giot, R., El Abed, M. and Rosenberger, C. (2009a) ‘Greyc keystroke: a benchmark
for keystroke dynamics biometric systems’, IEEE 3rd International Conference on
Biometrics: Theory, Applications and Systems (BTAS), pp.1–6.
Giot, R., El Abed, M. and Rosenberger, C. (2009b) ‘Keystroke dynamics authentication
for collaborative systems’, Collaborative Technologies and Systems, International
Symposium, Washington, DC, USA, pp.172–179.
Hemery, B., Rosenberger, C. and Laurent, H. (2007) ‘The ENSIB database: a benchmark
for face recognition’, International Symposium on Signal Processing and its
Applications (ISSPA), special session “Performance Evaluation and Benchmarking of
Image and Video Processing”, United Arab Emirates (U.A.E.), Sharjah, pp.459–464.
Hemery, B., Schwartzman, J-J. and Rosenberger, C. (2010) ‘Study on color spaces for
single image enrolment face authentication’, IAPR International Conference on Pattern
Recognition (ICPR), pp.1249–1252.
Higgins, J.J. (2003) An Introduction to Modern Nonparametric Statistics, The American
Statistician, 500 pages.
Hocquet, S., Ramel, J.Y. and Cardot, H. (2007) ‘User classification for keystroke dynamics
authentication’, International Conference on Biometrics (ICB), pp.531–539.
ISO 13407:1999 (1999) Human Centred Design Process for Interactive Systems.
ISO/IEC 19795-1 (2006) Information Technology – Biometric Performance Testing and
Reporting – Part 1: Principles and Framework.
Jain, A.K., Pankanti, S., Prabhakar, S., Hong, L. and Ross, A. (2004) ‘Biometrics:
a grand challenge’, International Conference on Pattern Recognition (ICPR), Vol. 2,
pp.935–942.
Jones, L.A., Antón, A.I. and Earp, J.B. (2007) ‘Towards understanding user perceptions
of authentication technologies’, ACM Workshop on Privacy in the Electronic Society,
Alexandria, Virginia, USA, pp.91–98.
Kryszczuk, K., Richiardi, J. and Drygajlo, A. (2009) ‘Impact of combining quality measures
on biometric sample matching’, Proceedings of the 3rd IEEE International Conference
on Biometrics: Theory, Applications and Systems (BTAS), Washington, DC, pp.1–6.
Kukula, E.P., Blomeke, C.R., Modi, S.K. and Elliott, S.J. (2009) ‘Effect of human-biometric
sensor interaction on fingerprint matching performance, image quality and minutiae
count’, International Journal of Computer Applications in Technology, Vol. 34, No. 4,
pp.270–277.
Ling, C.X., Huang, J. and Zhang, H. (2003) ‘AUC: a better measure than accuracy
in comparing learning algorithms’, Canadian Conference on Artificial Intelligence,
Vol. 2671, pp.329–341.
transpose.

Evaluation of biometric systems 25
Lowe, D.G. (2004) ‘Distinctive image features from scale-invariant keypoints’, International
Journal of Computer Vision (IJCV), Vol. 60, pp.91–110.
Mahier, J., Pasquet, M., Rosenberger, C. and Cuozzo, F. (2008) ‘Biometric authentication’,
Encyclopedia of Information Science and Technology, pp.346–354.
Maio, D., Maltoni, D., Wayman, J.L. and Jain, A.K. (2004) 1Fvc2004: third fingerprint
verification competition’, Proceedings of the 1st International Conference on Biometric
Authentication, Hong Kong, pp.1–7.
Moody, J. (2004) ‘Public perceptions of biometric devices: the effect of misinformation on
acceptance and use’, The Informing Science and Information Technology Education,
Vol. 1, pp.753–761.
ORC (2002) Public Attitudes Toward the Uses of Biometric Identification Technologiesby
Government and the Private Sector, Technical Report, Opinion Research Corporation
International (ORC).
Petrovska, D. and Mayoue, A. (2007) Description and Documentation of the Biosecure
Software Library, Technical Report, BioSecure.
Pons, A.P. and Polak, P. (2008) ‘Understanding user perspectives on biometric technology’,
Communications of the Association for Computing Machinery (ACM), Vol. 51, No. 9,
pp.115–118.
Quinlan, J.R. (1986) ‘Induction of decision trees’, Machine Learning, Kluwer Academic
Publishers, Vol. 1, pp.81–106.
Quinlan, J.R. (1993) C4.5: Programs for Machine Learning (Morgan Kaufmann Series in
Machine Learning), Vol. 16, Morgan Kaufmann, 302 pages.
Rakotomalala, R. (1997) Graphes d’induction, PhD Thesis, Université Claude Bernard –
Lyon 1.
Ratha, N.K., Connell, J.H. and Bolle, R.M. (2001) ‘An analysis of minutiae matching
strength’, Audio- and Video-based Biometric Person Authentication, pp.223–228.
Smith, S. (2003) ‘Humans in the loop: human computer interaction and security’,
IEEE Security and Privacy, Vol. 1, No. 3, pp.75–79.
Tabassi, E. and Wilson, C.L. (2005) ‘A novel approach to fingerprint image quality’,
International Conference on Image Processing (ICIP), pp. 37–40.
Theofanos, M., Stanton, B., Orandi, S., Micheals, R. and Zhang, N.F. (2007) Usability
Testing of Ten-print Fingerprint Capture, Technical Report, National Institute of
Standards and Technology (NIST).
Theofanos, M., Stanton, B., Sheppard, C., Micheals, R., Zhang, N., Wydler, J., Nadel, L.
and Rubin, W. (2008a) Usability Testing of Height and Angles of Ten-print Fingerprint
Capture, Technical Report, National Institute of Standards and Technology (NIST).
Theofanos, M., Stanton, B. and Wolfson, C.A. (2008b) Usability & Biometrics: Ensuring
Successful Biometric Systems, National Institute of Standards and Technology (NIST).
Uzoka, F-M.E. and Ndzinge, T. (2009) ‘An investigation of factors affecting biometric
technology adoption in a developing country context’, International Journal of
Biometrics (IJBM), Vol. 1, No. 3, pp.307–328.
Yampolskiy, R.V. and Govindaraju, V. (2008) ‘Behavioural biometrics: a survey
and classification’, International Journal of Biometrics (IJBM), Vol. 1, No. 1,
pp.81–113.

26 El-Abed et al.
Appendix
Survey questionnaire


![collaborative PP-Module for Mobile biometric enrolment and ... · [SD] Evaluation Activities for collaborative Protection Profile Module for Mobile biometric enrolment and verification](https://static.fdocuments.net/doc/165x107/5e21711c116ff5023a0c7f09/collaborative-pp-module-for-mobile-biometric-enrolment-and-sd-evaluation-activities.jpg)