
Evaluation of Big Data Maturity Models - A Benchmarking ...
129
HENRIK BRAUN EVALUATION OF BIG DATA MATURITY MODELS - A BENCH- MARKING STUDY TO SUPPORT BIG DATA MATURITY AS- SESSMENT IN ORGANIZATIONS Master of Science thesis Examiner: prof. Hannu Kärkkäinen Examiner and topic approved by the Faculty Council of the Faculty of Business and Built Environment on February 4 th , 2015
Transcript of Evaluation of Big Data Maturity Models - A Benchmarking ...
HENRIK BRAUN
EVALUATION OF BIG DATA MATURITY MODELS - A BENCH-
MARKING STUDY TO SUPPORT BIG DATA MATURITY AS-
SESSMENT IN ORGANIZATIONS
Master of Science thesis
Examiner: prof. Hannu Kärkkäinen Examiner and topic approved by the Faculty Council of the Faculty of Business and Built Environment on February 4th, 2015

i
ABSTRACT
HENRIK BRAUN: Evaluation of Big Data Maturity Models – A Benchmarking Study to Support Big Data Maturity Assessment in Organizations Tampere University of Technology Master of Science Thesis, 119 pages, 3 Appendix pages June 2015 Master’s Degree Programme in Information and Knowledge Management Major: Business Information Management Examiner: Professor Hannu Kärkkäinen Keywords: big data, maturity model, business value creation, benchmarking, evaluation
Big Data is defined as high volume, high velocity and high variety information assets, a
result of the explosive growth of data facilitated by the digitization of our society. Data
has always had strategic value, but with Big Data and the new data handling solutions
even more value creation opportunities have emerged. Studies have shown that adopting
Big Data initiatives in organizations enhance data management and analytical capabili-
ties that ultimately improve competitiveness, productivity as well as financial and oper-
ational results. There are differences between organizations in terms of Big Data capa-
bilities, performance and to what effect Big Data can be utilized. To create value from
Big Data, organizations must first assess their current situation and find solutions to
advance to a higher Big Data capability level, also known as Big Data maturity. Con-
ceptual artefacts called Big Data maturity models have been developed to help in this
endeavor. They allow organizations to have their Big Data methods and processes as-
sessed according to best practices. However, it is a tough job for an organization to se-
lect the most useful and appropriate model, as there are many available and each one
differ in terms of extensiveness, quality, ease of use, and content.
The objective of this research was to evaluate and compare available Big Data maturity
models in terms of good practices of maturity modeling and Big Data value creation,
ultimately supporting the organizational maturity assessment process. This was done by
conducting a benchmarking study that quantitatively evaluated maturity model attrib-
utes against specific evaluation criteria. As a result, eight Big Data maturity models
were chosen, evaluated and analyzed. The theoretical foundations and concepts of the
research were identified through systematical literature reviews. The benchmarking
scores suggest that there is great variance between models when examining the good
practices of maturity modeling. The degree of addressing Big Data value creation op-
portunities is more balanced. However, total scores clearly lean towards a specific group
of models, identified as top-performers. These top-performers score relatively high in
all examined criteria groups and represent currently the most useful Big Data maturity
models for organizational Big Data maturity assessment. They demonstrate high quality
of model structure, extensiveness and detail level. Authors of these models use a con-
sistent methodology and good practices for design and development activities, and en-
gage in high quality documentation practices. The Big Data maturity models are easy to
use, and provide an intuitive tool for assessment as well as sufficient supporting materi-
als to the end user. Lastly, they address all important Big Data capabilities that contrib-
ute to the creation of business value.

ii
TIIVISTELMÄ
HENRIK BRAUN: Big Data maturiteettimallien arviointi – Vertailututkimus Big Data maturiteetin arvioinnin tueksi organisaatioissa Tampereen teknillinen yliopisto Diplomityö, 119 sivua, 3 liitesivua Kesäkuu 2015 Tietojohtamisen diplomi-insinöörin tutkinto-ohjelma Pääaine: Tiedonhallinta Tarkastaja: professori Hannu Kärkkäinen Avainsanat: big data, maturiteettimalli, arvonluonti, vertailu, arviointi
Big Data määritellään suureksi, nopeasti kerätyksi ja järjestelemättömäksi
tietomassaksi, jonka syntyä on edistänyt tiedon räjähdysmäinen kasvu ja
yhteiskuntamme digitalisaatio. Datalla on aina ollut liiketoiminnallinen arvo, mutta Big
Datan myötä on ilmestynyt uusia arvonluontimahdollisuuksia. Tutkimusten mukaan Big
Data valmiuksien käyttöönotto organisaatiossa parantaa organisaation tiedonhallintaa ja
analyyttisiä ratkaisuja, mikä lopulta johtaa kilpailukyvyn ja tuottavuuden paranemiseen
sekä taloudellisten ja toiminnallisten tulosten kohenemiseen. Organisaatioiden välillä on
huomattavia eroja Big Data valmiuksien ja niiden hyödyntämisen suhteen. Jotta Big
Datasta saataisiin luotua arvoa, organisaatioiden on arvioitava nykytilansa sekä löytää
ratkaisuja Big Data valmiuksien eli maturiteettitason nostamiseen. Maturiteettimallit
yrittävät tarjota tähän ongelmaan ratkaisun. Ne mahdollistavat organisaation Big Data
menetelmien ja prosessien arvioimisen parhaita käytäntöjä vastaan. Organisaatiolla on
kuitenkin vaikeaa valita kaikista hyödyllisin ja sopivin malli, sillä niitä on paljon ja
jokainen niistä eroaa kattavuuden, laadun, käytettävyyden ja sisällön suhteen.
Tutkimuksen tavoite oli arvioida ja vertailla saatavilla olevia Big Data
maturiteettimalleja hyvien maturiteettimallintamiskäytäntöjen ja Big Datan
arvonluontimahdollisuuksien suhteen, ja tukea organisaatioiden Big Data
maturiteettiarviointiprosessia. Tutkimus oli toteutettu vertailututkimuksena, missä
maturiteettimallien ominaisuuksia arvioitiin kvantitatiivisesti tiettyjä kriteereitä vastaan.
Tutkimuksen valinta kohdistui lopulta kahdeksaan Big Data maturiteettimalliin, jotka
arvioitiin ja analysoitiin. Teoreettinen tausta ja tutkimuksessa käytetyt käsitteet
tunnistettiin systemaattisten kirjallisuuskatsausten kautta. Vertailututkimuksen tulokset
viittasivat siihen, että tarkasteltujen mallien välillä oli huomattavia eroja
maturiteettimallintamisen hyvien käytäntöjen suhteen. Sen sijaan Big Data
arvonluontimahdollisuuksia oli huomioitu tasapainoisesti. Kokonaistulokset kuitenkin
viittaavat siihen, että eräät mallit suoriutuivat ja ryhmittyivät muita malleja paremmin.
Tämän ryhmän mallit suoriutuivat suhteellisen korkeatasoisesti jokaisessa
kriteeriryhmässä ja täten edustavat tällä hetkellä hyödyllisimpiä Big Data
maturiteettimalleja organisaatioiden Big Data maturiteetin arvioinnin tueksi. Ne
osoittavat, että malli on kattava, yksityiskohtainen ja rakennettu korkealaatuisesti.
Mallien kehittäjät ovat käyttäneet yhdenmukaisia metodologisia ratkaisuja sekä hyviä
kehityksen käytäntöjä, ja ovat dokumentoineet kehitysprosessiaan. Big Data mallit ovat
helppokäyttöisiä ja tarjoavat intuitiivisen työkalun sekä ohjeistusta loppukäyttäjälle
arviointia varten. Lisäksi, ne ottavat huomioon kaikki tärkeät Big Data ominaisuudet,
jotka edistävät liiketoiminnan arvonluontimahdollisuuksia.

iii
PREFACE
I began writing this thesis in September 2014. After nine months of hard work it is fi-
nally finished. This Master‟s thesis marks the end of my 19 year study journey which
was overall very enjoyable. Now I can focus on utilizing all the new knowledge in the
awaiting work environment.
I would like to thank my supervising professor Hannu Kärkkäinen for his valuable ad-
vice and guidance throughout the research process. His insights helped me outline the
themes and topics of the research. I would also like to thank my friends and family for
supporting me in all endeavors, both academic and personal.
Tampere, 11th
of May 2015
Henrik Braun

iv
TABLE OF CONTENTS
1. INTRODUCTION .................................................................................................... 1
1.1 Research background and motivation ............................................................ 1
1.2 Research objectives, scope and limitations .................................................... 3
1.3 Research methodology ................................................................................... 4
1.3.1 Research philosophy and approach .................................................. 5
1.3.2 Research strategy ............................................................................. 7
1.3.3 Data collection and analysis techniques ........................................... 8
1.4 Research structure ........................................................................................ 10
2. BIG DATA .............................................................................................................. 11
2.1 The three V‟s of Big Data ............................................................................ 12
2.2 Big Data technologies .................................................................................. 15
2.2.1 NoSQL databases ........................................................................... 16
2.2.2 Hadoop and MapReduce ................................................................ 19
2.2.3 Big Data in the cloud ..................................................................... 22
2.3 Capturing value from Big Data .................................................................... 24
2.3.1 Data transparency through proper data management ..................... 25
2.3.2 Customer segmentation and new offerings .................................... 29
2.3.3 Improved decision making with data-driven analytics .................. 30
2.3.4 New innovative business models, products and services ............... 32
2.4 Challenges of implementing Big Data initiatives ........................................ 34
3. MATURITY MODELING ..................................................................................... 36
3.1 The concept of maturity and maturity models ............................................. 36
3.2 Forerunners of maturity models ................................................................... 39
3.3 Big Data maturity models ............................................................................ 41
3.4 Strengths and criticism of using maturity models in organizations ............. 42
4. SYSTEMATIC LITERATURE REVIEW OF MATURITY MODEL
DEVELOPMENT AND CLASSIFICATION ................................................................ 43
4.1 Fink‟s systematic literature review model ................................................... 43
4.2 Collection of data ......................................................................................... 45
4.2.1 Bibliographic databases and search strategy .................................. 45
4.2.2 Practical and methodological inclusion and exclusion criteria ...... 48
4.3 Description of data ....................................................................................... 50
4.3.1 De Bruin et al. proposal ................................................................. 50
4.3.2 Becker et al. proposal ..................................................................... 52
4.3.3 Kohlegger et al. proposal ............................................................... 54
4.3.4 Mettler et al. proposal .................................................................... 56
4.3.5 van Steenbergen et al. proposal ...................................................... 59
4.3.6 Lahrmann et al. proposal ................................................................ 60
4.3.7 Pöppelbuß and Röglinger proposal ................................................ 61

v
4.4 Analysis and synthesis of data ..................................................................... 62
4.4.1 Lack of standardized maturity model development methodology
and dissatisfactory documentation of development procedures ................... 63
4.4.2 Generic maturity model development framework and classification
system framework ........................................................................................ 64
5. EVALUATION OF BIG DATA MATURITY MODELS ..................................... 72
5.1 Big Data maturity model selection process .................................................. 72
5.2 Benchmarking framework and evaluation criteria ....................................... 76
5.3 Benchmarking results ................................................................................... 78
5.3.1 Completeness of the model structure ............................................. 78
5.3.2 Quality of model development and evaluation .............................. 80
5.3.3 Ease of application ......................................................................... 83
5.3.4 Big Data value creation .................................................................. 86
5.3.5 Overall benchmarking scores ......................................................... 88
6. CONCLUSIONS ..................................................................................................... 92
6.1 Research summary and conclusions ............................................................. 92
6.2 Critical evaluation of the research .............................................................. 102
6.3 Suggestions for future research .................................................................. 105
REFERENCES .............................................................................................................. 106
APPENDICIES (2 PIECES) ......................................................................................... 119

vi
LIST OF SYMBOLS AND ABBREVIATIONS
ACID Atomicity, Consistency, Isolation, Durability
BASE Basically Available, Soft state, Eventual consistency
BDM Big Data Management
BI Business Intelligence
BI/DW Business Intelligence and Data Warehousing
CAP Consistency, Availability, Tolerance
CMM Capability Maturity Model
DSR Design Science Research
DW Data Warehouse
GFS Google File System
HDFS Hadoop Distributed File System
ICT Information and Communications Technology
IaaS Infrastructure as a Service
IoT Internet of Things
IT Information Technology
KPA Key Process Area
NoSQL Not Only SQL
SaaS Software as a Service
PaaS Platform as a Service
RAM Random Access Memory
QMMG Quality Management Maturity Grid
SEI Software Engineering Institute
TDWI The Data Warehouse Institute

1
1. INTRODUCTION
Research in general is a “quest for knowledge through diligent search, investigation or
experimentation” (WHO 2001, p. 1). Research involves systematic procedures and
techniques for obtaining and interpreting new knowledge or resolving debatable exist-
ing knowledge (Moeen et al. 2008, p. 145). A thorough research process is delimited by
philosophical and strategic assumption that guide in the selection of data collection
methods and analysis techniques (Saunders et al. 2009).
The purpose of this Master‟s thesis is to conduct an academic research to identify the
most suitable and useful maturity models for organizational Big Data maturity assess-
ment in terms of extensiveness, quality, ease of use, and business value creation. In this
chapter the background and motivation of the research is firstly introduced. Secondly, a
look is taken into the research objectives, scope and limitations. Research objectives are
transformed into a research problem, and ultimately to a set of research questions. The
methodology of the research is also briefly discussed by introducing the research phi-
losophy, approach, strategy, and techniques. This includes the introduction to all uti-
lized frameworks, data collection methods and analysis methods. The last sub-chapter
introduces the structure of this research.
1.1 Research background and motivation
Today, organizations are collecting increasing amounts of disparate data. Companies
push out a tremendous amount of transactional data, capturing trillions of bytes of in-
formation about their customers, suppliers, and operations. They are collecting more
than they can manage or analyze, but they also realize that data and data analysis can
provide important strategic and competitive advantage. (Manyika et al. 2011, p. 1;
Halper & Krishnan 2013, p. 3.) There is a need for better infrastructure, data manage-
ment, analytics, governance and organizational processes to handle this vast amount of
data (Halper & Krishnan 2013, p. 6). These initiatives together are usually referred to as
Big Data.
Big Data can be viewed as a phenomenon and a buzzword. There is no distinct defini-
tion of Big Data and the definition is usually intentionally subjective and incorporates
moving elements. The definition can vary by sector, depending on “what kinds of soft-
ware tools are commonly available and what sizes of datasets are common in a particu-
lar industry.” (Manyika et al. 2011, p. 1.) According to Goss and Veeramuthu (2013, p.
220), Big Data is “the territory where our existing traditional relational database
and file systems processing capacities are exceeded in high transactional volumes,
2
velocity responsiveness, and the quantity and or variety of data.” Halper and Krish-
nan (2013, p. 4) describe Big Data as not only a single technology, but “a combination
of old and new technologies that help companies gain actionable insight while effective-
ly managing data load and storage problems.” According to Gartner (2014a), Big Data
is “high-volume, high-velocity and high-variety information assets that demand cost-
effective, innovative forms of information processing for enhanced insight and decision
making.”
The organization‟s Big Data program needs to meet the requirements of collecting,
managing and analyzing potentially huge volumes of disparate data, at the right speed,
and within the right time frame. Big Data is located in various internal and external
sources, and can consist of structured data, unstructured data, streaming data, social
media data, geospatial data, and so on. Leveraging all these data sources with success
requires Big Data ready infrastructure, data, analytics, organizational structure, and
governance. (Halper & Krishnan 2013, p. 4.)
The utilization of Big Data is becoming a key way for companies to outperform their
peers (Halper & Krishnan 2013, p. 4). McAfee and Brynjolfsson (2012, p. 64) explored
the impact of Big Data and corporate performance, and came to remarkable conclusion:
“The more companies characterized themselves as data-driven, the better they per-
formed on objective measures of financial and operational results. In particular, com-
panies in the top third of their industry in the use of data-driven decision-making were,
on average, 5 percent more productive and 6 percent more profitable than their com-
petitors.”
Still, organizations confront differences in their ability to utilize Big Data effectively, as
seen in their stages of Big Data maturity. These differences range from “adopting Big
Data practices for operational improvement in selected functional areas or building or
revamping an organization‟s value proposition to completely transforming their busi-
ness model based on Big Data.” (El-Darwiche et al. 2014, p. 50.) To keep up with the
constantly changing business environment and good practices of Big Data, organiza-
tions require tools to assess their current state of Big Data adoption and guidelines on
how to improve current Big Data capabilities.
Conceptual models called maturity models have been developed to assist organizations
in this endeavor. Maturity models are used to “rate capabilities of maturing elements
and select appropriate actions to take the elements to a higher level of maturity”
(Kohlegger et al. 2009, p. 51). According to Halper and Krishnan (2013, pp. 5-6), ma-
turity models that are designed for the Big Data domain help in creating structure
around a Big Data program and determining where to start, identifying and defining the
organization‟s goals around the program, and providing a methodology to measure and
monitor the state of the program and the effort needed to complete the current stage, as

3
well as steps to move to the next stage of maturity. However it is a tough job for the
company to select the most appropriate maturity model, as there are a lot of options
available and each one differ in terms of extensiveness, quality of development and test-
ing, ease of use, and content. Maturity models are also often developed ad hoc without
following a consistent development methodology, and may not provide a path way to
further extend and update the model to encourage systematic enhancements and exten-
sions (Proenca et al. 2013, p. 1474).
1.2 Research objectives, scope and limitations
The main objective of this research is to support organizational Big Data maturity as-
sessment by evaluating and comparing available Big Data maturity models in terms of
usefulness, good practices of maturity modeling and business value creation. First, sys-
tematical literature reviews are conducted to establish the theoretical foundations, con-
cepts and themes of the research. This includes defining the different ways Big Data
creates value as well as the good practices of maturity model development and classifi-
cation. This information is then used to conduct a benchmarking study of available Big
Data maturity models, where model attributes are evaluated quantitatively against pre-
defined criteria. Instead of looking into a subject on too broad of a scale there is a need
to narrow down and limit the subject to fit everything relevant into your research (Saar-
anen-Kauppinen & Puusniekka 2006, pp. 12-13). A Big Data ecosystem and organiza-
tional Big Data maturity in this research context is perceived as the collection of the
internal Big Data capabilities of an organization, excluding all third party vendor capa-
bilities. Also, the target of the latter systematic literature review is specifically the ge-
neric development and classification of maturity models. Here, “development” is re-
ferred to the complete lifecycle of a maturity model from early designing activities to
the implementation and maintenance of the model. Special emphasis is put on identify-
ing maturity model decision attributes since these are needed for constructing the classi-
fication system and benchmarking framework. Furthermore, when evaluating the Big
Data maturity models on value creation, a commercial business scope is used shifting
the focus off from public non-profit or governmental organizations. The benchmarking
is done based on pre-defined criteria that contribute to the extensiveness, quality, and
application of maturity model development as well as Big Data business value creation.
The benchmarking is limited to only commercial-free available models.
A good research problem is unambiguous, clear and understandable (Saaranen-
Kauppinen & Puusniekka 2006, p. 13). The research problem can be modified into the
main research question:
What maturity models are the most useful to organizations for determining and
improving Big Data capabilities and ultimately creating business value?

4
Research questions that support the main question can be shaped into the following sub-
questions:
What is Big Data and what are the characteristics behind it?
How can organizations utilize and create value from Big Data in their business?
What are maturity models and the concepts behind them?
What are the best practices for generic development and classification of maturi-
ty models?
How can maturity models be evaluated and compared effectively?
What kinds of existing models measure organizational Big Data maturity and
what differences are there between them in terms of good practices of maturity
modeling and Big Data business value creation?
The first three sub-questions help defining the basic concepts and terminology of the
research, namely the concepts of Big Data and maturity models. This is done in the the-
oretical part of this research in chapters 2 and 3 through analysis of current literature.
After establishing a theoretical background the fourth research sub-question, regarding
the good practices of maturity modeling, is answered. This is done in a more systematic
literature review in chapter 4 by comprehensively reviewing the literature on the topic
of maturity model development and classification. Finally, in chapter 5 the last two sub-
questions are answered by conducting a benchmarking analysis of available Big Data
maturity models. Answering all the sub-questions will ultimately yield an answer to the
main research question. Finally, all answers to the research questions are discussed and
summarized in chapter 6.
1.3 Research methodology
The term “methodology” refers to the theory of how research should be undertaken
(Saunders et al. 2009, p. 3), in other words, what the data consist of and how data was
collected, organized, and analyzed (Berg 2004, p. 275). When conducting a research,
the possibilities of choices are almost endless (Hirsjärvi et al. 2004). To answer the re-
search questions described above, the ways in which research data is collected and ana-
lyzed must be first defined. Saunders et al. (2009, pp. 107-108) propose a metaphorical
“research onion”, where the outer layers represent the context and boundaries within
which the data collection techniques and analysis procedures (inner layers) will be se-
lected. The research onion is illustrated in figure 1.1.

5
Positivism
Realism
Interpretivism
Pragmatism
Deductive
Inductive
ExperimentSurvey
Case Study
Action research
Grounded theory
Ethnography
Archival research
Mono method
Mixed method
Multi-method
Cross-sectional
Longitudinal
Data collection and data analysis
Philosophies
Approaches
Strategies
Choices
Time horizons
Techniques and procedures
Figure 1.1. The research onion (adapted from Saunders et al. 2009, p. 108)
During this sub-chapter, the research onion is peeled open by first defining the research
philosophy and approach. These act as a base for selecting the appropriate research
strategy and other choices regarding the strategic process. The research strategy finally
guides the selection of the data collection and analysis techniques.
1.3.1 Research philosophy and approach
Before a discussion about research philosophical approaches can be held, there is a need
to define the conceptions of social reality, namely ontology and epistemology. Ontology
is concerned with the nature of reality and existence, and introduces the terms “objectiv-
ism” and “subjectivism” (Saunders et al. 2009, p. 110). Objectivism portrays the posi-
tion that all reality is objective and external to mind, while subjectivism suggest that all
reality in the form of knowledge is subjective (Merriam-Webster 2015). Epistemology
can be defined as the relationship between the researcher and reality, or how this reality
is captured or known (Carson et al. 2001, p 6).
There are two ontological and epistemological ideologies that dominate the field. Based
on the philosophical assumptions adopted, research can be classified as positivist and
interpretive (Myers 1997). Positivist approaches assume that “reality is objectively giv-
en and can be described by measurable properties independent of the observer” (ibid).
Positivistic research is likely to use existing theories to develop hypothesis, test, and
ultimately confirm them. (Saunders et al. 2009, p. 113.) The positivist researcher will be
likely to use a highly structured methodology in order to facilitate replication. Further-

6
more, the emphasis will be on quantifiable observations and statistical analysis. (Gill &
Johnson 2002.) Interpretivism is highly subjective and advocates that there exist multi-
ple instances of a reality. This is due to the assumption that people perceive the reality
in different ways. Thus, the goal of interpretivistic research is to understand and inter-
pret the meanings in human behavior rather than to generalize and predict causes and
effects. (Carson et al. 2001, p. 6.) A general methodology for interpretation is herme-
neutics (Gummesson 2003, p. 484). Ricoeur (1981, p. 43) defines hermeneutics as the
theory of the operations of understanding their relation to the interpretation of texts. In
other words, hermeneutics focuses on the meaning of qualitative textual data. Herme-
neutics is often used in a business setting to understand the people and textual docu-
ments behind an organization (Myers 2008).
There are two main research approaches: deduction and induction. With deduction, a
hypothesis (or hypotheses) is developed and a research strategy designed to test the hy-
pothesis. With induction, empirical data is collected and a theory developed as a result
of the data analysis. (Saunders et al. 2009, p. 129.) The purpose of the research ap-
proach is the overall plan for connecting the conceptual research problem to the relevant
and practicable empirical research (Ghauri & Grønhaug 2005, p. 56). The classification
of research purpose most often used in the research methods‟ literature is the threefold
one of exploratory, descriptive and explanatory (Saunders et al. 2009, p. 139). An ex-
ploratory study is a valuable means of finding out “what is happening; to seek new in-
sights; to ask questions and to assess phenomena in a new light” (Robson 2002, p. 59).
It is particularly useful if one wishes “to clarify your understanding of a problem, such
as if one is unsure of the precise nature of the problem” (Saunders et al. 2009, p. 139).
The object of descriptive research is “to portray an accurate profile of persons, events or
situations” (Robson 2002, p. 59). This means that the problem is well understood and
highly structured. The term explanatory research advocates that “the research in ques-
tions is intended to explain, rather than simply to describe, the phenomena studied”
(Maxwell & Mittapalli 2008).
This research is mainly defined as deductive-descriptive using hermeneutics as a philo-
sophical approach. Maturity model development concepts and decisions, as well as
benchmarking criteria are identified through the interpretation and description of aca-
demic research papers. The concepts found in the academic papers act as the theoretical
foundation for the research, resulting in a deductive approach. Positivistic features are
introduced in the research part when conducting the quantitative benchmarking process.
The benchmarking process consists of assigning numeric values to different model at-
tributes against pre-defined weighted criteria, and is thus highly replicable.

7
1.3.2 Research strategy
After defining the key concepts of the research onion‟s outer layer (figure 1.1), the pro-
cess of choosing the appropriate research strategy can begin. There are many different
ways to interpret the term “research strategy” (Lähdesmäki et al. 2014) and no research
strategy is inherently superior or inferior to any other (Saunders et al. 2009, p. 141). A
well balanced definition is proposed by The University of Reading (2006), defining it as
“the activity that needs to be undertaken to ensure that there are adequate resources
available to complete the study in the time available, to make sure that the approach to
the design of the study is the appropriate one to achieve the study's objectives, that suit-
able software are available to manage and analyze the data, and that sensible sets of data
are collected to ensure that analysis will allow the required information to be extracted.”
It is common to divide research strategies into quantitative and qualitative. Quantitative
research is an empirical research where the data is in the form of numbers (Punch 2004).
Quantitative research methods employ statistical tools in the collection and interpreta-
tion of data. Their emphasis on systematic statistical analysis helps to ensure that find-
ings and interpretations are healthy and robust (Devine 2002). Comparatively, qualita-
tive research is a method of “a non-statistical form of inquiry, techniques and processes
employed to gather data through the understanding of an event, circumstance, or phe-
nomenon under study” (McNabb 2004, p. 104). In the qualitative perspective, “detailed
knowledge of a given setting is sought through unstructured or semi structured data col-
lection from a small number of sources” (Denzin & Lincoln 2011).
Kasanen et al. (1991, p. 317) propose a classification system for strategic research ap-
proaches, illustrated with a four by four matrix in figure 1.2. A research is often catego-
rized into either a theoretical or an empirical research, based on ways information is
being gathered. A distinction is also made between descriptive or normative approach,
regarding the ways the collected data is used. These two categories act as the two axes
of the research strategy matrix, in which Kasanen et al. introduce five distinct research
approaches, namely the conceptual approach, decision-oriented approach, nomothetical
(positivistic) approach, action-oriented (hermeneutic) approach and constructive ap-
proach.

8
Conceptual approach Nomothetical approach
Decision-oriented approach Constructive approach
Theoretical Empirical
Descriptive
Normative
Action-oriented approach
Figure 1.2. Classifications of research strategies (adapted from Kasanen et al. 1991, p.
317)
The data for this research is not intended to be collected by means of observation or
experimentation, and thus empirical evidence is absent. Furthermore, a normative ap-
proach is eliminated since no practical improvement measures are being planned. In the
light of these facts, this research can be classified as descriptive-theoretical with a con-
ceptual approach. The purpose of the conceptual approach is to produce new knowledge
through the method of reasoning, analysis, synthesis and comparison of data (Lukka
2001). The conceptual approach acts here as the qualitative research strategy, which
guides in choosing the appropriate data collection and analysis methods, discussed next.
1.3.3 Data collection and analysis techniques
For obtaining the right information, the ways data is being collected and analyzed must
be first defined. It is necessary to develop a thorough understanding of previous re-
search that relates to one‟s research questions and objectives. This can be achieved with
a critical literature review, a process where literature sources are referenced, and key
points are drawn out and presented to the reader in a logical manner (Saunders et al.
2009, p. 98). There is no one correct structure for a literature review and many ap-
proaches are available. However, Booth et al. (2012) argue that all literature reviews
should be somewhat systematic. They mainly differ in “the degree to which they are
systematic and how explicitly their methods are reported” (ibid). In a highly structured
systematic literature review the processes of selecting the sources, constructing a search
query, and applying screening criteria, are well documented. This results in an objective
and transparent review which can be reproduced if necessary. (CRD 2009, p. 16.)
Literature reviews are common for a conceptual approach (Neilimo & Näsi 1980), and
thus are used here in two different situations. Firstly, in defining the key concepts of this
research including business value creation criteria for benchmarking, and secondly, in
identifying the best practices of developing and classifying maturity models. The latter
review is conducted more systematically and utilizes Fink‟s (2005) systematic literature
review approach, discussed more specifically in chapter 4.1. After analysis and synthe-
sis of the systematic review results, the data is used to construct a benchmarking

9
framework for evaluating Big Data maturity models. The benchmarking framework is
based on the proposal of Vezzetti et al. (2014), where maturity model attributes are
evaluated quantitatively against pre-defined criteria. The numeric results can ultimately
be presented visually by using radar charts. In order to control quality and maximize
meaningfulness, only available and referenced models were used as input for the
benchmarking process. The benchmarking process is discussed in more detail in chapter
5.2.
Research philosophy and approachHermeneutic, Deductive-descriptive
Research strategyQualitative, Conceptual (descriptive-theoretical)
Data collection and analysis techniques
Systematic literature review, qualitative and quantitative benchmarking
Re
sear
ch m
eth
od
olo
gy
Figure 1.3. Summary of the research methodology
By combining several lines of sight, researchers obtain “a better, more substantive pic-
ture of reality; a richer, more complete array of symbols and theoretical concepts; and a
means of verifying many of these elements” (Berg 2004, p. 4). The use of multiple lines
of sight is frequently called triangulation (Tuomi & Sarajärvi 2002, p. 141). Triangula-
tion is used in a few instances during this research, including in combining theoretical
point of views in the systematic literature review, and in combining quantitative and
qualitative techniques during the evaluation of Big Data maturity models. The overall
research methodology for this research is summarized in figure 1.3.

10
1.4 Research structure
This research is conducted deductively by first establishing a theoretical background
and then utilizing this information to collect and analyze data as well as form conclu-
sions on the basis of the results. Thus, the research follows a chronological path starting
with establishing a theoretical foundation through systematic literature views and then
utilizing this information to collect and analyze Big Data maturity model data as well as
form conclusions based on the results. The first literature review defines the general
concepts of Big Data and maturity models while the second one defines maturity model
development concepts in more detail. The latter one is also seen as more systematic.
1. Introduction
2. Big Data 3. Maturity models
4. Systematic literature review of maturity model development and classification
6. Conclusions
5. Evaluation of Big Data maturity modelsUtilizing the previous information to collect and analyze selected
data, and form conclusons
Establishing a theoretical foundation through
systematic literature reviews
Establishing the research background, objectives and
methodology
Figure 1.4. The research structure
As seen in the figure 1.4, the research is structured into six main chapters. The introduc-
tion chapter presents information related to the background and purpose of this research,
summing up the research methodology. The second and third chapters act as the theoret-
ical background and provide an overview of the concepts related to the research topic,
namely concepts of Big Data and maturity models. Chapter 2 also identifies several Big
Data domain capabilities, used later on as evaluation criteria for the evaluation process.
In chapter 4, a systematic literature review is performed to identify best practices and
decisions for developing and classifying maturity models. The data obtained from the
systematic literature review is used for comparative purposes in chapter 5, where select-
ed Big Data maturity models are evaluated through a benchmarking process. The evalu-
ation consists of first selecting the Big Data maturity models, validating them through a
benchmarking framework, and analyzing the results. The final chapter 6 concludes the
research by summarizing all the key findings obtained during the whole research pro-
cess and by answering the research questions.

11
2. BIG DATA
Big Data can be described as “high-volume, high-velocity and high-variety information
assets that demand cost-effective, innovative forms of information processing for en-
hanced insight and decision making” (Gartner 2014a). The term Big Data emerged a
few years ago and has since then gained a lot of attention and interest among the busi-
ness community. Big Data has been called a phenomenon and even an ICT revolution.
Manyika et al. (2011) approach Big Data by describing it as “the next frontier for inno-
vation, competition, and productivity.” Big Data, as of July 2014, has passed the top
peak of Gartner‟s hype cycle meaning that markets are maturing, and implementing Big
Data initiatives in organizations is becoming business as usual (DSSR 2014). The Big
Data market has been claimed to exceed 7.9 billion euros in 2013 alone, growing on an
annual rate of 30% (Alanko & Salo 2013, p. 4).
Devlin et al. (2012) argue that Big Data has evolved in two key directions: technology
and business. First, due to the nature of Big Data being very complex and large in size,
emphasis has to be put on new technological implications. These include improved pro-
cessing speed, new ways of data structuring, and intelligent software applications. Se-
cond, the business perspective of Big Data is how it can support different business cases
with well executed analytics, data management and data governance. To achieve a ho-
listic view of Big Data, one must understand how business and technology issues inter-
relate. (Devlin et al. 2012, pp. 3-6.)

12
Figure 2.1. Big Data domain capabilities
In this chapter, a comprehensive examination of the Big Data concept is conducted. In
chapter 2.1, Big Data is defined based on current literature and particularly on the at-
tributes of the 3V framework, namely volume, velocity and variety. In chapter 2.2, a
look is taken into the different technologies that have emerged alongside Big Data, in
particular NoSQL databases, the Hadoop ecosystem and cloud applications. After clear-
ing up the technical aspects of Big Data, a discussion is held in chapter 2.3 about how to
capture value from it. This is done by investigating four key areas, including data trans-
parency, customer segmentation, data-driven analytics, and business model innovation.
Finally in chapter 2.4, after establishing a holistic view of Big Data and its benefits, a
look is taken at the challenges that come with implementing Big Data initiatives. Big
Data domain capabilities addressed during this chapter are summarized in figure 2.1.
2.1 The three V’s of Big Data
The definition of data as a term is ambiguous and there are currently many definitions
and interpretations available in literature. Webster‟s dictionary defines data as “facts or
information used usually to calculate, analyze, or plan something” (Merriam-
Webster.com 2015). The derivative of data, namely Big Data, is a concept arising from
“the explosive growth in data led on by the continued digitization of society” (IRIS
Group 2013, p. 2). Prescott (2014, p. 573) captures Big Data‟s main features by defining
it as “the collection, storage, management, linkage, and analysis of very large and com-
plex data sets.” Davenport (2014, p. 45) adds to the definition by stating that Big Data
requires vast computing power and smart algorithms to analyze the variety of digital
streams. International management consultancies link the term specifically to automated
Big Data
Data management
Data transparency
Data quality
Data governance
Data automation
Customer segmentation
Purchase behavior analysis
Social media
IoT
Analytics
Data-driven decision making
BI/DW
Data mining
Data visualization
Business model innovation
Product and service
innovation
Optimization of business practices
Technology
Hadoop
NoSQL
Cloud computing
Organization
Talent management
Cost-effectiveness

13
processes like collection and analysis of data (Fox & Do 2013, p. 741). El-Darwiche et
al. (2014, p. 3) go even further by arguing that Big Data represents the aspirations to
establish and improve data-driven decision making in organizations.
A popular way is to characterize Big Data into three main aspects to distinguish it from
traditional data processing and analytics. These aspects are called the three V‟s, volume,
variety and velocity, first introduced by Laney (2001). The famous three V‟s of Big
Data (illustrated in figure 2.2) have become ubiquitous and occur frequently in current
Big Data literature (see McAfee & Brynjolfsson 2012, pp. 62-63; Alanko & Salo 2013,
p. 3; Fox & Do 2013, p. 742; El-Darwiche et al. 2014, p. 43). Using the three 3V
framework, Big Data can be defined as information management and processing activi-
ties involving data of high volume, high variety, and high velocity (Fox & Do 2013, p.
742).
Big Data
Volume
Variety Velocity Structured Unstructured
Semi-structured Real-time Near-time
Streams
Terabytes Petabytes Records, transactions, files
Figure 2.2. The three V’s of Big Data and their characteristics (adapted from Russom
2011, p. 7)
The amount of data in the world estimated today has exceeded approximately five zet-
tabytes (1021
bytes) (Alanko & Salo 2013, p. 3). As of 2012, 2.5 exabytes of data has
been created daily and the number has been doubling every 40 months or so (McAfee &
Brynjolfsson 2012, p. 62). The growth of data is illustrated in figure 2.3. The fast
growth of the internet and rapid evolution of data capturing devices and sensors have
contributed in the generation of a tremendous amount of digital data which can also
contain excessive “exhaust data” (Manyika et al. 2011, p. 1). Volume refers to the large
scale or amount of data which can enable the creation of new insights but requires infra-
structure to manage it (Zikopoulos et al. 2011, pp. 5-6). Russom (2011, p. 6) argues that
volume is the defining primary attribute of Big Data. Big Data is usually described in

14
dozens of terabytes and multiple petabytes of data in an organization. However,
Manyika et al. (2011, p. 1) think that Big Data can‟t be defined in terms of being larger
than a certain number of bytes. Corporate analysts tend to describe their data warehouse
not in bytes but in billions of records, transactions or files, and also take the time di-
mension into account (Russom 2011, p. 6).
Figure 2.3. Estimated annual growth of data (adapted from Ciobo et al. 2013, p. 2)
Velocity refers to the rate at which data may enter the organization (Sagiroglu & Sinanc
2013, p. 43). As the amount of devices, sensors and digitizing interfaces for data in-
crease, this data is now real time or near real time, requiring an increased rate of re-
sponse (Williams et al. 2014, p. 312). In many cases applications can view the velocity
or speed of data creation as more important than the volume of data (McAfee &
Brynjolfsson 2012, p. 63). The velocity dimension shifts the data into a continuous flow
of information rather than discrete packages of data (Williams et al. 2014, pp. 312-313).
Big Data tries to overcome the major challenges of connecting fast flowing data
streams, capturing and recording the valuable information, and analyzing it intelligently
(Alanko & Salo 2013, p. 4).
Variety refers to “the heterogeneous nature of Big Data, with a mix of structured, quan-
tified data and unstructured data that is difficult to incorporate into traditional organiza-
tional databases” (Chen et al. 2012 in Williams et al. 2014, p. 312). Devlin et al. (2012,
p. 7) identify that there are three domains of information, namely human-sourced infor-
mation, process-mediated data and machine-generated data. All three of these domains
produce different forms of information from different types of sources. Human-sourced
0
5
10
15
20
25
30
35
40
45
50
2008 2009 2010 2011 2012 2013 2014 2015 2016 2017 2018 2019 2020
Dat
a in
ze
ttab
yte
s (Z
B)
Year

15
information can be gathered from people, it is highly subjective, and stored loosely
structured in several of digitized formats. Process-mediated data is data collected from
business processes events. Process-mediated data is highly structured and includes
transactions, reference tables, relationships and metadata. Machine-generated data is
structured data collected from different devices, sensors and computers. Machine-
generated data is generated through a computational agent independently without hu-
man actions in between. (Devlin et al. 2012, pp. 6-7.) Many of the most important
sources of Big Data are relatively new and produce human-sourced data in unstructured
format. These sources include smartphones, sensors and social networks that collect
social media data, mobile applications data and online gaming data. (McAfee &
Brynjolfsson 2012, p. 63; Hashem et al. 2015, p. 100). In a 2012 Big Data survey, re-
sponses show that human-sourced information accounts for nearly half of the sources of
Big Data (Devlin et al. 2012, p. 8). Unlike structured data, unstructured data is challeng-
ing to store in traditional data warehouses due to the nature of it not residing in fixed
fields (Manyika et al. 2011, p. 33; El-Darwiche et al. 2014, p. 3).
Additional V‟s have been added by others to extend the definition of Big Data. Recently
the popular candidates for the fourth V attribute have been both veracity and value. Ve-
racity refers to the uncertainty of data, and value to the discovery of hidden insights in
large datasets. (Alanko & Salo 2013, p. 4.) Other elements that have been recognized by
companies are viability, variability, validity, virality, viscosity and vulnerability. There
are frameworks that use up to 10 V-attributes in their definition of Big Data. Robinson
(2012) finds that these additions are consequential and do not contribute to the funda-
mental definition. Grimes (2013) goes a step further by calling the additional elements
misleading “wanna-V‟s” that just add to the confusion. Devlin et al. (2012, p. 4) also
point out their skepticism by arguing that the additional dimensions are “qualitative in
nature and limited only by the imagination of their promoters.“ Inconsistency between
different vendor‟s definitions does not help understanding the main concept of the phe-
nomenon. The essential part is that the original 3V framework represents the main chal-
lenges of Big Data the best. The additional V‟s are a reminder that when working to
overcome Big Data challenges, many other aspects are present as well.
2.2 Big Data technologies
Big Data is in the territory where existing traditional storage systems start having diffi-
culties storing and managing the data (Hashem et al. 2015, p. 106). The data is too big,
moves too fast and doesn‟t fit the structures of the relational database management sys-
tems. To create value from this vast amount of complex data, technological solutions
have been developed to address these data processing issues (Goss & Veeramuthu 2013,
p. 220; Hashem et al. 2015, p. 106). McAfee & Brynjolfsson (2012, p. 66) conclude
that technology is always a necessary component of a company‟s Big Data strategy.

16
There are a growing number of technologies used to aggregate, manipulate, manage and
analyze Big Data (Manyika et al. 2011, p. 31). In this sub-chapter the most prominent
technologies have been listed. Frist, NoSQL databases and the new ways of storing un-
structured data are examined. Afterwards, a brief investigation is conducted about the
Hadoop ecosystem and all the components associated with it. Finally, a discussion is
held about the relation of Big Data to cloud computing.
2.2.1 NoSQL databases
Horizontal scalability is the ability to add multiple hardware and software resources,
and making them work as a single unit (Banerjee et al. 2012, p. 3). Horizontal scalabil-
ity is important because it provides high capacity for databases to perform their opera-
tions. However, traditional database systems, or relational systems, have little or no
ability to scale well horizontally (Cattell 2010, p. 1). Padhy et al. (2011 in Moniruz-
zaman & Hossain 2013, p. 3) argue that the main limitations with relational systems are
that they do not scale well with Data warehousing, Grid, Web 2.0 and Cloud applica-
tion, all connected with Big Data. New database systems have been designed to address
this scalability issue and to meet the heavy demands of Big Data. The high-scalable
databases got quickly associated with a new term called NoSQL, or commonly referred
to as "Not Only SQL" or “Not Relational” (Cattell 2010, p. 1). As illustrated in figure
2.4, NoSQL databases have the capabilities to maintain high performance when pro-
cessing high volume data, while relational databases tend to fall off quickly.
MASSIVE DATALITTLE DATA
PEF
OR
MA
NC
E
VOLUME OF DATA
FA
STS
LOW
RelationalDatabase
NoSQL Database
Figure 2.4. Scalability of NoSQL databases vs. traditional relational databases
(adapted from Lo 2014)
NoSQL represents “a completely different framework of databases that allows for high-
performance, agile processing of information at massive scale. The efficiency of

17
NoSQL can be achieved because NoSQL databases are unstructured in nature, trading
off stringent consistency requirements for speed and agility.” (Lo 2014.) NoSQL sys-
tems use non-traditional storing mechanisms with each system having their own unique
architecture and design. They usually operate with non-SQL languages (Moniruzzaman
& Hossain 2013, p. 1). A NoSQL solution is attractive for organizations because they
can handle huge quantities of data, relatively fast and across a high-scalable platform
(Moniruzzaman & Hossain 2013, p. 8).
NoSQL store systems can be categorized according to the different functional and struc-
tural characteristics. A popular way is to classify NoSQL stores into key-value, wide-
column, graph or document storage systems (Devlin et al. 2012, p. 11; Moniruzzaman
& Hossain 2013, p. 4; Russom 2013, p. 30). These four NoSQL database type classifi-
cations are described in detail in Moniruzzaman and Hossain (2013) and summarized in
table 2.1.
Table 2.1. Classifications of NoSQL store system types (adapted from Moniruzzaman &
Hossain 2013, pp. 4-8)
Type Description Examples
Key-value Key-value systems store values and an index to find them,
based on a programmer defined key. Key-value systems are
suitable for lightning-fast, highly-scalable retrieval of values
needed for application tasks such as retrieving product
names or managing profile data.
Dynamo, Voldemort,
Riak
Document Document store systems are able to store more complex
data than key-value systems by supporting the management
and storage of multiple types of object formats in a semi-
structured manner. Primarily used for storing and managing
Big Data-size collections of literal documents.
MongoDB, CouchDB
Wide-column Wide-column stores use a distributed and column-oriented
data structure mostly patterned after BigTable, Google’s
high performance data storage system. These systems tend
to build their platform by incorporating BigTable related
mechanisms like a distributed file system and a parallel pro-
cessing framework (see chapter 2.2.2). Useful for distributed
data storage, large-scale data processing, and exploratory
and predictive analytics.
BigTable, HBase, Hy-
pertable, Cassandra,
SimpleDB, DynamoDB
Graph A graph database replaces relational tables with graphs,
which are interconnected key-value pairings. Graph stores
are human-friendly and focus on the visual representation of
information. Valuable in identifying relationships between
data and used in social networking or forensic investigation
cases.
Neo4j, InfoGrid, Sones,
GraphDB, AllegroGraph,
18
Major Internet companies like Google (BigTable), Amazon (Dynamo) and Facebook
(Cassandra) contributed in the development of NoSQL systems by providing “proof of
concept” systems that inspired many of the data stores described above (Cattell 2010, p.
1). Most of NoSQL systems are released as open-source and use cheap commodity
servers, which give organizations a price advantage over commercial systems (Mon-
iruzzaman & Hossain 2013, p. 8). A NoSQL system also does not require expensive
database administrators for its design, installation and ongoing tuning since the system
supports automatic repair and data distribution (Sekar & Elango 2014, p. 632).
According to Cattell (2010, p. 1), other key features of NoSQL systems are that they
replicate and distribute data over a server cluster, they have a simple usable interface,
they use efficient indexing and RAM for data storage and are not compatible with the
integrity model ACID. ACID (Atomicity, Consistency, Isolation, Durability) refers to
four properties that guarantee the reliability and integrity of database transactions (Sekar
& Elango 2014, p. 631). The problem with ACID and NoSQL is that the systems have
limited guarantees on the consistency of read operations while scaling across multiple
servers (Cattell 2010, p. 1). Some authors have proposed an alternative to ACID and are
using the acronym BASE, standing for Basically Available, Soft-state and Eventual
consistency. BASE is often connected with Eric Brewer‟s CAP theorem. The CAP theo-
rem states that from the three properties, namely consistency, availability and tolerance
to network partitioning, database systems can only achieve two at the same time. Most
NoSQL systems have loosened up the requirements on consistency in order to achieve
better availability and partitioning. (Moniruzzaman & Hossain 2013, p. 4.)
Cattell (2010, p. 13) has predicted that NoSQL systems will maintain a strong niche
position in the data storage domain and one or two systems will likely become the lead-
ers of each NoSQL category. However, NoSQL databases are still far from advanced
database technologies and they will not replace traditional relational DBMS (Pokorny
2013, p. 80). The NoSQL solutions are too undeveloped to be “enterprise ready” and
they lack the robustness, functionality, familiarity, support and maturity of database
products that have been around for decades (Cattell 2010, p. 13; Sekar & Elango 2014,
p. 632). Sekar and Elango (2014, p. 632) add to this list of limitations by pointing out
that installing and maintaining NoSQL systems require a lot of effort and a high exper-
tise level.
There have also been the sightings of so called “NewSQL” systems. NewSQL systems
support “scalability and flexibility promised by NoSQL while retaining the support for
SQL queries and ACID” (Aslett 2011, p. 1). Systems that support SQL-like querying
are already familiar to business users and thus do not require a steep learning curve.
NewSQL systems handle data processing on multi-core multi-disk CPUs, in-memory
databases, distributed databases and horizontally scaled databases (Cattell 2010, p. 13).
The term in-memory database refers to a system where the data is queried from the
computer‟s memory rather from physical disks (Russom 2011, p. 27). In-memory ana-

19
lytics allow for real-time responses from a database by eliminating the need for index-
ing and timely disk input/output actions (Goss & Veeramuthu 2013, p. 224). In-memory
capabilities are used in the Business Intelligence domain for real-time reporting and
dashboarding (Russom 2011, p. 27).
2.2.2 Hadoop and MapReduce
Hadoop is an open-source software project that “allows for the distributed processing
of large data sets across clusters of computers using simple programming models” (Ha-
doop 2014). Developed by Apache, a decentralized community of developers support-
ing open software, it got its inspiration from Google‟s distributed file system GFS and
MapReduce (Alanko & Salo 2013, p. 7). The computer clusters in Hadoop are a group
of inexpensive commodity servers that allow the Hadoop library to detect and handle
failures at the application layer, rather than relying on high-availability delivery through
expensive hardware (McAfee & Brynjolfsson 2012, p. 64). It must be understood that
Hadoop is not a type of database, but rather a software ecosystem that supports parallel
computing (Lo 2014). In addition to the distributed file system, Hadoop also provides
tools for analyzing the data. The original Hadoop consisted of the primary components
Hadoop Distributed File System and Hadoop MapReduce. New iterations of Hadoop
have since emerged, opening up a wealth of new possibilities. An improved version
MapReduce, MR2, is now running on top of Hadoop YARN, a framework for job
scheduling and cluster resource management (Cloudera 2014; Hadoop 2014).
Hadoop Distributed File System (HDFS) is “a file system that spans all the nodes in a
Hadoop cluster for data storage. It links together the file systems on many local nodes to
make them into one big file system” (IBM 2014). In other words, it provides fast high
performance access to application data (Hadoop 2014). HDFS differs from other file
systems by storing metadata and application data separately (Shvachko et al. 2010, p.
1). Metadata, containing attributes such as access time, modification and permissions, is
stored in a node called a namenode or “master.” The content of the namenode is split
into large blocks that are independently replicated across nodes called datanodes or
“slaves” containing application data. The namenode actively monitors the numbers of
replicas and makes sure that information isn‟t lost due to a datanode failure. (Hashem et
al. 2015, p. 107).
MapReduce is “a system for easily writing applications which process vast amounts of
data (multi-terabyte datasets) in-parallel on large clusters (thousands of nodes) of com-
modity hardware in a reliable, fault-tolerant manner” (Hadoop 2014). In other words,
the main task of MapReduce is to take intensive data processes and spread the computa-
tional load across the Hadoop cluster (Lo 2014). The MapReduce functionality has been
credited for changing the game in supporting the enormous processing needs of Big
Data (ibid). MapReduce in actuality contains two separate and distinct procedures that
Hadoop performs, namely Map() and Reduce(). The Map() tasks allow different points

20
of the distributed cluster to distribute their work and Reduce() tasks are designed to re-
duce the final from of the cluster‟s results into one output (Janssen 2014). MapReduce
tasks are governed by the Hadoop framework that takes care of all the scheduling,
monitoring and machine failure related tasks (Hadoop 2014). The following have been
presented as advantages of using MapReduce functionality: simplicity, scalability,
speed, built-in recovery, minimal data motion, and freedom to focus on the business
logic (Lee et al. 2012, p. 13; Hortonworks 2014). However, based on the research of
Lee et al. (2012, p. 11), MapReduce has inherent limitations on its performance and
efficiency. Lee et al. argue that MapReduce is unlikely to substitute database manage-
ment systems for data warehousing, but it can complement the existing solutions with
scalable and flexible parallel processing.
A variety of related open source projects have emerged around Hadoop to support the
activities of systems management, analysis and query function (Devlin et al. 2012, p. 4).
Cloudera (Awadallah 2009), one of the leading Hadoop providers and supporters, de-
scribes the Hadoop ecosystem and the relations of the components as illustrated in fig-
ure 2.5. The ecosystem, in addition to the core components HDFS and MapReduce,
consists of the following:
Avro serializes data, conducts remote procedure calls, and passes data from one
program or language to another.
HBase is a columnar NoSQL store and a management system providing fast
read/ write access.
Hive is a data warehouse system built on top of HDFS that provides support for
SQL. Hive uses its own query language called HiveQL.
The Pig framework generates a high-level scripting language called Pig Latin
and operates a run-time platform that enables users to execute MapReduce on
Hadoop.
Sqoop is a tool designed for efficiently transferring bulk data between Hadoop
and structured data stores such as relational databases.
ZooKeeper maintains, configures, and names large amounts of data. It also pro-
vides distributed synchronization across a cluster.
(Khan et al. 2014, pp. 5-6)

21
ETL Tools BI Reporting RDBMS
Pig (Data Flow) Hive (SQL) Sqoop
HBase (Column DB)
MapReduce (Job Scheduling/Execution System)
HDFS(Hadoop Distributed File System)
Zoo
kee
per
(C
oo
rdin
atio
n)
Avr
o (
Seri
aliz
ati
on
)
The Hadoop Ecosystem
Figure 2.5. The Hadoop ecosystem (adapted from Awadallah 2009)
Hadoop has become synonymous with Big Data (Devlin et al. 2012, p. 4) and is the
commonly known Big Data technology (Alanko & Salo 2013, p. 7; McAfee &
Brynjolfsson 2012, p. 66). According to the Big Data survey of Russom (2011, p. 16),
Hadoop has a respectable presence in companies and is already in use by 24% of the
survey respondents. However, it is suspected that these are mostly experimental use
cases and thus it‟s difficult to say whether Hadoop usage will evolve into a permanent
presence in IT (ibid). In the Big Data study of Devlin et al. (2012, p. 38) Hadoop like
programmatic data environments existed in 22% of the organizations. Hadoop is widely
used in industrial applications including spam filtering, network searching, click-stream
analysis, and social recommendation (Khan et al. 2014, p. 6).
Despite the hype about Hadoop, relational systems are still the most popular Big Data
stores among organizations according to Devlin et al. (2012, p. 38). Hadoop and
MapReduce have their own limitations and according to Hashem et al. (2015, p. 112),
they lack query processing strategies, and have low-level infrastructures with respect to
data processing and management. Big Data environments in organizations are thus usu-
ally built on top of hybrid solutions that make use of both traditional SQL-based envi-
ronments and new Big Data technologies (Rastas & Asp 2014, p. 27; Russom 2014, p.
34). A Hadoop centric architecture is not likely to benefit an organization, since it re-
quires too much of calibration, integration with existing systems, and massive testing. A
more probable alternative is to use Hadoop as part of an existing architecture. (Alanko
& Salo 2013, p. 7.) This has been backed up by studies of Russom (2014). Russom‟s
findings indicate, that DW teams implement Hadoop solutions to improve their enter-
prise DW in data staging, data archiving, handling multi-structured data and flexible
processing.

22
2.2.3 Big Data in the cloud
Cloud computing is a successful paradigm of service oriented computing and has revo-
lutionized the way computing infrastructure is used today (Agrawal et al. 2011). The
National Institute of Standards and Technology NIST defines cloud computing as “a
model for enabling ubiquitous, convenient, on-demand network access to a shared pool
of configurable computing resources (e.g. networks, servers, storage, applications, and
services) that can be rapidly provisioned and released with minimal management effort
or service provider interaction” (Mell & Grance 2011, p. 2). In other words, cloud com-
puting allows organizations to access reliable software, hardware and infrastructure de-
livered over the Internet and remote data centers (Armbrust et al. 2010 in Hashem et al.
2015, p. 101). The cloud architecture can perform very large-scale data storing, pro-
cessing and analyzing tasks which have led to a wide adaptation in organizations (Huan
2013 in Hashem et al. 2015, p. 101).
Mell and Grance (2011, p. 2) suggest that the cloud model is composed of five essential
characteristics, three service models, and four deployment models. These are illustrated
in figure 2.6 below.
Cloud computing
Characteristics
Deployment models
Service models
On demand self-serviceBroad network access
Resource poolingRapid elasticity
Measured service Private cloudCommunity cloud
Public cloudHybrid Cloud
Software as a ServicePlatform as a Service
Infrastructure as a Service
Automation Standardization
Virtualization
Figure 2.6. The components of a cloud computing (adapted from Schouten 2014)
The essential characteristics of cloud computing can be described as the following:
On-demand self-service lets the consumer provision cloud resources whenever
they are required automatically without human-interaction to the service provid-
er.
Broad network access allows access to cloud resources from a wide range of
devices.

23
Resource pooling is used to describe a situation where computing resources are
pooled to serve multiple consumers using different physical and virtual re-
sources without any apparent changes to the end user.
Rapid elasticity is the ability to provide high scalable services
Measured service is the measurement and monitoring of resource usage to con-
trol and optimize resource distribution.
(Mell & Grance 2011, p. 2)
Organizations utilize the cloud technology “as a service” and can thereby focus on their
core business without worrying about setting up and maintaining the cloud components.
Mell and Grance (2011, p. 2) have found out three typical cloud service models:
Software as a Service or SaaS provides the consumer with applications that run
on cloud infrastructure. The applications can be accessed through thin clients
such as web browsers or a program interface. In SaaS, the consumer has no con-
trol over deployed infrastructure or the applications in the cloud.
Platform as a Service or PaaS provides the consumer a platform to deploy and
use consumer-created applications created using programming languages and
other supported tools. The consumer has control over deployed applications and
some hosting configuration settings but not over the underlying cloud infrastruc-
ture.
Infrastructure as a Service or IaaS provides virtualized hardware and compo-
nents so that the consumer can build his own IT platform including operating
systems and applications. The consumer has control of all the virtualized hard-
ware but not the underlying physical infrastructure.
(Mell & Grance 2011, p. 2)
Cloud services can be “deployed in different ways depending on the organizational
structure and the provisioning location” (Kandawal 2014). Mell and Grance (2011, p. 2)
categorize the deployment models into the four following:
Private cloud is cloud infrastructure deployed for exclusive use by a single or-
ganization that consists of multiple consumers or business users. The private
cloud can be owned and managed by the organization, a third party or a combi-
nation of the two. The private cloud can be located either on or off the organiza-
tion premises.
Community cloud is cloud infrastructure intended to be used by a community
of consumers from an organization that have shared concerns. The community
cloud can be owned and managed by one of the organization, a third party or a
combination of them. The community cloud can be located either on or off the
organization premises.

24
Public cloud is cloud infrastructure intended for open use by the general public.
The public cloud can be owned by a business, academic, or government organi-
zation, or a combination of them. The public cloud exists on the premises of the
provider.
Hybrid cloud is a composition of the infrastructures described in the deploy-
ment models above. The infrastructures are connected together by standardized
technology that enables data and application portability. However, the hybrid
cloud can still be viewed as a unique entity with high-end resource management.
(Mell & Grance 2011, p. 2)
Surveys of The Data Warehouse Institute have consistently shown that BI/DW profes-
sionals prefer private clouds over public ones. This is mostly due to paranoia over data
security and governance. It is also common to first experiment with analytic tools and
databases on a public cloud and to then transfer them to a private cloud. (Russom 2011,
p. 29.)
Cloud computing and Big Data are strongly connected. Cloud computing (eg. the Ha-
doop ecosystem) provides the underlying infrastructure that can serve as an effective
platform to address Big Data related issues (volume, velocity, variety) and perform Big
Data analytics in a timely manner. Big Data utilizes distributed storage technology
based on cloud computing rather than local storage. (Hashem et al. 2015, pp. 102-103.)
A good example of Big Data processing in a cloud environment is MapReduce.
MapReduce accelerates “the processing of large amounts of data in a cloud and thus is
the preferred computational model of cloud providers” (Dean & Ghemawat 2008 in
Hashem et al. 2015, p. 103). Big Data cloud providers include famous names like
Google, Microsoft, Amazon and Cloudera. According to Hashem et al. (2015, p. 109),
research on Big Data in the cloud still remains in early stages and the main challenges
of Big Data in cloud computing are related to scalability, availability, data integrity,
transformation, data quality, heterogeneity, privacy, legal issues and governance.
2.3 Capturing value from Big Data
Data has always had strategic value, but when working in the Big Data realm it has be-
come a new form of asset class offering complete new opportunities (Bilbao-Osorio et
al. 2014; Davenport 2014, p. 45). These opportunities can benefit not only the corporate
world but also the public sector (Beardsley et al. 2014, p. 73; Rastas & Asp 2014, p. 8),
and scientific disciplines including atmospheric science, astronomy, medicine, biology,
genomics and biogeochemistry (Khan et al. 2014, p. 5). However, organizations that
have already been dealing with large data sources will be early benefiters (Villars et al.
2011, p. 5).

25
According to the Big Data survey of Russom (2011, p. 12) the vast majority of business
organizations and its business users consider Big Data more of an opportunity than a
problem. Beyer et al. (2011 in Fox & Do 2013, p. 742) claim, that those organizations
that adopt Big Data initiatives into their information management strategies by 2015
will “begin to outperform their competitors within their industry sectors by 20 percent
in every available financial metric”. This is backed up by studies of McAfee and
Brynjolfsson (2012, p. 64) who state that “the more companies characterized themselves
as data-driven, the better they performed on objective measures of financial and opera-
tional results”. The study also found out that “data-driven organizations were, on aver-
age, 5% more productive and 6% more profitable than their competitors.” In a 2011
report the McKinsey Global Institute (Manyika et al. 2011, p. 2) suggests that Big Data
may lead to an increase in profit margins by as much as 60 percent in retail. Further-
more, the 2010 IBM Global CFO Study (Gartenberg 2011) showed that “companies that
excel at finance efficiency and have more mature business analytics and optimization
outperform their peers, with 49% higher revenue growth, 20 times more profit growth,
and 30% higher return on invested capital.”
In the light of this evidence it can be said without a doubt, that adopting Big Data into
ones business has positive implications. Forward-thinking leaders that implement a full
spectrum of Big Data capabilities will gain competitive advantage, while others will be
left behind. However, the different ways of capturing value from Big Data must be first
discovered and understood.
There are many ways that Big Data can be used to create value (Manyika et al. 2011, p.
2). Villars et al. (2011, p. 6) argue, that the ultimate value of Big Data implementations
will be judged based on one or more of three criteria, namely usefulness, fidelity and
timeliness, complementing the three Vs of Big Data (see chapter 2.1). Herodotou et al.
(2011, p. 261) continue by adding cost-effectiveness to these criteria. Furthermore, Cio-
bo et al. (2013) identify three profitable and sustainable growth areas, namely customer
intimacy, product innovation, and operations. However, this chapter utilizes the pro-
posal of Beardsley et al. (2014), where Big Data is generally acknowledged to create
value in four main ways. It creates data transparency through proper data manage-
ment, making high-quality data available in a timely manner. It helps organizations with
customer segmentation and creating new customer offerings by tailoring products and
services. It helps to improve the decision-making process for a variety of business users
through data-driven analytics. And it enables companies to innovate completely new
business models, areas, products and services. (Beardsley et al. 2014, p. 73.) These
value-creation ways will be discussed in more detail in the following sections.
2.3.1 Data transparency through proper data management
Rastas and Asp (2014, p. 9) present a value chain for utilizing data to its full potential.
The value of the data increases when moving through the stages of data generation, data

26
storing, data analysis, and data usage. The data value chain is similar to the data life
cycle, proposed by Khan et al. (2014, p. 8), where the stages consist of collecting, filter-
ing and classification, data analysis, storing, sharing and publishing, and data retrieval
and discovery. Both of the models present the main idea that through various stages,
raw data eventually transforms into valuable insight. The general value chain for data is
proposed by Gustafson and Fink (2013) and illustrated in figure 2.7. Big Data heavily
influences the data value chain and the data life cycle and makes significant improve-
ments to all the stages.
Data Generation Data RepositoryIntelligence
EngineData Usage
Data value chain stage
Figure 2.7. The data value chain (adapted from Gustafson & Fink 2013)
Data becomes valuable only after proper data management (Alanko & Salo 2013, p. 4).
Data management is “the development, execution and supervision of plans, policies,
programs and practices that control, protect, deliver and enhance the value of data and
information assets” (Mosley 2007, p. 4). The responsibility of data management within
an organization usually belongs to data management professionals and data stewards
(Mosley 2007, p. 4). Bain and Company (Wegner & Sinha 2013, p. 1) suggest that suc-
cessful data management is the right mix of four elements, namely data, people, tools,
and intent. Firstly, data should be of high quality, consistent, reliable, available and
easily accessible (Khan et al. 2014, p. 5). The concept is also known as data transparen-
cy. Manyika et al. (2011, p. 5) define data transparency as “making data easily accessi-
ble to relevant users in a timely manner.” Open transparent data in organizations enables
concurrent engineering, reduces time to market, and improves the quality of the product
or service (ibid). Secondly, data should be handled by data-driven people with expertise
in various areas. The data management team consists of data scientists, business ana-
lysts and technical specialists, which all play an important role in the data management
environment. Data scientists provide data insights with statistical methods and business
analysts turn these insights into relevant business information. The technical specialists
deploy and maintain the hardware and software solutions needed for processing all this
data. Thirdly, state-of-the-art data management tools, such as database administration
tools, should be used to help in this endeavor. And finally, organizations should be built
around data. The organizational intent should be data-driven with clearly defined data
management strategies. (Wegner & Sinha 2013, p. 1.)
The emergence of Big Data has lead organizations to extend their data management
skills by bringing together both old and new data management technologies and practic-

27
es, resulting in Big Data Management (BDM) (Russom 2013, p. 4). There are many
technological options for managing Big Data, including top trends Hadoop and NoSQL
(see chapter 2.2). BDM can meet the requirements of growing data volume, variety and
velocity, and enable advanced analytics and data discovery for generating valuable in-
sights (Russom 2013, p. 7). BDM must not only be conducted on a technology level, but
also on a business level so that it supports organizational business goals (Russom 2013,
p. 13). The overall goal for BDM is to maintain a large data store in its original form,
with little or no alteration (Russom 2013, p. 22). Russom (2013, p. 11) predicts that
BDM will grow into a majority practice within the next few years.
BDM includes a number of data disciplines. The DAMA institute (Mosley 2013) argues
that those areas include data architecture, data modeling, data storage, data security,
data integration, content management, reference and master data management, business
intelligence and data warehousing, meta-data management, and data quality. According
to Russom (2013, p. 137), data governance, Business Intelligence and Data Warehous-
ing management, and data quality management have the strongest involvement with
BDM.
The functional area binding all other data management areas together is data govern-
ance. Data governance embodies “the exercise of control and authority over data-related
rules of law, transparency, and accountabilities of individuals and information systems
to achieve business objectives” (Malik 2013 in Hashem et al. 2015, p. 112). In other
words, data governance ensures that the data is formally managed, and that data can be
trusted, through different policies relating to optimization, privacy, and monetization of
data (Soares 2012, p. 6). Managing Big Data requires a rigorous data governance struc-
ture (Gupta 2014, p. 88). Big Data governance covers IT as well as business functions at
an enterprise level and it is critical for obtaining maximum business benefit from the
collected data (Venkatasubramanian 2013, p. 2). Venkatasubramanian (2013, p. 4) iden-
tifies key areas that should be addressed in governing the Big Data environment:
1. Enterprise data assets: A complete documented directory of all data assets in
the enterprise.
2. Unambiguous owner: Ownership of a particular data asset.
3. Data characteristics: Assigning and defining data characteristics including ac-
curacy, accessibility, consistency, completeness and update.
4. Housekeeping: Storing, archiving and backing up data.
5. Preventing data leakage: Control mechanism to prevent data leakage.
6. Data handling procedures: Procedures for handling data by authorized users.
7. Audit procedure for data: Procedures to monitor and manage the ongoing data
governance process
(Venkatasubramanian 2013, p. 4)

28
Business Intelligence includes “the applications, infrastructure and tools, and best prac-
tices that enable access to and analysis of information to improve and optimize deci-
sions and performance” (Gartner 2014b), while data warehousing is "the process of tak-
ing data from legacy and transaction database systems and transforming it into orga-
nized information in a user-friendly format” and to encourage the BI related activities
(Kimball & Caserta 2004, p. 22). Therefore, Business Intelligence and Data Warehous-
ing (BI/DW) management can be defined as an activity to enable access to decision
support data for reporting and analysis. This includes all the planning, implementation
and control activities to store, protect and access data found within electronic files and
physical records. (Mosley 2013.) In today‟s BI/DW environment, architectural changes
are mostly made to provide a better platform for Big Data, advanced analytics and real-
time operations (Russom 2014, p. 8).
A quality perspective in data management is critical (Wang et al. 1995 p. 349). There
are many ways how the quality of data is defined. One is the definition of Eppler
(2014), who describes data quality as “the fitness for use of information.” In other
words, the higher the data quality, the better it meets the requirements of the user (ibid.).
Wang et al. (1995, p. 350) identify four main attributes for data quality, namely accessi-
bility, interpretability, usefulness, and credibility. Data quality management can thus be
defined as business processes that ensure these attributes during the stages of the data
value chain (data generation, storage, analysis and usage). Data quality management is
the basis of a working Big Data information system network and ensures the quality of
information for Big Data applications and analytics (Oracle 2009).
In data management, reacting quickly to occurring events is crucial, since data tends to
lose its value over time. Hackathorn (2004, p. 3) has proposed a value-time curve to
illustrate the decreasing value of data over time as it passes through stages of use (figure
2.8). The longer it takes for organizations to respond to a new business event, the less
value they can extract from it. In the era of Big Data, growing volume, velocity and
variety of data affects the value-time curve immensely as organizations have difficulties
to capture and analyze real-time data in a more complex environment.

29
Time
Val
ue
Business event
Data stored
Information delivered
Action taken
DECISION LATENCY
Process entry and exit
Process intermediate steps
Figure 2.8. The value-time curve for data (adapted from Hackathorn 2004, p. 3)
The value-time challenge can be overcome by implementing automation to organiza-
tional data management whenever possible. Due to the hectic Big Data environment,
humans can no longer compete against machines with real-time processing capabilities.
Automating data management tasks results in managing data more quickly and more
effectively, at the same time opening up human resources. Automation is especially
well suited to “the complexity of predicting and anticipating events.” (Quinn & Taylor
2014, p. 62-63.)
2.3.2 Customer segmentation and new offerings
Customer segmentation is the premise of every marketing organization. It gives com-
panies “an understanding of the most attractive segments, including their size, profita-
bility, and growth potential”, ultimately resulting in competitive advantage. However,
traditional methods are not efficient anymore to describe the modern customer and his
behavior in existing markets. (Million 2014.) Fortunately, the explosion of Big Data and
its technological advances aid in today‟s segmentation endeavor and open up complete
new approaches. According to Biehn (2013), the contribution of executives, sales man-
agers, marketers and pricings experts is needed to determine what insights are valuable
and of benefit to the company. Million (2014) talks about Segmentation 2.0, a new way
to gain insight from Big Data by dividing customers into small micro-segments. Big
Data assisted micro-segmentation utilizes statistical data analysis and methods to group
customers into similar buckets (Biehn 2013), and allows for organizations to identify
certain customer characteristics, such as attitude and behavior (Million 2014). This ena-
bles better targeting of content, offerings, products and services, all through finer pro-
motion and advertising (Manyika et al. 2011, p. 6; Delgado 2014; Million 2014). Tar-
geted campaigns effectively serve the needs of individuals and eliminate the need to
come up with a general advertising slogan. Analyzing the purchase behavior, organiza-

30
tions can determine which customer segments are likely to buy a product, either at
launch or at a specific seasonal time. (Delgado 2014.)
Today‟s customer is more and more connected via online and social-media. Million
(2014) identifies three new types of Big Data sources, including activity-based data,
social networking profile data, and social influence data. Activity-based data is infor-
mation such as web site tracking information, purchase histories and mobile data. Social
networking profile data include the customer‟s work history and group membership,
while social influence data includes all the social media likes, follows, comments, and
reviews. When the sources for micro-segmentation are identified, the real value can be
extracted through leveraging these sources. (Million 2014.) Information gathered
through social media can be used to identify potential new customers or help maintain
the loyalty of existing customers. For example, transactional data can be correlated with
social media data, resulting in possibilities of special promotions towards individual
consumers (Datameer 2014). Million (2014) describes real-world cases of successful
Big Data assisted segmentation across many industries, including telecom, retail, manu-
facturing, healthcare and finance. Customer segmentation is closely guided by Big Data
analytics, which is discussed next.
2.3.3 Improved decision making with data-driven analytics
The primary purpose of traditional small data analytics is to support internal business
decisions. Analytics have since evolved into executive support, online analytical pro-
cessing, Business Intelligence and now into Big Data analytics. (Davenport 2014, pp.
45-46.) Big Data analytics are the act of translating data into intelligence and business
advantage, and differ from traditional analytics by focusing on the analysis of high data
volume, data velocity and data variety (McAfee & Brynjolfsson 2012, p. 62). Big Data
analytics can thus reveal new insights previously hidden due to the restrictions of tradi-
tional data systems (Goss & Veeramuthu 2013, p. 222). Russom (2011) favors the term
“discovery analytics”, since the business user ultimately tries to discover new business
facts previously unknown to the organization, and calls it “the primary path” to gain
business value (Russom 2011, p. 5; Russom 2013, p. 7). Furthermore, Big Data analyt-
ics can be seen as a driver of process and performance improvement (IBM 2013, p. 3).
Big Data analytics improve and support the decision making process of an organization
(Manyika et al. 2011, p. 6; McAfee & Brynjolfsson 2012, p. 66; Alanko & Salo 2013;
Khan et al. 2014, p. 5) and enables managers to decide on the basis of evidence rather
than intuition (McAfee & Brynjolfsson 2012, p. 63). Data-driven decision making can
be thus seen as the usage of scenarios and simulations that provide “immediate guidance
on the best actions to take when disruptions occur” (LaValle et al. 2011, p. 22). Sup-
ported decision making is rather augmented than fully automated, still requiring impact
from the business user (Manyika et al. 2011, p. 5).

31
According to Fan and Liu (2013 in Khan et al. 2014, p. 10), analyzing data with Big
Data analytics has two main objectives: to understand the relationships among features,
and to develop methods of data mining that can predict future observations. Data min-
ing has been widely accepted as means of extracting potentially valuable information
from large, incomplete, fuzzy and noisy datasets (ibid). Data mining uses methods of
association rule learning, cluster analysis, classification and regression (Manyika et al.
2011, p. 28). The general rule is that “the larger the data sample, the more accurate are
the statistics and other products of the analysis” (Russom 2011, p. 9). Techniques for
analyzing large datasets, in addition to data mining, include data visualization, statistical
analysis, and machine learning (Manyika et al 2011, p. 28). Data visualization attempts
to present the information in such a way that target users can consume it effectively and
understandably. Visualizing data will become increasingly valuable through transform-
ing data into information that can be used immediately, versus having to rely on further
time consuming interpretation (LaValle et al. 2011, p. 23).
There are generally three models of Big Data analytics, namely descriptive, predictive
and prescriptive (figure 2.9). The purpose of descriptive analytics is to “look at past
performance and understand that performance by mining historical data to look for the
reasons behind past success or failure” (Oracle 2012). It is the simplest and most popu-
lar class of analytics, and it simply summarizes “what” has happened (Bertolucci 2013).
Descriptive analytics are limited in their predictive abilities, resulting in the develop-
ment of more predictive models (Oracle 2012). Predictive analytics “utilize a variety
of statistical, modeling, data mining, and machine learning techniques to study recent
and historical data, thereby allowing analyst to make predictions about the future” (Ber-
tolucci 2013). It is important to understand, that predictive analytics only forecast what
might happen, since future events are always uncertain. The most advanced model of
analytics is prescriptive analytics that combines the previous two models, taking ad-
vantage of the data of descriptive models and the hypotheses of predictive models (Ora-
cle 2012). According to Cutts (2014), prescriptive analytics involve “not only predicting
the probability of future outcomes, but also automatically taking action based upon pre-
dicted outcomes.” This information helps decision makers see the possible consequenc-
es of those decisions available, and taking the right course of action (Bertolucci 2013).

32
Descriptive Modeling
Predictive Modeling
Prescriptive Modeling
Figure 2.9. Three models of Big Data analytics (adapted from Oracle 2012)
According to the study of Russom (2011), three key benefits in using Big Data analytics
could be identified. Firstly, business users felt that Big Data analytics could massively
improve anything involving customer interaction. This includes better-targeted social-
influencer marketing, customer-base segmentation, recognition of sales and market op-
portunities, and analysis of customer behavior. Secondly, Big Data supports the organi-
zations‟ Business Intelligence functions. Big Data and Business Intelligence together
create business insights, drive appropriate business changes, improve planning, report-
ing and forecasting processes, and identify the root cause of cost. Finally, Big Data im-
proves other analytical areas such as fraud detection, risk management and market
trends. (Russom 2011, pp. 10-11.)
2.3.4 New innovative business models, products and services
According to Hartmann et al. (2014, p. 5), Big Data provides value creation opportuni-
ties in two key ways: by providing information for innovating new business models,
products and services, and by improving and optimizing current business practices.
Both value creation ways are linked closely to the term data-drivenness, meaning that
the practice relies on data as a key resource (Hartmann et al. 2014, p. 6). Andrade et al.
(2014, p. 85) talk about data-driven innovation, which improves business efficiency and
creates new revenue opportunities by linking together product innovation and exploiting
new data sources. One form of data-driven innovation is data-driven business develop-
ment (Devlin et al. 2012, p. 5). The Danish Business Association (IRIS Group 2014, p.
5) defines data-driven business model development as a platform, compelled by data,
for “how to market the enterprise, how to carry out product development or how to best
service customers.” Hartmann et al. (2014, p. 6) argue that data-driven business devel-
opment is not only limited to companies conducting analytics, but also includes compa-
nies that focus on the collection and processing of data.

33
One vital driver for data-driven business development is development of new business
models, also seen as the highest level of organizational maturity. The development of
business models includes both the optimization of existing models and creation of com-
pletely new models (Manyika et al. 2011, p. 5; Andrade et al. 2014, p. 81; IRIS Group
2014, p. 8). There are many ways Big Data can be used to create data-centric business
models, one of them being the sale of data to other organizations (Ciobo et al. 2013;
Hartman et al. 2014, p. 5). The data can be either internal data from existing or self-
generated data sources, or external data that is publicly available or customer provided.
A new service model Data-as-a-service has been proposed to “aggregate and provide
access to a wide range of public and private data by partnering with data providers, ag-
gregators, and clients” (Hartmann et al. 2014 p. 5). However, a company may sell not
just the data, but also new products and services that rely on that data. A second emerg-
ing business model Analytics-as-a-service utilizes Big Data and provides “business in-
telligence reporting, text analytics, and advanced analytics such as predictive modeling,
all made in composable forms to allow for direct consumption, integration and customi-
zation” (ibid). New data-centric business models improve competitiveness by increasing
sales and profitability, operational efficiency, and risk management procedures (Rad-
cliffe 2014, p. 5). A data-driven business model may even establish a completely new
enterprise, providing job opportunities for data scientists and technical specialists.
Big Data is also used for incremental improvement and optimization of organizational
business practices and services. Business improvement can happen through process op-
timization, customer relationship management, process innovation, and collaboration of
employees. (Hartmann et al. 2014, p. 6.) Improving business practices and generating
new business models is facilitated by the trends of Big Data. Big Data has greatly af-
fected the Internet‟s evolution and has created the “Internet of Things”, a network of
physical objects that can communicate internally or with the external environment
(Gartner 2014c), and also influenced by the increasing migration of many social activi-
ties on the web (Andrade et al. 2014, p. 81). Social media information can be thus used
rapidly for developing better products and services by eg. analyzing the customer feed-
back data (IRIS Group 2014, p. 10). Data obtained from the use of actual products is
helpful for developing the next generation of products simultaneously creating innova-
tive service offerings (Manyika et al. 2011, p. 6). Identifying dissatisfied customers and
improving the quality of product and service ultimately affects the overall customer
satisfaction (Davenport 2014, p. 47).

34
2.4 Challenges of implementing Big Data initiatives
In contrast to Big Data opportunities, a great number of challenges can be identified
when implementing Big Data initiatives within an organization. Barriers to Big Data
adoption are generally managerial and cultural rather than technological (LaValle et al.
2011, p. 21; Villars et al. 2011, p. 7; McAfee & Brynjolfsson 2012, p. 68). Based on
relevant literature, key areas where Big Data adoption faces major challenges have been
identified. These include the lack of both business and technical professionals, and data
privacy and security concerns.
Big Data applications create pressure for organizations to understand the new technolo-
gies. A significant constraint on creating value from Big Data will thus be the shortage
of talent and the lack of Big Data professionals (Russom 2011, p. 12; Alanko & Salo
2013, p. 9; Andrade et al. 2014, p. 85; Gupta 2014, p. 88). New Big Data technologies
do require a skillset that IT departments do not necessarily possess, which makes inte-
grating all the relevant internal and external sources of data a challenge. (McAfee &
Brynjolfsson 2012, p. 66.) Manyika et al. (2011, p. 10) argue that organizations need
people with deep expertise in statistics and machine learning, and managers and ana-
lysts who can utilize Big Data with a highly analytical approach. However, this type of
talent is hard to produce, taking years of training. According to the study of Russom
(2013, p. 10), a total of 40 percent of the respondents find that their organization is hav-
ing insufficient staffing and data management skills. Another critical aspect of Big Data
is how decisions are made and who gets to make them. An issue arises with the lack of
executive level talent, meaning that organizational leaders do not understand or know
how to make the right decisions and how to unlock the value in Big Data (Manyika et
al. 2011, p. 12). Gupta (2014, p. 89) argues, that it is virtually impossible to deliver val-
ue from Big Data if business leaders do not have a data-driven mindset. There are a
number of genuinely data-driven senior executives, but McAfee and Brynjolfsson
(2012, pp. 65-66) believe that these people generally rely too much on experience and
intuition and not enough on data. Russom (2013, p. 10) identifies a major problem with
Big Data Management through the lack of proper governance, stewardship and business
sponsorship.
A big barrier for freely implementing Big Data initiatives are the juristic issues and re-
strictions related to collecting data (Alanko & Salo 2013, p. 10). Wu et al. (2014 in Wil-
liams et al. 2014, p. 314) argue extensive data collection being intrusive and revealing
information without the consent of the creator. Pospiech and Felden (2012 in Williams
et al. 2014, p. 314) continue, that Big Data technologies allow for new ways of collect-
ing and aggregating data from a number of different sources, which creates additional
insights possibly revealing confidential information. This all raises ethical concerns
around confidentiality and ultimately around personal privacy (Manyika et al. 2011, p.
11). Debates and regulations in the form of data collection laws have since emerged
(Alanko & Salo 2013, p. 10; Williams et al. 2014, p. 314). Different countries have dif-

35
ferent laws and regulations to achieve data privacy and protection, and in most countries
monitoring of user communication is not allowed (Hashem et al. 2015, p. 111). Contra-
ry to the rest of the world, there is a strong disagreement between the European Union
legislators on data collection laws in the EU. This is a key reason for the dominance of
US and Indian vendors on the Big Data market. (Alanko & Salo 2013, p. 10.) The intru-
sion of privacy through applications of Big Data has been recently witnessed worldwide
in the case of the infamous NSA surveillance controversy. Another related concern is
data security. Data breaches can expose not only personal and corporate information but
also national security secrets. Big Data software does not have its own safeguards that
would protect the data from inappropriate access. Organizations thus have to ensure that
data security practices and policies apply also in the context of Big Data. (Villars et al.
2011, p. 13.)

36
3. MATURITY MODELING
As organizations feel pressure to gain competitive advantage, retaining their market
position, identifying ways of cutting costs, improving quality, reducing time to market,
and inventing or reinventing new products and services becomes increasingly important
(De Bruin et al. 2005, p. 1; Mettler 2009, p. 1). Maturity models have been developed to
assist organizations in this endeavor. In short, maturity models allow an organization to
have its methods and processes assessed according to management best practice, often
against a clear set of external benchmarks (APGM 2014). The overall adoption of ma-
turity models is expected to increase, a prediction supported by a number of maturity
models proposed by academics, software companies and consultancies (Pöppelbuß &
Röglinger 2011, p. 2). Recent literature also suggests an increasing academic interest in
maturity models (Mettler 2009; Becker et al. 2010).
In chapter 3.1, the typology, concepts and characteristics behind maturity models are
defined. This chapter also describes the different domains maturity models can be uti-
lized in. Chapter 3.2 goes through the history of maturity models and introduces the
forerunner models that are well-known as of today. Chapter 3.3 describes how Big Data
is connected to the concept of maturity and examines the state of Big Data maturity
models. Lastly, the strengths of maturity models as well as the criticism behind them are
discussed in chapter 3.4. Maturity model development and the decisions to be made
within the development framework are discussed more specifically in chapter 4.
3.1 The concept of maturity and maturity models
In general, “maturity” can be defined as “the state of being complete, perfect or ready”
(Simpson & Weiner 1989) or literally as “ripeness” (Fraser et al. 2002, p. 245). Maturi-
ty thus implies “an evolutionary progress in the demonstration of a specific ability or in
the accomplishment of a target from an initial to a desired or normally occurring end
stage” (Mettler et al. 2010, p. 334). An evolutionary progress implies that the subject
may pass through a number of states on the way to maturity. The bottom state stands for
an initial state i.e. an organization having little capabilities in a specific domain, while
the highest stage represents a conception of total maturity. (Becker et al. 2009, p. 213.)
Maturity is normally measured as capabilities or “abilities to fulfill specified tasks and
goals” (Wendler 2012, p. 1318).
Independent from specific domains, maturity models refer to “manifold classes of enti-
ties” (Pöppelbuß & Röglinger 2011, p. 3). Mettler (2009, p. 4) argues, that maturation is
reflected in a one-dimensional manner and that maturing subjects can be divided into

37
three key groups: 1) process maturity i.e. to which extend a specific process is explicit-
ly defined, managed, measured, controlled, and effective (Fraser & Vaishnavi 1997 in
Mettler 2009, p. 4); 2) object maturity i.e. to which extend a particular object reaches a
predefined level of sophistication (Gericke et al. 2006 in Mettler 2009, p. 4); and 3)
people capability i.e. to which extend the workforce is able to enable knowledge crea-
tion and enhance proficiency (Nonaka 1994 in Mettler 2009, p. 4). Kohlegger et al.
(2009, p. 56) use a similar categorization system for maturing entities, and make a dis-
tinction between person, object, and social system maturity. Mettler (2009, pp. 5-6) in
his research raises questions about the artefact type maturity is associated with, or
whether maturity is associated with models, methods or theories. His conclusion is, that
maturity artefacts position themselves in-between models and methods, addressing both
the identification of problems as well as guidelines on how to solve these problems
(ibid).
A maturity model conceptually represents “phases of increasing quantitative or qualita-
tive capability changes of a maturing element in order to assess its advances with re-
spect to defined focus areas” (Kohlegger et al. 2009, p. 59). In other words, maturity
models are an instrument to rate organizational capabilities of maturing elements, and to
select appropriate actions to take the elements to a higher level of maturity (De Bruin et
al. 2005; Becker et al. 2009; Kohlegger et al. 2009; Mettler 2009). “The fundamental
underlying assumption of maturity models is that a higher level of maturity will result in
higher performance” (Boughzala & de Vreede 2012, p. 307), as well as improved pre-
dictability, control and effectiveness (Vezzetti et al. 2014, p. 900).
The purpose of maturity models is highly versatile, but typically the purpose of use can
be divided into three groups: descriptive, prescriptive and comparative. According to
Kohlegger et al. (2009, p. 59), descriptive models explain changes observed in reality,
and prescriptive (or normative) models guide committed individuals into making those
changes. Finally, maturity models can serve a comparative purpose as means of bench-
marking (Röglinger et al. 2012, p. 330). Benchmarking can compare an actual situation
with industry-specific best practices in order to support management decisions for con-
tinual improvement (Hamel et al. 2013, p. 1411). Hain and Back (2011, p. 1) argue that
maturity models essentially are used as a representation of the as-is situation, recom-
mendation for action, and an instrument for controlling. They also raise awareness of
the analysis aspect and serve as a reference frame for improvements, ensuring a certain
quality and avoiding errors (Wendler 2012, p. 1318). Furthermore, Pfeffer and Sutton
(1999 in Mettler 2009, p. 1) identify maturity models to be helpful to close a so-called
“knowing-doing gap” within an organization. Maturity assessment in organizations can
be either done through external audit or individual self-assessment (Mettler et al. 2010,
p. 333). Fraser et al. (2002, p. 247) argue that the latter should be approached as a team
exercise involving people from different functional groups, to ultimately eliminate sin-
gle-respondent bias.

38
It is observed, that all maturity models share the common property of defining specific
elements. These basic elements of maturity models are a number of levels, a descriptor
for each level, a generic description or summary of the characteristics of each level as a
whole, a number of dimensions, a number of elements or activities for each dimension,
and a description of each element or activity as it might be performed at each level of
maturity. (Fraser et al. 2002, p. 246.) However, certain distinctions can be made be-
tween maturity models based on different factors. One factor is that maturity models can
be constructed in either a top-down or bottom-up approach. With a top-down approach
definitions are written first and then the assessment items are developed to fit the defini-
tions. With a bottom-up approach the assessment items are developed first and then def-
initions are written to reflect the developed items. (De Bruin et al. 2005, p. 5). Further-
more, Fraser et al. (2002, p. 246) distinguish maturity models by categorizing them ac-
cording to their composition and structure type:
1. Maturity grids typically contain “text descriptions for each activity at each ma-
turity level and are of moderate complexity, requiring at most a few pages of
text.”
2. Likert-like questionnaires can be considered to be a simple form of maturity
models. The questions are simply statements of well-known practices, which or-
ganizations use to score their relative performance on a scale from 1 to n. (Hy-
brid models combine the questionnaire approach with more detailed definitions
of maturity.)
3. CMM like models have a more formal and complex approach, where a number
of key practices and goals are specified to reach an acceptable level of sophisti-
cation.
(Fraser et al. 2002, p. 246)
Maturity models have proliferated across multiple domains (De Bruin et al 2005, p. 2).
The most heavily dominated maturity model application fields are information systems
and software development (Wendler 2012, p. 1317; Vezzetti et al. 2014, p. 900). Fraser
et al. (2002, p. 244) have identified maturity models being proposed to other areas such
as quality management, supplier relationships, R&D effectiveness, product develop-
ment, innovation, product design, collaboration and product reliability. Pöppelbuß and
Röglinger (2011, p. 2) go further by identifying practical business areas such as digital
government, IT management and governance, knowledge management, and business
process management. However, until today, the development and application of maturi-
ty models has spread out to nearly any conceivable domain (Vezzetti et al. 2014, p.
900).

39
3.2 Forerunners of maturity models
Since the 1970s, a multitude of different maturity models have been developed in sci-
ence and practice. More than hundreds of maturity models have been published in the
field of information systems alone (Becker et al. 2009, p. 213). In this domain, the evo-
lutionary model of Nolan is often quoted as the origin of the maturity perspective (Vez-
zetti et al. 2014, p. 900). Nolan, in his original model, suggested that organizational
growth of IT evolved through four stages, namely initiation, contagion, control and in-
tegration (Nolan 1973). Simultaneously, Crosby developed and proposed a model of
organizational behavior by describing it at five stages of maturity for each of six aspects
of quality management (Crosby 1979). Crosby‟s Quality Management Maturity Grid
(QMMG) also had a strong evolutionary theme, suggesting that organizational quality
management excellence evolves through five phases, namely uncertainty, awakening,
enlightenment, wisdom and certainty. Nolan‟s and Crosby‟s hypotheses stimulated re-
search in the maturity model domain and led to the development of numerous maturity
models based on a sequence of stages or levels (Fraser et al. 2002, p. 244; Röglinger et
al. 2012, p. 330).
The popularity of maturity models was especially strengthened by the introduction of
the Capability Maturity Model (CMM) for software development (Mettler 2009, p. 3).
Developed by the Carnegie Mellon Software Engineering Institute (SEI), it is the most
well-known maturity model being accepted as the de facto standard by the software
industry (De Bruin et al. 2005, p. 1; Ahmed & Caprez 2010, p. 544). According to
Paulk et al. (1993, p. 53), the CMM provides “a conceptual structure for improving the
management and development of software products in a disciplined and consistent
way.” The CMM offers guidelines for organizations to determine their current process
maturity and develop a strategy for improving software quality and processes (Ahmed
& Caprez 2010, p. 544). The CMM proposes a five stage evolutionary path and defines
five different levels of process maturity, illustrated in figure 3.1.

40
Initial(1)
Repeatable(2)
Defined(3)
Managed (4)
Optimizing(5)
Disciplined process
Standard, consistent process
Predictable process
Continuously improving process
Figure 3.1. The five levels of the Capability Maturity Model (adapted from Paulk et al.
1993, p. 8)
The whole CMM framework ultimately consists of the four different aspects described
in detail in Paulk et al. (1993) and summarized below:
Maturity Levels are well-defined evolutionary entities toward achieving a ma-
ture software process. Each maturity level indicates a level of process capability.
The CMM consists of five maturity levels, namely Initial, Repeatable, Defined,
Managed and Optimizing
Key Process Areas (KPAs) indicate the areas an organization should focus on
to improve its software process and to achieve process capability goals. There
are a number of KPAs located at each maturity level, and 18 in total.
Common Features are attributes and practices that indicate whether the imple-
mentation and institutionalization of a KPA is effective, repeatable, and lasting.
The five common features are commitment to perform, ability to perform, activi-
ties performed, measurement and analysis, and verifying implementation.
Key Practices describe the infrastructure and activities that contribute most to
the effective implementation and institutionalization of the key process area.
(Paulk et al. 1993, pp. 30-41)
A number of studies regarding CMM have shown links between maturity and quality in
the software domain (Fraser et al. 2002, pp. 247-248). According to Kaur (2014, p. 47),
implementing CMM into the software development process helps forging a shared vi-
sion and providing consistency for the software product. However, CMM has also been
criticized on its overemphasis on the process perspective and its disregard on people‟s

41
capabilities (Bach 1994 in Mettler 2009, p. 2). Concerns were also raised due the strong
formalization of improvement activities accompanied by extensive bureaucracy that
hinder people from being innovative (Herbsleb & Goldenson 1996 in Mettler 2009, p.
2). Furthermore, Smith and Fingar (2004 in Rosemann & De Bruin 2005, p. 3) argue
that CMM-based maturity models cannot capture the need for business process innova-
tion.
3.3 Big Data maturity models
Big Data maturity can be defined as “the evolution of an organization to integrate, man-
age, and leverage all relevant internal and external data sources” (Halper & Krishnan
2013, p. 5). Bilbao-Osorio et al. (2014) describe Big Data maturity as an approach for
organizational progress assessment and to identification of relevant initiatives. It in-
volves building an ecosystem that includes technologies, data management, analytics,
governance, and organizational components (Halper & Krishnan 2013, p. 5).
Maturity models can be used as an artefact to measure Big Data maturity. According to
Halper and Krishnan (2013, pp. 5-6), a maturity model for Big Data helps creating
structure around a Big Data program and determine where to start. It is a great tool for
organizations to define goals around the program and communicate their Big Data vi-
sion across the entire organization. Big Data maturity models also provide a methodolo-
gy to measure and monitor the state of the program, the effort needed to complete the
current maturity stage, and the steps to advance to the next stage. Furthermore, Big Data
maturity models measure and manage the speed of both the progress and adoption of
Big Data programs within organizations. (ibid.)
The goal of a Big Data maturity model is to provide a capability assessment tool that
focuses on specific Big Data key areas in organizations, to help guide development
milestones, and to avoid pitfalls. Krishnan (2014) suggests, that the previously men-
tioned key areas are the subcomponents of the “people, processes, technology” –
triangle, namely alignment, architecture, data, data governance, delivery, development,
measurement, program governance, scope, skills, sponsorship, statistical model, tech-
nology, value, and visualization. According to El-Darwiche et al. (2014, p. 45) the Big
Data maturity stages depict the various ways in which data can be used within an organ-
ization. Radcliffe (2014, p. 6) argues that Big Data maturity models are the key tools for
setting the direction and monitoring the health of the organizations Big Data program.
An underlying assumption is that a high Big Data maturity level correlates to the in-
crease of top-line revenues and reduction of operational expenses. However, reaching
the highest level of Big Data maturity often involves major investments over many
years. (El-Darwiche et al. 2014, p. 45.)

42
3.4 Strengths and criticism of using maturity models in organ-
izations
Current literature identifies several key strengths connected to maturity models. Devel-
opment of new maturity models will not stop in the future, due to them helping manag-
ers to “balance divergent objectives with regard to obtaining and retaining competitive
advantage, assembling new products and services, reducing costs and time to market,
and enhancing quality” (Mettler et al. 2010, p. 334). The team of De Bruin et al. (2005,
p. 1) argue that maturity models assist organizations in gaining and retaining competi-
tive advantage by identifying ways of cost reduction, quality improvement, and time-to-
market reduction. Becker et al. (2009, p. 221) continue, that maturity models are a ma-
jor importance especially for IT management, who regulate the organizational IT per-
formance and economic efficiency. In addition to IT management, maturity models are
also valuable in the domain of digital government and knowledge management (Pöp-
pelbuß & Röglinger 2011, p. 2). Boughzala and de Vreede (2012, p. 307) identify key
areas in which maturity models exceed, mostly regarding the application of the model.
Maturity models are simple to use, they can be applied from many perspectives, they
help in team building activities, and they can be used either as self-assessment or
through a third party auditor (ibid).
However, maturity models have also been the target of criticism. Mettler (2009, p. 3)
points out the most important point of critique, namely the poor theoretical foundations
and the lack of documentation. As argued by De Bruin et al. (2005, p. 3), there is little
documentation on how to develop maturity models that are theoretically sound, rigor-
ously tested and widely accepted. Many authors of maturity models simply build on
their predecessors without much thinking about the appropriateness of their design deci-
sions (Kohlegger et al. 2009, p. 51). Whilst built on good practices, the maturity models
do not necessarily guarantee that an organization will achieve success (Mettler 2009, p.
3). Furthermore, maturity models often lack in documentation regarding their develop-
ment process (Becker et al. 2009, p. 216), resulting in low reliability. A rising number
of maturity models implicate problems with respect to the irretrievability. “As no classi-
fication for precisely allocating different kinds of maturity models exist, the search for
and the selection of specific models is time consuming and exhausting” (Mettler et al.
2010, p. 334). Furthermore, Mettler (2009, p. 3) suggests that many maturity models do
not describe how to carry out improvement actions, and act only as descriptive ways to
assess the current situation.

43
4. SYSTEMATIC LITERATURE REVIEW OF MA-
TURITY MODEL DEVELOPMENT AND CLAS-
SIFICATION
A systematic literature review or a systematic review is “an exhaustive summary of the
high-quality literature on a particular topic” (King‟s College 2014, p. 3). Combing re-
sults of several studies gives more reliability and precision than one study alone (CRD
2009). Crowther et al. (2014, p. 3140) point out that systematic reviews are highly ob-
jective and transparent, and aim “to reduce bias with the use of explicit methods to per-
form a comprehensive literature search and critical appraisal of the individual studies.”
The search process should be as transparent as possible and documented in a way that
enables it to be evaluated and reproduced (CRD 2009, p. 16). Furthermore, systematic
reviews attempt to identify if certain subtypes of evidence are absent from the literature
(Salminen 2011, p. 9; Crowther et al. 2014, p. 3140).
Chapter 4.1 introduces Fink‟s (2005) model for conducting a systematic literature re-
view. Fink proposes a seven phase model, which starts off by data collection and ends
in the synthesis of results. The data collection process is introduced in chapter 4.2 and
includes phases of selecting the appropriate databases, choosing the right search strate-
gy, and establishing practical and methodological inclusion and exclusion criteria. The
selected academic papers are then introduced in chapter 4.3. The final phase of Fink‟s
model is to synthesize the results, which is done after careful analysis in chapter 4.4.
The synthesis yields results in the form of a generic maturity model development
framework and a maturity model classification system framework.
4.1 Fink’s systematic literature review model
Literature review models provide guidelines and help the researcher selecting the right
keywords for searching the information. The guidelines also help with limiting the in-
formation pool and analyzing the data with high quality. This research utilizes the sys-
tematic literature review model proposed by Fink (2005, p. 4), where the research pro-
cess is divided into seven tasks (figure 4.1).

44
1. Select Research Questions
2. Select Bibliographic Databases and Web Sites
3. Choose Search Terms
4. Apply Practical Screen
Content covered; years searched; language; setting,
sample, interventions, and outcomes studied;
research design
5. Apply Methodological Quality Screen
Research design; sampling; data collection;
interventions; data analysis; results; conclusions
6. Do the Review and Monitor Quality
Ensure reliability and accuracy of review
7. Synthesize the Results
Report on current knowledge; justify the need for
research; explain research findings; describe quality
of research
Figure 4.1. Fink’s model for conducting a systematic literature review (adapted from
Fink 2005, p. 4)
First, a set of research questions must be selected. In phase two the appropriate biblio-
graphic databases and websites are selected. In phase three the search terms or phrases
that are used to query the databases are selected. The next phases four and five concern
filtering the results and applying both practical and methodological screening criteria.
This helps in including only the relevant data and excluding all other unnecessary data.
Finally in phases six and seven the actual review is conducted and the results are syn-
thesized. (Fink 2005, pp. 3-4.)

45
4.2 Collection of data
The premise of a systematic literature review is to form research questions based on a
research problem. The research questions guide the researcher in selecting the appropri-
ate sources for data collection and constructing the right search terms that query these
data sources. The objective of this systematic literature review is to find best practices
and decisions of scoping, designing, developing, evaluating and classifying maturity
models. Therefore, the research questions formed in chapter 1.2 can be utilized:
What are the best practices for generic development and classification of maturi-
ty models?
In this study, the development process is defined as “the process of creating something
over a period of time” and the classification process as “the systematic arrangement in
groups or categories according to established criteria” (Merriam-Webster.com 2015).
Furthermore, systematic reviews in general are performed at a single specific point in
time to avoid becoming outdated. The date at which the systematic review was per-
formed has to be documented precisely allowing future researchers to update the review
by repeating the search from that time point. (Bown & Sutton 2010, p. 671.) The fol-
lowing data was collected between the time period of December 10th
2014 and Decem-
ber 11th
2014.
4.2.1 Bibliographic databases and search strategy
Conducting a thorough search is a key factor in minimizing bias in the review process.
Thorough searching is best achieved by using a variety of search methods (electronic
and manual) and by searching multiple, possibly overlapping resources. (CRD 2009, pp.
16-22.) An electronic or bibliographic database is a collection of articles, books and
reports that can provide data to answer research questions. They are usually accessed
via an online connection and provide full copies of the original research, from a range of
different countries and years. (Fink 2005 p. 5.) The papers found in bibliographic data-
bases have been through some sort of screening and quality control, which increases the
reliability and validity of the information sources (Warwick 2014). According to
Crowther et al. (2014, p. 3142) it is recommended additionally to manually search the
reference lists of found studies as a final check that no relevant studies have been
missed. Manual searching or “hand searching” is an important way to identify publica-
tions that have not yet been included and indexed by bibliographic databases (CRD
2009. p. 18).
According to the Centre of Reviews and Dissemination (CRD 2009, p. 17) there can be
no agreed standard for what constitutes an acceptable search in terms of the number of
databases. However, it is important to take into consideration that one search portal may
only search a subset of a particular database and for the most comprehensive searches

46
multiple portals in addition to multiple databases should be used (Bown & Sutton 2010,
p. 671). The types of bibliographic databases are usually selected according to the topic
of the review. In the context of this research, maturity modeling is seen to fit the subject
areas of engineering, computer science and business management, thus resulting in the
selection of interdisciplinary databases where these domains are present.
In this research, peer-reviewed articles found in bibliographic databases are selected as
the main source of information. At first, seven databases were selected based on a popu-
larity-of-use list made by the Tampere University of Technology (TUT 2014). These
subscription based databases were Scopus, Web of Science, IEEE Xplore, Spring-
erLink, ScienceDirect, EBSCO and ACM Digital Library. It was discovered, that Sco-
pus and ScienceDirect are both owned by the company Elsevier (Elsevier 2014). To
reduce biased redundant data, ScienceDirect was dropped from the list. Another deci-
sion was made to also discard “Web of Science” due to the very low availability of its
content. In addition, Google Scholar was added to the list due to the demand for a man-
ual ad-hoc search, being described later on in this chapter. The final list of the six se-
lected bibliographic databases can be found in table 4.1.
Table 4.1. The list of the selected bibliographic databases
Name Description
Scopus With 55 million records, Scopus is the largest abstract and citation database of peer-
reviewed literature: scientific journals, books and conference proceedings. Delivering a
comprehensive overview of the world's research output in the fields of science, tech-
nology, medicine, social sciences, and arts and humanities, Scopus features smart tools
to track, analyze and visualize research. (Elsevier 2014.)
IEEE Xplore The IEEE Xplore digital library is a powerful resource for discovery and access to scien-
tific and technical content published by the IEEE (Institute of Electrical and Electronics
Engineers) and its publishing partners. IEEE Xplore provides Web access to more than 3-
million full-text documents from some of the world's most highly cited publications in
electrical engineering, computer science and electronics. (IEEE 2014.)
SpringerLink SpringerLink provides researchers with access to millions of scientific documents from
journals, books, series, protocols and reference works (Springer 2014).
EBSCO EBSCO Information Services provides a complete and optimized research solution com-
prised of research databases, e-books and e-journals—all combined with the most
powerful discovery service and management resources to support the information and
collection development needs of libraries and other institutions and to maximize the
search experience for researchers and other end users. (EBSCO 2014.)

47
ACM Digital
Library
ACM hosts the computing industry's leading Digital Library, and serves its global mem-
bers and the computing profession with journals and magazines, conferences, work-
shops, electronic forums, and Learning Center. (ACM 2014).
Scholar
Google Scholar provides a simple way to broadly search for scholarly literature. From
one place, you can search across many disciplines and sources: articles, theses, books,
abstracts and court opinions, from academic publishers, professional societies, online
repositories, universities and other web sites. (Google 2014.)
After establishing the bibliographic databases, the search strategy must be defined.
Search strategies are “explicitly designed to be highly sensitive so that as many poten-
tially relevant studies as possible are retrieved” (CRD 2009, p. 19). Search terms are the
keywords and phrases that you use to get relevant journal articles, books and reports.
They are based on the words and concepts that frame the research question. (Fink 2005,
p. 5.)
In this research, the search words seek to answer the research question previously men-
tioned in chapter 4.2 by taking into account all the synonyms connected with the con-
cept of maturity modeling. The advanced search functionalities of the databases (e.g.
Boolean operators „AND‟, „OR‟ and „NOT‟) were utilized to construct a query that
would cover a large sample of maturity modeling literature. After careful examination,
the following search string was created and used to query the bibliographic databases:
(“maturity modeling” OR “maturity modelling” OR “maturity model design” OR “maturity model development” OR “maturity model evaluation” OR “maturity model framework”)
Depending on the database, this query had to be modified so that it matched the syntax
of the search platform. If possible, the selected terms were searched against full-text
documents and the metadata. The advanced search capabilities of the SpringerLink en-
gine did not fully support multiple Boolean operators and this resulted in over 30000
results returned. However, adjustments to the screening criteria reduced this data dra-
matically.
It was observed, that some authors appeared frequently in the reference list of the arti-
cles acquired through the systematic literature review. The mostly cited authors, when
discussing the design and development of maturity models, were Becker, De Bruin,
Kohlegger and Mettler. An ad-hoc search was carried out in Google Scholar combining
the term “maturity model” and the name of the authors resulting in the following query:
("maturity model" AND ("becker" OR "de bruin" OR "kohlegger" OR "mettler"))

48
This resulted in the addition of 2200 unique papers, later to be investigated in the
screening process.
4.2.2 Practical and methodological inclusion and exclusion
criteria
Literature searching may result in a large number of records, but only a few of them are
relevant. There is a need for a screening process to identify the articles that are mean-
ingful to one‟s research. Screening is done by defining inclusion and exclusion criteria
whilst collecting the data. (Fink 2005, pp. 54-55.) A strict screening process is one
characteristic of systematic reviews that distinguishes it from other literature review
models (Salminen 2011, p. 11). It is important to find the right balance between includ-
ing and excluding the research material. Too narrowly defined criteria grow the risk of
missing potentially relevant studies and reducing the generalizability of the research.
Conversely, if criteria are too strictly defined there will not be enough data to allow
meaningful combination of results. (CRD 2009, p. 10; Bown & Sutton 2010, p. 671.)
Fink proposes a two phase screening process to sort out the relevant and strong studies
from the others, namely practical screening and methodological screening. Using both
screens ensures the systematic review‟s efficiency, relevance, and accuracy. The practi-
cal screen is used to identify a broad range of articles that cover the topic of interest, are
in a language you read, are in a publication you respect, and can be obtained in a timely
manner. The methodological screen is for quality, and helps you narrow your search by
identifying the best available studies. Methodological quality of a study refers to how
well it has been designed and implemented, and how rigorously it uses justified research
standards. (Fink 2005, pp. 55-59.)
In this research, the advanced filtering and sorting options of the bibliographic data-
bases helped the practical screening process. Practical screening was done by reducing
the results based on language, publication date, citations and availability. Filtering
based on the title and abstract was made by skimming through the articles. This nar-
rowed the selection down significantly. The inclusion and exclusion criteria for all data-
bases are listed below:
Inclusion criteria
o Language: English
o Publication date: Last 10 years (2004-2014)
o Title: Combinations of the words “maturity” and “model”
o Abstract: A mention of designing, developing or evaluating maturity
models.
Exclusion criteria
o Cited: 0 times
o Availability: Full-text not available

49
Most bibliographic databases were able to apply the inclusion and exclusion criteria so
that the results were limited effectively. However, it was observed that SpringerLink
still returned too many results (n=20200). To analyze the results in a timely manner, a
criterion was added to only include articles from the subject areas of business manage-
ment, computer science and engineering. This resulting in a much better selection
(n=217).
Methodological screening produced the following inclusion and exclusion criteria:
Inclusion criteria:
o The paper clearly answers the research question and presents a unique
approach for generic maturity model development or classification
Exclusion criteria:
o The content from the same author(s) is overlapping
o The paper does not follow scientific research standards
During the methodological screening process, the papers were classified in three differ-
ent types:
Relevant papers fully satisfy the methodological screening criteria
Secondary papers are related to maturity model development, but clearly use
another methodology as its primary source
Excluded papers are not relevant to the concept of maturity model development
or classification
It was agreed upon, that only the relevant papers were to pass the methodological
screening process. The secondary papers contained various guidelines, models and
methods that mostly referenced and repeated the existing development procedures. Ex-
cluded papers were not included due to them being out of the research area.
Table 4.2. Results of the systematical literature review searching and screening process
Database Keyword search Practical screening Methodological screening
Scopus 145 7 1
IEEE Xplore 85 4 0
SpringerLink 32553 5 1
EBSCO 36 2 0
ACM DL 238 2 0
Google Scholar 2200 7 5
Other N/A N/A 1
Total 35257 27 8

50
After keyword searching the databases and applying the practical screening criteria, 27
unique papers remained. After applying methodological screening criteria and removing
the papers that are overlapping or out of the area, 7 papers remained. Afterwards, the
references of the most relevant papers were manually checked, and as a result, another 1
paper was added, bringing the total to 8. The evolution of the screening process can be
seen in table 4.2.
4.3 Description of data
The systematic literature review resulted in the final selection of eight research papers.
These papers were selected based on the strict screening criteria defined in the previous
chapter. Basic information about the authors, title, year, publication and summary of the
content of the papers are listed in appendix A.
In the following sections of this chapter, a brief introduction to all the development and
classification proposals are presented, ordered by the publication date of the paper. The
two papers of Mettler (Mettler 2009; Mettler et al. 2010) are presented as together. Af-
ter establishing a basic overview of all the methodologies, they are analyzed and synthe-
sized in the chapter 4.4.
4.3.1 De Bruin et al. proposal
The group of De Bruin et al. (2005) proposes a generic maturity model development
methodology consisting of six phases which have to be followed in order, as illustrated
in figure 4.2. These phases are iterative in nature, helping to make adjustments through-
out the whole development process. Each phase presents a major decision to be ad-
dressed in that phase, usually in the form of different criteria or characteristics. (De Bru-
in et al. 2005, p. 3.)
Scope Design Populate Test Deploy Maintain
Figure 4.2. The phases of maturity model development (adapted from De Bruin et al.
2005)
Before moving to phase one, De Bruin et al. (2005) talk about the defining purpose of
the model. Purpose refers to whether the model is descriptive, prescriptive or compara-
tive in nature. Highly descriptive models tell you what the state of maturity is, but do
not provide information to improve it. Prescriptive models on the other hand indicate
how to approach improvement, and how to achieve better business performance and
value. Comparative models extend these two by further providing benchmarking possi-
bilities across a number of industries or regions. It is argued, that these three models
represent evolutionary phases of a model‟s lifecycle, suggesting that a comparative ma-

51
turity model is the most advanced and complete. Thus it can be concluded, that compar-
ative models are best for capturing domain and industry specific issues. (De Bruin et al.
2005, p. 3.)
In the first phase the scope of the desired model is defined. This is done by determining
the focus of the model and which stakeholders will assist in the development process.
Focus of the model refers to whether the model is intended for a specific domain, or for
general use. Focusing the model within a domain, rather than on general usage, will
determine specificity and extensibility of the model. Scoping greatly influences all the
remaining phases. (De Bruin et al. 2005, p. 4.) Phase two consists of defining the de-
sign of the model. This is done by defining the needs of the intended audience and how
these needs will be met. The target audience can be either internal or external, consist-
ing of either executives and managers, or external auditors and partners. The needs of
these groups vary, since the model can be applied from one to multiple entities/regions.
A maturity model should have the right balance of simplicity and complexity, only then
providing sufficient information to the audience. One should also consider how the
stages of the model should be designed. This is done either by a top-down or bottom-up
approach and selecting if the model should be built based on a maturity gird, Like-scale
questionnaire or CMM-like model. Furthermore, the naming and labeling of the stages
should be clear and consistent. (De Bruin et al. 2005, pp. 5-6.)
After establishing the scoping and design principles, the model is populated. This is
done by identifying a number of domain components and their sub-components that are
mutually exclusive and collectively exhaustive. Domain components can be found by
examining domain specific critical success factors and barriers through exploratory data
collection methods such as the Delphi method, Nominal Group technique, case studies
and focus groups. Using standard methods that ultimately complement each other is the
key in identifying the relevant content of the constructed model. (De Bruin et al. 2005,
pp. 6-8.) Once the model is filled with content, the model components must be tested
for validity, reliability, and generalizability. The group of De Bruin et al. proposes a
testing protocol that tests both the construct of the model and the model instruments.
Several testing methods can be used here, including case studies, surveys or interviews.
(De Bruin et al. 2005, p. 9.)
The final phases of the models are deployment and maintenance. Deployment ensures
that the model is made available for verification. A critical criterion for a verified model
is the generalizability of the model, and only then it can be accepted for wider use. Fi-
nally, the model‟s growth and use has to be maintained. Evolution of the model occurs
as the domain knowledge and understanding deepens, resulting in the need for constant-
ly evaluating and enhancing the model components. (De Bruin et al. 2005, pp. 9-10)
In conclusion, the paper argues for the importance of developing maturity models using
a standardized generic methodology, since it achieves great value through high general-

52
izability (De Bruin et al. 2005, p. 10). The De Bruin et al. proposal is the oldest one
among the reviewed papers, meaning that there is little or no bias in the results. Howev-
er, the development framework is limited in that it is only practically tested with models
within two domains, namely business process management and knowledge manage-
ment.
4.3.2 Becker et al. proposal
Becker et al. (2009) propose generic procedures for developing and evaluating maturity
models based on design science research. The paper builds the foundation of its meth-
odology on the guidelines of the design science approach of Hevner et al. (2004), which
are transformed into eight design requirements. These requirements are then compared
to the design processes of six existing maturity models. The results of this research ul-
timately provided the elements for constructing the eight procedures of the procedure
model for developing maturity models, simplified in figure 4.3.

53
Initiation
active
Problem definition
Comparison of
existing maturity
models
Determination of
development
strategy
Iterative maturity
model
development
Result
reactive
Not approved
Approved
Conception of
transfer and
evaluation
Implementation of
transfer media
Evaluation
Continuation
No, discard model
Rejection of
maturity model
Yes, re-evaluation
Yes, new version
Select design level
Select approach
Design model
section
Test result
Figure 4.3. Procedure model for developing maturity models (adapted from Becker et
al. 2009, p. 218)
The eight phases of the procedure model are as follows: 1) Problem definition: deter-
mine the target domain and target group; 2) Comparison of existing maturity models:
compare existing models as a basis for incentive and inspiration; 3) Determination of
development strategy: choose between a completely new model design, enhancement
of an existing model or combination of the design of several models; 4) Iterative ma-
turity model development: select design level, select approach, design model section
and test results; 5) Conception of transfer and evaluation: determine the different
forms of result transfer for both academic and user communities; 6) Implementation of
transfer media: make the maturity model accessible through transfer media such as
self-assessment questionnaires; 7) Evaluation: evaluate the maturity model by compar-

54
ing defined goals to real-life observations; 8) Rejection of the model (optional): rejec-
tion of the designed model if results are truly negative. Becker et al. argue the phases
four and seven, namely iterative maturity model development and evaluation, are cen-
tric phases of the model, putting emphasis on the iterative nature of a development pro-
cess. The outcome of these phases may result in reiteration of the whole design process,
and modification of certain entities. Also, due to nature of business domains constantly
changing and evolving, old maturity models become obsolete and there is a need for
validation through regular evaluations. (Becker et al. 2009, pp. 217-219.)
Becker et al. (2009) identified a major problem with the lack of documentation provided
by maturity model designers, yielding very little information about the model‟s devel-
opment process. Thus, the main purpose of this paper was to build a sound framework
for designers to develop well-founded maturity models. However, the procedure model
was strictly developed based on the approach of Hevner et al. (2004), and it is possible
that excluding other approaches may leave important success criteria unnoticed. (Becker
et al. 2009, p. 221.)
4.3.3 Kohlegger et al. proposal
Kohlegger et al. (2009) propose a model for the creation or re-creation of a maturity
model based on a structured content analysis of 16 existing models. The model consists
of a set of maturity assessment questions that help the developer to develop new or re-
vise existing maturity models in the domains of business information systems and com-
puter science, and especially in knowledge management. Furthermore, it gives an over-
view of the different conceptions of maturing and fundamental principles of maturity
models. Kohlegger et al. test the model‟s applicability by providing a case example with
the knowledge maturity model. (Kohlegger et al. 2009, p. 51.)
First, a total of 76 maturity models for the structured content analysis were identified
based on an exhaustive internet search. This number was then reduced by dividing them
into three categories, namely persons, objects and social systems, and including only the
five most cited models for each category. Additionally, one model was added subse-
quently, bringing the final number to 16. The models were then analyzed and distinct
model characteristics were extracted to form the maturity assessment questions.
(Kohlegger et al. 2009, pp. 53-55.)
The results of the study are presented in the form of questions that are divided into three
main categories: defining questions, design questions and usage questions. These
questions try to identify certain attributes attached to the target model. The final ques-
tionnaire and possible answers are summarized in table 4.3. Two of the assessment
questions were not formally addressed in the study, leaving out details about the classi-
fication of the question-specific attributes, and thus are marked not applicable.

55
Table 4.3. The maturity assessment questionnaire (adapted from Kohlegger et al. 2009,
pp. 56-57)
Category Question Possible answers
Defining
questions
How do elements change in time? Change in number
Change in nature
What does maturing mean? Change in quality
Change in capability
Change in risk
Other change
What is the direction of change? Increasing change
Decreasing change
What is the maturing subject? Person: competence
Object: document, infrastructure, product,
service
Social system: group, team, community,
process, routine, structure
Design ques-
tions
Has the model a conceptual mother
model?
No mother model
CMM
SPICE
Other model
What is the model used for? N/A
Who uses the model? Internal assessment team
External assessment team
Model is not used practically
Does the model complement other
models?
No model is complemented
CMM
How is model designed? Iterative
Cyclical
How do the stages build on each oth-
er?
Upper level comprises lower level
Upper level is new concept
How does the subject process from
one level to the next?
Defined goals have to be fulfilled
Matures implicit
What is the number of stages? Metric value (0-n)
Is there a “not existing” -stage? There is a “not existing” -stage
There isn’t a “not existing” -stage
What do the level descriptions in-
clude?
Trigger descriptions
Activity descriptions (tasks, processes)
Conceptual level description
What is the degree of detail of the
trigger description?
One trigger per stage
Many triggers per stage
No triggers per stage
Is level-skipping allowed? Explicitly allowed
Not recommended
Are there parallel maturing processes
possible for one unit?
Parallel maturing possible
Parallel maturing not possible
What is the number of goal levels? Metric value (0-n)

56
What is the method of goal bench-
marking?
Metric based
Non-metric based
Where do assessment data come
from?
Interviews
Documents
Questionnaire
Data
Usage ques-
tions
What is the model used as? Conceptual model
Applied model
Is tool support available? Supported by assessment model
Supported by software tool
Not supported by tool
What is the model description based
on?
N/A
Is certification available? Certification is available
Certification is not available
The questionnaire proposed by Kohlegger et al. is very useful for both developing ma-
turity models and classifying the models on several different attributes and characteris-
tics. The questionnaire also acts as a complete benchmarking tool for selecting and
comparing maturity models based on the similarities or differences between them.
However, this model favors maturity models that assess maturity in the domains of
knowledge, knowledge-intensive processes and knowledge infrastructure, reducing in
the applicability in more practical domains. Also, the paper analyzes and investigates
existing maturity models on their textual descriptions, not relying on empirical evidence
such as testing the model in a practical environment, resulting in the lack of reliability.
(Kohlegger et al. 2010, pp. 59-60.)
4.3.4 Mettler et al. proposal
This chapter describes the content of Mettler‟s research in his two research papers (Met-
tler 2009; Mettler et al. 2010), the first focusing on the development of maturity models
and the latter on constructing a classification system around these models. Mettler, in
his first paper (Mettler 2009), proposes a phase model for both development and appli-
cation of maturity models. The model differentiates between two perspectives, namely
the developer‟s and user‟s perspective, which closely interact with each other. Both of
these perspectives consist of four phases tied with specific decision parameters and
characteristics. The decision parameters can be investigated in more detail in Mettler
(2009, pp. 8-10). The phases of maturity model development and application are illus-
trated in figure 4.4 below.

57
identify need or new opportunity
define scope
design model
evaluate design
reflect evolution
prepare deployment select
model
take corrective
actionsapply model
maturity model development
maturity model application
identify need
Figure 4.4. Phases of maturity model development and application (adapted from Met-
tler 2009, p. 8)
From the developer’s perspective, developing maturity models consist of: 1) Define
scope: determine the focus/breadth, level of analysis/depth, novelty, audience and dis-
semination; 2) Design model: determine maturity definition, goal function, design pro-
cess, design product, application method and respondents; 3) Evaluate design: deter-
mine subject of evaluation, time-frame and evaluation method; 4) Reflect evolution:
determine the subject of change, frequency and structure of change. (Mettler 2009, p. 8.)
From the user’s perspective, applying maturity models consist of: 1) Select model:
selection of model based on origin, reliability, practicality, accessibility, design mutabil-
ity and application method; 2) Prepare deployment: decide on driver/responsibility,
realization, application area, respondents and training; 3) Apply model: decide over
execution and frequency of application; 4) Take corrective actions: decide on target
setting, implementation and implementer. (Mettler 2009, p. 10.) Mettler emphasizes that
the order of the phases is of great importance. Mettler also argues that understanding the
definition of maturity model is crucial for developing a working maturity model.
With his model, Mettler (2009) tries to improve the development process of maturity
models to better address information systems related issues by differentiating his model
into a development and implementation perspective, whilst underlining the importance
of iterativeness throughout the whole process. Mettler‟s findings also indicate, that de-
velopers lack knowledge on how to design theoretically sound and acceptable models,
and that the maturity model development methodology should be standardized. Howev-
er, the model has its limitations. Mettler bases his research on guidelines on design re-
search of Hevner et al. (2004) and the methodology of De Bruin et al. (2005), which
already address the issues of standardizing the development methodology, following in
slightly biased results (Mettler 2009, p. 11.)
Mettler in his second paper (Mettler et al. 2010) addresses issues with respect to retriev-
ability and reusability of maturity models. It can take a lot of time to find, select and

58
implement the most appropriate maturity model for your purpose, if the function and
purpose of the model is not presented in a systematical manner. Mettler et al. thus pro-
pose a classification system for maturity models in the domain of information systems.
The classification system uses a characteristic-based approach and is divided into three
dimensional perspectives, namely general model attributes, maturity model design at-
tributes, and maturity model use attributes (see table 4.4)
Table 4.4. Classification system of maturity models (adapted from Mettler et al. 2010,
p. 336)
Dimension: Attribute: Values:
General model attributes Name Name of model
Acronym Acronym of name
Primary source Primary source
Secondary source Secondary source
Addressed topic Name of domain
Origin Academic
Practice
Audience Management-oriented
Technology-focused
No clear distinctions
Year of publication Year of publication
Access Freely available
Pay a fee
Maturity model design attributes Concept of maturity Process maturity
Object maturity
People capability
Composition Maturity grids
Likert-like questionnaires
CMM-like models
Reliability Verified model
Validated model
Mutability Form of model
Functioning of model
Maturity model use attributes Method of application Self-assessment
Third-party assisted assessment
Certified practitioners
Support of application No supporting materials
Textual description or handbook
Software assessment tool
Practicality of evidence Implicit improvement activities
Explicit recommendations
The general model attributes are used to describe the origin and basic characteristics
of a maturity model. This provides an overview of the model, helping developers and
business users to identify such attributes as the target domain, target audience and pri-

59
mary publication source. These attributes are easy to define and usually present in all
published maturity model. The more difficult attributes to define are attributes related to
the development and use of the model, which are closely connected to Mettler‟s (2009)
maturity model development framework. Maturity model design attributes describe
the focus and structure of the model by defining the concept of maturity, composition,
reliability and mutability. The concept of maturity tells the user if the model focuses on
either process maturity, object maturity or people capability. This influences the compo-
sition of the model, whether the model is structured as a maturity grid, Likert-like ques-
tionnaire or CMM-like model. Through defining the reliability, it can be determined
whether the model is verified or validated. The difference between these two are, that
verified models only represent the conceptions of the developer while validated models
represent a more accurate real world usage perspective. Lastly, mutability communi-
cates the level of modification requirements to form and functioning, due to the con-
stantly changing environment and emergence of new technologies and practices. Final-
ly, maturity model use attributes describe the method of application, support of appli-
cation, and practicality of evidence. The method of application tells the user how the
model is intended to be used, whether it is self-assessment, third-party assisted assess-
ment or certified practitioners. The support of applications describes how the model is
documented and how well it gives assistance to conduct the assessment. Practicality of
evidence is the last attribute, distinguishing between implicit improvement activities and
explicit recommendations. (Mettler et al 2010, pp. 337-339.)
All these attributes were based on a detailed analysis of 117 existing maturity models.
Mettler argues, that the main problem in developing a classification system lies in limit-
ing the scope for attribute selection. There should be as few attributes as possible while
at the same time diversely explaining all the important factors needed for addressing
domain specific maturity issues. However, this representation may not be the most ac-
curate presentation since maturity model classification is never unambiguous. Mettler
concludes his paper by stating that the most value is gained by integrating the classifica-
tion system into the maturity model development framework. (Mettler et al. 2010, p.
339.)
4.3.5 van Steenbergen et al. proposal
The group of van Steenbergen et al. (2010) proposes a generic methodology for devel-
oping maturity models, using a design science research approach. This model makes a
distinction between fixed-level and focus area maturity models, and focus on the latter
one. A fixed-level maturity model has a fixed number of maturity levels each associated
with a number of processes that have to be implemented. It is argued, that fixed-level
models are not well suited for incremental improvement within an organization, since
they cannot identify the interdependencies between the maturity processes. This has
resulted in the demand for focus area models. A focus area maturity model achieves

60
maturity in a functional domain by addressing issues in specific focus areas eg. devel-
opment of a process or training of a competence. Each focus area can be divided into a
number of capabilities and attributes that are dependent on the selected functional do-
main. (van Steenbergen et al. 2010.)
The paper identifies four common phases for developing maturity models: 1) Scope:
identify and scope the functional domain by deciding what to include and exclude; 2)
Design model: determine focus areas, capabilities and dependencies with the help of
critical success factors 3): Develop instrument: develop assessment instrument such as
questionnaires and define improvement actions; 4) Implement and exploit: implement
maturity model, evaluate iteratively and communicate results. (van Steenbergen et al.
2010, pp. 10-14.)
The approach of van Steenbergen et al. (2010) is derived from existing approaches of
De Bruin et al. (2005), Mettler (2009) and Becker et al. (2009), using a lot of the exist-
ing methodology for classification and evaluation of maturity models. However, this
model extends the current methodology by identifying best practices to develop focus
area specific maturity models. Focus area models create value by supporting organiza-
tions in incrementally improving their practices and capabilities. (van Steenbergen et al.
2010, p. 15.)
4.3.6 Lahrmann et al. proposal
Lahrmann et al. (2011) propose a methodology for developing maturity models by iden-
tifying five main development phases: 1) Identify need or new opportunity: identify a
business need using creativity techniques, focus groups, case studies, literature reviews
or surveys; 2) Define scope: Scope the domain by establishing inclusion and exclusion
criteria using informed arguments or scenarios; 3) Design model: construct the model
using either a top-down approach using Delphi methods, case studies or literature re-
views, or bottom-up approach using algorithmic analysis, informed arguments or ontol-
ogies; 4) Evaluate design: evaluate the model on utility, validity, reliability and gener-
alizability, using functional testing, structural testing, surveys, focus groups or inter-
views; 5) Reflect evolution: maintain and further develop the model based on the
emergence of new practices and technologies, using field studies or interviews. (Lahr-
mann et al. 2011, p. 179.)
The generic phases, proposed by Larhmann et al. (2011), are influenced by the existing
methodologies, but a major advancement is presented for the design phase, namely ap-
plying quantitative methods such as the Rasch algorithm and cluster analysis to help
constructing the model. The main idea of the Rasch algorithm is to analyze the trade-off
between the ability of a respondent and the difficulty of a defined item. In the case of
maturity models, the ability of a responded corresponds to the ability of the organization
based on an assessment questionnaire, and the difficulty of an item to a specific maturi-

61
ty characteristics. Applying the Rasch algorithm in the design phase works well, since
the ability of the organization and the difficulty of a maturity item fit the basis consider-
ation of maturity models. The Lahrmann et al. approach is effective for building a ma-
turity model that address both the current state as well as the corresponding target state.
However, it is limited to mature domains only since there is always a need for a rela-
tively large sample for identifying items and maturity levels. (Lahrmann et al. 2011, pp.
182-188.)
4.3.7 Pöppelbuß and Röglinger proposal
Pöppelbuß and Röglinger (2011) propose a framework for general design principles for
maturity models. Here, design principles are defined as entities that give insight into the
principles of form and function that maturity models should meet. The design principles
were identified based on an extensive literature review of maturity models. (Pöppelbuß
& Röglinger 2011, p. 1.) The framework can be seen in table 4.5 below.
Table 4.5. A framework of general design principles for maturity models (adapted from
Pöppelbuß & Röglinger 2011, p. 6)
GROUP DESIGN PRINCIPLES
(1) BASIC 1.1 Basic information
a) Application domain and prerequisites for applicability
b) Purpose of use
c) Target group
e) Differentiation from related maturity models
f) Design process and extent of empirical validation
1.2 Definition of central constructs related to maturity and maturation
a) Maturity and dimensions of maturity
b) Maturity levels and maturation paths
c) Available levels of granularity of maturation
d) Underpinning theoretical foundations with respect to evolution and change
1.3 Definition of central constructs related to the application domain
1.4 Target group-oriented documentation
(2) DESCRIPTIVE
2.1 Intersubjectively verifiable criteria for each maturity level and level of granu-larity
2.2 Target group-oriented assessment methodology
a) Procedure model
b) Advice on the assessment of criteria
c) Advice on the adaption and configuration of criteria
d) Expert knowledge from previous application
(3) PRESCRIPTIVE
3.1 Improvement measures for each maturity level and level of granularity
3.2 Decision calculus for selecting improvement measures
a) Explication of relevant objectives
b) Explication of relevant factors of influence
c) Distinction between an external reporting and an internal improvement perspective

62
3.3 Target group-oriented decision methodology
a) Procedure model
b) Advice of the assessment of variables
c) Advice on the concretization and adaption of the improvement measures
d) Advice on the adaption and configuration of the decision calculus
e) Expert knowledge from previous application
The design principles are categorized intro three main groups. From the latter two,
groups are chosen accordingly to the maturity model‟s purpose of use. Basic design
principles provide information about the basics of the model, the central constructs of
the model both related to maturity/maturation and application domain, and how the
model is documented for its target group. Design principles for descriptive purpose of
use define the assessment criteria for each maturity level and level of granularity, as
well the assessment methodology of the model. Design principles for prescriptive
purpose of use define generic improvement measures for each maturity level and level
of granularity, and basic selection guidelines of improvement measures and target group
oriented decision methodology. (Pöppelbuß & Röglinger 2011, pp. 5-8.)
The paper found out that the purpose of use in investigated maturity models was poorly
documented and that the design principles for prescriptive maturity models were hardly
addressed at all. The descriptive design principles, however, were covered well in gen-
eral. The paper also has its limitations. The presented design principles are based on
literature from other authors, making the content biased with respect to maturity model
development. Furthermore, the framework could be tested with only a few maturity
models in a restricted domain. (Pöppelbuß & Röglinger 2011, p. 10.)
4.4 Analysis and synthesis of data
According to the reviewed literature, the development of maturity models, and especial-
ly the generic development phases and steps, falls in most cases within the guidelines of
design science research (DSR) and accordingly to the approach of Hevner et al. (2004).
Hevner et al. provide seven guidelines for the development of an artefact, either a con-
struct, a model, a method, or an instantiation, that helps solving defined organizational
problems. The guidelines are very helpful in guiding the researcher through the whole
development process from start (problem identification) to finish (communication of
results). Becker et al. (2009) use the DSR approach of Hevner et al. as the basis for their
argument and translate the guidelines into a consideration of requirements, later on used
in developing the steps of the procedure model. Hevner et al. is heavily referenced in
papers of Mettler (2009), van Steenbergen et al. (2010), Lahrmann et al. (2011), and
Pöppelbuß and Röglinger (2011). Additionally to Hevner et al., the DSR approach of
Peffers et al. (2008) is referenced by van Steenbergen et al. (2010) and Lahrmann et al.
(2011).

63
Saturation of content was detected when moving chronologically through the papers. To
eliminate the bias, or the tendency of treating a specific approach more superior to oth-
ers (Thomas & Segal 2006, p. 399), it must first be investigated what the papers are
cross-referencing. During the investigation a link was detected between several German
speaking researchers. Pöppelbuß can be found as the co-author in the proposal of Beck-
er et al., and Mettler in the proposal of Lahrmann et al. Furthermore, Becker has been in
the same research team as De Bruin et al. co-author Rosemann. The first proposal in
chronological order is from De Bruin et al. (2005), who propose a development frame-
work based on their empirical research with the help of two universities. This empirical
research, including consolidation of different methodologies, makes the proposal origi-
nal and unbiased. Becker et al. (2009) address the paper of De Bruin et al. by analyzing
their BPMM model, a by-product of the maturity model development framework.
Kohlegger et al. (2009) approach the construction of a development methodology by
examining 16 different maturity models with as structured content analysis, referencing
neither De Bruin et al. nor Becker et al. Mettler (2009) in his paper tries to further en-
hance the ideas of De Bruin et al. by introducing decision parameters for development
from the perspectives of the developer and user. The research approach of van Steen-
bergen et al. (2010) stems from the formulated ideas by De Bruin et al., Becker et al.
and Mettler. Lahrmann et al. (2011) build their methodological foundations on the ideas
of De Bruin et al., Becker et al., Mettler and van Steenbergen et al. Lastly, Pöppelbuß
and Röglinger (2011) extend the proposals of De Bruin et al., Becker et al., Mettler and
Kohlegger et al. by formulating their ideas into model design principles.
4.4.1 Lack of standardized maturity model development meth-
odology and dissatisfactory documentation of develop-
ment procedures
The systematic literature review yielded two key problematic findings: the lack of
standardized maturity model development methodology, and the dissatisfactory docu-
mentation of the development process of existing maturity models. Whilst there are nu-
merous available maturity models, there is little documentation on how to develop a
maturity model that is theoretically sound, rigorously tested and widely accepted (De
Bruin et al. 2005, p. 2; Kohlegger et al. 2009, p. 51; Mettler 2009, p. 1). It is important
to develop maturity models using a consistent generic methodology, since value can be
then achieved through the high generalizability and standardization of the model (De
Bruin et al. 2005, p. 10). Standardization transforms the model into a form of high
quality (Ahlemann 2007 in Pöppelbuß & Röglinger 2011, p. 4).
The second key finding in the literature review was that existing maturity models lacked
proper documentation of the development process (Becker et al. 2009, p. 216). Docu-
mentation of the research process is of vital importance for the scientific procedure, and
all the design processes of the maturity model should be “documented in detail, consid-

64
ering each step of the process, the parties involved, the applied methods, and the re-
sults” (Becker et al. 2009, pp. 214-216; Pöppelbuß & Röglinger 2011, p. 3). Only ma-
turity models with detailed documentation available can be effectively compared (Beck-
er et al. 2009, p. 216). Pöppelbuß and Röglinger (2011 p. 7) in their proposal state, that
the maturity model should always provide documented guidance and advice for the ma-
turity assessment process. This can be done by “elaborating on the assessment steps,
their interplay, and how to elicit the criteria‟s values” (Maier et al. 2009 in Pöppelbuß &
Röglinger 2011 p. 7). These problems are answered in the next section by introducing a
generic maturity model development framework consisting of four main phases and
several sub-phases, and a classification system framework of decisions to be made with-
in the development process.
4.4.2 Generic maturity model development framework and
classification system framework
The reviewed literature suggests that maturity model development can be divided into
several phases. Most of the authors, including De Bruin et al., Mettler, van Steenbergen
et al. and Lahrmann et al., present their models on a more generic level, while Becker et
al. drill down into a more detailed level and include sub-phases. The synthesis favors
the Becker et al. approach and illustrates maturity model development as generic main
phases containing several sub-phases. Furthermore, variation in the ordering of the sub-
phases was detected. The team of De Bruin et al. (2005, p. 3) and Mettler (2009, p. 8)
put emphasis on the importance of the main phase order, since previous decisions affect
greatly the following phases. However, there is an understanding that most sub-phase
activities within a main phase can be conducted concurrently and independently (Met-
tler 2009, p. 8), rendering this issue insignificant. All sub-phases contain decisions,
which depict the choices that have to be made regarding the development activity. Dif-
ferent authors use different terminology related to the choices to be made. The team of
De Bruin et al. describes a decision as a criterion, which is divided into characteristics
(De Bruin et al. 2005, p. 4). Kohlegger et al. translate the decisions into questions and
provide the reader with possible answer options (Kohlegger et al. 2009, p. 56). Mettler
uses the term decision parameter and its subcategory characteristics during develop-
ment, and the term attribute and attribute examples during classification (Mettler 2009,
p. 8; Mettler et al. 2010, p. 336). In this research the choice was made to further on use
the terms “decision attributes” and “decision attribute characteristics” to describe the
possible decisions to be made within a phase. These decision attributes can later on be
extracted as attributes for the benchmarking framework. The generic maturity model
development framework with its phases is illustrated in figure 4.5.

65
Identify need or opportunity
Define maturing elements
Define focus, purpose and targets of the model
Identification and comparison of existing
models
Define assessment methodology
Identify business dimensions and
capabilities
Define the design premise
Re-design
Define evaluation concepts
Conduct evaluationCommunicate evaluation
results
Approved
Re-evaluation
New version
Reflect evolution Deploy modelImplement assessment
documentation
Approved
Start/End
Process
Iteration decision
Documentation
Control flow
Doc
umen
tati
on
Read/Write
Figure 4.5. The generic maturity model development framework – phases within the development process

66
In the very beginning, before entering the development cycle, one must identify the need
or opportunity for a new maturity model. This activity is present in the proposals of
Mettler (2009, p. 8) and Lahrmann et al. (2011, p. 179), and originates from DSR where
either a business need or an economically valuable opportunity initiates the develop-
ment of an artefact. Immediately after this, one enters the first main phase called the
definition of the scope, consisting of three sub-phases. Scoping is present in all of the
proposals and it is mostly associated with setting the outer boundaries for model appli-
cation and use (De Bruin et al. 2005, p. 4). In other words, this is the phase where inclu-
sion and exclusion criteria are applied.
As suggested by Kohlegger et al. (2009, p. 57), Mettler (2009, p. 8), and Pöppelbuß and
Röglinger (2011, p. 6), the first sub-phase includes defining the maturing elements. It
has to be determined whether the measured maturity is process-, object-, or people-
focused. Kohlegger et al. (2009, p. 57) additionally define the form of change affecting
the maturing element, whether it is quality change, capability (readiness) change, risk
change, or some other change. In the second sub-phase one must define focus, purpose
and targets of the model. Decision to be made here are related to defining the focus of
the model, whether it is for general or domain-specific use (De Bruin et al. 2005, p. 4;
Mettler 2009, p. 8), and purpose of the model, whether the model is descriptive, pre-
scriptive or comparative (De Bruin et al. 2005, p. 4; Mettler 2009, p. 8; Pöppelbuß &
Röglinger 2011, p. 6). Furthermore, one must define the target domain and industry
(van Steenbergen et al. 2010, pp. 10-11; Pöppelbuß & Röglinger 2011, p. 6) and target
audience (De Bruin et al. 2005, p. 4; Mettler 2009, p. 8; Kohlegger et al. 2009, p. 58;
Pöppelbuß & Röglinger 2011, p. 6). Once these are specified, existing maturity models
operating in the same domain can be identified and compared. As highlighted by Beck-
er et al. (2009), Kohlegger et al. (2009, pp. 57-58), van Steenbergen et al. (2010, pp. 10-
11), and Pöppelbuß and Röglinger (2011, p. 6), this step is intended to find possible
solutions that will act as a complement model and starting point for development.
After defining the scope, the phase called the development of the model is entered.
This is where the artefact, in this case the maturity model, is designed and constructed.
A lot of variation is found between the proposals regarding the activity of designing,
constructing and populating the model. The team of De Bruin et al. (2005, p. 3) sepa-
rates the development process into two phases, the design and population phase.
Kohlegger et al. (2009, pp. 56-57) look into more detail of the construct of the model by
defining level relationships, transitions and stage triggers. Both van Steenbergen et al.
(2010, p. 12) and Lahrmann et al. (2011), greatly focus during this phase on the defini-
tion of domain capabilities and dependencies. However, a common feature found in all
the proposals is that upon completion of the development phase, the research team is
provided with a maturity model frame, populated with relevant domain-specific infor-
mation, and ready to be evaluated.

67
First, the model design premise must be defined (Becker et al. 2009, p. 218; Mettler
2009, p. 8; Mettler et al. 2010, p. 336). This sub-phase includes many decisions, includ-
ing the design approach, dimensionality of the model, the composition of model ele-
ments, and the design process. In a top-down approach one first defines the business
dimensions and then fills them with relevant information (Lahrmann et al. 2011, p.
179), and in a bottom-up approach this sequence is reversed. The team of De Bruin et
al. (2005), Becker et al. (2009) and van Steenbergen et al. (2010) all prefer a top-down
approach over a bottom-up approach when designing maturity models. Mettler (2009, p.
8) suggests a distinction between one-dimensional and multi-dimensional models, and
classifies models (Mettler et al. 2010, pp. 337-338) based on whether the model is built
like a grid, a Likert-like questionnaire or a CMM-like model. One must also discuss the
possibility of choosing between iterative and cyclical model design (Kohlegger et al.
2009, p. 56). The next step in developing maturity models is to identify a number of
business dimensions and capabilities. This answers the basic questions of “what needs
to be measured” and “how it can be measured.” The order of whether to identify busi-
ness dimensions and capabilities before or after model structure depends on the selected
design approach. The proposal of De Bruin et al. (2005, p. 6) is to include business di-
mensions and capabilities that are mutually exclusive and collectively exhaustive,
through the identification of domain-specific critical success factors. The team of van
Steenbergen et al. (2010, pp. 11-12) also use critical success factors to identify focus
area capabilities, which do not rely on a frame with a fixed number of levels. Lahrmann
et al. (2011, p. 179) propose a quantitative approach to identify the domain capabilities
by applying the Rasch algorithm, while Becker et al. (2009, p. 218), Mettler (2009, p.
9), and van Steenbergen et al. (2010, p. 11) prefer qualitative exploratory research
methods. To increase understandability for the end user, the business dimensions and
capabilities should be well-defined with textual descriptions in relation to the maturing
entities (Pöppelbuß & Röglinger 2011, p. 7). After the identification of business dimen-
sions and capabilities, the developer is provided with the architectural frame of the
model, resulting in metric values associated with maturity levels and business dimen-
sions. The relationship and transition between the maturity levels is addressed by
Kohlegger et al. (2009, pp. 56-57), and Pöppelbuß and Röglinger (2011, p. 7l) in their
proposals, which can help to determine if the maturing element moves from a level to
another implicitly or explicitly. In the third sub-phase the assessment methodology is
defined. This includes both defining the methods of application and the artefact used in
the assessment. Becker et al. (2009, p. 218) call this sub-phase “conception of transfer
and transfer media.” Both De Bruin et al. (2005, p. 8) and van Steenbergen et al. (2010,
p. 13), when talking about the assessment artefact, use the term “assessment instru-
ment.” Usually the assessment is done by interpreting the provided textual document.
The assessment instrument can also be constructed either as a traditional or software
assisted questionnaire by formulating control questions for each identified domain ca-
pability (Becker et al. 2009, p. 218; van Steenbergen et al. 2010, p. 13). It is recom-
mended to use electronic quantitative data collection methods, because they increase

68
availability and generalizability of the model (De Bruin et al. 2005, p. 8). The number
of questions in the assessment instrument must be of a right balance to ensure all topics
are covered and that the responses stay reliable (De Bruin et al. 2005, p. 8). Further-
more, one must define how the instrument is used. Three distinct approaches can be
distinguished, namely self-assessment, third-party assisted or certified professionals
assisted (De Bruin et al. 2005, p. 4; Becker et al. 2009, p. 219; Kohlegger et al. 2009, p.
57). Self-assessment models are often not made generally accessible due to commercial
reasons (Becker et al. 2009, p. 219). According to Becker et al. (2009, p. 218), the first
iteration decision has to be made after a cycle of the development main phase, in order
to comply with the DSR guidelines. The model design must be internally tested for
comprehensiveness, consistency and problem adequacy, to ensure that the model is of
high quality and sufficiency (ibid.). If these criteria are not fulfilled, the development
phase will start again.
Once the designed model is approved internally, the evaluation phase is entered. Ac-
cording to Becker et al. (2009, p. 219), evaluation establishes “whether the maturity
model provides the projected benefits and an improved solution for the defined prob-
lem.” The evaluation phase is also concerned with evaluating forms of reliability, name-
ly verification i.e. determining that the model meets the developer‟s specifications (Met-
tler 2009, p. 9), and validation i.e. the model measures what it was intended to measure
(De Bruin et al. 2005, p. 9). Further evolution criteria are the utility and generalizability
of the model (Lahrmann et al. 2011, p. 179).
The whole evaluation process consists of defining the evaluation concepts, conducting
the evaluation and communicating the results. The subject of the evaluation can be ei-
ther the development process of the model, or the final design product. However, it is
recommended that both subjects are present in the evaluation process to fully address
the rigor of the model. (Mettler 2009, p. 9.) Lahrmann et al. (2011) mention evaluating
methods such as functional testing, structural testing, surveys, focus groups, and inter-
views. If a method with user testing is selected, the appropriate test users have to be
chosen. The team of De Bruin et al. (2005, p. 9) differentiate between evaluating the
construct of the model and the assessment instrument, while authors like Becker et al.
(2009, p. 219) and Mettler (2009, p. 9) perceive the evaluation process as more holistic.
Becker et al. (2009, p. 219) address the possibility of conducting the evaluation publicly
via web-based self-assessment, which potentially generates a good amount of test data.
Results of the evaluation are communicated to the appropriate group via publications or
evaluation reports. The outcome of the evaluation may cause a reiteration of the evalua-
tion process, and in some cases of the whole development process. (Becker et al. 2009;
Mettler 2009, p. 8.)
The final phase of the whole maturity model development process is the deployment
and maintenance. The deployment process begins with implementing assessment doc-
umentation, which emphasizes on preparing documented guidance to assist the end user

69
in the application of the model. Mettler et al. (2010, p. 339) identify three stages of as-
sistance, namely “no supporting materials”, “handbook or manual”, and “software as-
sisted”, the latter being the most advanced level of assistance. Another aspect that needs
to be addressed in the assessment documentation is the practicality of evidence or how
suggestions for improvement are presented to the user. The practicality of evidence can
be either implicit and general improvement activities, or explicit and specific recom-
mendations. Explicit recommendations are desirable when the model addresses a delim-
ited domain (Mettler et al. 2010, p. 339.) The team of De Bruin et al. (2005, p. 9) argue,
that after evaluation the model must be deployed and made available for use to verify
the generalizability of the model. The De Bruin et al. approach is different from Becker
et al. (2009, p. 218), who consider the deployment already happening within the evalua-
tion phase. This argument is backed up by van Steenbergen et al. (2010, p. 13), who
argue that the very first application of the model can be used to evaluate the model.
However, deploying the model to a great number of end users will generate insight into
the general acceptance of the model. For classification purposes, the model is catego-
rized based on the degree of reliability after observing the outcome of the deployment.
The model can be verified, validated or certified, the latter being the highest form of
reliability (Kohlegger et al. 2009, p. 56). After the deployment, the continued relevance
of the model will be ensured by maintaining the model over time (De Bruin et al. 2005,
p. 10). Mettler (2009, p. 10) and Lahrmann et al. (2011, p. 179) use the term reflecting
evolution to describe the need for continuous model maintenance due to the changing
nature of the domain. Model elements will get obsolete and new best practices will
emerge, and therefore it is important to figure out how to handle alterations in the de-
ployment process (De Bruin et al. 2005, p. 10; Becker et al. 2009, p. 219; Lahrmann et
al. 2011, p. 179). Mettler (2009, p. 10) distinguishes between reflecting the model
through form (the underlying meta-model or model schema), or functioning (the way
how maturity is assessed). It has also to be determined, whether evolution is non-
recurring or continuous (ibid). The maintenance will further support the model‟s stand-
ardization and global acceptance (De Bruin et al. 2005, p. 10). If maintenance require-
ments are identified, an iteration cycle will be launched. As seen in the generic devel-
opment framework (figure 4.5), all main-phases should throughout the development
process be documented in detail.

70
Table 4.6. Maturity model classification system framework – the decisions of generic
maturity model development
Sub-phase Decision attributes Decision attribute characteristics
Basic information Name Name of the model
Primary source Author(s)
Origin Academic Business
Year of publication Year
Define maturing elements Maturing subject Process maturity Object maturity People capability
Define focus, purpose and targets of the model
Domain focus of the model General Domain-specific
Industry considerations No focus on industries General focus on industries Detailed focus on industries
Purpose of use Descriptive Prescriptive Comparative
Target domain Name of domain/industry
Target audience Management-oriented Technology-focused Both
Identification and comparison of existing models
Innovation New model Enhancement Combination
Define the design premise Design approach Top-down Bottom-up
Composition Grid Likert CMM-like
Design process Iterative Cyclic
Maturity levels 0-n
Business dimensions 0-n
Identify business dimensions and capabilities
Domain capabilities and focus areas Domain areas identified by the model
Define assessment methodology Assessment instrument Textual document Traditional questionnaire Software assessment tool
Total number of questions for business dimensions
0-n
Assessment method Self-assessment Third-party Certified practitioners
Define evaluation concepts Subject of evaluation Form Functioning Both
Communicate evaluation results Total number of respondents that have tested the model
0-n
Reliablity Verified Validated Certified
Reflect evolution Evolution Non-recurring Continuous
Implement assessment documentation
Application support No supporting materials Handbook or manual Software assisted
Practicality of evidence Implicit improvement activities Explicit recommendations
Visualization No visualization Traditional visualization Interactive visualization

71
All the identified decision attributes and their characteristics are summarized in the ma-
turity model classification system framework, shown in table 4.6. Decisions such as
name, primary source, origin, and year of publication were added to the top of the list to
describe the basic information of each model. This research defines a “domain” as a
field of action, thus perceiving Big Data as a domain of its own. However, some maturi-
ty models focus their attention additionally to industries. Industries are defined here as
mature and well-known economic regions of actions (eg. finance, retailing, manufactur-
ing, telecom, healthcare). The industry focus is especially present in comparative mod-
els that benchmark the results across the industry of the assessor. Thus the attribute “In-
dustry considerations” was added to the framework, to depict the level of focus that
models have on industries (no focus, general focus, detailed focus). Furthermore, the
decision attribute “visualization” was added to the framework for the development sub-
phase “implement assessment documentation”. Assessment materials can either be pre-
sented with no visual aid, as a traditional visualization, or as an interactive visualization.
The addition is in line with the findings of LaValle et al. (2011, p. 22) and Manyika et
al. (2011, p. 33), who both state that visualizing the data will become greatly valuable
since visualization increases understandability.

72
5. EVALUATION OF BIG DATA MATURITY MOD-
ELS
The terms “assessment” and “evaluation” differ in the context of maturity models. As-
sessment is understood as the act of utilizing the maturity model to measure organiza-
tional capabilities, while evaluation is the act of measuring the effectiveness of the ma-
turity model itself. It is important that maturity models are effective in the sense that
they identify the right improvement proposals. To show that a maturity model is effec-
tive, one can conduct a comparative evaluation. (Helgesson et al. 2012, p. 456.) In this
research, comparison is understood as normative comparison, meaning that the aim is to
explain invariances of the models and point out the best model among all alternatives
being studied (Routio 2007). A form of comparative evaluation is benchmarking, and it
can be associated with both qualitative and quantitative means (Johnson 2012).
In this chapter, the decision attributes identified in the systematic literature review are
utilized to comparatively evaluate existing Big Data maturity models. In chapter 5.1, the
target models are identified in a similar manner to chapter 4 using the approach of Fink
(2005). After having selected the final maturity models for evaluation, they are all vali-
dated on each decision attribute. As a result, a table is created with information that de-
picts decision attribute characteristics for every maturity model. Chapter 5.2 defines the
structure of the evaluation as well as the criteria evaluation is based upon. Here, the
approach of Vezzetti et al. (2014) is adapted, resulting in a benchmarking evaluation.
The results of the benchmarking evaluation process are depicted in chapter 5.3. The
results are divided into five smaller sections. The first four sections examine the de-
tailed benchmarking results on specific criteria and the fifth section examines the over-
all benchmarking scores.
5.1 Big Data maturity model selection process
There are a number of maturity models available on the web but how many of those
models measure maturity in the domain of Big Data? For selecting the appropriate mod-
els used in the benchmarking process in the following chapters, the approach of Fink
(see chapter 4.1) is again adapted. The maturity model selection process was conducted
on the 17th
of March 2015. It was noticed that searching bibliographic databases de-
scribed in table 4.1 for Big Data maturity models provided only empty results. This
suggests, that Big Data maturity models have been developed commercially and public-
ly, not academically. Thus, the search was conducted with the search engine “Google
Search” using the following search combinations:

73
big data maturity model “big data maturity model” “big data” AND “maturity model”
By applying practical and methodological screening criteria such as “ten last years”,
“English documents only”, “most relevant”, and “availability”, the total search results
were reduced drastically. Exclusion based on accessibility resulted in the exclusion of
models such as T-systems‟ commercial service “Big Data Readiness Assessment”,
Shan‟s “Big Data Maturity Model.” and SAP‟s “Big Data Maturity Model.” After re-
moving duplicates, the final selection was reduced to eight different maturity models,
developed independently from each other. The final eight models are introduced in or-
der of discovery below in table 5.1 with the help of the maturity model classification
system framework.

74
Table 5.1. The Big Data maturity models and their decision attribute characteristics
Decision attribute
Halper Betteridge IDC Infotech Radcliffe El-Darwiche van Veenstra Knowledgent
Name Big Data Maturity Model & Assess-ment Tool
Big Data & Ana-lytics Maturity Model
CSC Big Data Maturity Tool
Big Data Maturity Assessment Tool
Big Data Maturity Model
Big Data Maturity Framework
Maturity Model for Big Data Developments
Big Data Maturity Assessment
Primary source Halper & Krishnan (2013)
Betteridge & Nott (2014)
IDC (2013) Infotech (2013) Radcliffe (2014) El-Darwiche et al. (2014)
van Veenstra et al. (2013)
Knowledgent (2014)
Origin Educational (TDWI)
Business (IBM) Business (IDC) Business (Info-Tech)
Business (Radcliff Advisory Services)
Business (Strategy&) Business (TNO) Business (Knowledgent group inc)
Year of publication
2013 2014 2013 2013 2014 2014 2013 2014
Maturing subject
Process, Object, People
Process, Object, People
Process, Object, People
Process, Object, People
Process, Object, People
Process, Object, People
Process, Object Process, Object
Domain focus of the model
Domain-specific Domain-specific Domain-specific Domain-specific Domain-specific Domain-specific Domain-specific Domain-specific
Industry con-siderations
General focus on industries
No focus on industries
General focus on industries
No focus on industries
No focus on industries
No focus on industries
No focus on industries
No focus on industries
Purpose of use Comparative Descriptive Comparative Prescriptive Prescriptive Prescriptive Prescriptive Descriptive
Target domain Big Data Big Data & Analytics
Big Data & Analytics
Big Data Big Data Big Data Big Data Big Data
Target audience
Management & IT Management Management & IT
Management Management Management Management Management & IT
Innovation N/A N/A N/A N/A N/A N/A N/A N/A
Design approach
N/A N/A N/A N/A N/A Top-down N/A N/A
Composition Likert-like Grid Likert-like Likert-like Grid Grid Grid Likert-like
Design process Iterative N/A N/A N/A N/A Iterative N/A N/A
Maturity levels 6 5 5 4 6 4 4 5

75
Decision attribute
Halper Betteridge IDC Infotech Radcliffe El-Darwiche van Veenstra Knowledgent
Business dimensions
10 6 5 4 8 5 0 5
Domain capa-bilities and focus areas
Organization, Infrastructure, Data manage-ment, Analytics, Governance
Business strate-gy, Information, Culture & execu-tion, Architec-ture, Governance
Intent, Data, Technology, People, Process
Staffing, Business focus, Big data management & governance, Technology, Data type & quality
Vision, Strategy, Value & metrics, Governance, trust & privacy, People & organization, Data sources, Data man-agement, Analytics & visualization
Technical & Organi-zational capabilities, Data availability, Sponsorship, Data-driven decision-making, Customer segmentation
Efficiency, Effec-tiveness, New solutions, Trans-formation
Business environ-ment, Technology platform, Operat-ing model, Analyt-ics, Core infor-mation disciplines
Assessment instrument
Software assessment tool
Textual document
Software assessment tool
Traditional questionnaire
Textual document Textual document Textual document
Software assessment tool
Total number of questions for business dimensions
84 0 79 34 0 0 0 40
Assessment method
Self-assessment Self-assessment Self-assessment Self-assessment Self-assessment Self-assessment Self-assessment Self-assessment
Subject of evaluation
Form & Functioning
N/A Functioning N/A N/A N/A N/A N/A
Total number of respondents
600 N/A 2000 N/A N/A N/A N/A N/A
Reliability N/A N/A N/A N/A N/A N/A N/A N/A
Evolution Continuous N/A Continuous N/A N/A Continuous N/A Continuous
Application support
Software assisted No supporting materials
Software assisted
No supporting materials
Handbook Handbook Handbook Software assisted
Practicality of evidence
Explicit N/A Explicit Implicit Implicit Explicit Implicit N/A
Visualization Traditional No visualization Interactive No visualization Traditional Traditional Traditional Traditional

76
The information for each decision attribute per model was validated and filled based on
the provided materials from each maturity model. Further on, each model is referred to
in figures by the name of its author. If the model is developed by several people, the
name that appears first in the authors section is chosen. Unavailable information was
marked with the abbreviation “N/A.” Unavailable information was especially the case
when examining attributes regarding to the documentation of the maturity model devel-
opment process.
5.2 Benchmarking framework and evaluation criteria
Benchmarking is “the process of identifying, sharing, and using knowledge and best
practices” (Lemke et al. 2001, p. 1). It is used for comparative reasons to measure per-
formance using a specific indicator resulting in a metric or performance that is then
compared to others (Johnson 2012, p. 40). Whilst mostly applied by organizations to
measure business processes and business performance, benchmarking can be also per-
formed for a variety of artefacts including maturity models (Vezzetti et al. 2014). There
is a large number of benchmarking models and choosing the right methodology is an
essential key in making benchmarking a success (Jetmarova 2011, p. 76).
For evaluating the eight Big Data maturity models, the choice was made to adaptively
use the benchmarking framework proposed by Vezzetti et al. (2014, pp. 908-915). Orig-
inally applied in the Product Lifecycle Management -domain, the benchmarking frame-
work highlights the strengths and weaknesses of existing maturity models by taking into
account “the basic features of the model, such as name, origin, year of the publication,
the construction and organization of the model and the application method or tool sup-
port” (Vezzetti et al. 2014, p. 916). Vezzetti et al. (2014, p. 908) have divided the
benchmarking process into three distinct steps. First, appropriate maturity models have
to be selected for comparison. This was already done in chapter 5.1 by selecting eight
Big Data –focused maturity models. The selection process consisted of constructing a
search string, applying that string to query the chosen search engine, applying inclusion
and exclusion criteria to delimit results, and populating the classification system frame-
work with information from the final maturity models.
In the second step, the variables for comparing maturity models are selected. According
to Mettler (2010, p. 6), typical measures for evaluating maturity models are the actuali-
ty, completeness, consistency, relevancy, trustworthiness, comprehensibility, ease of
use, performance, and stability of the model. It was decided, that the Big Data maturity
models are evaluated on specific criteria complementing these measures. These criteria
were transformed into the following categories:

77
Completeness of the model structure (completeness, consistency)
The quality of model development and evaluation (trustworthiness, stability)
Ease of application (ease of use, comprehensibility)
Big Data value creation (actuality, relevancy, performance)
Each of these categories represents an aggregated criteria group consisting of several
decision attributes (table 5.2), identified in the systematic literature review. The first
criteria group, completeness of the model structure, emphasizes on how extensively the
model was built. Decision attributes included in this group are especially the attributes
that can be characterized as metric values (e.g. number of maturity levels, business di-
mensions). Secondly, the quality of model development and evaluation addresses the
key problematic findings of the systematic literature review. This criterion focuses on
how well the maturity model development process was documented, if best practices
and standardized methods were used for development, and how well the model was
tested. The third criteria group, ease of application, addresses the supporting tools pre-
sented to the end user when applying the model in practice. Evaluation focuses on the
quality of guidelines for maturity assessment as well as the improvement recommenda-
tions. The fourth and the last criteria group, Big Data value creation, evaluates the ma-
turity model based on how well it applies to the Big Data domain emphasizing on busi-
ness value creation.
Table 5.2. Aggregated criteria groups and their decision attributes
Completeness of the model structure
Quality of model development and evaluation
Ease of application
Big Data value creation
Purpose of use Design approach Assessment instrument
Maturing subject
Industry considerations Design process Assessment method
Domain focus of the model
Composition Subject of evaluation Application support
Target domain
Maturity levels Total number of respondents that have tested the model
Practicality of evidence
Target audience
Business dimensions Reliablity Visualization Domain capabilities and focus areas
Innovation Evolution
Total number of questions for business dimensions
The final step of the benchmarking process is to define and calculate a relative score for
each attribute per maturity model. The score for each attribute per model depends on
how well the attribute meets the criteria it is grouped with, and is based on arguments
found in the previously examined literature. In other words, a decision attribute with a
characteristic seen as a good practice for that specific criteria, is awarded a better score.
For example, three distinct characteristics can be identified for the decision attribute
“purpose of use”, namely descriptive, prescriptive and comparative. Upon investigating

78
academic literature it can be concluded, that these three characteristics represent chrono-
logical and evolutionary phases of a model‟s lifecycle and domain-specific issues are
addressed in more detail when moving from descriptive models to comparative models
(De Bruin et al. 2005, p. 3; Pöppelbuß & Röglinger 2011, p. 4). Thus, descriptive mod-
els are assigned a score of one, prescriptive a score of two, and comparative a score of
three. If information about a specific attribute is not available for a model, the attribute
is automatically scored as zero. After assigning scores for the attributes of each criteria
group per model, two final benchmarks can be extracted. The first final benchmark is a
detailed benchmark that compares the models according to the criteria groups, and the
second total benchmark compares the models as a whole. For better representation, the
final results are visualized with a radar chart.
5.3 Benchmarking results
The next sections describe the results of the benchmarking process. The first four sec-
tions address the benchmarks according to each criteria group, while the fifth section
examines the overall benchmarking scores. The overall benchmarking scores are pre-
sented in two different ways. First, as a more detailed benchmark comparing models in
each criteria group. And secondly, as a total benchmarking score comparing models as a
whole.
5.3.1 Completeness of the model structure
The aggregated criteria group “completeness of the model structure” comprises of deci-
sion attributes such as “purpose of use”, “industry focus of the model”, “composition”,
“innovation”, “maturity levels”, “business dimensions”, and “total number of questions
for business dimensions”. For the attribute “purpose of use”, a score was assigned on
the basis of the type of purpose specified by the maturity model (1=descriptive;
2=prescriptive; 3=comparative). The attribute “industry considerations” was scored in
terms of how broadly models focused on industries during prescriptive actions (0=no
focus on industries; 1=general focus on industries; 2=detailed focus on industries). For
the attribute “composition”, a score was assigned based on how the maturity model was
structured (1=grid; 2=Likert-like; 3=CMM-like). For the attribute “innovation”, a score
was assigned in regard to how well the model has utilized existing maturity models in
the scoping phase (1=new model; 2=enhancement; 3=combination). For attributes “ma-
turity levels”, “business dimensions” and “total number of questions for business di-
mensions", a value was assigned according to the number of maturity levels, business
dimensions, and questions asked in the assessment.

79
Table 5.3. Completeness of the model structure – attributes and scores
Max score Completeness of the model struc-ture
Halper IDC Inf Bett El-D Radcl van V Knowl
3 Purpose of use 3 3 2 1 2 2 2 1
2 Industry considerations 1 1 0 0 0 0 0 0
3 Composition 2 2 2 1 1 1 1 2
3 Innovation 0 0 0 0 0 0 0 0
6 Maturity levels 6 5 4 5 4 6 4 5
10 Business dimensions 10 5 4 6 5 0 0 5
84 Total number of questions for busi-ness dimensions
84 79 34 0 0 0 0 40
The results for the decision attributes in the criteria group “completeness of the model
structure” are visible in table 5.3. A radar chart (figure 5.1) was used to visualize the
final score. For efficiency, the values have been normalized using the maximum score
of each attribute row.
Figure 5.1. Results of “completeness of the model structure” for each maturity model
0
0,1
0,2
0,3
0,4
0,5
0,6
0,7
0,8
0,9
1
Halper
IDC
Infotech
Betteridge
El-Darwiche
Radcliffe
van Veenstra
Knowledgent
Purpose of use Industry considerations
Composition Innovation
Maturity levels Business dimensions
Total number of questions for business dimensions

80
There is great variance between the Big Data maturity models when examining the
completeness or extensiveness of the model, as seen in the figure 5.1 above. The models
of Halper and Krishnan (2013), and IDC (2013) provide the end users with all descrip-
tive, prescriptive, and comparative functionality, while the models of Infotech (2013),
El-Darwiche et al. (2014), Radcliffe (2014) and van Veenstra et al. (2013) serve a de-
scriptive-prescriptive purpose of use. The models of Betteridge and Nott (2014), and
Knowledgent (2014) were the only ones acting as a descriptive model, not providing
any recommendations or improvement activities. Upon investigation it was also noted,
that none of the models were structured as a CMM-like model, but merely as a maturity
grid or Likert-like questionnaire. Since CMM-like models provide the right amount of
complexity, also defining specific goals for key process areas and considering common
implementation and infrastructural activities, can all evaluated Big Data maturity mod-
els be seen to lack in composition.
Another criteria measured is the numeric value regarding the models structural objects.
Whilst others have built their model traditionally with 4 to 5 maturity levels, include
Halper and Krishnan (2013), and Radcliffe (2014) a sixth level. This additional level in
both models can be called a “non-existing” level, and it addresses the issues and several
hurdles with closing a specific “knowledge-gap.” The non-existing levels can be identi-
fied as crucial time-consuming phases and assist in smoothly transitioning over prob-
lematic barriers. Halper and Krishnan, and Radcliffe also exceed having defined a total
of 8-10 business dimensions, and covering a wide area of capabilities. Notable is, that
van Veenstra et al. (2013) do not specify any business dimensions at all, relying only on
maturity levels and embedded prescriptive and general recommendations. The “total
number of questions for business dimensions” –attribute correlates with models that
provide some sort of assessment tools to the end user. Whilst Halper and Krishnan, and
IDC (2013) ask a total of ca. 80 questions in their assessment, do Infotech (2013) and
Knowledgent (2014) ask only the half of that amount, namely ca. 40 questions. Howev-
er, a great number of questions can consume a great amount of time, hence the im-
portance of the overall score for each maturity model. None of the Big Data maturity
models provided information about the attribute “innovation”, or whether the maturity
model uses a conceptual mother model.
5.3.2 Quality of model development and evaluation
The aggregated criteria group “quality of model development and evaluation” comprises
of decision attributes such as “design approach”, “design process”, “subject of evalua-
tion”, “total number of respondents that have tested the model”, “reliability”, and “evo-
lution”. For the attribute “design approach”, a score is awarded based on the type of
approach used in developing and constructing the conceptual model (1=bottom-up; 2=
top-down). The attribute “design process” addresses whether the model is designed cy-
clically or iteratively (cyclical=1; iterative=2). For the attribute “subject of evaluation”,

81
a score is assigned on the basis of what is considered to be the target of testing and
evaluation as a part of the model‟s development process (form=1; functioning=1; form
and functioning=2). The attribute “the total number of respondents that have tested the
model” is awarded a score in relation to how many users have tested and used the mod-
el. For this, the latest information provided is used. For the attribute “reliability”, a
score is assigned on the basis of the general and public acceptance of the model
(1=verified; 2=validated; 3=certified). Lastly, the attribute “evolution” measures wheth-
er the model is maintained continuously or not (0=non-recurring; 1=continuous).
Table 5.4. Quality of model development and evaluation – attributes and scores
Max score Quality of model development and evaluation
El-D Halper IDC Bett Inf Radcl van V Knowl
2 Design approach 2 0 0 0 0 0 0 0
2 Design process 2 2 0 0 0 0 0 0
2 Subject of evaluation 0 2 1 0 0 0 0 0
2000
Total number of respondents that have tested the model
0 600 2000 0 0 0 0 0
3 Reliablity 0 0 0 0 0 0 0 0
1 Evolution 1 1 1 0 0 0 0 1
The results for the decision attributes in the criteria group “quality of model develop-
ment and evaluation” are visible in table 5.4. A radar chart (figure 5.2) was used to vis-
ualize the final score. For efficiency, the values have been normalized using the maxi-
mum score of each attribute row. Since there are a lot of zero score entries, the radar
charts axis is formatted to scale more optimally.

82
Figure 5.2. Results of “quality of model development and evaluation” for each maturity
model
It was a challenge to evaluate the Big Data maturity models on the criterion quality of
model development and evaluation, since development processes were documented
poorly or the information was not accessible. A questionnaire regarding the develop-
ment processes (see appendix B) was sent out to the immediate authors of all the mod-
els. This however yielded only answers from the team of El-Darwiche et al. (2014). The
unavailable information for this criteria group is in line with the findings of the system-
atic literature review, namely that maturity models lack in documentation when looking
into the model‟s development processes.
Information for the design approach was available for El-Darwiche et al. (2014) who
state that the maturity model design is based on their collective experience in the indus-
try. El-Darwiche et al. see their model as a hybrid model, consisting of both top-down
and bottom-up design approaches. Furthermore, El-Darwiche et al. argue that the model
is subject to iterative refinement due to more and more organizations continuously
adopting Big Data practices. The iterative design process is also mentioned by Halper
-0,2
0
0,2
0,4
0,6
0,8
1
El-Darwiche
Halper
IDC
Betteridge
Infotech
Radcliffe
van Veenstra
Knowledgent
Design approach
Design process
Subject of evaluation
Total number of responents that have tested the model
Reliablity
Evolution

83
and Krishnan (2013), who state that best practices will be added to the model as infor-
mation is gathered from observations and success stories.
The quality of evaluation or testing during the development process was measured with
the subject of evaluation, total number of respondents that have tested the model, and
reliability. The subject of evaluation for the model Halper and Krishnan (2013) was
identified as both form and functioning. The Big Data maturity model of Halper and
Krishnan is presented as an evolutionary model and its practices are under constant
evaluation, affecting both the content and structure of the model. The subject of evalua-
tion for IDC (2013) is only the model functioning (or the way the maturity model is
being used). Evidence for this is that IDC‟s Big Data maturity model stems from an
IDC research paper published in 2013, and it was during the years transferred to a soft-
ware tool hosted by CSC. However, during this transfer the content of the model was
unaffected. The total number of respondents that have tested the model could be also
found only for the models of Halper and Krishnan, and IDC. Halper mentions in a
“TDWI Big Data maturity model” related blog post that ca. 600 respondents have par-
ticipated in the assessment as of 2014 (Halper 2014). This number is however topped by
the Big Data and Analytics Assessment maturity model from IDC, who credit over 2000
respondents from major industries around the world to have tested the model. For all
maturity models, no information was found regarding the reliability or the degree of
public acceptance. One reason for the low acceptance rate can be the fairly young age
of all the maturity models examined.
The quality of model maintenance was evaluated with the criterion “evolution.” For the
models of Halper and Krishnan (2013), IDC (2013), El-Darwiche et al. (2013), and
Knowledgent (2014), a clear continuous pattern of reflecting evolution is identified.
Especially Knowledgent‟s model was detected to be under continuous change, even
having modifications happening during the benchmarking process. The rest of the mod-
els were identified to serve more of a one-time purpose.
5.3.3 Ease of application
The aggregated criteria group “ease of application” comprises of decision attributes
such as “assessment instrument”, “assessment method”, “application support”, “practi-
cality of evidence” and “visualization”. Values were assigned based on the type of in-
strument (1=textual document; 2=traditional questionnaire; 3=software assessment
tool), method of assessment (1=self-assessment; 2=third-party assisted; 3=certified
practitioners), and type of application support (0=no supporting materials; 1=handbook;
2=software assisted). For the attribute “practicality of evidence”, a score was assigned
according to the type of recommendations given after the assessment (1=implicit im-
provement activities; 2=explicit recommendations). Lastly, the attribute “visualization”
evaluated the type of visualized assistance provided (0=no visualization; 1=traditional
visualization; 2=interactive visualization).

84
Table 5.5. Ease of application – attributes and scores
Max score Ease of application Halper IDC El-D Radcl van V Inf Bett Knowl
3 Assessment instrument 3 3 1 1 1 2 1 3
3 Assessmentt method 1 1 1 1 1 1 1 1
2 Application support 2 2 1 1 1 0 0 2
2 Practicality of evidence 2 2 2 1 1 1 0 0
2 Visualization 1 2 1 1 1 0 0 1
The results for the decision attributes in the criteria group “ease of application” are visi-
ble in table 5.5. A radar chart (figure 5.3) was used to visualize the final score. For effi-
ciency, the values have been normalized using the maximum score of each attribute
row.
Figure 5.3. Results of “ease of application” for each maturity model
In terms of ease of application, the Big Data maturity models differ in the way they are
practically used, and in the way materials are provided for assistance. However, the as-
sessment method for every model was identified as the same, namely self-assessment.
0
0,1
0,2
0,3
0,4
0,5
0,6
0,7
0,8
0,9
1
Halper
IDC
El-Darwiche
Radcliffe
van Veenstra
Infotech
Betteridge
Knowledgent
Assessment instrument Assessment method Application support
Practicality of evidence Visualization
85
This was mostly due the fact that assessments conducted by third-parties or certified
practitioners have usually commercial intent (eg. the Big Data readiness assessment of
T-Systems), not falling into the boundaries of the examined commercial-free models.
Within the models, all three types of assessment instruments could be identified. Halper
and Krishnan (2013), IDC (2013) and Knowledgent (2014) offer their Big Data maturity
assessment instrument as a software tool, accessible via a web browser. In all three cas-
es, the software assessment tool automatically calculates a maturity score based on the
answers given to a certain number of questions. In addition, Halper and Krishnan, and
IDC calculate a benchmarking score, comparing the assessor‟s results to industry aver-
ages. Infotech (2013) offer their assessment instrument as a traditional questionnaire
and the calculation is done with the help of spreadsheet functionality. This type of tradi-
tional questionnaire is not as intuitive as the web-based software assessment. The rest of
the authors present their maturity model in the form of a textual document, not provid-
ing an assessment directly to the end user. This means that the end user has to, on his
own, figure out the best way to utilize the descriptive and prescriptive content of these
models to measure their Big Data maturity and capabilities.
The form of the assessment instrument is closely tied to the application support. All
models that include a software assessment tool provide software assisted application
support. Instructions are embedded within the software tool and guide the user in using
the maturity model in the most effective way. The application support of Halper and
Krishnan (2013) is especially of high quality due to them additionally providing a guide
book for interpreting the assessment score, and an introduction webinar video. Radcliffe
(2014), El-Darwiche et al. (2014) and van Veenstra et al. (2013) have published their
maturity model to the public via a white paper or a research paper. These papers act as
handbooks that guide the user in identifying certain maturity topics associated with their
organization. Furthermore, Radcliffe‟s argues that the Big Data maturity model works
the best when combining it with his Big Data framework that details the components of
the Big Data big picture. Both Betteridge and Nott (2014), and Infotech (2013) do not
provide any supporting materials, presenting all information within the frame of their
maturity model.
The practicality of evidence measures whether recommendations are given on a more
general implicit level or on a more specific explicit level. Halper and Krishnan (2013),
IDC (2013), and El-Darwiche et al. (2014) all provide detailed information about steps
that need to be taken to overcome boundaries and to transition from a lower maturity
level to a higher one. While Halper and Krishnan, and IDC offer explicit recommenda-
tions per every business dimension, focus El-Darwiche et al. more on giving advice on
the procedures built on top of these dimensions, namely environment readiness and in-
ternal capabilities. As for Radcliffe (2014), van Veenstra et al. (2013) and Infotech
(2013), improvement activities are in the form of good practices organizations in gen-
eral should implement within each maturity level. Knowledgent (2014) as a descriptive
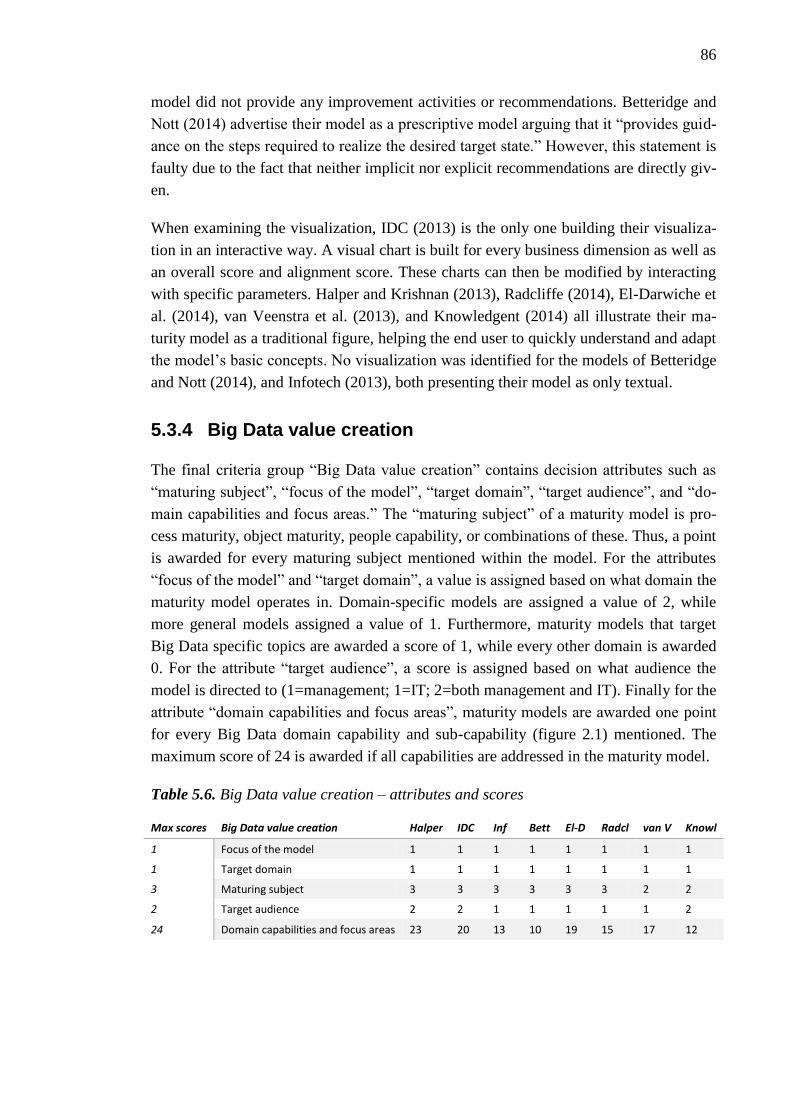
86
model did not provide any improvement activities or recommendations. Betteridge and
Nott (2014) advertise their model as a prescriptive model arguing that it “provides guid-
ance on the steps required to realize the desired target state.” However, this statement is
faulty due to the fact that neither implicit nor explicit recommendations are directly giv-
en.
When examining the visualization, IDC (2013) is the only one building their visualiza-
tion in an interactive way. A visual chart is built for every business dimension as well as
an overall score and alignment score. These charts can then be modified by interacting
with specific parameters. Halper and Krishnan (2013), Radcliffe (2014), El-Darwiche et
al. (2014), van Veenstra et al. (2013), and Knowledgent (2014) all illustrate their ma-
turity model as a traditional figure, helping the end user to quickly understand and adapt
the model‟s basic concepts. No visualization was identified for the models of Betteridge
and Nott (2014), and Infotech (2013), both presenting their model as only textual.
5.3.4 Big Data value creation
The final criteria group “Big Data value creation” contains decision attributes such as
“maturing subject”, “focus of the model”, “target domain”, “target audience”, and “do-
main capabilities and focus areas.” The “maturing subject” of a maturity model is pro-
cess maturity, object maturity, people capability, or combinations of these. Thus, a point
is awarded for every maturing subject mentioned within the model. For the attributes
“focus of the model” and “target domain”, a value is assigned based on what domain the
maturity model operates in. Domain-specific models are assigned a value of 2, while
more general models assigned a value of 1. Furthermore, maturity models that target
Big Data specific topics are awarded a score of 1, while every other domain is awarded
0. For the attribute “target audience”, a score is assigned based on what audience the
model is directed to (1=management; 1=IT; 2=both management and IT). Finally for the
attribute “domain capabilities and focus areas”, maturity models are awarded one point
for every Big Data domain capability and sub-capability (figure 2.1) mentioned. The
maximum score of 24 is awarded if all capabilities are addressed in the maturity model.
Table 5.6. Big Data value creation – attributes and scores
Max scores Big Data value creation Halper IDC Inf Bett El-D Radcl van V Knowl
1 Focus of the model 1 1 1 1 1 1 1 1
1 Target domain 1 1 1 1 1 1 1 1
3 Maturing subject 3 3 3 3 3 3 2 2
2 Target audience 2 2 1 1 1 1 1 2
24 Domain capabilities and focus areas 23 20 13 10 19 15 17 12
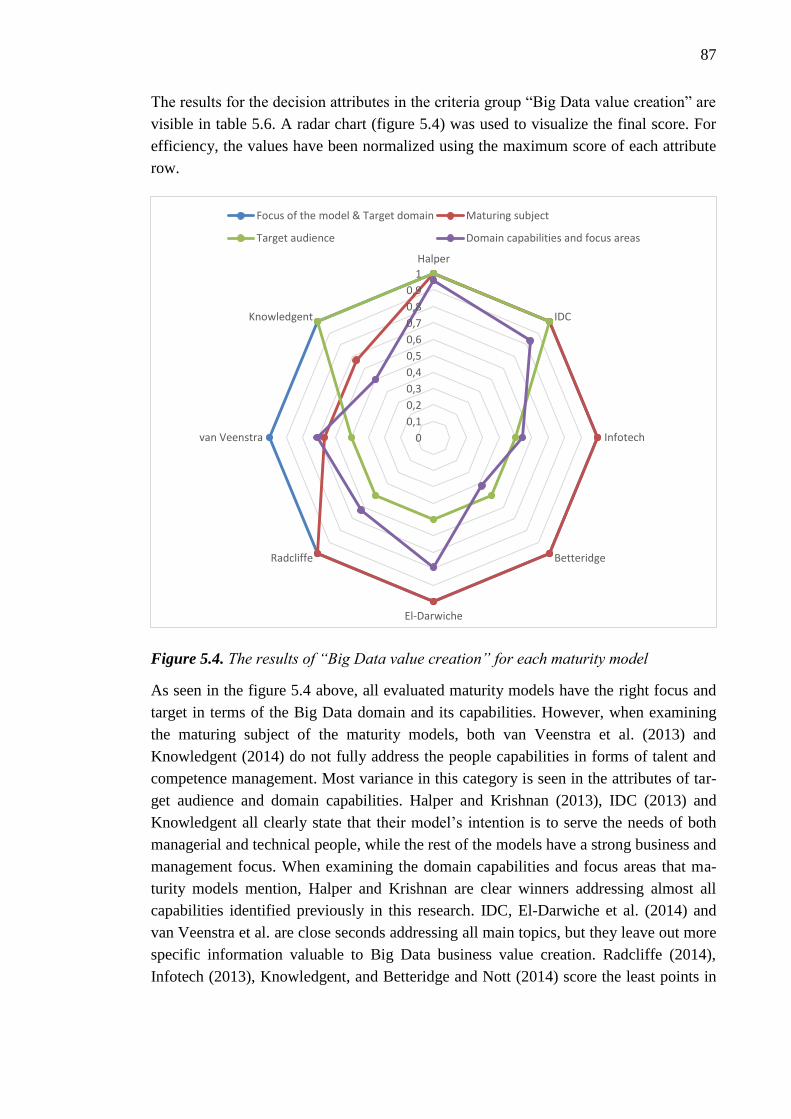
87
The results for the decision attributes in the criteria group “Big Data value creation” are
visible in table 5.6. A radar chart (figure 5.4) was used to visualize the final score. For
efficiency, the values have been normalized using the maximum score of each attribute
row.
Figure 5.4. The results of “Big Data value creation” for each maturity model
As seen in the figure 5.4 above, all evaluated maturity models have the right focus and
target in terms of the Big Data domain and its capabilities. However, when examining
the maturing subject of the maturity models, both van Veenstra et al. (2013) and
Knowledgent (2014) do not fully address the people capabilities in forms of talent and
competence management. Most variance in this category is seen in the attributes of tar-
get audience and domain capabilities. Halper and Krishnan (2013), IDC (2013) and
Knowledgent all clearly state that their model‟s intention is to serve the needs of both
managerial and technical people, while the rest of the models have a strong business and
management focus. When examining the domain capabilities and focus areas that ma-
turity models mention, Halper and Krishnan are clear winners addressing almost all
capabilities identified previously in this research. IDC, El-Darwiche et al. (2014) and
van Veenstra et al. are close seconds addressing all main topics, but they leave out more
specific information valuable to Big Data business value creation. Radcliffe (2014),
Infotech (2013), Knowledgent, and Betteridge and Nott (2014) score the least points in
0
0,1
0,2
0,3
0,4
0,5
0,6
0,7
0,8
0,9
1
Halper
IDC
Infotech
Betteridge
El-Darwiche
Radcliffe
van Veenstra
Knowledgent
Focus of the model & Target domain Maturing subject
Target audience Domain capabilities and focus areas

88
this category, poorly addressing analytical and technological capabilities as well as top-
ics of customer segmentation.
5.3.5 Overall benchmarking scores
The previous benchmarking results form a basis for calculating the overall benchmark-
ing score (table 5.7). First, the total score of each criteria group is calculated for every
maturity model by summing together the normalized attribute values. These sub-totals
are later used in visualizing the detailed benchmarking score. Finally, the total bench-
marking score for every maturity model is calculated by summing together the total
criteria group scores.
Table 5.7. Overall benchmarking scores for the Big Data maturity models
Criteria group Halper IDC El-D Knowl Inf Radcl van V Bett
Completeness of the model structure 5,17 4,44 2,17 2,81 2,80 2,80 1,67 2,1
The quality of model development and evalua-tion
3,30 2,50 3,00 1,00 0,00 0,00 0,00 0,00
Ease of application 3,83 4,33 2,67 2,83 1,50 2,17 2,17 0,67
Big Data value creation 4,96 4,83 4,29 4,17 4,04 4,13 3,88 3,92
Total score 17,26 16,11 12,13 10,81 8,35 8,29 7,71 6,68
The detailed benchmarking scores for every Big Data maturity model are visualized in
figure 5.5 as a radar chart. Results in the radar chart are presented as normalized values
for efficiency. The models are ordered on the total score from highest to lowest.

89
Figure 5.5. Detailed benchmarking scores of Big Data maturity models
The detailed benchmark reflects the variation between Big Data maturity models in spe-
cific criteria groups. Whilst Big Data value creation is balanced, all other criteria differ
greatly between the maturity models. Halper and Krishnan‟s (2013) Big Data maturity
model and assessment tool is ranked first in model completeness, model quality and Big
Data value creation, while IDC (2013) ranks first in the ease of application.
Model completeness and extensiveness is well represented in models of Halper and
Krishnan (2013), and IDC (2013). These models are structured as prescriptive-
comparative models and provide benchmarking functionality to the end user. The ma-
turity assessment is done on a Likert-scale, by asking a number of questions for a good
variety of business dimensions. Results are then compared to a variety of mature indus-
tries, but only on a general level. Knowledgent (2014) and Infotech (2013) offer a simi-
lar Likert-like assessment tool for measuring organizational maturity, but haven‟t yet
implemented benchmarking capabilities. The rest of the models, namely Radcliffe
(2014), van Veenstra et al. (2013) and Betteridge and Nott (2014), are grid-like compo-
sites, not relying on direct maturity assessment tools. However, Radcliffe distinguishes
himself from others by combining his maturity model with an extensive Big Data busi-
ness dimension framework, addressing six maturity levels in relation to eight business
0
0,1
0,2
0,3
0,4
0,5
0,6
0,7
0,8
0,9
1
Halper
IDC
El-Darwiche
Knowledgent
Radcliffe
Infotech
van Veenstra
Betteridge
Completeness of the model structure
The quality of model development and evaluation
Ease of application
Big Data value creation

90
dimensions. The team of van Veenstra et al. build their gird-like model somewhat ab-
normally, not directly addressing any business dimensions.
By examining the quality of model development and evaluation we can conclude that
the models of Halper and Krishnan (2013), IDC (2013) and El-Darwiche et al. (2014)
perform very strong in this category, in contrast to the rest of the models. The strong
performers have provided information about the underlying methodological assump-
tions of their maturity model. These methodological choices are also in line with good
development practices, making them credible for practical use. The radically low scores
for the rest of the models can be explained by the lack of documentation in relation to
the models‟ development processes. This finding confirms the argument found earlier in
the systematic literature review that maturity model authors document their develop-
ment processes in a dissatisfactory manner.
The category “ease of application” is dominated by models associated with a software
type tool, namely Halper and Krishnan (2013), and IDC (2013). Software assisted ma-
turity assessment with visualized results ensures that the model is easy to use and as
comprehensible as possible to the end user. The rest of the models, with the exception
of Betteridge and Nott (2014), have a balanced approach affecting the ease of applica-
tion, lacking only a bit in the way assistance is provided to the end user. Betteridge and
Nott score very low in this category, not providing any application support for their
model. Furthermore, Betteridge and Nott have intended their Big Data maturity model
as solely descriptive, meaning that using the model in a practical scenario is difficult.
Big Data value creation scores are distributed surprisingly even. However, the bench-
mark tends to lean towards Halper and Krishnan (2013) and IDC (2013), them address-
ing all general maturing subjects and a great number of Big Data capabilities. The mod-
els are also customized to not only address the decision makers and management within
a business, but also the technical specialists that operate the Big Data systems.
The total benchmarking score for the Big Data maturity models is shown in table 5.7
and illustrated in figure 5.6. The radar chart visualizes the total score of each maturity
model as a shared percentage of the sum of all total scores. Three distinct categories can
be identified based on the obtained results, namely top performers, mid performers, and
low performers.
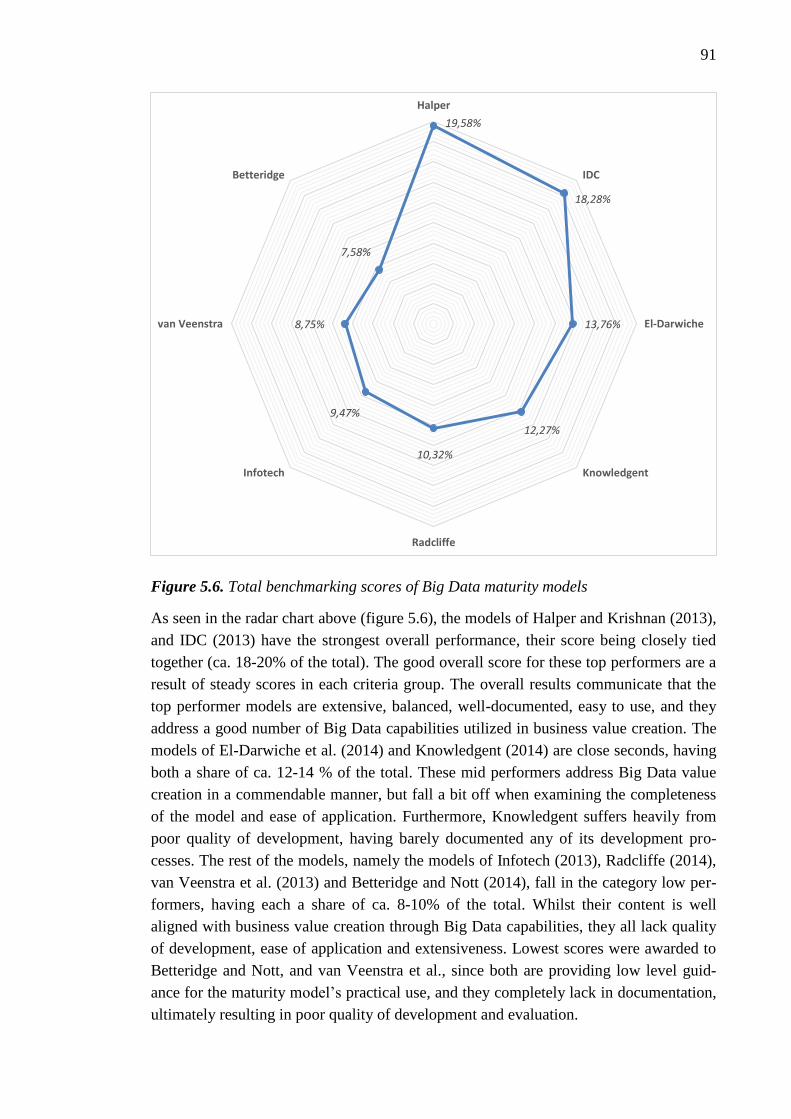
91
Figure 5.6. Total benchmarking scores of Big Data maturity models
As seen in the radar chart above (figure 5.6), the models of Halper and Krishnan (2013),
and IDC (2013) have the strongest overall performance, their score being closely tied
together (ca. 18-20% of the total). The good overall score for these top performers are a
result of steady scores in each criteria group. The overall results communicate that the
top performer models are extensive, balanced, well-documented, easy to use, and they
address a good number of Big Data capabilities utilized in business value creation. The
models of El-Darwiche et al. (2014) and Knowledgent (2014) are close seconds, having
both a share of ca. 12-14 % of the total. These mid performers address Big Data value
creation in a commendable manner, but fall a bit off when examining the completeness
of the model and ease of application. Furthermore, Knowledgent suffers heavily from
poor quality of development, having barely documented any of its development pro-
cesses. The rest of the models, namely the models of Infotech (2013), Radcliffe (2014),
van Veenstra et al. (2013) and Betteridge and Nott (2014), fall in the category low per-
formers, having each a share of ca. 8-10% of the total. Whilst their content is well
aligned with business value creation through Big Data capabilities, they all lack quality
of development, ease of application and extensiveness. Lowest scores were awarded to
Betteridge and Nott, and van Veenstra et al., since both are providing low level guid-
ance for the maturity model‟s practical use, and they completely lack in documentation,
ultimately resulting in poor quality of development and evaluation.
19,58%
18,28%
13,76%
12,27%
10,32%
9,47%
8,75%
7,58%
Halper
IDC
El-Darwiche
Knowledgent
Radcliffe
Infotech
van Veenstra
Betteridge

92
6. CONCLUSIONS
This chapter presents the conclusions and key findings of the research. The key findings
are outlined by reflecting on the research questions formed in chapter 1.2. Furthermore,
the research and its methods are evaluated from a critical point of view in terms of reli-
ability and validity. A critical review is necessary to address the possible weaknesses,
problems and limitations that have occurred during the research process. Lastly, a brief
discussion is held about the future research opportunities.
6.1 Research summary and conclusions
The objective of this research was to design a benchmarking process to evaluate availa-
ble Big Data maturity models in terms of business value creation and good practices of
maturity modeling. As a result, maturity models could be effectively compared to de-
termine the best available model for business organizations to practically assess and
improve their Big Data maturity. The research objective was translated into a main re-
search question, comprising of several elements and concepts. To define these elements
and concepts, and to support the research process, this main research question was fur-
ther on divided into six sub-questions. Sub-questions one to three were designed to de-
fine key concepts such as Big Data and maturity modeling as well as how to utilize Big
Data in business value creation. The fourth sub-question supported in analyzing and
summarizing best practices of maturity model development and classification. Lastly,
sub-questions five and six guided in selecting the appropriate maturity models for com-
parison and designing an efficient benchmarking process around them. Hence, in the
next section all sub-questions are gone through chronologically and provided with an
answer. As they unfold one-by-one, enough information is obtained to ultimately an-
swer the main research question.
What is Big Data and what are the characteristics behind it?
Big Data in its simplicity is a term for complex and large information assets, addressing
both technological and business implications. It is a result of the explosive growth of
data led by the digitization of our society, and has since its emergence been a topic of
interest among both business and academic societies. To distinguish Big Data from tra-
ditional data processing and analytics, it is often associated with the attributes of high-
volume, high-variety and high-velocity. Volume, also perceived as the primary attribute
of Big Data, refers to the large amount of data available, usually measured in terabytes
and petabytes. The fast growth of the Internet and the evolution of handheld devices
have contributed to the generation of high-volume Big Data. All data is argued to grow

93
on an annual rate of ca. 40 %. However, Big Data also contains excess data that may not
be in any forms valuable to the end user. Velocity refers to the rate at which data is cap-
tured. Data is now captured in real time or near real time, requiring organizations to
react more quickly to occurring changes. Big Data technologies try to overcome this
challenge by connecting the important data streams and capturing the most valuable
information for intelligent analysis. Lastly, variety refers to the different forms data is
occurring in our everyday life. Big Data is a mix of structured and unstructured data,
which together present a challenge for data management. The sources of Big Data are
usually categorized into human-sourced information, process-mediated data and ma-
chine-generated data. While process-mediated and machine-generated data is highly
structured, human-sourced information is highly subjective and unstructured in forms of
media files and social network data.
Technology is a necessary component for Big Data. Technological solutions have been
developed to address the issues with traditional data processing systems, ultimately cap-
turing value from the vast amount of complex data. There are a growing number of
technologies used to aggregate, manipulate, manage and analyze Big Data, the most
prominent being NoSQL systems, Hadoop, and cloud computing. NoSQL systems are
high-scalable and high-performance database systems that handle agile processing of
large information sets. These NoSQL systems are unstructured in nature, trading off
consistency requirements for speed and agility. They can be classified into key-value,
document, wide-column, and graph storage systems, all having unique functional and
structural characteristics. NoSQL systems are mostly open-source and they build their
processing on cheap hardware, making them very cost-efficient. However, they are far
from advanced database technologies and will not replace traditional relational systems
in the near future. Hadoop is an open-source software project, providing distributed
processing of large datasets across clusters of computers using simple programming
models. It can be viewed as a software ecosystem, consisting of primary components
Hadoop Distributed File System (HDFS) and MapReduce, and a plethora of third-party
open-source software components. HDFS acts as a file system that stores data across the
Hadoop cluster. MapReduce distributes the processing load across the Hadoop cluster
by performing complex computational procedures. MapReduce is credited as a major
game changer in Big Data processing and provides key advantages such as increased
functionality, simplicity, scalability, speed, built-in recovery, minimal data motion and
freedom to focus on business logic. Lastly, cloud computing can be defined as a model
for network access to a shared pool of computing resources. Cloud services, depending
on their service model, provide the end user access to reliable software, hardware and
infrastructure, all delivered over the Internet and remote data centers. Cloud computing
serves as a platform to address Big Data related issues and perform complex analytics in
a timely manner. Big Data technologies have a respectable presence in the business
world, but also have their limitations. Hadoop lacks query processing strategies and
infrastructure in respect to data processing and management, while NoSQL lack robust-
94
ness, functionality, familiarity, support and maturity. Thus companies build their data
environments on top of hybrid solutions, making use of both traditional and Big Data
technologies.
How can organizations utilize and create value from Big Data in their business?
Data has always been valuable to organizations, and with Big Data even more value
creation opportunities have emerged. Several studies in the 2010s have shown that
adopting Big Data initiatives in organizations increase competitiveness and productivi-
ty, as well as improve financial and operational results. There are many ways Big Data
can generate value, but these ways usually complement the 3V‟s. A common driver for
all value creation ways is the organizational talent management, ensuring that the Big
Data ecosystem is operated by the right level of professionalism. Big Data is generally
acknowledged to create value in four main ways, namely data transparency through
proper data management, customer segmentation, data-driven analytics and business
model innovation.
Data transparency can be translated as “making data easily accessible to relevant users
in a timely manner” (Manyika et al. 2011, p. 5). Achieving open transparency improves
data quality, consistency, reliability, availability and accessibility. This makes open
transparent data valuable in the forms of improved product and service offerings, re-
duced time-to-market, and efficient concurrent engineering. Data transparency is
achieved through proper Big Data management (BDM), a concept of collectively man-
aging data, people, tools and intent together as a whole. Data disciplines such as data
governance, BI/DW and data quality management have the strongest involvement in
BDM. BDM requires expertise in the new Big Data technologies, as well as in the new
business practices. The value of data increases as it is more processed and refined, but
value is also lost over a period of time. To overcome the value-time challenge, automa-
tion should be implemented to BDM. Automated BDM processes support managing the
data more quickly and more effectively, at the same time opening up human resources.
Customer segmentation is viewed as the premise of a marketing organization. It pro-
vides market insights such as segment size, profitability, and growth potential, as well
as analysis of customer behavior and attitude. Big Data enables new segmentation pro-
cedures and utilizes statistical methods to group customers into certain micro-segments.
These micro-segments assist in targeting product and service offerings and designing
promotions and advertisement campaigns to the right group of people. Sources for gath-
ering customer data exist online, as more and more customers are connected to the In-
ternet of Things. Customer data can be categorized into activity-based data, social net-
working profile data and social influence data that together form a pool of information
for identifying potential new customers and maintaining the loyalty of existing custom-
ers.

95
The main goal of Big Data analytics is to translate data into business advantage and
support internal business decisions. Big Data analytics meet the requirements of han-
dling data that is of high volume, high velocity and high variety. Thus, business insights
can be acquired that traditional solutions might miss. Analyzing data with Big Data ana-
lytics generally has to objectives: to understand relationships among features, and to
develop methods of data extraction that can predict future observations. These objec-
tives are reached through extensive methods such as data mining, data visualization,
statistical analysis, and machine learning. Furthermore, analytics can be performed on
certain levels, namely descriptive, predictive or prescriptive. While descriptive analytics
analyze events in the past, focus predictive analytics more on forecasting and predicting
future events. Prescriptive analytics combine both descriptive and prescriptive ap-
proaches, and automatically take actions based upon predicted outcomes. Big Data ana-
lytics as a whole is highly valuable for organizations in many ways. Firstly, it massively
improves anything involving customer interaction. Secondly, it supports the BI func-
tions by creating business insights, driving appropriate business changes, improving
planning, reporting and forecasting processes, as well as identifying root causes of cost.
Thirdly, it improves other analytical areas such as fraud detection, risk management and
market trends.
Big Data provides value creation opportunities in the forms of business model, product
and service innovation as well as optimization of current business practices. These value
creation ways are closely linked to the term data-drivenness, highlighting data as a key
resource. Data-driven business development facilitates the development of new data-
centric business models that mostly revolve around the sale of data. New service models
such as data-as-a-service and analytics-as-a-service provide access to a wide range of
data as well as analytical capabilities, and improve competitiveness by increasing sales
and profitability, operational efficiency and risk management procedures. Big Data has
greatly affected the creation of IoT. Information residing in the IoT can be used for de-
veloping next generation products and innovate service offerings, ultimately boosting
overall customer satisfaction. Organizational business practice improvement happens
through process optimization, customer relationship management, process innovation
and collaboration of employees, all facilitated by the recent trends of Big Data.
What are maturity models and the concepts behind them?
Maturity models area conceptual artefacts that allow organizations to have their meth-
ods and processes assessed according to best practices. Since the term “maturity” im-
plies an evolutionary progress from an initial to a desired stage, can maturity models be
described “to represent phases of increasing quantitative or qualitative capability chang-
es of a maturing element in order to assess capability advances with respect to defined
focus areas” (Kohlegger et al. 2009, p. 59). Maturing subjects can be generally grouped
into process maturity, object maturity, or people capability. A fundamental underlying
96
assumption for maturity modeling is that a higher maturity level is related to higher per-
formance, improved predictability, control and effectiveness.
It is observed that maturity models share common properties. These are usually a spe-
cific number of levels, a descriptor for each level, a generic description of the character-
istics of each level, a specific number of dimensions, a specific number of elements for
each dimensions, and a description of each activity as it might be performed at each
level of maturity. However, maturity models can be distinguished on several factors,
stemming from the decisions made during the model‟s development. Depending on the
purpose of use, maturity models can be divided into descriptive, prescriptive and com-
parative models. While descriptive models focus on assessing the current situation, are
prescriptive models giving out improvement activities and recommendations to achieve
a higher maturity state. Comparative models are the most advanced form of maturity
models and, in addition to descriptive-prescriptive functionality, provide benchmarking
functionality for comparing results against industry standards and best practices. Whilst
some maturity models have more of a general focus, do others focus on specific do-
mains. Domain-specific models provide detailed information for mature domains like
software engineering and information systems, but fall off when they are applied to new
and niche fields of actions. Maturity models can be generally divided into three groups
based on their composition and structure. Gird-like models are the simplest forms of
maturity models, usually consisting of a frame of textual descriptions. Likert-like mod-
els have additionally an assessment part in the form of a questionnaire. CMM-like mod-
els are the most complex type of maturity models, defining key practices and target
goals that support reaching an acceptable level of sophistication. CMM-like models are
compared to the famous Capability Maturity Model, a pioneer of maturity modeling in
the software development domain.
In the light of the benchmarking study, organizational Big Data maturity is considered
as the collective level of all maturing subjects present in the Big Data program of an
organization. In some definitions it is also considered as the evolution of an organiza-
tion to integrate and leverage available data sources, as well as assessing progress and
identifying relevant initiatives that improve progress. The maturing subjects of an or-
ganization can be anything from business users and processes to technical information
systems, which together make up the whole Big Data internal ecosystem. Hence, Big
Data maturity models are used to provide a tool for Big Data capability assessment and
to help guide development milestones. Furthermore, they are useful in communicating
the business goals and vision across the entire organization while at the same time
measuring and managing the speed of progress and adoption. Big Data maturity models
depict capability key areas as business dimensions. Dimensions differ slightly among
the models but some common themes can be identified such as data management, tech-
nology, process, governance, people, and organization. However, Big Data maturity
models have also been identified with weaknesses. Most of them are built on poor theo-
97
retical foundation and do not utilize standard and best practice methodologies. This re-
sults in poor documentation practices, lowering the reliability and applicability of the
models. Also, reaching the highest level of Big Data maturity requires major invest-
ments over many years, which might not be realistic to smaller business organizations.
What are the best practices for generic development and classification of maturity mod-
els?
The research identified several unique approaches for developing theoretically sound
maturity models. These proposals were selected through an extensive systematic litera-
ture review covering many articles from a variety of bibliographic databases. It was
noticed that most of the proposals were influenced by the guidelines of design science
research, a direction of research that focuses on building artefacts that support solving
organizational problems. Slight saturation of content was detected when moving from
the oldest to the newest paper, and later published proposals tended to reference the
earlier ones. This however was not an issue, since every proposal provided a unique
insight into the topic.
Analysis of the papers extracted two key problems that have existed in the maturity
model development landscape. Firstly, the maturity model development methodology
has not been fully standardized. Developers have difficulties to build reliable and gener-
alizable models without consistent guidelines and thus a generic methodology is need-
ed. Secondly, it was noted that maturity model developers have the tendency towards
poor documentation practices. The development processes should always be document-
ed in detail, considering each step of the process, the parties involved, the applied meth-
ods, and the testing results. This is to ensure that the model can be verified and validat-
ed. An answer to these two key problems was presented in the form of a generic maturi-
ty model development framework (figure 4.5), a consistent methodology for developing
maturity models based on the practices found in the systematic review. The framework
consists of four main phases, all split into several sub-phases. The four main phases
“definition of scope”, “development of model”, “evaluation” and “deployment and
maintenance” should be addressed in order, since previous decisions greatly influence
the following ones. The framework favors and encourages iterative decisions by offer-
ing re-design paths for certain main phases. Iterative development is of great importance
since it effectively supports error management as well making valuable adjustments in
the later phases of development. Each sub-phase of the framework depicts the develop-
ment decisions to be made. Maturity models should be built accordingly to the defined
maturing elements, purpose, focus, target domain and audience. These facilitate the de-
sign activities including structuring the model as well as populating it with content. The
model should be extensive, but still balanced to ensure the ease of application. Thus,
when designing the assessment methodology, developing materials and tools for assis-
tance should be considered. In order to develop a reliable model, it must be tested and
evaluated either internally or externally. Evaluation should target both form and func-

98
tion of the model, meaning that evaluation addresses the model schema as well as the
model‟s assessment method. Lastly, models should be under constant maintenance and
refinement, to keep up with the changing environment and practices.
To ensure the maturity models reliability and validity, the framework emphasizes on the
importance of documenting the decisions made within each sub-phase (as seen on the
left side of figure 4.5). Documentation practices provide evidence for testers and evalua-
tors to use, that might later turn into user acceptance. The decisions attributes and their
characteristics were later used to construct the classification system framework (figure
4.6). The classification system framework offers developers the possibility to classify
their models on the decision attributes. These attributes can then be searched by the end
users, resulting in greater retrievability and generalizability. While the majority of pa-
pers focused on development activities only, did the paper of Mettler et al. (2010) spe-
cifically focus on the classification of maturity models. The proposal of Mettler et al.
thus formed the basis of the framework, and was later on enhanced by decision attrib-
utes extracted from the development framework.
How can maturity models be evaluated and compared effectively?
To show that a maturity model is effective and usable to a good effect, it can be evaluat-
ed comparatively against other models. One form of comparison is normative compari-
son that highlights the best models among the alternatives in terms of defined criteria. A
method that fits the normative element of comparison is benchmarking. Thus bench-
marking was selected as the tool for measuring and comparing specific performance
indicators of the models. The benchmarking framework of Vezzetti et al. (2014) was
utilized in designing the benchmarking process for Big Data maturity model evaluation.
The selected framework highlights the strengths as well as the weaknesses of maturity
models by focusing on different model features such as general, design, and usage.
To align the benchmarking process with the objective of this research, variables for
evaluation had to be selected. Variables such as actuality, completeness, consistency,
relevancy, trustworthiness, comprehensibility, ease of use, performance and stability
complemented the research objectives and were used to create four distinct criteria
groups. The first three groups, namely “completeness of the model structure”, “the qual-
ity of model development and evaluation” and “ease of application”, all evaluated dif-
ferent aspects of good practices of maturity modeling. The fourth group “Big Data value
creation” evaluated how well Big Data business value creation ways were addressed.
After establishing the criteria groups, they were assigned accordingly with decision at-
tributes of the classification system framework. As a result, each attribute could then be
assigned with a numeric value, enabling quantitative benchmarking. The highly system-
atic and quantitative procedures of the benchmarking process ensure that the process is
reliable and that it can be replicated at any time.
99
What kinds of existing models measure organizational Big Data maturity and what dif-
ferences are there between them in terms of good practices of maturity modeling and
Big Data business value creation?
As a result of a strict screening process, eight Big Data maturity models were selected
to be included in the benchmarking process. The selection was made based on the avail-
ability meaning that evaluation targeted commercial-free models only, leaving out third
party assisted maturity assessment services. All selected models were developed inde-
pendently from each other, originating from distinct sources. One of the models origi-
nated from an educational background and was developed by TDWI (Halper & Krish-
nan 2013), while the rest were developed by business organizations and consultancies.
These business organizations included big names such as IBM, IDC and Strategy&, as
well as smaller players such as Infotech, Radcliffe Advisory Services, TNO and
Knowledgent group Inc.
The eight selected maturity models differed in terms of naming practices describing
themselves as tools, models, frameworks or assessments, but all represented an artefact
for assessing an organization's Big Data maturity level. The eight Big Data maturity
models were classified with the help of the classification system framework. This in-
cluded analyzing the models one by one and filling in characteristical information for
each decision attribute. As a result, the maturity models could be compared in terms of
characteristical differences. These decision attributes were later aggregated into four
distinct criteria groups. Thus, maturity model characteristics could be evaluated against
specific evaluation criteria. The four criteria groups that maturity models evaluated in
were ”completeness of the model structure”, ”quality of model development and evalua-
tion”, ”ease of application”, and ”Big Data business value creation.” The benchmarking
study experienced major differences in the first three criteria groups regarding good
practices of maturity modeling. For example, the quality of model development and
evaluation was almost non-existing in the majority of the evaluated models. Big Data
value creation ways on the other hand were addressed in a more balanced manner. On
the basis of the total benchmarking scores, three performance groups could be identi-
fied. In terms of good practices of maturity modeling and addressing Big Data business
value creation opportunities, maturity models were categorized as top-performers (2
models), mid-performers (2 models) and low-performers (4 models).
Main research question: What maturity models are the most useful to organizations for
determining and improving Big Data capabilities and ultimately creating business val-
ue?
In the light of the research results, there are clear differences in the overall performance
of the evaluated Big Data maturity models. Two models were clearly overshadowing
the rest, scoring relatively high in all criteria groups. The top-performing models in-
cluded Halper and Krishnan‟s (2013) “Big Data maturity model and assessment tool”

100
acquiring a total benchmarking score of 17.26, and IDC‟s (2013) “CSC Big Data ma-
turity tool” acquiring a total benchmarking score of 16.11 (out of the maximum of
23.00). They represent the models that the benchmarking process identified as the most
useful for organizational Big Data maturity assessment in terms of quality and business
value creation. Thus, it is logical to focus in more detail on the common features these
models share.
Both models scored high in the group “completeness of the model structure”, demon-
strating high quality of model structure, extensiveness and detail level. They are devel-
oped as descriptive-prescriptive-comparative models, assessing the current situation,
providing recommendations for improvement, and benchmarking the assessment results
across industry standards. However, industries are addressed on a more general level
and the industry benchmarks strictly depend on whether there is enough respondent
generated sampling available. The models share a common feature in composition in
that they are built as Likert-like questionnaires, providing assessment in forms of ques-
tions. These ca. 80 questions are asked across five primary business dimensions, cover-
ing a wide area of Big Data capabilities. In addition to the five primary business dimen-
sions, Halper and Krishnan (2013) embed five additional dimensions/factors within the
questionnaire that consider BI, cloud and outsourcing related activities. Big Data ma-
turity is presented at five distinct levels, presenting a progress from the lowest level of
organizational Big Data capabilities to the highest. In addition, Halper and Krishnan add
a sixth “non-existing” level between the third and fourth primary level. Adding a non-
existing level to a maturity model demonstrates deepening understanding of the situa-
tion as it can identify crucial time-consuming phases and assist in smoothly transition-
ing over problematic barriers. It is important to keep the structure of a maturity model
balanced, comprising of both simple and complex features. This ensures that a sufficient
coverage of content is provided, but in a timely manner.
The overall poor results for the criteria group ”quality of development and evaluation”
confirm the statements found in the systematic review, namely that maturity model de-
velopers document their development practices in a dissatisfactory manner. In most cas-
es, information for development quality characteristics was simply not available. How-
ever, the top-performers Halper and Krishnan (2013) and IDC (2013) redeem them-
selves by having documentation available for the ways in which the maturity model was
designed, tested and maintained. As suggested by the generic development framework,
model development should be conducted iteratively. This is the case for Halper and
Krishnan, them stating that best practices are iteratively added to the maturity model as
practitioners learn more about what companies are doing to succeed in their Big Data
efforts. To ensure the reliability and generalizability of the model, it has to be tested
internally and evaluated externally. As the assessment for both models is conducted via
a web interface, the maturity model reaches a wide number of end users. As of 2014, a
total of 600 respondents have tested the model of Halper and Krishnan, moving it closer

101
towards public acceptance. For IDC, the total number of respondents is even higher
providing benchmarks against a sampling of 2000 respondents. However, there was no
clear indicator on whether the model has ownership of an official verification, valida-
tion or certification status. The maintenance of the models is designed in the way that
evolution is continuous. This means that the maturity models are constantly evaluated
and refined to keep up with the changing Big Data environment and practices. Mainte-
nance of a model should be targeted to both form and functioning of the model, focus-
ing on the maintenance of both model schematic content and the assessment instrument.
To ensure that the Big Data maturity model is easy to use, the end user has to be guided
and provided with assistance throughout the whole assessment process. The Likert-like
composition of the models indicates that there is a clear assessment instrument to meas-
ure the maturity level. In both models, the assessment instrument was in the form of a
software assisted questionnaire. Having designed the assessment as software assisted is
advantageous to the end user, since a software tool is intuitive and provides assistance
throughout the assessment process. In both cases maturity assessment is perceived as
evolutionary, letting the assessing organization to adjust its answers as changes in capa-
bilities are occurring. Software assessment tools are efficient as they can be published to
a large number of end users, gathering and analyzing assessment data for benchmarking
purposes. In addition to the software assessment tool, end users were supported with
virtual handbooks to better interpret the assessment scores. Another aspect of easy ap-
plication is the way results are presented. Visualizing the scores as interactive charts
increases understandability and comprehensibility. Furthermore, when prescriptive
models give out recommendation, the practicality of these recommendations should be
explicit rather than implicit and give out detailed information about improving the cur-
rent level of Big Data capabilities.
The focus of the models is domain-specific, addressing Big Data essential themes and
topics. While more generic models can be generalized to multiple domains, are these
not prepared to capture domain-specific issues. In the case of Big Data, issues include
poorly managed competences and talent as well as data governance in terms of privacy
and security concerns. Halper and Krishnan (2013), and IDC (2013) clearly state that
their model‟s intention is to serve the needs of both managerial and technical people.
This is important since a Big Data ecosystem can only be operated efficiently in co-
operation of both technicians and management. Technology enables business goals and
visions, and vice versa. Maturing subjects in Big Data include all three generally
acknowledged groups including people capabilities (eg. technical and managerial com-
petences), process maturity (eg. analytics, data management, data governance) as well
as object maturity (eg. infrastructure, data stores). All these subjects are addressed well
in both models and they are distributed across the business dimensions. Halper and
Krishnan (2013) present dimensions as organization, infrastructure, data management,
analytics and governance, while DC (2013) group dimensions into intent, data, technol-

102
ogy, people and process. This research identified 24 different domain capabilities for an
organizational Big Data program, including Big Data business value creation opportuni-
ties as well as technological and organizational components. Big Data maturity models
are required to include these capabilities in the their assessment, since they represent the
current means of achieving a Big Data maturity level that contributes to increased com-
petiveness and business value creation. Both Halper and Krishnan (2013), and IDC
(2013) sufficiently address the main Big Data value creation ways including data trans-
parency, customer segmentation, advanced data-driven analytics, and business model
innovation. Data transparency is achieved through Big Data management, aligned with
aspect such as data quality, data governance and data automation. Customer segmenta-
tion enables analyzing the behaviors of customers and targeting adverts towards micro
segmented groups. The value of customer segmentation ultimately comes from utilizing
data from Big Data type networks. Social networking data was in both models ad-
dressed well, but there is still room for improvement in terms of including an IoT focus.
Data-driven analytics positively impact the decision making process, support BI/DW
related functions, and are achieved by data mining and data visualization tools. Lastly,
business model innovation enables innovating completely new products and services,
also regarding the optimization of current business practices.
In addition to value creation ways, trending Big Data technological solutions including
Hadoop, NoSQL and cloud computing as well as organizational solutions such as prop-
er talent management and cost-effectiveness strategies contribute to the increase of or-
ganizational Big Data maturity. Technological components were especially well-
addressed in the model of Halper and Krishnan, involving several Hadoop and cloud
centric assessment questions. On the other hand, IDC achieved high quality assessment
for organizational components, broadly addressing the degree of skill and qualification
possession.
6.2 Critical evaluation of the research
To ensure the trustworthiness and quality of the results, the research is critically evalu-
ated in terms of reliability and validity. Fundamentally, reliability “concerns the extent
to which an experiment, test, or any measuring procedures yields the same results on
repeated trials” (Carmines & Zeller 1979, p. 11). In other words, reliability is the ten-
dency towards consistency found in repeated measurements of the same phenomenon
(ibid). Kirk and Miller (in Saaranen-Kauppinen & Puusniekka 2006, pp. 25-26) divide
reliability into three categories: quixotic, diachronic and synchronic reliability. Quixotic
reliability measures whether a research method is trustworthy and consistent, diachronic
reliability measures whether research results will remain stable over time, and synchron-
ic reliability measures whether research results are logical and consistent when collect-
ing them at the same point of time but using a different instrument (ibid). Validity on
the other hand concerns the degree to which obtained research arguments, interpreta-

103
tions and results measure what they are intended to measure. Validity ensures that the
results of the research can be utilized effectively and credibly in further scenarios. Vari-
ables that may threaten validity should be controlled as much as possible. (Saaranen-
Kauppinen & Puusniekka 2006, p. 25.) Validity can be generally divided into internal
and external validity. Internal validity evaluates the internal logic and possible contra-
dictions of the research, while external validity ensures that the research findings are
generalizable and applicable outside the confines of the selected study. Furthermore, a
third form of validity, namely construct validity, is often addressed. Construct validity
measures whether the research data collection is based on a logical process that main-
tains consistency from the research question to conclusions. (Yin 2009.) The evaluation
of reliability and validity supports understanding the complex issues of measurement in
both theoretical and applied research settings. Reliability is generally more of an empir-
ical issue focusing on the performance of empirical measures, while validity focuses on
theoretically oriented issues. These two factors are independent from each other and
therefore it is possible that a research can be reliable without being valid, or vice versa.
However, a research is said to be complete and successful only when it meets both crite-
ria. (Carmines & Zeller 1979, pp. 9-13.)
The total reliability of this research is perceived as very good. The quixotic reliability of
this research is good due to the systematic and highly structured data collection and
analysis methods. The concepts and definitions introduced in the theoretical background
stem from a wide range of literature sources, resulting in little or no reference bias. As
the research advances to the systematic literature review part in chapter 4, all methods
from selecting the bibliographic databases to synthesizing the results are strictly and
precisely documented. This also includes documenting the point of time when the col-
lection process was conducted. Documenting the systematic review procedures ensures
that the review can be repeated, with the same information sources and restrictions. The
benchmarking process in chapter 5 is also highly reliable, since it employees quantita-
tive means against pre-defined criteria. The diachronic reliability of this study is a little
lower. New maturity models are constantly published and existing ones are refined ac-
cording to domain changes. Thus, the selection of maturity models for the benchmark-
ing process and benchmarking results may be completely different in a few years.
Achieving high diachronic reliability would require conducting the benchmarking pro-
cess every few years. However, it can be argued that all research can be associated with
lower diachronic reliability since change is natural and it will always happen in every
examined subject. Synchronic reliability for this research can be predicted as good. The
systematic review was conducted with the procedure model of Fink (2005), a highly
cited and broadly accepted tool for systematic literature reviews. Fink‟s process em-
ploys good practices for gathering information from valuable sources as well as other
aspects that must be present in a systematic review.

104
The internal validity of this research is somewhat difficult to evaluate, since arguments
are always presented form the perspective of an individual researcher. However, this
research does not employ an empirical data collection part, and all arguments are based
on existing high quality information sources. Thus, internal validity can be viewed as
the strongest in the literature review parts of the research. Some internal validity issues
can be identified relating to the quality of presented arguments and possible contradic-
tions in the benchmarking part. The Big Data maturity models are evaluated on textual
descriptions only, not relying on a practical assessment. The assumptions made for the
attributes related to practicality and application may thus have a connection to decreased
internal validity. Furthermore, the attribute scoring process for every Big Data maturity
model is prone to errors. Valuable aspects could be missed by the evaluator due to mis-
conceptions or biased opinions.
The external validity of this research as a whole can be considered good. The intent of
the systematic review was to cover as many relevant papers as possible to establish a
generic maturity model development and classification system framework. To ensure
external validity throughout the systematic review, every step of the review, including
the data collection and screening process, were explicitly defined. Nevertheless, it is
very likely that some valuable articles have been left out. This is related to the loosely
based inclusion criteria “cited over 0 times.” The criteria was chosen for practical rea-
sons to conduct the systematic review in a timely manner, but ultimately resulted in the
exclusion of newer and lesser-known papers. Hence, this research cannot guarantee
completeness of the results but can still be trusted to give a good overview of best prac-
tices of maturity modeling. Furthermore, the maturity model development framework
and the classification system framework are designed as generic methodologies. This
means, that the generalizability of these methodologies is high and they can be applied
in any possible domain. In addition, using a broad classification system framework
helps the developer to document the development procedures of the maturity model as
well as reduce the irretrievability issues that occur for end users. However, Mettler et al.
(2010) have argued that there should be as few attributes as possible present in a classi-
fication system. The classification system framework for this research consists of a
much greater number of attributes than the proposal of Mettler and his team. This is
because the classification system framework was constructed in the light of utilizing it
for benchmarking purposes. Thus, it suffers a bit in external validity when applying it to
pure classification purposes only. The benchmarking framework can be adapted for dif-
ferent maturity model evaluation scenarios by just applying different evaluation criteria.
This argument is backed up by the fact that the first iteration of the benchmarking
framework stems from the PLM research of Vezzetti et al. (2014), but was here success-
fully applied to the Big Data domain. Benchmarking results for the Big Data maturity
models are intended to support organizations to choose the most appropriate ones for
maturity assessment in terms of good maturity modeling practices and Big Data busi-
ness value creation. This is ultimately done by examining the top performers of the

105
benchmarking process and especially their characteristics in general. Thus, external va-
lidity qualifies as good due for benchmarking results.
The construct validity of this research meets the standard research requirements. The
research is structured logically so that objectives, limitations and scope guide the selec-
tion of methodological assumptions. The methodology consists of first selecting the
appropriate philosophical assumptions that support selecting the right research strategy.
The strategic choices ultimately guide in choosing the data collection and analysis
methods. The research employs a deductive approach, meaning that the benchmarking
process is built on existing theoretical assumptions found in literature sources. The re-
search sub-questions are designed so that as they unfold one by one, enough infor-
mation is gathered to ultimately provide an answer to the main research question.
6.3 Suggestions for future research
The field of Big Data and Big Data maturity models is constantly changing. Old models
are under constant refinement and new models are developed in a rapid manner. This
opens up further research opportunities.
One key research opportunity regards the ways Big Data can be utilized in business val-
ue creation. The Big Data domain as of today is still fairly new, but acceptance will
without a doubt increase during the following years. As Big Data becomes part of eve-
ryday business activities, are business and technological solutions also evolving and
improving. The evolution of Big Data will present new ways of creating business value.
These new business value creation opportunities can be, for example in the frame of
benchmarking studies, be used in defining benchmarking evaluation criteria. Thus, fu-
ture research should focus on the changes in ways of Big Data business value creation.
It would be also meaningful to conduct a new benchmarking study for Big Data maturi-
ty models during the following years to evaluate the newcomer models, as well as re-
evaluate the old models in respect to evolutionary changes. This would give insight on
how maturity modeling practices change in the domain of Big Data. The target of eval-
uation could also be how well maturity model developers have improved their docu-
mentation practices or whether standard and consistent development methodologies are
used.
Maturity between two segments may vary greatly. For example, Big Data maturity ca-
pabilities in the core organization may be vastly different than their partner organiza-
tions. It was noted, that current Big Data maturity models did not focus on this issue and
mostly treated Big Data maturity as the internal capabilities of an organization. Future
research is thus required keep track on models that consider the relationships between
different capability levels, and how to integrate the Big Data landscape between all rel-
evant organizational segments and third party vendors.

106
REFERENCES
ACM. 2014. What is ACM? ACM Inc. official website. Available at:
http://www.acm.org/about [Accessed on: 10.12.2014].
Agrawal, D., Das, S. & El Abbadi, A. 2011. Big data and cloud computing: Current
state and future opportunities. Proceedings of the 14th International Conference on Ex-
tending Database Technology. pp. 530-533.
Ahmed, F. & Capretz, L. 2011. A business maturity model of software product line en-
gineering. Information Systems Frontiers. Vol. 13, No. 4, pp. 543-560.
Alanko, M. & Salo, I. 2013. Big data in Finland. Publications of Finland‟s Ministry of
Transport and Communications 25/2013. Available at:
http://www.lvm.fi/docs/fi/2497123_DLFE-21601.pdf [Accessed on: 04.12.2014].
Andrade, P., Hemerly, J., Recalde, G. & Ryan, P. 2014. From big data to big social and
economic opportunities: Which policies will lead to leveraging data-driven innovation‟s
potential? In The Global Information Technology Report 2014. World Economic Fo-
rum, Geneva. pp. 81-86.
APGM. 2014. What is a maturity model, and why use one? APGM International official
website. Available at: http://www.apmg-international.com/en/consulting/what-maturity-
model.aspx [Accessed on 20.12.2014].
Aslett, M. 2011. How will the database incumbents respond to NoSQL and NewSQL.
White Paper, The 451 Group, San Francisco. Available at:
https://cs.brown.edu/courses/cs227/archives/2012/papers/newsql/aslett-newsql.pdf [Ac-
cessed on: 04.12.2014].
Awadallah, A. 2009. How Hadoop revolutionized data warehousing at Yahoo and Fa-
cebook. Proceedings of TDWI BI Executive Summit. Available at:
http://www.slideshare.net/awadallah/how-hadoop-revolutionized-data-warehousing-at-
yahoo-and-facebook [Accessed on 06.12.2014].
Banerjee, C., Kundu, A., Bhaumik, S., Babu, R. & Dattagupta, R. 2012. Framework on
service based resource selection in cloud computing. International Journal of Infor-
mation Processing and Management. Vol. 3, No. 1, pp. 17-25.
Becker, J., Knackstedt, R. & Pöppelbuß, J. 2009. Developing maturity models for IT
management. Business & Information Systems Engineering. Vol. 1, No. 3, pp. 213-222.
Becker, J., Pöppelbuß, J., Niehaves, B. & Simons, A. 2010. Maturity models in infor-
mation systems research: Literature search and analysis. Proceedings of the 18th Euro-
pean Conference on Information Systems, Pretoria. pp. 1-12.
Beardsley, S., Enriquez, L., Grijpink, F., Sandoval, S., Spittaels, S. & Strandell-Jansson,
M. 2014. Building trust: The role of regulation in unlocking the value of big data. In

107
The Global Information Technology Report 2014. World Economic Forum, Geneva. pp.
73-80.
Berg, B. 2004. Qualitative research methods for the social sciences. 5th
ed. Pearson,
Toronto. 400 p.
Bertolucci, J. 2013. Big data analytics: descriptive vs. predictive vs. prescriptive. Infor-
mation Week official website. Available at: http://www.informationweek.com/big-
data/big-data-analytics/big-data-analytics-descriptive-vs-predictive-vs-prescriptive/d/d-
id/1113279 [Accessed on: 17.12.2014].
Betteridge, N. & Nott, C. 2014. Big data and analytics maturity model. IBM official
website. Available at: http://www.ibmbigdatahub.com/blog/big-data-analytics-maturity-
model [Accessed on: 07.03.2015].
Biehn, N. 2013. Realizing big data benefits: The intersection of science and customer
segmentation. Innovation Insights, official website of Wired. Available at:
http://insights.wired.com/profiles/blogs/realizing-big-data-benefits-the-intersection-of-
science-and#axzz3VsLihODs [Accessed on: 16.12.2014].
Bilbao-Osorio, B., Dutta, S. & Lanvin, B. 2014. Executive summary. In The Global
Information Technology Report 2014. World Economic Forum, Geneva.
Booth, A., Papaioannou, D. & Sutton, A. 2012. Systematic approaches to a successful
literature review. 1st ed. SAGE Publications Ltd, England. 288 p.
Boughzala, I. & de Vreede, G. 2012. A collaboration maturity model: Development and
exploratory application. Proceedings of the 45th Hawaii International Conference on
System Science, Maui. pp. 306-315.
Bown, M. & Sutton, A. 2010. Quality control in systematic reviews and meta-analyses.
European Journal of Vascular and Endovascular Surgery. Vol. 40, No. 5, pp. 669-677.
De Bruin, T., Freeze, R., Kaulkarni, U. & Rosemann, M. 2005. Understanding the main
phases of developing a maturity assessment model. Proceedings of the 13th European
Conference on Information Systems, Regensburg.
Carmines, E. & Zeller, R. 1979. Reliability and validity assessment. Vol. 17. SAGE
Publications Ltd. 71 p.
Carson, D., Gilmore, A., Perry, C., & Gronhaug, K. 2001. Qualitative marketing re-
search. 1st ed. SAGE Publications Ltd, London. 256 p.
Cattell, R. 2010. Scalable SQL and NoSQL data stores. ACM SIGMOD Record. Vol.
39, No. 4, pp. 12-27.
Ciobo, M., Miller, J., Wall, D., Evans, H., Yadav, A., Hagen, C. & Khan, K. 2013. Big
data and the creative destruction of today's business models. A.T. Kearny consulting
report. Available at:
http://www.atkearney.com/documents/10192/698536/Big+Data+and+the+Creative+Des

108
truction+of+Todays+Business+Models.pdf/f05aed38-6c26-431d-8500-d75a2c384919
[Accessed on: 03.03.2015].
Cloudera. 2014. Introduction to YARN and MapReduce 2. Cloudera official website.
Available at:
http://www.cloudera.com/content/cloudera/en/resources/library/recordedwebinar/introd
uction-to-yarn-and-mapreduce-2-slides.html [Accessed on: 05.12.2014].
CRD – Centre for Reviews and Dissemination. 2009. Systematic reviews: CRD‟s guid-
ance for undertaking reviews in health care. 1st ed. University of York, York. 281 p.
Crosby, P. 1979. Quality is free: The art of making quality certain. McGraw-Hill, New
York. 309 p.
Crowther, M., Lim, W. & Crowther, M.A. 2014. Systematic review and meta-analysis
methodology. Blood. Vol. 116, No. 17, pp. 3140-3146.
Cutts, J. 2014. Ghost in the machine: The predictive power of big data analytics. Con-
sumer Electronics Association official website. Available at:
http://www.ce.org/i3/Features/2014/September-October/Ghost-in-the-Machine-The-
Predictive-Power-of-Big-D.aspx [Accessed on: 17.12.2014].
Datameer. 2014. Customer segmentation. Datameer Inc. official website. Available at:
http://www.datameer.com/solutions/usecases/customer-segmentation.html [Accessed on
16.12.2014].
Davenport, T. 2014. How strategists use “big data” to support internal business deci-
sions, discovery and production. Strategy & Leadership. Vol. 42, No. 4, pp. 45-50.
Delgado, R. 2014. Applications of big data in customer segmentation. Data Science
Central official website. Available at:
http://www.datasciencecentral.com/profiles/blogs/applications-of-big-data-in-customer-
segmentation [Accessed on 16.12.2014].
Denzin N. & Lincoln, Y. 2011. The SAGE Handbook of Qualitative Research. 4th
ed.
SAGE Publications Ltd, England. 784 p.
Devine, F. 2002. Qualitative methods. Theory and methods in political science. 2nd
ed.
Palgrave Macmillan, New York. pp. 197-215.
Devlin, B., Rogers S. & Myers. J. 2012. Big data comes of age. EMA and 9sight Con-
sulting Report. Available at: http://www-
03.ibm.com/systems/hu/resources/big_data_comes_of_age.pdf [Accessed on:
15.12.2014].
DSSR – Decision Support System Resources. 2014. Hype cycle for big data 2014. De-
cision Support System Resources official website. Available at:
http://www.dssresources.com/news/4137.php [Accessed on: 29.02.2015].

109
EBSCO. 2014. About EBSCO. EBSCO Industries Inc. official website. Available at:
https://www.ebsco.com/no/om [Accessed on: 10.12.2014].
El-Darwiche B., Koch, V., Meer, D., Shehadi R. & Tohme, W. 2014. Big data maturity:
An action plan for policymakers and executives. In The Global Information Technology
Report 2014. World Economic Forum, Geneva. pp. 43-51.
Elsevier. 2014. Scopus: An eye on global research. Elsevier B.V. official website.
Available at: http://www.elsevier.com/online-tools/scopus [Accessed on 10.12.2014].
Eppler, M. 2014. Glossary: Information quality. International Association for Infor-
mation and Data Quality official website. Available at:
http://iaidq.org/main/glossary.shtml [Accessed on: 15.12.2014].
Fink, A. 2005. Conducting research literature reviews: From the internet to paper. 2nd
ed. SAGE Publications Ltd, Thousand Oaks. 280 p.
Fraser, P., Moultrie, J. & Gregory, M. 2002. The use of maturity models/grids as a tool
in assessing product development capability. Proceedings of the International Engineer-
ing Management Conference, Cambridge. pp. 244-249.
Fox, S. & Do, T. 2013. Getting real about big data: Applying critical realism to analyse
big data hype. International Journal of Managing Projects in Business. Vol. 6, No. 4, pp.
739-760.
Gartenberg, A. 2011. Bringing smarter computing to big data. Smarter computing builds
a smart planet: 2 in a series, official website of IBM. Available at:
http://www.ibm.com/smarterplanet/global/files/us__en_us__smarter_computing__ibm_
data_final.pdf [Accessed on 10.12.2014].
Gartner. 2014a. Gartner IT glossary: Big data. Gartner Inc. official website. Available
at: http://www.gartner.com/it-glossary/big-data [Accessed on: 17.11.2014].
Gartner. 2014b. Gartner IT glossary: Business intelligence. Gartner Inc. official website.
Available at:
http://www.gartner.com/it-glossary/business-intelligence-bi [Accessed on: 15.12.2014].
Gartner. 2014c. Gartner IT glossary: Internet of things. Gartner Inc. official website.
Available at: http://www.gartner.com/it-glossary/internet-of-things/ [Accessed on:
19.12.2014].
Ghauri, P. & Grønhaug, K. 2005. Research methods in business studies: A practical
guide. 3rd
ed. Pearson, England. 257 p.
Gill, J. & Johnson, P. 2002. Research methods for managers. 3rd
ed. SAGE Publishing
Ltd, London. 288 p.
Google. 2014. Google Scholar: Stand on the shoulders of giants. Google Scholar official
website. Available at: https://scholar.google.com/intl/en/scholar/about.html [Accessed
on: 10.12.2014].

110
Goss, R. & Veeramuthu, K. 2013. Heading towards big data: Building a better data
warehouse for more data, more speed, and more users. Proceedings of 24th
Annual
SEMI Advanced Semiconductor Manufacturing Conference, New York. pp. 220-225.
Grimes, S. 2013. Big data: Avoid “wanna V” confusion. Information Week official
website. Available at: http://www.informationweek.com/big-data/big-data-
analytics/big-data-avoid-wanna-v-confusion/d/d-id/1111077 [Accessed on: 25.11.2014].
Gummesson, E. 2003. All research is interpretative! Journal of Business & Industrial
Marketing. Vol. 18, No. 6/7, pp. 482-492.
Gupta, A. 2014. Making big data something more than the “next big thing”. In The
Global Information Technology Report 2014. World Economic Forum, Geneva. pp. 87-
93.
Gustafson, T. & Fink, D. 2013. Winning within the data value chain. Strategy and Inno-
vation newsletter. Vol. 11, No. 2. Available at: http://www.innosight.com/innovation-
resources/strategy-innovation/winning-within-the-data-value-chain.cfm [Accessed on:
10.12.2014].
Hackathorn, R. 2004. The BI watch real-time to real-value. DM Review. pp. 1-4.
Hadoop. 2014. What Is Apache Hadoop? Hadoop official website. Available at:
https://hadoop.apache.org/ [Accessed on: 04.12.2014].
Hain, S. & Back, A. 2011. Towards a maturity model for e-collaboration-a design sci-
ence research approach. Proceedings of the 44th Hawaii International Conference on
System Sciences, Kauai. pp. 1-10.
Halper, F. & Krishnan, K. 2013. TDWI Big data maturity model guide: Interpreting
your assessment score. TDWI research. Available at:
http://www.pentaho.com/sites/default/files/uploads/resources/tdwi_big_data_maturity_
model_guide_2013.pdf [Accessed on: 13.11.2011].
Halper, F. 2014. Three interesting results from the big data maturity assessment. TDWI
Blog, official website of The Data Warehouse Institute. Available at:
http://tdwi.org/Blogs/TDWI-Blog/2014/10/The-Big-Data-Maturity-Assessment-Three-
Results-Worth-Noting.aspx [Accessed on: 08.04.2015].
Hamel, F., Herz, T., Uebernickel, F. & Brenner, W. 2013. IT evaluation in business
groups: A maturity model. Proceedings of the 28th Annual ACM Symposium on Ap-
plied Computing, Portugal. pp. 1410-1417.
Hartmann, P., Zaki, M., Feldmann, N. & Neely, A. 2014. Big data for big business? A
taxonomy of data-driven business models used by start-up firms. Proceedings of Cam-
bridge Service Alliance, University of Cambridge.

111
Hashem, I., Yaqoob, I., Anuar, N., Mokhtar, S., Gani, A. & Khan S. 2015. The rise of
“big data” on cloud computing: Review and open research issues. Information Systems.
Vol. 47, pp. 98-115.
Helgesson, Y., Höst, M. & Weyns, K. 2012. A review of methods for evaluation of ma-
turity models for process improvement. Journal of Software: Evolution and Process.
Vol. 24, No.4, pp. 436-454.
Herodotou, H., Lim, H., Luo, G., Borisov, N., Dong, L., Cetin, F. & Babu, S. 2011.
Starfish: A self-tuning system for big data analytics. Proceedings of The biennial Con-
ference on Innovative Data Systems Research. Vol. 11, pp. 261-272.
Hevner, A., March, S., Park, J. & Ram, S. 2004. Design science in information systems
research. MIS quarterly. Vol. 28, No. 1, pp. 75-105.
Hirsjärvi, S., Remes, P. & Sajavaara, P. 2004. Tutki ja kirjoita. 10th ed. Tammi, Helsin-
ki. 464 p.
Hortonworks. 2014. What is Hadoop?: MapReduce. Hortonworks official website.
Available at: http://hortonworks.com/hadoop/mapreduce/ [Accessed on: 05.12.2014].
IBM. 2013. Business analytics for big data: Unlock value to fuel performance. White
Paper, IBM. Available at:
http://public.dhe.ibm.com/common/ssi/ecm/yt/en/ytw03329usen/YTW03329USEN.PD
F [Accessed on: 17.12.2014].
IBM. 2014. What is Hadoop? IBM official website. Available at: http://www-
01.ibm.com/software/au/data/infosphere/hadoop/ [Accessed on: 05.12.2014].
IDC. 2013. CSC Big data maturity tool. Originally developed by IDC, CSC official
website. Available at: http://csc.bigdatamaturity.com/ [Accessed on: 17.03.2015].
IEEE. 2014. About IEEE Xplore Digital Library. IEEE official website. Available at:
http://ieeexplore.ieee.org/xpl/aboutUs.jsp [Accessed on 10.12.2014].
Infotech. 2013. Big data maturity assessment tool. Info-Tech Research Group official
website. Available at:
http://www.infotech.com/research/it-big-data-maturity-assessment-tool [Accessed on:
17.03.2015].
IRIS Group. 2013. Big Data as a growth factor in Danish business: Potentials, barriers
and business policy implications. White Paper, Danish Business Authority. Available at:
https://erhvervsstyrelsen.dk/sites/default/files/big-data-as-a-growth-factor-in-Danish-
Business.pdf [Accessed on: 03.02.2015].
Janssen, C. 2014. MapReduce. Techopedia official website. Available at:
http://www.techopedia.com/definition/13816/mapreduce [Accessed on: 05.12.2014].
Jetmarova, B. 2011. Comparison of best practice benchmarking models. Problems of
Management in the 21th Century. Vol. 2, pp. 76-84.

112
Johnson, M. 2012. Service level management: What you need to know for IT operations
management. 1st ed. Emereo Publishing. 518 p.
Kandawal, N. 2014. Deployment models in cloud computing. Blog post. Available at:
http://naveenkandwal.blogspot.fi/2014/02/deployment-model-in-cloud-computing-
4d.html [Accessed on: 05.12.2014].
Kasanen, E., Lukka, K. & Siitonen, A. 1991. Konstruktiivinen tutkimusote liiketa-
loustieteessä. Finnish Journal of Business Economics, Vol. 3, pp. 301–327.
Kaur, J. 2014. Comparative study of Capability Maturity Model. International Journal
of Advanced Research in Computer Science & Technology. Vol. 2, No. 1, pp. 47-49.
Khan, N., Yaqoob, I., Hashem, I., Inayat, Z., Ali, W., Alam, M., Shiraz, M. & Gani, A.
2014. Big data: Survey, technologies, opportunities, and challenges. The Scientific
World Journal. Vol. 2014, pp. 1-18.
Kimball, R. & Caserta, J. 2004. The data warehouse ETL toolkit. 1st ed. Wiley Publish-
ing Inc., Indiana. 528 p.
King‟s College. 2014. Systematic reviews. Library Services of King‟s College, London.
Available at: http://www.kcl.ac.uk/library/help/documents/Systematic-Review-User-
Guide.pdf [Accessed on: 05.01.2015].
Knowledgent. 2014. Big data maturity assessment. Knowledgent Group Inc. official
website. Available at: https://bigdatamaturity.knowledgent.com [Accessed on:
17.03.2015].
Kohlegger, M., Maier, R. & Thalmann, S. 2009. Understanding maturity models: Re-
sults of a structured content analysis. Proceedings of I-KNOW ‟09 and I-SEMANTICS
‟09, Graz. pp. 51-61.
Krishnan, K. 2014. Measuring maturity of big data initiatives. IBM Data magazine offi-
cial website. Available at: http://ibmdatamag.com/2014/09/measuring-maturity-of-big-
data-initiatives/ [Accessed on: 04.01.2015].
Lahrmann, G., Marx, F., Mettler, T., Winter, R. & Wortmann, F. 2011. Inductive design
of maturity models: Applying the Rasch algorithm for design science research. In Ser-
vice-Oriented Perspectives in Design Science Research, Springer, Berlin. pp. 176-191.
Laney, D. 2001. Application delivery strategies. Meta Group Inc., official website of
Gartner. Available at: http://blogs.gartner.com/doug-laney/files/2012/01/ad949-3D-
Data-Management-Controlling-Data-Volume-Velocity-and-Variety.pdf [Accessed on:
20.10.2014].
LaValle, S., Lesser, E., Shockley, R., Hopkins, M. & Kruschwitz, N. 2011. Big data,
analytics and the path from insights to value. MIT Sloan Management Review. Vol. 52,
No. 2, pp. 21-31.

113
Lee, K., Lee, Y., Choi, H., Chung, Y. & Moon, B. 2012. Parallel data processing with
MapReduce: A survey. ACM SIGMOD Record. Vol. 40, No. 4, pp. 11-20.
Lemke, M., Plisko, V. & Kasprzyk, D. 2001. Benchmarking the performance of statisti-
cal agencies. Proceedings of Statistics Canada Symposium. pp. 1-9.
Lo, F. 2014. Big data technology. DataJobs official website. Available at:
https://datajobs.com/what-is-hadoop-and-nosql [Accessed on: 20.11.2014].
Lukka, K. 2001. Konstruktiivinen tutkimusote. Metodix official website. Available at:
http://www.metodix.com [Accessed at: 22.03.2015].
Lähdesmäki, T., Hurme, P., Koskimaa, R., Mikkola, L. & Himberg, T. 2014.
Menetelmäpolkuja humanisteille. Jyväskylä university, faculty of arts. Available at:
http://www.jyu.fi/mehu [Accessed on: 22.09.2014].
Manyika, J., Chui, M., Brown, B., Bughin, J., Dobbs, R., Roxburgh, C., & Byers, A.
2011. Big data: The next frontier for innovation, competition, and productivity. White
Paper, McKinsey Global Institute. Available at:
http://www.mckinsey.com/~/media/McKinsey/dotcom/Insights%20and%20pubs/MGI/
Re-
search/Technology%20and%20Innovation/Big%20Data/MGI_big_data_full_report.ash
x [Accessed on: 09.12.2014].
Maxwell, J. & Mittapalli, K. 2008. Explanatory Research. In The SAGE encyclopedia
of qualitative research methods. SAGE Publications Ltd, California. pp. 323-324.
McAfee, A. & Brynjolfsson, E. 2012. Big data: The management revolution. Harvard
business review. Vol. 90, No. 10, pp. 60-66.
McNabb, D. 2004. Research methods for political science: Quantitative and qualitative
methods. 1st ed. M.E. Sharpe Inc., New York. 448 p.
Mell, P. & Grance, T. 2011. The NIST definition of cloud computing. National Institute
of Standards and Technology official website. Available at:
http://csrc.nist.gov/publications/nistpubs/800-145/SP800-145.pdf [Accessed on:
05.12.2014].
Merriam-Webster 2015. Merriam-Webster online dictionary. Available at:
http://www.merriam-webster.com/ [Accessed on: 02.03.2015].
Mettler, T. 2009. A design science research perspective on maturity models in infor-
mation systems. Technical Report BE IWI/HNE/03. Universität St. Gallen, St. Gallen.
Available at:
http://www.researchgate.net/profile/Tobias_Mettler/publication/44939433_A_Design_S
cience_Research_Perspective_on_Maturity_Models_in_Information_Systems/links/0de
ec534f922e719c6000000.pdf [Accessed on: 16.01.2015].
Mettler, T. 2010. Thinking in terms of design decisions when developing maturity mod-
els. International Journal of Strategic Decision Sciences. Vol. 1, No. 4, pp. 1-12.

114
Mettler, T., Rohner, P. & Winter, R. 2010. Towards a classification of maturity models
in information systems. In Management of the Interconnected World, Physica-Verlag
HD, Berlin. pp. 333-340.
Million, M. 2014. Customer segmentation in the age of big data. White Paper,
FullSurge. Available at:
http://www.fullsurge.com/sites/default/files/07)%20Segmentation%E2%80%94Segmen
tation%20in%20the%20Age%20of%20Big%20Data%20.pdf [Accessed on:
15.12.2014].
Moeen, F., Mumtaz, R. & Khan A. 2008. Writing a research proposal. Pakistan Oral
and Dental Journal. Vol. 28, No. 1, pp. 145-152.
Moniruzzaman, A. & Hossain, S. 2013. Nosql database: New era of databases for big
data analytics-classification, characteristics and comparison. International Journal of
Database Theory and Application. Vol. 6, No. 4, pp. 1-14.
Mosley, M. 2007. Data management body of knowledge (DMBOK) guide. DAMA In-
ternational official website. Available at: http://www.dama-
mn.org/Resources/Documents/DAMA0707_MarkMosely_DMBOK.ppt [Accessed on:
12.12.2014].
Mosley, M. 2013. Body of Knowledge: Knowledge areas. DAMA International official
website. Available at: http://www.dama.org/content/body-knowledge [Accessed on
12.12.2014].
Myers, M. 1997. Qualitative research in information systems. MIS Quarterly. Vol. 21,
No. 2, pp. 241- 242.
Myers M. 2008. Qualitative research in business and management. Sage Publications
Ltd, England. 206 p.
Neilimo, K. & Näsi, J. 1980. Nomoteettinen tutkimusote ja suomalainen yrityksen
taloustiede: Tutkimus positivismin soveltamisesta. Series A 2 / 12, University of Tam-
pere.
Nolan, R. 1973. Managing the computer resource: A stage hypothesis. Communications
of the ACM. Vol. 16, No. 7, pp. 399-405.
Oracle. 2009. Oracle warehouse builder: User‟s guide. Oracle Corporation official web-
site. Available at:
http://docs.oracle.com/cd/B31080_01/doc/owb.102/b28223/concept_data_quality.htm
[Accessed on: 15.12.2014].
Oracle. 2012. Big data analytics technology brief: Customer segmentation engines as
building block. White Paper, Oracle Corporation. Available at:
http://www.oracle.com/us/technologies/big-data/bda-customer-segmentation-engines-
2045188.pdf [Accessed on 17.12.2014].

115
Paulk, M., Curtis, B., Chrissis. & Weber, C. 1993. Capability maturity model for soft-
ware, version 1.1. Technical Report CMU/SEI-93-TR-024, Software Engineering Insti-
tute SEI. Available at:
http://resources.sei.cmu.edu/asset_files/TechnicalReport/1993_005_001_16211.pdf
[Accessed on: 02.01.2015].
Peffers, K., Tuunanen, T., Rothenberger, M. & Chatterjee, S. 2008. A design science
research methodology for information systems research. Journal of Management Infor-
mation Systems. Vol. 24, No. 3, pp. 45-78.
Pokorny, J. 2013. NoSQL databases: a step to database scalability in web environment.
International Journal of Web Information Systems. Vol. 9, No. 1, pp. 69-82.
Prescott, M. 2014. Big data and competitive advantage at Nielsen. Management Deci-
sion. Vol. 52, No. 3, pp. 573-601.
Proença, D., Vieira, R., Antunes, G., da Silva, M., Borbinha, J., Becker, C., & Kulovits,
H. 2013. Evaluating a process for developing a capability maturity model. Proceedings
of the 28th Annual ACM Symposium on Applied Computing, New York. pp. 1474-
1475.
Punch, K. 2004. Developing effective research proposals. 1st ed. SAGE Publications
Ltd, London. 176 p.
Pöppelbuß, J. & Röglinger, M. 2011. What makes a useful maturity model? A frame-
work of general design principles for maturity models and its demonstration in business
process management. Proceedings of the European Conference on Information Systems
2011.
Quinn, M. & Taylor, C. 2014. Managing the risks and rewards of big data. In The Glob-
al Information Technology Report 2014. World Economic Forum, Geneva. pp. 61-66.
Radcliffe, J. 2014. Leverage a big data maturity model to build your big data roadmap.
White paper, Radcliffe Advisory Services Ltd. Available at:
http://www.radcliffeadvisory.com/research/download.php?file=RAS_BD_MatMod.pdf
[Accessed on: 19.02.2014].
Rastas, T. & Asp, E. 2014. Big data exploitation. Publications of Finland‟s Ministry of
Transport and Communications 20/2014. Available at:
http://www.lvm.fi/julkaisu/4417803/big-datan-hyodyntaminen [Accessed on:
05.12.2014].
Ricoeur, P. 1981. Hermeneutics and the human sciences: Essays on language, action
and interpretation. 1st ed. Cambridge university press, Cambridge. 314 p.
Robinson, D. 2012. Big data - the 4 V‟s: The simple truth; Part 4. Making data mean-
ingful official website. Available at: http://makingdatameaningful.com/2012/12/10/big-
data-the-4-vs-the-simple-truth/ [Accessed on: 25.11.2014].

116
Robson, C. 2002. Real world research: A resource for social scientists and practitioner
researchers. 2nd
ed. Blackwell publishing, Oxford. 587 p.
Rosemann, M. & De Bruin, T. 2005. Towards a business process management maturity
model. Proceedings of the Thirteenth European Conference on Information Systems,
Regensburg.
Routio, P. 2007. Comparative study. Arteology, research of products and professions.
Official website of the University of Art and Design Helsinki. Available at:
http://www2.uiah.fi/projekti/metodi/172.htm [Accessed on 07.04.2015].
Russom, P. 2011. Big data analytics. TDWI Research. Available at:
http://tdwi.org/research/2011/09/~/media/TDWI/TDWI/Research/BPR/2011/TDWI_BP
Re-
port_Q411_Big_Data_Analytics_Web/TDWI_BPReport_Q411_Big%20Data_ExecSu
mmary.ashx [Accessed on: 19.01.2015].
Russom, P. 2013. Managing big data. TDWI Research. Available at:
http://www.pentaho.com/sites/default/files/uploads/resources/tdwi_best_practices_repor
t-_managing_big_data.pdf [Accessed on: 11.11.2014].
Russom, P. 2014. Evolving data warehouse architectures: In the age of big data. TDWI
Research. Available at: http://tdwi.org/research/2014/04/best-practices-report-evolving-
data-warehouse-architectures-in-the-age-of-big-data.aspx [Accessed on 05.12.2014].
Röglinger, M., Pöppelbuß, J. & Becker, J. 2012. Maturity models in business process
management. Business Process Management Journal. Vol. 18, No. 2, pp. 328-346.
Saaranen-Kauppinen A. & Puusniekka. A. 2006. KvaliMOTV: Menetelmäopetuksen
tietovaranto Yhteiskuntatieteellinen tietoarkisto. Publications of the University of Tam-
pere, Tampere. Available at:
http://www.fsd.uta.fi/fi/julkaisut/motv_pdf/KvaliMOTV.pdf [Accessed on: 25.11.2014]
Sagiroglu, S. & Sinanc, D. 2013. Big data: A review. Proceedings of the International
Conference on Collaboration Technologies and Systems. pp. 42-47.
Salminen, A. 2011. Mikä kirjallisuuskatsaus? Publications of the University of Vaasa,
Vaasa. Available at: http://www.uva.fi/materiaali/pdf/isbn_978-952-476-349-3.pdf [Ac-
cessed on: 06.01.2015].
Saunders, M., Lewis, P. & Thornhill, A. 2009. Research methods for business students.
5th
ed. Pearson, England. 627 p.
Schouten, E. 2014. Cloud computing defined: Characteristics and service levels.
Thoughts on Cloud, official website of IBM. Available at:
http://thoughtsoncloud.com/2014/01/cloud-computing-defined-characteristics-service-
levels/ [Accessed on: 05.12.2014].

117
Sekar, G. & Elango, N. 2014. The next generation database language with base proper-
ties. Journal of Theoretical & Applied Information Technology. Vol. 61, No. 3, pp. 630-
634.
Shvachko, K., Kuang, H., Radia, S. & Chansler, R. 2010. The Hadoop distributed file
system. Proceedings of the 26th
IEEE Symposium on Mass Storage Systems and Tech-
nologies. pp. 1-10.
Simpson, J. & Weiner, E. 1989. The Oxford English Dictionary. Oxford University
Press, Oxford.
Soares, S. 2012. Big Data Governance. Presentation, Information Asset, LLC. Available
at: http://www.dama-
ny.com/images/meeting/101713/Presentation_deck/damanyc_bigdatagovernance17_oct
ober_2013.pdf [Accessed on: 15.12.2014].
Springer. 2014. SpringerLink. Springer official website. Available at:
http://www.springer.com/gp/eproducts/springerlink [Accessed on: 10.12.2014].
van Steenbergen, M., Bos, R., Brinkkemper, S., van de Weerd, I. & Bekkers, W. 2010.
The design of focus area maturity models. In Global perspectives on design science re-
search, Springer, Berlin.
The University of Reading. 2006. Research strategy. Publications of the Statistical Ser-
vice Centre (SSC) of University of Reading, Reading. Available at:
https://www.reading.ac.uk/ssc/media/ILRI_2006-Nov/guides/Guide1/Guide%201.htm
[Accessed on: 11.03.2015].
Thomas, J. & Segal, D. 2006. Comprehensive handbook of personality and psycho-
pathology, personality and everyday functioning. 1st ed. John Wiley & Sons, Hoboken.
479 p.
Tuomi, J. & Sarajärvi, A. 2002. Laadullinen tutkimus ja sisällönanalyysi. Tammi,
Helsinki. 182 p.
TUT – Tampere University of Technology 2014. Käytetyimmät, monitieteiset aineistot.
Web library of Tampere University of Technology. Available at:
http://www.tut.fi/fi/kirjasto/aineistot/monitieteiset-tietokannat/ [Accessed on:
10.12.2014].
van Veenstra, A., Bakker, T. & Esmeijer, J. 2013. Big data in small steps: Assessing the
value of data. White Paper, TNO. Available at: http://www.idnext.eu/files/TNO-
whitepaper--Big-data-in-small-steps.pdf [Accessed on: 17.03.2015].
Venkatasubramanian, U. 2013. Data governance for big data systems. White Paper,
L&T Infotech. Available at:
http://www.lntinfotech.com/resources/documents/DataGovernanceforBigDataSystems_
Whitepaper.pdf [Accessed on: 15.12.2014].
118
Vezzetti, E., Violante, M. & Marcolin, F. 2014. A benchmarking framework for product
lifecycle management (PLM) maturity models. The International Journal of Advanced
Manufacturing Technology. Vol. 71, No. 5-8, pp. 899-918.
Villars, R., Olofson, C. & Eastwood, M. 2011. Big data: What it is and why you should
care. White Paper, IDC. Available at:
http://sites.amd.com/us/Documents/IDC_AMD_Big_Data_Whitepaper.pdf [Accessed
on: 10.12.2014].
Wang, R., Reddy, M. & Kon, H. 1995. Toward quality data: An attribute-based ap-
proach. Decision Support Systems. Vol. 13, No. 3, pp. 349-372.
Warwick. 2014. Bibliographic databases. Publications of the University of Warwick,
Coventry. Available at:
http://www2.warwick.ac.uk/services/library/subjects/sciences/wmg/wmgtutorial/parttw
o/ [Accessed on: 05.01.2015].
Wegner, R. & Sinha, V. 2013. The value of big data: How analytics differentiates win-
ners. White Paper, Bain & Company. Available at:
http://www.bain.com/Images/BAIN%20_BRIEF_The_value_of_Big_Data.pdf [Ac-
cessed on 15.12.2014].
Wendler, R. 2012. The maturity of maturity model research: A systematic mapping
study. Information and Software Technology. Vol. 54, No. 12, pp. 1317-1339.
WHO - World Health Organization. 2001. Health research methodology: A guide for
training in research methods. 2nd
ed. WHO Regional Office for Western Pacific, Manila.
237 p.
Williams, N., Ferdinand, N. & Croft, R. 2014. Project management maturity in the age
of big data. International Journal of Managing Projects in Business. Vol. 7, No. 2, pp.
311-317.
Yin, R. 2009. Case study research: Design and methods. 4th
ed. SAGE Publications Ltd,
Thousand Oaks, USA. 240 p.
Zikopoulos, P., Eaton C., Deutsch, T., de Roos, D. & Lapis, G. 2011. Understanding big
data: Analytics for enterprise class Hadoop and streaming data. 1st ed. McGrew-Hill
Osborne Media., USA. 141 p.

119
APPENDICIES (2 PIECES)
APPENDIX A: The selection of papers for the systematic literature review
APPENDIX B: Questionnaire regarding the development of the maturity models

APPENDIX A: THE SELECTION OF PAPERS FOR THE SYS-
TEMATIC LITERATURE REVIEW
# Author(s), Year, Title Publication info Summary
1. De Bruin, T. Freeze, R.
Kaulkarni, U. & Rosemann,
M. 2005. “Understanding
the main phases of devel-
oping a maturity assess-
ment model.”
Proceedings of the 13th Euro-
pean Conference on Information
Systems, Regensburg.
Proposal of a new
generic methodology
for developing maturi-
ty models.
2. Becker, J. Knackstedt, R. &
Pöppelbuß, J. 2009. “De-
veloping maturity models
for IT management. “
Business & Information Systems
Engineering. Vol. 1, No. 3, pp.
213-222.
Proposal of a proce-
dure model for devel-
oping maturity models
based on a design
science approach.
3. Kohlegger, M. Maier, R. &
Thalmann, S. 2009. “Un-
derstanding Maturity Mod-
els. Results of a Structured
Content Analysis.”
Proceedings of I-KNOW ’09 and
I-SEMANTICS ’09, Graz. pp. 51-
61.
Proposal of a maturity
assessment question-
naire based on an
exhaustive structure
content analysis of 16
existing maturity mod-
els.
4. Mettler, T. 2009. “A design
science research perspec-
tive on maturity models in
information systems.”
Technical Report BE
IWI/HNE/03. Universität St.
Gallen, St. Gallen.
Proposal for develop-
ing maturity models
from both the perspec-
tive of a developer
and a user, using a
design science re-
search approach.
5. Mettler, T. Rohner, P. &
Winter, R. 2010. “Towards
a classification of maturity
models in information sys-
tems.”
In Management of the Intercon-
nected World, Physica-Verlag
HD, Berlin. pp. 333-340.
Proposal of a classifi-
cation system for ma-
turity models.
6. van Steenbergen, M. Bos,
R. Brinkkemper, S. van de
Weerd, I. & Bekkers, W.
2010. “The design of focus
area maturity models.”
In Global perspectives on design
science research, Springer,
Berlin.
Proposal of a method-
ology for developing
focus area maturity
models, extending the
current methodolo-
gies.
7. Lahrmann, G. Marx, F.
Mettler, T. Winter, R. &
Wortmann, F. 2011. “In-
ductive design of maturity
models: applying the
Rasch algorithm for design
science research.”
In Service-Oriented Perspec-
tives in Design Science Re-
search, Springer, Berlin. pp.
176-191.
Proposal of a method-
ology for developing
maturity models, fo-
cusing on the design
phase and the appli-
ance of quantitative
methods such as the
Rasch algorithm.

8. Pöppelbuß, J. & Röglinger,
M. 2011. “What makes a
useful maturity model? A
framework of general de-
sign principles for maturity
models and its demonstra-
tion in business process
management.”
Proceedings of the European
Conference on Information Sys-
tems 2011.
Proposal of a frame-
work of general design
principles for maturity
models, extending the
current methodolo-
gies.

APPENDIX B: QUESTIONNAIRE REGARDING THE DEVELOP-
MENT OF THE MATURITY MODELS
1. Is the maturity model a new original model, an enhancement of an existing model, or a hybrid of these?
2. Did you develop the maturity model using a top-down or a bottom-up ap-proach?
a. Top-down: Defining maturing entities, then structuring the model around the defined elements.
b. Bottom-up: Building the model structure first, then defining the matur-ing entities
3. Was the development process done more iteratively or cyclically?
4. How was the model tested and evaluated? a. Is this model validated, verified or certified by a third party? b. How many respondents have tested/used your model as of 2015?
5. Is the model being maintained?
a. Is evolution non-recurring or continuous b. If continuous, are you addressing:
i. Form = reflecting the change of meta-model/model schema ii. Functioning = reflecting the change of the assessment instru-
ment iii. Both


