EVALUATION OF BEST ENVIRONMENTAL ...etd.lib.metu.edu.tr/upload/12614892/index.pdfYüksek Lisans,...
194
EVALUATION OF BEST ENVIRONMENTAL MANAGEMENT PRACTICES OF AN INTEGRATED IRON AND STEEL PLANT A THESIS SUBMITTED TO THE GRADUATE SCHOOL OF NATURAL AND APPLIED SCIENCES OF MIDDLE EAST TECHNICAL UNIVERSITY BY NUR ÇAKIR IN PARTIAL FULFILLMENT OF THE REQUIREMENTS FOR THE DEGREE OF MASTER OF SCIENCE IN ENVIRONMENTAL ENGINEERING SEPTEMBER 2012
Transcript of EVALUATION OF BEST ENVIRONMENTAL ...etd.lib.metu.edu.tr/upload/12614892/index.pdfYüksek Lisans,...

EVALUATION OF BEST ENVIRONMENTAL MANAGEMENT PRACTICES OF AN INTEGRATED IRON AND STEEL PLANT
A THESIS SUBMITTED TO THE GRADUATE SCHOOL OF NATURAL AND APPLIED SCIENCES
OF MIDDLE EAST TECHNICAL UNIVERSITY
BY
NUR ÇAKIR
IN PARTIAL FULFILLMENT OF THE REQUIREMENTS
FOR THE DEGREE OF MASTER OF SCIENCE
IN ENVIRONMENTAL ENGINEERING
SEPTEMBER 2012
Approval of the thesis:
EVALUATION OF BEST ENVIRONMENTAL MANAGEMENT
PRACTICES OF AN INTEGRATED IRON AND STEEL PLANT
submitted by NUR ÇAKIR in partial fulfillment of the requirements for the degree of Master of Science in Environmental Engineering Department, Middle East
Technical University by, Prof. Dr. Canan Özgen ________________ Dean, Graduate School of Natural and Applied Sciences
Prof. Dr. Göksel N. Demirer ________________ Head of Department, Environmental Engineering
Prof. Dr. Ülkü Yetiş ________________ Supervisor, Environmental Engineering Dept., METU
Asst. Prof. Dr. Emre Alp ________________ Co-Supervisor, Environmental Engineering Dept., METU
Examining Committee Members:
Prof. Dr. Celal F. Gökçay ________________ Environmental Engineering Dept., METU Prof. Dr. Ülkü Yetiş ________________ Environmental Engineering Dept., METU Prof. Dr. Filiz B. Dilek ________________ Environmental Engineering Dept., METU Asst. Prof. Dr. Emre Alp ________________ Environmental Engineering Dept., METU Dr. Haluk Çeribaşı ________________ Encon Engineering
Date: ________________1

iii
I hereby declare that all information in this document has been obtained and
presented in accordance with academic rules and ethical conduct. I also declare
that, as required by these rules and conduct, I have fully cited and referenced
all material and results that are not original to this work.
Name, Last name : Nur Çakır
Signature :

iv
ABSTRACT
EVALUATION OF BEST ENVIRONMENTAL MANAGEMENT PRACTICES
OF AN INTEGRATED IRON AND STEEL PLANT
Çakır, Nur
M.S., Department of Environmental Engineering
Supervisor: Prof. Dr. Ülkü Yetiş
Co-Supervisor: Asst.Prof. Dr. Emre Alp
September 2012, 175 pages
European Union published IPPC Directive in 1996 aiming to create an integrated
approach in order to manage and control industrial facilities better. IPPC provides the
development of a new concept of “Best Available Techniques (BAT)”, the most
effective, advanced and applicable methods, preventing emissions to the environment
and providing efficient use of resources. Within this framework, numerous sectoral
Best Available Techniques Reference Documents were published giving information
on the sector and BAT alternatives for this sector. Iron and steel industry, which
causes quite significant amount of resource depletion and waste production, is one of
the industries within the scope of IPPC Directive. In the this study, environmental
performance of an integrated iron and steel plant in Turkey is evaluated and
compared with the EU’s integrated iron and steel plants, in order to suggest
applicable BAT alternatives for the studied plant. Totally 74 BAT alternatives were
evaluated and among them 36 alternatives were determined to be applicable for this
plant. Finally, two of these applicable BAT alternatives were selected and compared
by use of cross-media effects and financial analysis. The results of this study
indicated that dust emission and high energy consumption are the common problems
in the facility. Moreover, sintering process was found to be the least compatible sub-
process with EU’s iron and steel plants. Additionally, it was determined that with
respect to application of BAT alternatives, facility is quite compatible with EU’s iron

v
and steel plants. Furthermore, cross media effect and financial analysis revealed that
the selected BAT alternatives, “Advanced Electrostatic Precipitator (ESP)” and
“Bag Filter-combined or integrated reduction of solid and gaseous pollutants”, have
different cross media effects on the environment, however, the second alternative is a
more cost-effective alternative than the first one. Since this study was undertaken in
an integrated iron and steel plant that represents Turkish iron and steel industry with
respect to its production process, production capacity and environmental
performance; the results of this study can be used to aid decision makers to make
environmental initiatives in iron and steel industry in Turkey.
Keywords: Best Available Techniques (BAT), Cross-media Effects, Integrated
Pollution Prevention and Control (IPPC) Directive, Iron and steel production

vi
ÖZ
BİR ENTEGRE DEMİR ÇELİK TESİSİNİN MEVCUT EN İYİ ÇEVRESEL
YÖNETİM TEKNİKLERİNİN DEĞERLENDİRİLMESİ
Çakır, Nur
Yüksek Lisans, Çevre Mühendisliği Bölümü
Tez Yöneticisi: Prof. Dr. Ülkü Yetiş
Ortak Tez Yöneticisi: Yrd. Doç. Dr. Emre Alp
Eylül 2012, 175 sayfa
Avrupa Birliği 1996 yılında endüstriyel tesislerin daha iyi yönetilebilmesi ve kontrol
edilebilmesi için entegre bir yaklaşımı amaçlayan IPPC Direktifini yayınlamıştır.
IPPC Direktifi, “çevresel emisyonları önleyen ve verimli kaynak kullanımını
sağlayan en verimli, gelişmiş ve uygulanabilir metodlar” anlamına gelen “Mevcut En
İyi Teknikler (MET)” kavramının gelişmesini sağlamıştır. Bu çerçevede, sektörel
bilgi ve sektöre yönelik MET alternatiflerinin yer aldığı birçok “Mevcut En İyi
Teknikler Referans Dökumanı” yayınlanmıştır. Oldukça önemli ölçüde kaynak
tüketimine ve atık üretimine neden olan demir çelik sektörü, IPPC Direktifi’nin
kapsamında yer alan endüstrilerden biridir. Mevcut çalışmada, Türkiye’de bir entegre
demir çelik tesisinin çevresel performensı AB entegre demir çelik tesisleriyle
kıyaslanarak değerlendirilmiş, ayrıca tesise ait uygulanabilir MET alternatifleri
belirlenmiştir. Toplamda 74 MET alternatifi değerlendirilmiş, bunların içinden 36
alternatif tesiste uygulanabilir olarak belirlenmiştir. Son olarak, söz konusu
uygulanabilir MET alternatiflerinden iki tanesi seçilmiş ve çapraz ortam etkisi ve
finansal analizler kullanılarak karşılaştırılmıştır. Çalışmanın sonuçları, toz
emisyonun ve yüksek enerji tüketimini tesisteki ortak sorunlar olduğunu göstemiştir.
Ayrıca, sinterleme ünitesi AB demir çelik tesisleriyle en az uyumlu olan alt proses
olarak bulunmuştur. Bunlara ek olarak, MET alternatiflerinin uygulanma durumuna
gore, tesisin AB entegre demir çelik tesisleriyle oldukça uyumlu olduğu

vii
belirlenmiştir. Ayrıca, çapraz ortam etkisi ve finansal analizler, seçilen “İleri
elektrostatik çöktürücü (ESP)” ve “Torbalı Filtre - katı ve gaz kirleticilerin bileşik
ya da entegr olarak azaltılması” MET alternatiflerinin çevre üzerinde farklı çapraz
ortam etkilerinin olduğu, ancak ikinci alternatifin ilkine oranla maliyetinin daha
uygun olduğu saptanmıştır. Bu çalışma Türk demir çelik endüstrisini üretim prosesi,
üretim kapasitesi ve çevresel performansı açısından temsil eden bir entegre demir
çelik tesisinde gerçekleştirildiğinden dolayı, bu çalışmanın sonuçları Türkiye’de
demir çelik endüstrisinde karar mercilerinin çevresel girişimlerine yardım etmek
amacıyla kullanılabilir.
Anahtar Kelimeler: Mevcut En İyi Teknikler (MET), Çapraz Ortam Etkileri,
Entegre Kirlilik Önleme ve Kontrolü (EKÖK) Direktifi, Demir Çelik Üretimi

viii
To My Baby

ix
ACKNOWLEDGEMENTS
I would like to express my greatest gratitude to my supervisor Prof. Dr. Ülkü Yetiş
and my co-supervisor Assist. Prof. Dr. Emre Alp for their valuable support,
encouragement and guidance during my study.
I am also obligated to the Supervising Committee Members, Prof. Dr. Celal F.
Gökçay, Prof. Dr. Ülkü Yetiş, Prof. Dr. Filiz B. Dilek, Asst. Prof. Dr. Emre Alp and
Dr. Haluk Çeribaşı, for their valuable comments and contributions to my study.
This study was conducted with the support of a project of the Scientific and
Technological Research Council of Turkey (TUBITAK – 107G126); I also want to
thank them for this support. And, I want to thank the authorities of the facility for
providing the opportunity for me to conduct my study and the technical staff which
allocate time for me.
I would like to acknowledge the friendship, understanding and valuable support of
my friends Gülnur Ölmez and Çisem Yiğit during my study.
I wish to express my special thanks to my family for the trust and belief in me. I
appreciate their support and love throughout my life. And lastly, I would like to
express my deepest gratitude and love to my dear husband Berati Çakır for his
endless trust, encouragement and support.

x
TABLE OF CONTENTS
ABSTRACT ............................................................................................................ iv
ÖZ… ....................................................................................................................... vi
ACKNOWLEDGEMENTS ..................................................................................... ix
TABLE OF CONTENTS .......................................................................................... x
LIST OF TABLES .................................................................................................. iii
LIST OF FIGURES ................................................................................................. vi
ABBREVIATIONS .............................................................................................. viii
CHAPTERS
1. INTRODUCTION ............................................................................................. 1
1.1 General ..................................................................................................... 1
1.2 Objective and Scope of the Study ............................................................. 3
1.3 Thesis Overview ....................................................................................... 4
2. IRON AND STEEL PRODUCTION ................................................................. 5
2.1 Overview .................................................................................................. 5
2.2 Sintering ................................................................................................... 6
2.3 Coke Making ............................................................................................ 8
2.4 Iron Making.............................................................................................10
2.5 Steel Making ...........................................................................................11
2.6 Casting and Rolling .................................................................................12
2.7 Environmental Concern ...........................................................................14
3. BACKGROUND ............................................................................................. 16
3.1 Legislative Background ...........................................................................16
3.1.1 IPPC Directive .....................................................................................16
3.2 Studies Regarding the IPPC Directive and Best Available Techniques .....22
3.2.1 Non-sectoral Studies ............................................................................22
3.2.2 Sectoral Studies ...................................................................................31
3.2.3 Studies on BAT Suggestions for Integrated Iron and Steel Production .42

xi
4. METHODOLOGY .......................................................................................... 47
4.1 Step 1- Preliminary Study: Literature Study and Site Visits .....................48
4.2 Step 2- Input/Output Analysis ..................................................................49
4.3 Step 3- Performance Evaluation of the Facility ........................................49
4.4 Step 4- Determination of Potential BAT for the Facility ..........................50
4.5 Step 5- Calculation of Cross-Media Effects of Selected BAT Alternatives ………………………………………………………………………………………….....50
4.6 Step 6- Calculation of Cost of Selected BAT Alternatives .......................55
4.7 Step 7- Evaluation of Selected BAT Alternatives .....................................58
4.8 Step 8- Evaluation of Economic Viability in the Sector ...........................59
5. RESULTS AND DISCUSSION ....................................................................... 61
5.1 Step 1– Preliminary Study: Literature Study and Site Visits .....................61
5.1.1 Sintering ..............................................................................................62
5.1.2 Coke Making .......................................................................................64
5.1.3 Iron Making .........................................................................................68
5.1.4 Steel Making .......................................................................................69
5.1.5 Casting and Rolling .............................................................................70
5.2 Step 2– Input/Output Analysis .................................................................73
5.2.1 Sintering ..............................................................................................74
5.2.2 Coke Making .......................................................................................76
5.2.3 Iron Making .........................................................................................79
5.2.4 Steel Making .......................................................................................81
5.2.5 Casting and Rolling .............................................................................83
5.3 Step 3 – Performance Evaluation of the Facility ......................................85
5.3.1 Sintering ..............................................................................................86
5.3.2 Coke Making .......................................................................................89
5.3.3 Iron Making .........................................................................................92
5.3.4 Steel Making and Casting ....................................................................94
5.3.5 Rolling ................................................................................................97
5.3.6 Results Overview.................................................................................99
5.4 Step 4 – Determination of Potential BAT for the Facility ....................... 106
5.4.1 Sintering ............................................................................................ 107

xii
5.4.2 Coke Making ..................................................................................... 109
5.4.3 Iron Making ....................................................................................... 111
5.4.4 Steel Making and Casting .................................................................. 113
5.4.5 Rolling .............................................................................................. 115
5.4.6 Results Overview............................................................................... 116
5.5 Step 5 – Calculation of Cross-Media Effects of Selected BAT Alternatives. ...…………………………………….............…………………………………...119
5.6 Step 6 – Calculation of Cost of Selected BAT Alternatives .................... 137
5.7 Step 7 – Evaluation of Selected BAT Alternatives ................................. 146
5.8 Results Overview for Step 5, Step 6 and Step 7 ..................................... 147
5.9 Step 8 – Evaluation of Economic Viability in the Sector ........................ 148
6. CONCLUSION AND RECOMMENDATIONS ............................................ 150
REFERENCES ..................................................................................................... 155
APPENDICES
A. DETAILED INFORMATION ON APPLICABLE BAT ALTERNATIVES .... 161
B. DETAILED INFORMATION ON NON-APPLICABLE BAT ALTERNATIVES ................................................................................................ 174

iii
LIST OF TABLES
TABLES
Table 3.1. Summary table of all general studies.......................................................27
Table 3.2. Summary table of all sector specific studies ............................................37
Table 3.3. BAT alternatives from BREF Documents ...............................................43
Table 3.4. Other techniques suggested in the literature ............................................46
Table 4.1. Summary of cross-media calculation procedure ......................................54
Table 4.2. Example table for cash flow analysis ......................................................56
Table 5.1. Composition of COG ..............................................................................65
Table 5.2. Composition of the BF slag ....................................................................68
Table 5.3. Composition of the BF gas .....................................................................69
Table 5.4. Composition of BOF slag .......................................................................70
Table 5.5. Composition of BOF gas ........................................................................70
Table 5.6. Inputs and outputs of sintering process ...................................................75
Table 5.7. Inputs and outputs of coke making process .............................................78
Table 5.8. Inputs and outputs of iron making process ..............................................80
Table 5.9. Inputs and outputs of steel making process .............................................82
Table 5.10. Inputs and outputs of casting process ....................................................83
Table 5.11. Inputs and outputs of rolling process.....................................................85
Table 5.12. Comparison of specific emissions and consumptions of sintering process
with BREF document ..............................................................................................88
Table 5.13. Comparison of specific emissions and consumptions of coke making
process with BREF document .................................................................................91
Table 5.14. Comparison of specific emissions and consumptions of iron making
process with BREF document .................................................................................93
Table 5.15. Comparison of specific emissions and consumptions of steel making and
casting processes with BREF document ..................................................................96

iv
Table 5.16. Comparison of specific emissions and consumptions of rolling process
with BREF document ..............................................................................................98
Table 5.17. Comparison of input parameters (raw materials, energy, water and other
inputs) outside the limits set in BREF Documents ................................................. 100
Table 5.18. Comparison of output parameters (products, air emissions, wastes and
side products) outside the limits set in BREF Documents ...................................... 103
Table 5.19. BAT alternatives for sintering process ................................................ 108
Table 5.20. BAT alternatives for coke making process .......................................... 110
Table 5.21. BAT alternatives for iron making process ........................................... 112
Table 5.22. BAT alternatives for steel making and casting processes .................... 114
Table 5.23. BAT alternatives for rolling process ................................................... 115
Table 5.24. Summary of applicabilities of BAT alternatives in the facility ............ 116
Table 5.25. Direct emissions of both of the alternatives ......................................... 124
Table 5.26. Turkish electricity supply distribution and emissions released for 1 MWh
electricity generation ............................................................................................. 125
Table 5.27. Average emissions released to generate 1 GJ electricity in Turkey ...... 126
Table 5.28. Electricity consumption of BAT alternatives ...................................... 127
Table 5.29. Mass of indirect emission released with the consumption of electricity by
IBFS and ESP ....................................................................................................... 127
Table 5.30. Calculations for the amount of indirect emissions arised due to the
electricity consumptions of IBFS and ESP ............................................................ 128
Table 5.31. Human toxicity impacts of IBFS and ESP........................................... 130
Table 5.32. Global warming impacts of IBFS and ESP.......................................... 131
Table 5.33. Acidification impacts of IBFS and ESP .............................................. 133
Table 5.34. Photochemical ozone creation impacts of IBFS and ESP .................... 135
Table 5.35. Comparison of alternatives with respect to environmental impacts and
energy consumption .............................................................................................. 137
Table 5.36. Assumed and calculated values in revenue calculation ........................ 140
Table 5.37. Defined cost components .................................................................... 141
Table 5.38.. Cash Flow analysis for IBFS ............................................................. 142
Table 5.39. Cash Flow analysis for ESP ................................................................ 143
Table 5.40. NPV’s of alternatives.......................................................................... 144

v
Table 5.41. Total annual costs of alternatives ........................................................ 145
Table 5.42. Cost effectiveness of alternatives ........................................................ 146
Table A.1. Explanations of applicable BAT alternatives ........................................ 161
Table B.1. Reason why BAT alternative is not applicable to the facility……….....174

vi
LIST OF FIGURES
FIGURES
Figure 2.1. Flow scheme of integrated iron and steel production .............................. 6
Figure 2.2. Flow scheme of sintering process ........................................................... 7
Figure 2.3. Sketch of coke oven ............................................................................... 8
Figure 2.4. Flow scheme of coking process .............................................................. 9
Figure 2.5. Flow scheme of iron making process .....................................................10
Figure 2.6. Flow scheme of steel making process ....................................................12
Figure 2.7. Flow scheme of casting and hot rolling processes ..................................13
Figure 5.1. Flow scheme of integrated iron and steel production .............................62
Figure 5.2. Flow diagram of sintering .....................................................................63
Figure 5.3. Flow scheme of COG treatment process ................................................67
Figure 5.4. Slabs .....................................................................................................71
Figure 5.5. Billets ...................................................................................................71
Figure 5.6. Coil .......................................................................................................72
Figure 5.7. Wirerod .................................................................................................72
Figure 5.8. Percentile of exceed of electricity consumption limits (average of 2009
and 2010) .............................................................................................................. 101
Figure 5.9. Percentile of exceed of steam consumption limits (average of 2009 and
2010) .................................................................................................................... 102
Figure 5.10. Exceed percentiles of dust emissions ................................................. 104
Figure 5.11. Air emissions of sintering process ..................................................... 105
Figure 5.12. Number of parameters outside the limits............................................ 106
Figure 5.13. Percentile distribution of total BAT alternatives based o sub-processes
............................................................................................................................. 117
Figure 5.14. Percentile distribution of total BAT alternatives based on applicabilities
............................................................................................................................. 118

vii
Figure 5.15. Number of BAT alternatives and their applicabilities for sub-processes
............................................................................................................................. 118
Figure 5.16. Flowsceme of the cross-media effects calculation procedure ............. 119
Figure 5.17. Scematic representataion of ESP ....................................................... 121
Figure 5.18. Flowsceme of IBFS ........................................................................... 122
Figure 5.19. Total, indirect and direct human toxicity impacts of IBFS and ESP ... 131
Figure 5.20. Global warming impacts of IBFS and ESP ........................................ 132
Figure 5.21. Total, indirect and direct acidification impacts of IBFS and ESP ....... 134
Figure 5.22. Total, indirect and direct photochemical oxygen creation impacts of
IBFS and ESP ....................................................................................................... 136
Figure 5.23. Flowsceme of the cost analysis procedure ......................................... 138

viii
ABBREVIATIONS
BAT: Best Available Techniques
BEAsT: Best Available Techniques Economic Attractiveness Tool
BEI: Best Available Techniques Emission Index
BF: Blast Furnace
BOF: Basic Oxygen Furnace
BREF: Best Available Techniques Reference Documents
CE: Cost Effectiveness
CFB: Circulating Fluidized Bed
CME: Cross Media Effects
COG: Coke Oven Gas
DEA: Data Envelopment Analysis
EAF: Electrical Arc Furnace
ELV: Emission Limit Value
ESP: Electrostatic Precipitator
EU: European Union
FGD: Flue Gas Desulphurisation
IBFS: Integrated Bag Filter System
IE: Industrial Emissions
IMGS: Intensive Mixing and Granulation System
IPPC: Integrated Pollution Prevention and Control
LCA: Life Cycle Assessment
NPV: Net Present Value
OC: Operating and Maintanance Cost
P-BCAT: Privately Best Combination of Alternative Techniques
PCDD/F: Dioxin/furan
S-BCAT: Socially Best Combination of Alternative Techniques
SCR: Selective Catalytic Reduction

ix
SNCR: Selective Non-Catalytic Reduction
TE: Technical Efficeincy
TEİAŞ: Türkiye Elektrik İletim Anonim Şirketi
US: United States

1
C
CHAPTER 1
1. INTRODUCTION
INTRODUCTION
1.1 General
Steel is a quite durable and sustainable material making it one of the most common
materials in the world with its pretty wide range of application. Steel is indispensable
for various sectors such as building construction, manufacture of vehicles, machines,
household equipments [1].
As a result of increase in economical activities in worldwide and growth of
economies of the countries; increase in the demand of house, automobile and other
steel products scales up the iron and steel production in the world [2]. In 2011, world
steel production ascended up to 1.49 billion tons [3].
Turkey is the tenth in the world and second top steel producer in Europe with the
production of 34.1 million tons [3] in 2011. This is an important indicator of the fact
that, Turkey has come to a substantial level in steel production. Turkish steel sector
increased its production capacity from 25.1 (in 2005) million tons to 47.1 million
tons (in 2011) corresponding 87.6% increase in 6 years [4]. Moreover, steel sector is
very crucial industry providing added value to Turkish economy and its high export
potential.
This industry is also very important regarding resource depletion and waste
production. China is the world leader in steel production since 1996, with its output
reaching to 635 million tons in 2011. The share of Chinese produced steel in the
world increased to 45.8% in 2011 from 5.1% in 1980. China, consumed 15.2% of the
national total energy and generated 14% of the national total wastewater and waste

2
gas, and 6% of the total solid waste materials in 2009 [5]. On the other hand, in 2010,
Turkish iron and steel industry consumed 10.56% of the total electricity, 4.83% of
the total natural gas and ultimately 8.1% of the total national energy [6].
Furthermore, as is known iron and steel industry is one of the most air polluting
industries.
Considering decrease of energy sources, raw material and water resources and
increase of environmental pollution, sustainable environmental consciousness is
developed throughout the world. More stringent limitations in legislations force the
industry to meet increased energy efficiency, reuse and recycle.
One of the most important legislation in this context is the European Union’s (EU)
IPPC Directive published in 1996 (the new IPPC Directive published in 2010 is
named as Industrial Emissions Directive). The goal of this directive is to create an
integrated approach in order to manage and control the industrial facilities better. So
that a high level of environmental protection is succeeded taking into account the
emissions in air, water and soil as a whole.
IPPC provides the development a new concept of “Best Available Techniques
(BAT)”, the most effective, advanced and applicable methods, as the name implies,
preventing emissions to the environment and providing efficient use of resources.
Within this framework, numerous sectoral Best Available Techniques Reference
Documents were published giving information on the sector and BAT alternatives for
this sector. Apart from sectorel BREF’s, a few BREF’s on general environmental
issues were published. One of these general documents is “BREF on Economics and
Cross-Media Effect” [7] giving methodology for selection of BAT for a facility,
which is evaluating environment effects and cost-effectiveness of BAT alternatives
to be compared.
On the other hand, as a requirement of IPPC Directive, competent authorities should
be consider the application of BAT measures in the facility, in giving permission to

3
the industrial facilities. Iron and steel industry is one of the industries which should
take these permits.
In the literature, plenty of BAT studies have performed in various countries industrial
sectors such as cement manufacturing, casting industry and textile production.
However, although iron and steel sector is one the major environmental polluting and
resource depleting industries, no study on BAT application in iron and steel sector
was encountered. This situation causes a major deficiency in environmental concern.
1.2 Objective and Scope of the Study
The aim of the study is to evaluate the environmental performance of an integrated
iron and steel plant in Turkey and to suggest BAT alternatives suitable for this
facility, by considering the environmental impacts and cost/effectiveness of these
alternatives.
Within the context of this main aim, following tasks were undertaken respectively;
The process of general iron and steel production and the process of the
facility were studied, all inputs and outputs in all sub-processes were
determined.
After processing the data obtained from input/output analysis, specific
emission and consumptions of all sub-processes were calculated and
compared with European Union’s iron and steel plants with the help of
“BREF documents on Iron and Steel Production” [8],[9].
Potential BAT list for the facility was created and eliminated according
to their applicabilities in the facility.
Two of the applicable BAT alternatives were selected and their cross-
media effects (CME), which is the environmental effects on different
4
impact categories, arising due to the implementation of BAT
alternatives, and their cost-effectiveness were calculated and compared
with each other. The final decision is left to the competent authority of
the facility.
1.3 Thesis Overview
This thesis is composed of six chapters. In Chapter 1, the importance of iron and
steel industry in the world and in Turkey is mentioned and information on IPPC
directive and the objective & the scope of the study are given. Chapter 2 describes
the integrated iron and steel production. Moreover detailed information on
environmental concerns of all sub-processes is given in this chapter. Background of
this study including relevant legislations and previously undertaken studies are
presented in Chapter 3. In Chapter 4, the methodology of the study is described.
Chapter 5 covers results presented and interpreted. Additionally, discussions on these
results are given in this chapter. Finally, the study is concluded and
recommendations are given in Chapter 6.

5
2. IRON AND STEEL PRODUCTION
CHAPTER 2
IRON AND STEEL PRODUCTION
2.1 Overview
Steel production is based on the reduction of iron ore which is followed by the
removal of impurities in iron that are silicon, manganese, phosphorus as well as
carbon. Iron contains relatively high amount of carbon (around 4%), that makes it
hard and brittle. In steel production process, carbon content of iron is reduced to less
than 1%, so that it gains a more flexible structure [10]. This carbon reduced form of
iron is named as “steel”.
Steel is produced worldwide by four different methods [11];
1. Reduction by Blast Furnace (BF) and Basic Oxygen Furnace (BOF)
2. Direct melting of scrap by electric arc furnaces (EAF)
3. Smelting reduction
4. Direct reduction
The first method is also called as “integrated steel production”. According to 2006
statistics, 58.9% of European total steel production was made by integrated iron and
steel plants whereas the shares of electrical arc furnaces and direct reduction plants
were 40.2% and 6.8%, respectively. No smelting reduction was applied on a
commercial scale in Europe [11].
In Turkey, in the year of 2011, 76% of the total steel production was made by
integrated steel plants whereas 24% by electric arc furnaces [3]. Direct reduction and
smelting reduction are not being applied in Turkey.

6
As mentioned above, this study involves only integrated iron and steel production.
Therefore only integrated iron and steel production is examined and presented in this
study.
Integrated steel production includes six major sub-processes;
1- Sintering
2- Coke making
3- Iron making (Blast Furnace-BF)
4- Steel Making (Basic Oxygen Furnace-BOF)
5- Casting
6- Rolling
Flow scheme of integrated iron and steel production is presented in Figure 2.1.
Figure 2.1. Flow scheme of integrated iron and steel production
Detailed information is given in the following sections.
2.2 Sintering
In sintering process, a mixture of fine particles that are fine iron ore, additives (lime,
olivine) and recycled iron bearing materials from downstream processes (BF dust,
Sintering
Coke Making
Iron Making
Steel Making
Casting & Rolling

7
mill scale) is agglomerated by means of ignition of coke breeze added into the
mixture.
The product of sintering process, called “sinter”, is sent to BF. Sintering process is
applied for the improvement of permeability and reducibility of iron ore in BF [11].
Initially, a mixture of raw materials, additives and recycled wastes is prepared. Coke
breeze is also added into the mixture to be used as fuel. This mixture is send to the
sinter machine and with the ignition of coke breeze in the mixture, sufficient heat is
supplied (temperature becomes 1300-1480°C), so that agglomeration takes place and
“sinter” is produced. Afterwards, it is screened in order to eliminate smaller sinter
pieces and then sinter pieces that are sufficiently large in size are sent to BF
following cooling process. Flow scheme of sintering process is presented in Figure
2.2.
Figure 2.2. Flow scheme of sintering process
Since the wastes of other processes are recycled in sinter plants, emission of this
process is quite variable and significant. The most crucial emissions caused by sinter
plants are dust, CO, CO2, SO2, NO, NO2, HCl, HF, D/F, heavy metals (Cr, Pb etc.).
Another important concern on sintering process is that this process consumes high
amount of energy. Hence, efficient use of energy is substantially important for sinter
plants.
Mixing Sintering Screening Cooling Product: Sinter

8
2.3 Coke Making
Coke is produced from coal by means of pyrolysis. The coal is heated in a close and
airless environment, in order the volatiles in coal to move away from coal. The
remaining hard and spongy material is called “coke” [12].
The major role of coke in the BF is to be used as energy source. The reason why
coke is used instead of coal is that coke behaves as a support material in BF and
provides gas circulation due to its spongy nature whereas coal cannot supply these.
Coke cannot be wholly replaced by other types of fuel in BF [11].
The process starts with coal preparing. Mixture of various types of coal is prepared
and sent to coke ovens. To be converted to coke, coal is heated up to 1000-1100°C
for 14-28 hours indirectly via coke ovens. Fuel gas is burned in burning rooms and
heat is transferred from burning rooms to coking rooms by means of the walls
between them. Several coke ovens combine and constitute a “coke battery”. A sketch
of coke oven can be seen in Figure 2.3.
Figure 2.3. Sketch of coke oven
After sufficient coking time mentioned above, coke is pushed from coke oven and
quenched by wet or dry methods. Finally coke is sent to BF to be used as fuel. On the
Coking room
Coke oven gas to be treated
Burning room

9
other side, coke oven gas (COG) is sent to gas treatment. Coke making process
scheme is presented in Figure 2.4.
Figure 2.4. Flow scheme of coking process
COG is a valuable gas having calorific value of 17.4-20 MJ/m3 (~4350 kcal/m3) [13].
For this reason, COG is treated and used as fuel in integrated iron and steel plants. In
the treatment of COG, initially COG that is composed of volatiles and moisture is
cooled by spraying ammonia water. During this process, high amount of ammonia
containing wastewater is produced. Afterwards, COG is subjected to various
processes; during these processes ammonium sulphate, benzole and tar are produced
as side-products from the impurities present in COG. Finally, clean COG is stored to
be used as an energy source.
The main environmental problem related to coke making is that coke batteries cause
significant emissions to air. Aforementioned emissions are generally dust, NO, NOx,
SO2 and CO. For these emissions, precautions should be taken in order not to cause
air pollution problems. Another major environmental problem is the wastewater
containing high amount of ammonia that is produced during COG treatment. This
wastewater should be treated before discharging it to a receiving body. The final
significant environmental issue is the energy efficiency. Huge amount of energy is
produced and consumed at the same time in coke batteries. Management of both
production and consumption of energy is a crucial subject.
Coal preparing
Coking (coke ovens)
Quenching
Gas treatment
Product: Coke
Side Product: Clean COG
10
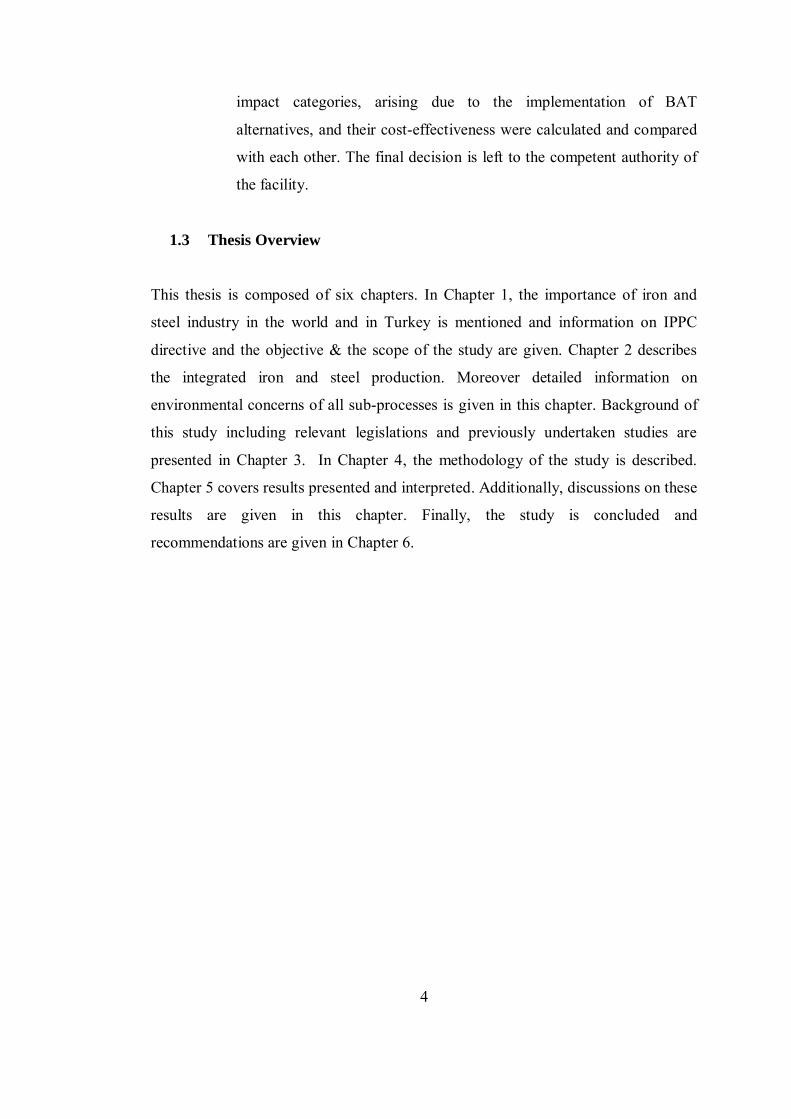
2.4 Iron Making
In the production of iron; sinter from sinter plant, lump iron ore, additives (lime etc.)
and, as fuel coke from coke battery and pulverized coal from coal preparation unit
are filled into the BF and heated up to sufficient degree (~2000°C). A reduction
reaction takes place in BF, and hematite (Fe2O3) and magnetite (Fe3O4) in iron ore
are reduced to iron oxide (FeO) [11]. Hot air required for combustion in BF is
provided from hot stoves.
The impurities in the iron ore are passed to slag with the help of lime added. Slag has
lower density then iron, so that it ascends up to liquid iron. By this way, slag and iron
are separated easily. The reduced and liquefied iron is sent to BOF to be converted to
liquid steel whereas liquid slag is sent to slag processing unit to be cooled and
granulated.
Although BF gas seems to have negligible calorific value (~720 kcal/m3) [13]
comparing to COG, actually it involves sufficient amount of energy which cannot be
wasted. Hence, like COG it is cleaned and used as energy source in iron and steel
facilities.
Figure 2.5 presents the flow scheme of iron making process.
Figure 2.5. Flow scheme of iron making process
Hot Stoves
Product: Liquid iron
Side Product: Clean BF gas
Hot air
Pulvarized coal Pulvarized coal
preparing
Blast Furnace
Gas treatment

11
Iron particles passing to the BF gas contain high amount of zinc due to the zinc
content of iron ore. During gas treatment, these zinc bearing iron particles are
collected as sludge or dust, after they are removed from BF gas. Afterwards, this
sludge/dust containing high amount of zinc is added to the feed of sintering process,
and this causes high zinc content of sinter, that is produced by sinter plants. High
zinc bearing sinter consumption leads to operational problems in BF. As a result,
usage of BF gas treatment sludge/dust in sintering process is limited in order to
prevent operational problems in BF. Reduction of zinc content of BF gas treatment
sludge/dust is an important issue; hence it provides safe usage of BF gas treatment
sludge/dust in sintering process. By this way solid waste production of iron making
process and raw material consumption of sintering process are minimized.
Beside high zinc containing BF gas treatment sludge, there are two more major
environmental issues related to iron making process. The first problem is emission of
dust, CO, CO2, SO2 and NOx. These emissions to air cause air pollution problems. In
order to prevent air pollution problem, measures should be taken such as inserting
cleaning equipments. The second important issue is the fact that iron making process
uses enormous amount of energy both in BFs and hot stoves. Management of energy
consumption of iron making process is a crucial concern to be taken into account.
Precautions taken in this process can provide high amount of energy saving.
2.5 Steel Making
As mentioned before, in order to produce steel from iron, carbon content of iron
should be decreased to about 2% considering desired hardness and flexibility. This is
achieved by blowing oxygen into liquid iron in BOF and converting carbon in iron
into carbon dioxide. Carbon dioxide is moved away by means of BOF stacks. Beside
liquid iron, steel scrap is fed into BOF as raw material. At the same time with the
same method with BF, adding lime into the BOF feed, impurities such as silicon,
manganese and phosphorus are passed to slag. By this way they are removed from
liquid steel [11]. Flow diagram of steel making process can be seen in Figure 2.6.

12
Figure 2.6. Flow scheme of steel making process
As is seen in Figure 2.6, prior to BOF liquid, steel is subjected to pretreatment for
removal of sulphur in liquid iron. After the conversion of iron to steel, fine
adjustments in the quantitiy of substances in the liquid steel are made in secondary
metallurgy unit to provide requested quality of steel.
BOF gas has a calorific value (~1450 kcal/m3) [13], lower than COG and more than
BF gas. It is treated and consumed as energy source in the facility as well as the other
ones.
High zinc content in BOF gas treatment dust/sludge is also an important problem for
steel making as in iron making. The reason behind the fact that BOF gas treatment
dust/sludge has high zinc content is galvanized and painted steel scrap used in the
process as raw material. Emissions of CO, CO2, SO2 and NOx, and high energy
consumption are other prior problems related to steel making process.
2.6 Casting and Rolling
Two types of casting methods are used in steel production; continuous and ingot
casting. Continuous casting has several advantages comparing to ingot casting as
follows;
Product: Liquid steel
Side Product: Clean BOF gas
Pretreatment Basic oxygen furnace
Secondary metalurgy
Gas treatment

13
It saves energy, causes less emission and uses less water,
Working conditions are improved,
It has high yield rate, up to 95% and high productivity.
Worldwide; 90% of steel is cast by continuous methods whereas this ratio
approaches to 97% in Europe [11]. Products of casting are slab, wide in shape; and
billet thin and long in shape.
Slab and billet are sent to rolling process to be converted into coil and wirerod,
respectively via physical forming. Physical forming of steel is performed by means
of hot rolling, cold rolling and drawing. In integrated iron and steel production, hot
rolling is applied. Semi products are heated up to annealing temperature (~1250°C)
prior to hot rolling. In hot rolling process slab is flattened and billet is extended by
compressing between electrically powered rollers repeatedly [9]. Afterwards coil and
wirerod, produced as the final product of hot rolling, are subjected to pressurized
water in order to be cooled and cleaned from the mill scale which is a recyclable
waste into sintering process. The process scheme is presented in Figure 2.7.
Figure 2.7. Flow scheme of casting and hot rolling processes
The most important environmental problem regarding casting and hot rolling
processes is the formation of oily mill scale. It is a valuable waste due to its high
steel content. Mill scale is formed during cooling and cleaning of semi-product or
Final product: Coil and wirerod
Casting Hot rolling
Semi product: Slab and
billet
Furnace

14
final products. In order to obtain a smooth surface, the iron oxide particles on the
surface of these products are removed by pressurized cold water as stated above. By
this way, cooling of products is provided as well. This cooling water is percolated
through rolling machines and therefore it gets contaminated with oil and grease on
the surface of rolling machines. As a result, due to the direct contact of oily cooling
water, mill scale contaminated with oil and grease. The oil content limits the quantity
of mill scale to be recycled into the sintering process, as it causes operational
problems in the BF. Therefore oil content of mill scale should be reduced by
treatment.
Emissions of CO, CO2, SO2 and NOx, and high energy consumption are the other
major environmental problems related to casting and rolling.
2.7 Environmental Concern
As can be noticed from the abovementioned issues, the common problems of all
processes of an integrated iron and steel plant are;
Emissions of CO2, CO, SO2 and NOx to the air,
High energy consumption
Environmental impacts of these problems can be summarized as follows;
CO2 is the major gas causing global warming.
CO is a toxic substance for living being.
SO2 causes acid rains and harmful for the human respiratory system.
NOx emission also causes acid rain and eutrophication in water bodies.
Energy resources in the world have diminishing. Moreover, high energy
consumption leads to high emission of abovementioned substances.

15
In consequence, to manage an integrated iron and steel plant more efficiently and
environmental friendly, first of all these emission and high energy consumption
problems should be considered and related precautions should be taken.

16
3. BACKGROUND
CHAPTER 3
BACKGROUND
3.1 Legislative Background
On account of diminishing energy sources, raw material and water resources and
rising of environmental pollution, sustainable environmental consciousness is
developed throughout the world. As a result, more and more stringent limitations in
legislations force the industry to increase energy efficiency and reuse and recycle
practices.
Within this scope, the most substantial piece of legislation is the “Integrated
Pollution Prevention and control Directive-IPPC” [14] of the European Union. In
the following section, the information about this directive is given.
3.1.1 IPPC Directive
In 1996, European Council’s Directive on Integrated Pollution Prevention and
Control (96/61/EC) came into force with the aim of achieving integrated pollution
prevention and control resulting from industrial activities which are collected under
six main topics in this directive: energy industries, production and processing of
metals, mineral industry, chemical industry, waste management and other activities
[14].
The IPPC Directive establishes regulations to succeed high level of protection of the
environment taken as a whole [14]. In other words it brings an integrated approach to
environmental protection; therefore it is accepted as a milestone in pollution
prevention concept.

17
The IPPC Directive comprises a broad range of environmental impacts including
emissions to air, water and land, waste production, energy use, accidents and site
contamination. It prevents not only pollution caused by emissions, but also all any
introduction causing harm to the health or quality of the environment such as
vibration, heat and noise [15].
The IPPC strengthen the concept of Best Available Techniques (BAT). According to
this directive, operators should take all proper preventive measures against pollution
particularly by the implementation of the BAT (Article 3-(a)). The concept of BAT is
defined in Article 2 of the aforesaid directive as follows:
'best available techniques` shall mean the most effective and advanced stage
in the development of activities and their methods of operation which indicate
the practical suitability of particular techniques for providing in principle the
basis for emission limit values designed to prevent and, where that is not
practicable, generally to reduce emissions and the impact on the environment
as a whole:
'techniques` shall include both the technology used and the way in which the
installation is designed, built, maintained, operated and decommissioned,
'available` techniques shall mean those developed on a scale which allows
implementation in the relevant industrial sector, under economically and
technically viable conditions, taking into consideration the costs and
advantages, whether or not the techniques are used or produced inside the
Member State in question, as long as they are reasonably accessible to the
operator
'best` shall mean most effective in achieving a high general level of
protection of the environment as a whole [14]
According to the IPPC Directive, competent authorities in the member states should
give permits to the installations. In the IPPC Directive, it is stated that single permits
should be given by competent authorities to the facilities for their waste production
and emissions to the air and water rather than separate permits. These permits should

18
be given if the installation is in compliance with the measures laid down in Article 3
(Article 9(1)), which means that they are encouraged to apply BAT.
In this context, numerous sectoral reference documents (BREFs) were published on
BAT by the IPPC Bureau which has been set up to organize an “information
exchange” between industry and the Member States regarding BAT. BREFs are the
main reference documents used by competent authorities in the Member States when
issuing operating permits for the facilities that have an important pollution potential
in Europe [16]. BREF Documents includes information on the process(es), current
emissions and consumptions as well as BAT of the regarding sector.
There are totally 35 BREF Documents published by the EU up to now. Some of
these documents are sector-based and some are non sector-based such as the BREF’s
on industrial cooling systems, monitoring, economic and cross-media effects. Since
BAT have a dynamic character altering with the technological developments, they
have been being updated and reviewed within a number of years by the IPPC Bureau.
In 2008, the Directive 2008/1/EC [15] entered into force repealing the IPPC
Directive (96/61/EC) And the Directive 2008/1/EC will be repealed by the new
Directive on Industrial Emissions-IE (2010/75/EU) known as new IPPC Directive,
from January 7, 2014 [17]
The Directive on Industrial Emissions (2010/75/EU) [17] that has been adopted on
November 2010, requires industrial installations to adopt BAT that are defined in
BREFs. The name of “Best Available Reference Documents” firstly mentioned in
this directive. In the Industrial Emissions Directive it is stated that “Permit conditions
should be set on the basis of best available techniques” and “In order to determine
best available techniques and to limit imbalances in the Union as regard the level of
emissions from industrial activities, reference documents for BAT should be drawn
up, reviewed and, where necessary, updated through an exchange of information
with stakeholders and the key elements of BAT reference documents adopted
through committee procedure.” [17]. These statements mean that the strength of

19
BREF documents has increased with the Industrial Emission Directive’s entry into
force.
3.1.1.1 BREF on Iron and Steel Production
According to IPPC Directive, “Installations for the production of pig iron and steel
including continuous casting, with a capacity exceeding 2,5 tonnes per hour” have to
take a permit based on the application of BAT mentioned in the Reference
Documents related to the Iron and Steel Industry in order to provide integrated
pollution prevention and control (Annex 1-(2.2)).
In this study, three different sectoral BREF Documents were taken as base and
investigated in detail; hence they provide detailed information on integrated iron and
steel production including BAT. The first one is the BREF Document on iron and
steel production published in 2001 including information on sub-processes apart
from rolling process. The second one is the draft BREF document revising the first
one on iron and steel production as well, published in 2011. Information on rolling
process is given in the third BREF Document on ferrous metal processing published
in 2001. Detailed information on these documents is presented as follows:
1- Reference Document on Best Available Techniques in the Iron and Steel
Production [8] (December 2001):
It involves the environmental aspects of integrated iron and steel production
including sinter plants, pelletisation plants, coke oven plants, blast furnaces and
basic oxygen furnaces and casting, and steel production made by electrical arc
furnaces. The structure of this document is as follows;
General information on the sector comprising statistical data on EU’s iron
and steel production, the geographical distribution, economic and
employment aspects as well as the rough evaluation of the environmental
importance of the sector,

20
Information on integrated iron and steel production comprising information
on the processes, current emission and consumption levels and BAT
alternatives,
Information on electric arc furnace steel production comprising information
on the processes, current emission and consumption levels and BAT
alternatives [8]
2- Draft Reference Document on Best Available Techniques in the Iron and Steel
Production [11] (June 2011):
This document is the updated version of the previous one. It also includes
information on sintering, coke making, iron making, steel making and casting
processes. Only a few more BAT alternatives are included in this document
comparing with the previous one. Moreover, this document covers more detailed
information especially on common BAT alternatives with the previous document.
3- Reference Document on Best Available Techniques in the Ferrous Metal
Processing [9](July 2001):
Rolling downstream to casting is not covered in the reference documents mentioned
above. Instead, it is included in another reference document on the ferrous metal
processing. Part A of this document gives information on hot rolling and Part D
states BAT alternatives for hot rolling. In other words, only part A and D are related
to iron and steel production. Thus only these parts were considered in this thesis.
3.1.1.2 BREF on Economics and Cross-Media Effects [7]
BAT concept under IPPC consider “cost and benefits of measures” beside protection
of the environment taken as a whole. The aim of this approach is to prevent new and
more significant environmental problems when solving an already existing problem.

21
In Article 9(4) of IPPC, it is stated that permit conditions shall be based on BAT
considering technical characteristics, geographical location and the local
environmental conditions of the installation. This brings a need to determine which
option provides higher level of protection of the environment in such local conditions
and which option gives more benefits with the same cost [7]. Methodology presented
in the BREF on Economics and Cross-Media Effects is for the assessment of the
BAT alternatives and for the comparison of BAT alternatives according to their
environmental impacts and cost/benefit ratio towards the selection of the most
feasible one/ones.
The methodology of “Economics and Cross-Media Effects Analysis” described in
the BREF on Economics and Cross-Media Effects mainly includes four steps as
follows:
Step 1- Cross-media effects analysis
In this step, BAT alternatives are assessed according to their environmental
impacts with the use of four guidelines (Guidelines 1 to 4) presented in the
document which help the user to determine which alternative technique is the best
environmental option.
Step 2- Cost analysis
Cost of BAT alternatives is calculated transparently by means of further five
guidelines (Guidelines 5 to 9) in the second step. By this way the alternatives can
be validated, controlled and compared in a fair way.
Step 3- Evaluation the alternatives
Information obtained from the steps 1 and 2 is used to balance the cost of a BAT
alternative against the environmental benefit that it brings. It means that cost
effectiveness of BAT alternatives is expressed in this step.

22
Step 4- Evaluation of economic viability in the sector
Apart from the environmental benefits and cost, another important issue related to
a BAT alternative is its economic viability in the sector. In the last step, economic
viability is evaluated by considering “Market Structure”, the “Industry Structure”
and the “Resilience” of the sector [7].
More detailed information on “Economics and Cross-Media Effects Analysis” will
be presented in Chapter 4.
3.2 Studies Regarding the IPPC Directive and Best Available Techniques
In this part, general studies and sector specific studies performed in different
countries and sectors regarding the IPPC Directive and BAT will be assessed.
3.2.1 Non-sectoral Studies
In the literature general studies mostly including general information on the IPPC
Directive, BAT, BREF Documents; tools or methodologies used for the selection of
candidate BAT or used for evaluation of BAT implementation degree of an
installation are present. In this part, examples of these studies will be presented.
A review study giving general information of the IPPC Directive, BAT and BREF
Documents was conducted by Martinez [18]. According to Martinez, integrated
approach is very crucial since this approach prevents transfer of pollutants from one
media to another. In his paper, it is mentioned that the scope of the IPPC Directive is
highly polluted large industrial installations. He also stated that, with the application
of the IPPC Directive, pollution prevention is adopted rather than “after the fact”
approach, moreover this Directive affects the countries trying to enter European
Union including Turkey and acceding countries, beside the Member States of the
European Union as well. In this paper, BAT was defined and considerations to be
taken into account for BAT specifications were listed. Furthermore it was mentioned

23
that Emission Limit Values (ELV) are set based on the selection and application of
BAT rather than specific ELV’s.
A similar review study was performed by O’Maley [19] with the same goal as
Martinez [18]. Both of these studies involve the information on the scope of the IPPC
Directive, BAT and ELV’s. O’Maley [19] mentioned mainly operator obligations,
permit application requirements, BAT information exchange and competent
authorities & their responsibilities where Martinez [18] did not mention any of these
topics. In the study of O’Maley [19], it was stated that the IPPC Directive focuses on
the “source control” of pollution primarily instead of end of pipe treatment. The
steps in a waste management methodology should be followed according to waste
management hierarchy. This concept requires elimination, reduction, recovery,
recycle of wastes respectively. If neither of them is applicable, end of pipe
techniques should be applied to the wastes. Finally from the study of O’Maley [19],
it can be deduced that the IPPC Directive not only protects the environment, but also
improves efficiency of business.
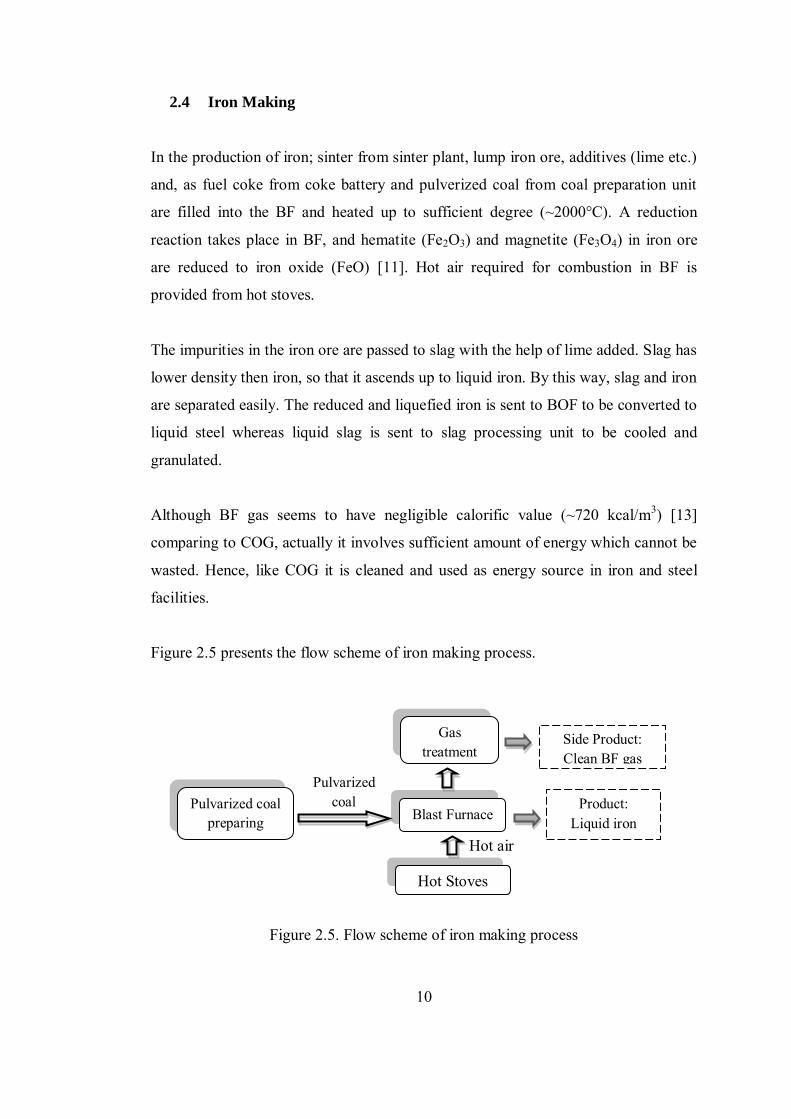
Schoenberger [20] conducted a study concentrating on “BAT Information Exchange
Process (Sevilla Process)”BAT Information Exchange Process is, as the name
implies, sharing information between the Member States and industries concerning
BAT. In the study of Schoenberger [20], the aim of BAT Information Exchange
Process was presented as helping competent authorities in determination of BAT
based permits, balancing the process technology in European Community and
supporting of spreading the information on attainable emission and consumption
levels in case of application of BAT. BREF Documents, which are unique documents
including sectoral emission and consumption levels, are the result of this process.
Schoenberger [20] stated that these emission and consumption levels determines
whether the installation is “best performing” or “well performing” or “not such well
performing”.
A more specific study comparing the studies by Martinez [18] and O’Maley [19]was
conducted by Dijkmans [21], describing a methodology in his study to choose BAT

24
among candidate BAT at sectoral level. Presented methodology based on mainly two
steps: data collection and evaluation of candidate BAT. The first step includes
collection of information on sector specific economical data and on candidate BAT.
Cross check of the data quality is stated to be very significant in this paper. The
second step is composed of four sub-steps which are assessments of technical
feasibility, environmental impacts, cost and presence of other better alternatives.
Afterwards an evaluation table is prepared presenting BAT candidates versus these
sub-steps and each candidate BAT is scored with the signs (+), (-), or (-/+).
According to the sum of these signs, BAT candidates are classified as “always
applicable”, “not applicable” and “applicable depending on local conditions” for
that sector.
Another candidate BAT assessment and selection approach was demonstrated in the
paper by Nicholas et al.[22]. They described LCA tool to assess BAT candidates like
Dijkmans [21]. In the paper it was mentioned that LCA is a requirement of the IPPC
Directive. Moreover it was stated that by Nicholas et al. [22], this tool provides
comparison of different environmental impacts on a certain set of impact categories
that are acidification, depletion of nonrenewables, depletion of ozone layer,
eutrophication, greenhouse effect, photochemical ozone creation, aquatic toxicity,
terrestrial toxicity and human toxicity. However, it was also reported that some
uncertainties and methodological difficulties of regarding this tool also present.
Comparing the study of Nicholas et al.[22] with the previous one undertaken by
Dijkmans [21], it can be deduced that LCA is a more complicated tool to evaluate
environmental effects of a candidate BAT. On the other hand, the other tool
described by Dijkmans [21], one includes assessment on technical feasibility, cost
and presence of other better alternatives. Another difference between these studies is
that the Dijkmans’s [21], study is more suitable for an overall sector whereas
Nicholas et al.’s [22] for a certain institution. Finally in this study it was mentioned
that some uncertainties and methodological difficulties related to LCA methodology
are present.

25
Georgopoulou et al. [23] performed a study aiming to give information on another
tool to choose BAT for as the studies of Dijkmans [21] and Nicholas et al. [22]. This
tool named BEAsT (BAT Economic Attractiveness Tool) is developed in Greece
within the scope of a reseach project. BEAsT is a Visual Basic based computer
program, assessing both environmental and economic benefits of the selected BAT
options or their combinations. Comparing with the method mentioned by Dijkmans
[21], it is more complicated and comprehensive as LCA [22]. However BEAsT
evaluates environmental benefits as well as economic benefits whereas LCA [22]
only evaluates environmental benefits. The steps of the methodology of BEAsT were
reported as; configuration of installation (Step 1), assessment of environmental
benefits (Step 2), assessment of economic cost and benefits (Step 3), and economic
evaluation of the total investment cost (Step 4). Georgopoulou et al. [23] described
these steps in their paper as follows: First of all, the sector or subsector to be
examined should be selected by the user. Then in the first step of the methodology of
BEAsT, information of the installation for instance the production capacity, currents
emissions-consumptions and possible BAT alternatives or their combinations entered
into the program. Afterwards in the second step, the program calculates the new
consumption and emissions after the implementation of selected BAT alternatives or
their combinations. In the third step; investment cost, operational and maintenance
costs, revenues and avoided cost are calculated. Finally, the program calculates the
result of benefit/cost ratio considering total costs and total environmental benefits. If
benefit/cost ratio is greater than 1, this BAT alternative is attractive. In addition, with
the help of this ratio comparison of different BAT alternatives can be made.
Karavanas et al. [24] performed a study on another methodology in order to evaluate
facilities in the same sector. This methodology uses operational performance
indicators and requires data on emissions, wastes, resource and energy consumptions
in annually based. As stated in the previous study conducted by Nicholas et al. [22],
in the LCA methodology, impacts categories were defined as acidification, depletion
of non-renewables, depletion of ozone layer, eutrophication, greenhouse effect,
photochemical ozone creation, aquatic toxicity, terrestrial toxicity and human
toxicity. In the study of Karavanas et al. [24], however, environmental impacts are

26
divided into different categories, so called “components”, which are waste
production, resources use, energy consumption, water consumption, water pollution,
gaseous emissions, noise levels, soil pollution and green house gases emissions.
Karavanas et al. [24] produced a function giving a facility a value (FINX) that is an
indicator of BAT application degree of the facility. If a facility gain FINX smaller
than “one”, it means that this facility is compatible with the IPPC Directive. If FINX
is smaller than “two”, larger than “one”; the facility is intermediately compatible
with the IPPC Directive. If it is larger than “two”, the facility is far away from
compliance of the IPPC Directive. In addition in this paper it was stated that with the
help of this method, the facilities in the same sector can be ranked and compared
with each other and the advantage of this methodology was said to give integrated
picture on BAT implementation of a facility.
All of the studies examined are summarized in Table 3.1.

27
Table 3.1. Summary table of all general studies
Aim Result Reference
Giving general
information of
IPPC
Directive,
BAT and
BREF
Documents
Integrated approach is very crucial since this
approach prevents transfer of pollutants from one
media to another.
Scope of the IPPC Directive is highly polluted
large industrial installations.
With the application of the IPPC Directive,
pollution prevention is adopted rather than “after
the fact” approach.
The countries trying enter European Union
including Turkey and acceding countries beside
Member States of European Union are affected by
the IPPC Directive.
Emission Limit Values (ELV) are set based on the
selection and application of BAT rather than
specific ELV’s.
Martinez
[18]
Giving general
information of
the IPPC
Directive,
BAT and
BREF
Documents
The IPPC Directive focuses on the “source
control” of pollution primarily instead of end of
pipe treatment.
The steps in waste management should be
followed are elimination, reduction, recovery,
recycle of wastes. If neither of them is applicable,
end of pipe techniques should be applied to the
wastes.
The Directive both protects the environment and
improves efficiency of business.
O’Maley
[19]
28
Table 3.1. Summary table of all general studies- continued
Aim Result Reference
Giving general
information on
“information
exchange
process” and
BREF
Documents
BAT Information Exchange Process is sharing
information between the Member States and
industries concerning BAT.
The aim of BAT Information Exchange Process
is;
- helping competent authorities in determination
of BAT based permits,
- balancing the process technology in European
Community
- supporting of spreading the information on
attainable emission and consumption levels in
case of application of BAT.
BREF Documents are the result of this process.
The emission and consumption levels determines
that the whether the installation is “best
performing” or “well performing” or “not such
well performing”.
BREF Documents are dynamic in nature and
should be revised due to the improvements in
technology.
Schoenberger
[20]
Description of
a methodology
to choose BAT
for a sector
This method is suitable for an overall sector.
It evaluates of both environmental and
economical aspects.
Steps of BAT selection are;
1. Data collection on;
1.1. sector specific economic data
1.2. candidate BAT
2. BAT candidate evaluation on;
2.1. technical feasibility
2.2. environmental impacts
2.3. cost
2.4. presence of other better alternatives
Dijkmans
[21]

29
Table 3.1. Summary table of all general studies- continued
Aim Result Reference
Giving
information on
a tool (LCA) to
choose BAT
for an
installation.
This tool is suitable for a certain installation.
LCA is a quite comprehensive and complicated
environmental impact assessment tool.
Some uncertainties and methodological
difficulties are present.
LCA is a requirement of the IPPC Directive.
Environmental impacts categories are;
o acidification,
o depletion of nonrenewables,
o depletion of ozone layer,
o eutrophication,
o greenhouse effect,
o photochemical ozone creation,
o aquatic toxicity,
o terrestrial toxicity and human toxicity,
o waste production
Nicholas et al.
[22]
Giving
information on
a tool (BEAsT)
to choose BAT
for an
installation.
This tool evaluates both environmental and
economical benefits of BAT,
It is complicated and comprehensive as LCA.
The steps of BEAsT are;
o configuration of installation,
o assessment of environmental benefits,
o assessment of economic cost and benefits,
economic evaluation of the total investment
cost.
If Benefit/Cost greater than 1, BAT alternative is
attractive.
With Benefit/Cost ration comparison of different
BAT alternatives can be made
Georgopoulou
et al. [23]

30
Table 3.1. Summary table of all general studies- continued
Aim Result Reference
Description of
a methodology
to evaluate and
rank BAT
application
degree.
This method uses operational performance
indicators.
It requires of data on emissions, wastes, resource
and energy consumptions in annually based.
Environmental impacts categories are;
o waste production,
o resources use,
o energy consumption,
o water consumption,
o water pollution,
o gaseous emissions,
o noise levels,
o soil pollution,
o green house gases emissions
A function is created giving a facility a value
(FINX) that is an indicator of BAT application
degree of the facility;
o FINX < 1 compatible with the IPPC
Directive
o 1 < FINX < 2 intermediately compatible
with the IPPC Directive
o FINX > 2 incompatible with the IPPC
Directive
Ranking and comparison of the facilities in the
same sector may be possible.
Advantage of this methodology is that it gives
integrated picture on BAT implementation of a
facility.
Karavanas et
al. [24]

31
3.2.2 Sectoral Studies
Apart from the general studies reviewed above, several sector specific BAT
application studies are present in the literature. Most of these studies are carried out
in real plants. Although most of these studies are related to manufacturing sectors,
there are also studies about BAT application on other sectors such as adhesive
application, treatment sector etc. Some of the BAT studies are performed to select
best alternative for a plant or for overall sector in a country, some of which based on
Life Cycle Assessment tool or a model developed. Other purposes might be to
evaluate a plants BAT application ratio or to assess the performance of a plant or a
country by comparing consumption and emission values by the limit values set in
BREF documents.
Valderemma et al. [25] conducted such a sector specific study on a cement
manufacturing plant in Spain that increased its production capacity by the addition of
a new cement production line which is designed considering BAT for the cement
industry. To compare the effects of the new line on the environment with thoseof the
previous lines, they used LCA as a tool as Nicholas et al. [22]. The study showed that
the implementation of the aforesaid measures provides decreases in negative effects
on global warming, acidification, eutrophication, human health, ecosystem quality
and resources by 5%, 15%, 17%, 11%, 11% and 14%, respectively. The results also
indicated that the new line designed considering BAT for cement industries
consumed 8.4%, 14.7% and 25% less electricity, fuel and water respectively.
Moreover, 4%, 20.5%, 54% and 84.7% reduction of emissions to air of CO2, NOx,
SO2 and dust respectively was achieved.
Instead of LCA, Liu and Wen [26] used an approach, so called “Data Envelopment
Analysis (DEA)” for the selection of BAT for thermal power plants in China from
the point of view of energy conservation and pollution prevention. DEA is a
methodology used for performance evaluation of facilities. They created a model to
calculate Technical Efficiency (TE) values to compare BAT alternatives and select
the better one for the Chinese thermal power plants. TE values were function of

32
capital and operational costs, electricity and fuel consumption, NOx, SO2 and dust
emissions. BAT alternatives were evaluated under the topics of: combustion
technologies, denitrification technologies, dedusting technologies and
desulphurization technologies. Under these topics, totally 22 different BAT measures
were compared with the ones serving to the same purposes. For instance, from
combustion technologies, the alternatives of chain-grate boiler, pulverized-coal
furnace, bubbling fluidized bed and circulating fluidized bed are compared according
to their calculated TE values. Data entered into the model was the actual operational
data from Chinese thermal power plants. Calculated TE values indicated that as
BAT measures “chain-grate boiler” from combustion technologies, “Air
Classifier+Selective Catalytic Reduction (SCR)” from dentrification technologies,
“Electrosatic precipitator (ESP)-fabric filter integrated” for dedusting technologies,
“Circulating Fluidized Bed (CFB)-Flue Gas Desulphurization (FGD)” from
desulphurization technologies were the best suitable BAT alternatives for Chinese
thermal power plants. Moreover 22 different optimal combinations of these BAT
alternatives were evaluated by using this model and combinations including CFB
were found out to be more appropriate for thermal power plants in China.
A similar study was conducted by Breched and Tulkens [27] for the limestone
industry in Belgium using another model.. They selected a combination of BATs for
the limestone industry whereas Liu and Wen [26] studied both individual and
combination of BAT options. In the study of Breched and Tulkens [27], it is
mentioned that both environmental protection and technical-economical viability
were considered. The authors benefitted from linear programming during selection of
“Privately Best Combination of Alternative Techniques (P-BCAT)” to minimize
economical cost and “Socially Best Combination of Alternative Techniques (S-
BCAT)” to minimize environmental cost. Another distinction between the study of
Breched and Tulkens [27] and the previous one is that the previous one evaluated
BAT measures that require new investments; on the other hand the study by Breched
and Tulkens [27] assessed BAT measures that require relatively small alterations in
the process such as changing the type of fuel or utilization ratio of different type
kilns present in the facility. Results of the model runs for P-BCAT and S-BCAT
33
were nearly the same which are the production of 1,150 kt lime/yr, extraction of
2,649 kt limestone/yr, use of LRK kiln at 82% of its capacity and use of other type of
kilns at full capacity. However the result on fuel type to be used differentiated
between them, the first one preferred petcoke to be used 5,985 TJ/yr, although the
other one preferred lignite to be used 9,985 TJ/yr. Comparing these two BAT
scenarios it was stated that S-BCAT provided 2% less amount of CO2 emission, yet it
causes 1.2% increase in economical cost.
Silvo et al. [28] assessed whole Finnish pulp and paper industry instead of a plant
study, with regard to their BAT application ratio and comparison of their emission
values with the ones presented in “BREF Document on BAT in the Pulp and Paper
Industry”. Information on the application of BAT measures given in this BREF
Document were gathered from totally 24 different facilities including kraft pulp
mills, paper mills and multi-product mills by questionnaires, whereas data on
emissions were obtained from Finnish Environment Institute. In the study of Silvo et
al. [28], BAT Emission Index (BEI) was generated and calculated as an indicator of
BAT related environmental performance of the facilities.As a result, it was indicated
that BAT in Pulp and Paper BREF document are widely applied in pulp and paper
industry in Finland. Besides, comparing the emission values with the ones in BREF,
it was indicated that 40-100% of the Finnish pulp and paper facilities are in the range
in the emission limit values presented in BREF. Moreover; comparing BEI index,
paper mills and multiproduct mills were shown to have better environmental
performance than the kraft mills in Finland.
A similar study was conducted by Li Rosi et al. [29] as a part of a project aiming to
develop a technically and economically feasible water reuse technique, for the whole
textile sector. In the study of Li Rosi et al. [29], in order to gather information on the
best practices of the sector, both a plant study was conducted and questionnaires
were prepared and sent to the facilities, like Silvo et al. [28]. Effluent samples were
collected during site visits and their treatability was evaluated in the laboratory. A
prototype plant was built with membrane wastewater treatment technology and an
Expert System was developed for online control of the treatment system. Afterwards,

34
a case study was undertaken in a plant which did not use any water reuse in the
process. Concerning aforementioned prototype plant study, water treatment by
membrane and reuse of treated water was suggested as BAT. It is mentioned in this
paper that with the implementation of this BAT, 50% of water saving, 80-90%
removal of total organic matter, 99% removal of total suspended solids, 95-98%
removal of color and finally 80% removal of surfactants were expected.
Another study in the textile sector was undertaken by Kocabaş et al. [30] in a textile
plant in Turkey with the aim of evaluation of water and energy consumption
performances after implementation of proper BAT measures regarding water and
energy consumption minimization. During site visits to the facility, production
process and water and energy consumptions were examined. After the assessment of
gathered information, seven different BAT measures for the minimization of water
consumption beside five different BAT measures for the minimization of energy
consumption were suggested to the facility. After the implementation of these
measures it was observed that 29.5% reduction in total specific water consumption
and 9% reduction in total specific energy consumption were achieved. With these
reductions, specific water consumption of the plant was below the suggested value in
the textile BREF Document; and the specific energy consumption of the plant was at
around the limit value.
Fatta et al. [31] performed a study regarding BAT application in a foundry facility in
Cyprus. They examined BAT measures applied in the facility and compared them
with the ones in “Foundry BREF Document” and “Guideline for foundries”
prepared by National Technical University of Athens in a framework of a project.
The results of the study showed that some of these measures were already applied in
the plant. However emission values were still above the limits mentioned in BREF.
The reason for this situation is mentioned as breakdowns and bad maintenance of the
equipment. In conclusion, totally 11 different measures were suggested to the
facility. Among these measures, five of them are process integrated measures, three
of them are technical measures and three of them are regulations.

35
Barros et al. [32] also carried out a quite comprehensive study in a plant which
produces canned mussel in Spain, with the same goal as Fatta et al. [31], to assess the
extent of the application of BAT measures in the facility. They examined the process,
input and outputs, consumption and emission level of the facility in a very detailed
manner. After these investigations BAT measures applied in the plant were
determined and compared with the ones in the literature. The results indicated that
most of the BAT measures had already been applied. BAT measures were
investigated under five different categories; integrated environmental management
tools, manufacturing process, wastewater treatment plant, waste treatment and
auxiliary operations. Applied and not applied numbers of the measures under these
categories were presented as three to one, seven to three, five to one, three to three
and one to two respectively. In other words totally 19 measures were applied in the
facility among 29 BAT measures stated in the literature.
As mentioned above, BAT are also used in some sectors other than production.
Geldermann et al. [33] conducted a study with the aim of determining candidate
BAT for adhesive application in Germany by undertaking case studies in 18 different
adhesive applying sectors. As a result of their study it was mentioned that VOC
emission is very significant from adhesive application and measures should be taken
to prevent this emission. Moreover, as candidate BAT, exhaust gas cleaning systems
such as absorption or adsorption, reusing solvents after cleaning were presented. In
addition, solvent free or solvent reduced adhesives like powder adhesives, water
based adhesives or radiation hardening coating systems were also suggested as BAT.
However, it is also mentioned in the paper that in some sectors such as tape
production; solvent based adhesives should be used to achieve quality standards.
A table summarizing all above reviewed sector specific studies is presented in Table
3..2.
There are plenty of studies published in the literature in different sectors ranging
from fruit and vegetable processing to heavy ceramic industry, from glass production
to dairy industry. However, any study similar to the ones mentioned above, i.e. plant

36
studies for BAT application ratio or comparison of emissions with BREF
Documents, regarding iron and steel industry was not encountered during the
literature search, although iron and steel industry is a prior sector consuming huge
amount of raw material, water and energy and producing enormous amount of waste
and emission.

37
Tabl
e 3.
.2. S
umm
ary
tabl
e of
all
sect
or sp
ecifi
c st
udie
s
Ref
eren
ce
Val
derra
ma
et a
l. [2
5]
Res
ult
BA
T im
plem
enta
tion
prov
ided
de
crea
ses
of
nega
tive
effe
cts o
n;
glob
al w
arm
ing
(5%
),
acid
ifica
tion
(15%
),
eutro
phic
atio
n (1
7%),
hum
an h
ealth
(11%
),
ecos
yste
m q
ualit
y (1
1%),
reso
urce
s (14
%),
Mor
eove
r les
s con
sum
ptio
n of
;
Elec
trici
ty (8
.4%
),
Fuel
(14.
7%),
Wat
er (2
5%)
and
less
em
issio
ns to
air
of;
CO
2 (4
%),
NO
x (20
.5%
),
SO2 (
54%
),
Dus
t (84
.7%
) w
ere
prov
ided
.
Met
hod
/Tool
Plan
t stu
dy,
LCA
as a
tool
to
com
pare
BA
T al
tern
ativ
es
Aim
Com
paris
on o
f th
e ef
fect
s of
BA
T al
tern
ativ
es
on th
e en
viro
nmen
t
Co
un
try
Spai
n
Sec
tor
Cem
ent
prod
uctio
n

38
Tabl
e 3.
2. S
umm
ary
tabl
e of
all
sect
or sp
ecifi
c st
udie
s - c
ontin
ued
Ref
eren
ce
Liu,
Wen
[2
6]
Bre
ched
an
d Tu
lken
s [2
7]
Res
ult
Mos
t sui
tabl
e B
AT
alte
rnat
ives
wer
e fo
und
as;
com
bust
ion
ch
ain
-gra
te b
oil
er
dent
rific
atio
n
Air
Cla
ssif
ier+
SC
R
dedu
stin
g
ES
P-f
ab
ric
filt
er i
nte
gra
ted
desu
lphu
rizat
ion
CF
B-F
GD
Mor
eove
r com
bina
tions
incl
udin
g CF
B w
ere
foun
d ou
t to
be m
ore
appr
opria
te fo
r the
rmal
pow
er p
lant
s in
Chi
na.
Sam
e re
sults
of P
-BC
AT
and
S-B
CA
T w
ere
as fo
llow
s;
1,15
0 kt
lim
e pr
oduc
tion/
yr ,
2,64
9 kt
lim
esto
ne e
xtra
ctio
n/yr
,
use
of L
RK
kiln
at 8
2% o
f its
capa
city
use
of o
ther
type
of k
ilns a
t ful
l cap
acity
di
ffene
nt re
sult;
P-B
CA
T pr
efer
red
petc
oke
to b
e us
ed 5
,985
TJ/
yr,
S-B
CA
T pr
efef
fed
ligni
te to
be
used
9,9
85 T
J/yr
C
ompa
ring
thes
e tw
o B
AT
scen
ario
s it w
as st
ated
that
S-
BC
AT
prov
ided
2%
less
am
ount
of C
O2 e
miss
ion,
yet
it
caus
es 1
.2%
incr
ease
in e
cono
mic
al c
ost.
Met
hod
/Tool
A m
odel
bas
ed o
n D
EA a
s a to
ol to
co
mpa
re B
AT
alte
rnat
ives
Line
ar
Prog
ram
min
g Pl
ant s
tudy
Aim
Sele
ctio
n of
B
AT
alte
rnat
ives
Sele
ctio
n of
B
AT
com
bina
tion
alte
rnat
ives
Co
un
try
Chi
na
Bel
gium
Sec
tor
Ther
mal
po
wer
pr
oduc
tion
Lim
esto
ne
prod
uctio
n

39
Tabl
e 3.
2. S
umm
ary
tabl
e of
all
sect
or sp
ecifi
c st
udie
s - c
ontin
ued
Ref
eren
ce
Silv
o et
al.
[28]
Li R
osi e
t al
. [29
]
Res
ult
BA
T in
Pul
p an
d Pa
per B
REF
doc
umen
t wer
e w
idel
y ap
plie
d in
pul
p an
d pa
per i
ndus
try in
Fin
land
, 40
-100
% o
f the
Fin
nish
pul
p an
d pa
per f
acili
ties a
re in
the
rang
e in
the
emis
sion
lim
it va
lues
pre
sent
ed in
BR
EF,
Com
parin
g B
EI in
dex,
pap
er m
ills a
nd m
ultip
rodu
ct m
ills
have
bet
ter e
nviro
nmen
tal p
erfo
rman
ce th
an k
raft
mill
s in
Finl
and.
Wat
er tr
eatm
ent b
y m
embr
ane
and
reus
e of
trea
ted
wat
er w
as
sugg
este
d as
BA
T.
With
the
impl
emen
tatio
n of
this
BA
T;
50%
of w
ater
savi
ng
and
rem
oval
of
80-9
0% to
tal o
rgan
ic m
atte
r,
99%
tota
l sus
pend
ed so
lids,
95-9
8% c
olor
80%
surfa
ctan
ts
was
exp
ecte
d.
Met
hod
/Tool
Que
stio
nnai
res t
o de
term
ine
BA
T im
plem
enta
tion
leve
l,
BEI
cal
cula
tion
Que
stio
nnai
res t
o ga
ther
info
rmat
ion
on th
e se
ctor
bes
t pr
actic
es,
Plan
t stu
dy
Aim
Eval
uatio
n of
Fi
nnis
h pu
lp
and
pape
r in
dust
ry w
ith
resp
ect t
o B
REF
do
cum
ent.
Dev
elop
men
t of
a
tech
nica
lly
and
econ
omic
ally
fe
asib
le w
ater
re
use
tech
niqu
e w
hich
is a
lso
viab
le fo
r the
ov
eral
l tex
tile
sect
or.
Co
un
try
Finl
and
Italy
Sec
tor
Pulp
and
pa
per
prod
uctio
n
Text
ile
prod
uctio
n

40
Tabl
e 3
.2. S
umm
ary
tabl
e of
all
sect
or sp
ecifi
c st
udie
s - c
ontin
ued
Ref
eren
ce
Koc
abas
et
al. [
30]
Fatta
et a
l. [3
1]
Res
ult
Mea
sure
s wer
e su
gges
ted
to th
e fa
cilit
y in
the
follo
win
g ca
tego
ries;
min
imiz
atio
n of
wat
er c
onsu
mpt
ion
7 m
easu
res
min
imiz
atio
n of
ene
rgy
cons
umpt
ion
5 m
esur
es
Follo
win
g re
duct
ions
wer
e ac
hiev
ed a
fter B
AT
impl
emen
tatio
n;
29.5
%
tota
l spe
cific
wat
er c
onsu
mpt
ion
9%
tota
l spe
cific
ene
rgy
cons
umpt
ion
Alth
ough
som
e of
thes
e m
easu
res w
ere
appl
ied
in th
e pl
ant,
emis
sion
val
ues a
re st
ill a
bove
the
limits
men
tione
d in
BR
EF.
Mea
sure
s wer
e su
gges
ted
to th
e fa
cilit
y in
the
follo
win
g ca
tego
ries;
proc
ess i
nteg
rate
d
5 m
easu
res,
tech
nica
l 3
mea
sure
s
regu
latio
ns
3 r
egu
lati
on
s
Met
hod
/Tool
Plan
t stu
dy
Plan
t stu
dy
Aim
Eval
uatio
n of
w
ater
and
en
ergy
co
nsum
ptio
n pe
rform
ance
s af
ter
impl
emen
tatio
n of
pro
per
BA
T m
easu
res
Eval
uatio
n of
B
AT
appl
icat
ion
circ
umst
ance
in
a fo
undr
y
Co
un
try
Turk
ey
Cyp
rus
Sec
tor
Text
ile
prod
uctio
n
Cas
ting
indu
stry

41
Tabl
e 3.
2. S
umm
ary
tabl
e of
all
sect
or sp
ecifi
c st
udie
s –
cont
inue
d
Ref
eren
ce
Bar
ros e
t al.
[32]
Gel
derm
ann
et a
l. [3
3]
Res
ult
Inte
grat
ed e
nviro
nmen
tal m
anag
emen
t too
ls
3
appl
ied,
1 n
ot a
pplie
d
man
ufac
turin
g pr
oces
s
7 a
pplie
d, 3
not
ap
plie
d
was
tew
ater
trea
tmen
t pla
nt
5 a
pplie
d, 1
not
ap
plie
d
was
te tr
eatm
ent
3 a
pplie
d, 3
not
app
lied
auxi
liary
ope
ratio
ns
1 a
pplie
d, 2
not
app
lied
VO
C e
mis
sion
is v
ery
sign
ifica
nt fr
om a
dhes
ive
appl
icat
ion.
A
s can
dida
te B
AT
follo
win
gs w
ere
sugg
este
d;
exha
ust g
as c
lean
ing
syst
ems s
uch
as a
bsor
btio
n or
ads
orpt
ion,
reus
ing
solv
ents
afte
r cle
anin
g
solv
ent f
ree
or so
lven
t red
uced
adh
esiv
es li
ke
pow
der a
dhes
ives
, wat
er b
ased
adh
esiv
es o
r ra
diat
ion
hard
enin
g co
atin
g sy
stem
s
Met
hod
/Tool
Plan
t stu
dy
Cas
e st
udie
s
Aim
Eval
uatio
n of
B
AT
appl
icat
ion
circ
umst
ance
in
a m
usse
l ca
nnin
g fa
cilit
y
Det
erm
inat
ion
of
cand
idat
e B
AT
mea
sure
s for
ad
hesi
ve
appl
icat
ion
sect
or
Co
un
try
Spai
n
Ger
man
y
Sec
tor
Seaf
ood
indu
stry
Adh
esiv
e ap
plic
atio
n

42
3.2.3 Studies on BAT Suggestions for Integrated Iron and Steel Production
The most comprehensive sources including the most detailed and reliable
information on BAT for integrated iron and steel production are BREF’s. Hence, in
this thesis BREF documents are used as the main source to determine the BAT
alternatives for the facility.
As it is stated in previous sections, BREF documents used in this thesis are
“Reference Document on Best Available Techniques in the Iron and Steel
Production” [8], “Draft Reference Document on Best Available Techniques in the
Iron and Steel Production” [11] for sintering, coke making, iron making, steel
making and casting and “Reference Document on Best Available Techniques in the
Ferrous Metal Processing” [9] for rolling (Detailed information these documents
were given in section 3.1.1.2). BAT alternatives for integrated iron and steel
production plants for all processes listed in BREF’s are presented in Table 3.3. As is
seen from this table, totally 69 different alternatives are suggested in BREF’s.
In this thesis, however, various other techniques apart from techniques in BREF’s are
found from the literature and examined. After the literature survey it was realized
that most of the techniques found in the literature have already been involved in
BREF’s. There are only a few study found suggesting different techniques from
BREF’s. BAT alternatives found from the literature as different from the ones listed
in BREF Documents are presented in Table 3.4. As is seen from this table, only
seven different alternatives different from BREF’s are suggested in the literature and
they are just for sintering and coke making processes.
In Chapter 5, information on the alternatives listed in Table 3.3 and Table 3.4, and
their applicability’s for the facility will be evaluated.

43
Table 3.3. BAT alternatives from BREF Documents
Process BAT Alternative Reference
BREF
Sintering Process Integrated Techniques:
1. Process optimization for minimization of PCDD/F
emissions
2. Recycling iron-containing waste into the sinter plant
3. Lowering the content of volatile hydrocarbons in the sinter
feed
4. Lowering the sulphur content of the sinter feed
5. Heat recovery from sintering and sinter cooling
6. Top layer sintering
7. Waste gas recirculation
8. Suppression of PCDD/F formation by addition of nitrogen
compounds in the sinter mix
Bref on Iron
and steel [8]
Draft Bref on
Iron and Steel
[11]
End of Pipe Techniques:
1. Electrostatic precipitator (ESP)
2. Fabric filter system
3. Cyclone
4. Fine wet scrubber
5. Desulphurization
6. Regenerative active carbon (RAC)
7. Selective catalytic reduction (SCR)
8. Reduction of PCDD/F by means of ESP and additives
Bref on Iron
and steel [8]
Draft Bref on
Iron and Steel
[11]
Coke
Making
Process Integrated Techniques:
1. Smooth and undisturbed operation of the coke oven plant
2. Maintenance of coke ovens
3. Improvement of oven door and frame seals
4. Maintaining free gas flow in the coke oven
5. Emission reduction during coke oven firing
6. Coke dry quenching (CDQ)
7. Large coke oven chambers
8. Non-recovery coking
9. Waste gas recirculation
10. Closed belt conveyors
11. Stabilized coke dry quenching
Bref on Iron
and steel [8]
Draft Bref on
Iron and Steel
[11]

44
Table 3.3. BAT alternatives from BREF Documents- continued
Process BAT Alternative Reference
BREF
End of Pipe Techniques:
1. Minimizing oven charging emissions
2. Sealing of ascension pipes and charging holes
3. Minimizing leakage between coke oven chamber and
heating chamber
4. De-dusting of coke oven pushing
5. Emission minimized wet quenching
6. De-NOx of waste gas from coke oven firing (Selective
catalytic reduction -SCR)
7. Coke oven gas desulphurization
8. Removing tar (and PAH) from the coal water
9. Ammonia stripper
10. Gas-tight operation of the gas treatment plant
11. Wastewater treatment plant
Bref on Iron
and steel [8]
Draft Bref on
Iron and Steel
[11]
Iron
Making
Process Integrated Techniques:
1. Direct injection of reducing agents
2. Energy recovery from blast furnace gas
3. Energy recovery from top gas pressure
4. Energy savings at the hot stove
5. Use of tar-free runner linings
6. Gas recovery system from top hopper release
Bref on Iron
and steel [8]
Draft Bref on
Iron and Steel
[11]
End of Pipe Techniques:
1. Blast furnace gas treatment
2. De-dusting of tap holes and runners
3. Fume suppression during casting
4. Hydro-cyclonage of blast furnace sludge
5. Treatment and reuse of scrubbing water
6. Condensation of fume from slag granulation
Bref on Iron
and steel [8]
Draft Bref on
Iron and Steel
[11]

45
Table 3.3. BAT alternatives from BREF Documents- continued
Process BAT Alternative Reference
BREF
Steel
Making
and casting
Process Integrated Techniques:
1. Energy recovery from BOF gas
2. Lowering the zinc-content of scrap
3. On-line sampling and analysis of steel
Bref on Iron
and steel [8]
Draft Bref on
Iron and Steel
[11]
End of Pipe Techniques:
1. Primary dedusting
2. Particulate matter abatement from pig iron pre-treatment
3. Secondary de-dusting
4. Dust hot briquetting and recycling
5. Treatment of wastewater from wet de-dusting
6. Treatment of wastewater from continuous casting
Bref on Iron
and steel [8]
Draft Bref on
Iron and Steel
[11]
Rolling Process Integrated Techniques:
1. Regenerative burner system
2. Recuperator and recuperative burners
3. Limitations of burning temperature
4. Low NOx Burners
5. External flue gas recirculation
Bref on
Ferrous Metal
Processing
[9]
End of Pipe Techniques:
1. Selective catalytic reduction (SCR)
2. Selective non-catalytic reduction (SNCR)
3. Treatment of cooling water
Bref on
Ferrous Metal
Processing [9]

46
Table 3.4. Other techniques suggested in the literature
Process Technique Reference
Sintering 1. Twin layer charging
2. Intensive mixing and granulation system- IMGS
3. Biological treatment of oily mill scale
4. Use of novel filter for dust and heavy metal treatment
[34]
[34]
[35]
[36]
Coke Making 1. Preheating of coal, combustion air and fuel
2. Hydrogen and methanol production from COG
3. Heat recovery from COG
[37]
[38],[39]
[37]
Iron Making Any techniques other than the ones in BREF documents can not
be found in the literature -
Steel Making
and casting
Any techniques other than the ones in BREF documents can not
be found in the literature -
Rolling Any techniques other than the ones in BREF documents can not
be found in the literature -

47
4. METHODOLOGY
CHAPTER 4
METHODOLOGY
The study was conducted in an integrated iron and steel plant having a production
capacity of 4.10 million tons/year crude-steel in 2011. Considering that there are
three integrated iron and steel plants in Turkey with a total steel production capacity
of 8.17 million tons crude-steel/year (2011) [3], and all of them apply nearly the
same manufacture technologies, the plant studied having the share of about 50% in
production is considered as a representative sample of Turkish Iron and Steel
Industry in terms of manufacturing technologies. The study was carried out in eight
stages;
Step 1- Preliminary study: literature study and site visits
Step 2- Input/output analysis
Step 3- Performance evaluation of the facility
Step 4- Determination of potential BAT for the facility
Step 5- Calculation of cross-media effects of selected BAT alternatives
Step 6- Calculation of cost of selected BAT alternatives
Step 7- Evaluation of selected BAT alternatives
Step 8- Evaluation of economic viability in the sector
In the following sections, the methodology followed at each step is described.
48
4.1 Step 1- Preliminary Study: Literature Study and Site Visits
Initially, a literature review was carried out and five site visits were made to the
facility between 2010 and 2011 in order to examine the manufacturing processes and
to collect the information necessary to carry out the input/output analysis.
During the literature review, the main documents used were the BREF Documents.
In addition to BREF documents, thesis, academic articles and technical reports
obtained from literature and from the facility were used.
During site visits to the facility, all sub-processes in steel production were visited to
get in depth technical information. The basic steps and crucial points of steel
production were learned. The chemical reactions and physical operations taken place
in the production processes and physical and biological operations in treatment
processes in the facility were studied in detail. In addition, the raw materials used
and products, side-products and wastes produced were observed during site visits.
The function of raw materials, the characteristics and composition of products, side-
products and wastes were determined. Moreover, waste and emission production
points were seen as well.
Furthermore, information obtained from the literature was discussed with the
technical staff of the plant and process of the facility was compared by integrated
iron and steel production in the literature. The methods applied in the facility for the
production, emission prevention, recycle, reuse, waste minimization are investigated
in detail. During site visits, technical staff gave information on the wastes reused or
disposed directly, on emissions and wastes generate problems for the facility.
Finally, the flow pathways of all inputs and outputs were determined and
comprehensive process flow diagrams were prepared for all sub-processes.

49
4.2 Step 2- Input/Output Analysis
In the facility, for a proper management of the operation, comprehensive reports are
prepared annually for every sub-processes by the technical staff. These reports
include the quantities of all inputs and outputs, some technical parameters indicating
the performance of the sub-process, operational pauses, working accidents etc. In this
step, these annual reports of all sub-processes of the facility are investigated in detail
in order to obtain information on all inputs and outputs of all sub-processes.
Afterwards in consideration of this information, a comprehensive material flow
analysis was performed for the plant. All inputs (energy, raw material, water etc.)
and outputs (product, by-product, waste etc.) involved in all sub-processes in the
facility were determined.
Since the facility is an integrated plant, product of a sub-process is raw material of
downstream sub-process. Some contradictions between interdependent sub-processes
were noticed. As an example, the information gained from “blast furnace annual
report” on the amount of liquid iron that is sent to basic oxygen furnace is
incompatible with the information obtained from “basic oxygen furnace annual
report” on the amount of liquid iron that is taken from blast furnace. Such
contradictions among the data are corrected by means of discussions with the
technical staff of the plant.
In addition, emissions of all sub-processes to air (as mg/m3 or g/m3) are specified by
examining various emission reports of the facility.
4.3 Step 3- Performance Evaluation of the Facility
Specific energy (MJ/ton product), water (m3/ton product) and raw material
consumptions (ton/ton product), and waste generation rates (ton/ton product) were
calculated simply by dividing the yearly generation of waste, and consumption of
energy, water and raw material to the yearly production of the sub-process.
Afterwards, calculated specific consumptions and generation rates of all sub-

50
processes compared with the values given in BREF documents. Moreover, air
emissions of all sub-processes that are obtained from the previous step are directly
compared with the emission values presented in BREF documents as well.
The values given in BREF documents were used to evaluate the performance of the
plant, since BREF documents include the most comprehensive and reliable
information on iron and steel production as it is mentioned in Chapter 2.
At the end, specific consumption and generation rates, and emission values outside
the limits set in BREF documents were determined and the reasons behind these
were discussed with the technical staff of the facility.
4.4 Step 4- Determination of Potential BAT for the Facility
All BAT possibilities listed in BREF documents and other sources in the literature
were compiled and a long list of BAT options was prepared. These BAT possibilities
were mentioned in Section 3.3 previously. Then the BAT options included in the list
were evaluated according to their applicabilities in the facility. The techniques that
have already been fully and/or partially applied at the plant and can/cannot be
applied were determined. Technical feasibility, environmental benefits with respect
to air, water, and soil pollution, waste products, energy use, use of natural resources,
noise, and cost affordability were considered in the evaluation of the BAT. All
possible BAT gathered from the literature were reviewed; and a short-list of BAT
was made considering their advantages, disadvantages, benefits on energy and
emission reductions and approximate application costs. Finally, applicable BAT
alternatives in this short list were suggested to the authority of the facility.
4.5 Step 5-Calculation of Cross-Media Effects of Selected BAT Alternatives
In this step, two of the applicable alternatives which are listed in abovementioned
short list were selected. Selection of these BAT alternatives was made considering

51
the most significant environmental problem in the facility, emissions to air
(especially dust emission).
As it is mentioned in Section 3.1.1.2, selected two BAT alternatives were assessed
according to their environmental impacts with the use of four guidelines (Guidelines
1 to 4) presented in BREF on Economics and Cross-Media Effects [7] which help the
user to determine which alternative technique is the best environmental option. These
guidelines are “Scope and identification of the alternative options”, “Inventory of
emissions”, “Calculation of the cross-media effects” and “Interpretation of the cross-
media effects” respectively presented below.
Guideline 1-Scope and identification of the alternative options:
In this step, selected BAT alternatives should be described in sufficient detail. The
aim of the application of the alternatives and the average removal efficiencies of the
selected BAT alternatives were determined in this stage. In addition, capacity of the
suggestion was fixed to provide comparison on an equal basis.
Guideline 2- Inventory of consumptions and emissions:
In this stage, quantity of emissions and consumptions were presented aiming to
provide inventory for the following steps described in Guideline 3 and 4. According
to BREF on Economics and Cross-Media Effects [7], the amounts of following terms
should be determined;
1. Pollutant released,
2. Consumption of energy,
3. Consumption of raw materials including water,
4. Wastes produced
52
(1) In this study, in order to calculate the amount of pollutant released from BAT
alternatives, their emissions to air determined previously in Step 2, are converted
from “mg/m3 to “kg/yr” or “g/yr”.
(2) It is stated in BREF on Economics and Cross-Media Effects that, in
determination of consumption of energy, average heat and electricity usage of the
selected BAT alternatives should be considered. Afterwards emission released for
creation of these energy sources utilized should be calculated. Since the selected
BAT options consume only electricity as energy source, no heat consumption was
determined in this study, instead only electricity consumption was specified for the
selected BAT alternatives. The data on annual electricity consumption of the selected
BAT options were taken from Draft BREF Document on Iron and Steel Production
[11].
According to BREF on Economics and Cross-Media Effects, emissions caused by
electricity consumed by the alternatives were calculated according to the Table 1 in
Annex 8 of this document. However, in there it is also stated that if the data on local
use of primary energy for electricity generation is achievable, using of this data
rather than the one presented in BREF Document gives more reliable results, since
the emissions are highly dependent on the primary energy of electricity generation.
Therefore in this study “mass of emissions for 1 GJ electricity consumption” was
calculated using local data.
Initially, Turkish electricity supply distribution was provided from a report belonging
to Turkish local authority related to electricity production in Turkey. By this way,
percentages of Turkish electricity production from natural gas, coal, hydraulic energy
etc. were determined. Afterwards, the amounts of emissions caused by these sources
for the production of 1MWh electricity were found from the literature. Finally, by
taking weighted mean of all emissions, mass of emissions from MWh electricity
production was calculated.

53
(3) and (4) Since raw material consumptions and waste productions of the selected
BAT alternatives could not be found from literature, these values were not taken into
account.
Guideline 3- Calculation of the cross-media effects:
The effects of different pollutants released to the environment by the selected
alternatives were calculated with respect to seven impact categories; human toxicity,
global warming, aquatic toxicity, acidification, eutrophication, ozone depletion,
photochemical ozone creation and their effects on the same impact categories were
compared.
In these calculations, formulas and tables given in the BREF on Economics Cross-
Media Effects were considered. Summary of the cross-media calculation procedure is
given in Table 4.1. In this table, unit, medium affected by the pollutant, formula used
in the calculation of potential impacts and the reference tables where the values of
factors or potentials were obtained are summarized for all impact categories.
For instance; supposing that 1.3 kg of SO2 emission is achieved with the application
of a BAT alternative; human toxicity factor for SO2 is found to be 13 from Annex 1
of the Reference Document on Economics and Cross-Media Effects. Inserting this
value and mass of SO2 (1.3 kg) into the formula given at the first raw of the Table
4.1, human toxicity potential caused by SO2 is found 0.1 kg. Calculating for all
substances caused with the application of BAT alternative and summing all of them,
total human toxicity potential is calculated as CO2 equivalent.
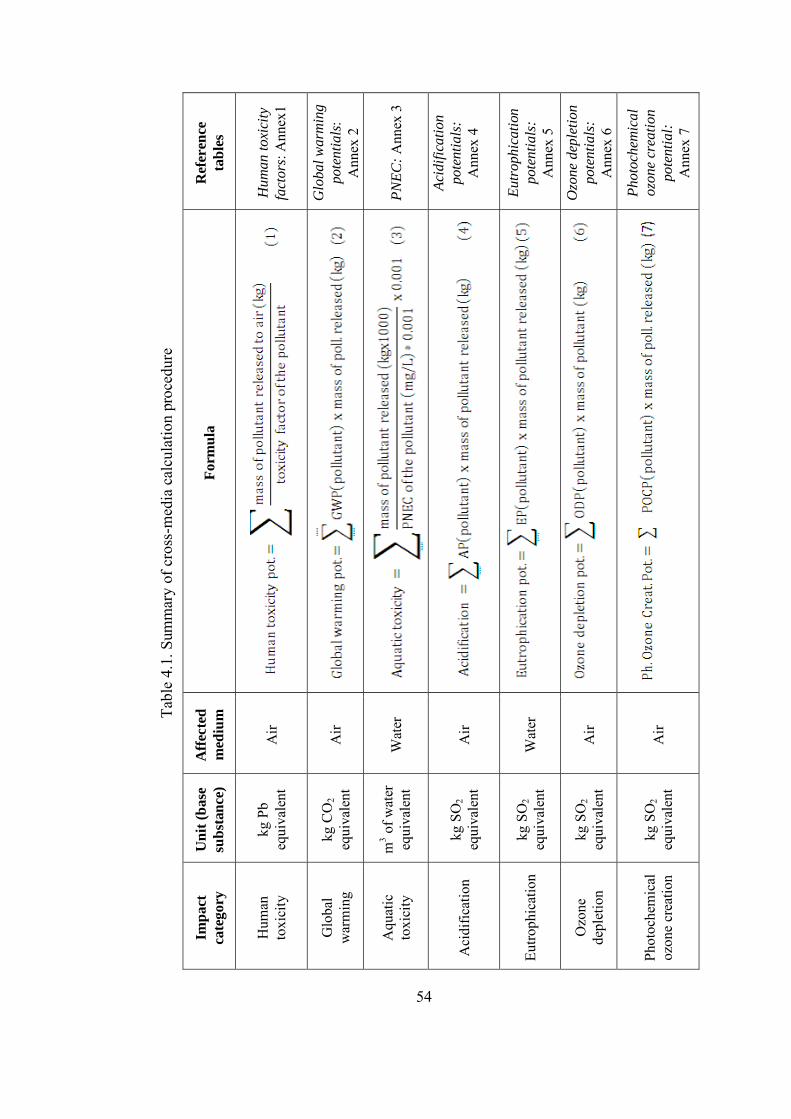
54
Tabl
e 4.
1. S
umm
ary
of c
ross
-med
ia c
alcu
latio
n pr
oced
ure
Ref
eren
ce
tab
les
Hu
ma
n t
oxi
city
fact
ors
: Ann
ex1
Glo
ba
l w
arm
ing
po
ten
tia
ls:
Ann
ex 2
PN
EC
: A
nnex
3
Aci
dif
ica
tio
n
po
ten
tia
ls:
Ann
ex 4
Eu
tro
ph
ica
tion
po
ten
tia
ls:
Ann
ex 5
Ozo
ne
dep
leti
on
po
ten
tia
ls:
Ann
ex 6
Ph
oto
chem
ica
l
ozo
ne
crea
tio
n
po
ten
tia
l:
Ann
ex 7
Form
ula
Aff
ecte
d
med
ium
Air
Air
Wat
er
Air
Wat
er
Air
Air
Un
it (
ba
se
sub
stan
ce)
kg P
b eq
uiva
lent
kg C
O2
equi
vale
nt
m3 o
f wat
er
equi
vale
nt
kg S
O2
equi
vale
nt
kg S
O2
equi
vale
nt
kg S
O2
equi
vale
nt
kg S
O2
equi
vale
nt
Imp
act
cate
go
ry
Hum
an
toxi
city
Glo
bal
war
min
g
Aqu
atic
to
xici
ty
Aci
dific
atio
n
Eutro
phic
atio
n
Ozo
ne
depl
etio
n
Phot
oche
mic
al
ozon
e cr
eatio
n

55
Guideline 4- Interpretation of the cross-media effects:
Cross-media effects of the BAT alternatives on the same impact category calculated
in the previous stage were compared and interpreted in this stage. Comparison was
made with respect to abovementioned seven impact categories as well as energy
consumed by the two alternatives. An alternative having the lower environmental
impacts was chosen for every impact categories and energy consumption.
4.6 Step 6- Calculation of Cost of Selected BAT Alternatives
In this step, as it is mentioned in Section 3.1.1.2, selected two BAT alternatives were
assessed according to their costs including investment cost, operating and
maintenance cost etc., with the use of five guidelines (Guidelines 5 to 9) presented in
BREF on Economics and Cross-Media Effects [7].
Guideline 5- Scope and identification of the alternative options:
First stage of costing methodology is nearly the same as the cross-media
methodology. Yet, costing methodology requires more information in addition to the
ones in cross media methodology such as technical characteristic of the alternatives
involving technical and economic lifetime of the equipment, and operational data
including energy consumption and removal efficiencies.
Guideline 6- Gathering and validation of the cost data:
Investment and operational cost data used in the calculation of cost of the alternatives
are taken from the Draft BREF Document on Iron and Steel Production. Since this
investment and operational cost data for both alternatives given in this document was
as range instead of a single value, average of these ranges were taken for both BAT
alternatives. Different sources were researched to validate cost data in the literature
and from the design companies; any of appropriate information cannot be obtained.
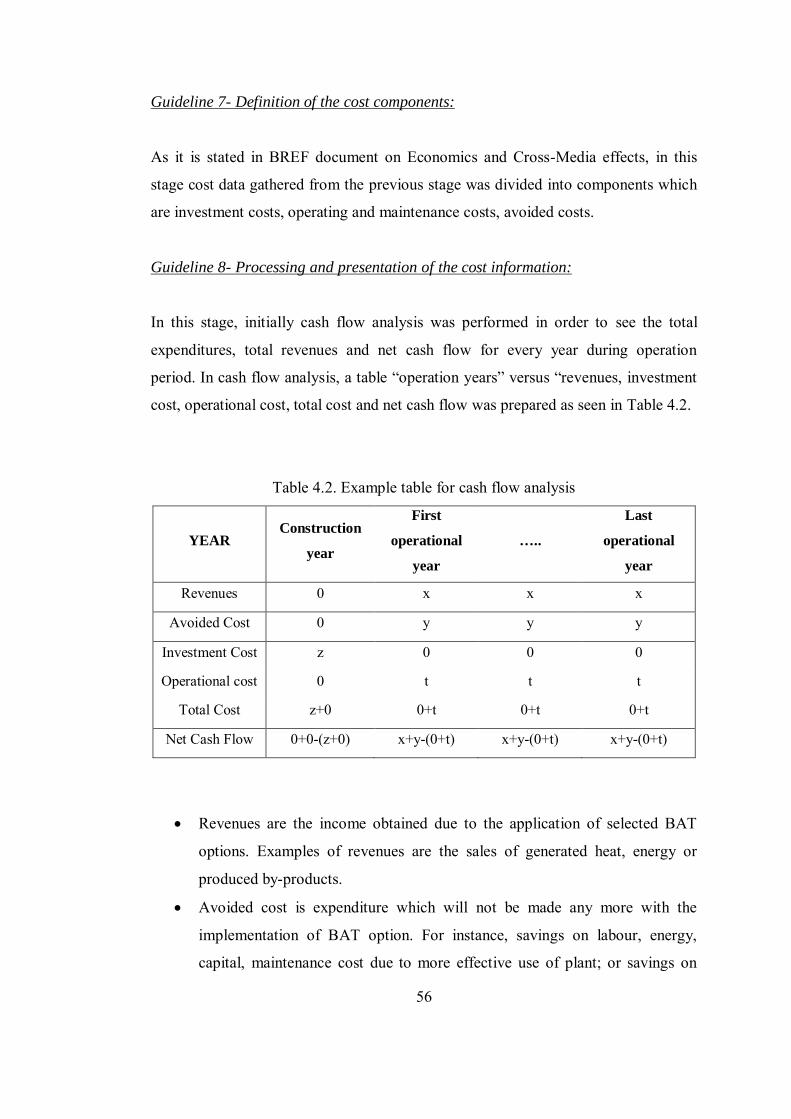
56
Guideline 7- Definition of the cost components:
As it is stated in BREF document on Economics and Cross-Media effects, in this
stage cost data gathered from the previous stage was divided into components which
are investment costs, operating and maintenance costs, avoided costs.
Guideline 8- Processing and presentation of the cost information:
In this stage, initially cash flow analysis was performed in order to see the total
expenditures, total revenues and net cash flow for every year during operation
period. In cash flow analysis, a table “operation years” versus “revenues, investment
cost, operational cost, total cost and net cash flow was prepared as seen in Table 4.2.
Table 4.2. Example table for cash flow analysis
YEAR Construction
year
First
operational
year
…..
Last
operational
year
Revenues 0 x x x
Avoided Cost 0 y y y
Investment Cost z 0 0 0
Operational cost 0 t t t
Total Cost z+0 0+t 0+t 0+t
Net Cash Flow 0+0-(z+0) x+y-(0+t) x+y-(0+t) x+y-(0+t)
Revenues are the income obtained due to the application of selected BAT
options. Examples of revenues are the sales of generated heat, energy or
produced by-products.
Avoided cost is expenditure which will not be made any more with the
implementation of BAT option. For instance, savings on labour, energy,
capital, maintenance cost due to more effective use of plant; or savings on
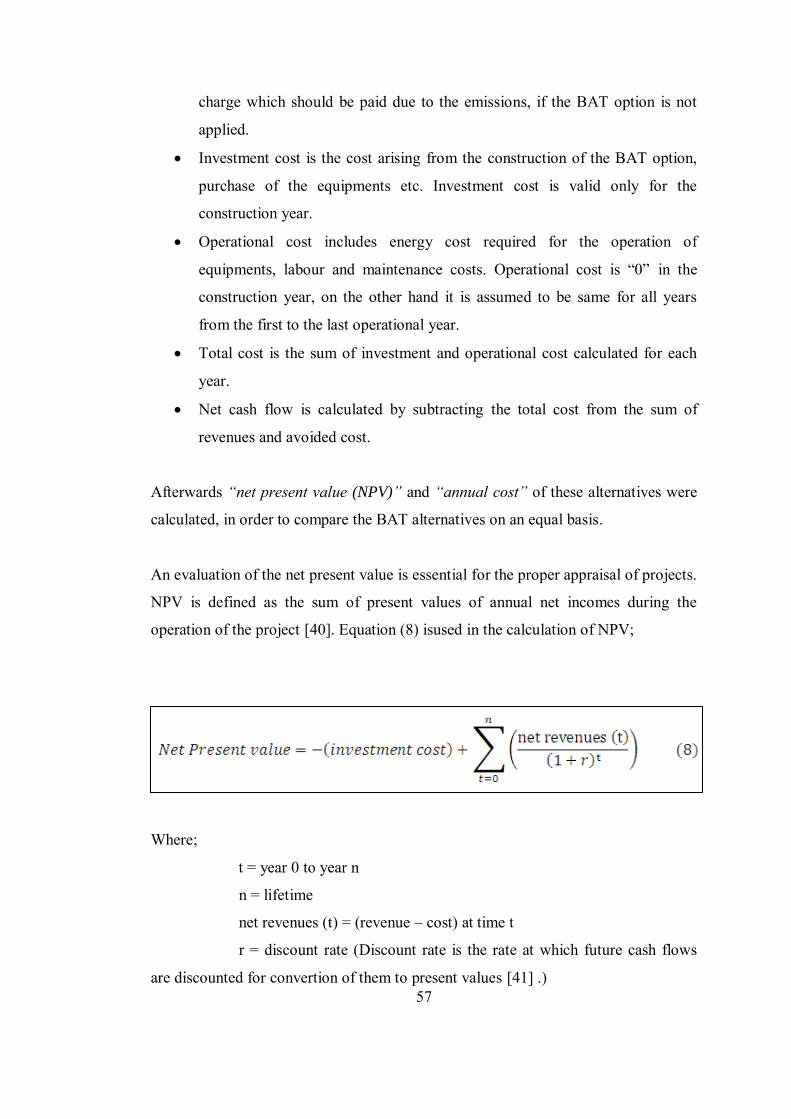
57
charge which should be paid due to the emissions, if the BAT option is not
applied.
Investment cost is the cost arising from the construction of the BAT option,
purchase of the equipments etc. Investment cost is valid only for the
construction year.
Operational cost includes energy cost required for the operation of
equipments, labour and maintenance costs. Operational cost is “0” in the
construction year, on the other hand it is assumed to be same for all years
from the first to the last operational year.
Total cost is the sum of investment and operational cost calculated for each
year.
Net cash flow is calculated by subtracting the total cost from the sum of
revenues and avoided cost.
Afterwards “net present value (NPV)” and “annual cost” of these alternatives were
calculated, in order to compare the BAT alternatives on an equal basis.
An evaluation of the net present value is essential for the proper appraisal of projects.
NPV is defined as the sum of present values of annual net incomes during the
operation of the project [40]. Equation (8) isused in the calculation of NPV;
Where;
t = year 0 to year n
n = lifetime
net revenues (t) = (revenue – cost) at time t
r = discount rate (Discount rate is the rate at which future cash flows
are discounted for convertion of them to present values [41] .)

58
On the other hand, annual cost is calculated with the conversion of all the cash flows
over the life years of the BAT alternative to an equivalent annual cost [7]. The
formulation of annual cost is presented below in equation (9).
Where;
C = investment cost
n = lifetime
r = discount rate
OC = operating and maintenance cost
Guideline 9- Attribution of cost to environmental protection:
As the stated in the BREF document on Economics and Cross-Media Effects,
purpose of the alternative should be transparently distinguished, (1) those to be
implemented for reduction or prevention of the environmental pollution, and (2)
those for other reasons such as investment expenditure in waste minimization or
energy conservation. It is also stated that generally end-of-pipe techniques aim to
reduce or prevent emissions. In this stage the purpose of the alternatives were stated
clearly.
4.7 Step 7- Evaluation of Selected BAT Alternatives
Evaluation of alternatives was performed with cost effectiveness analysis. It is a well
known and simple technique in preparation or implementation of environmental
policy [7]. With this method, comparison of two or more BAT alternatives is
provided by considering both their costs and effectiveness’s, as the name implies.

59
The basic concept is dividing “annual cost” of the implementation of BAT options
into “annual reduction” provided by the implementation of BAT options. In other
words, the unit cost per reduction is calculated. Equational representation of cost
effectiveness (CE) calculation is given in Bref Documument on Economics and
Crosss-Media Effects [7] as in equation (10);
Annual cost had already been calculated in the previous section by means of equation
(9) in €/yr or $/yr. On the other hand, annual reduction of emission was calculated
considering the reduction efficiencies of the alternatives. For instance, if the
alternative is implemented in order to provide reduction of dust emission, annual
reduction is the mass of annually reduced dust (tons/yr). The unit of CE becomes
than €/tons or $/tons.
As stated above, the cost effectiveness analysis is performed in order to compare two
or more BAT options. Comparison is made with respect to their CE values. The BAT
alternative having smaller CE value means that it provides the same effectiveness
with less cost than the one having larger CE value. Therefore the BAT alternative
having smaller CE value was selected to be the most feasible option.
4.8 Step 8- Evaluation of Economic Viability in the Sector
Apart from the environmental benefits and cost, another important issue related to
BAT alternative is its economic viability in the sector. It is evaluated by considering
“Market Structure” and “Industry Structure” [7] in the last step.

60
With the examination of industry structure, the socio-economic characteristics of iron
and steel sector were determined. In this framework, size and number of the plants in
the iron and steel sector was specified. Furthermore, technical and economical
characteristics of the facility in the sector and the vision of the facility on the
protection of the environment were specified. These issues are very crucial in the
application of selected BAT alternative.
Another important issue considered was market structure, since market has a
substantial power on the industry. In this context, extent of the market, including
situation of iron and steel sector in domestic and foreign market, was examined.

61
CHAPTER 5
5. RESULTS AND DISCUSSION
RESULTS AND DISCUSSION
As it was stated in Chapter 1, the main goal of the study is to evaluate the
environmental performance of an integrated iron and steel plant in Turkey and to
suggest BAT alternatives suitable for this plant, by considering the environmental
impacts and cost/effectiveness of these alternatives. Initially the process of general
iron and steel production and process of the plant was studied. Afterwards, all inputs
and outputs of all sub-processes were determined. After processing the data obtained
from input/output analysis, specific emission and consumptions of all sub-processes
were calculated and compared with European Union’s iron and steel plants. Then,
potential BAT list for the plant is determined and eliminated according to their
applicabilities in the facility. Finally, two of the applicable BAT alternatives were
selected and their Cross-media effects and cost-effectiveness’ were calculated and
compared with each other.
In the previous chapter, this methodology was described in detail in eight steps. In
this chapter, results of these steps were presented respectively.
5.1 Step 1- Preliminary Study: Literature Study and Site Visits
The facility in which the study was conducted is an integrated iron and steel plant.
As it was mentioned before, it represents Turkish integrated iron and steel production
with respect to the manufacture technologies and production capacity. The facility
has a conventional integrated iron and steel production process, including sintering,
coke making, iron making, steel making, casting and rolling as sub-process as
presented in Figure 5.1.
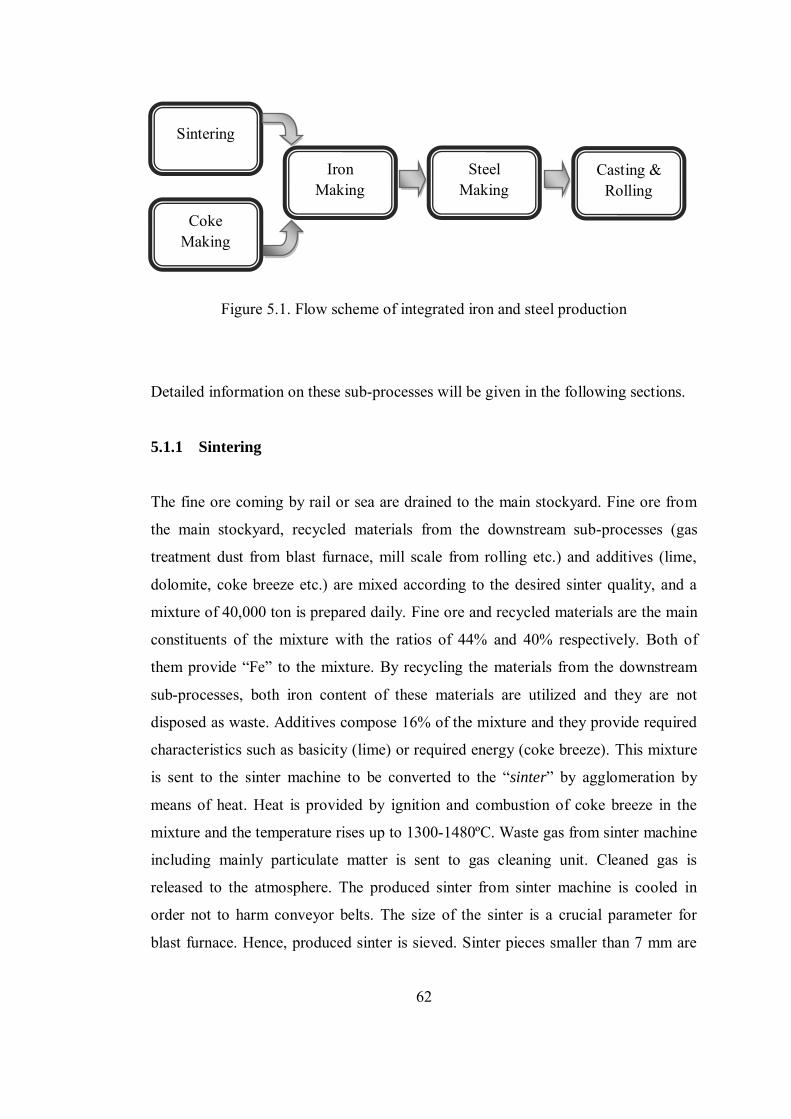
62
Figure 5.1. Flow scheme of integrated iron and steel production
Detailed information on these sub-processes will be given in the following sections.
5.1.1 Sintering
The fine ore coming by rail or sea are drained to the main stockyard. Fine ore from
the main stockyard, recycled materials from the downstream sub-processes (gas
treatment dust from blast furnace, mill scale from rolling etc.) and additives (lime,
dolomite, coke breeze etc.) are mixed according to the desired sinter quality, and a
mixture of 40,000 ton is prepared daily. Fine ore and recycled materials are the main
constituents of the mixture with the ratios of 44% and 40% respectively. Both of
them provide “Fe” to the mixture. By recycling the materials from the downstream
sub-processes, both iron content of these materials are utilized and they are not
disposed as waste. Additives compose 16% of the mixture and they provide required
characteristics such as basicity (lime) or required energy (coke breeze). This mixture
is sent to the sinter machine to be converted to the “sinter” by agglomeration by
means of heat. Heat is provided by ignition and combustion of coke breeze in the
mixture and the temperature rises up to 1300-1480ºC. Waste gas from sinter machine
including mainly particulate matter is sent to gas cleaning unit. Cleaned gas is
released to the atmosphere. The produced sinter from sinter machine is cooled in
order not to harm conveyor belts. The size of the sinter is a crucial parameter for
blast furnace. Hence, produced sinter is sieved. Sinter pieces smaller than 7 mm are
Sintering
Coke Making
Iron Making
Steel Making
Casting & Rolling

63
sent to the stockyard, between 7 mm and 25 mm to sinter the machine and larger than
25 mm to the blast furnace. Process flow of the sintering is presented in Figure 5.2.
Figure 5.2. Flow diagram of sintering
As all sinter plants, the main problem related to this sinter plant is high emissions
especially dust and other substances such as CO, CO2, SO2, NO, NO2, HCl, HF, D/F,
heavy metals. Some precautions have been taken in this plant for emission problem,
the most important one is gas cleaning unit mentioned above. “Wet cyclones” are
being used as gas cleaning devices. However, cyclones are outdated technologies and
they have low efficiencies about 70%. As a result, emissions from sinter machines
create environmental problems.
Another precaution taken for emission problem are dust collecting systems for dusts
arising from charging and conveying. On the other hand, for the other important
>25mm
Mixture preparing
Blast Furnace
Stock yard
Mixing
Sinter machine
Sieving
<7mm
>7mm <25mm
Gas cleaning Atmosphere Clean gas
Cooling

64
concern for sinter plants, energy efficiency, waste heat from sinter cooler is reused in
this sinter plant.
5.1.2 Coke Making
Coal coming from Canada, Australia, USA, Poland, China and Ukraine by sea is
drained into the stockyard. Different types of coal are prepared and mixed according
to the desired coke quality and sent to the coke batteries. In the facility, six coke
batteries are present, two of them are old, two of them are new, one of them is being
modernized and the last one is not used. Every battery is composed of 65-69 coke
ovens, where coking process takes place. After 19 hours coking time, coal is
converted to coke by pyrolisis as mentioned in detail in Section 1.3 and pushed from
coke ovens.
Finally the temperature of coke produced is decreased, in other words it is quenched,
in order to be transferred easily. There are two types of quenching process, wet and
dry quenching and both of them are being used in this coke oven plant. Dry
quenching is a more environmental friendly method comparing to wet quenching. In
wet quenching, water is sprayed onto the hot coke whereas in dry quenching,
nitrogen gas is passed above hot coke, so that the heat is transferred from coke to the
nitrogen gas indirectly. With dry quenching emissions are prevented, in addition the
heated nitrogen gas is used in steam generation. By this way energy is hot coke is
reused. Moreover, in dry quenching no water is used. However, operation of dry
quenching is more complex and construction cost is higher comparing to wet
quenching.
After quenching, coke is sent to blast furnace (iron making) to be used as fuel in
order to provide sufficient heat for melting of iron.
As it is mentioned in Section 2.3, coke oven gas (COG) is a valuable gas having a
high calorific value (~4350 kcal/m3) that is originated from its high amount of H2

65
and CH4 components. Composition of COG from the facility is presented in Table
5.1.
Table 5.1. Composition of COG
Component % (volume based)
H2 59.60
CH4 25.28
CO 6.05
N2 4.72
CnHm 2.63
CO2 1.35
O2 0.39
Before using COG as fuel, it should be cleaned, in other words undesired substances
should be removed from COG, in other words COG should be treated. The flow
diagram of COG treatment process is presented in Figure 5.3.
First of all, COG is washed with ammonia water in “goose neck” in order to be
cooled. This cooling provides that tar in gas form in the COG becomes liquid. COG,
tar and ammonia water mixture is separated in “separator” and COG is sent to
ammonium sulphate production unit whereas, ammonia water and tar mixture comes
to “decanter” to be separated again. In decanter unit, ammonia water, tar and tar and
coke breeze mixture are separated physically with respect to their densities.
Ammonia water (~1 gr/cm3) is sent to goose neck to be reused in gas cooling.
However, due to the moisture in the coal, the amount of ammonia water in the
system increases in time. The quantity of ammonia water in the system should be
fixed, hence the excess ammonia water is removed from the system and sent to
“ammonia stripping” unit prior to “biological treatment”. After biological treatment,
clean water is disposed to receiving body (Mediterranean Sea). On the other hand, tar
(~1.2 gr/cm3) is taken from decanter and stored whereas tar and coke breeze mixture

66
(~1.25 gr/cm3) is sent to coke ovens in order to be incinerated after “sedimentation
unit”.
On the other side, in ammonium sulphate production unit, ammonia present in the
COG is converted to ammonium sulphate (fertilizer) by addition of sulphuric acid.
Finally, COG comes to benzole scrubbers, where benzole in COG is removed. So
that, COG becomes exactly clean and ready to be used as fuel in the facility.
As stated earlier, ammonium sulphate (fertilizer), benzole and tar are the side
products of COG treatment process and they are sold.
Previously, the main environmental problem related to coke ovens was stated as
emissions. This is valid for this coke oven plant as well. More crucial emissions
arising are dust, NO, NOx, SO2 and CO. For dust emission prevention, dust
collection systems for dusts arising from charging and conveying, and a sprinkler
system in stockyard for dust emission due to the wind are being in use in this coke
oven plant. For the other important issue which is energy consumption, neither
precaution is taken in this coke oven plant.

67
Exce
ss
amm
onia
w
ater
Am
mo
nia
stri
pp
er
Bio
log
ica
l
trea
tmen
t R
ecei
ving
bo
dy
Cle
an
wat
er
NaO
H
Oil
H2S
O4
Co
ke
ov
ens
CO
G +
tar +
am
mon
ia
wat
er
Go
ose
nec
k
C
OG
Sep
era
tor
Am
on
niu
m
sulp
ha
te
pro
du
ctio
n u
nit
CO
G
CO
G
Ben
zole
scu
bb
ers
Side
pro
duct
: A
mm
oniu
m
Supl
hate
Si
de p
rodu
ct: T
ar
Side
pro
duct
: B
enzo
le
PR
OD
UC
T:
Cle
an C
OG
Sed
imen
tati
on
un
it
Dec
an
ter
Am
mon
ia w
ater
Tar
Tar +
Cok
e B
reez
e
Figu
re 5
.3. F
low
sche
me
of C
OG
trea
tmen
t pro
cess
67

68
5.1.3 Iron Making
In iron making process, sinter from sinter plant, lump iron ore, additives (limestone,
dolomite, dunit, magnesite), coke from coke oven plant and pulverized coal from
coal preparation unit are filled into blast furnace (BF). To supply heat, coke and
pulverized coal is burned by the hot air provided from hot stoves. After blast furnace
feed is liquefied, liquid slag and liquid iron are separated from each other by density
difference. Finally most of the liquid iron is sent to the basic oxygen furnace (steel
making) to be converted to liquid slag. On the other hand, a small portion of the
liquid iron is sent to pig iron casting plant and sold to the foundries. In the facility
three blast furnaces are in use, one of them is new comparing to other two. In the
new blast furnace, an integrated slag granulation system is present which granulates
slag on site, whereas the liquid steel produced in the old ones are sent to slag
granulation plant to be granulated. Granulated slag is sold to cement plants as a raw
material. Composition of the BF slag in the facility is shown in Table 5.2.
Table 5.2. Composition of the BF slag
Composition SiO2 CaO Al2O3 MgO FeO S MnO K2O TiO2 Na2O
% 41.36 35.35 11.97 7.11 0.19 0.70 1.16 0.99 0.53 0.32
Stack gas from blast furnaces are collected and treated in order to be used as fuel in
the facility due to its remarkable amount of CO component. Composition of BF gas
is presented in Table 5.3. Dirty gas is cleaned by spraying water following a dry dust
collection system. The wastes that are dust from dry cleaning systems and sludge
from wet cleaning systems are sent to sinter plant to be reused in sintering process.
However, as it is mentioned before, due to the high zinc content of this dust and
sludge, its usage in sinter plant is limited. Therefore these wastes are stored in the
facility. This situation creates a substantial problem in the facility.

69
Table 5.3. Composition of the BF gas
Component % (volume) based
CO2 22
CO 22
N2 51
H2 5
Another important problem related to the blast furnace is high emissions. Despite the
gas cleaning system and other dust collection systems for dust arising from
conveying and charging, emissions of dust, CO, CO2, SO2 and NOx create problems
related to blast furnace operation as well as aforementioned units.
For energy efficiency in blast furnaces and hot stoves, neither precaution is taken in
this blast furnace plant.
5.1.4 Steel Making
Steel is produced in basic oxygen furnace (BOF) by blowing oxygen into liquid iron
coming from BF. There are three BOF in the facility. As raw material, beside liquid
iron, steel scrap is used in approximately 20%. As stated in section 1.5, liquid iron is
subjected to desulphurization process before BOF to remove sulphur form liquid
iron. Like in BF, in BOF impurities are passed to the scrap with the help of lime
added to the BOF. The composition of BOF slag is shown in Table 5.4. The slag
from desulphurization process and BOF cannot be granulated to be used as raw
material in cement plants due to their nature, instead they are sent to slag storage area
after cooling. A limited amount of BOF slag is sent to sinter plant in order to be
added to the sinter mixture. Produced liquid steel is sent to secondary metallurgy
before continuous casting in order to make fine adjustments by adding additives for
requested steel quality.

70
Table 5.4. Composition of BOF slag
Fe Mn CaO MgO SiO2 Al2O3 moisture others
% 18.8 2.7 45.9 3.8 11.4 2.1 2.7 12.6
BOF gas has a quite high CO content as can be seen in Table 5.5. Therefore it can be
used as fuel after being cleaned. Gas cleaning in this BOF is performed by means of
wet cleaning system similar to BF gas treatment system. In this system sludge is
produced. As it was mentioned before, this gas treatment sludge includes high
amount of zinc due to the painted and galvanized steel scrap used, and its usage in
sintering process is limited. It creates an important problem for the facility.
Table 5.5. Composition of BOF gas
CO H2 CO2 N2 + Ar others
% 72.5 3.3 16.2 2.7 5.3
Other problems of basic oxygen furnaces in general which are emission and energy
efficiency are valid for this facility. To prevent emissions of dust, collection systems
for dust arising from conveying and charging are used in addition to abovementioned
wet gas cleaning system. Moreover, for energy efficiency that is another important
issue for BOF’s, stack gas arising from BOF is subjected to indirect cooling by
passing around water. This water is converted to steam to produce electricity. By this
way waste heat is reused.
5.1.5 Casting and Rolling
As it was mentioned before, there are two types of casting methods, continuous and
ingot casting. In the facility, continuous casting is applied. In the casting plant of the
facility, liquid steel from steel making is cast into moulds as “slab” and “billet”

71
(Figure 5.4 and Figure 5.5) which are wide and long semi-products respectively. The
dimensions of the moulds are set according to the desired quality. Following to
casting, semi-products are left to cool until their temperature become appropriate to
be transferred. Some portion of slabs and billets are sent to other rolling mills to be
processed further, whereas most of them are brought to hot rolling mills in the
facility. In the facility two rolling mills are in use; slab and billet rolling mills.
Figure 5.4. Slabs
Figure 5.5. Billets
In slab rolling mill, slabs are heated in furnaces up to annealing temperature
approximately 1250°C, afterwards flattened by compressing between electrically
powered rollers repeatedly up to 1.2-22 mm thickness and 700-2050 mm width

72
according to the customers desire. The name of produced product from slab rolling
mill is “coil”, shown in Figure 5.6. Coil is used as raw material in automotive and
white goods industry, and in ship building.
Figure 5.6. Coil
In billet rolling mill, billets are heated as well, and extended with the same method
up to 5.5-16 mm diameter. The product of billet rolling mill is called as “wirerod”
presented in Figure 5.7. After being process in other facilities, construction steel,
screw, loaf etc. are produced from wirerod.
Figure 5.7. Wirerod
As mentioned in section 1.6, the main environmental problem related to casting and
rolling is oily rolling mill which arises from cooling and cleaning of slab, billet, coil

73
and wirerod. In the facility, cooling water containing oily mill scale is collected with
canals and filled in sedimentation tanks. Due to the density difference, oil rises up
and mill scale settles down. At certain periods oil is skimmed, then sent to oil
recovery facilities, and mill scale separated from oil (called coarse mill scale) is
collected from the bottom of the tank, and then sent to sinter plant. However, fine
mill scale particles that cannot be separated from oil remains suspended in the water.
After being further processed, oily mill scale (i.e. fine mill scale) is separated from
water, collected and stored. Due to its high oil content up to 10%, it cannot be reused
in sinter process and this situation causes an environmental and operational problem.
In the facility, any measures are not taken against, however the authority of the
facility are searching for methods to overcome this problem.
For NOx emission, low NOx generating boilers are in use in furnaces, however for
other emissions such as CO, CO2, SO2, any precautions are not taken in this rolling
mills. Considering energy efficiency, recuperators are used.
5.2 Step 2– Input/Output Analysis
The reason of input/output analysis was to provide data for the next step,
performance evaluation of the facility. As stated in methodology part, in order to
determine inputs and outputs of the sub-process, reports of each sub-processes for
years 2009 and 2010 were examined and some calculations were made. However,
due to the lack of measurements of some parameters (solid wastes, wastewaters, air
emissions etc.), some of the inputs and outputs could not be determined. Amount of
unidentified inputs and outputs are indicated as “dnf” (data not found) in the
following tables presenting inputs and outputs of all sub-processes.
It should be noted that, there may be inconsistancies between the amounts of inputs
and outputs. The reasons of these inconsistencies can be listed as follows;

74
Lack of measurements of some parameters such as
o gas treatment sludges,
o gas cleaning waters,
o cooling waters,
o wastewater,
o some other wastes
Air emissions which can not be caught by air cleaning devices
Errors in the measurements performed by the technical staff of the facility
Moisture content in the raw materials which evapotares
The results of input/output analysis, for all sub-processes are given in the following
sections in detail.
5.2.1 Sintering
Results of input/output analysis for sintering process for the years 2009 and 2010
presented in Table 5.6.
The only raw material utilized is fine iron ore and various additives that are
limestone, dolomite, dunite, magnesite are put into the sinter mixture according to
the desired sinter quality. As it was mentioned before, sinter plant is also operated as
the recycling plant of the facility, which means all iron bearing materials are added to
the sinter mixture that are returned sinter after screening (<7mm), pellet dust, BOF
slag, BF gas treatment sludge, mill scale from casting and rolling mill and other
wastes. Coke breeze is the main energy source for sintering of sinter feed. Moreover,
among energy sources, COG and BF gas are used for ignition of coke breeze and
electricity is used for the operation of sinter machine and other equipments such as
pumps. In chapter 2, it was stated that for stack gas cleaning is performed wet
cyclones, hence water is required for this process. Furthermore, for cooling of pumps
cooling water is used in sinter plants. The quantity of gas treatment water for both of
the years and quantity of cooling water could not be identified as these values are not
recorded in the facility.

75
Table 5.6. Inputs and outputs of sintering process
INPUTS
Unit 2009 2010
Raw materials Fine iron ore ton 1,720,951 2,357,645
Additives Limestone ton 380,856 466,358 Dolomite ton 21,010 1,697
Dunite ton 60,261 102,049 Magnesite ton 3,141 0
Wastes reused Returned sinter after sieving ton 1,337,504 1,837,578
Pelet dust ton 76,371 138,192 BOF slag ton 35,563 92,806
BF gas treatment dust ton 43,962 55,057 Mill scale ton 52,477 66,902
Other wastes ton 59,902 71,925 Energy
Electricity (*1000) kwh 90,400 134,115 COG (*1000) Nm3 10,877 12,561
BF gas (*1000) Nm3 0 43,695 Coke breeze ton 154,358 207,565
Water Gas treatment water m3 dnf dnf
Cooling water (*1000) m3 dnf 2,190 OUTPUTS
Unit 2009 2010
Product Sinter ton 1,933,241 2,733,897
Wastes Sinter dust remain. under sieve ton 1,337,504 1,837,578
Wastewater (*1000) m3 dnf 657 Gas treatment sludge ton dnf dnf
Air emissions ton dnf dnf dnf: data could not be found

76
The only product of sinter plant is sinter and wastes arising are sinter dust remaining
in underflow of sieve (i.e. <7mm), wastewater and gas treatment sludge. As
presented in the following table, the amount of abovementioned sinter dust is huge,
almost equal to the sinter produced. Whole waste sinter dust produced is recycled to
the sintering process. If examined carefully, it is seen that the amount “returned
sinter after sieving” in inputs and the amount of “sinter dust remaining under sieve”
are exactly equal to each other. On the other hand, amount of wastewater produced in
2009, and gas treatment sludge produced in both of the years cannot be specified.
During the examination of several annual reports of sintering process, it is
noticedthat total inputs are averagely 15-20% greater than total outputs. This big
difference is called “ignition loss”, which arises mainly from the conversion of coke
breeze in the mixture to CO2 by combustion.. Ignition loss is a very crucial parameter
followed by the technical staff of sinter plant indicating the efficiency of sintering
process.
5.2.2 Coke Making
Inputs and outputs of coke making process and their quantities of yearly
consumption & production in 2009 and 2010 are presented in Table 5.7.
As raw material, coal is utilized for coke making process. Moreover for manufacture
of side-products, sulphuric acid (H2SO4), sodium hydroxide (NaOH) and oil are used
for ammonium sulphate (fertilizer) production, distillation of ammonia wastewater
and benzole recovery from COG respectively. Like in sinter plants, tar and coke
breeze mixture produced as waste from side-product manufacture is used in coke
ovens as energy source beside COG, natural gas and BF gas. Furthermore for other
equipments related to the operation of coke oven plant electricity is used in order to
provide energy. For wet quenching applied batteries, water is consumed. In addition
water and steam are used for cooling and cleaning purposes respectively. The amount
of cooling water could not be determined as it is shown in Table 5.7.

77
The products of coke oven plant are coke and COG originated from batteries and
steam from dry quenching. Dry quenching unit in the facility was in maintenance
between 2009 and 2010, steam generation was not recorded properly. The values of
steam generation mentioned in coke oven plant and energy plant in the facility are
inconsistent; as a result it is not included in input/output analysis of coke making
process. Benzole, tar and ammonium sulphate are side-products produced from COG
treatment. Wastes arising from coke oven plant are tar and coke breeze mixture that
is used in coke oven plant as fuel, ammonia wastewater which is arise due to the
moisture content of the coal and treated treated biologically, sludge from
aforementioned treatment, and wet quenching water. The quantity of biological
wastewater treatment sludge could not be specified due to the lack information.

78
Table 5.7. Inputs and outputs of coke making process
INPUTS
Unit 2009 2010
Raw materials Coal ton 2,709,895 2,953,556
Other raw materials Sulfuric acid ton 20,629 21,157
Sodium hydroxide ton 2,757 3,168 Oil ton 388 494
Wastes reused Tar + coke breeze mixture ton 1,628 1,708
Energy
Electricity (*1000) kwh 47,555 52,936 COG (*1000) Nm3 318,474 191,631
Natural gas (*1000) Sm3 29 0 BF gas (*1000) Nm3 0 694,657
Water Quenching water ton 876,000 876,000
Cooling water m3 dnf dnf Steam (*1000) ton 399,896 346,207
OUTPUTS Unit 2009 2010
Products Coke ton 1,915,938 2,192,966
COG (*1000) Nm3 756,884 845,864 ton 370,8731 414,4731
Steam ton dnf dnf Side products
Benzole ton 11,440 11,621 Tar ton 77,690 82,780
Ammonium sulphate ton 22,745 18,958 Wastes
Tar + coke breeze mixture ton 1,628 1,708 Ammonia wastewater ton 230,612 235,694
Biol. wastewater treatm. sludge ton dnf dnf Wet quenching water ton 876,000 876,000
Air emissions ton dnf dnf 1density of COG is taken as 490 kg/m3 dnf: data could not be found

79
5.2.3 Iron Making
Table 5.8 presents the results of input/output analysis for iron making process for
2009 and 2010 years.
In iron making process, three different iron bearing raw materials are consumed,
sinter produced in sinter plant, pellet and lump iron ore purchased. Besides, lime
stone for slag producing and dolomite, magnesite and quartzite for other purposes are
used as additives. As the main energy source for reducing and melting iron bearing
feed of BF’s coke is required. Beside coke, pulverized coal is used in relatively small
quantity. In addition, COG, natural gas and BF gas is consumed in hot stoves in
order to heat the air needed in BF for combustion of coke and coal. As in the
upstream sub-processes electricity is used for other operational energy requirements
such as pumps and dust collection systems. Required water for steel making is for BF
stack gas treatment and for cooling of pumps. The amount of gas treatment water
used in 2009 and cooling water in both of the years could not be determined during
input/output analysis of iron making process. Other than abovementioned inputs,
steam, air, oxygen and nitrogen are consumed with the aim of cleaning, combustion
in BF, enriching of air required for this combustion and transfer of pulverized coal,
respectively.
The only products of iron making process are liquid iron and BF gas whereas various
types of wastes are produced which are liquid slag, scrap, stack dust from dry as
cleaning, sludge from wet gas cleaning. However as it was mentioned before, among
these wastes, slag is granulated and sold to cement plants and the remaining wastes
all of which have iron content are reused in the sintering process. Furthermore, from
stack gas treatment process, wastewater arises and its amount could not be identified
since it is not recorded in the facility.

80
Table 5.8. Inputs and outputs of iron making process
INPUTS
Unit 2009 2010
Raw materials Sinter ton 2,140,363 2,733,898 Pellet ton 1,692,646 2,133,178
Lump iron ore ton 332,137 606,477 Additives
Limestone ton 11,903 11,112 Dolomite ton 101 1,598
Magnesite ton 48,561 16,849 Quartzite ton 72,175 97,045
Energy
Coke ton 1,147,737 1,440,900 Pulvarized coal ton 197,272 357,109
Electricity (*1000) kwh 35,955 47,961 COG (*1000) Nm3 29,072 28,998
Natural gas (*1000) Sm3 44 196 BF gas (*1000) Nm3 1,211,038 1,553,950
Water Gas treatment water (*1000) m3 dnf 3,110
Cooling water m3 dnf dnf Others
Steam ton 131,600 172,614 Air (*1000) ton 3,472 4,335
Oxygen (*1000) Nm3 91,000 152,536 Nitrogen (*1000) Nm3 11,020 11,020
OUTPUTS Unit 2009 2010
Products Liquid iron ton 2,603,147 3,371,884
BF gas (*1000) Nm3 4,252,134 5,309,760 ton 5,485,253 6,849,590
Wastes Liquid slag ton 744,007 983,027
Scrap ton 33,197 181 Stack dust ton 22,160 37,385
Gas treatment sludge ton 20,000 26,000 Wastewater m3 dnf dnf
Air emissions ton dnf dnf *density of BF gas is taken as 1,290 kg/m3
dnf: data could not be found

81
5.2.4 Steel Making
In Table 5.9, inputs consumed and outputs produced from steel making process for
the years 2009 and 2010 are presented.
Liquid iron produced in BF’s is the only raw material of BOF’s. Other than that,
other metallic inputs that are great amount of scrap (purchased scrap and defective
slabs and billets), and relatively small amount of returned steel whose quality is not
sufficient, pig iron, iron ore and other materials. Moreover as additive, oxygen is
provided for oxidizing carbon in liquid iron to be convert it to liquid steel, and lime
is added as slag making agent. In addition, as it is presented in Table 5.9, various
other additives are consumed in BOF’s and in secondary metallurgy for required
quality of the steel. COG and natural gas are consumed by BOF’s and electricity is
used for other equipments as energy source in steel making process. Water for stack
gas treatment of BOF’s, cooling water for pumps and steam for cleaning purposes
are other inputs of the steel making process. The amount of gas treatment water and
cooling water could not be identified for 2009 due to the aforementioned reason.
As presented Table 5.9, liquid steel and BOF gas are the product of steel making
process and the wastes are desulphurization and BOF slag, gas treatment sludge,
scale (scattered steel during transfer of steel) and wastewater originating from stack
gas treatment.

82
Table 5.9. Inputs and outputs of steel making process
INPUTS
Unit 2009 2010
Raw materials Liquid iron ton 2,552,010 3,313,018
Metallic inputs Returned steel ton 4,978 3,547
Scrap ton 619,851 785,738 Pig iron ton 200 242 Iron ore ton 10,005 21,809
Other ton 13,641 914 Additives
Oxygen ton 220,195 279,844 Lime ton 165,966 238,510
Magnesite ton 504 6,045 Dolomite ton 0 14,455
Coke ton 3,596 3,960 Hard coal ton 5,768 2,395
Fe Mn+ Fe Si ton 8,439 9,277 Si Mn ton 21,655 19,423
Coke breeze ton 1,719 27 Al ton 2,118 5,328
FeCr + FeMo + FeV ton 104 296 Floride ton 1,090 1,479
Other ton 1,261 1,433 Energy
Electricity (*1000) kwh 72,408 215,433 COG (*1000) Nm3 15,959 10,900
Natural gas (*1000) Sm3 122 200 Water Gas treatment water (*1000) m3 dnf 4,507
Cooling water (*1000) m3 dnf 887 Steam ton 186,067 188,208
OUTPUTS Unit 2009 2010
Products Liquid steel ton 2,820,895 3,674,945
BOF gas (*1000) Nm3 168,606 353,283 ton2 224,245 469,866
Wastes Desulpurisation slag ton 76,560 99,390
BOF slag ton 307,965 433,554 Gas treatment sludge ton 114,576 240,073
Scale ton 3,505 3,921 Wastewater (*1000) m3 dnf 118
Air emissions ton dnf dnf *density of BOF gas is taken as 1,330 kg/m3
dnf: data could not be found

83
5.2.5 Casting and Rolling
Input/output analysis results for casting and rolling processes are presented in Table
5.10 and Table 5.11 respectively.
Raw material of casting process is liquid steel provided from BOF. Electricity, COG,
natural gas and LPG are the main energy sources of casting process for different
purposes. Oxygen is consumed for shaving of slabs and billets, whereas nitrogen and
argon are used for hydraulic equipments. Another input for this process is water that
is used for cooling and cleaning of semi-products and cooling of pumps.
Table 5.10. Inputs and outputs of casting process
INPUTS
Unit 2009 2010
Raw materials Liquid steel ton 2,820,895 3,674,944
Energy Electricity (*1000) kwh 35,028 41,342
COG (*1000) Nm3 21,355 17,253 Natural gas (*1000) Sm3 2,178 3,046
LPG kg 421 381 Oxygen (*1000) Nm3 4,801 5,524
Nitrogen (*1000) Nm3 10,734 7,270 Argon(*1000) Nm3 362 467
Water Water m3 222,830 223,670
OUTPUTS Unit 2009 2010
Products Slab ton 853,534 2,124,497
Billet ton 1,896,095 1,439,980 Wastes
Slab scrap ton 40,820 10,411 Billet scrap ton 26,852 3,861 Wastewater m3 dnf dnf
Oil ton dnf dnf Fine mill scale ton dnf dnf
Coarse mill scale ton dnf dnf Air emissions ton dnf dnf
dnf: data could not be found

84
The products of casting process are slab and billets (semi-products) differentiated
only in shape. The wastes originated from this process is slab and billet scrap which
are unqualified products, coarse and fine mill scales of semi-products and wastewater
arising from semi-product cooling and cleaning, oil skimmed from sedimentation
tanks. The amount of wastewater, oil, fine and coarse mill scales arising from casting
for years 2009 and 2010 could not be determined due to the same reason as the
abovementioned sub-processes.
As it is shown in Table 5.11, raw materials of rolling process are slab and billet
which are the semi-products of casting process. COG and Natural gas are used for
heating furnaces and electricity is consumed for mechanical equipment of rolling
mill. Almost the whole electricity is utilized for huge engines of rollers. On the other
hand, oxygen and nitrogen gases are needed for shaving of coil and wirerods and
hydraulic equipments in the rolling mills.
Products of rolling mills are coil and wirerod. Wastes arising from rolling mills are
similar with casting process, since here coil and wirerod are cooled and cleaned with
the same method. Aforementioned wastes are coil and wirerod scrap which are
unqualified products, coarse and fine mill scales of coil and wirerod, wastewater and
oil skimmed from sedimentation tanks. Different form casting process, the amount of
coarse mill scales from coil and wirerod were determined whereas other wastes
which are oil and fine mill scales could not be determined as well for both of the
years. On the other hand the quantity of wastewater produced in 2010 was identified
while the one in 2009 could not be specified.

85
Table 5.11. Inputs and outputs of rolling process
INPUTS
Unit 2009 2010
Raw materials Slab ton 622,209 2,046,013
Billet ton 540,270 466,225 Energy
Electricity (*1000) kwh 159,703 250,042 COG (*1000) Nm3 67,397 138,994
Natural gas (*1000) Sm3 21,454 23,707 Oxygen (*1000) Nm3 220 1,391
Nitrogen (*1000) Nm3 250 2,021 Water
Water (*1000) m3 dnf 4,800 OUTPUTS
Unit 2009 2010
Products Coil ton 605,431 1,983,301
Wirerod Nm3 517,514 445,067 Wastes
Coil scrap ton 4,436 17,188 Wirerod scrap ton 17,325 15,444
Coil coarse mill scale ton 12,342 45,524 Wirerod coarse mill scale ton 5,431 5,714
Wirerod fine mill scale ton dnf dnf Billet fine mill scale ton dnf dnf
Oil ton dnf dnf Wastewater (*1000) m3
dnf 1,760 Air emissions ton dnf dnf
dnf: data could not be found
5.3 Step 3 – Performance Evaluation of the Facility
In the facility, since 2002 modernization processes have been carried out for capacity
increase and protection of environment. Since then 160 million US dollars have been
spent for environmental modifications. These provided a substantial development of
environmental performance of the facility comparing before 2002. Emissions to air
have decreased in a considerable amount. Moreover from 2001 to 2009 specific
water consumption have been reduced from 29.5 m3/ton crude steel to 9.8 m3/ton

86
crude steel, on the other hand energy consumption have decreased from 7.9 Mcal/
ton crude steel to 5.5 Mcal/ ton crude steel .
As stated in Chapter 4, with the aim of evaluation of environmental and operational
performance of the facility, specific consumptions and emissions of all sub-processes
were calculated one by one, based on the product of each sub-process and they were
compared with the ones listed in BREF Documents (on iron and steel production and
on surface treatment of metals). Afterwards, the parameters outside the limits were
specified and the reason behind them was researched during the site visits to the
facility. Emission values of the facility were taken from an emission report provided
by technical staff of the facility, prepared according to the measured emission values
in 2009. The facility have this report prepared once every three years, therefore 2010
emissions could not be compared with BREF Documents. Moreover, some of the
emission parameters which are present in BREF Documents were not mentioned in
aforesaid emission report; hence these could not be evaluated as well.
In the following sections, results of aforementioned study are presented for each sub-
processes. Parameters that are outside of the limit values are indicated by bold fonts.
Moreover, the exceed percentages of these parameters are given in Section 5.3.6.
5.3.1 Sintering
In sintering process, the amount of all inputs are divided into mass of sinter produced
whereas outputs are divided into the mass of liquid steel (LS) produced by steel
making process considering BREF document. By this way specific consumptions and
emissions of the sinter plant is calculated and compared with the limit values
mentioned in BREF Document (Table 5.12).
As it can be seen in Table 5.12, the amount of returned sinter after sieving is
significantly higher than the upper limit set in BREF Document because of the long
distance between sinter plant and BF plant. Since sieves are placed just before BF
sinter and sinter produced in sinter plant fragmentizes during the transfer. This

87
creates an operational and financial problem, however because sinter and BF plant
cannot be replaced, this problem cannot be overcame.
Moreover, specific consumptions of iron ore in both of the years and limestone and
additives in 2009 are slightly higher than the limits. It indicates that the iron content,
i.e., the quality, of iron ore used up is a slightly lower than the one in Europe.
Qualified iron ore is composed of nearly 60-65% Fe, where the iron content of the
ore utilized in the facility is 50-55%. The amount of limestone and additives can alter
according to the desired characteristics of the steel produced. Hence, this situation is
accepted as normal.
Considering energy consumption of this sinter plant, it can be realized that total
usage of COG, BF gas and natural gas are between the limits, however specific
consumption of coke and electricity is significantly higher. When total energy usage
is calculated by summing upper and lower limits of BREF Document and 2009 and
2010 energy consumptions individually, it can be concluded that total energy
consumption of the sinter plant is very high. This indicates that energy is used in
sinter plant inefficiently. In addition, water consumption in 2010 is found out to be
significantly higher than the limits.
As it can be seen in Table 5.12, most of the emissions such as dust, Cd, Cu, Mn, Ni,
V, NOx and SO2, arising from sinter plant are quite higher than the ones in European
sinter plants,. On the other hand, some of the parameters, Cd and TI are slightly
higher and Hg, CO and PCDD/F values are within the limit values. Finally, HCl and
HF emissions and wastewater production are found to be quite lower than the limits.
Consequently, as a result of this study sinter plant is evaluated to be incompatible
with the European sinter plants with respect to environmental and operational
performance criteria.

Ta
ble
5.12
. Com
paris
on o
f spe
cific
em
issio
ns a
nd c
onsu
mpt
ions
of s
inte
ring
proc
ess w
ith B
REF
doc
umen
t IN
PU
TS
U
nit
B
RE
F R
an
ge
Facil
ity
OU
TP
UT
S
Un
it
BR
EF
Ran
ge
Facil
ity
2009
2010
2009
2010
Ra
w m
ate
ria
ls
Prod
uct
Iron
ore
kg/t
sint
er
680
– 85
0 890
862
Sint
er
kg/t
sint
er
1000
10
00
1000
O
ther
ferr
ous m
ater
ials
kg/t
sint
er
37 –
125
67
75
A
ir e
mis
sion
s
Lim
e kg
/t si
nter
0.
5 –
14
0 0
Dus
t g/
t LS
170
- 280
1159
-
Lim
esto
ne
kg/t
sint
er
105
– 19
0 197
170
Cd
g/t L
S 0.
002
– 0.
04
0.05
5 -
Add
itive
s kg
/t si
nter
26
– 4
2 43.7
38
C
r g/
t LS
0.00
5 –
0.05
19
-
BF g
as tr
eatm
ent d
ust
kg/t
sint
er
11 –
27
22.7
20
.1
Cu
g/t L
S 0.
007
– 0.
16
0.7
5
-
Rec
ycle
d m
ater
ial
kg/t
sint
er
42 –
113
49
.4
86.6
H
g m
g/t L
S 16
-149
18
-
Ret
ur. s
inte
r afte
r sie
ving
kg
/t si
nter
23
0 –
375
692
672
Mn
g/t L
S 0.
02 –
0.4
4.2
9
-
En
erg
y
Ni
g/t L
S 0.
002
– 0.
04
16.6
3
-
CO
G, B
F ga
s, na
tura
l gas
M
J/t s
inte
r 57
– 2
00
103.
8 13
1.8
Pb
g/t L
S 0.
04 –
7
0.57
4 -
Cok
e M
J/t s
inte
r 12
60 –
138
0 1972
1875
Tl
g/t L
S 0.
005
– 0.
03
0.04
8 -
Elec
trici
ty
MJ/
t sin
ter
96 –
114
450
472
V
g/t L
S 0.
005
– 0.
02
0.3
38
-
Tota
l ene
rgy
(cal
cula
ted)
M
J/t s
inte
r 14
13-1
694
2525.8
2478.8
Zn
g/
t LS
0.00
2- 1
.8
- -
Oth
ers
HC
l g/
t LS
17 –
65
7 -
Com
pres
sed
air
Nm
3 /t si
nter
1.
2 –
3 dn
f dn
f H
F g/
t LS
1.4
– 3.
5 0.
32
- W
ater
m
3 /t si
nter
0.
01 –
0.3
5 dn
f 0.8
N
Ox
g/t L
S 44
0 - 7
10
848
-
SO
2 g/
t LS
900
- 185
0 3025
-
C
O
kg/t
LS
13 –
43
31.2
2 -
C
O2
kg/t
LS
205
- 240
-
-
V
OC
g/t L
S 15
-
-
PA
H
mg/
t LS
115
- 915
-
-
PC
DD
/F
µg I-
TEQ
/t LS
0.
5 –
6.5
2.59
-
W
ast
es/S
ide P
rod
ucts
D
ust
kg/t
LS
0.9
– 15
dn
f -
G
as tr
eatm
. sl
udge
kg
/t LS
3.
0 dn
f dn
f
dnf:
data
cou
ld n
ot b
e fo
und
LS
: liq
uid
stee
l W
aste
wat
er
m3 /t
LS
6.00
dn
f 0.
18
88

89
5.3.2 Coke Making
In performance evaluation of coke making process, coke production is taken as base
in calculation of specific consumption and waste production, and liquid steel is
considered in specific emission calculation. The results of this performance
evaluation presented in Table 5.13.
Coal consumption in 2009 is determined to be slightly higher than the limit values in
BREF Documents due to the quality of coke utilized. Considering energy
consumption of coke oven plant, it is noticed that BF gas and coke oven gas usage is
lower than limits, on the other hand electricity consumed is significantly higher.
When looking at total consumption, it can be concluded that total energy
consumption of coke oven plant is compatible with BREF Document. Moreover,
steam consumption is calculated to be significantly higher than the limits.
Examining the specific productions, it is specified that quite high amount of COG is
produced in both of the years comparing with the BREF Document. Normally, high
COG production is an indicator of poor coal quality. However in this facility, the
reason behind high COG production is different: Some of the coke produced in coke
oven plant is sold to another integrated iron and steel plant in Turkey instead of using
in itself for steel production. Since the limit value set in the BREF document is
calculated by dividing COG production into liquid steel produced, it becomes higher
than expected.
Among 13 emission parameters specified in BREF document, only four of them are
measured and reported in 2009. Hence only four parameters can be compared and
evaluated. Among them only dust emission found out significantly higher than the
limit value. In addition, ammonium sulphate ((NH4)2SO4) production is calculated as
quite higher than expected, which means ammonium in COG originated from coal
characteristics is high. More ammonium sulphate production provides more income
for the facility with its sale. Finally wastewater production is slightly lower than

90
limits. In consequence, coke oven plant of the facility is not compatible with
European coke oven plants, but it is more compatible than sinter plant.

T
able
5.1
3. C
ompa
rison
of s
peci
fic e
mis
sions
and
con
sum
ptio
ns o
f cok
e m
akin
g pr
oces
s with
BR
EF d
ocum
ent
INP
UT
S
Un
it
BR
EF
Ran
ge
Facil
ity
OU
TP
UT
S
Un
it
BR
EF
Ran
ge
Facil
ity
2009
2010
2009
2010
Ra
w m
ate
ria
ls
Prod
ucts
Coa
l (dr
y ba
sis)
kg
/t co
ke
1250
– 1
350
1414
1346
C
oke
(dry
) kg
/ton
coke
10
00
1000
10
00
En
erg
y
CO
G
MJ/
t LS
2500
- 32
00
4950
4346
BF g
as+C
OG
M
J/t c
oke
3200
– 3
900
3067
25
67
Stea
m
MJ/
t LS
3 - 5
00
188
126
Elec
trici
ty
MJ/
t cok
e 20
– 1
70
239
232
Air
em
issi
on
s
To
tal e
nerg
y (c
alcu
late
d)
MJ/
t cok
e 32
20-4
070
3306
27
99
Dus
t g/
t LS
17 -
75
525
-
Oth
ers
SOx
g/t L
S 27
- 95
0 78
-
Stea
m
MJ/
t cok
e 60
- 30
0 720.2
687
NO
x g/
t LS
230
- 600
24
2 -
Com
pres
sed
air
Nm
3 /t co
ke
7 –
15
dnf
dnf
NH
3 g/
t LS
0.8
– 3.
4 -
- C
oolin
g w
ater
m
3 /t co
ke
0.8
- 10
0.45
0.
40
H2S
O4
g/t L
S 0.
7 -
-
HC
N
g/t L
S 0.
02 –
0.4
-
-
H2S
g/
t LS
4 -2
0 -
-
CO
g/
t LS
130
- 150
0 11
74
-
CO
2 kg
/t LS
17
5- 2
00
- -
C
H4
g/t L
S 27
-
-
VO
C g/
t LS
4 - 8
-
-
Benz
ene
g/t L
S 0.
3 - 1
5 -
-
PAH
m
g/t L
S 17
0 - 5
00
- -
W
ast
es/S
ide P
rod
ucts
Be
nzen
e kg
/t co
ke
8 - 1
5 5.
97
5.3
H
2SO
4 kg
/t co
ke
4 - 9
*
*
Tar
kg/t
coke
25
- 46
40
.5
37.7
(NH
4) 2SO
4
(as S
O4-2
) kg
/t co
ke
1.7
– 3.
4 8.
6 8.
6
Su
lphu
r kg
/t co
ke
1.5
– 2.
3 *
*
was
tew
ater
m
3/t c
oke
0.3
– 0.
4 0.
27
dnf
dn
f: da
ta c
ould
not
be
foun
d
LS:
liqu
id st
eel
*
no su
lphu
r rec
over
y is
app
lied
in th
e fa
cilit
y
91

92
5.3.3 Iron Making
In calculation of specific consumptions of iron making process liquid iron (LI) is
accepted as base, whereas for specific emissions and waste production LS is
considered, in order to compare them with BREF Document. Comparison of specific
consumptions and emissions for iron making process are shown in Table 5.14.
Considering raw materials, coke consumptions in both of the years are determined to
be slightly higher than the limits set in BREF Documents. Besides, it is noticed that
some of the inputs specified in BREF documents that are heavy oil, lime, recycled
materials and plastics, were not consumed in both of the years. On the other hand,
some additives which are consumed in the facility are not mentioned in BREF
Document, which are limestone, dolomite, quartzite and manganese. Their usage
depends on the desired quality of liquid iron produced.
Natural gas and electricity usage are significantly lower than expected, moreover
total energy consumption of the iron making plant is within the limit values.
Only four emission parameters can be compared and evaluated. Two of them are
quite higher than limits which are dust and CO whereas the remaining two, NOx and
SOx are between the limits. Finally, top gas sludge arising from wet treatment of
stack gas is specified as slightly higher than the limits.
As a result, except for some parameters, iron making process is compatible with
BREF Document.

Tabl
e 5.
14. C
ompa
rison
of s
peci
fic e
mis
sions
and
con
sum
ptio
ns o
f iro
n m
akin
g pr
oces
s with
BR
EF d
ocum
ent
INP
UT
S
Un
it
BR
EF
Ran
ge
Facil
ity
OU
TP
UT
S
Un
it
BR
EF
Ran
ge
Facil
ity
2009
2010
2009
2010
Ra
w m
ate
ria
ls
Prod
ucts
Sint
er
kg/t
LI
720
– 14
80
822
811
Liqu
id ir
on
kg/t
LI
1000
10
00
1000
Iro
n or
e kg
/t LI
25
–35
0 12
8 18
0 E
nergy
Pele
t kg
/t LI
10
0 –
770
650
633
BF g
as
MJ/
t LI
4400
– 5
000
4808
47
47
Cok
e kg
/t LI
28
0 –
410
440
427
Elec
trici
ty
MJ/
t LI
750
*
*
Coa
l kg
/t LI
0
– 18
0 75
10
6 A
ir e
mis
sion
s
H
eavy
oil
kg/t
LI
0 –
60
0 0
Dus
t g/
t LS
10 –
50
1066
- Li
me
kg/t
LI
0 –1
0 0
0 M
n g/
t LS
< 0.
01 –
0.1
3 -
- R
ecyc
led
mat
eria
ls
kg/t
LI
2 –
8 0
0 N
i g/
t LS
< 0.
01 –
0.0
2 -
- Pl
astic
kg
/t LI
0
–30
0 0
Pb
g/t L
S <
0.01
– 0
.12
- -
Lim
e st
one
kg/t
LI
dnm
4.
6 3.
3 SO
x g/
t LS
20 –
230
21
-
Dol
omid
e kg
/t LI
dn
m
0.03
9 0.
47
NO
x g/
t LS
30 –
120
68
-
Qua
rtzite
kg
/t LI
dn
m
27.7
28
.8
H2S
g/
t LS
0.2
– 20
-
- M
anga
nese
kg
/t LI
dn
m
18.6
5
CO
g/
t LS
770
– 17
50
2624
- E
nerg
y
CO
2 kg
/t LS
28
0 –
500
- -
BF g
as
MJ/
t LI
1050
– 2
700
1369
13
71
PCD
D/F
µg
I-TE
Q/t
LS
<0.0
01–0
.004
-
- C
OG
M
J/t L
I 90
– 5
40
206
159
Wast
es/S
ide P
od
ucts
Nat
ural
gas
M
J/t L
I 50
– 2
30
0.58
1.
99
Slag
kg
/t LS
20
0 –
290
266
267
Elec
trici
ty
MJ/
t LI
270
– 37
0 13
3 13
7 To
p ga
s dus
t kg
/t LS
6
– 16
7.
9 10
.2
Tota
l ene
rgy
(cal
cula
ted)
M
J/t L
I 14
60-3
840
1709
16
69
Top
gas s
ludg
e kg
/t LS
3
– 5
7.1
6
7.7
Oth
ers
Was
tew
ater
m
3/t L
S 0.
1 –
3.3
dnf
dnf
Oxy
gen
m3 /t
LI
25 –
55
35
45
St
eam
M
J/t L
I 22
– 3
0 142
144
C
ompr
esse
d ai
r m
3 /t LI
9
– 11
-
-
Wat
er
m3 /t
LI
0.8
- 50
dnf
dnf
d
nm: d
ata
not m
entio
ned
in B
REF
doc.
dnf:
data
cou
ld n
ot b
e fo
und
LI: l
iqui
d iro
n
LS: l
iqui
d st
eel
*no
top
gas t
urbi
ne
93

94
5.3.4 Steel Making and Casting
In BREF document, limit values for steel making and continuous casting processes
are given in the same table, hence they were evaluated together in this study as well.
Base unit is taken as liquid steel for specific consumptions as well as specific
emissions and waste productions.Table 5.15 presents the specific inputs and outputs
compared with BEF documents.
When looking at the table below, it is seen that the amounts of some of the raw
material consumptions differentiate with the ones in BREF documents. This results
from the differences in required steel quality.
Coke oven gas consumed in the steel making and casting processes is not specified in
BREF document. On the other hand, although natural gas usage determined to be
low, electricity consumption is so great that calculated total energy becomes quite
higher than the limit values. This means that energy is not used efficiently in these
processes of the facility. Moreover, steam consumption of these processes is
significantly higher when comparing with the values mentioned in BREF Document.
As outputs, the quantity of produced BOF gas is low resulting in low energy
recovery. In addition steam generated from BOF gas pretty high comparing to BREF
documents.
Considering emissions, it can be realized that only three emissions can be compared
and evaluated, and among them dust is found out to be quite high, NOx is within the
limit values and CO is lower than the limits. Additionally, among wastes produces,
desulphurization slag production in 2009 and 2010 is significantly higher than the
limits set in BREF Document, whereas BOF slag production in 2010 is slightly
higher.

95
In consequence, as a result of this study steel making and casting processes are
evaluated to be incompatible with the ones in Europe with respect to environmental
and operational concerns.

Tab
le 5
.15 .
Com
paris
on o
f spe
cific
em
issio
ns a
nd c
onsu
mpt
ions
of s
teel
mak
ing
and
cast
ing
proc
esse
s with
BR
EF d
ocum
ent
INP
UT
S
Un
it
BR
EF
Ran
ge
Facil
ity
OU
TP
UT
S
Un
it
BR
EF
Ran
ge
Facil
ity
2009
2010
2009
2010
Ra
w m
ate
ria
ls
Prod
ucts
Li
quid
iron
kg
/t LS
82
0 –
980
914
908
Slab
/bill
et
kg/t
LS
Sc
rap
kg/t
LS
170
– 25
5 22
0 21
4 BO
F ga
s M
J/t L
S 65
0 –
840
392
636
Iron
ore
kg/t
LS
7 –
20
3.6
6 St
eam
M
J/t L
S 20
– 2
70
431
308
Oth
er fe
rrou
s mat
. kg
/t LS
7
– 10
7.
1 1.
8 G
as
emis
sion
s
Cok
e kg
/t LS
0.
02 –
0.4
8 0.
046
0.01
4 D
ust
g/t L
S 15
– 8
0 519
- Li
me
kg/t
LS
30 –
55
50.7
54
.7
Cr
g/t L
S 0.
01 –
0.3
6 -
- D
olom
ite
kg/t
LS
1.5
– 4
0 3.
9 C
u g/
t LS
0.01
– 0
.04
- -
En
erg
y
Pb
g/t L
S 0.
13 –
0.9
-
- N
atur
al g
as
MJ/
t LS
20 –
55
1.5
1.9
Mn
g/t L
S <0
.01
– 1.
2 -
- El
ectri
city
M
J/t L
S 38
– 1
20
616
564
NO
x g/
t LS
5 –
20
7.9
- C
OG
M
J/t L
S -
54.9
55
.1
CO
g/
t LS
1500
– 7
960
7 -
Tota
l ene
rgy
(cal
cula
ted)
M
J/t L
S 58
- 17
5 672.4
621
CO
2 kg
/t LS
11
.2 –
140
-
-
Oth
er
PAH
m
g/t L
S 0.
08 –
0.1
6 -
- O
xyge
n m
3 /t LS
45
– 5
5 55
54
PC
DD
/F
µg I-
TEQ
/t LS
<0
.001
– 0
.06
- -
Stea
m
MJ/
t LS
30 –
140
218
169
Wast
es/S
ide P
rod
ucts
Com
pres
sed
air
Nm
3 /t LS
4
– 18
-
- D
esul
phur
isatio
n sla
g kg
/t LS
2.
2 –
19.2
27.7
27.2
Wat
er
m3 /t
LS
0.4
– 5
dnf
1.46
BO
F sl
ag
kg/t
LS
85 –
110
11
0 118
Se
cond
ary
met
al. s
lag
kg/t
LS
2 –
16
dnf
dnf
D
ust
kg/t
LS
1.5
– 7
dnf
dnf
C
ont.c
astin
g sl
ag
kg/t
LS
4 –
5 dn
f dn
f
W
aste
wat
er
m3 /t
LS
- dn
f 0.
03
dn
f: da
ta c
ould
not
be
foun
d
LS:
liqu
id st
eel
96

97
5.3.5 Rolling
In rolling process, base is taken as mass of product which are coil and wirerod.
Emission and consumptions of slab rolling mill is divided into coil production
whereas the ones of billet rolling mill into divided into wirerod production. Results
of performance evaluation of rolling mills are shown in Table 5.16 below.
Energy consumptions is not evaluated according to total consumption of slab rolling
mill and billet rolling mill, instead the evaluation is performed by summing of the
energy consumptions of furnaces and rolling systems of both of the mills with
respect to the BREF Document. As it can be seen from the table below, energy
consumptions of furnaces and rolling systems are within the limits.
Water consumption of rolling systems which is used for cooling and cleaning of coil
and wirerod can only be calculated for 2010. Its value is between the limits as well.
When looking at emissions, among the five emission parameters specified in BREF
Document, three of them were measured and reported in 2009. Hence only they were
compared with the limit values set in BREF Documents. Among them only dust is
above the limits, NOx is between the limits and CO is determined to be pretty low
than the limits.
Considering wastes produced, only mill scale arising from coil production in 2009
and 2010 is determined to be significantly higher, however wastewater produced due
to the cooling and cleaning of coil and wirerod in 2010 is calculated as slightly over
than the aforementioned limit values.
In conclusion, rolling mills in the facility is pretty compatible with BREF Document
when neglecting some parameters.

Tab
le 5
.16.
Com
paris
on o
f spe
cific
em
issio
ns a
nd c
onsu
mpt
ions
of r
ollin
g pr
oces
s with
BR
EF d
ocum
ent
INP
UT
S
Un
it
BR
EF
Ran
ge
Facil
ity
OU
TP
UT
S
Un
it
BR
EF
Ran
ge
Facil
ity
2009
2010
2009
2010
En
erg
y
Prod
ucts
Ener
gy
(Fur
nace
s)
GJ/
ton
prod
uct
1.1-
2.2
1.84
1.
45
Wire
rod/
Coi
l kg
/ton
prod
uct
1000
10
00
1000
Ener
gy (R
ollin
g)
kwh/
ton
prod
uct
72-1
40
135
97
Gas
emis
sion
s
Oth
ers
Dus
t g/
ton
prod
uct
1-10
19.1
-
Wat
er (R
ollin
g)
m3 /to
n pr
oduc
t 1-
15.5
dn
f 1.
97
NO
x g/
ton
prod
uct
2-60
0 59
.4
-
SO
2 g/
ton
prod
uct
0.3-
600
- -
C
O
g/to
n pr
oduc
t 5-
850
0.68
-
H
ydro
carb
on
g/to
n pr
oduc
t 0-
5 -
-
W
ast
es/S
ide
prod
ucts
M
ill sc
ale
kg/t
LS
1.2
– 6
2.8
(wire
rod)
13 (c
oil)
2.6
(wire
rod)
20 (c
oil)
W
aste
wat
er
m3 /to
n pr
oduc
t 0.
8-15
.3
dnf
0.72
dnf
: dat
a co
uld
not b
e fo
und
p
rodu
ct: w
irero
d fo
r bill
et ro
lling
mill
, coi
l for
slab
rolli
ng m
ill
98

99
5.3.6 Results Overview
As a result of this study, it was noticed that despite the abovementioned
modifications having been performed in the facility since 2002, still some parameters
are outside the ranges set in BREF documents, in other words more improvements
are required in environmental concern in the facility.
Two summary tables on the specific consumptions and emission of parameters
outside the limits and creating problems for the facility are prepared and presented
below. In Table 5.17 and Table 5.18 aforementioned parameters for inputs and
outputs are shown. Moreover in these tables, the percentiles how much the specific
emissions and consumption exceed the upper limit set in BREF documents for 2009
and 2010 separately and average of these years are presented. Exceed percentiles
were calculated with respect to the upper limit of the range. On the other hand,
specific emission and consumptions of some of the parameters were compared with
respect to the lower limit, since for these parameters lower value indicates poor
performance. Parameters slightly higher than the limits, the ones lower than the
limits indicating good performance are not covered in these tables.

100
Table 5.17. Comparison of input parameters (raw materials, energy, water and other
inputs) outside the limits set in BREF documents
Parameter Unit BREF
Range
Facility
2009 2010 Avg.
value exceed
% value
exceed
%
exceed
%
Raw
materials
Sintering
Returned sinter after
sieving kg/t sinter 230- 375 692 84.5 672 79.2 81.9
Energy
Sintering
Coke MJ/t sinter 1260 - 1380 1972 42.9 1875 35.9 39.4
Electricity MJ/t sinter 96 – 114 450 295 472 314 305
Total energy (calculated) MJ/t sinter 1413-1694 2526 49.1 2479 46.3 47.7
Coke making
Electricity MJ/t coke 20 – 170 239 40.6 232 36.5 38.6
Total energy (calculated) MJ/t LS 58 - 175 672 284 621 255 270
Steel making and casting
Electricity MJ/t LS 38 – 120 616 413 564 355 384
Water
Sintering
Water m3/t sinter 0.01 – 0.35 dnf - 0.8 129 129
Other inputs
Coke making
Steam MJ/t coke 60 - 300 720 140 687 129 135
Iron making
Steam MJ/t LI 22 – 30 142 373 144 380 377
Steel making
and casting
Steam MJ/t LS 30 – 140 218 55.7 169 20.7 382
dnf: data could not be found
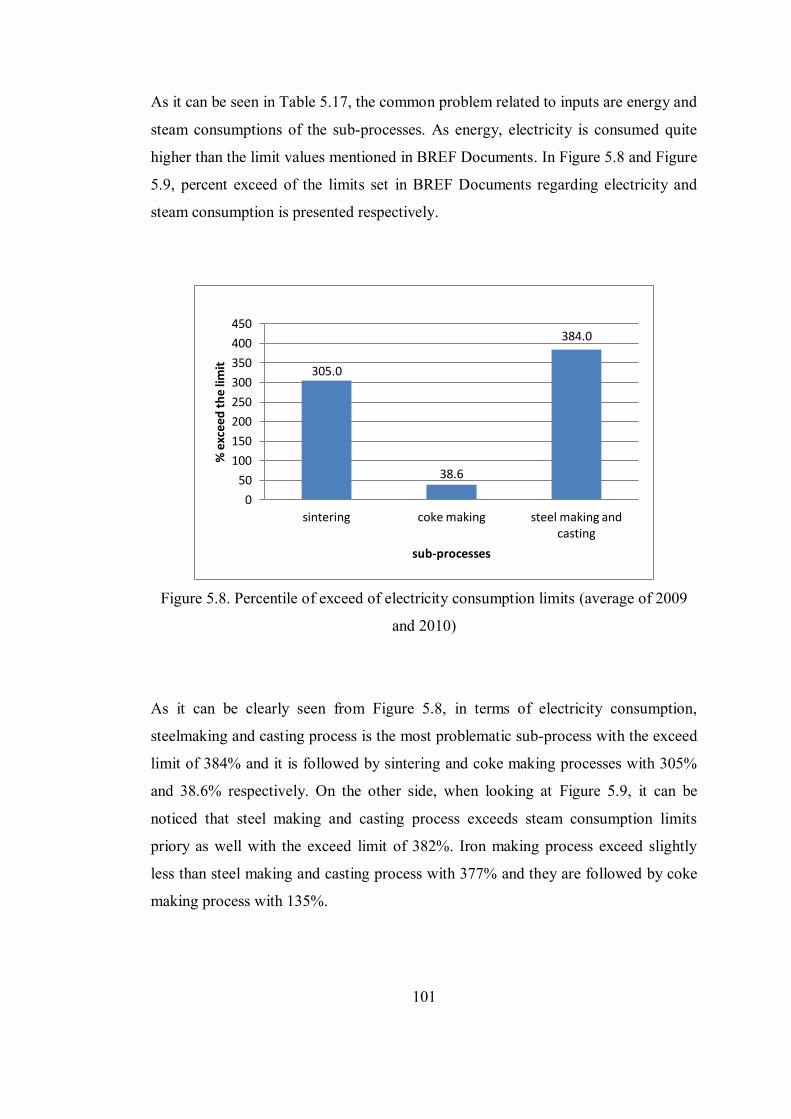
101
As it can be seen in Table 5.17, the common problem related to inputs are energy and
steam consumptions of the sub-processes. As energy, electricity is consumed quite
higher than the limit values mentioned in BREF Documents. In Figure 5.8 and Figure
5.9, percent exceed of the limits set in BREF Documents regarding electricity and
steam consumption is presented respectively.
Figure 5.8. Percentile of exceed of electricity consumption limits (average of 2009
and 2010)
As it can be clearly seen from Figure 5.8, in terms of electricity consumption,
steelmaking and casting process is the most problematic sub-process with the exceed
limit of 384% and it is followed by sintering and coke making processes with 305%
and 38.6% respectively. On the other side, when looking at Figure 5.9, it can be
noticed that steel making and casting process exceeds steam consumption limits
priory as well with the exceed limit of 382%. Iron making process exceed slightly
less than steel making and casting process with 377% and they are followed by coke
making process with 135%.
305.0
38.6
384.0
0
50
100
150
200
250
300
350
400
450
sintering coke making steel making and casting
% e
xce
ed
th
e li
mit
sub-processes

102
Figure 5.9. Percentile of exceed of steam consumption limits (average of 2009 and
2010)
Moreover, the summary table showing the problematic specific outputs and their
percent exceed limits of BREF documents are presented in Table 5.18.
135
377 382
0
50
100
150
200
250
300
350
400
450
coke making iron making steel making and casting
% e
xce
ed
th
e li
mit
sub-processes

103
Table 5.18. Comparison of output parameters (products, air emissions, wastes and
side products) outside the limits set in BREF Documents
Parameter Unit BREF
Range
Facility
2009 2010 Avg.
value exceed
% value
exceed
%
exceed
%
Products
Coke making
COG MJ/t LS 2500 - 3200 4950 54.6 4346 35.8 45.2
Steelmaking and
casting
BOF gas MJ/t LS 650 – 840 392 -39.7* 636 -2.1* -20.7*
Air emissions
Sintering
Dust g/t LS 170 - 280 1159 314 - - 314
Heavy metals
Cr g/t LS 0.005 – 0.05 19 37900 - - 37900
Cu g/t LS 0.007 – 0.16 0.75 369 - - 369
Mn g/t LS 0.02 – 0.4 4.29 973 - - 973
Ni g/t LS 0.002 – 0.04 16.63 41475 - - 41475
V g/t LS 0.005 – 0.02 0.338 1590 - - 1590
NOx g/t LS 440 - 710 848 19.4 - - 19.4
SO2 g/t LS 900 - 1850 3025 63.5 - - 63.5
Coke making
Dust g/t LS 17 - 75 525 600 - - 600
Iron making
Dust g/t LS 10 – 50 1066 2032 - - 2032
CO g/t LS 770 – 1750 2624 49.9 - - 49.9
Steel making and
casting
Dust g/t LS 15 – 80 519 549 - - 549
Rolling
Dust g/t product 1-10 19 90 - - 90
Wastes/Side
Products
Iron Making
Top gas sludge kg/t LS 3 – 5 7.16 30.1 7.7 54 42
Steel making and
casting
Desulphurisation slag kg/t LS 2.2 – 19.2 27.7 44.3 27.2 41.7 43
Rolling
Mill scale (coil) kg/t LS 1.2 – 6 13 117 20 233 175
* Minus sign means that BOF is produced less than it should be. This indicates poor performance. Exceed percentile is based on lower limit.

104
From Table 5.18, it is clearly seen that dust emission is the common problem for the
facility among other parameters. As seen in Figure 5.10, iron making is the leading
sub-process by far with the exceed limit 2032% and it is followed by coke making,
steel making and casting, sintering and rolling processes with the exceed limits
600%, 549%, 314% and 90% respectively. It can be deduced that all sub-processes
have dust emission problem, among them rolling process exceeds the limits in
negligible quantities comparing with the others.
Figure 5.10. Exceed percentiles of dust emissions
Another remarkable point noticed from Table 5.18 is the fact that the amount of
heavy metal emissions arising from sintering process is so enormous that dust
emissions from this process becomes negligible. As it can be seen from Figure 5.11,
especially emissions of Ni and Cr are high with the exceed limits 41475% and
37900% comparing to other emissions that are V (1590%), Mn (973%), Cu (369%),
dust (314%), SO2 (63.5%) and NOx (19.4%).
314
600
2032
549
90
0
500
1000
1500
2000
2500
sintering coke making iron making steel making and casting
rolling
% o
f ex
ceed
th
e lim
it
sub-processes
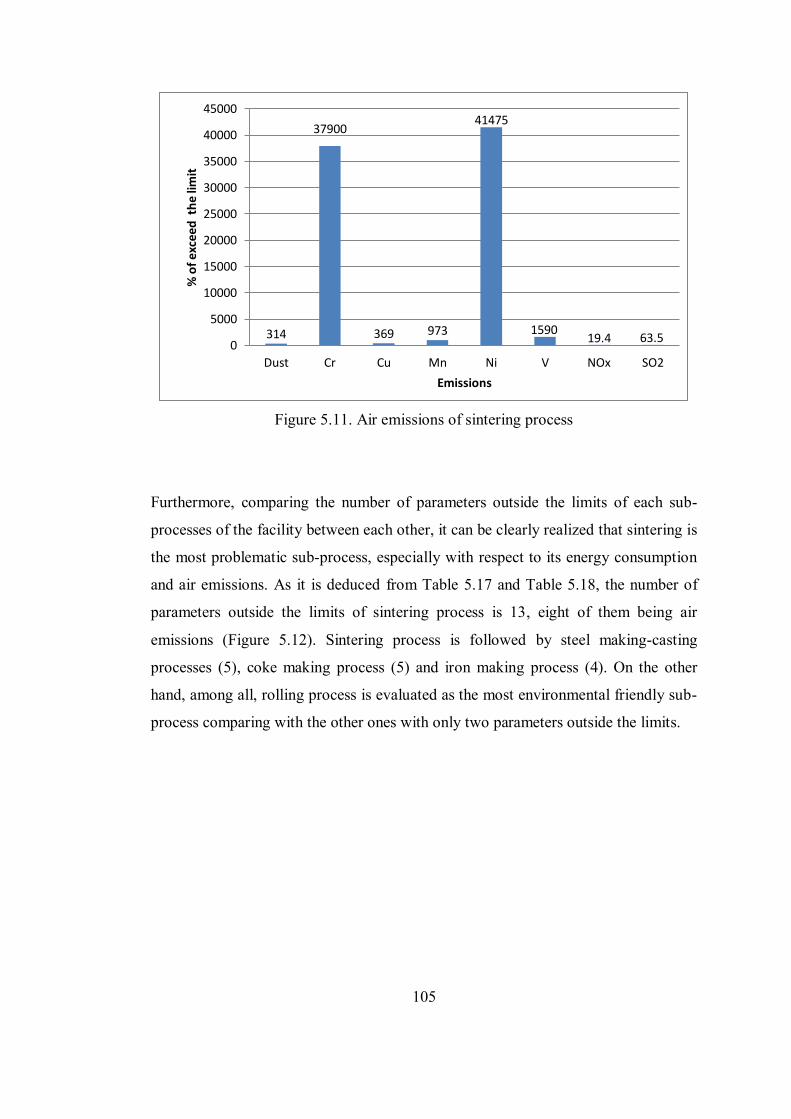
105
Figure 5.11. Air emissions of sintering process
Furthermore, comparing the number of parameters outside the limits of each sub-
processes of the facility between each other, it can be clearly realized that sintering is
the most problematic sub-process, especially with respect to its energy consumption
and air emissions. As it is deduced from Table 5.17 and Table 5.18, the number of
parameters outside the limits of sintering process is 13, eight of them being air
emissions (Figure 5.12). Sintering process is followed by steel making-casting
processes (5), coke making process (5) and iron making process (4). On the other
hand, among all, rolling process is evaluated as the most environmental friendly sub-
process comparing with the other ones with only two parameters outside the limits.
314
37900
369 973
41475
1590 19.4 63.5
0
5000
10000
15000
20000
25000
30000
35000
40000
45000
Dust Cr Cu Mn Ni V NOx SO2
% o
f e
xce
ed
th
e li
mit
Emissions

106
Figure 5.12. Number of parameters outside the limits
5.4 Step 4 – Determination of Potential BAT for the Facility
In Section 3.2.3. BAT alternatives for integrated iron and steel plants obtained from
literature were presented. In this section, results of evaluation of these alternatives
with respect to their applicability to the facility will be presented.
As it was mentioned before, total of 74 alternative BAT measures were specified.
However, after examination of the process of the facility during site visits, it was
noticed that some of these measures had already been applied and some of them are
not applicable to the facility due to various reasons. With the aim of determining the
suitable BAT options to the facility, aforesaid measures were eliminated. To this end,
list of BAT alternatives showing their applicability to the facility and the targets of
their applications for all sub-processes were prepared and presented following
sections. In order to show its applicability, every BAT alternative was marked with
the signs that are plus (+), minus (-) and check (√) indicating “already applied”,
“not applicable” and “suggested” respectively. Detailed information on suggested
BAT alternatives and the reasons why BAT alternatives are not applicable to the
facility are presented in Table A.1 (Apendix A) and Table B.1 (Apendix B),
13
5 4
5
2
0
2
4
6
8
10
12
14
Sintering Coke making Iron making Steel making and casting
Rolling
nu
mb
er o
f p
aram
eter
s
sub-processes
107
respectively. In addition, when the target of these BAT alternatives are examined, it
is realized that most of them help to provide energy efficiencies and to overcome
emission problems other operational problems mentioned in Chapter 2 for every
sub-processes.
5.4.1 Sintering
In the previous chapter, sintering process was determined to be the least compatible
sub-process with BREF Document considering its specific consumption and
emission values. Parallel to this result, in this part of the study, it is realized that
sinter plant in the facility does not apply most of the BAT alternatives stated in the
literature. Looking at Table 5.19 which presents the BAT alternatives for sintering
process, it is noticed that among 20 alternatives, one is not suitable and among the
rest 19 ones, only four alternatives have already been applied in this sinter plant. It
means that, this sinter plant applies only 21% of the potential BAT alternatives.
Suggested 15 BAT alternatives can be seen in Table 5.19.

108
Table 5.19. BAT alternatives for sintering process
BAT Alternative Target + / - /
√ Ref.
Process Integrated Techniques
1 Process optimization for minimization of
PCDD/F emissions
Emission
minimization + [8],[11]
2 Recycling iron-containing waste into the sinter
plant Waste reuse + [8],[11]
3 Lowering the content of volatile hydrocarbons
in the sinter feed
Emission
minimization √ [8],[11]
4 Lowering the sulphur content of the sinter feed Emission
minimization - [8],[11]
5 Heat recovery from sinter cooling Energy
recovery + [8],[11]
6 Top layer sintering Waste reuse √ [8],[11],
[34]
7 Waste gas recirculation
Emission
minimization,
Energy
recovery
√
[8],[11],
[34],
[42]
8 Suppression of PCDD/F formation by addition
of nitrogen compounds in the sinter mix
Emission
minimization √
[11],
[36]
9 Twin layer charging
Energy
efficiency,
Quality
increase
√ [34]
10 Intensive mixing and granulation system-
IMGS
Energy
efficiency,
Quality
increase
√ [34]
+: already applied -: not applicable √: suggested

109
Table 5.19. BAT alternatives for sintering process- continued
BAT Alternative Target + / - /
√ Ref.
End of Pipe Techniques
11 Advanced electrostatic precipitator (ESP) Emission
minimization √ [8],[11]
12 Integrated bag filter system (ESP + bag filter) Emission
minimization √ [8],[11]
13 Cyclone Emission
minimization + [8],[11]
14 Fine wet scrubber (AIRFINE) Emission
minimization √ [8],[11]
15 Desulphurization Emission
minimization √ [8],[11]
16 Regenerative active carbon (RAC) Emission
minimization √
[8],[11],
[42]
17 Selective catalytic reduction (SCR) Emission
minimization √ [8],[11]
18 Reduction of PCDD/F by means of ESP and
additives
Emission
minimization √ [11]
19 Biological treatment of oily mill scale Waste reuse √ [35]
20 Use of novel filter for dust and heavy metal
treatment
Emission
minimization √ [36]
+: already applied -: not applicable √: suggested
5.4.2 Coke Making
The list of BAT alternatives and their applicabilities is presented in Table 5.20. As
shown in this table, 14 of the total 25 alternatives have already been applied in this
coke oven plant, where three of them are not applicable. This coke oven plant seems
to be environmental friendly with respect to the 63.6% of the BAT application ratio.
However, coke making process was determined to be relatively compatible with

110
BREF Document comparing to sinter plant. From this determination it can be
deduced that either these applied BAT measures are not applied properly or more
BAT measures should be applied.
Table 5.20. BAT alternatives for coke making process
BAT Alternative Target + / - /
√ Ref.
Process Integrated Techniques:
1 Smooth and undisturbed operation of the
coke oven plant
Emission
minimization + [8],[11]
2 Maintenance of coke ovens Emission
minimization + [8],[11]
3 Improvement of oven door and frame seals Emission
minimization + [8],[11]
4 Maintaining free gas flow in the coke oven Emission
minimization + [8],[11]
5 Emission reduction during coke oven firing Emission
minimization - [8],[11]
6 Coke dry quenching (CDQ)
Emission
minimization,
Energy recovery
+ [8],[11]
7 Large coke oven chambers
Emission
minimization,
Energy recovery
- [8],[11]
8 Non-recovery coking
Emission
minimization,
Energy recovery
- [8],[11]
9 Waste gas recirculation
Emission
minimization,
Energy recovery
√ [11]
+: already applied -: not applicable √: suggested

111
+: already applied -: not applicable √: suggested
Table 5.20. BAT alternatives for coke making process- continued
BAT Alternative Target + / - /
√ Ref.
10 Closed belt conveyors Emission
minimization √ [11],[43]
11 Stabilized coke wet quenching Emission
minimization √ [11]
12 Preheating of coal, combustion air and fuel Energy recovery √ [37]
End of Pipe Techniques:
13 Minimizing oven charging emissions Emission
minimization + [8],[11]
14 Sealing of ascension pipes and charging hole
Emission minimization
+ [8],[11]
15 Minimizing leakage between coke oven
chamber and heating chamber
Emission
minimization + [8],[11]
16 De-dusting of coke oven pushing Emission
minimization + [8],[11]
17 Emission minimized wet quenching Emission
minimization + [8],[11]
18 De-NOx of waste gas from coke oven firing
(Selective catalytic reduction -SCR)
Emission
minimization √ [8],[11]
19 Coke oven gas desulphurization Emission
minimization √ [8],[11]
20 Removing tar (and PAH) from the coal
water
Emission
minimization + [8],[11]
21 Ammonia stripper Emission
minimization + [8],[11]
22 Gas-tight operation of the gas treatment
plant
Emission
minimization + [8],[11]
23 Wastewater treatment plant Emission
minimization + [8],[11]
24 Hydrogen and methanol production from
COG
Waste reuse √ [38],[39]
25 Heat recovery from COG Energy recovery √ [37]

112
5.4.3 Iron Making
For iron making process, relatively less BAT alternatives could be found from the
literature. During the site visits, it was determined that all of the possible 12 BAT
options are applicable to the iron making process of the facility, four of them have
already been implemented in this facility whereas eight of them can be applied, as
presented in Table 5.21. In other words 33.3% of the BAT options is in application
in this iron making plant. Although this ratio is relatively low, iron making process
was found to be compatible with BREF Document with respect to specific
consumption and emissions in the previous section. The reason behind that may be
the appropriate operation of implemented BAT measures.
Table 5.21. BAT alternatives for iron making process
BAT Alternative Target + / - /
√ Ref.
Process Integrated Techniques
1 Direct injection of reducing agents
Fuel cost
decrease,
Waste reuse
√ [8],[11],
[44],[45]
2 Energy recovery from blast furnace gas Energy recovery + [8],[11]
3 Energy recovery from top gas pressure Energy recovery √ [8],[11]
4 Energy savings at the hot stove Energy saving + [8],[11]
5 Use of tar-free runner linings Emission
minimization √ [8],[11]
6 Gas recovery system from top hopper
release
Emission
minimization √ [11]
+: already applied -: not applicable √: suggested

113
Table 5.21. BAT alternatives for iron making process- continued
BAT Alternative Target + / - /
√ Ref.
End of Pipe Techniques
7 Blast furnace gas treatment
Emission
minimization,
Energy recovery
+ [8],[11]
8 De-dusting of tap holes and runners Emission
minimization √ [8],[11]
9 Fume suppression during casting Emission
minimization √ [8],[11]
10 Hydro-cyclonage of blast furnace sludge Waste reuse √ [11],[46]
11 Treatment and reuse of scrubbing water Wastewater
reuse + [11]
12 Condensation of fume from slag granulation Emission
minimization √ [8],[11]
+: already applied -: not applicable √: suggested
5.4.4 Steel Making and Casting
In BREF Documents BAT alternatives for steel making and casting processes are
given together as in the previous section, performance evaluation of the facility.
Hence, in this study BAT alternatives of these two processes are evaluated together.
Table 5.22 presents the BAT alternatives and their applicabilities for steel making
and casting processes. As it can be noticed from the table below, among nine
alternatives, six BAT measures have already been applied and one is not applicable
to the steel making and casting plants of the facility. In other words, 75% of the BAT
alternatives have been implemented before this study. Despite this high ratio, in the
previous section it was stated that specific emission and consumption levels of steel
making and casting processes are not compatible with BREF Documents. From this
result is can be deduced that the applied BAT measures are not operated properly.

114
For instance, although a primary dedusting system is present near BOF’s in the
facility, dust emissions are huge due to the low efficiency of the dedusting
equipments.
Table 5.22. BAT alternatives for steel making and casting processes
BAT Alternative Target + / - /
√ Ref.
Process Integrated Techniques
1 Energy recovery from BOF gas Energy recovery + [8],[11]
2 Lowering the zinc-content of scrap Waste reuse - [8],[11]
3 On-line sampling and analysis of steel Production
efficiency + [8],[11]
End of Pipe Techniques
4 Primary dedusting Emission
minimization + [8],[11]
5 Particulate matter abatement from pig iron
pre-treatment
Emission
minimization + [8],[11]
6 Secondary de-dusting Emission
minimization + [8],[11]
7 Dust hot briquetting and recycling Waste reuse √ [8],[11],
[47],[48]
8 Treatment of wastewater from wet de-
dusting
Wastewater
reuse + [8],[11]
9 Treatment of wastewater from continuous
casting
Wastewater
reuse √ [8],[11]
+: already applied -: not applicable √: suggested

115
5.4.5 Rolling
In the previous section, rolling process was determined to be the most compatible
sub-process with BREF Document considering its specific emission and
consumptions. However, in this part of study it is determined that eight BAT
alternatives are present in the literature for rolling mills and two of them are not
suitable to the mills in the facility, whereas three of them have already been applied
and remaining three is suggested to the facility. It means, 50% of the BAT
alternatives are in use in the facility. Considering the result of the previous section,
this percentage seems to be low. The reason of this circumstance is that the options
are alternative for each other. In other words, one cannot be applied if another one
has already been implemented. The result of evaluation of BAT alternatives for
rolling mills is presented in Table 5.23.
Table 5.23. BAT alternatives for rolling process
BAT Alternative Target + / - /
√ Ref.
Process Integrated Techniques
1 Regenerative burner system Energy recovery √ [9]
2 Recuperator and recuperative burners Energy recovery + [9]
3 Limiting air preheating temperature Emission
minimization - [9]
4 Low NOx Burners Emission
minimization + [9]
5 External flue gas recirculation (FGR) Emission
minimization √ [9]
+: already applied -: not applicable √: suggested

116
Table 5.23. BAT alternatives for rolling process- continued
BAT Alternative Target + / - /
√ Ref.
End of Pipe Techniques
6 Selective catalytic reduction (SCR) Emission
minimization √ [9]
7 Selective non-catalytic reduction (SNCR) Emission
minimization - [9]
8 Treatment of cooling water Wastewater
reuse + [9]
+: already applied -: not applicable √: suggested
5.4.6 Results Overview
As stated before, 74 different BAT alternatives were evaluated with respect to their
applicabilities in the facility, in other words, BAT measures that have been already
applies, are not applicable to the facility and are suggested are determined. A
summary table showing the results of this part of the study is presented in Table 5.24.
Table 5.24. Summary of applicabilities of BAT alternatives in the facility
Sub-process Applied
(+)
Not
applicable
(-)
Suggested
(√) TOTAL
Sintering 4 1 15 20
Coke making 14 3 8 25
Iron making 4 0 8 12
Steel making and
casting 6 1 2 9
Rolling 3 2 3 8
TOTAL 31 7 36 74

117
Table 5.24 shows that comparing the number of BAT alternatives, coke is the prior
sub-process having 25 BAT possible alternatives, followed by sintering, iron making,
steel making and casting, and rolling processes with the number of possible BAT
alternatives 20, 12, nine and eight respectively. The percentile distribution of these
values is presented in Figure 5.13.
Figure 5.13. Percentile distribution of total BAT alternatives based o sub-processes
On the other hand, looking at the applicabilities of total BAT measures for the
facilities, it is realized that among 74 alternatives, 31 BAT measures have already
been applied, seven alternatives are not applicable to the facility and the remaining
36 measures are suggested to the facility. The percentile distribution of these values
is presented in Figure 5.14 below.
Sintering 27%
Coke making 34%
Iron making 16%
Steel making and casting
12%
Rolling 11%

118
Figure 5.14. Percentile distribution of total BAT alternatives based on applicabilities
Finally, graphical representation of number of BAT alternatives for every sub-
processes deduced from Table 5.24 is shown in Figure 5.15. As can be seen from this
figure, number of suggested alternatives of sintering process is more than others, on
the other side, the largest number of measures that have already been applied belongs
to coke making process.
Figure 5.15. Number of BAT alternatives and their applicabilities for sub-processes
Applied 42%
Not applicable 9%
Suggested 49%
4
14
4
6
3
1
3
0 1
2
15
8 8
2
3
0
2
4
6
8
10
12
14
16
Sintering Coke making Iron making Steel making and casting
Rolling
Nu
mb
er o
f B
AT
alte
rnat
ive
s
Sub-processes
Applied
Not applicable
Suggested

119
5.5 Step 5 – Calculation of Cross-Media Effects of Selected BAT
Alternatives
In Section 5.4, all possible BAT alternatives were evaluated and 36 alternatives
having different targets were suggested for the facility. In this section, two of the
BAT alternatives were selected and cross-media effects of these alternatives are
calculated by means of the method described in BREF Document on Economics and
Cross-Media Effects (CME), and compared with each other. The procedure of
calculation of CME was explained in Section 4.5. Moreover, scematic representation
of this procedure is presented in Figure 5.16 below.
Figure 5.16. Flowsceme of the cross-media effects calculation procedure
Guideline 4:
Interpretation of the
cross-media effects
Guideline 2:
Inventory of emissions
Guideline 3:
Calculation of the
cross-media effects:
Guideline 1:
Scope and identification of the alternative options
Common aim Removal efficiencies Capacities
for both of the BAT alternatives were determined
Mass of direct emissions achieved with the
implementation of the BAT alternatives are determined from the literature
Mass of indirect emissions arised due to the energy consumption of the BAT alternatives are calculated
Direct, indirect and total impact of both of the alternatives on the seven impact categories are calculated
BAT alternatives are compared according to their impacts on the seven impact categories and their energy consumptions

120
In order to perform an appropriate comparison, alternatives aiming the same issue
should be selected. Moreover, in this study the alternatives were selected considering
the most important problems in the facility. As stated in Section 5.3, considering
outputs, the most significant and common problem in the facility is the dust
emission. In addition, it was found that sintering is the most problematic sub-process
in the facility. In sintering process, beside dust, other emissions of SO2, NO2 and
heavy metals cause nuisance having emission values outside the limits, especially
heavy metal emissions are significantly higher (41000%) than upper limit. Moreover,
in order to solve the emission problems of the facility, the methods should be
selected such that their applicabilities and efficiencies are proven. Considering above
mentioned selection criteria, “Bag Filter-combined or integrated reduction of solid
and gaseous pollutants” and “Advanced Electrostatic Precipitator (ESP)” are
selected to be considered (After this point of the text, the first method is called as
IBFS- Integrated Bag Filter System and the second one as ESP for convenience) for
the CME analysis.
In the following parts of this section, calculation and comparison of these two BAT
measures will be presented step by step according to the cross-media guidelines
described before in Section 4.5.
Guideline 1-Scope and identification of the alternative options:
In this stage, both of the BAT alternatives are identified as follows:

121
ESP: By means of an electrostatic field generated, dust in the stack gas of sinter
plant is precipitated. Two types of this method are present, wet and dry electrostatic
precipitators. In order to increase the efficiency three or four ESP’s are placed and
connected in series. Beside dust, other emissions also minimized such as SOx, NOx,
HCl, HF, heavy metals and PCDD/F. ESP is a common dust removal method being
in use. Scematic representataion of ESP is presented in Figure 5.17.
Figure 5.17. Scematic representataion of ESP
IBFS: It is an alternative dust removal method. IBFS is an integrated and quite more
complex system comparing to ESP. In this method, a bag filter is placed downstream
to an ESP or Cyclone. By injection of some adsorbents removal of PCDD/F, PCB,
HCB or PAH, moreover by using slaked lime or sodium bicarbonate solutions, HCl,
HF and SOx removal is achieved. Moreover NOx can be removed efficiently. It is a
more complex method comparing to ESP, and removal efficiency of dust, heavy
metals and other emissions is quite high. Flowsceme of IBFS method is presented in
Figure 5.18.
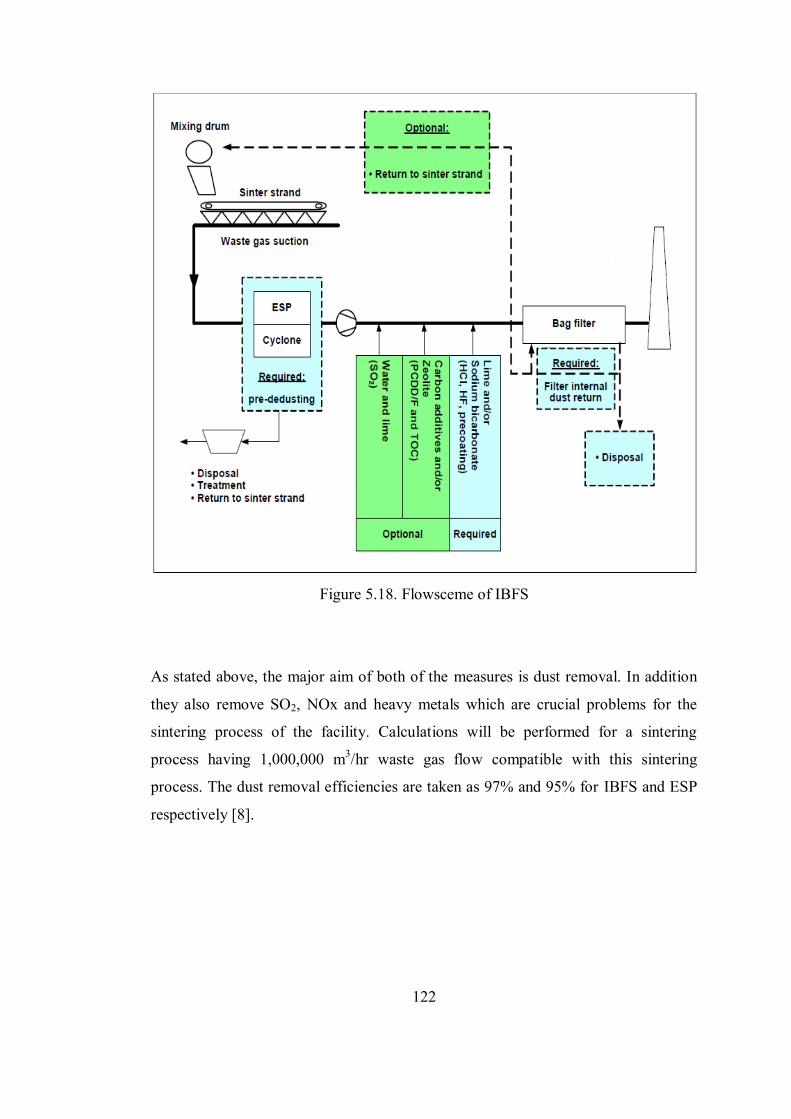
122
Figure 5.18. Flowsceme of IBFS
As stated above, the major aim of both of the measures is dust removal. In addition
they also remove SO2, NOx and heavy metals which are crucial problems for the
sintering process of the facility. Calculations will be performed for a sintering
process having 1,000,000 m3/hr waste gas flow compatible with this sintering
process. The dust removal efficiencies are taken as 97% and 95% for IBFS and ESP
respectively [8].

123
Guideline 2- Inventory of emissions:
In determination of “inventory emissions”, both direct and indirect emissions arise
from the implementation of BAT measures were considered. Direct emissions are
stack gas air emissions that can be achieved after the implementation of BAT
measures to the facility. Indirect emissions, on the other hand, can be described as
emissions arised due to the consumption of energy. In other words, emissions
generated because of the generation of this energy are also taken into account. In
BREF Document on Economics and Cross-Media Effects, it is also stated that this
indirect harm to the environment should be considered.
Initially, direct emissions of the BAT measures were estimated. Direct emissions of
IBFS and ESP are presented in Table 5.25. These values are average achieved stack
gas air emissions of the integrated iron and steel plants in Europe which have been
applying IBFS or ESP in their sintering units. For instance, in an iron and steel plant
implementing IBFS, 0,9 mg/m3 dust emission was achieved; whereas in another one
implementing ESP 36 mg/m3 emission was achieved. The values in Table 5.25 are
specific values for iron and steel production and they are taken from literature.
Emission concentrations are converted to annual mass of emission. As shown in this
table, for all parameters IBFS achieves lower emission values.

124
Table 5.25. Direct emissions of both of the alternatives [8]
Emissions
IBFS ESP
mg/m3
(1) kg/yr (2) mg/m3
(1) kg/yr (2)
dust 0.9 7,884 36 315,360
NOx 240 2,102,400 400 3,504,000
SO2 263 2,303,880 311 2,724,360
HF 0.2 1,752 0.7 6,132
HCl 2 17,520 17.4 152,424
Cd 0.002 17.52 0.04 350
As 0.001 8.76 0.18 1,577
Hg 0.001 8.76 0.025 219
Cr 0.002 17.52 0.008 70
Pb 0.002 17.52 1.98 17,345
PCDD/F 0.05 438(g/yr) (3) 0.13 1,138(g/yr) (3) (1) Taken from literature
(2) = (1) * 1,000,000 m3/hr waste gas flow * 24 hr/d * 365 d/yr /1,000,000 mg/kg
(3) = (1) * 1,000,000 m3/yr waste gas flow * 24 hr/d * 365 d/yr /1,000 g/kg
Secondly, indirect emissions of the BAT measures were calculated. Both of the
alternatives compared in this study consume electricity as energy source. The
emissions of electricity can be calculated with respect to the table given in Annex 8
of this BREF Document, presenting CO2, SO2 and NO2 emissions arise from 1GJ of
electricity consumption. However it is also stated there that if the data on local use of
primary energy for electricity generation is achievable, using of this data rather than
the one presented in BREF Document gives more reliable results, since the emissions
are highly dependent on the primary energy of electricity generation.
In 2010, 1,586,448 MWh electricity is consumed for the operation of all units
whereas 1,175,767 MWh is produced by means of recovered energy in the facility.
The remaining 410,681 MWh electricity is supplied from the network. In the facility,
electricity produced in the power plant and electricity supplied from the network are

125
transmitted to the units by separated lines. In this study, it is assumed that the needed
electricity for the suggested BAT measures which will be implemented (IBFS and
ESP), will be supplied from the network.
According to the information obtained from the personel communication with the
staff of the institution responsible from the transmission of electricity in Turkey
(TEIAS), national electricity grid is operated with an interconnected system. It means
that, which electricity production plant feeds a certain region is not known.
Therefore, in this part of this thesis, general electricity supply in Turkey is used in
the following calculations.
In Turkey, 45.9% of the electricity is generated from natural gas, followed by coal,
hydraulic energy, fuel oil, wind and geothermal& biofuel in 2010, having the shares
of 25.3%, 24.5%, 2.5%, 1.35%, 0.47% respectively as presented in Table 5.26.
Furthermore, in this table average emissions arising from the use of these primary
energies for 1 MWh electricity generation is shown.
Table 5.26. Turkish electricity supply distribution and emissions released for 1 MWh
electricity generation [49],[50]
Type of primary
energy
%
(2010)
CO2
(kg)
SO2
(kg)
NO2
(kg)
H2S
(kg)
Cd
(mg)
Hg
(mg)
Natural gas 45.9 751 - - 550 0.2 0.35
Coal 25.3 902 4.71 1.95 - 4.65 37.5
Hydraulic energy 24.5 15 - - - 0.03 -
Fuel oil 2.5 893 - - 814 43.3 9
Wind 1.35 21 - - - - -
Geothermal energy
and biofuel 0.47 477 0.08 - 407 - -

126
In order to calculate the indirect emissions for 1GJ electricity consumption for the
facility, share of primary energy distribution is multiplied by the unit emissions given
in the table above, summed up and converted to kg/GJ. As an example, CO2 emission
for 1 MWh electricity production was calculated as follows;
After calculation of emissions of other substances as above, a table is prepared
(Table 5.27) and given below.
Table 5.27. Average emissions released to generate 1 GJ electricity in Turkey
MWh GJ
CO2 (kg) 601 2,165
SO2 (kg) 1.2 4.3
NO2 (kg) 0.5 1.8
H2S (kg) 275 989
Cd (mg) 2.4 8.5
Hg (mg) 9.9 35.5
Electricity power requirement of IBFS and ESP for 1 million m3 waste gas flow were
taken from literature as [8] 300-400 kW and 1,000 kW respectively. Since electricity
power need for ESP is given as range, average of this range is taken and this value is
assumed to be 350 kW. Afterwards, power requirement is converted to energy
consumption by multiplying 24 and 365, since the facility is working full time in a

127
day. Finally, power is converted from kWh/yr to GJ/yr as presented in Table 5.28
below.
Table 5.28. Electricity consumption of BAT alternatives
Power requirement (kW) Energy consumption
Range Assumed kWh/yr (1) GJ/yr (2)
IBFS - 1,000 [8] 8,760,000 31,536
ESP 300-400 [8] 350 3,066,000 11,038 (1) = Assumed power * 24h/d * 365d/yr
(2)= Energy (kWh) * 0.0036 (GJ/kwh)
Total mass of emission released with the consumption of electricity by the use of
IBFS and ESP are calculated by multiplying electricity consumptions (GJ/yr) of the
BAT alternatives (Table 5.28) with the unit emission values presented in Table 5.27
and listed in Table 5.29.
Table 5.29. Mass of indirect emission released with the consumption of electricity by
IBFS and ESP
Emission
type
Calculated indirect emission amount
(kg/year)
IBFS ESP
CO2 68,274,894 23,897,270
SO2 135,604 47,463
NO2 56,764 19,868
H2S 31,188,854 10,916,582
Cd 0.268 0.094
Hg 1.119 0.392
All calculations for the amount of emissions arised due to the electricity
consumptions of IBFS and ESP are summarized and presented in Table 5.30.
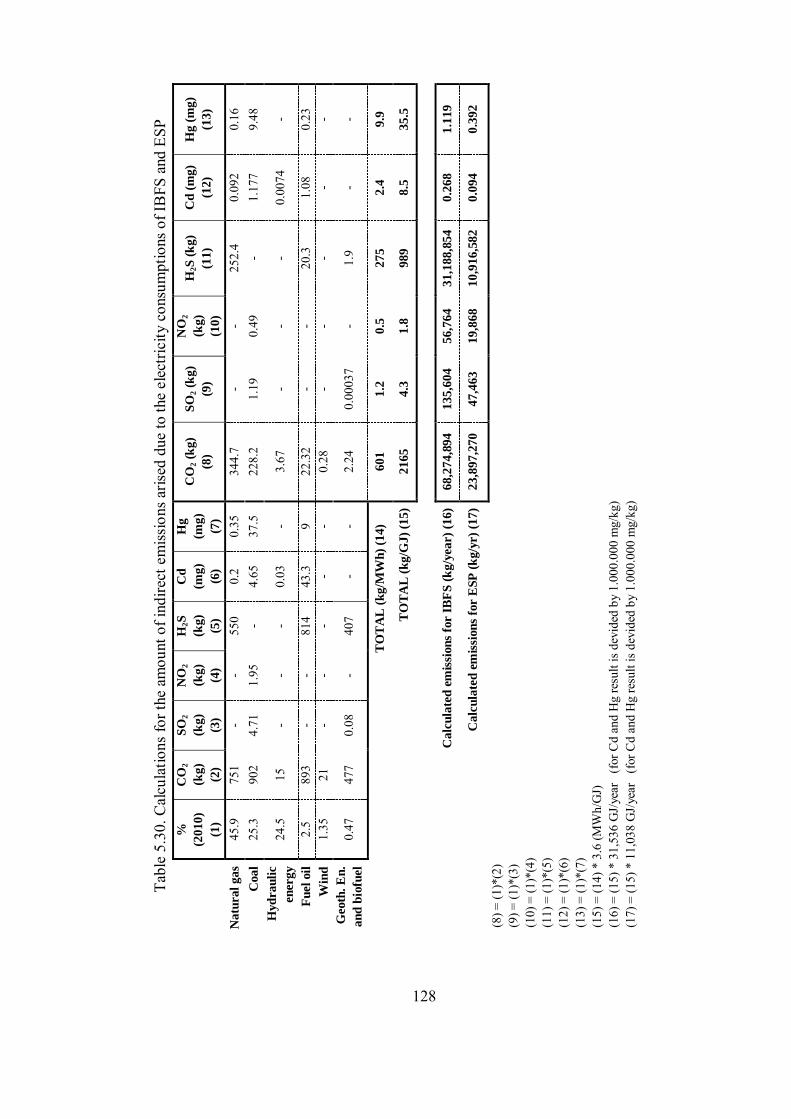
Tab
le 5
.30.
Cal
cula
tions
for t
he a
mou
nt o
f ind
irect
em
issio
ns a
rised
due
to th
e el
ectri
city
con
sum
ptio
ns o
f IB
FS a
nd E
SP
%
(20
10
)
(1)
CO
2
(kg)
(2)
SO
2
(kg)
(3)
NO
2
(kg)
(4)
H2S
(kg)
(5)
Cd
(mg)
(6)
Hg
(mg)
(7)
CO
2 (
kg)
(8)
SO
2 (
kg)
(9)
NO
2
(kg)
(10)
H2S
(k
g)
(11)
Cd
(m
g)
(12)
Hg (
mg)
(13)
Na
tura
l g
as
45.9
75
1 -
- 55
0 0.
2 0.
35
344.
7 -
- 25
2.4
0.09
2 0.
16
Coa
l 25
.3
902
4.71
1.
95
- 4.
65
37.5
22
8.2
1.19
0.
49
- 1.
177
9.48
H
yd
ra
uli
c
en
erg
y
24.5
15
-
- -
0.03
-
3.67
-
- -
0.00
74
-
Fu
el
oil
2.
5 89
3 -
- 81
4 43
.3
9 22
.32
- -
20.3
1.
08
0.23
W
ind
1.
35
21
- -
- -
- 0.
28
- -
- -
- G
eoth
. E
n.
an
d b
iofu
el
0.47
47
7 0.
08
- 40
7 -
- 2.
24
0.00
037
- 1.
9 -
-
T
OT
AL
(k
g/M
Wh
) (1
4)
601
1.2
0.5
275
2.4
9.9
T
OT
AL
(k
g/G
J)
(15)
2165
4.3
1.8
989
8.5
35.5
C
alc
ula
ted
em
issi
on
s fo
r I
BF
S (
kg/y
ear)
(16)
68,2
74,8
94
135,6
04
56,7
64
31,1
88,8
54
0.2
68
1.1
19
C
alc
ula
ted
em
issi
on
s fo
r E
SP
(k
g/y
r)
(17)
23,8
97,2
70
47,4
63
19,8
68
10,9
16,5
82
0.0
94
0.3
92
(8) =
(1)*
(2)
(9) =
(1)*
(3)
(10)
= (1
)*(4
)
(1
1) =
(1)*
(5)
(12)
= (1
)*(6
)
(1
3) =
(1)*
(7)
(15)
= (1
4) *
3.6
(MW
h/G
J)
(16)
= (1
5) *
31,
536
GJ/
year
(f
or C
d an
d H
g re
sult
is d
evid
ed b
y 1.
000.
000
mg/
kg)
(17)
= (1
5) *
11,
038
GJ/
year
(f
or C
d an
d H
g re
sult
is d
evid
ed b
y 1.
000.
000
mg/
kg)
128
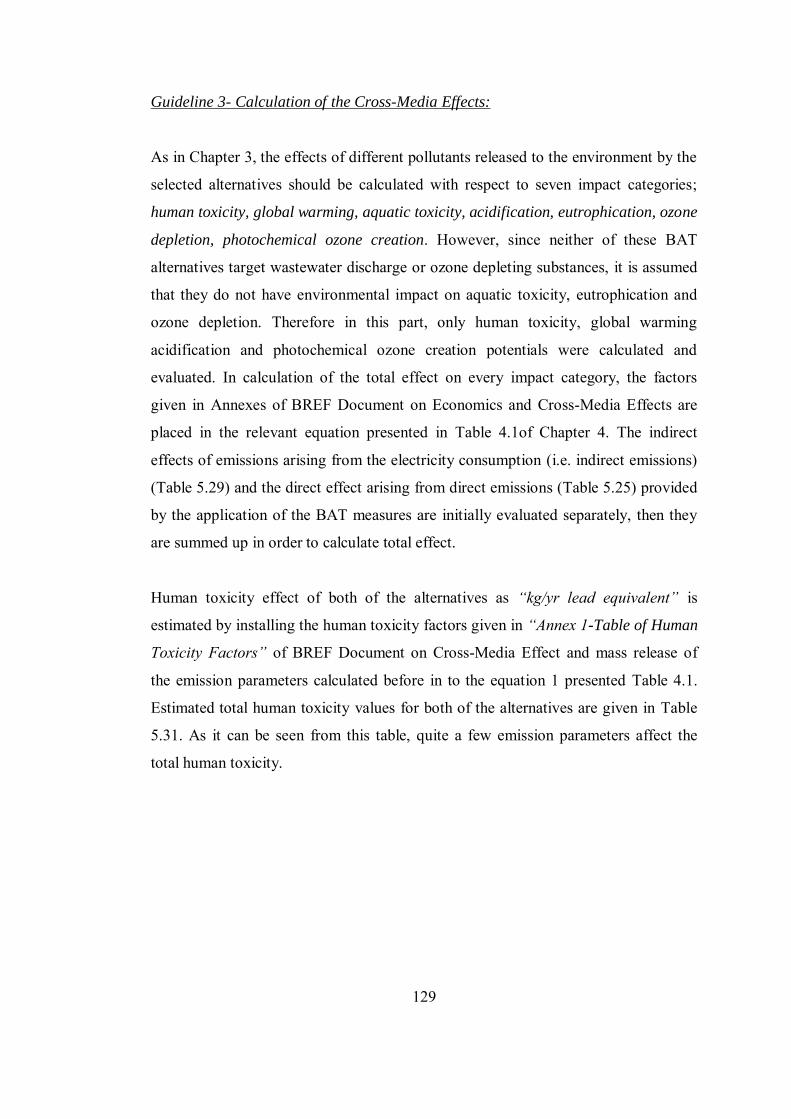
129
Guideline 3- Calculation of the Cross-Media Effects:
As in Chapter 3, the effects of different pollutants released to the environment by the
selected alternatives should be calculated with respect to seven impact categories;
human toxicity, global warming, aquatic toxicity, acidification, eutrophication, ozone
depletion, photochemical ozone creation. However, since neither of these BAT
alternatives target wastewater discharge or ozone depleting substances, it is assumed
that they do not have environmental impact on aquatic toxicity, eutrophication and
ozone depletion. Therefore in this part, only human toxicity, global warming
acidification and photochemical ozone creation potentials were calculated and
evaluated. In calculation of the total effect on every impact category, the factors
given in Annexes of BREF Document on Economics and Cross-Media Effects are
placed in the relevant equation presented in Table 4.1of Chapter 4. The indirect
effects of emissions arising from the electricity consumption (i.e. indirect emissions)
(Table 5.29) and the direct effect arising from direct emissions (Table 5.25) provided
by the application of the BAT measures are initially evaluated separately, then they
are summed up in order to calculate total effect.
Human toxicity effect of both of the alternatives as “kg/yr lead equivalent” is
estimated by installing the human toxicity factors given in “Annex 1-Table of Human
Toxicity Factors” of BREF Document on Cross-Media Effect and mass release of
the emission parameters calculated before in to the equation 1 presented Table 4.1.
Estimated total human toxicity values for both of the alternatives are given in Table
5.31. As it can be seen from this table, quite a few emission parameters affect the
total human toxicity.

130
Table 5.31. Human toxicity impacts of IBFS and ESP
emission human
toxicity
factor
IBFS ESP
mass release
(kg/yr)
human toxicity
(kg/yr lead eq.) (3)
mass release
(kg/yr)
human toxicity
(kg/yr lead eq.) (4)
Indirect impact due to elect. use
SO2 13 135,604 (1) 10,431 47,463 (1) 3,651 NO2 95 56,764 (1) 598 19,868 (1) 209 H2S 140 31,188,854 (1) 222,778 10,916,582 (1) 77,976 Cd 0.15 0.268 (1) 1.787 0.094 (1) 0.627 Hg 0.1 1.119 (1) 11.19 0.392 (1) 3.92
Total
indirect 233,819 Total indirect 81,840
Direct impact due to emiss.
As 1 8.76 (2) 8.76 1,577 (2) 1,577 Cd 0.15 17.52 (2) 116.80 350(2) 2,333 HCl 80 17,520 (2) 219 152,424 (2) 1,905 Pb 1 17.52 (2) 17.52 17,345 (2) 17,345 Hg 0.1 8.76 (2) 87.60 219 (2) 2,190 V 5 61.32 (2) 12.26 - -
SO2 13 2,303,880 (2) 177,222 2,724,360 (2) 209,566 NO2 95 2,102.400 (2) 22,131 3,504,000 (2) 36,884
Total direct
199,814 Total direct
271,801
TOTAL 433,633 TOTAL 353,641
(1) Taken from Table 5.29 (2) Taken from Table 5.25 (3) Human toxicity factor/mass release of IBFS (4) Human toxicity factor/mass release of ESP
The total direct, total indirect and overall total impacts are compared by means of a
graph presented below in Figure 5.19. As it can be seen clearly from this graph,
indirect emission of IBFS caused by electricity consumption is higher than ESP,
whereas the direct emission of this BAT alternative is lower due to its higher
emission removal efficiency. In consequence, total emission of IBFS is more than the
one of ESP, in other words considering human toxicity impact potential, ESP is the
preferable BAT alternative.

131
Figure 5.19. Total, indirect and direct human toxicity impacts of IBFS and ESP
Calculation of global warming potential is performed by using the values of global
warming potential numbers given is “Annex 2-Table of Global Warming Factors” of
BREF Document on Cross-Media Effect and mass release of related emission
parameters calculated before, and the equation 2 given in Table 4.2. Table 5.32
shows the calculated global warming impacts as “kg CO2 equivalent” of both of the
BAT alternatives. It can be noticed from this table that the only emission parameter
affecting the global warming potential is CO2.
Table 5.32. Global warming impacts of IBFS and ESP
emission
global
warming
potential
IBFS ESP
mass
release
(kg) (1)
global
warming effect
(kg CO2 eq.) (2)
mass
release
(kg) (1)
global
warming effect
(kg CO2 eq.) (3)
Indirect
impact CO2 1 68,274,894 68,274,894 23,897,270 23,897,270
TOTAL 68,274,894 TOTAL 23,897,270 (1) Taken from Table 5.29 (2) Global warming potential*mass release of IBFS (2) Global warming potential*mass release of ESP
0
50.000
100.000
150.000
200.000
250.000
300.000
350.000
400.000
450.000
500.000
indirect emission direct emission total emission
imp
act
(kg/
yr le
ad e
q.)
Emission type
Bag Filter
ESP
IBFS

132
Since neither of these BAT alternatives causes direct CO2 emission, there is no direct
impact on global warming of both these BAT alternatives. Hence, only indirect
impacts are compared as it can be seen from the graph in Figure 5.20. It can be
noticed from this graph that IBFS has more impact on global warming since it
consumes more electricity than ESP. More electricity consumption causes more CO2
production, consequently, more global warming effect arises. As a result, if global
warming is an important issue to be considered, ESP should be selected.
Figure 5.20. Global warming impacts of IBFS and ESP
In order to determine the total effect of IBFS and ESP on acidification, acidification
potentials of related emission parameters given in “Annex 4-Table of acidification
potentials” of BREF Document on Cross-Media Effect and estimated mass released
of these emission parameters are placed into the equation 4 mentioned in Table 4.2.
Total acidification effect is calculated as “kg SO2 equivalent”. Among the emission
of both of the alternatives, only SO2 and NO2 are related emission parameters
according to the Table of Acidification potentials. The result table (Table 5.33) of
acidification impacts of IBFS and ESP is presented below.
0
10.000.000
20.000.000
30.000.000
40.000.000
50.000.000
60.000.000
70.000.000
80.000.000
Bag Filter ESP
imp
act (
kg/y
r C
O2
eq
.)
BAT alternative
IBFS

133
Table 5.33. Acidification impacts of IBFS and ESP
emission
acidification
potential
IBFS ESP
mass
release (kg)
acidification
effect (kg
SO2 eq.) (3)
mass
release (kg)
acidification
effect (kg SO2
eq.) (4)
Indirect
impact
SO2 1 135,604 (1) 135,604 47,463 (1) 47,463 NO2 0,5 56,764 (1) 113,529 19,868 (1) 39,737
Total
indirect 249,132
Total
indirect 87,200
Direct
impact
SO2 1 2,303,880 (2)
2,303,880 2,724,360 (2)
2,724,360
NO2 0,5 2,102,400
(2) 4,204,800
3,504,000 (2)
7,008,000
Total
Direct 6,508,680
Total
Direct 9,732,360
TOTAL 6,757,812 TOTAL 9,819,560
(1) Taken from Table 5.29 (2) Taken from Table 5.25
(3) Acidification potential * mass release of IBFS (4) Acidification potential * mass release of ESP
In the graph presented in Figure 5.21 the total direct, total indirect and overall total
impacts are compared. According to this graph, it can be noticed, indirect emission
of IBFS caused by electricity consumption is higher than ESP, whereas the direct
emission of this BAT alternative is lower due to its higher SO2 and NO2 emission
removal efficiency. Consequently, total emission of ESP is more than the one of
IBFS, since the indirect impacts are negligible comparing to the direct impacts. In
conclusion if acidification if impact potential is considered to be more crucial, IBFS
is the preferable BAT alternative.
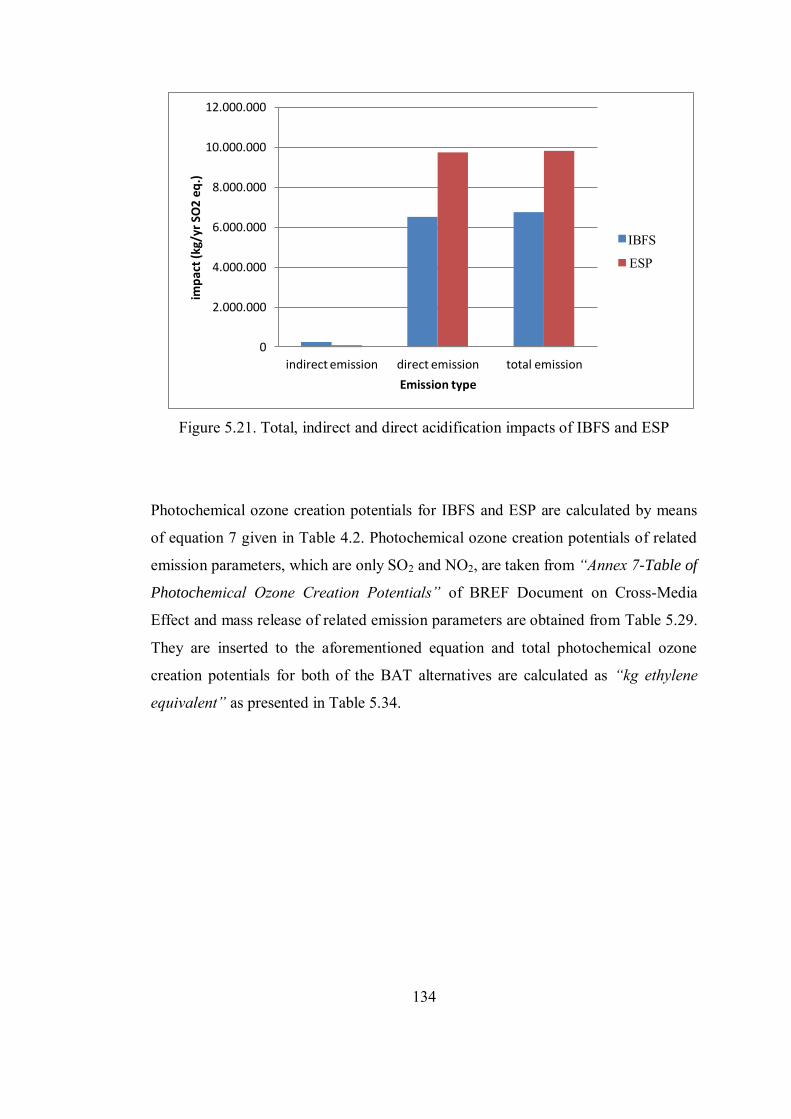
134
Figure 5.21. Total, indirect and direct acidification impacts of IBFS and ESP
Photochemical ozone creation potentials for IBFS and ESP are calculated by means
of equation 7 given in Table 4.2. Photochemical ozone creation potentials of related
emission parameters, which are only SO2 and NO2, are taken from “Annex 7-Table of
Photochemical Ozone Creation Potentials” of BREF Document on Cross-Media
Effect and mass release of related emission parameters are obtained from Table 5.29.
They are inserted to the aforementioned equation and total photochemical ozone
creation potentials for both of the BAT alternatives are calculated as “kg ethylene
equivalent” as presented in Table 5.34.
0
2.000.000
4.000.000
6.000.000
8.000.000
10.000.000
12.000.000
indirect emission direct emission total emission
imp
act
(kg/
yr S
O2
eq
.)
Emission type
Bag Filter
ESP
IBFS
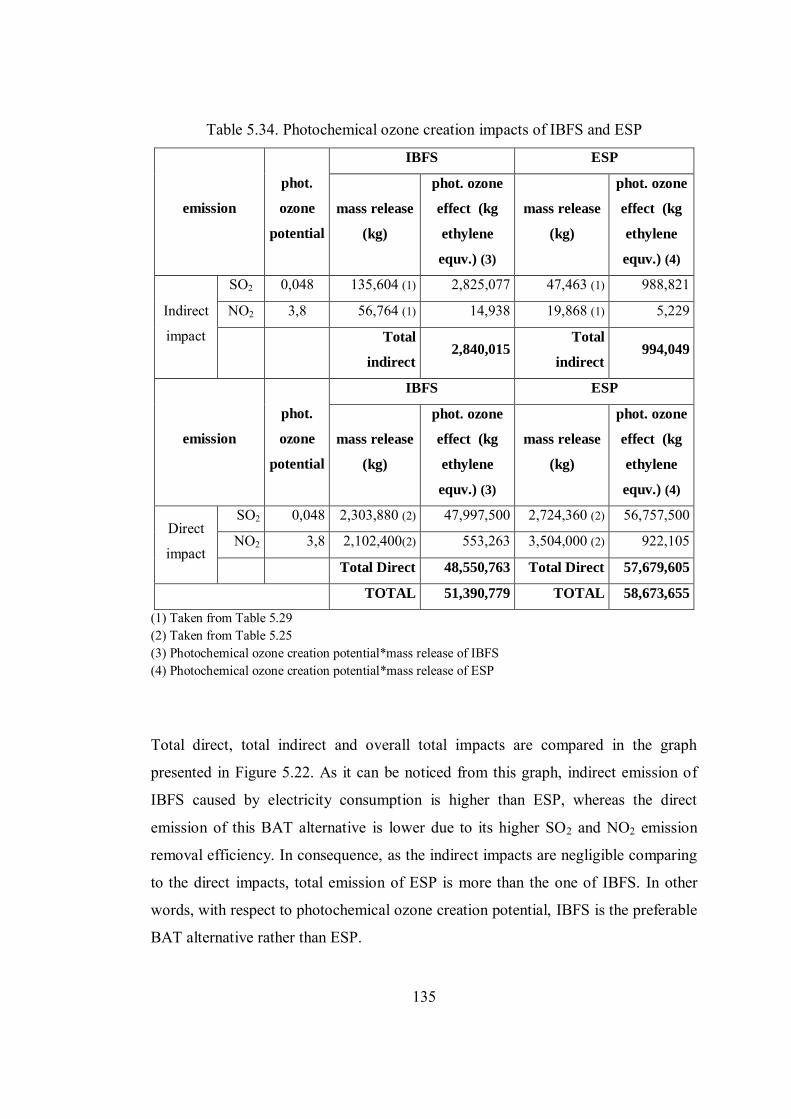
135
Table 5.34. Photochemical ozone creation impacts of IBFS and ESP
emission
phot.
ozone
potential
IBFS ESP
mass release
(kg)
phot. ozone
effect (kg
ethylene
equv.) (3)
mass release
(kg)
phot. ozone
effect (kg
ethylene
equv.) (4)
Indirect
impact
SO2 0,048 135,604 (1) 2,825,077 47,463 (1) 988,821 NO2 3,8 56,764 (1) 14,938 19,868 (1) 5,229
Total
indirect 2,840,015
Total
indirect 994,049
emission
phot.
ozone
potential
IBFS ESP
mass release
(kg)
phot. ozone
effect (kg
ethylene
equv.) (3)
mass release
(kg)
phot. ozone
effect (kg
ethylene
equv.) (4)
Direct
impact
SO2 0,048 2,303,880 (2) 47,997,500 2,724,360 (2) 56,757,500 NO2 3,8 2,102,400(2) 553,263 3,504,000 (2) 922,105
Total Direct 48,550,763 Total Direct 57,679,605
TOTAL 51,390,779 TOTAL 58,673,655
(1) Taken from Table 5.29 (2) Taken from Table 5.25 (3) Photochemical ozone creation potential*mass release of IBFS (4) Photochemical ozone creation potential*mass release of ESP
Total direct, total indirect and overall total impacts are compared in the graph
presented in Figure 5.22. As it can be noticed from this graph, indirect emission of
IBFS caused by electricity consumption is higher than ESP, whereas the direct
emission of this BAT alternative is lower due to its higher SO2 and NO2 emission
removal efficiency. In consequence, as the indirect impacts are negligible comparing
to the direct impacts, total emission of ESP is more than the one of IBFS. In other
words, with respect to photochemical ozone creation potential, IBFS is the preferable
BAT alternative rather than ESP.
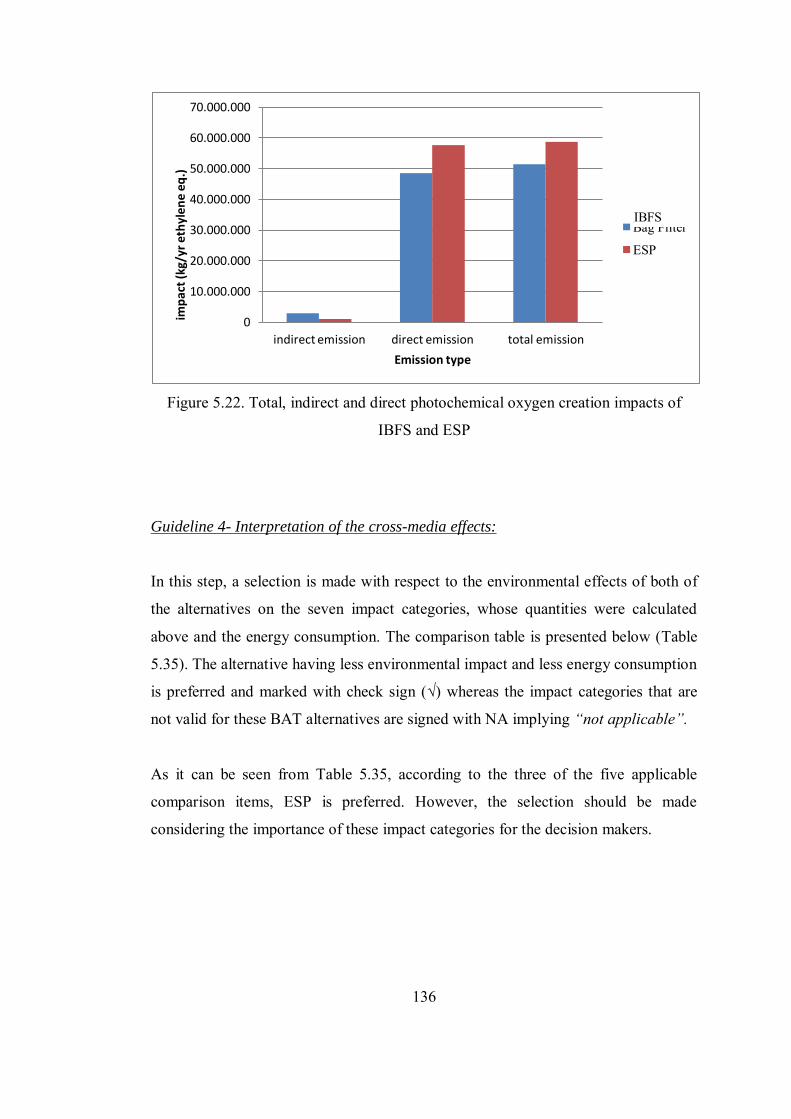
136
Figure 5.22. Total, indirect and direct photochemical oxygen creation impacts of
IBFS and ESP
Guideline 4- Interpretation of the cross-media effects:
In this step, a selection is made with respect to the environmental effects of both of
the alternatives on the seven impact categories, whose quantities were calculated
above and the energy consumption. The comparison table is presented below (Table
5.35). The alternative having less environmental impact and less energy consumption
is preferred and marked with check sign (√) whereas the impact categories that are
not valid for these BAT alternatives are signed with NA implying “not applicable”.
As it can be seen from Table 5.35, according to the three of the five applicable
comparison items, ESP is preferred. However, the selection should be made
considering the importance of these impact categories for the decision makers.
0
10.000.000
20.000.000
30.000.000
40.000.000
50.000.000
60.000.000
70.000.000
indirect emission direct emission total emission
imp
act
(kg/
yr e
thyl
en
e e
q.)
Emission type
Bag Filter
ESP
IBFS

137
Table 5.35. Comparison of alternatives with respect to environmental impacts and
energy consumption
Impact category IBFS ESP
Human toxicity potential √ Global warming potential √ Aquatic toxicity potential NA NA
Acidification potential √ Eutrophication potential NA NA
Ozone depletion potential NA NA Photochemical ozone creation potential √
Energy consumption √ NA: Not Applicable
5.6 Step 6 – Calculation of Cost of Selected BAT Alternatives
Up to now, comparison of BAT alternatives was made considering environmental
impacts of the alternative. In this step, economical aspects of them will be
considered. Economic analysis is performed according to the methodology described
in Section 4.6. Moreover, scematic representation of this procedure is presented in
Figure 5.23.

138
Figure 5.23. Flowsceme of the cost analysis procedure
Guideline 8:
Processing and presentation of the cost information
Guideline 6:
Gathering and validation of the cost data
Guideline 7:
Definition of the cost components
Guideline 5:
Scope and identification of the alternative options
Lifetimes of the equipment Energy consumptions Removal efficiencies
for both of the BAT alternatives were determined
All cost data for both of the BAT alternatives were gathered and validated
Cost data is distinduished into components of
investment costs operational costs avoided costs revenues
Cash flow analysis is performed Net present values and total annual costs
for both of the BAT alternatives are calculated
Guideline 9:
Attribution of cost to environmental protection
Purposes of the alternatives are stated clearly

139
Guideline 5- Scope and identification of the alternative options:
As it was stated before in Section 4.6., lifetimes of the equipment, energy
consumptions and removal efficiencies of the alternatives should be specified.
Lifetime of the both of the BAT alternatives is determined as 20 years [51]. Energy
consumptions and removal efficiencies of IBFS and ESP have alreay been
determined in Section 4.5. Dust removal efficiencies of IBFS and ESP have been
specified as 97% and 95% respectively. Energy consumption data will be included in
oparetion and maintanance cost.
Guideline 6- Gathering and validation of the cost data:
Intially all cost data is gathered from the literature including operational and
maintenance cost of the BAT alternatives. From the literature, the cost values
suitable for the facility studied are selected (for 1 million m3/h waste gas flow).
However, the investment and operational cost values are given as ranges rather than
unique values. Hence, the averages are taken as investment cost and operational cost
for IBFS and ESP. Additionally, as it was stated in Section 4.6, different sources
were researched to validate cost data in the literature and from the design companies;
any of appropriate information cannot be obtained.
Guideline 7- Definition of the cost components:
In this stage, averages of ranges of investment and operational cost data which is
gathered from the literature are taken as a requirement of Guideline 6.
Afterwards, revenues and avoided costs are calculated (revenues and avoided costs
are previously defined in Section 4.6). Revenues are price of sinter dust recovered,
since sinter dust is an iron bearing material. Unit price of sinter dust is taken as
159$/ton [52] which equals 121 €/ton. As stated above, the assumed dust removal
efficiencies are teken as 97% and 95% for IBFS and ESP respectively. Assuming
that the waste gas flow of sintering process is 1,000,000 m3/hr [11] and dust

140
concentration in the inflow of the removal equipment (IBFS or ESP) is 530 mg/m3
[11], the recycled dust amount is calculated as 4,504 ton/year for IBFS and 4,411
ton/year for ESP (calculation are given in Table 5.36 below) . In addition for IBFS
and ESP, price of recycled dust, in other words revenues, are specified as 546,610
€/year and 535,340 €/year respectively. The details of the renevue calculations and
the assumptions made are listed in Table 5.36 (The raw numbers given in the 4th
column represent the numbers given in the 3rd column. Calculations column shows
the details of the calculations).
Table 5.36. Assumed and calculated values in revenue calculation
Parameter Unit Value Raw
number Calculation
Assumed
Unit price of sinter dust $/ton 159 [52] (1) -
Exchange rate1 €/$ 1.31 (2) - Unit price of
sinter dust €/ton 121 (3) (1)*(2)
Dust removal efficien. of IBFS % 97 [8] (4) -
Dust removal efficien. of ESP % 95 [8] (5) -
Inflow dust concentration mg/m3 530 [11] (6) -
Waste gas flow m3/hr 1,000,000 [11] (7) -
m3/yr 8,760,000,000 (8) (7) * 24 hr/d * 365d/yr
Calculated
Mass of recycled sinter dust for IBFS
ton/yr 4,504 (9)
Mass of recycled sinter
dust for ESP ton/yr 4,411 (10)
Price of recycled
sinter dust for IBFS
€/yr 546,610 (11) (9)*(3)
Price of recycled sinter dust for
ESP €/yr 535,340 (12) (10)*(3)
1 as of the date of 02.05.2012

141
No avoided cost is calculated, since if neither of these alternatives will be applied, no
charge will be paid according to the “Regulation on the Control of Emissions from
Industries [53]”. Instead the emission permission of the facility will be cancelled
which causes the shutoff of the production.
The summary table on defined cost components is presented below (Table 5.37).
Table 5.37. Defined cost components
IBFS ESP
Parameter Unit Range [8] Assumed (1)
Range [8] Assumed
(1)
Investment
cost € 16,000,000-
35,000,000 25,000,000 5,000,000-7,500,000 6,250,000
Operational
cost
€/ton sinter (2) 0.3-0.6 0.45 0.11-0.16 0.135
€/yr (3) 1,200,000 – 2,400,000 1,800,000 440,000 –
640,000 540,000
Revenues €/yr (4) 546,610 535,340 (1) Average of the range (3) = (2) * 4,000,000 ton/yr sinter production of the facility (4) Taken from Table 5.36
Guideline 8- Processing and presentation of the cost information:
In this stage, cash flow analysis should be performed in order to be able to calculate
net present value (NPV). The procedure of Cach Flow Analysis was described in
detail in Section 4.6. Performed cash flow analysis for IBFS and ESP as presented in
Table 5.38 and Table 5.39.

Tab
le 5
.38.
. Cas
h Fl
ow (€
) ana
lysi
s fo
r IB
FS
YE
AR
2013
2014
2015
2016
2017
2018
2019
2020
2021
2022
Rev
enue
s 0
546,
610
546,
610
546,
610
546,
610
546,
610
546,
610
546,
610
546,
610
546,
610
Inve
stm
ent c
ost
25,0
00,0
00
0 0
0 0
0 0
0 0
0
Ope
ratin
g co
st
0 1,
800,
000
1,80
0,00
0 1,
800,
000
1,80
0,00
0 1,
800,
000
1,80
0,00
0 1,
800,
000
1,80
0,00
0 1,
800,
000
Tota
l cos
t 25
,000
,000
1,
800,
000
1,80
0,00
0 1,
800,
000
1,80
0,00
0 1,
800,
000
1,80
0,00
0 1,
800,
000
1,80
0,00
0 1,
800,
000
NE
T C
AS
H
FL
OW
-2
5,00
0,00
0 -1
,253
,390
-1
,253
,390
-1
,253
,390
-1
,253
,390
-1
,253
,390
-1
,253
,390
-1
,253
,390
-1
,253
,390
-1
,253
,390
YE
AR
2023
2024
2025
2026
2027
2028
2029
2030
2031
2032
Rev
enue
s 54
6,61
0 54
6,61
0 54
6,61
0 54
6,61
0 54
6,61
0 54
6,61
0 54
6,61
0 54
6,61
0 54
6,61
0 54
6,61
0
Inve
stm
ent c
ost
0 0
0 0
0 0
0 0
0 0
Ope
ratin
g co
st
1,80
0,00
0 1,
800,
000
1,80
0,00
0 1,
800,
000
1,80
0,00
0 1,
800,
000
1,80
0,00
0 1,
800,
000
1,80
0,00
0 1,
800,
000
Tota
l cos
t 1,
800,
000
1,80
0,00
0 1,
800,
000
1,80
0,00
0 1,
800,
000
1,80
0,00
0 1,
800,
000
1,80
0,00
0 1,
800,
000
1,80
0,00
0
NE
T C
AS
H
FL
OW
-1
,253
,390
-1
,253
,390
-1
,253
,390
-1
,253
,390
-1
,253
,390
-1
,253
,390
-1
,253
,390
-1
,253
,390
-1
,253
,390
-1
,253
,390
142
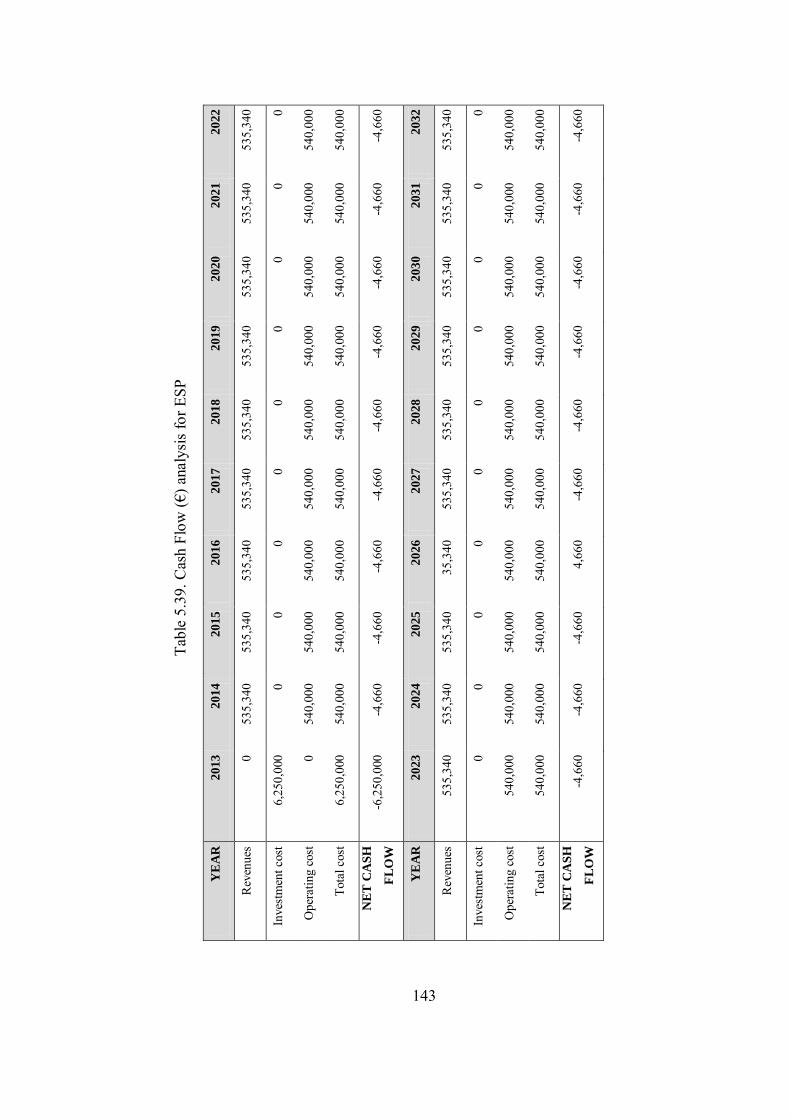
T
able
5.3
9. C
ash
Flow
(€) a
naly
sis
for E
SP
YE
AR
2
013
2014
2015
2016
2017
2018
2019
2020
2021
2022
Rev
enue
s 0
535,
340
535,
340
535,
340
535,
340
535,
340
535,
340
535,
340
535,
340
535,
340
Inve
stm
ent c
ost
6,25
0,00
0 0
0 0
0 0
0 0
0 0
Ope
ratin
g co
st
0 54
0,00
0 54
0,00
0 54
0,00
0 54
0,00
0 54
0,00
0 54
0,00
0 54
0,00
0 54
0,00
0 54
0,00
0
Tota
l cos
t 6,
250,
000
540,
000
540,
000
540,
000
540,
000
540,
000
540,
000
540,
000
540,
000
540,
000
NE
T C
AS
H
FL
OW
-6
,250
,000
-4
,660
-4
,660
-4
,660
-4
,660
-4
,660
-4
,660
-4
,660
-4
,660
-4
,660
YE
AR
2
023
2024
2025
2026
2027
2028
2029
2030
2031
2032
Rev
enue
s 53
5,34
0 53
5,34
0 53
5,34
0 35
,340
53
5,34
0 53
5,34
0 53
5,34
0 53
5,34
0 53
5,34
0 53
5,34
0
Inve
stm
ent c
ost
0 0
0 0
0 0
0 0
0 0
Ope
ratin
g co
st
540,
000
540,
000
540,
000
540,
000
540,
000
540,
000
540,
000
540,
000
540,
000
540,
000
Tota
l cos
t 54
0,00
0 54
0,00
0 54
0,00
0 54
0,00
0 54
0,00
0 54
0,00
0 54
0,00
0 54
0,00
0 54
0,00
0 54
0,00
0
NE
T C
AS
H
FL
OW
-4
,660
-4
,660
-4
,660
4,
660
-4,6
60
-4,6
60
-4,6
60
-4,6
60
-4,6
60
-4,6
60
143

144
In calculation of Net Present Values (NPV) for both of the alternatives, following
equation is used, which is also given in Section 4.6.
Where;
t = year 0 to year n
n = lifetime of ESP of IBSF
net revenues (t) = (revenue – cost) at time t
r = discount rate (Discount rate is the risk-free interrest rate, therefore it
is generally taken as the interrest rate of government bonds [54])
Lifetimes of the both alternatives are taken as 20 years [51]. On the other hand,
discount rate is selected as 9.70% considering interest rate of government bonds
(average of 2012 dated government bonds regardless of duration of the bonds) [55].
“Net revenues” is taken from cash flow analysis Table 5.38 and Table 5.39.
Estimated NPV’s of both of the alternatives are shown in Table 5.40 below.
Table 5.40. NPV’s of alternatives
Alternative NPV (€)
IBFS -33,663,294
ESP -7,245,078
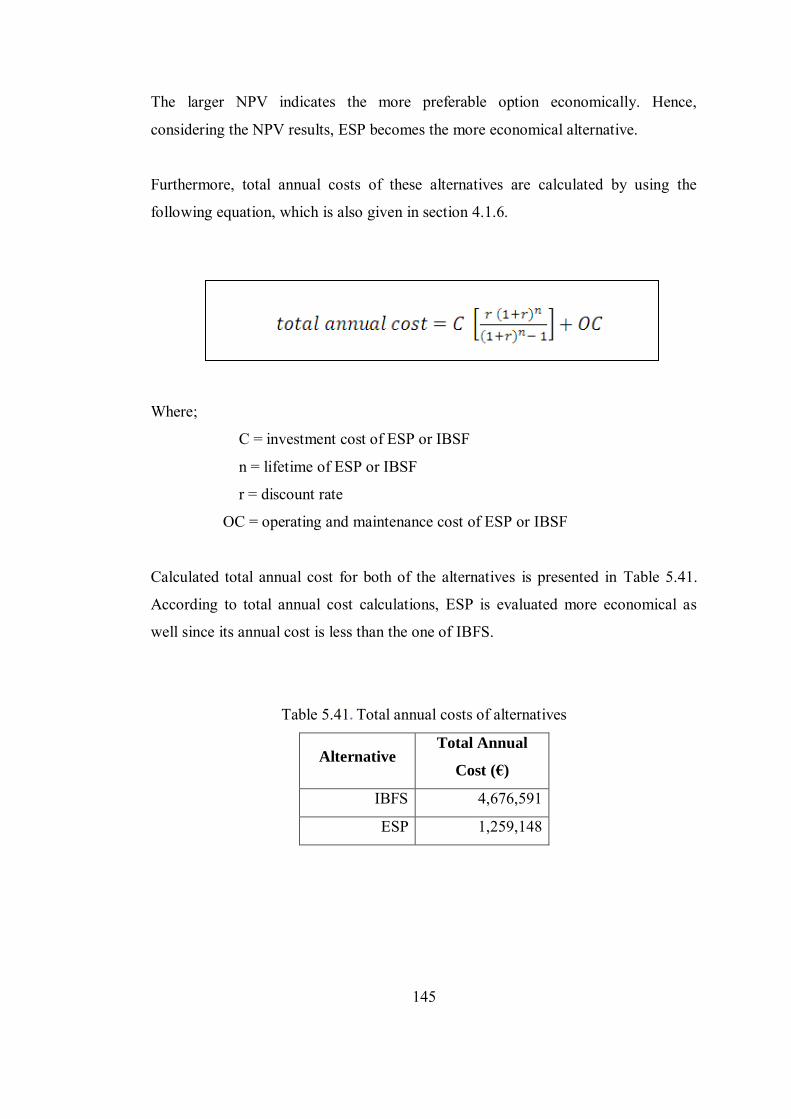
145
The larger NPV indicates the more preferable option economically. Hence,
considering the NPV results, ESP becomes the more economical alternative.
Furthermore, total annual costs of these alternatives are calculated by using the
following equation, which is also given in section 4.1.6.
Where;
C = investment cost of ESP or IBSF
n = lifetime of ESP or IBSF
r = discount rate
OC = operating and maintenance cost of ESP or IBSF
Calculated total annual cost for both of the alternatives is presented in Table 5.41.
According to total annual cost calculations, ESP is evaluated more economical as
well since its annual cost is less than the one of IBFS.
Table 5.41. Total annual costs of alternatives
Alternative Total Annual
Cost (€)
IBFS 4,676,591
ESP 1,259,148

146
Guideline 9- Attribution of cost to environmental protection:
In Section 4.6, it was stated that, in this stage the purpose of the alternatives should
be transparently distinguished, (1) those to be implemented for reduction or
prevention of the environmental pollution, and (2) those for other reasons such as
investment expenditure in waste minimization or energy conservation. It is also
stated that generally end-of-pipe techniques aim to reduce or prevent emissions.
Since both IBFS and ESP are end of pipe techniques, it can be concluded that their
common purposes are to reduce and prevent emissions.
5.7 Step 7 – Evaluation of Selected BAT Alternatives
Cost effectiveness of these alternatives are calculated using the equation given in
section 4.1.6. Although IBFS and ESP alternatives are selected because of their dust,
SO2, NO2 and heavy metal removal characteristics, as stated in section 5.5, the main
aim of these alternatives are dust removal. As a result, annual reduction term is based
on “dust removal” of these alternatives. As it was stated in Section 4.7, CE of the
alternatives are calculated by dividing annual cost by annual reduction (Equation 10).
Results of cost/effectiveness analysis are presented in Table 5.42. As it can be clearly
deduced from this table, ESP is the more preferred alternative with its lower CE
value.
Table 5.42. Cost effectiveness of alternatives
Alternative
Annual Cost
(€)
[Table 5.41]
Annual
Reduction (ton)
[Table 5.36]
CE (€/ton)
(annual cost/annual
reduction)
IBFS 4,676,591 4,504 1,038
ESP 1,259,148 4,410 285
147
5.8 Results Overview for Step 5, Step 6 and Step 7
In these steps, two of the suggested 36 BAT alternatives, IBFS and ESP, were
selected to be compared with each other with respect to their cross media effects on
the seven impact categories and their cost effectiveness.
In step 5, impacts of both of the alternatives on the four impact categories, human
toxicity, global warming, acidification and photochemical ozone creation were
calculated numerically, since the rest three categories, aquatic toxicity potencial,
eutrophication potencial and ozone depletion potencial were not applicable for these
BAT alternatives. Afterwards, BAT alternatives were compared with each other with
respect to these four impact categories and their energy concumption. According to
human toxicity, global warming and energy consumption, ESP became the preferable
option, on the other hand according to acidification and photochemical ozone
creation, IBFS became the preferable option. The selection should be made by the
authority of the facility considering their priorities. For instance, if the global
warming is a more important concern for the facility than the others, ESP should be
preferred. If acidification is considered to be more important, IBFS should be
preferred by the authority of the facility.
In the next step, Step 6, costs of the alternatives were evaluated considering their
investment costs, operational and maintenance costs, avoided costs and revenues.
NPVs and annual costs of the alternatives were calculated. NPV of ESP was
determined to be considerably higher than IBFS, which means that according to
NPV, ESP became the preferable option. On the other hand, annual cost of IBFS was
estimated to be four times higher than ESP, which also means that according to
annual cost, ESP became the preferable option. In other words, results of Step 6
show that, ESP is the more economical option than IBFS.
Finally, in Step 7, cost effectiveness analysis was performed using the results of Step
5 and Step 6, and the BAT alternatives were compared with respect to their CE
values. As a result of this Cost Effectiveness analysis, CE value of ESP was

148
determined to be quite higher than IBFS, which means that ESP is the preferable
option.
In conclusion, according to their cross media effects, selection can be alter according
to the importance of the impact categories for the authority of the facility, however,
if costs and CEs of the BAT alternatives are considered, it can be clearly deduced
that, ESP is the more proper option for the facility.
5.9 Step 8 – Evaluation of Economic Viability in the Sector
Iron and steel production sector has a very substantial role in the world considering
proliferation of the area of usage, increase of consumption day by day, its production
of raw material for other production sectors, and its great potential of export [2].
For Turkish economy, steel production is an important sector as well due to the
abovementioned reasons. The export of produced steel in Turkey was 12,3 billion
dollars corresponding 11% of the total export of Turkey [2],[56]. Moreover,
according to Turkish Statistical Institute, iron and steel sector takes the forth place
following textile, food and automotive sector comparing to its industry production
index that is an indicator of the greatness of a sector [57].
In Turkey three integrated plants are in activity beside 27 arc furnaces. All f these 30
plants are large scale facilities [58].
The facility is one of the biggest companies in Turkey. According to the research
conducted by Istanbul Board of Trade, the facility is considered in the first 10 in the
top list of 500 firms with a net sale of more than 3,2 billion TL [59]. Moreover
according to World Steel Association it is also in the top steel producers in the world.
The facility has a cleaner production approach to protect the environment. Since the
start of the modernization works in the facility in 2004, more than 160 million dollar
investment have been performed and these investments are still continuing [60].

149
Considering the scale of the facility and its approach to environmental protection, it
can be easily mentioned that, the facility has affordability and willingness to the
make real of selected the BAT alternatives.
In addition, Ministry of Environment and Urbanization have initiated the
implementation studies of IPPC Directive in Turkey. A lot of harmonization projects
have been completed and plenty of projects have been continuing. The regulations
have been being changed according to European Union Regulations. It is stated that,
the integrated permission system, which is a major requirement of IPPC, will be
passed in 2015, and fully application of permission system will be in 2018 [61]. With
the application of IPPC in Turkey, industrial establishments including iron and steel
facilities will be encouraged to apply BAT in BREF documents.

150
CHAPTER 6
6. CONCLUSION AND RECOMMENDATIONS
CONCLUSION AND RECOMMENDATIONS
In the recent years, due to the decrease of energy sources, raw material and water
resources and increase of environmental pollution, sustainable environmental
consciousness has been developed throughout the world. As a result, more stringent
limitations in legislations force the industry to meet increased energy efficiency,
reuse and recycle. One of the most important legislation is Directive on Integrated
Pollution Prevention and Control (96/61/EC) of European Union. IPPC strengthen
the concept of “Best Available Techniques (BAT)” which are most effective,
advanced and applicable methods in prevention of environmental pollution and
providing of efficient resource use. BAT of different industrial sectors are specified
in “Best Available Techniques Reference Documents (BREF’s)” prepared by
European Commission. In these Documents in addition to BAT alternatives, sectoral
process information, and specific emission and consumption limit values are
presented. Beside sectoral BREF documents, documents general issues were
published.
One of these general BREF’s is on Economics and Cross-Media Effects describing
the methodology on calculation and comparison of cross-media effects and cost-
effectiveness’ of the BAT alternatives.
There are great amount of BAT studies performed in different countries and
industrial sectors such as cement manufacturing, casting industry and textile
production. Yet, there is not any study performed on BAT application in iron and
steel sector in the literature, although iron and steel sector is one the major
environmental polluting and resource depleting industries. This deficiency in
environmental concern is filled by this study.

151
This thesis aims to evaluate the environmental performance of an integrated iron and
steel plant in Turkey and to suggest BAT alternatives suitable for this plant, by
considering the environmental impacts and cost/ effectiveness of these alternatives.
In this context, a case study was undertaken in an integrated iron and steel plant
representative for Turkish integrated iron and steel production
In this study, after a comprehensive input-output analysis, specific inputs and outputs
of the facility were calculated and compared with the limit values in BREF
Documents regarding Iron and Steel Production. Furthermore BAT alternatives for
the facility were determined and their applicabilities to the facility were specified.
Afterwards, considering BREF on Economics and Cross-Media Effects, two of the
applicable BAT options were selected and their cross-media effects were calculated.
Finally, cost/benefit analysis for both of the alternatives was performed.
In the light of the results of this study, following conclusions can be drawn;
The common problems related to inputs are energy and steam consumptions
of the sub-processes. As energy, electricity is consumed quite higher than the
limit values mentioned in BREF Documents.
Considering electricity consumption, steelmaking and casting process is the
most problematic sub-process and it is followed by sintering and coke making
processes respectively. Moreover, steel making and casting process exceeds
steam consumption limits priorly as well and iron making process exceed
slightly less than steel making and casting process, they are followed by coke
making process.
Dust emission is the common problem for the facility among other
parameters. Iron making is the leading sub-process by far and following sub-
processes are coke making, steel making and casting, sintering and rolling,
respectively. It can be deduced that all sub-processes have dust emission

152
problem, among them rolling process exceeds the limits in negligible
quantities comparing with the others.
The amount of heavy metal emissions arising from sintering process is so
enormous that dust emissions from this process become negligible. Especially
emissions of Ni and Cr are huge comparing to other emissions that are V,
Mn, Cu, dust, SO2 and NOx.
Comparing the number of parameters outside the limits of each sub-processes
of the facility between each other, it can be mentioned that sintering is the
most problematic sub-process, especially with respect to its energy
consumption and air emissions. The number of parameters outside the limits
of sintering process is 13, eight of them being air emissions. Sintering process
is followed by steel making-casting processes (5), coke making process (5)
and iron making process (4). On the other hand, among all, rolling process is
evaluated as the most environmental friendly sub-process comparing with the
other ones with only two parameters outside the limits.
Totally 74 BAT alternatives were evaluated with respect to their
applicabilities in the facility. Comparing the number of BAT alternatives,
coke is the prior sub-process having 25 BAT possible alternatives, followed
by sintering, iron making, steel making and casting, and rolling processes
with the number of possible BAT alternatives 20, 12, nine and eight
respectively.
Again among 74 alternatives, 31 BAT measures have already been applied,
seven alternatives are not applicable to the facility and the remaining 36
measures are suggested to the facility.
Number of suggested alternatives of sintering process is more than others, on
the other side; the largest number of measures that have already been applied
belongs to coke making process.
153
The most suitable BAT alternatives to be compared with respect to their
cross-media effects and cost/effectiveness’ were determined as “Electrostatic
Precipitator-ESP” and “Integrated Bag Filter System-IBFS” for Sintering
process. Considering cross media effects of the these alternatives, according
to human toxicity and global warming potential, and energy consumption of
ESP is the preferred alternative, on the other hand according to acidification
and photochemical ozone creation potential IBFS is the preferred option.
According to cost/effectiveness analysis, ESP is the more preferred
alternative with its lower CE value.
In recent years, due to the sharp increase of global warming and climate change in
the world, emission of greenhouse gases has gained importance in Turkey as well as
throughout the world. Therefore, Ministery of Environment and Urbanisation started
to work in order to decrease emission of greenhouse gases especially from the
industrial activities. Accordingly, it can be said that, among the seven impact
categories, global warming impact is the most crucial one for Turkish industrial
plants. Moreover, as wellknown, the cost/effectiveness of an implementation is the
most important factor for an industrial plant. Considering these, ESP is more suitable
option than IBFS since it has less global warming potential and CE value.
The facility where this study was undertaken produces about 50% of the Turkish
total integrated iron and steel and it applies the same manufacturing technologies as
the other integrated iron and steel plants in Turkey. Moreover environmental
performances of all of these three plants are similar. Considering all of these, it can
be said that the facility can be considered as representative for Turkish iron and steel
production. Therefore, the results of this study can aid decision makers to make
environmental initiatives in other iron and steel plants.
Turkey is in the harmonization period in European Union. In this context, Ministery
of Environment and Urbanization works on adaptation of IPPC directive to Turkish
Legislations. In this framework, the methodology followed in this study is crucial.

154
Since, after adaptation of IPPC Directive in Turkish Legislations, BAT application in
the industries will gain importance.
As it was mentioned before, only two of the BAT alternatives have been compared
with CME and CE analysis due to the data limitations. Both of the BAT alternatives
aim to decrease dust emissions from the sinter plant of the facility. In the future
studies, the methodology used in this study can be applied on the other crucial
problem of the facility, inefficient use of energy. Furthermore, the same
methodology can be extended for the other subprocesses such as iron making or coke
making.
It was stated in Section 3.2.2., there are studies evaluating individual and
combinations of BAT alternatives. In this study, individual BAT alternatives are
evaluated. As a recommendation, in future studies, combination of BAT alternatives
can be asseses with this methodology.
Finally, the lack measurements of in the facility cause some uncertainities in this
study. This situation leads to also problems in environmental management in the
facility. Therefore, a monitoring program is recommended to the facility. Especially,
the media listed below should be monitored by measuring relevant parameters;
gas treatment sludges,
gas cleaning waters,
cooling waters,
wastewater,
some other wastes

155
REFERENCES
[1] European Confederation of Iron and Steel Industries, website:
http://www.eurofer.org/, last accessed on April 10, 2011
[2] T.C. Sanayi ve Ticaret Bakanlığı, Demir Çelik Sektörü Raporu, Sanayi
Genel Müdürlüğü, Sektörel Raporlar ve Analizler Serisi, 2011
[3] World Steel Association, Statistics on Crude Steel Production of 2011
[4] Demir Çelik A.Ş, Annual Report, 2011
[5] Guo Z.C., Fu, Z.X., Current situation of energy consumption and measures
taken for energy saving in the iron and steel industry in China, Energy, 35,
4356–4360, 2010
[6] T.C. Enerji ve Tabii Kaynaklar Bakanlığı, 2010 yılı genel enerji dengesi,
website:http://www.enerji.gov.tr/EKLENTI_VIEW/index.php/raporlar/rapo
rVeriGir/62173/2, last accessed on April 10, 2011
[7] European Commission, Integrated Pollution Prevention and Control,
Reference Document on Economics and Cross-Media Effects, July 2006.
[8] European Commission, Integrated Pollution Prevention and Control,
Reference Document on Best Available Techniques in the Iron and Steel
Production, December 2001.
[9] European Commission, Integrated Pollution Prevention and Control,
Reference Document on Best Available Techniques in the Ferrous Metal
Processing, July 2001.
[10] Olmez G., 2011, Comparison of Sub-processes and Final Products of Iron
and Steel Production with Life Cycle Assessment, M.S. thesis, METU,
Ankara
[11] European Commission, Integrated Pollution Prevention and Control, Draft
Reference Document on Best Available Techniques in the Iron and Steel
Production, June 2011.
[12] Çakır, A.M., 2006, Kok Fırın Gazı Prosesleri ve Ek Tesisleri, M.S. thesis,
Atatürk Univ., Erzurum

156
[13] Annual Report of Energy Plant of the Facility
[14] Council Directive 96/61/EC of 24 September 1996 concerning integrated
pollution prevention and control, 24 September 1996
[15] Directive 2008/1/EC of the European Parliament and of the Council of 15
January 2008 concerning integrated pollution prevention and control, 15
January 2008
[16] European Commision Joint Research Centre, website:
http://eippcb.jrc.es/index.html, last accessed on April 10, 2011
[17] Directive 2010/75/EU of the European Parliament and of the Council of
24 November 2010 on industrial emissions (integrated pollution prevention
and control), 24 November 2010
[18] Martinez, J.L., The IPPC Directive: The EU Meets Pollution Prevention,
Environmental Quality Management, DOI 10.1002/tqem, 9-18, 2006
[19] O’Malley, V., The Integrated Pollution Prevention and Control (IPPC)
Directive and Its Implications for the Environment and Industrial Activities
in Europe, Sensors and Actuators B, 59, 78-82, 1999
[20] Schoenberger, H., Integrated Pollution Prevention and Control in Large
Industrial Installations on the Basis of Best Available Techniques: The
Sevilla Process, Journal of Cleaner Production, 17, 1526-1529, 2009
[21] Dijkmans, R., Methodology for Selection of Best Available Techniques
(BAT) at the sector level, Journal of Cleaner Production, 8, 11-21, 2000
[22] Nicholas, M.J., Clift, R., Azapagic, A., Walker, F.C., Porter, D.E.,
Determination of “Best Available Techniques” for Integrated Pollution
Prevention and Control: A Life Cycle Approach, Institution of Chemical
Engineers, Trans IChemE,78, Part B, 2000
[23] Georgopoulou,E., Hontou, V., Gakis,N., Sarafidis, Y., Mirasgedis, S., Lalas,
D.P., Loukatos, A., Gargoulas, N.,Mentzis, A., Economidis, D.,
Triantafilopoulos, T., Korizi, K., BEAsT, a Decision-Support Tool for
Assessing the Environmental Benefits on the Economic Attractiveness of
BAT in Industry, Journal of Cleaner Production,16, 359-373, 2008
[24] Karavanas, A., Chaloulakou, A., Spyrellis, N., Evaluation of the
Implementation of Best Available Techniques in IPPC Context: an

157
Environmental Performance Indicators Approach, Journal of Cleaner
Production, 17, 480-486, 2009
[25] Valderrama, C., Granados, R., Cortina, J.L., Gasol, C.M., Guillem, M., Josa,
A., Implementation of Best Available Techniques in Cement Manufacturing:
a Life-Cycle Assessment Study, Journal of Cleaner Production 25, 60-67,
2012
[26] Liu,X., Wen, A., Best Available Techniques and Pollution Control: a Case
Study on China’s Thermal Power Industry, Journal of Cleaner Production,
23, 113-121, 2012
[27] Brechet, T, Tulkens, H., Beyond BAT: Selecting Optimal Combination of
Available Techniques, with an Example from Limestone Industry, Journal of
Environmental Management 90, 1790–1801,2009
[28] Silvo,K., Jouttijärvi, T., Melanen, M., Ruonala, S., Best Available
Techniques (BAT) in the Finnish Pulp and Paper Industry, European
Environment, 15, 175-191, 2005
[29] Li Rosi, O., Casarci, M., Mattioli, D., De Florio, L., Best Available
Technique for Water Reuse in Textile SMEs, Desalination, 206, 614–619,
2007
[30] Kocabas, A.M., Yukseler, H., Dilek, F.B., Yetis, U., Adaptation of
European Union’s IPPC Directive to a Textile Mill: Analysis Water and
Energy Consumption, Journal of Environmental Management, 91, 102-113,
2009
[31] Fatta, D., Marneri, M., Papadopoulos, A., Savvides, C., Mentzis, A.,
Nikolaides, L., Loizidou, M., Industrial Pollution and Control Measures
for a Foundry in Cyprus, Journal of Cleaner Production, 12, 29–36, 2012
[32] Barros, M.C., Magan, A., Valino, S., Bello, P.M., Casares, J.J., Blanco,
J.M., Identification of Best available Techniques in the Seafood Industry: a
Case Study, Journal of Cleaner Production 17, 391–399, 2009
[33] Geldermann, J., Peters, N.H., Nunge, S. Rentz, O., Best Available
Techniques in the Sector of Adhesive Application, International Journal of
Adhesion & Adhesives, 24, 85–91, 2004
[34] Siemens AG, Solutions for Sinter Plants, 2011

158
[35] Biswal, B.K., Tiwari, S.N.,Mukherji, S., Biodegredation of oily sludges
from steel mills, Bioresource Technology 100, 1700–1703, 2009
[36] Schofield, N., Fisher, R., Anderson, D.R., Environmental challenges for the
iron-and steel making process, Ironmaking and Steelmaking, 31, 428-431,
2004
[37] Bisio, G., Rubatto, G., Energy savings and some environmental
improvements in coke-oven plants, Energy, 25, 247-265, 2000
[38] Diemer, P., Killich, H.J., Knop, K., Lüngen, H.B., Reinke, M., Schmöle, P.,
Potentials for Utilization of Coke Oven Gas in Integrated Iron and Steel
Works, 2nd International Meeting on Ironmaking /1st International
Symposium on Iron Ore , September 12-15, 2004
[39] International Finance Corporation, Environmental Health and Safety
Guidelines for Coal Processing, April 2007
[40] Hanafizadeh P. Latif V.,Robust Net Present Value, Mathematical and
Computer Modelling, 54, 233-242, 2011
[41] Dogan B., 2008, Adaptation of European Union’s IPPC Directive to a
Textile Mill: Analysis Water and Energy Consumption, M.S. thesis, METU,
Ankara
[42] Intergovernmental Negotiating Committe, Guidelines on best available
techniques and provisional guidance on best environmental practices
relevant to Article 5 and Annex C of te Stockholm Convenion on Persistent
Organic Pollutants, December 2004
[43] Multilateral Investment Gurantee Agency, Coke Manufacturing, 2006
[44] Kim, D., Shin, S., Sohn, S., Choi, J., Ban, B., Waste plastics as
supplemental fuel in blast furnace process: Improving combustion
efficiencies, Journal of Hazardous Materials, B94, 213–222, 2002
[45] Audibert, F., Waste Engine Oils, Rerefining And Energy Recovery, Elsevier,
first edition, 199-245, UK, 2006
[46] Spengler, T., Püchert H., Penkuhn T., Rentz O., Envronmental integrated
production and recycling management, European Journal of Operational
Research 97, 308 – 326, 1997

159
[47] Northeast Waste Management Officials’ Association and Illinois Waste
Management &Research Center, Industry Sector P2 Notebooks, Primary
Metals, website:
http://www.istc.illinois.edu/info/library_docs/manuals/primmetals/chapter2.
htm, last accessed on April 22, 2011
[48] Esezobor D.E, Balogun S.A., Zinc accumulation during recycling of iron
oxide wastes in the blast furnace, Ironmaking and Steelmaking, 33, 419-
425, 2006
[49] Elektrik Üretim Anonim Şirketi, Elektrik Üretim Sektör Raporu, 2010
[50] World Economic Forum, Cambridge Energy Research Associates; US
Department Of Energy,Thirsty Energy: Water and Energy in the 21st
Century, 2009
[51] Lin Guoxin, A Disucssion about Strategy about Flue Gss Dust Removal for
Indian Coal Fired Burner, 11th International Conference on Electrostatic
precipitation, Hangzhou, 2008
[52] Demir Çelik Üreticileri Derneği, website:
http://www.dcud.org.tr/tr/news.asp?news_id=156, last accessed on April 10,
2011
[53] T.C. Çevre ve Orman Bakanlığı, Sanayiden Kaynaklı Hava Kirliliğinin
Kontrolü Yönetmeliği, Official Gazette number: 27277, date 03.07.2009
[54] Official website of Aktüerya Bilimleri Akademisi, website:
http://www.aktueryabilimleri.com/index.php?option=com_content&view=ar
ticle&id=362:skonto-oran&catid=113:kdem-tazminat-karlklar&Itemid=328,
last accessed on August 20,2012
[55] Türkiye Cumhuriyeti Merkez Bankası, İhale Yöntemiyle Satılan Hazine
Bonoları ve Devlet Tahvilleri, website:
http://www.tcmb.gov.tr/evds/dibs/istihl.html, last accessed on August
20,2012
[56] Demir Çelik Üreticileri Derneği, Güncel İstatistikler, website:
http://www.dcud.org.tr/tr/page.asp?id=20, last accessed on April 10, 2011

160
[57] Türkiye İstatistik Kurumu, Sanayi Üretim Endeksi, website:
http://www.tuik.gov.tr/MetaVeri.do?alt_id=62, last accessed on April 10,
2011
[58] Demir Çelik Üreticileri Derneği, demir-çelik haritası, website:
http://www.dcud.org.tr/tr/page.asp?id=12, last accessed on April 10, 2011
[59] İstanbul Sanayi Odası, Türkiye’nin en büyük 500 sanayi kuruluşu-2010,
website: http://www.iso.org.tr/tr/web/besyuzbuyuk/turkiye-nin-500-buyuk-
sanayi-kurulusu--iso-500-raporunun-sonuclari.html, last accessed on April
10, 2011
[60] Official website of the facility
[61] Çevre ve Şehircilik Bakanlığı, website:
http://www.rec.org.tr/dyn_files/42/4623-EKOK-Direktifinin-Turkiyede-
Uygulanmasinin-Desteklenmesi-Projesi.pdf, last accessed on April 10, 2011
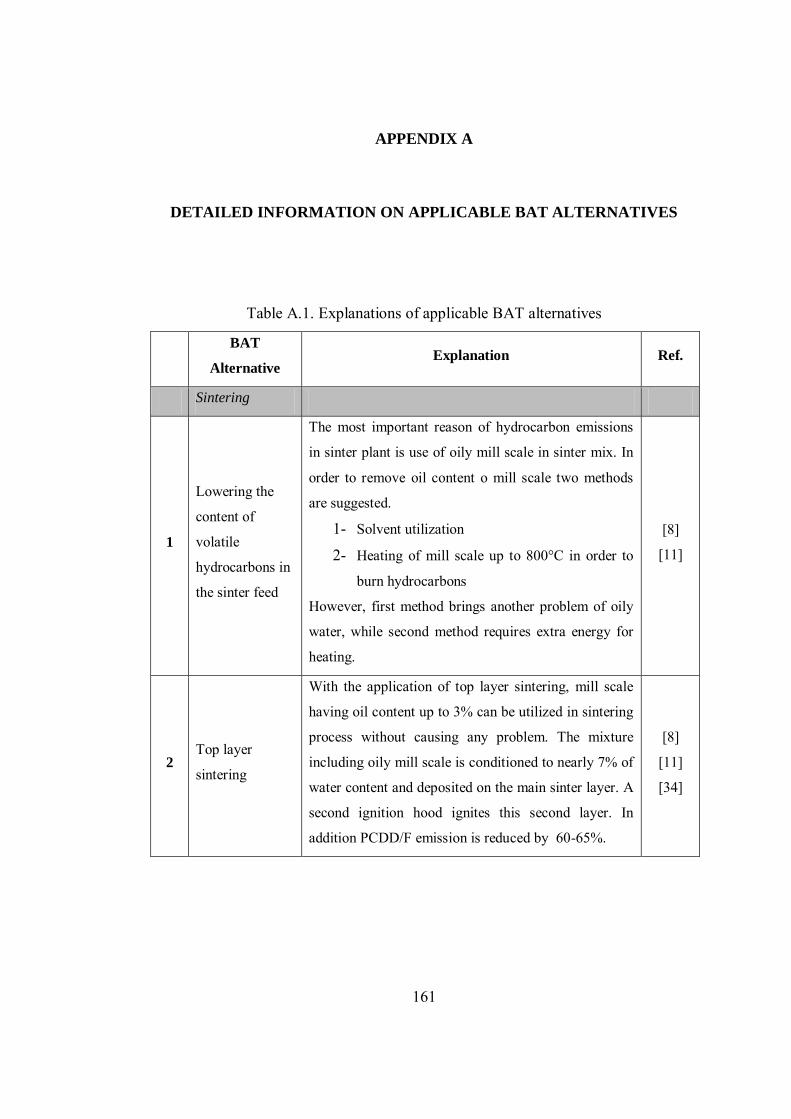
161
APPENDIX A
A. DETAILED INFORMATION ON APPLICABLE BAT ALTERNATIVES
DETAILED INFORMATION ON APPLICABLE BAT ALTERNATIVES
Table A.1. Explanations of applicable BAT alternatives
BAT
Alternative Explanation Ref.
Sintering
1
Lowering the
content of
volatile
hydrocarbons in
the sinter feed
The most important reason of hydrocarbon emissions
in sinter plant is use of oily mill scale in sinter mix. In
order to remove oil content o mill scale two methods
are suggested.
1- Solvent utilization
2- Heating of mill scale up to 800°C in order to
burn hydrocarbons
However, first method brings another problem of oily
water, while second method requires extra energy for
heating.
[8]
[11]
2 Top layer
sintering
With the application of top layer sintering, mill scale
having oil content up to 3% can be utilized in sintering
process without causing any problem. The mixture
including oily mill scale is conditioned to nearly 7% of
water content and deposited on the main sinter layer. A
second ignition hood ignites this second layer. In
addition PCDD/F emission is reduced by 60-65%.
[8]
[11]
[34]

162
Table A.1. Explanations of applicable BAT alternatives - continued
BAT Alternative Explanation Ref.
3 Waste gas
recirculation
Normally combustion in sintering process is provided
by clean air. In this method clean air is mixed with
waste exhaust gas from sinter machine recirculated to
a certain part of the sinter strand. So that the heat of
exhaust gas is recovered, moreover sinter strand acts
as a filter for particles and particulate emissions to
the air decreases. Four different waste gas
recirculation methods are described in BREF
Documents as follows;
1- Emission optimized sintering (EOS)
2- Low emission and energy optimized
sintering process (LEEP)
3- Environmental process optimized sintering
(EPOSINT)
4- Recycling of parts of waste gas to other parts
of the sinter strand
The difference of these methods is the parts of the
sinter strand that the exhaust gas is suctioned and
recycled onto.
[8]
[11]
[34]
[42]

163
Table A.1. Explanations of applicable BAT alternatives - continued
BAT Alternative Explanation Ref.
4
Suppression of
PCDD/F
formation by
addition of
nitrogen
compounds in the
sinter mix
With the addition of various additives such as
triethanolamine (TEA), monoethanolamine (MEA)
and urea into the sinter exhaust gas, PCDD/F
emissions can be prevented. Addition of urea also
minimizes HCl and HF emissions, however this
method has some disadvantages as follows;
Dust removal efficiency of ESP may
decrease,
Stack gas of sinter plant may be more visible
Ammonia emission may increase
Dust and micro pollutant emissions may
increase due to the abovementioned results
[11]
[36]
5 Twin layer
charging
Sinter mix is charged into the sinter machine by
dividing it into two according to the particle size;
Top layer includes small particle size and high coke
breeze content providing ignition easily. On the other
hand the particle size of bottom layer is large and its
coke breeze content is low, so that high permeability
and efficient use of fuel is provided.
In order to optimize and control moisture content,
preheating is required. By means of the
implementation of this method higher and more
stabilized quality can be achieved.
[34]

164
Table A.1. Explanations of applicable BAT alternatives - continued
BAT Alternative Explanation Ref.
6
Intensive mixing
and granulation
system- IMGS
With the application of this method, several benefits
are provided as follows;
No pre-mixing is required
An exactly homogenous sinter mix having
high and equal permeability is achieved
High production (> 40 ton/m² x 24 hr) is
approached even if iron ore very small in size
is consumed
Sinter having high and stabilized quality is
produced affecting blast furnace performance
positively, electricity consumption decreases
Coke breeze consumption decreases due to
the distribution as proper as possible
[34]
7
Advanced
electrostatic
precipitator (ESP)
By means of an electrostatic field generated, dust in
the stack gas of sinter plant is precipitated. Two types
of this method are present, wet and dry electrostatic
precipitators. In order to increase the efficiency three
or four ESP’s are placed and connected in series.
Dust removal efficiency of ESP is more than 95%.
Beside dust, other emissions also minimized such as
Sox, NOx, HCl, HF, heavy metals and PCDD/F. ESP
is a common dust removal method being in use.
[8]
[11]
8
Bag Filter-
combined or
integrated
reduction of solid
and gaseous
pollutants (IBFS)
An alternative dust removal method is bag filter
downstream to an ESP or cyclone (IBFS). By
injection of some adsorbents removal of PCDD/F,
PCB, HCB or PAH, moreover by using slaked lime
or sodium bicarbonate solutions, HCl, HF and SOx
removal is achieved. Removal efficiency of dust,
heavy metals and other emissions is quite high
comparing to other methods.
[8]
[11]

165
Table A.1. Explanations of applicable BAT alternatives - continued
BAT Alternative Explanation Ref.
9 Fine wet scrubber
(AIRFINE)
In scrubber system waste gas is treated by means of a
liquid. This liquid contaminated by dust is removed
from the system in to be treated further as sludge.
Conventional scrubber systems are not suitable for
sinter plants due to their content of hydrocarbons and
very small sized particles. In 1993, this system called
AIRFINE was developed. This system includes the
following items:
A cyclone or ESP for removal of larger
particles
A scrubber for gas cooling
A fine cyclone for smaller particles and
simultaneous gas cleaning
Water cleaning unit
Unlike dry cleaning methods, removal of pollutants
dissolving in water such as alkali chlorides and heavy
metal chlorides is possible. In case of NaOH addition
acidic compounds such as HF, HCl and SO2 can be
cleaned.
Dust emissions can be decreased up to from 40 to 80
mg/Nm3. Less dust emission values can be achieved
according to the situation of the unit. This method
provides removal of PCDD/F as well.
[8]
[11]
10 Desulphurization
A solution including SO2 gas, Ca or Mg is sprayed on
to the waste gas after cooling, and sulphur in the
waste gas is precipitated as CaSO4 or MgSO4.
After dewatering, precipitated CaSO4 can be utilized
by cement factories as raw material. Wet type of
desulphurization can be performed by scrubber as
well.
[8]
[11]

166
Table A.1. Explanations of applicable BAT alternatives - continued
BAT Alternative Explanation Ref.
11
Regenerative
active carbon
(RAC)
This is a dry sulphur removal method in which
sulphur is absorbed by activated carbon and H2SO4 is
produced as side-product.
This method can be added to the normal
desulphurization systems in order to increase the
removal efficiency. By means of Regenerative Active
Carbon, SO2, HCl, HF, Hg, dust, PCDD/F are
achieved. Moreover in case of HN3 injection NOX
emissions are prevented as well.
Since the construction and operational costs of this
method are high, this method have not being applied
in the recent years in Europe.
[8]
[11]
[42]
12 Selective catalytic
reduction (SCR)
NOx is converted to urea or N2 and H2 catalytically
by addition of NH3. Titanium oxide (TiO2),
vanadium pentoxide (V2O5) and tungsten oxide
(WO3) are generally used catalysts. Optimum
temperature range is 300-400°C. Reactions that take
place are as follows;
4NO + 4NH3 + O2 4N2 + 6H2O
6NO2 + 8NH3 7N2 + 12 H2O
The most crucial issue to be careful about is
deactivation of catalyst, accumulation of ammonium
nitrate being explosive and forming of corrosive SO3.
No wastewater is produced since SCR is a dry
method. The only waste produces is the deactivated
catalysts which can be recycled the manufacturer.
Desulphurisation is required priorly. Additionally
waste gas temperature should be more than 300°C.
Since the construction and operational costs of this
method are high, this method have not being applied
in the recent years in Europe.
[8]
[11]

167
Table A.1. Explanations of applicable BAT alternatives - continued
BAT Alternative Explanation Ref.
13
Reduction of
PCDD/F by
means of ESP and
additives
In order to remove PCDD/F in the waste gas,
activated carbon is injected prior to ESP. Waste gas
temperature should be smaller than for minimization
of fire. The retention time between gas injection
point and gas cleaning unit, which should be more
than three minutes between 150 and 180°C
temperatures.
[11]
14
Biological
treatment of oily
mill scale
It is proved that oily mill scale is treated biologically.
The oil content of the mill scale is reduced from 4.5-
5% to 2.7-3% after a decomposition lasting 60 days.
This is an economic and environmental friendly
method on the contrary to burning and
physicochemical methods such as solvent use.
[35]
15
Use of novel filter
for dust and
heavy metal
treatment
Novel filter is an alternative method to ESP and bag
filter. ESP cannot work efficiently in case of the
smaller dust concentration than 50mg/m3 in waste
gas. On the other hand bag filters has some
disadvantages such as being affected from content of
moisture and some other substances of waste gas, and
being harmed from the high temperature of waste
gas.
In order to overcome these problems, a method called
metallic novel filter is developed. These filters can be
cleaned easily and they are long lasting. However,
this is a new developed method and there is no
sufficient study is present.
[36]

168
Table A.1. Explanations of applicable BAT alternatives - continued
BAT Alternative Explanation Ref.
Coke making
1 Waste gas
recirculation
Similar to the sintering process, waste gas arising
form coke oven combustion rooms is mixed with
combustion air and given to the system as
combustion air. By this method, both waste heat of
exhaust gas is recovered and Nox emissions are
avolided since the low O2 and high CO2 content in
the waste gas prevents high flame temperature which
causes Nox emissions.
[11]
2 Closed belt
conveyors
Transportation of fine particle containing goods such
as granular coal or coke minimizes all material
emissions, especially dust emissions are prevented.
[11]
[43]
3 Stabilized coke
wet quenching
This system consists of a quenching tower,
quenching water sedimentation tank and a quenching
car. It has larger quenching tower than conventional
wet quenching towers with the dimensions
16x16x70m.
[11]
4
Preheating of
coal, combustion
air and fuel
When coal, combustion air and fuel is preheated
before being used, energy consumption decreases.
For preheating of coal, use of coke oven gas is
suggested.
[37]
5
De-NOx of waste
gas from coke
oven firing
(Selective
catalytic
reduction -SCR)
For NOx removal from coke oven gas, SCR method
is used as well as sintering process. Detailed
information was given above in BAT alternatives for
sintering process.
[8]
[11]
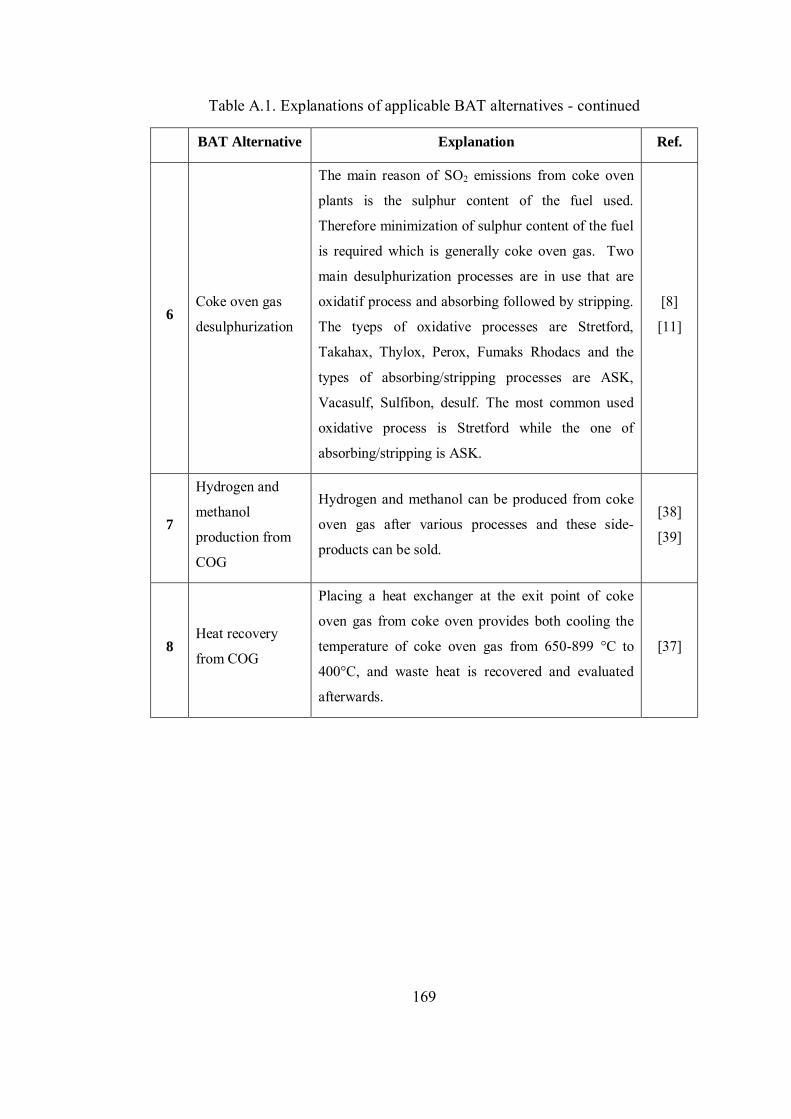
169
Table A.1. Explanations of applicable BAT alternatives - continued
BAT Alternative Explanation Ref.
6 Coke oven gas
desulphurization
The main reason of SO2 emissions from coke oven
plants is the sulphur content of the fuel used.
Therefore minimization of sulphur content of the fuel
is required which is generally coke oven gas. Two
main desulphurization processes are in use that are
oxidatif process and absorbing followed by stripping.
The tyeps of oxidative processes are Stretford,
Takahax, Thylox, Perox, Fumaks Rhodacs and the
types of absorbing/stripping processes are ASK,
Vacasulf, Sulfibon, desulf. The most common used
oxidative process is Stretford while the one of
absorbing/stripping is ASK.
[8]
[11]
7
Hydrogen and
methanol
production from
COG
Hydrogen and methanol can be produced from coke
oven gas after various processes and these side-
products can be sold.
[38]
[39]
8 Heat recovery
from COG
Placing a heat exchanger at the exit point of coke
oven gas from coke oven provides both cooling the
temperature of coke oven gas from 650-899 °C to
400°C, and waste heat is recovered and evaluated
afterwards.
[37]

170
Table A.1. Explanations of applicable BAT alternatives - continued
BAT Alternative Explanation Ref.
Iron making
1 Direct injection of
reducing agents
In blast furnaces, some of the coke can be replaced
by other hydrocarbon sources such as heavy oil, oil
residues, recovered waste oil, granular or pulverized
coal, natural gas or coke oven gas and waste plastics.
The most common used ones are coal and oil. By this
method, requirement for coke is decreased.
Considering that the production of coke is very
polluting and expensive, it can be deduced that this
method provides minimization of environmental
pollution and operational cost. These materials are
injected to blast furnaces via tuyeres.
[8]
[11]
2
Energy recovery
from top gas
pressure
The pressure at the exit point of blast furnace gas is
quite high and the energy there can be recovered by
placing turbine at this point. A top gas pressure of 2-
2.5 bar provides 15 MW electricity generation and an
energy of 0.4 GJ/ton hot metal produced is recovered.
[8]
[11]
3 Use of tar-free
runner linings
Use of tar free runner linings in blast furnaces
minimizes VOC ve PAH emissions. This type of
liners is more resistible to slag and more long-lasting
comparing to others.
[8]
[11]
4
Gas recovery
system from top
hopper release
The pressure in the blast furnace is up to 2.5 bar
which is more than atmospheric pressure. During the
charge of blast furnace, in order to equilibrate the
atmospheric pressure with the pressure in the blast
furnace, some blast furnace gas is discharge to the
atmosphere which causes air emission and waste of
energy. With application of this method, this released
gas is collected and recovered in order to prevent air
emissions and provide energy recovery.
[11]

171
Table A.1. Explanations of applicable BAT alternatives - continued
BAT Alternative Explanation Ref.
5 De-dusting of tap
holes and runners
During casting of liquid iron and slag due to the
formation of ferrous oxides such as Fe2O3 which
causes brown fume. In order to suppress during
casting, typically two measures are taken;
Covering the runners with movable lids
Dissipating oxygen from hot metal by
using of N2 gas
So that formation of ferrous oxides is prevented.
[8]
[11]
6 Fume suppression
during casting
This is a more complex and costly method with the
same aim of the previous measure. The whole
transfer route of the hot metal is enclosed by
specially designed sculptures. The space between hot
metal is kept minimum and if necessary this space is
filled with N2 gas in order to dissipate oxygen from
hot metal.
[8]
[11]
7
Hydro-cyclonage
of blast furnace
sludge
Zinc is present in gas treatment sludge as fine
particulate zinc oxides. By means of hydro-cyclonage
of this sludge separating these fine particles from
larger iron particles. With this method, two different
sludges are generated having low and high zinc
content. Sludge including low zinc is recycled to the
sintering process in order to recover iron in it,
whereas the one including high zinc is sent to
disposal of zinc recovery plant depending on the zinc
enrichment.
[11]
[46]
8
Condensation of
fume from slag
granulation
During slag processing H2S and SO2 emissions are
generated. Odor problem arised due to H2S generated
is prevented with this method.
[8]
[11]

172
Table A.1. Explanations of applicable BAT alternatives - continued
BAT Alternative Explanation Ref.
Steel making and
casting
1
Dust hot
briquetting and
recycling
Dust from stack gas treatment of basic oxygen
furnaces are heated up to 750°C in a hot briquetting
plant and then they are shaped as briquettes with the
help of a cylindrical press machine. These briquettes
are fed in to basic oxygen furnaces in order to recycle
of iron in the briquettes. This process continues, in
time the zinc content of the briquettes enriches.
When the zinc content of the briquettes reaches up to
a certain level, it is sent to zinc recover plants.
[8]
[11]
[47]
[48]
2
Treatment of
wastewater from
continuous
casting
Cooling water generated during countinuous casting
is separated from the oily mill scale my means of
settling tanks as well as sand filters.
[8]
[11]
Rolling
1 Regenerative
burner system
This is an alternative method to racuperators which is
currently in use in the facility, aiming to recover the
heat of exhaust gas arising from heating furnaces. In
regenerative burner two sets of heat exchangers are
present including brick pieces or ceramic balls. When
one of the burner is in firing mode, regenerator of
other burner is heated by direct contact with exhaust
gas. After a certain time, flow is switched to reverse
of the process. In this type of systems preheated air
temperature can be achieved up to 1100-1300°C,
which provides a quite high amount of energy
recovery in the furnace.
[9]

173
Table A.1. Explanations of applicable BAT alternatives - continued
BAT Alternative Explanation Ref.
2
External flue gas
recirculation
(FGR)
Flue gas recirculation is a NOx emission reduction
system, limiting peak flame temperatures. Waste gas
from the furnaces is recirculated by mixing the air, so
that flame temperature is decreased due to the
reduction of oxygen content in the air to 17- 19%.
This provides both minimization of NOx emission
and energy recovery. Similar systems were
mentioned above in sintering and coke making
processes.
[9]
3 Selective catalytic
reduction (SCR)
For NOx removal from coke oven gas, SCR method
is used as well as sintering process. Detailed
information was given above in BAT alternatives for
sintering process.
[9]

174
APPENDIX B
B. DETAILED INFORMATION ON NON-APPLICABLE BAT
ALTERNATIVES
DETAILED INFORMATION ON NON-APPLICABLE BAT
ALTERNATIVES
Table B.1. Reason why BAT alternative is not applicable to the facility
BAT
alternative Reason Ref.
Sintering
1
Lowering the
sulphur content of
the sinter feed
It is stated that, iron ore having low sulphur content
and coke breeze smaller in size should be consumed
in order to decrease the sulphur emissions. In the
facility, previously a feasibility study had been
conducted comparing the cost of construction of a
desulphurization system for stack gas and the cost
of purchase of low sulphur containing iron ore
consumption. The results had shown that purchase
of iron ore with low sulphur content is not feasible.
In addition, by using coke breeze very small in size,
completely combustion cannot be provided and
combustion efficiency decreases.
[8]
[11]
Coke Making
1
Emission reduction
during coke oven
firing
Reducing of coking temperature in coke ovens is
suggested aiming decrease of NOx emissions.
However, a temperature decrease in coke ovens will
lead to an increase in coking time, causing a
decrease in production efficiency.
[8]
[11]

175
Table B.1. Reason why BAT alternative is not applicable to the facility- continued
BAT
alternative Reason Ref.
2 Large coke oven
chambers
As stated in BREF document, this method cannot
be applied in existing coke oven plants.
[8]
[11]
3 Non-recovery
coking
As stated in BREF document, this method cannot
be applied in existing coke oven plants.
[8]
[11]
Steel Making and
Casting
1 Lowering the zinc-
content of scrap
Only unpainted and ungalvanized scrap includes
low zinc, who cannot be found easily in the market.
[8]
[11]
Rolling
1
Limiting air
preheating
temperature
Air preheating is a method providing energy
efficiency in furnaces and preventing CO2 and SO2
emissions. Limiting air preheating provides NOx
reduction however it causes increase in energy
consumption in furnaces and CO2 and SO2
emissions.
[9]
2
Selective non-
catalytic reduction
(SNCR)
In order to decrease the NOx emission, providing a
reaction in flue gas of furnaces reducing NOx to N2
is suggested. However this reaction requires 850-
1100°C temperature and flue gas of furnaces should
be heated up to this temperature. This consumes
huge amount of energy, in other words, this method
is not feasible.
[9]