Evaluation of Apical, Coronal and Occlusal Form Diffrences ...
52
Loma Linda University eScholarsRepository@LLU: Digital Archive of Research, Scholarship & Creative Works Loma Linda University Electronic eses, Dissertations & Projects 8-1-2012 Evaluation of Apical, Coronal and Occlusal Form Diffrences with Conventional Orthodontic Treatment Tamar Sardarian Loma Linda University Follow this and additional works at: hp://scholarsrepository.llu.edu/etd Part of the Orthodontics and Orthodontology Commons , and the Other Dentistry Commons is esis is brought to you for free and open access by eScholarsRepository@LLU: Digital Archive of Research, Scholarship & Creative Works. It has been accepted for inclusion in Loma Linda University Electronic eses, Dissertations & Projects by an authorized administrator of eScholarsRepository@LLU: Digital Archive of Research, Scholarship & Creative Works. For more information, please contact [email protected]. Recommended Citation Sardarian, Tamar, "Evaluation of Apical, Coronal and Occlusal Form Diffrences with Conventional Orthodontic Treatment" (2012). Loma Linda University Electronic eses, Dissertations & Projects. 98. hp://scholarsrepository.llu.edu/etd/98
Transcript of Evaluation of Apical, Coronal and Occlusal Form Diffrences ...

Loma Linda UniversityTheScholarsRepository@LLU: Digital Archive of Research,Scholarship & Creative Works
Loma Linda University Electronic Theses, Dissertations & Projects
8-1-2012
Evaluation of Apical, Coronal and Occlusal FormDiffrences with Conventional OrthodonticTreatmentTamar SardarianLoma Linda University
Follow this and additional works at: http://scholarsrepository.llu.edu/etd
Part of the Orthodontics and Orthodontology Commons, and the Other Dentistry Commons
This Thesis is brought to you for free and open access by TheScholarsRepository@LLU: Digital Archive of Research, Scholarship & Creative Works. Ithas been accepted for inclusion in Loma Linda University Electronic Theses, Dissertations & Projects by an authorized administrator ofTheScholarsRepository@LLU: Digital Archive of Research, Scholarship & Creative Works. For more information, please [email protected].
Recommended CitationSardarian, Tamar, "Evaluation of Apical, Coronal and Occlusal Form Diffrences with Conventional Orthodontic Treatment" (2012).Loma Linda University Electronic Theses, Dissertations & Projects. 98.http://scholarsrepository.llu.edu/etd/98

LOMA LINDA UNIVERSITY School of Dentistry
in conjunction with the Faculty of Graduate Studies
____________________
Evaluation of Apical, Coronal and Occlusal Form Differences with Conventional Orthodontic Treatment
by
Tamar Sardarian
____________________
A Thesis submitted in partial satisfaction of the requirements for the degree of
Master of Science in Orthodontics and Dentofacial Orthopedics
____________________
August 2012

© 2012
Tamar Sardarian All Rights Reserved

iii
Each person whose signature appears below certifies that this thesis in his/her opinion is adequate, in scope and quality, as a thesis for the degree Master of Science. , Chairperson Joseph Caruso, Professor of Orthodontics and Dentofacial Orthopedics Mark Batesole, Assistant Professor of Orthodontics and Dentofacial Orthopedics V. Leroy Leggitt, Professor of Orthodontics and Dentofacial Orthopedics Kitichai Rungcharassaeng, Associate Professor of Orthodontics and Dentofacial Orthopedics

iv
ACKNOWLEDGEMENTS
I would like to thank my committee members for their guidance and support
throughout my research project. A special thank you to Dr. Batesole for allowing me to
use his CephalometriX program and for all his time and effort in helping with my data
analysis. To my family, I cannot thank you enough for all your encouragement and
continued support.

v
CONTENTS
Approval Page .................................................................................................................... iii Acknowledgements ............................................................................................................ iv Contents ...............................................................................................................................v Figures............................................................................................................................... vii Tables ............................................................................................................................... viii Abbreviations ..................................................................................................................... ix Abstract ................................................................................................................................x Chapter
1. Introduction ..............................................................................................................1 Statement of the problem ...................................................................................1 Hypothesis..........................................................................................................1
2. Review of the Literature ..........................................................................................3
Development of Arch Form ...............................................................................3 Arch Form in Different Malocclusions ..............................................................4 Alveolar Arch Form Differences .......................................................................5 Clinical Implications ..........................................................................................7 CBCT .................................................................................................................8 Euclidean Distance Matrix Analysis ..................................................................9
3. Materials and Methods ...........................................................................................11
Statistical Analysis ...........................................................................................21
4. Results ....................................................................................................................22 Reproducibility ................................................................................................22 EDMA with Bootstrap Analysis ......................................................................22
5. Discussion ..............................................................................................................26 Statistical Significance .....................................................................................26 Clinical Significance ........................................................................................27

vi
Subject Demographic .......................................................................................28 Future Studies ..................................................................................................29 Conclusions ......................................................................................................30
References ..........................................................................................................................31 Appendix
A. Reproducibility Data ..........................................................................................35
B. Python Script to Extract XYZ Points .................................................................38

vii
FIGURES
Figures Page
1. Frequency of Maxillary and Mandibular ALD in Millimeters ..............................14
2. Landmark Selection in the CephalometriXTM Plugin Using MPR View ................15
3. AP Landmark Selection in the CephalometriXTM Plugin Using MPR View ..........16
4. Selection of CO Landmark for Upper Left First Molar .........................................17
5. Selection of CO Landmark for Upper Right Central Incisor .................................18
6. OC Landmark for Lower Right Second Bicuspid ..................................................19
7. OC Landmark for Upper Right Central Incisor .....................................................20
8. Results of EDMA with Bootstrap Analysis, Showing the Distribution and p-values of Each Sample ........................................................................................24
9. Visualization of Changes in Interlandmark Distances From T1 to T2 for Each Sample...........................................................................................................25

viii
TABLES
Tables Page
1. Reproducibility – Overall Intraclass Correlation ...................................................22

ix
ABBREVIATIONS
ALD Arch length discrepancy
AP Apical
CBCT Cone beam computed tomography
CO Coronal
CT Computed Tomography
EDMA Euclidean distance matrix analysis
FDM Form difference matrix
ICC Intraclass correlation coefficient
MPR Multi-planar reconstruction
OC Occlusal
T1 Time point for pre-orthodontic treatment
T2 Time point for post-orthodontic treatment
x
ABSTRACT OF THE THESIS
Evaluation of Apical, Coronal and Occlusal Form Differences with Conventional Orthodontic Treatment
by
Tamar Sardarian
Master of Science, Graduate Program in Orthodontics and Dentofacial Orthopedics School of Dentistry, September 2012
Dr. Joseph Caruso, Chairperson
Introduction: Cone-beam computed tomography (CBCT) can be used to
accurately identify dental landmarks in order to detect changes in dental arch forms.
Purpose: The objective of this study was to determine how apical, coronal and
occlusal arch forms change following orthodontic treatment with fixed appliances and to
establish a base for future studies.
Material and Methods: Maxillary and mandibular apical, coronal and occlusal
landmarks of 27 subjects were selected on their respective CBCT images at two time
points: pre-orthodontic treatment (T1) and post-orthodontic treatment (T2). Comparisons
were made between the two time points to evaluate how each arch form changed
following routine orthodontic treatment.
Statistical Analysis: Euclidean Distance Matrix Analysis (EDMA) with bootstrap
analysis was used to assess changes in geometric form from T1 to T2 at each of the three
levels. Landmark selection was repeated on 10 subjects and an intraclass correlation
(ICC) was used to assess reproducibility.
Results: The mandibular apical arch showed statistically significant change in
geometric form from T1 to T2. No statistically significant change was observed in the
mandibular coronal and occlusal, as well as maxillary apical, coronal and occlusal arches.

xi
Conclusion: During conventional orthodontic treatment of Class I, minimally
crowded cases, selecting orthodontic arch wires according to the clinical coronal or
occlusal arch form is viable.

1
CHAPTER ONE
INTRODUCTION
Statement of the Problem
The pre-treatment dental arch form is an important factor in the diagnosis and
treatment planning of orthodontic patients. Many studies have tried to identify a single,
unique shape that best fits the dental arch form of particular orthodontic samples in an
attempt to provide the best alignment and stability. While many studies have focused on
describing these arch forms via various methods, it’s also important to apply these
methods to orthodontically treated patients in order to understand how these arch forms
really change with treatment. With the emergence of cone beam computed tomography
(CBCT), we are now able to accurately identify and evaluate changes in these arch forms
at multiplanar levels. Understanding these changes can perhaps lead to more predictable
and stable orthodontic results.
The objective of this study was to determine how apical, coronal and occlusal
arch forms change following orthodontic treatment with fixed appliances. Furthermore,
this study will serve as a base for future studies.
Hypothesis
The null hypothesis in this study was: There is no difference in the geometric
form of the apical, coronal and occlusal arches following orthodontic treatment.

2
The alternative hypothesis was: There is a significant change in the geometric
form of the apical, coronal and occlusal arches following orthodontic treatment.
3
CHAPTER TWO
REVIEW OF THE LITERATURE
Development of Arch Form
Arch form refers to the position of teeth contained within the alveolar bone and
their relationship to one another as well as to the opposing arch. In the past, arch forms
were classified according to their geometric shape, such as elliptical, parabolic, segments
of circles joined to straight lines, and even as modified spheres.1 Raberin et.al. later went
on to group arch forms into two main groups, the stretched group, which included narrow
and pointed arch forms, and the stocky group, which included wide, mid and flat arch
forms.2 When studying the dental arches of untreated subjects, Ricketts developed a
pentamorphic arch system that included five different types of arch forms: normal,
tapered, narrow tapered, ovoid and narrow ovoid.3 These five arch forms, he believed,
would fit all facial types. Today, many arch forms are defined by mathematical
functions, such as the catenary curve and the cubic spline curve.4 Although many
attempts have been made to try and identify a single, simple arch form that represents
either the maxilla or the mandible, investigators have come to the conclusion that no such
ideal arch form exists.2,5
It is without doubt that certain anatomic factors dictate the natural arch form.
Initial shaping of the arch form occurs by the configuration of the supporting bone1 and is
further shaped by the oral muscles and intraoral functional forces, such as the muscles of
mastication and those of occlusion.6 Stability of occlusion is achieved once the maxillary
4
and mandibular teeth are arranged in harmonious arch forms that are in equilibrium.7
The dental arch forms continue to change as one grows, adapts and ages. Carter et. al.
showed that decrements of up to 3 mm occur in the arch width, depth and perimeter in
untreated subjects between late adolescence and the fifth or sixth decade of life.8
Arch forms may also be subject to the unfavorable influence of abnormal functions
of the orofacial complex, such as consistent mouth breathing, low tongue posture and
abnormal swallowing patterns. A study by Melink et. al. showed that sucking habits also
play a role in affecting arch form by finding a positive correlation between a prolonged
pacifier sucking habit and smaller maxillary and larger mandibular arch widths.9
Arch Form in Different Malocclusions
Analysis and evaluation of the arch forms of patients with Class I, Class II and
Class III malocclusions have revealed consistent differences between them.1,10,11 Yet no
one particular arch form has been found to be unique to each group.
In a study by Braun et. al., both the maxillary and mandibular dental arch forms of
Class I, Class II, and Class III patients were evaluated for differences in arch depth and
arch width. According to their results, the mandibular arch shape of Class II occlusions
was on average 3 mm smaller in arch depth and 2.3 mm narrower in arch width than
normal Class I arches. The mandibular arch shape of Class III occlusions, on the other
hand, was about 3.3 mm smaller in arch depth and 2.1 mm wider beginning in the
premolar area than the arch of Class I occlusions. When analyzing differences in the
maxillary arch shape, the arch depths for all three occlusions were found to be about the
same. However, Class II maxillary arches were on average 1.5 mm narrower beginning
in the lateral incisor-canine area while Class III maxillary arches were on average 5.1 mm

5
wider than Class I widths.1 Qiong et. al. also added that patients with Class II division 1
malocclusions in particular have larger maxillary arches than Class I occlusion patients,
but with a narrow posterior arch width that required expansion to harmonize with the
mandibular arch.10
The etiology of the variations in arch form among the different malocclusions is
primarily due to variations in growth and development of either the maxilla or the
mandible. While Class II malocclusions result from a transverse deficit in the mandible,
Class III malocclusions arise from a maxillary arch that’s insufficient in the transverse
and sagittal dimensions.11 With these differences in mind, the orthodontist can customize
the treatment that is to be rendered to patients with different malocclusions.
Alveolar Arch Form Differences
As discussed earlier, the natural position of teeth within the arch is directed by the
underlying basal bone. With differences in the dental arch form of patients with different
malocclusions evident, it’s certainly no surprise that alveolar arch forms will vary as
well. Uysal et. al. examined alveolar arch widths in normal, Class II division 1, Class II
division 2, and Class III malocclusions in an effort to explain differences in the dental
arch form observed among these groups. He found that in both Class II division 1 and
Class II division 2 occlusions, the maxillary and mandibular alveolar widths were
significantly narrower than that of Class I occlusions. To compensate for this insufficient
alveolar base, maxillary molars in Class II occlusions, especially in division 1 cases, tend
to incline buccally.12 Similar observations were made in the maxillary alveolar widths of
Class III occlusions, with all measurements being significantly narrower in comparison to
the Class I group. However, Class III mandibular alveolar widths were significantly

6
larger than in the Class I group. These patients tend to have their maxillary teeth inclined
lingually while their mandibular teeth are inclined buccally.13 With respect to basal bone
in adolescents and adults, no significant differences between the two groups have been
found.14
With the basal bone playing an integral role in positioning of teeth within the arch,
many investigators have attempted to use the alveolar arch form to predict the appropriate
dental arch form. Ronay et. al. examined the mandibular dental arch form at points
where orthodontic brackets would be placed clinically and at the level of the underlying
apical base. It was concluded that although the mandibular arch cannot be classified
according to one general shape, the apical base arch form strongly correlates with the
clinical arch form in Class I patients and so can be used to predict an individualized
dental arch form.15 The same prediction method has been found to be useful in Class II
occlusions.16 However, it’s important to note that the points representative of the apical
base in these studies were only estimates determined by the height of the mucogingival
junction.
A study by Vanarsdall et. al. has shown that orthodontic treatment with standard
edgewise appliances does not affect the width of the basal structure in either the mandible
or the maxilla.17 For this reason, it has become even more critical to consider alveolar
dimensions in treatment, especially since it is now known that the width of the bone can
limit the amount of orthodontic tooth movement possible, with patients having narrow
alveolar widths demonstrating less tooth movement and more iatrogenic consequences.18

7
Clinical Implications
The size and shape of the arch affect the amount of space available, stability of the
dentition, occlusion and esthetics. With orthodontic treatment using fixed appliances
alone, the orthodontist can attain significant increases in the perimeter of the dental
arches during the leveling and aligning phases of treatment, with one study reporting up
to a 3.5 mm increase in the maxillary arch.19 This expansion will not only allow the
orthodontist to gain space within the arch, but will produce what they believe to be a
more esthetically pleasing result. Esthetics is a key factor in orthodontic treatment and
can be influenced by arch form. Kokich was quick to point out that orthodontists are far
more perceptive to changes in dental esthetics than both general dentists and laypeople.20
A study by Roden-Johnson et. al. showed that most orthodontists deem broader arches to
be more attractive than narrower ones and so tend to expand them in an effort to produce
what they perceive as the most esthetic result. Laypeople, on the other hand, didn’t have
a strong preference for a particular arch form.21 This suggests that it may be wise for
orthodontists to understand their patients’ esthetic concerns and expectations prior to
expanding arches for purely esthetic reasons.
With so many changes being made to the arch form with orthodontic treatment, one
questions the long term stability of these changes. The stability of expanded arches is
usually compromised. When dental arch forms are changed with treatment, there is a
strong tendency for it to return back to its pre-treatment shape following the post-
retention period. The greater the amount of change made, the greater this tendency for
relapse.22 A study by Felton et. al. reported that about 70% of cases that undergo arch
form changes are not stable and result in post-treatment changes.23 In particular, arch
expansion has been found to be more stable in non-extraction than in extraction cases and

8
more so in the posterior region, while the least amount of stability is expected in the
expansion of lower intercanine arch width.24 As for long-term stability, a longitudinal
study by Ward et. al. showed that patients treated orthodontically will have a statistically
significant increase in maxillary intercanine arch width, a decrease in maxillary and
mandibular intermolar widths, and a decrease in mandibular intercanine arch width,15
suggesting the instability of altered arch form over time.
As discussed earlier, the alveolar bone imposes a biologic limit on the amount of
tooth movement possible by limiting the size of the arch. If teeth are moved beyond this
limit, tipping of teeth, loss of attachment and other periodontal problems, and unstable
treatment results with subsequent relapse are likely to ensue.15,26 In addition to causing
deleterious tissue effects and compromising post-treatment stability, increasing the arch
width beyond that of the natural form can also affect lip support and facial esthetics.26
These unfavorable consequences of over expansion of the dental arch must be kept in
mind throughout treatment.
To date, no studies have been done accurately locating and evaluating the changes
in the geometric form of the dental arches brought about by orthodontic treatment. With
the development of cone beam computed tomography, evaluating dental arch forms more
comprehensively has become possible, making it an important tool in orthodontic
diagnosis and treatment planning.
CBCT
Many advances have been made within the field of imaging. In the past, the use of
new and emerging imaging tools by orthodontists has been limited due to concerns with
cost, efficiency and radiation exposure. However, with the development of the cone
9
beam computed tomography (CBCT), more and more dental practitioners are using this
3-dimensional imaging system in their diagnosis and treatment planning. CBCT is highly
recommended for evaluation of impacted teeth, the TMJ, airway and maxillofacial
growth in orthodontics.27 It has truly proven to be a comprehensive imaging modality.
CBCT can provide images with high diagnostic quality and high resolution in a 10
to 70 second scan. Furthermore, it can produce a 3-dimensional image with minimal
distortion, making it a unique tool for the orthodontist to use in treatment planning. The
advantages of CBCT are plentiful. In addition to the aforementioned, CBCT also
provides image accuracy, has a rapid scan time, and reduces image artifacts, allowing for
unprecedented evaluation of anatomic structures.28 CBCT has also proven to be an
extremely useful tool for evaluating bone29 and is routinely used to evaluate implant sites.
With such accurate images, studies have shown that measurements made from these
CBCT volumes can accurately be used for quantitative analysis.30 The accuracy with
which CBCT can identify various anatomical structures and relationships can certainly
help improve diagnosis, treatment planning, and prognosis in orthodontics.31
One concern with the use of CBCT in orthodontics has been the radiation dose.
Tthe radiation dose of CBCT is reduced and is markedly lower than that of a CT scan27,28
and so is the preferred method for when 3-dimensional imaging is required.
Euclidean Distance Matrix Analysis
Several different methods for evaluating changes in geometric form have been
proposed.32,33,34 However, Euclidean Distance Matrix Analysis (EDMA) has been
deemed most suitable for evaluating landmark data. It has been used extensively in
craniofacial morphology studies such as growth studies,35,36,37 analysis of dental arch

10
forms,38,39,40,41 and in the evaluation of changes resulting from orthodontic and orthopedic
treatment.42,43 EDMA is a statistical analysis that separates size from shape and allows
changes in shape or form to be measured as a displacement of a landmark relative to all
other landmarks. It attempts to describe change in form in terms of the entire shape and
localizes areas of major change.44 In this analysis, a form matrix of the distances
between the landmarks in a sample is calculated. The form matrices of two samples are
then compared by the calculation of a form difference matrix (FDM), which is a ratio of
one form matrix to the other. If no difference exists between two landmarks, the FDM
value is 1.00. A value greater or less than 1.00 indicates the distance between the
landmarks increased or decreased respectively. An advantage to this method is that the
matrix is independent of translation or rotation, with the distances between the landmarks
being the same regardless of the orientation of the landmark coordinate system.
Furthermore, the error around one landmark is added to the errors of the others using
superimposition methods. To test the results, a nonparametric bootstrap method is
used.44 While most of the studies utilizing this method have been used to evaluate
differences in the dental arch form of different malocclusions, to our knowledge there has
been no research utilizing this method to evaluate changes in the position of both dental
crowns and roots resulting from orthodontic treatment.

11
CHAPTER THREE
MATERIALS AND METHODS
T1 and T2 CBCT images of thirty subjects treated at the Loma Linda University
graduate orthodontic clinic were selected according to the following criteria:
1. Complete orthodontic treatment with fixed appliances
2. Complete maxillary and mandibular permanent dentition from right to left first molar
3. Non-extraction, non-expansion, non-surgical treatment
4. Class I skeletal and dental
All subjects were at least eleven years old and had, on average, mild arch length
discrepancies (ALD) with either mild crowding or mild spacing in each arch as shown in
Figure 1. In addition, all subjects were treated with 0.018 slot Ricketts prescription
brackets and all but the mandibular arch of one subject were treated with either 16x22 or
16x16 archwires at some point during treatment.
The images of three subjects were excluded due to motion artifacts. Thus, the
CBCT images of twenty seven subjects were evaluated and analyzed. All CBCT images
were taken with the NewTom 3G (12-bit). The images were imported into the NNT
program (QR srl, Verona, Italy) and oriented to the occlusal plane. The images were then
saved and exported to the OsiriX program, where they were subsequently anonymized.
The maxillary and mandibular landmarks at the apical (AP), coronal (CO), and
occlusal (OC) levels were selected on each image using a plugin for OsiriX (open-source,
www.osirix-viewer.com) called CephalometriXTM. This plugin allows for points to be

12
selected in the axial, coronal and sagittal planes simultaneously, as shown in Figure 2.
Our method involved navigation through the axial, coronal and sagittal planes until the
proper landmark was found and confirmed in all three planes. The landmarks for each
arch were selected from first molar to contralateral first molar as follows:
- Apical level: The root apex of each root was selected in the axial view at the most
apical level where the root apex was visible. The point was then confirmed to be
the geometric center of each root in the coronal and sagittal views. All roots of all
teeth were selected. For multi-rooted teeth, the apex of each root was selected
and the geometric center extrapolated for analysis. For example, the mesial, distal
and palatal root apices of the maxillary first molar were selected. For the
maxillary first bucuspid, CephalometriX was programmed to select a point for the
buccal apex and a point for the lingual apex. In the case that the upper first
bicuspid was single rooted, the apex of the single root was selected for both the
buccal and lingual apical landmarks. An example of landmark selection at the
apical level is shown in Figure 3.
- Coronal level: Landmarks were chosen to mimic the archwire slot as described by
Andrews. For the first molars, the height of contour of the crown in line with the
mesiobuccal groove of the mandibular molars and buccal groove of the maxillary
molars was selected (Figure 4). For all other teeth, the height of contour or the
midpoint of the facial axis of the crown was selected (Figure 5).
- Occlusal level: For both the mandibular and maxillary arches, the mesiobuccal
cusp tip of the first molars, the buccal cusp tip of the premolars, and the cusp tip
of the cuspids were selected. Figure 6 shows an example of the occlusal

13
landmark for the lower right second bicuspid. For the incisors, the midpoints of
the incisal edges were selected in both the maxillary and mandibular arches
(Figure 7). The locations of these points were confirmed in all three views.

14
Figure 1. Frequency of maxillary and mandibular ALD in Millimeters.

15
Figure 2. Landmark Selection in the CephalometriXTM Plugin Using MPR View. This plugin allows for a landmark to be selected and viewed in the axial, coronal and sagittal planes simultaneously.

16
Figure 3. AP Landmark Selection in the CephalometriXTM Plugin Using MPR View. In this example, the distal root of the lower left first molar has been selected, with the axial, coronal and sagittal planes passing through the most apical point of the root.

17
Figure 4. Selection of CO Landmark for Upper Left First Molar. The red dot represents the landmark at the height of contour of the crown.

18
Figure 5. Selection of CO Landmark for Upper Right Central Incisor. The red dot represents the landmark at midpoint of the facial axis of the crown.

19
Figure 6. OC Landmark for Lower Right Second Bicuspid. The buccal cusp tip of the bicuspid has been selected, as indicated by the red dot.

20
Figure 7. OC Landmark for Upper Right Central Incisor. The midpoint of the incisal edge has been selected, as indicated by the red dot.

21
Statistical Analysis
A Python computer script was used to extract the x, y and z coordinates of each
point and run a three-dimensional Euclidean Distance Matrix Analysis with bootstrap
analysis.
Landmark selection for the first molar, second bicuspid, canine, and central incisor
on the right side of the dentition in both arches was repeated once on ten randomly
selected subjects two months after initial landmark selection. An intraclass correlation
(ICC) was used to assess reproducibility.

22
CHAPTER FOUR
RESULTS
Reproducibility
The overall ICCs at 95% confidence intervals are shown in Table 1. The results
show excellent reproducibility in all sectors (x,y,z), with the single ICCs being equal to
1.0 and very tight 95% confidence intervals. The stratified ICCs and 95% confidence
intervals can be found in the appendix.
Table 1. Reproducibility – Overall Intraclass Correlation
Sector Single 95% Confidence Interval F Test
Measures ICC Lower Bound Upper Bound Sig
X 1.000 0.999 1.000 0.000
Y 1.000 1.000 1.000 0.000
Z 1.000 0.999 1.000 0.000
EDMA with Bootstrap Analysis
The distribution of each sample along with the corresponding p-values resulting
from the EDMA with bootstrap analysis is shown in Figure 8. As indicated by the p-
values, a statistically significant change in geometric form from T1 to T2 is seen in the
mandibular arch at the apical level. The mandibular coronal and occlusal, along with the
maxillary apical, coronal and occlusal arches show no statistically significant change.

23
Localization of the changes in geometric form from T1-T2 in each arch and level
can be visualized in Figure 9. These figures show changes in the interlandmark distances
from T1 to T2, with the colors of the interlandmark lines corresponding to an increase or
decrease in distance. Colors towards the blue end of the spectrum indicate the distance
increased, green indicates the distance stayed the same, and colors towards the red end of
the spectrum indicate the distance decreased.

24
Figure 8. Results of EDMA with Bootstrap Analysis, Showing the Distribution and p-values of Each Sample. A) Maxillary arch, apical level. B) Mandibular arch, apical level. C) Maxillary arch, coronal level. D) Mandibular arch, coronal level. E) Maxillary arch, occlusal level. F) Mandibular arch, occlusal level.

25
Figure 9. Visualization of Changes in Interlandmark Distances From T1 to T2 for Each Sample. Legend shows magnitude of change according to ratio of T2 to T1 interlandmark distances and is scaled to maximally show differences. A) Maxillary arch, apical level. B) Mandibular arch, apical level. C) Maxillary arch, coronal level. D) Mandibular arch, coronal level. E) Maxillary arch, occlusal level. F) Mandibular arch, occlusal level.

26
CHAPTER FIVE
DISCUSSION
According to literature, EDMA is an effective and suitable analysis for evaluating
landmark data.35,44 As discussed earlier, several studies have used this analysis to
evaluate arch forms38,39,40,41, growth changes35,36,37, results of orthognathic surgeries and
treatment with orthodontic functional appliances.42,43 However, there has been no
research utilizing this method to evaluate changes in the position of both dental crowns
and roots resulting from orthodontic treatment with fixed appliances. Furthermore, these
studies have used casts and lateral cephalometric tracings to evaluate differences or
changes. By using CBCT images, this study accurately identifies appropriate landmarks
and provides unprecedented insight into the dental changes that occur following
orthodontic treatment with fixed appliances.
Statistical Significance
The results from the EDMA with bootstrap analysis indicate a statistically
significant change in geometric form from T1 to T2 in the mandibular arch at the apical
level under the conditions of this study. The mandibular coronal and occlusal, along with
the maxillary apical, coronal and occlusal arches show no statistically significant change
in geometric form from T1 to T2.

27
Clinical Significance
When looking at the changes occurring in the mandibular apical arch, figure 9B
shows that the distance between the posterior landmarks decreases mesiodistally from T1
to T2 whereas the distance between the anterior landmarks increases. Clinically, this is
consistent with the posterior apices converging anteroposteriorly and the anterior apices
diverging mesiodistally. This may be a result of the leveling of the curve of spee, a
routine part of orthodontic treatment that involves extruding the posterior teeth and
intruding the anterior teeth. This is supported by a study by Clifford et. al. that showed
the molar roots moving mesially during leveling by a reverse curve archwire.45
The maxillary apical arch (Figure 9A) shows somewhat similar changes to those
seen in the mandibular apical arch, with the posterior apices getting closer together and
the anterior apices getting farther apart from T1 to T2. However, these changes were not
found to be statistically significant. This may be due to the maxillary arch having a much
larger volume than the mandibular arch. Thus, small changes may not be as readily
observed in the maxilla whereas the smaller volume of the mandibular arch allows for the
influence of the environment to be picked up more easily. In other words, variance in the
mandibular arch is tighter.
According to Figure 9C and 9D, the maxillary and mandibular coronal arches show
an increase in the posterior transverse dimension from T1 to T2. Furthermore, the
mandibular coronal arch shows an increase in the anteroposterior dimension, consistent
with an increase in arch depth. All these changes can be attributed to the rounding out of
the arch during the leveling and aligning phase of orthodontic treatment.
The results for the maxillary and mandibular occlusal arches as seen in Figure 9E
and 9F are very similar to the results seen in their respective coronal arches. This result

28
was expected as the landmarks for these two levels were very close together in space. As
mentioned earlier, no statistically significant change was observed in either of these two
levels. This may be due to biological limits to coronal tooth movement, such as lip or
tongue pressure, as well as to the mere fact that the subjects used in this study had mild
ALD and so limited tooth movement was required during orthodontic treatment.
The results of this study have direct implications in the clinical practice of
orthodontics. The findings are clinically useful in helping the orthodontist decide which
arch form to follow when selecting the orthodontic arch wire. Orthodontists would like
to follow the arch form that’s most stable. Since significant change is seen in the
mandibular apical arch, this arch form should not be followed. As no change is seen in
the mandibular occlusal and coronal as well as the maxillary apical, coronal and occlusal
arches, any one of these arches could technically be followed when selecting the arch
form of the orthodontic arch wire. However, the apical arch is not clinically practical as
it can only be determined radiographically. Since the coronal arch form is more
reflective than the occlusal arch form of where the arch wire will be, selecting the clinical
arch wire according to the clinical coronal arch form is viable.
Subject Demographic
As mentioned earlier, all subjects in this study were treated with 0.018 slot Ricketts
prescription brackets and all but the mandibular arch of one subject were treated with
either 16x22 or 16x16 archwires at some point during treatment, allowing for the torque
in the brackets to be expressed to some degree, but not to their fullest extent. A fully
filled slot may show greater differences. Furthermore, the subjects had, on average, mild
ALDs with either mild crowding or spacing in each arch as shown in Figure 1.

29
Interestingly, examining the distribution of the ALD in each arch, one can see that while
the mandibular arch had predominantly negative ALDs, indicative of crowding, the
maxillary arch had an even distribution of negative and positive ALDs, indicating cases
of both crowding and spacing. This may have confounded the results seen in the
maxillary arch. A larger sample size that would allow for evaluation and analysis of only
crowded cases in the maxillary arch may show results at the apical level similar to those
seen in the mandibular arch.
With respect to age, all subjects were at least eleven years old. One may wonder if
growth would influence the results of this study. While skeletal anteroposterior growth
would not have an influence on the results, since each arch was evaluated independently,
significant transverse growth would. However, according to literature, transverse growth
of both jaws is minimal between seven and fifteen years of age. Furthermore, a
deceleration in the increase in intermolar width after age eleven was reported, with 95%
of intermolar width increases occurring by age seven.46,47
Given this subject demographic, one can see that the results of this study are
specific to a particular subset of orthodontic patients. Furthermore, it’s difficult to
separate the effects of certain variables on the results of the study. For example, incorrect
bracket positioning, finishing bends, and additional archwire torque may all influence the
final position of the roots or crowns at T2.
Future Studies
The results of this study provide insight into the dental changes occurring as a result
of orthodontic treatment with fixed appliances. However, as discussed earlier, the results
of this study are specific to a particular orthodontic patient population. The next step of

30
the study would be to analyze changes in geometric form in patients with different
malocclusions as well as different treatment modalities, such as expansion via different
appliances like the hyrax and quad helix, extraction, and surgery. Compared with the
results of this study, these future studies would enable the clinician to see the effects of
different treatments on arch form, allowing the clinician to determine if the changes, if
any, are desired. Thus, the clinician can make treatment decisions that are best and most
suitable for each patient. In turn, this may lead to more predictable and stable
orthodontic results.
Finally, future studies should include evaluating these subjects during retention.
Arch form may be changed during orthodontic treatment with different appliances. The
clinician’s decision to do so depends on whether or not the changes are stable long-term.
Thus, retention is a critical consideration and a study that evaluates post-retention cases
would be a great complement to this study.
Conclusions
The following conclusions can be drawn based on the results seen in this study:
1. A significant change in the geometric form of the mandibular apical arch occurs in
patients treated with orthodontic fixed appliances.
2. Selecting the clinical arch wire according to the clinical coronal arch form is
viable in patients with Class I occlusions and ALD of -4 mm to +4 mm in the
maxillary arch and -4 mm to +3 mm in the mandibular arch.
3. This study serves as a baseline for future studies examining subjects with different
occlusions and treatment modalities. It also provides a method to collect and
analyze data in such future studies.
31
REFERENCES
[1] Braun S, Hnat WP, Fender DE, Legan HL. The form of the human dental arch. Angle Orthod 1998;68(1):29-36.
[2] Reberin M, Laumon B, Martin JL, Brunner F. Dimensions and form of dental
arches in subjects with normal occlusions. Am J Orthod Dentofacial Orthop 1993;104:67-72.
[3] Ricketts RM. Provocations and perceptions in craniofacial orthopedics. Denver:
Jostens;1989. [4] BeGole EA, Lyew RC. A new method for analyzing change in dental arch form.
Am J Orthod Dentofacial Orthop 1998;113:394-401. [5] Trivino T, Siqueira DF, Scanavini MA. A new concept of mandibular dental arch
forms with normal occlusion. Am J Orthod Dentofacial Orthop 2008;133:10e.15-10.e22.
[6] Weinstein S, Haack DC, Morris LY, Snyder BB, Attaway HE. On an equilibrium
theory of tooth position. Angle Orthod 1963;33:1-25. [7] Newcomb MR. The anatomic and physiologic factors influencing denture arch
form and a discussion of the part played by each. Angle Orthod 1936;6(1):39-46. [8] Carter GA, McNamera JA. Longitudinal dental arch changes in adults. Am J
Orthod Dentofacial Orthop 1998;114:88-99. [9] Melink A, Vagner MV, Hocevar-Boltezar I, Ovsenik M. Posterior crossbite in the
deciduous dentition period, its relation with sucking habits, irregular orofacial functions, and otolaryngological findings. Am J Orthod Dentofacial Orthop 2012;138:32-40.
[10] Nie Q, Lin J. A comparison of dental arch forms between Class II division1 and
normal occlusion assessed by euclidean distance matrix analysis. Am J Orthod Dentofacial Orthop 2006;129:528-35.
[11] Slaj M, Slaj A, Pavlin D, Illes D, Slaj M. Dental archforms in dentoalveolar Class
I, II and III. Angle Orthod 2010;80:919-924.

32
[12] Uysal T, Memili B, Usumez S, Sari Z. Dental and alveolar arch widths in normal occlusion, Class II division 1 and Class II division 2. Angle Orthod 2005;75:941-947.
[13] Uysal T, Usumez S, Memili B, Sari Z. Dental and alveolar arch widths in normal
occlusion and Class III malocclusion. Angle Orthod 2005;75:809-813. [14] Gupta D, Miner M, Arai K, Will LA. Comparison of the mandibular dental and
basal arch forms in adults and children with Class I and Class II malocclusions. Am J Orthod Dentofacial Orthop 2010;138:10.e1-10.e8.
[15] Ronay V, Miner RM, Will LA, Arai K. Mandibular arch form: The relationship
between dental and basal anatomy. Am J Orthod Dentofacial Orthop 2008;134:430-8.
[16] Ball RL, Miner RM, Will LA, Arao K. Comparison of dental and apical base arch
forms in Class II division 1 and Class I malocclusions. Am J Orthod Dentofacial Orthop 2010;138:41-50.
[17] Vanarsdall RL, Secchi AG, Chung CH, Katz SH. Mandibular basal structure
response to lip bumper treatment in the transverse dimension. Angle Orthod 2004;74(4):473-479.
[18] Handelman CS. The anterior alveolus: its importance in limiting orthodontic
treatment and its influence on the occurrence of iatrogenic sequelae. Angle Orthod 1996;66(2)95-110.
[19] Franchi L, Baccetti T, Camporesi M, Lupoli M. Maxillary arch changes during
leveling and aligning with fixed appliances and low-friction ligatures. Am J Orthod Dentofacial Orthop 2006;130:88-91.
[20] Kokich V, Kiyak AH, Shapiro PA. Comparing the perception of dentists and
laypeople to altered dental esthetics. J Esthet Dent 1999;11:311-24. [21] Roden-Johnson D, Gallerano R, English J. The effects of buccal corridor spaces
and arch form on smile esthetics. Am J Orthod Dentofacial Orthop 2--5;127:343-50.
[22] De La Cruz R A, Sampson P, Little RM, Artun J, Odont D, Shapiro PA. Long-
term changes in arch form after orthodontic treatment and retention. Am J Orthod Dentofacial Orthop 1995;107:518-30.
[23] Felton JM, Sinclair PM, Jones DL, Alexander RG. A computerized anlysis of the
shape and stability of mandibular arch form. Am J Orthod Dentofacial Orthop 1987;92:478-83.

33
[24] Lee RT. Arch width and form: a review. Am J Orthod Dentofacial Orthop 1999;115:305-13.
[25] Ward DE, Workman J, Brown R, Richmond S. Changes in arch width: a 20-year
longitudinal study of orthodontic treatment. Angle Orthod 2006;76:6-13. [26] Braun S, Hnat WP, Leschinsky R, Legan H. An evaluation of the shape of some
popular nickel titanium alloy preformed arch wires. Am J Orthod Dentofacial Orthop 1999;116:1-12.
[27] Silva MAG, Wolf U, Heinicke F, Bumann A, Visser H, Hirsch E. Cone-beam
computed tomography for routine orthodontic treatent planning: a radiation dose evaluation. Am J Orthod Dentofacial Orthop 2008;133:640.e1-640.e5.
[28] Scarfe WC, Farman AG, Sukovic P. Clinical applications of cone-beam computed
tomography in dental practice. J Can Dent Assoc 2006;72(1):75-80. [29] Sukovic P. Cone beam computed tomography in craniofacial imaging. Orthod.
Craniofacial Res. 2003; 6(suppl.1):31-36. [30] Baumgaertel S, Palomo JM, Palomo L, Hans MG. Reliability and accuracy of
cone-beam computed tomography dental measurements. Am J Orthod Dentofacial Orthop 2009;136:19-28.
[31] Mah JK, Huang JC, Choo H. Practical applications of cone-beam computed
tomography in orthodontics. J Am Dent Assoc 2010;141:7S-13S [32] Bluta J, Lavell CLB. An analysis of dental arch form. Eur J Orthod 1987;9:165-
71. [33] Buschang PH, Stroud J, Alexander RG. Differences in dental arch morphology
among adult females with untreated Class I and Class II malocclusion. Eur J Orthod 1994;16:47-52.
[34] Bookstein FL. Size and shape spaces for landmark data in two dimensions. Stat.
Sci 1986;1:181-242. [35] Lele S, Richtsmeier JT. On comparing biological shapes: detection of influential
landmarks. Am J Phys Anthropol 1992;87:49-65. [36] Corner BD, Richtsmeier JT. Morphometric analysis of craniofacial growth in
cebus apella. Am J Phys Antrhopol 1991;84:323-42. [37] Hens SM. Growth and sexual dimorphism in orangutan crania: a three-
dimensional approach. Am J Phys Antrhopol 2003;121:19-29.

34
[38] Ferrario VF, Sforza C, Miani A Jr, Serrao G. Dental arch asymmetry in young human subjects evaluated by Euclidean distance matrix analysis. Arch Oral Biol 1993;38:189-94.
[39] Ferrario VF, Sforza C, Miani A Jr, Tartaglia G. Maxillary versus mandibular arch
form differences in human permanent dentition assessed by Euclidean-distance matrix analysis. Arch Oral Biol 1994;39:135-9.
[40] Ferrario VF, Sforza C, Miani A Jr, Tartaglia G. Human dental arch shape
evaluated by euclidean-distance matrix analysis. Am J Phys Antrhopol 1993;90:445-53.
[41] Bell A, Ayoub AF. Assessment of the accuracy of a three-dimensional imaging
system for archiving dental study models. J Orthod 2003;30:219-23. [42] Ayoub AF, Millect DT, Hasan S. Evaluation of skeletal stability following surgical
correction of mandibular prognathism. Br J Oral Maxillofac Surg 2000;38:305-11.
[43] Singh GD, Hodge MR. Bimaxillary morphpometry of patients with Class II
Division 1 malocclusion treated with Twin Block appliance. Angle Orthod 2002;72:402-9.
[44] Lele S, Richtsmeier JT. Euclidean distance matrix analysis: a coordinate-free
approach for comparing biological shapes using landmark data. Am J Phys Anthropol 1991;86:415-427.
[45] Clifford PM, Orr JF, Burden DJ. The effects of increasing the reverse curve of
Spee in a lower archwire examined using a dynamic photo-elastic gelatine model. Eur J Orthod 1999;21:213-222.
[46] Lux CJ, Conradt C, Burden D, Komposch G. Three-dimensional analysis of
maxillary and mandibular growth increments. Cleft Palate Craniofac J 2004;3:304-14.
[47] Lux CJ, Conradt C, Burden D, Komposch G. Transverse development of the
crandiofacial skeleton and dentition between 7 and 15 years of age - a longitudinal postero-anterior cephalometric study. Eur J Orthod 2004;26:31-42.

35
APPENDIX A
REPRODUCIBILITY DATA
Stratified “X” Sector Intraclass Correlation
Landmark Single 95% Confidence Interval F Test Measures ICC Lower Bound Upper Bound Sig Distal AP LR6 0.998 0.996 0.999 0.000 Mesial AP LR6 0.998 0.996 0.999 0.000 AP LR5 0.999 0.997 1.000 0.000 AP LR3 0.999 0.998 1.000 0.000 AP LR1 0.999 0.998 1.000 0.000 Distal AP UR6 1.000 1.000 1.000 0.000 Mesial AP UR6 1.000 1.000 1.000 0.000 Palatal AP UR6 0.999 0.997 1.000 0.000 AP UR5 0.998 0.994 1.000 0.000 AP UR3 0.999 0.998 1.000 0.000 AP UR1 0.999 0.996 1.000 0.000 CO LR6 1.000 0.998 1.000 0.000 CO LR5 0.999 0.996 1.000 0.000 CO LR3 0.999 0.995 1.000 0.000 CO LR1 1.000 0.998 1.000 0.000 CO UR6 1.000 1.000 1.000 0.000 CO UR5 1.000 0.999 1.000 0.000 CO UR3 0.999 0.995 1.000 0.000 CO UR1 1.000 0.999 1.000 0.000 OC LR6 0.995 0.982 0.999 0.000 OC LR5 1.000 0.999 1.000 0.000 OC LR3 0.999 0.995 1.000 0.000 OC LR1 1.000 0.998 1.000 0.000 OC UR6 0.999 0.995 1.000 0.000 OC UR5 1.000 0.998 1.000 0.000 OC UR3 0.999 0.997 1.000 0.000 OC UR1 1.000 0.999 1.000 0.000

36
Stratified “Y” Sector Intraclass Correlation
Sector Single 95% Confidence Interval F Test Measures ICC Lower Bound Upper Bound Sig Distal AP LR6 0.999 0.999 1.000 0.000 Mesial AP LR6 0.999 0.997 1.000 0.000 AP LR5 0.999 0.997 1.000 0.000 AP LR3 0.998 0.994 1.000 0.000 AP LR1 1.000 0.999 1.000 0.000 Distal AP UR6 1.000 1.000 1.000 0.000 Mesial AP UR6 1.000 1.000 1.000 0.000 Palatal AP UR6 1.000 0.998 1.000 0.000 AP UR5 0.999 0.998 1.000 0.000 AP UR3 0.997 0.989 0.999 0.000 AP UR1 1.000 0.999 1.000 0.000 CO LR6 0.999 0.997 1.000 0.000 CO LR5 1.000 0.999 1.000 0.000 CO LR3 0.999 0.998 1.000 0.000 CO LR1 1.000 0.999 1.000 0.000 CO UR6 1.000 0.999 1.000 0.000 CO UR5 1.000 0.999 1.000 0.000 CO UR3 0.999 0.997 1.000 0.000 CO UR1 1.000 0.999 1.000 0.000 OC LR6 0.999 0.996 1.000 0.000 OC LR5 1.000 0.998 1.000 0.000 OC LR3 1.000 0.999 1.000 0.000 OC LR1 1.000 0.999 1.000 0.000 OC UR6 1.000 0.994 1.000 0.000 OC UR5 1.000 0.999 1.000 0.000 OC UR3 1.000 0.998 1.000 0.000 OC UR1 1.000 1.000 1.000 0.000
37
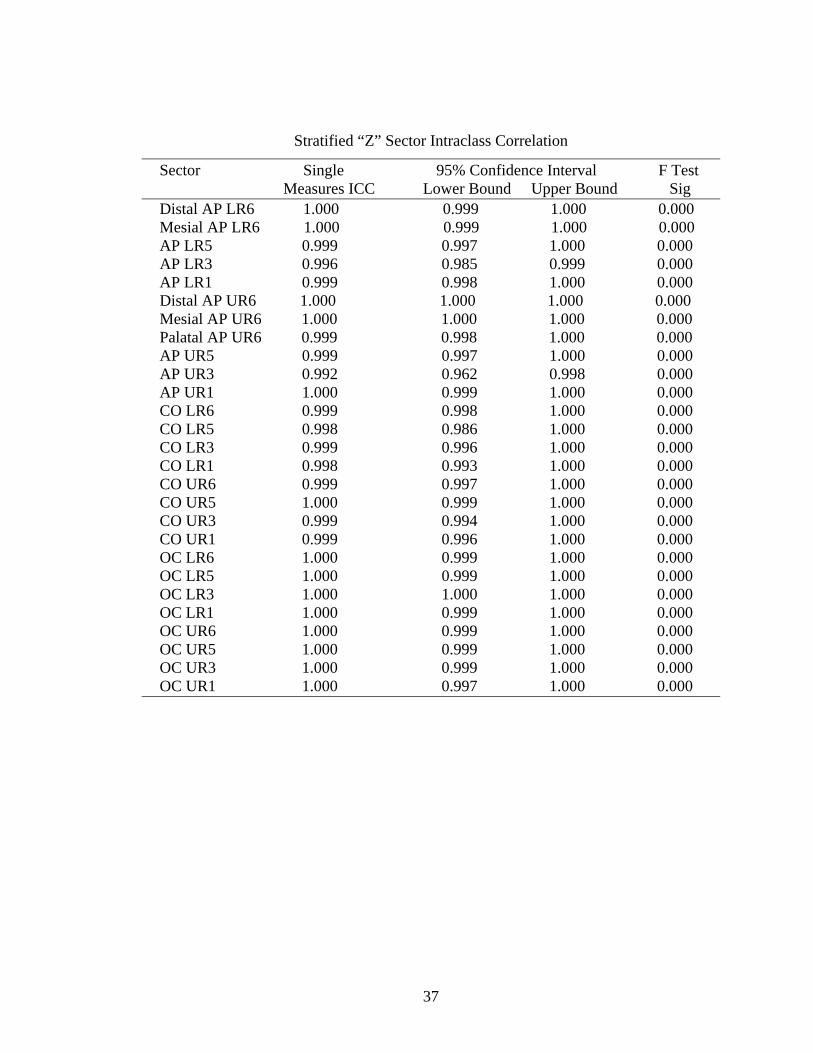
Stratified “Z” Sector Intraclass Correlation
Sector Single 95% Confidence Interval F Test Measures ICC Lower Bound Upper Bound Sig Distal AP LR6 1.000 0.999 1.000 0.000 Mesial AP LR6 1.000 0.999 1.000 0.000 AP LR5 0.999 0.997 1.000 0.000 AP LR3 0.996 0.985 0.999 0.000 AP LR1 0.999 0.998 1.000 0.000 Distal AP UR6 1.000 1.000 1.000 0.000 Mesial AP UR6 1.000 1.000 1.000 0.000 Palatal AP UR6 0.999 0.998 1.000 0.000 AP UR5 0.999 0.997 1.000 0.000 AP UR3 0.992 0.962 0.998 0.000 AP UR1 1.000 0.999 1.000 0.000 CO LR6 0.999 0.998 1.000 0.000 CO LR5 0.998 0.986 1.000 0.000 CO LR3 0.999 0.996 1.000 0.000 CO LR1 0.998 0.993 1.000 0.000 CO UR6 0.999 0.997 1.000 0.000 CO UR5 1.000 0.999 1.000 0.000 CO UR3 0.999 0.994 1.000 0.000 CO UR1 0.999 0.996 1.000 0.000 OC LR6 1.000 0.999 1.000 0.000 OC LR5 1.000 0.999 1.000 0.000 OC LR3 1.000 1.000 1.000 0.000 OC LR1 1.000 0.999 1.000 0.000 OC UR6 1.000 0.999 1.000 0.000 OC UR5 1.000 0.999 1.000 0.000 OC UR3 1.000 0.999 1.000 0.000 OC UR1 1.000 0.997 1.000 0.000

38
APPENDIX B
PYTHON SCRIPT TO EXTRACT XYZ POINTS
from xml.etree import ElementTree as ET from math import * import re import os from os.path import join ### Some Caveats: There MUST be more than 9 and less than 100 subjects. Same for Landmarks rootDir = '/Users/TamarSardarian/Documents/OsiriX Data/CephalometriX/' landmarkDict = {} #create .xyz file t1File = open('/Users/TamarSardarian/Documents/xyzFiles/T1_COU.txt', 'w') t1File.write('T1 Archform Analysis \r\n') t1File.write('XYZ \r\n') #create .xyz file t2File = open('/Users/TamarSardarian/Documents/xyzFiles/T2_COU.txt', 'w') t2File.write('T2 Archform Analysis \r\n') t2File.write('XYZ \r\n') #print t2File.tell() ###cursor position is at 29 at this point (where we need to insert the ### Number of landmarks Dimensionality Number of Specimens## nbrLandmarks = 99 dimensonality = 3 nbrSpecimens = 99 headerString = ("%sL %s %sA\r\n" % (nbrLandmarks, dimensonality, nbrSpecimens)) t1File.write(str(headerString)) #t1File.write('\r\n') t2File.write(str(headerString)) #t2File.write('\r\n') #Get Landmark Data from .xml file def getLandmarkXYZ(cephFile, subjectLabel, timeFile): f = open(cephFile, 'r') cephText = f.read() cephData = ET.fromstring(cephText)

39
landmarks = cephData.findall("LandmarkDICOMCoordinates/landmark") timeFile.write(subjectLabel) timeFile.write('\r\n') i = 0 for item in landmarks: item.get(landmarks[i]) i = i+1 name = str(item.find("name").text) name = name.replace(' ','') if name[0:3] == 'COU': x = str(item.find("x").text) y = str(item.find("y").text) z = str(item.find("z").text) xyzLine = ("%s %s %s \r\n" % (x, y, z)) #print xyzLine timeFile.write(xyzLine) # Write the landmark names read from the first file encountered. def writeLandmarkNames(cephFile, t1File, t2File): f = open(cephFile, 'r') cephText = f.read() cephData = ET.fromstring(cephText) landmarks = cephData.findall("LandmarkDICOMCoordinates/landmark") #nbrLandmarks = len(landmarks) i = 0 nbrLandmarks = 0 for item in landmarks: item.get(landmarks[i]) name = str(item.find("name").text) # Get rid of the space in the landmark label name = name.replace(' ','') if name[0:3] == 'COU': t1File.write(name) t1File.write(' ') t2File.write(name) t2File.write(' ') nbrLandmarks = nbrLandmarks+1 t1File.write("\r\n") t2File.write("\r\n") return nbrLandmarks

40
count = 0 landmarkswritten = 0 for dirPath,dirNames,fileNames in os.walk(rootDir): for file in fileNames: fileExt=os.path.splitext(file)[-1] #print fileExt if (fileExt == '.xml'): count = count +1 cephFile = join(dirPath, file) # Get the Label of the subject from the file name subjectLabel = file[0:2] # Get the time label from the file name timeLabel = file[3:5] if landmarkswritten == 0: nbrLandmarks = writeLandmarkNames(cephFile, t1File, t2File) landmarkswritten = 1 if (timeLabel == "T1" or timeLabel == "t2"): #print "T1" getLandmarkXYZ(cephFile, subjectLabel, t1File) elif (timeLabel == "T2" or timeLabel == "t2"): #print "T2" getLandmarkXYZ(cephFile, subjectLabel, t2File) else: print "We have a serious problem" break #print t1File.tell() print "Number of files found: ", count print "Number of Landmarks found: ", nbrLandmarks nbrSpecimens = count/2 t1HeaderString = ("%sL %s %sA" % (nbrLandmarks, dimensonality, nbrSpecimens)) print t1HeaderString t1File.seek(29,0) t1File.write(str(t1HeaderString)) t1File.close() t2File.seek(29,0) t2File.write(str(t1HeaderString)) t2File.close() #print "Congrats! The widths are measured... Now let's get this thesis done!"