Evaluation of an intensified continuous heat...
9
Evaluation of an intensified continuous heat-exchanger reactor for inherently safer characteristics Wassila Benaı ¨ssa b, , Nadine Gabas a , Michel Cabassud a , Douglas Carson b , Se ´ bastien Elgue a , Michel Demissy b a Laboratoire de Ge´nie Chimique, UMR 5503 CNRS-INPT-UPS, BP 1301, 5 rue PaulinTalabot, 31106 Toulouse, Cedex 1, France b INERIS (Institut National de l’Environnement Industriel et des Risques), Parc Alata, BP 2, 60550 Verneuil-en-Halatte, France Keywords: Process safety Intensification Simulation Heat-exchanger/reactor Runaway scenario Inherently safer abstract The present paper deals with the establishment of a new methodology in order to evaluate the inherently safer characteristics of a continuous intensified reactor in the case of an exothermic reaction. The transposition of the propionic anhydride esterification by 2-butanol into a new prototype of ‘‘heat- exchanger/reactor’’, called open plate reactor (OPR), designed by Alfa Laval Vicarb has been chosen as a case study. Previous studies have shown that this exothermic reaction is relatively simple to carry out in a homogeneous liquid phase, and a kinetic model is available. A dedicated software model is then used not only to assess the feasibility of the reaction in the ‘‘heat-exchanger/reactor’’ but also to estimate the temperature and concentration profiles during synthesis and to determine optimal operating conditions for safe control. Afterwards the reaction was performed in the reactor. Good agreement between experimental results and the simulation validates the model to describe the behavior of the process during standard runs. A hazard and operability study (HAZOP) was then applied to the intensified process in order to identify the potential hazards and to provide a number of runaway scenarios. Three of them are highlighted as the most dangerous: no utility flow, no reactant flows, both stop at the same time. The behavior of the process is simulated following the stoppage of both the process and utility fluid. The consequence on the evolution of temperature profiles is then estimated for a different hypothesis taking into account the thermal inertia of the OPR. This approach reveals an intrinsically safer behavior of the OPR. 1. Introduction Most of the processes involved in the specialty chemical industries are batch or semi-batch. They are particularly con- venient because of their flexibility and make it possible to produce a large range of different chemicals within the same apparatus. Indeed, fine chemicals industry is often confronted with the rapid change of the customer’s demand and has to be able to switch quickly from one reaction to another. Through time these reactors were improved by numerous specific tools that were developed in order not only to increase their efficiency, optimize yield and selectivity (Zhang & Smith, 2004) but also to decrease the environmental impact by reducing the use of solvent (Elgue, Prat, Cabassud, & Ce ´ zerac, 2006). However, these kind of reactors present an important technological limit: temperature control is not always sufficient and numerous case histories have demon- strated that most of the thermally initiated accidents took place in batch processes (Gustin, 2002). When an exothermic reaction is carried out, unpredicted deviations can lead to dangerous situations: cooling failure as well as inappropriate stirring, unknown side reactions and wrong reactant dosing could initiate a runaway. From the 80s, safety has become a priority in the design and development of chemical processes (Lees, 2001). Large research effort contributed to the improvement of new safety tools and methodologies: for instance several calorimetric devices have been invented for the fast determination of thermo-kinetic behavior of the reactions involved (Maria & Heinzle, 1998). But also, systematic methods are now available to anticipate the potential responses of batch processes in the case of thermal deviations and to include appropriate external safety barriers in the overall facility (Stoessel, 1993). But nowadays, the chemical industry has to go further and deal with new challenges. In addition to producing more and faster, ARTICLE IN PRESS Corresponding author. Tel.: +33 3 44 55 62 29; fax: +33 3 44 55 65 65. E-mail addresses: [email protected] (W. Benaı¨ssa), [email protected] (N. Gabas).
Transcript of Evaluation of an intensified continuous heat...
ARTICLE IN PRESS
� Corr
E-m
Nadine.
Evaluation of an intensified continuous heat-exchanger reactor for inherentlysafer characteristics
Wassila Benaıssa b,�, Nadine Gabas a, Michel Cabassud a, Douglas Carson b,Sebastien Elgue a, Michel Demissy b
a Laboratoire de Genie Chimique, UMR 5503 CNRS-INPT-UPS, BP 1301, 5 rue Paulin Talabot, 31106 Toulouse, Cedex 1, Franceb INERIS (Institut National de l’Environnement Industriel et des Risques), Parc Alata, BP 2, 60550 Verneuil-en-Halatte, France
Keywords:
Process safety
Intensification
Simulation
Heat-exchanger/reactor
Runaway scenario
Inherently safer
esponding author. Tel.: +33 3 44 55 62 29; fax
ail addresses: [email protected] (W. B
[email protected] (N. Gabas).
a b s t r a c t
The present paper deals with the establishment of a new methodology in order to evaluate the
inherently safer characteristics of a continuous intensified reactor in the case of an exothermic reaction.
The transposition of the propionic anhydride esterification by 2-butanol into a new prototype of ‘‘heat-
exchanger/reactor’’, called open plate reactor (OPR), designed by Alfa Laval Vicarb has been chosen as a
case study. Previous studies have shown that this exothermic reaction is relatively simple to carry out in
a homogeneous liquid phase, and a kinetic model is available. A dedicated software model is then used
not only to assess the feasibility of the reaction in the ‘‘heat-exchanger/reactor’’ but also to estimate the
temperature and concentration profiles during synthesis and to determine optimal operating conditions
for safe control. Afterwards the reaction was performed in the reactor. Good agreement between
experimental results and the simulation validates the model to describe the behavior of the process
during standard runs.
A hazard and operability study (HAZOP) was then applied to the intensified process in order to
identify the potential hazards and to provide a number of runaway scenarios. Three of them are
highlighted as the most dangerous: no utility flow, no reactant flows, both stop at the same time. The
behavior of the process is simulated following the stoppage of both the process and utility fluid. The
consequence on the evolution of temperature profiles is then estimated for a different hypothesis taking
into account the thermal inertia of the OPR. This approach reveals an intrinsically safer behavior of
the OPR.
1. Introduction
Most of the processes involved in the specialty chemicalindustries are batch or semi-batch. They are particularly con-venient because of their flexibility and make it possible to producea large range of different chemicals within the same apparatus.Indeed, fine chemicals industry is often confronted with the rapidchange of the customer’s demand and has to be able to switchquickly from one reaction to another. Through time these reactorswere improved by numerous specific tools that were developed inorder not only to increase their efficiency, optimize yield andselectivity (Zhang & Smith, 2004) but also to decrease theenvironmental impact by reducing the use of solvent (Elgue, Prat,Cabassud, & Cezerac, 2006). However, these kind of reactors
: +33 3 44 55 65 65.
enaıssa),
present an important technological limit: temperature control isnot always sufficient and numerous case histories have demon-strated that most of the thermally initiated accidents took place inbatch processes (Gustin, 2002). When an exothermic reaction iscarried out, unpredicted deviations can lead to dangeroussituations: cooling failure as well as inappropriate stirring,unknown side reactions and wrong reactant dosing could initiatea runaway. From the 80s, safety has become a priority in thedesign and development of chemical processes (Lees, 2001). Largeresearch effort contributed to the improvement of new safetytools and methodologies: for instance several calorimetric deviceshave been invented for the fast determination of thermo-kineticbehavior of the reactions involved (Maria & Heinzle, 1998). Butalso, systematic methods are now available to anticipate thepotential responses of batch processes in the case of thermaldeviations and to include appropriate external safety barriers inthe overall facility (Stoessel, 1993).
But nowadays, the chemical industry has to go further and dealwith new challenges. In addition to producing more and faster,
ARTICLE IN PRESS
Nomenclature
C concentration (mol L�1)Cpr heat capacity of the reaction mixture (J g�1 K�1)Ea activation energy (J mol�1)Hr acidity functionk0 frequency factork reaction rate constantm mass (kg)mr reaction mixture mass (kg)p kinetic parametersR gas constant (J K�1 mol�1)r reaction rate (mol L�1 s�1)Tr temperature of the reaction mixture (K)T0 temperature of the reaction mixture before deviation
(K)t time (s)V volume (L)X steady-state conversion reached during normal op-
eration
Greek
DHr heat of reaction (J mol�1)
DTad adiabatic temperature rise (1C)F adiabatic coefficient
Subscript
2but 2-butanolacp propionic acidanhp propionic anhydridecat1 catalyst 1cat2 catalyst 2k cell index
Abbreviation
ICI imperial chemical industriesMTSR maximum temperature of the synthesis reaction in
the cell number k (1C)PC process chamberTP transition platesSP sandwich platesTE thermal environmentUF utility fluid
inherently safer and cleaner production must be performed.Thus, alternatives have emerged to dramatically improve chemicalprocesses. Green chemistry is certainly one of the most relevantexamples. During the previous decades, new perspectives haveemerged with process intensification. This movement started anew way of thinking concerning the evolution and the futuredesign of production units in the chemical industry: the challengeis to decrease their size but increase their efficiency (Stankiewicz &Moulinj, 2002). In this field, process intensification can beconsidered as a method that allows one to prevent and reducerisks related to major industrial accidents. To reach this objective,one solution is to create new types of equipments with innovativecharacteristics and significantly higher performances in order toattain better heat transfer and thus safer conditions compared totraditional batch or semi-batch operations. These performances canbe attained by modifying the operating conditions by employinghigher concentrations and using less solvent and reaction volumes.Focusing on the reaction zone, some successful projects havealready demonstrated that it was possible to conceive originalreactors, miniaturized, multifunctional and/or continuous. Forinstance, ICI improved dramatically one of their production plantsby combining the qualities of a heat exchanger and a chemicalreactor in the same apparatus (Phillips, Lausche, & Peerhossaini,1997). These encouraging results illustrated how the chemistryindustry could move in new directions and how engineeringscience could be used to replace traditional processes with newpromising reactors smaller, better and safer. Since the initialapplications, process intensification did not stop growing andtoday we can find numerous studies on innovative pilots (Jachuk,2002; Stankiewicz, 2003). New prototypes of ‘‘heat-exchanger/reactors’’ are a good illustration: built like a plate heat-exchanger,internal plates are designed in order to carry out chemicalsynthesis. But because of these new concepts of reactor designbeing less familiar than traditional ones, research work is necessarynot only to assess their feasibility and potentialities but also toevaluate their efficiency and intrinsic characteristics.
The aim of this work is to evaluate the inherently safercharacteristics of an intensified continuous heat-exchanger/
reactor. To meet this goal, a prototype of ‘‘heat-exchanger reactor’’,provided by Alfa Laval Vicarb, called open plate reactor (OPR), wasconsidered to carry out the esterification of propionic anhydrideby 2-butanol. Firstly, the feasibility of the transposition of thisreaction into the OPR was experimentally validated (Benaissa,2006). Later, risk assessment of the process was performed, whichhighlights accidental scenarios. One major scenario is thestoppage of both process and utility flows. Therefore, this workfocuses on the thermal consequences of flows failure consideringthe physical characteristics of the different elements of the OPR.Moreover, a comparison between the kinetics and the heat-transfer characteristics times allows discriminating the differenthypothesis taken into account to estimate temperature variationsafter failure.
2. Case study: propionic anhydride esterification
Esterification of propionic anhydride by 2-butanol leads tobutyl propionate and propionic acid (Fig. 1). This synthesis wasfirst studied by Snee, Barcons, Hernandez, and Zaldivar (1992) inorder to elaborate a standard method for determining thermo-dynamic parameters using numerous adiabatic and isothermalcalorimetric devices. The system has later been chosen in manystudies relating to the assessment of the chemical risk andspecifically to build optimal safety procedures for batch and semi-batch reactors (Feliu, Iban, Alos, & Macias-Hernandez, 2003;Ubrich, Srinivasan, Lerena, Bonvin, & Stoessel, 1999). This reactionconstitutes a relevant case study for the transposition from batchto continuous process: it is relatively simple to carry out in ahomogeneous liquid phase, is exothermic, and a kinetic model isavailable.
The synthesis is exothermic: Galvan, Zaldivar, Hernandez, andMolga (1996) found a value of DHr ¼ �62.99 kJ mol�1 and Ubrich,Srinivasan, Lerena, Bonvin, and Stoessel (2001) proposedDHr ¼ �62.5 kJ mol�1. Both authors agree that there is nodecomposition reaction.
ARTICLE IN PRESS
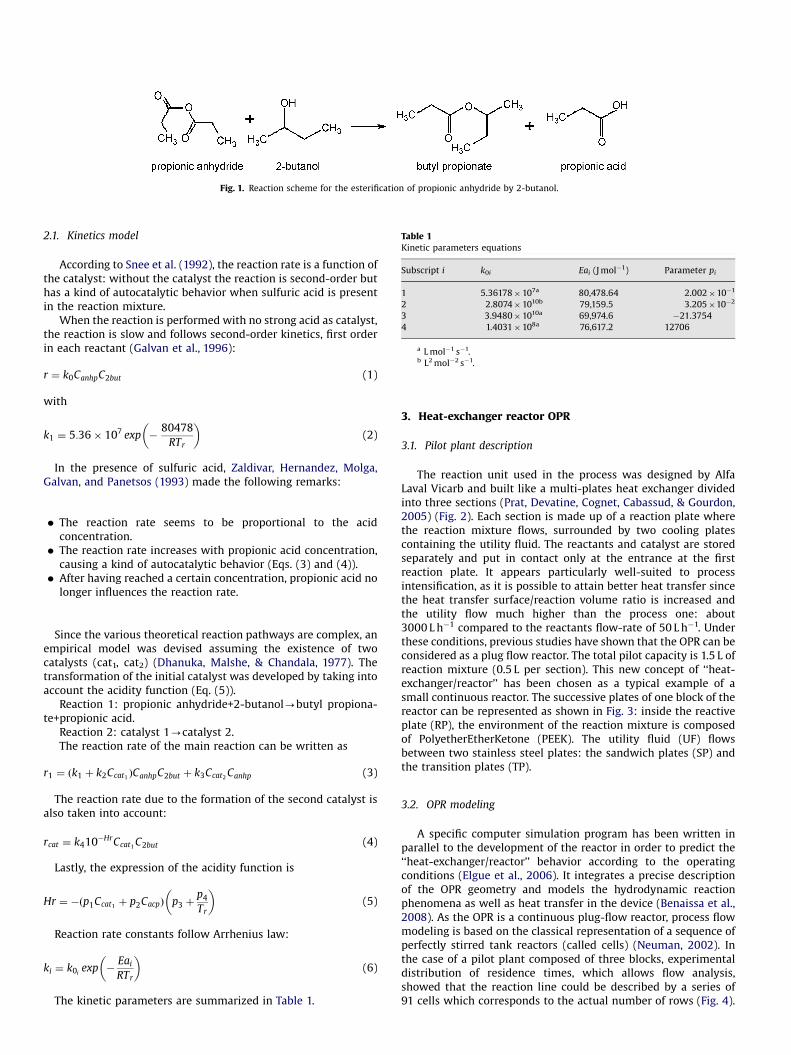
Fig. 1. Reaction scheme for the esterification of propionic anhydride by 2-butanol.
Table 1Kinetic parameters equations
Subscript i k0i Eai (J mol�1) Parameter pi
1 5.36178�107a 80,478.64 2.002�10�1
2 2.8074�1010b 79,159.5 3.205�10�2
3 3.9480�1010a 69,974.6 �21.3754
4 1.4031�108a 76,617.2 12706
a L mol�1 s�1.b L2 mol�2 s�1.
2.1. Kinetics model
According to Snee et al. (1992), the reaction rate is a function ofthe catalyst: without the catalyst the reaction is second-order buthas a kind of autocatalytic behavior when sulfuric acid is presentin the reaction mixture.
When the reaction is performed with no strong acid as catalyst,the reaction is slow and follows second-order kinetics, first orderin each reactant (Galvan et al., 1996):
r ¼ k0CanhpC2but (1)
with
k1 ¼ 5:36� 107 exp �80478
RTr
� �(2)
In the presence of sulfuric acid, Zaldivar, Hernandez, Molga,Galvan, and Panetsos (1993) made the following remarks:
�
The reaction rate seems to be proportional to the acidconcentration. � The reaction rate increases with propionic acid concentration,causing a kind of autocatalytic behavior (Eqs. (3) and (4)).
� After having reached a certain concentration, propionic acid nolonger influences the reaction rate.
Since the various theoretical reaction pathways are complex, anempirical model was devised assuming the existence of twocatalysts (cat1, cat2) (Dhanuka, Malshe, & Chandala, 1977). Thetransformation of the initial catalyst was developed by taking intoaccount the acidity function (Eq. (5)).
Reaction 1: propionic anhydride+2-butanol-butyl propiona-te+propionic acid.
Reaction 2: catalyst 1-catalyst 2.The reaction rate of the main reaction can be written as
r1 ¼ ðk1 þ k2Ccat1ÞCanhpC2but þ k3Ccat2
Canhp (3)
The reaction rate due to the formation of the second catalyst isalso taken into account:
rcat ¼ k410�HrCcat1C2but (4)
Lastly, the expression of the acidity function is
Hr ¼ �ðp1Ccat1þ p2CacpÞ p3 þ
p4
Tr
� �(5)
Reaction rate constants follow Arrhenius law:
ki ¼ k0iexp �
Eai
RTr
� �(6)
The kinetic parameters are summarized in Table 1.
3. Heat-exchanger reactor OPR
3.1. Pilot plant description
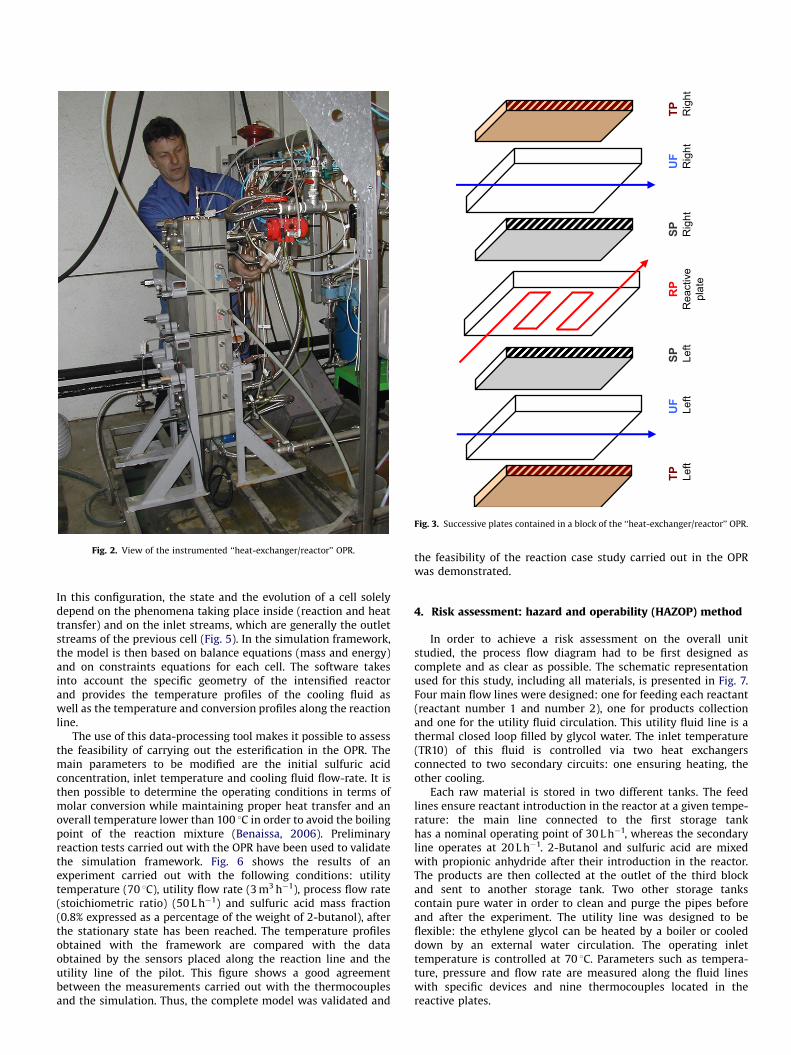
The reaction unit used in the process was designed by AlfaLaval Vicarb and built like a multi-plates heat exchanger dividedinto three sections (Prat, Devatine, Cognet, Cabassud, & Gourdon,2005) (Fig. 2). Each section is made up of a reaction plate wherethe reaction mixture flows, surrounded by two cooling platescontaining the utility fluid. The reactants and catalyst are storedseparately and put in contact only at the entrance at the firstreaction plate. It appears particularly well-suited to processintensification, as it is possible to attain better heat transfer sincethe heat transfer surface/reaction volume ratio is increased andthe utility flow much higher than the process one: about3000 L h�1 compared to the reactants flow-rate of 50 L h�1. Underthese conditions, previous studies have shown that the OPR can beconsidered as a plug flow reactor. The total pilot capacity is 1.5 L ofreaction mixture (0.5 L per section). This new concept of ‘‘heat-exchanger/reactor’’ has been chosen as a typical example of asmall continuous reactor. The successive plates of one block of thereactor can be represented as shown in Fig. 3: inside the reactiveplate (RP), the environment of the reaction mixture is composedof PolyetherEtherKetone (PEEK). The utility fluid (UF) flowsbetween two stainless steel plates: the sandwich plates (SP) andthe transition plates (TP).
3.2. OPR modeling
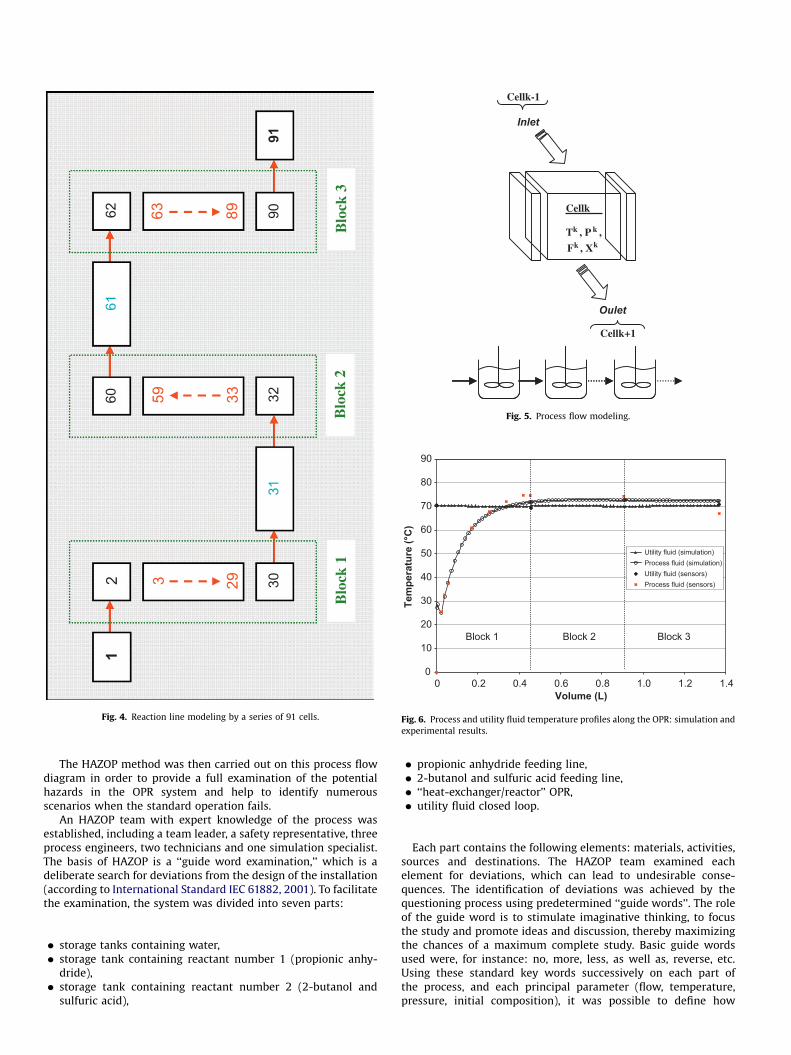
A specific computer simulation program has been written inparallel to the development of the reactor in order to predict the‘‘heat-exchanger/reactor’’ behavior according to the operatingconditions (Elgue et al., 2006). It integrates a precise descriptionof the OPR geometry and models the hydrodynamic reactionphenomena as well as heat transfer in the device (Benaissa et al.,2008). As the OPR is a continuous plug-flow reactor, process flowmodeling is based on the classical representation of a sequence ofperfectly stirred tank reactors (called cells) (Neuman, 2002). Inthe case of a pilot plant composed of three blocks, experimentaldistribution of residence times, which allows flow analysis,showed that the reaction line could be described by a series of91 cells which corresponds to the actual number of rows (Fig. 4).
ARTICLE IN PRESS
Fig. 2. View of the instrumented ‘‘heat-exchanger/reactor’’ OPR.
TP Left
TP Rig
htU
FLe
ftU
FR
ight
SP Rig
htSP Le
ftR
PR
eact
ive
plat
e
Fig. 3. Successive plates contained in a block of the ‘‘heat-exchanger/reactor’’ OPR.
In this configuration, the state and the evolution of a cell solelydepend on the phenomena taking place inside (reaction and heattransfer) and on the inlet streams, which are generally the outletstreams of the previous cell (Fig. 5). In the simulation framework,the model is then based on balance equations (mass and energy)and on constraints equations for each cell. The software takesinto account the specific geometry of the intensified reactorand provides the temperature profiles of the cooling fluid aswell as the temperature and conversion profiles along the reactionline.
The use of this data-processing tool makes it possible to assessthe feasibility of carrying out the esterification in the OPR. Themain parameters to be modified are the initial sulfuric acidconcentration, inlet temperature and cooling fluid flow-rate. It isthen possible to determine the operating conditions in terms ofmolar conversion while maintaining proper heat transfer and anoverall temperature lower than 100 1C in order to avoid the boilingpoint of the reaction mixture (Benaissa, 2006). Preliminaryreaction tests carried out with the OPR have been used to validatethe simulation framework. Fig. 6 shows the results of anexperiment carried out with the following conditions: utilitytemperature (70 1C), utility flow rate (3 m3 h�1), process flow rate(stoichiometric ratio) (50 L h�1) and sulfuric acid mass fraction(0.8% expressed as a percentage of the weight of 2-butanol), afterthe stationary state has been reached. The temperature profilesobtained with the framework are compared with the dataobtained by the sensors placed along the reaction line and theutility line of the pilot. This figure shows a good agreementbetween the measurements carried out with the thermocouplesand the simulation. Thus, the complete model was validated and
the feasibility of the reaction case study carried out in the OPRwas demonstrated.
4. Risk assessment: hazard and operability (HAZOP) method
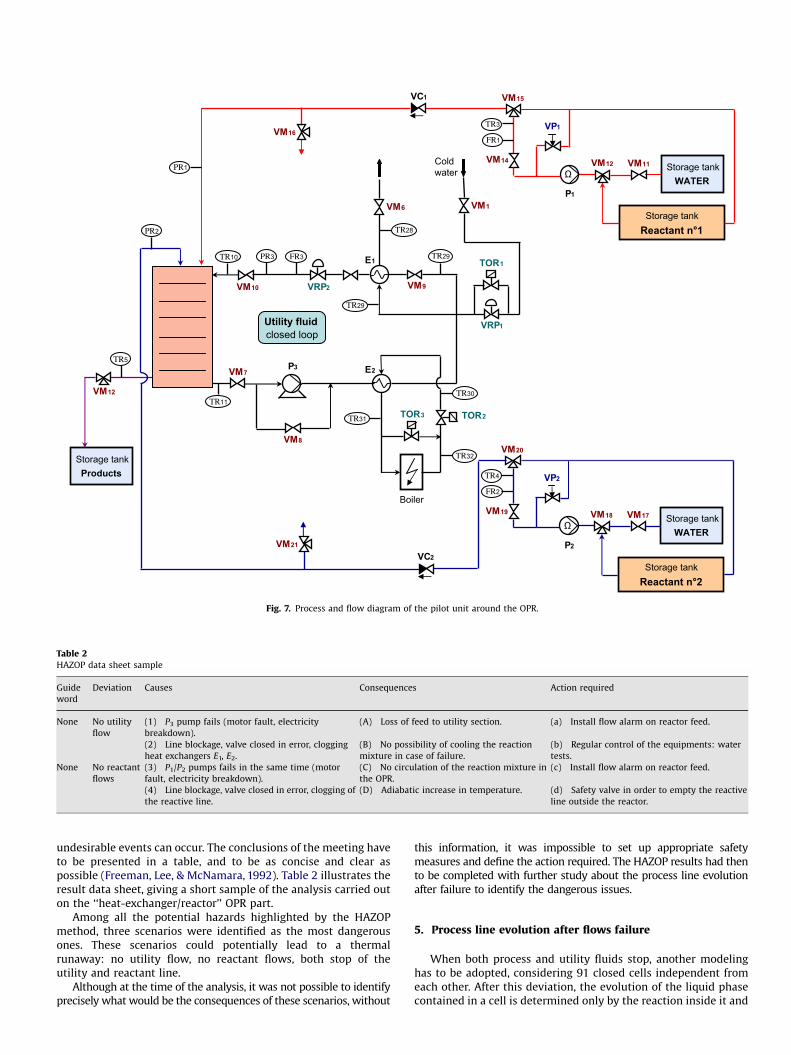
In order to achieve a risk assessment on the overall unitstudied, the process flow diagram had to be first designed ascomplete and as clear as possible. The schematic representationused for this study, including all materials, is presented in Fig. 7.Four main flow lines were designed: one for feeding each reactant(reactant number 1 and number 2), one for products collectionand one for the utility fluid circulation. This utility fluid line is athermal closed loop filled by glycol water. The inlet temperature(TR10) of this fluid is controlled via two heat exchangersconnected to two secondary circuits: one ensuring heating, theother cooling.
Each raw material is stored in two different tanks. The feedlines ensure reactant introduction in the reactor at a given tempe-rature: the main line connected to the first storage tankhas a nominal operating point of 30 L h�1, whereas the secondaryline operates at 20 L h�1. 2-Butanol and sulfuric acid are mixedwith propionic anhydride after their introduction in the reactor.The products are then collected at the outlet of the third blockand sent to another storage tank. Two other storage tankscontain pure water in order to clean and purge the pipes beforeand after the experiment. The utility line was designed to beflexible: the ethylene glycol can be heated by a boiler or cooleddown by an external water circulation. The operating inlettemperature is controlled at 70 1C. Parameters such as tempera-ture, pressure and flow rate are measured along the fluid lineswith specific devices and nine thermocouples located in thereactive plates.
ARTICLE IN PRESS
1
Blo
ck 3
Blo
ck 2
2 3031
62 90
60 32
61
91
Blo
ck 1
3 293359
63 89
Fig. 4. Reaction line modeling by a series of 91 cells.
Inlet
Oulet
Cellk-1
Cellk+1
Cellk
Tk , P k ,
Fk , Xk
Fig. 5. Process flow modeling.
0
10
20
30
40
50
60
70
80
90
0 0.2 0.4 0.6 0.8 1.0 1.2 1.4Volume (L)
Tem
pera
ture
(°C
)
Utility fluid (simulation)Process fluid (simulation)Utility fluid (sensors)Process fluid (sensors)
Block 1 Block 2 Block 3
Fig. 6. Process and utility fluid temperature profiles along the OPR: simulation and
experimental results.
The HAZOP method was then carried out on this process flowdiagram in order to provide a full examination of the potentialhazards in the OPR system and help to identify numerousscenarios when the standard operation fails.
An HAZOP team with expert knowledge of the process wasestablished, including a team leader, a safety representative, threeprocess engineers, two technicians and one simulation specialist.The basis of HAZOP is a ‘‘guide word examination,’’ which is adeliberate search for deviations from the design of the installation(according to International Standard IEC 61882, 2001). To facilitatethe examination, the system was divided into seven parts:
�
storage tanks containing water, � storage tank containing reactant number 1 (propionic anhy-dride),
� storage tank containing reactant number 2 (2-butanol andsulfuric acid),
�
propionic anhydride feeding line, � 2-butanol and sulfuric acid feeding line, � ‘‘heat-exchanger/reactor’’ OPR, � utility fluid closed loop.Each part contains the following elements: materials, activities,sources and destinations. The HAZOP team examined eachelement for deviations, which can lead to undesirable conse-quences. The identification of deviations was achieved by thequestioning process using predetermined ‘‘guide words’’. The roleof the guide word is to stimulate imaginative thinking, to focusthe study and promote ideas and discussion, thereby maximizingthe chances of a maximum complete study. Basic guide wordsused were, for instance: no, more, less, as well as, reverse, etc.Using these standard key words successively on each part ofthe process, and each principal parameter (flow, temperature,pressure, initial composition), it was possible to define how
ARTICLE IN PRESS
Storage tankWATER
E1
Ω
TR3
FR1
PR1
Storage tankReactant n°1
VM11VM12
P1
VP1
VM14
VM15VC1
VM16
Storage tankWATER
Ω
TR4
FR2
Storage tankReactant n°2
VM17VM18
P2
VP2
VM19
VM20
VM21
VC2
PR2
Storage tankProducts
TR5
TR28
VM1VM6
TOR1
VRP1
TR29
TR29
VM9
TR10 PR3 FR3
VM10 VRP2
E2
TR11
VM7P3
TR30
TR32
TR31 TOR2TOR3
VM8
VM12
Cold water
Boiler
Utility fluid closed loop
Fig. 7. Process and flow diagram of the pilot unit around the OPR.
Table 2HAZOP data sheet sample
Guide
word
Deviation Causes Consequences Action required
None No utility
flow
(1) P3 pump fails (motor fault, electricity
breakdown).
(A) Loss of feed to utility section. (a) Install flow alarm on reactor feed.
(2) Line blockage, valve closed in error, clogging
heat exchangers E1, E2.
(B) No possibility of cooling the reaction
mixture in case of failure.
(b) Regular control of the equipments: water
tests.
None No reactant
flows
(3) P1/P2 pumps fails in the same time (motor
fault, electricity breakdown).
(C) No circulation of the reaction mixture in
the OPR.
(c) Install flow alarm on reactor feed.
(4) Line blockage, valve closed in error, clogging of
the reactive line.
(D) Adiabatic increase in temperature. (d) Safety valve in order to empty the reactive
line outside the reactor.
undesirable events can occur. The conclusions of the meeting haveto be presented in a table, and to be as concise and clear aspossible (Freeman, Lee, & McNamara, 1992). Table 2 illustrates theresult data sheet, giving a short sample of the analysis carried outon the ‘‘heat-exchanger/reactor’’ OPR part.
Among all the potential hazards highlighted by the HAZOPmethod, three scenarios were identified as the most dangerousones. These scenarios could potentially lead to a thermalrunaway: no utility flow, no reactant flows, both stop of theutility and reactant line.
Although at the time of the analysis, it was not possible to identifyprecisely what would be the consequences of these scenarios, without
this information, it was impossible to set up appropriate safetymeasures and define the action required. The HAZOP results had thento be completed with further study about the process line evolutionafter failure to identify the dangerous issues.
5. Process line evolution after flows failure
When both process and utility fluids stop, another modelinghas to be adopted, considering 91 closed cells independent fromeach other. After this deviation, the evolution of the liquid phasecontained in a cell is determined only by the reaction inside it and
ARTICLE IN PRESS
from transfer with its thermal environment, according to thefollowing hypotheses:
�
TabMa
mrC
F0
F
homogeneity of characteristic values (temperature, composi-tion, etc.),
� homogeneity of physical properties (density, viscosity, etc.), � homogeneity of physico-chemical phenomena (reaction, trans-fer, etc.),
� no variation of volume, � no transfer between the cells.What is then the final temperature profile reached inside theprocess line in the case of flows failure? Since each cell isconsidered as a stirred tank reactor, it is possible to calculate foreach cell k the parameters used to build the runaway scenariodiagram well-known in the field of chemical process safetymethodologies (Stoessel, 1993): the adiabatic temperature rise(DTad) (Eq. (7)) and the maximum temperature of the synthesisreaction (MTSR) (Eq. (8)):
DTkad ¼
DHrð1� XkÞ
mkr Cpk
r
(7)
MTSRk¼ Tk
0 þ DTkad (8)
6. Thermal inertia of the OPR and adiabatic coefficient
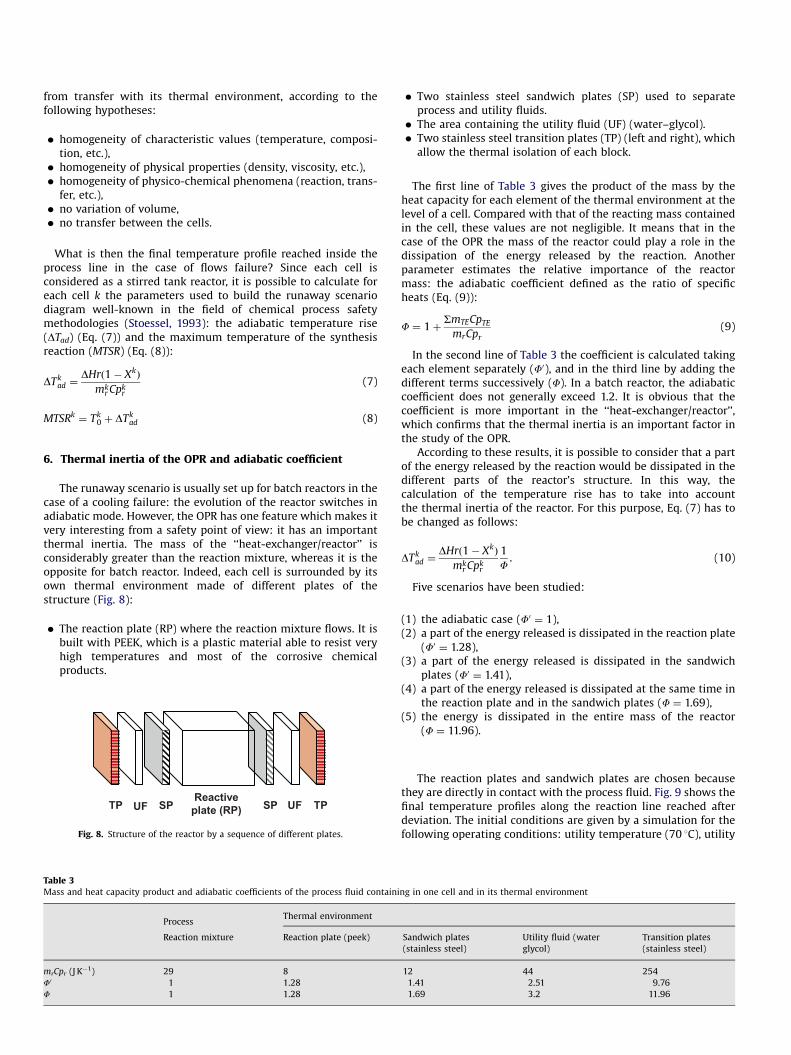
The runaway scenario is usually set up for batch reactors in thecase of a cooling failure: the evolution of the reactor switches inadiabatic mode. However, the OPR has one feature which makes itvery interesting from a safety point of view: it has an importantthermal inertia. The mass of the ‘‘heat-exchanger/reactor’’ isconsiderably greater than the reaction mixture, whereas it is theopposite for batch reactor. Indeed, each cell is surrounded by itsown thermal environment made of different plates of thestructure (Fig. 8):
�
The reaction plate (RP) where the reaction mixture flows. It isbuilt with PEEK, which is a plastic material able to resist veryhigh temperatures and most of the corrosive chemicalproducts.le 3ss and heat capacity product and adiabatic coefficients of the process fluid containi
ProcessThermal environment
Reaction mixture Reaction plate (peek)
pr (J K�1) 29 8
1 1.28
1 1.28
Reactiveplate (RP) SPSP UF TPUFTP
Fig. 8. Structure of the reactor by a sequence of different plates.
�
ng i
San
(sta
12
1.
1.
Two stainless steel sandwich plates (SP) used to separateprocess and utility fluids.
� The area containing the utility fluid (UF) (water–glycol). � Two stainless steel transition plates (TP) (left and right), whichallow the thermal isolation of each block.
The first line of Table 3 gives the product of the mass by theheat capacity for each element of the thermal environment at thelevel of a cell. Compared with that of the reacting mass containedin the cell, these values are not negligible. It means that in thecase of the OPR the mass of the reactor could play a role in thedissipation of the energy released by the reaction. Anotherparameter estimates the relative importance of the reactormass: the adiabatic coefficient defined as the ratio of specificheats (Eq. (9)):
F ¼ 1þSmTECpTE
mrCpr
(9)
In the second line of Table 3 the coefficient is calculated takingeach element separately (F0), and in the third line by adding thedifferent terms successively (F). In a batch reactor, the adiabaticcoefficient does not generally exceed 1.2. It is obvious that thecoefficient is more important in the ‘‘heat-exchanger/reactor’’,which confirms that the thermal inertia is an important factor inthe study of the OPR.
According to these results, it is possible to consider that a partof the energy released by the reaction would be dissipated in thedifferent parts of the reactor’s structure. In this way, thecalculation of the temperature rise has to take into accountthe thermal inertia of the reactor. For this purpose, Eq. (7) has tobe changed as follows:
DTkad ¼
DHrð1� XkÞ
mkr Cpk
r
1
F. (10)
Five scenarios have been studied:
(1)
n
d
4
6
the adiabatic case (F0 ¼ 1),
(2) a part of the energy released is dissipated in the reaction plate(F0 ¼ 1.28),
(3) a part of the energy released is dissipated in the sandwichplates (F0 ¼ 1.41),
(4) a part of the energy released is dissipated at the same time inthe reaction plate and in the sandwich plates (F ¼ 1.69),
(5) the energy is dissipated in the entire mass of the reactor(F ¼ 11.96).
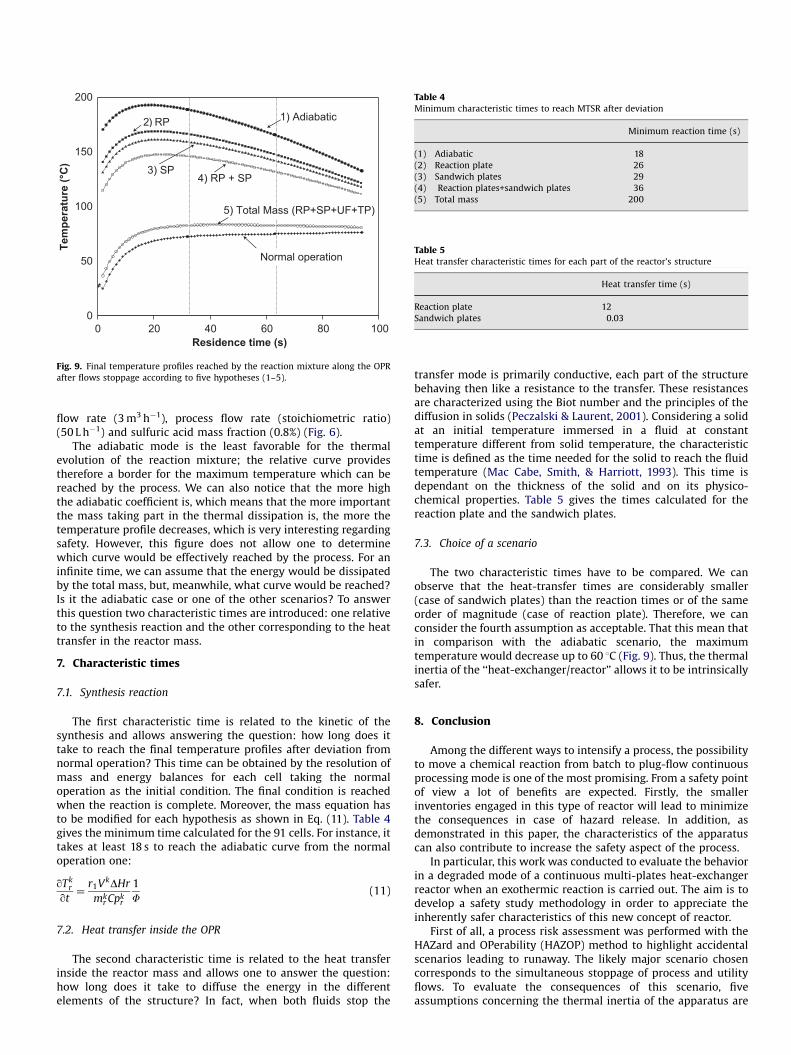
The reaction plates and sandwich plates are chosen becausethey are directly in contact with the process fluid. Fig. 9 shows thefinal temperature profiles along the reaction line reached afterdeviation. The initial conditions are given by a simulation for thefollowing operating conditions: utility temperature (70 1C), utility
one cell and in its thermal environment
wich plates
inless steel)
Utility fluid (water
glycol)
Transition plates
(stainless steel)
44 254
1 2.51 9.76
9 3.2 11.96
ARTICLE IN PRESS
0
50
100
150
200
0 20 40 60 80 100Residence time (s)
Tem
pera
ture
(°C
)
1) Adiabatic 2) RP
5) Total Mass (RP+SP+UF+TP)
4) RP + SP3) SP
Normal operation
Fig. 9. Final temperature profiles reached by the reaction mixture along the OPR
after flows stoppage according to five hypotheses (1–5).
Table 4Minimum characteristic times to reach MTSR after deviation
Minimum reaction time (s)
(1) Adiabatic 18
(2) Reaction plate 26
(3) Sandwich plates 29
(4) Reaction plates+sandwich plates 36
(5) Total mass 200
Table 5Heat transfer characteristic times for each part of the reactor’s structure
Heat transfer time (s)
Reaction plate 12
Sandwich plates 0.03
flow rate (3 m3 h�1), process flow rate (stoichiometric ratio)(50 L h�1) and sulfuric acid mass fraction (0.8%) (Fig. 6).
The adiabatic mode is the least favorable for the thermalevolution of the reaction mixture; the relative curve providestherefore a border for the maximum temperature which can bereached by the process. We can also notice that the more highthe adiabatic coefficient is, which means that the more importantthe mass taking part in the thermal dissipation is, the more thetemperature profile decreases, which is very interesting regardingsafety. However, this figure does not allow one to determinewhich curve would be effectively reached by the process. For aninfinite time, we can assume that the energy would be dissipatedby the total mass, but, meanwhile, what curve would be reached?Is it the adiabatic case or one of the other scenarios? To answerthis question two characteristic times are introduced: one relativeto the synthesis reaction and the other corresponding to the heattransfer in the reactor mass.
7. Characteristic times
7.1. Synthesis reaction
The first characteristic time is related to the kinetic of thesynthesis and allows answering the question: how long does ittake to reach the final temperature profiles after deviation fromnormal operation? This time can be obtained by the resolution ofmass and energy balances for each cell taking the normaloperation as the initial condition. The final condition is reachedwhen the reaction is complete. Moreover, the mass equation hasto be modified for each hypothesis as shown in Eq. (11). Table 4gives the minimum time calculated for the 91 cells. For instance, ittakes at least 18 s to reach the adiabatic curve from the normaloperation one:
qTkr
qt¼
r1VkDHr
mkr Cpk
r
1
F(11)
7.2. Heat transfer inside the OPR
The second characteristic time is related to the heat transferinside the reactor mass and allows one to answer the question:how long does it take to diffuse the energy in the differentelements of the structure? In fact, when both fluids stop the
transfer mode is primarily conductive, each part of the structurebehaving then like a resistance to the transfer. These resistancesare characterized using the Biot number and the principles of thediffusion in solids (Peczalski & Laurent, 2001). Considering a solidat an initial temperature immersed in a fluid at constanttemperature different from solid temperature, the characteristictime is defined as the time needed for the solid to reach the fluidtemperature (Mac Cabe, Smith, & Harriott, 1993). This time isdependant on the thickness of the solid and on its physico-chemical properties. Table 5 gives the times calculated for thereaction plate and the sandwich plates.
7.3. Choice of a scenario
The two characteristic times have to be compared. We canobserve that the heat-transfer times are considerably smaller(case of sandwich plates) than the reaction times or of the sameorder of magnitude (case of reaction plate). Therefore, we canconsider the fourth assumption as acceptable. That this mean thatin comparison with the adiabatic scenario, the maximumtemperature would decrease up to 60 1C (Fig. 9). Thus, the thermalinertia of the ‘‘heat-exchanger/reactor’’ allows it to be intrinsicallysafer.
8. Conclusion
Among the different ways to intensify a process, the possibilityto move a chemical reaction from batch to plug-flow continuousprocessing mode is one of the most promising. From a safety pointof view a lot of benefits are expected. Firstly, the smallerinventories engaged in this type of reactor will lead to minimizethe consequences in case of hazard release. In addition, asdemonstrated in this paper, the characteristics of the apparatuscan also contribute to increase the safety aspect of the process.
In particular, this work was conducted to evaluate the behaviorin a degraded mode of a continuous multi-plates heat-exchangerreactor when an exothermic reaction is carried out. The aim is todevelop a safety study methodology in order to appreciate theinherently safer characteristics of this new concept of reactor.
First of all, a process risk assessment was performed with theHAZard and OPerability (HAZOP) method to highlight accidentalscenarios leading to runaway. The likely major scenario chosencorresponds to the simultaneous stoppage of process and utilityflows. To evaluate the consequences of this scenario, fiveassumptions concerning the thermal inertia of the apparatus are
ARTICLE IN PRESS
considered, including the adiabatic case. Thus, a specific computersimulation program is used to calculate, on the one hand, the finaltemperature profiles reached by the reaction mixture along theOPR after flow stoppage and, on the other hand, the minimumcharacteristic times to reach the maximum temperature of thesynthesis reaction (MTSR) after deviation. These times are thencompared with the heat-transfer characteristic times in thedifferent parts of the pilot structure. It shows that part of theenergy released by the reaction would be dissipated at the sametime in the plates closer to the reaction mixture: the reaction platemade of PEEK and sandwich plates made of stainless steel. Theconsideration of these ‘‘masses’’ in the heat-transfer phenomenonleads to a maximum temperature decrease reached after a failureof between 20 and 60 1C. This approach reveals an intrinsicallysafer behavior of this apparatus compared to batch reactors.
Acknowledgments
The authors would like to thank Alfa Laval in supply of the‘‘heat-exchanger/reactor’’ OPR and Data Processing Tool software,which have made this study possible. They also wish to thankDominique Picque, Armelle Frezier, Lahcen Fahri, Jean-Louis Labat,Lucien Pollini and Marc Samazan for their technical support.
References
Benaissa, W. (2006). Developpement d’une methodologie pour la conduite en securited’un reacteur continu intensifie, Ph.D. thesis, Institut National Polytechnique deToulouse, France.
Benaissa, W., Elgue, S., Gabas, N., Cabassud, M., Carson, D., & Demissy, M. (2008).Dynamic behaviour of a continuous heat exchanger/reactor after flow failure.International Journal of Chemical Reactor Engineering 6, A23 Available at:/http://www.bepress.com/ijcre/vol6/A23S.
Dhanuka, V. R., Malshe, V. C., & Chandala, S. B. (1977). Kinetics of the liquid phaseesterification of carboxylic acids with alcohols in the presence of acidcatalysts: Re-interpretation of published data. Chemical Engineering Science,32, 551–556.
Elgue, S., Prat, L., Cabassud, M., & Cezerac, J. (2006). Optimisation of solventreplacement procedures according to economic and environmental criteria.Chemical Engineering Journal, 117, 169–177.
Feliu, J. A., Iban, G., Alos, M. A., & Macias-Hernandez, J. J. (2003). Match your processconstraints using dynamic simulation. Chemical Engineering Progress, 42–48.
Freeman, R. A., Lee, R., & McNamara, T. P. (1992). Plan HAZOP studies with anexpert system. Chemical Engineering Progress, 28–32.
Galvan, I. M., Zaldivar, J. M., Hernandez, H., & Molga, E. (1996). The use of neuralnetworks for fitting complex kinetic data. Computers & Chemical Engineering,20(12), 1451–1465.
Gustin, J. L. (2002). How the study of accident case histories can prevent run-away reaction accidents from recurring. Transactions IChemE, 80(Part B),16–24.
IEC, International Electrotechnical Commission. (2001). Hazard and operabilitystudies (HAZOP studies)—Application guide. International Standard 61882.
Jachuk, R. J. (2002). Process intensification for responsive processing. TransactionsIChemE, 80(Part A), 233–238.
Lees, F. P. (2001). Loss prevention in the process industries, Vol. 1. Oxford:Butterworth and Heinemann.
Mac Cabe, W. L., Smith, J. C., & Harriott, P. (1993). Unit operations of chemicalengineering. New York: McGraw-Hill.
Maria, G., & Heinzle, E. (1998). Kinetic system identification by using short-cuttechniques in early safety assessment of chemical processes. Journal of LossPrevention Process Industries, 11, 187–206.
Neuman, E. B. (2002). Chemical reactor design, optimization, and scale up. New York:McGraw-Hill.
Peczalski, R., & Laurent, M. (2001). Outils simplifies de calcul. Techniques del’Ingenieur, F2 005.
Phillips, C. H., Lausche, G., & Peerhossaini, H. (1997). Intensification of batchchemical processes by using integrated chemical reactor heat-exchangers.Applied Thermal Engineering, 17, 809–824.
Prat, L., Devatine, A., Cognet, P., Cabassud, M., & Gourdon, C. (2005). Performance ofa novel concept ‘‘open plate reactor’’ applied to highly exothermic reactions.Chemical Engineering & Technology, 28(9), 1028–1034.
Snee, T. J., Barcons, C., Hernandez, H., & Zaldivar, J. M. (1992). Characterisation of anexothermic reaction using adiabatic and isothermal calorimetry. Journal ofThermal Analysis, 38, 2729–2747.
Stankiewicz, A. (2003). Re-engineering the chemical processing plant, Processintensification. Aaaa: Marcel-Dekker.
Stankiewicz, A., & Moulinj, J. A. (2002). Process intensification. Industry EngineeringResearch, 41, 1920–1924.
Stoessel, F. (1993). What is your thermal risk? Chemical Engineering Progress,68–75.
Ubrich, O., Srinivasan, B., Lerena, P., Bonvin, D., & Stoessel, F. (1999). Optimal feedprofile for a second order reaction in a semi-batch reactor under safetyconstraints: Experimental studies. Journal of Loss Prevention Process Industries,12, 485–493.
Ubrich, O., Srinivasan, B., Lerena, P., Bonvin, D., & Stoessel, F. (2001). The use for on-line optimisation of isothermal semi-batch reactors. Chemical EngineeringScience, 56, 5147–5156.
Zaldivar, J. M., Hernandez, H., Molga, E., Galvan, I. M., & Panetsos, F. (1993). The useof neural networks for the identification of kinetic functions of complexreactions. In Proceedings of the third European symposium on computer aidedprocess engineering, ESCAPE 3.
Zhang, J., & Smith, R. (2004). Design and optimisation of batch and semi-bathreactors. Chemical Engineering Science, 59, 459–478.