Evaluation of Ammonium Sulfate Effect on Rice Production ... · Evaluation of Ammonium Sulfate...
22
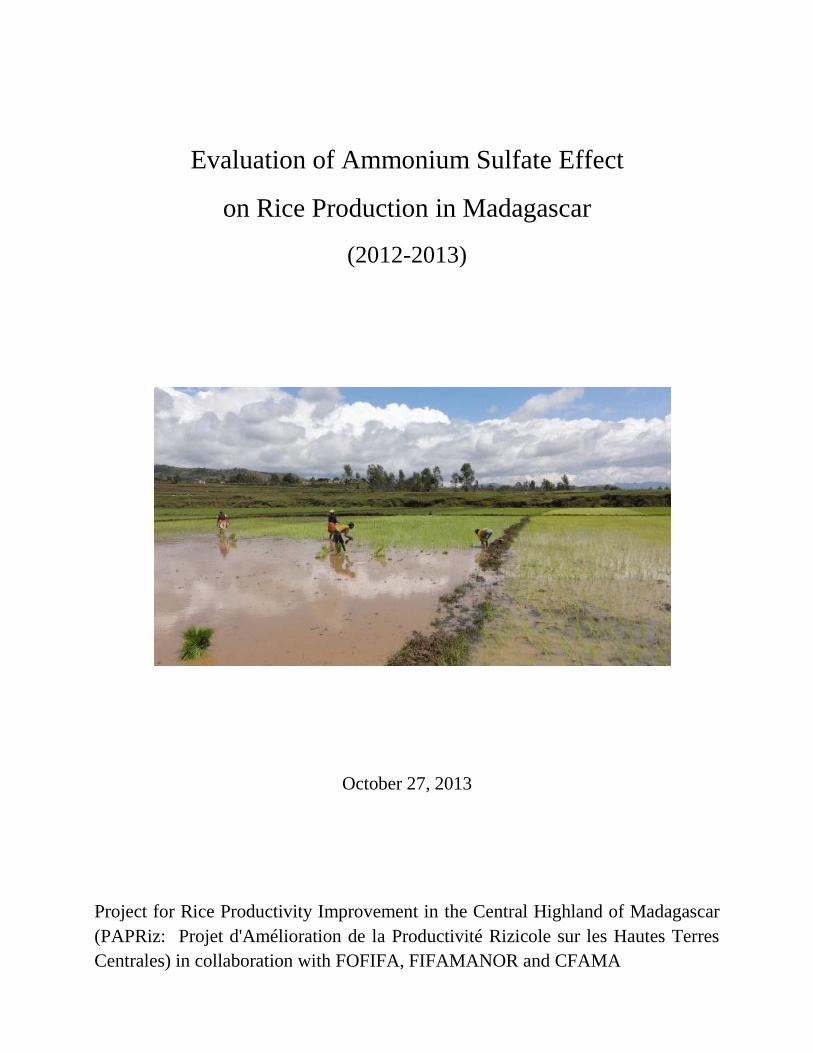
Evaluation of Ammonium Sulfate Effect on Rice Production in Madagascar (2012-2013) October 27, 2013 Project for Rice Productivity Improvement in the Central Highland of Madagascar (PAPRiz: Projet d'Amélioration de la Productivité Rizicole sur les Hautes Terres Centrales) in collaboration with FOFIFA, FIFAMANOR and CFAMA
Transcript of Evaluation of Ammonium Sulfate Effect on Rice Production ... · Evaluation of Ammonium Sulfate...
Evaluation of Ammonium Sulfate Effect
on Rice Production in Madagascar
(2012-2013)
October 27, 2013
Project for Rice Productivity Improvement in the Central Highland of Madagascar
(PAPRiz: Projet d'Amélioration de la Productivité Rizicole sur les Hautes Terres
Centrales) in collaboration with FOFIFA, FIFAMANOR and CFAMA
Content
Abstract 1
Introduction 1
Materials and Methods 1
Results 9
Discussion 15
Acknowledgments 20
Notes 20
References 20
Abbreviations
AS Ammonium sulfate
CALA Complexe Agricoles du Lac Alaotra, FOFIFA
CFAMA Centre de Formation et d'Application du Machinisme Agricole
DAT days after transplanting
FIFAMANOR Fiompiana Fambolena Malagasy Norveziana (Centre de Recherche
Malgacho-Norvegien pour le développement de l'elevage et de
l'agricullture)
FOFIFA Foibem-pirenena momba ny Fikarohana ampiharina amin ny
Fampandrosoana ny Ambanivohitra (Centre National de la Recherche
Appliquée au Développement Rural)
GY grain yield in each unit area
NUE nitrogen use (absorption) efficiency
OM organic matter
PAPRiz Projet d'Amélioration de la Productivité Rizicole sur les Hautes Terres
Centrales
PC Périmètre de Colonisation
YC yield component
1
Draft 2 (2013/10/27)
Evaluation of Ammonium Sulfate Effect on Rice Production in Madagascar
(2012-2013)
Project for Rice Productivity Improvement in the Central Highland of Madagascar (PAPRiz)
Abstract
Rice plants were grown with urea or ammonium sulfate (AS) combined with NPK compound
fertilizer in various agro-climatic zones of Madagascar. AS was effective in rice production as
urea was both in lowlands and uplands. Organic matter or dolomite incorporation hardly
influenced the AS effect on grain production. In a typical upland soil likely lacking in sulfur, AS
took advantage over urea of containing sulfur. Nitrogen use efficiency was frequently low,
probably owing to poor water control and prevailing deficiency of nutrients other than nitrogen
like phosphorus. To find a strict effect of AS, an experiment with a single source of phosphorus
and potassium fertilizers is essential.
Introduction
Cultural improvement certainly promotes crop production, but the improvement would not be
beyond a certain yield level. Crops hardly display their full potential nor attain abundant
production in infertile soils without nutrient input. Highly weathered soils widely spread in
Malagasy agricultural lands because of their geological background. The country has been
importing all chemical fertilizers as many developing countries have. Fortunately, she is now
favored with producing ammonium sulfate (AS) by herself.
AS is an effective nitrogenous source to crop production, and its effectiveness has been proved
in history of worldwide use. Besides, AS greatly contributes to better crop production in sulfur
deficient soils. In contract, it may cause acidity and sulfur excess problems in some specific
circumstances. General advantage and disadvantage of AS are described elsewhere (PAPRiz,
2012).
PAPRiz initiated a set of AS trials to evaluate AS effect on rice production in Madagascar in
2011 (PAPRiz, 2012). The present study in 2012-2013 was a follow-up trial of the experiment in
the last year with the similar fertilizer treatment. Three organizations as the same as in the
previous year collaborated with the experiment: FOFIFA, FIFAMANOR and CFAMA.
Materials and Methods
1. Experiment sites
Five experiment sites, Kianjasoa, Mahitsy, Ambohitsilaozana, Anosiboribory and Mimosa, were
the same as in the last trials and one site at Antsoantany was added as a typical upland field at
the central highland (Table 1 and Fig. 1). Agro-climatic zones of these sites covered middle-
west, central highland and Alaotra area.
2
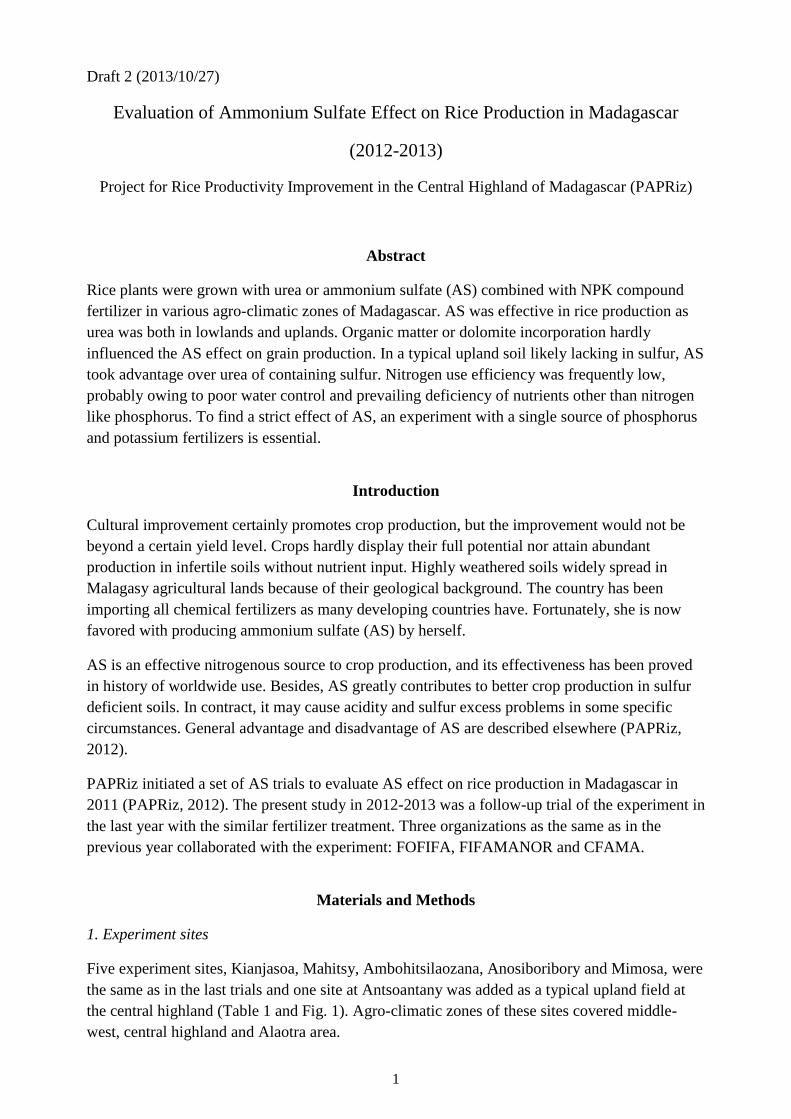
Altitude of respective site is ca.750 m in Alaotra area, 910 m at Kianjasoa, 1,200 m at Mahitsy,
ca. 1,600 m at Mimosa and Antsoantany. In all those areas, rice is grown both in lowlands and
uplands during the main (rainy) season. During the off (dry to early rainy) season, lowland rice
and winter crops are grown respectively below and above ca. 1,000 m, when irrigation water is
available.
Table 1. Locations of the ammonium sulfate trials in three agro-climatic zones, two agro-ecologies (lowland and
upland) and two cropping (main and off) seasons (2012-2013)
Agro-climatic Location Altitude Agro-ecology Direction
zone (site) Lowland Upland Organization Person
(m) Main Off
Region season season
Middle west
Bongolava Kianjasoa (a) 910 * * * FOFIFA Kianjasoa Pierre Rasolofo
Central highland
Analamanga Mahitsy 1,200 * FOFIFA Antananarivo Joseph Randrianampy
Vakinankaratra Mimosa (b) 1,610 * FIFAMANOR Noroseheno Ralisoa
Antsoantany (c) 1,650 * ditto ditto
Lac Alaotra
Alaotra-Mangoro Ambohitsilaozana 780 * FOFIFA CALA Arsène Randrianantenaina
Anosiboribory (d) 750 * CFAMA Nénée Lalanekenarisoa T.
* Practiced.
a) Lowland at Ambalavao. Hydromorphic soil, being relatively poor in organic matter. Experiment plots and the field design
(sub-plots allocation) were the same both in main and off seasons. b) 5 km east of Andranomanelatra, Antsirabe II district.
Relatively flat plain on Oxisols (Ferralsols), yearly well applied with farmyard manure and dolomite, and planted with maize in
the previous off-season. c) Undulating fields (ca. ±50 m) on Oxisols, being one of representative farmers' fields in the central
highland. Applied with a certain quantity of organic matter. Planted with sweet potato in the previous off-season. d) Peaty
flood plain, located in PC23.
Fig.1 Locations of the
AS trials
3
2. Cropping season and agro-ecology
Planting seasons and agro-ecologies at each site were selected in accordance with natural
environment (topography, temperature, etc.) and irrigation facility availability. The experiment
was carried out both in the main and off seasons in 2012-2013. Note that the former is
appropriated for the cultural year of 2013 and the latter for that of 2012 in agricultural statistics,
although the off season rice in 2012 was frequently harvested in the early 2013.
Two agro-ecologies of rice culture were practices: lowlands and uplands. In this text, 'lowland' ,
or occasionally called as ‘wetland’, signifies a field where rice is grown under submerged
condition during most growth stages, and 'upland', or sometimes called as ‘dryland’, does a
free-drained field where rice is grown without submergence: the plant growth totally depends on
rainfall.
3. Fertilizer treatment
To verify an AS effect on rice production in the Malagasy condition, three types of fertilizer
treatments were set up: the standard design for comparing AS with urea in combination of
organic matter and dolomite treatments, a simple comparison of urea and AS in a large-scale
cultivation, and the treatment to find an effect of AS with timing and split-application. The
standard nutrient treatment was the same as in 2011-2012.
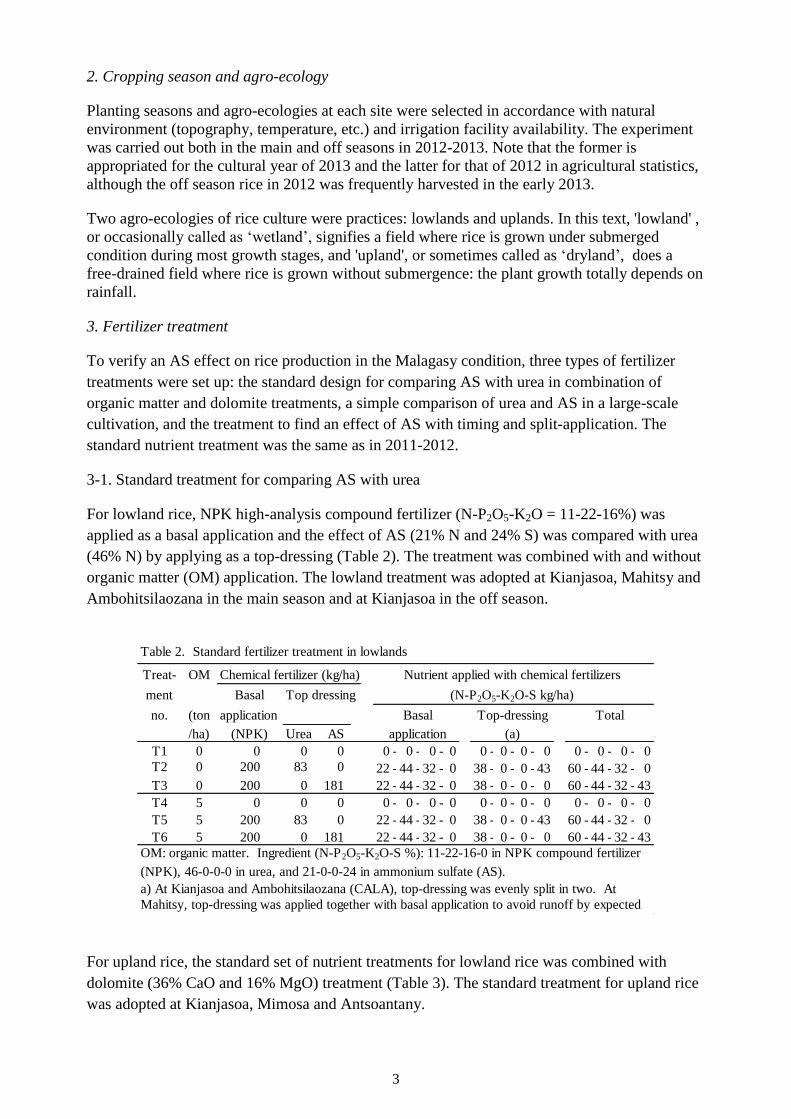
3-1. Standard treatment for comparing AS with urea
For lowland rice, NPK high-analysis compound fertilizer (N-P2O5-K2O = 11-22-16%) was
applied as a basal application and the effect of AS (21% N and 24% S) was compared with urea
(46% N) by applying as a top-dressing (Table 2). The treatment was combined with and without
organic matter (OM) application. The lowland treatment was adopted at Kianjasoa, Mahitsy and
Ambohitsilaozana in the main season and at Kianjasoa in the off season.
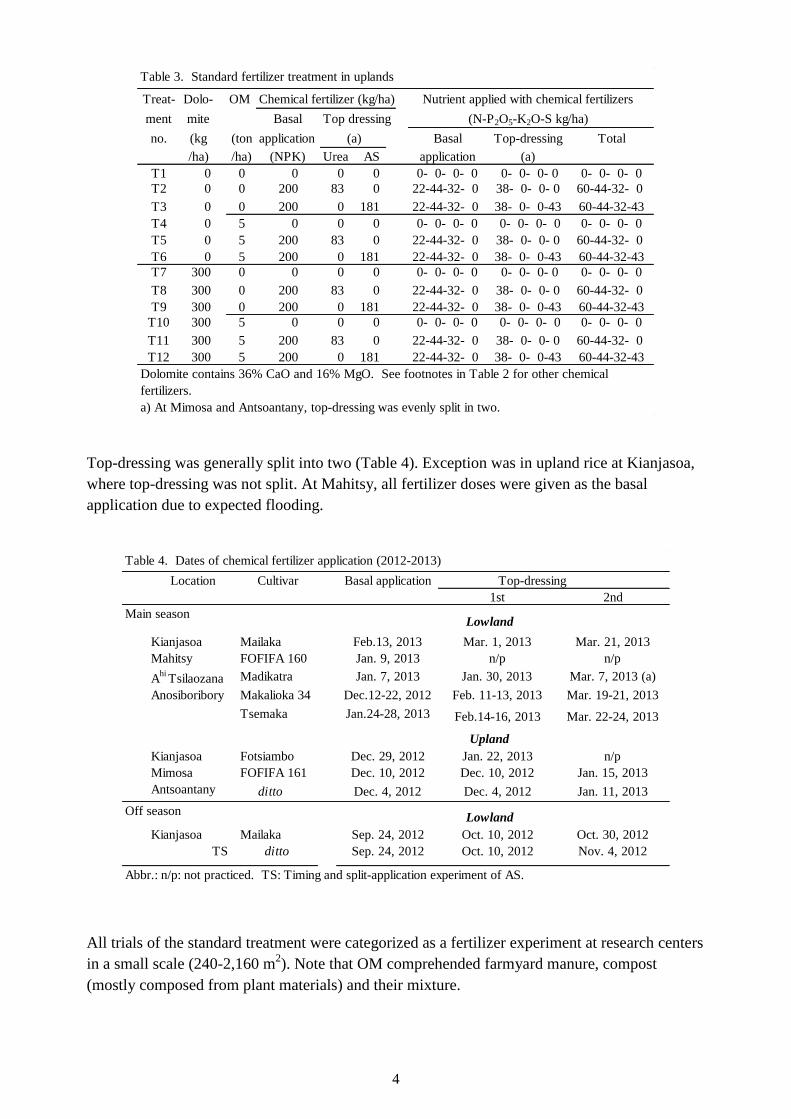
For upland rice, the standard set of nutrient treatments for lowland rice was combined with
dolomite (36% CaO and 16% MgO) treatment (Table 3). The standard treatment for upland rice
was adopted at Kianjasoa, Mimosa and Antsoantany.
Table 2. Standard fertilizer treatment in lowlands
Treat- OM Chemical fertilizer (kg/ha) Nutrient applied with chemical fertilizers
ment Basal Top dressing (N-P2O5-K2O-S kg/ha)
no. (ton application Basal Top-dressing Total
/ha) (NPK) Urea AS application (a)
T1 0 0 0 0 0 - 0 - 0 - 0 0 - 0 - 0 - 0 0 - 0 - 0 - 0
T2 0 200 83 0 22 - 44 - 32 - 0 38 - 0 - 0 - 43 60 - 44 - 32 - 0
T3 0 200 0 181 22 - 44 - 32 - 0 38 - 0 - 0 - 0 60 - 44 - 32 - 43
T4 5 0 0 0 0 - 0 - 0 - 0 0 - 0 - 0 - 0 0 - 0 - 0 - 0
T5 5 200 83 0 22 - 44 - 32 - 0 38 - 0 - 0 - 43 60 - 44 - 32 - 0
T6 5 200 0 181 22 - 44 - 32 - 0 38 - 0 - 0 - 0 60 - 44 - 32 - 43
OM: organic matter. Ingredient (N-P2O5-K2O-S %): 11-22-16-0 in NPK compound fertilizer
(NPK), 46-0-0-0 in urea, and 21-0-0-24 in ammonium sulfate (AS).
a) At Kianjasoa and Ambohitsilaozana (CALA), top-dressing was evenly split in two. At
Mahitsy, top-dressing was applied together with basal application to avoid runoff by expected
4
Top-dressing was generally split into two (Table 4). Exception was in upland rice at Kianjasoa,
where top-dressing was not split. At Mahitsy, all fertilizer doses were given as the basal
application due to expected flooding.
All trials of the standard treatment were categorized as a fertilizer experiment at research centers
in a small scale (240-2,160 m2). Note that OM comprehended farmyard manure, compost
(mostly composed from plant materials) and their mixture.
Table 3. Standard fertilizer treatment in uplands
Treat- Dolo- OM Chemical fertilizer (kg/ha) Nutrient applied with chemical fertilizers
ment mite Basal Top dressing (N-P2O5-K2O-S kg/ha)
no. (kg (ton application (a) Basal Top-dressing Total
/ha) /ha) (NPK) Urea AS application (a)
T1 0 0 0 0 0 0- 0- 0- 0 0- 0- 0- 0 0- 0- 0- 0
T2 0 0 200 83 0 22-44-32- 0 38- 0- 0- 0 60-44-32- 0
T3 0 0 200 0 181 22-44-32- 0 38- 0- 0-43 60-44-32-43
T4 0 5 0 0 0 0- 0- 0- 0 0- 0- 0- 0 0- 0- 0- 0
T5 0 5 200 83 0 22-44-32- 0 38- 0- 0- 0 60-44-32- 0
T6 0 5 200 0 181 22-44-32- 0 38- 0- 0-43 60-44-32-43
T7 300 0 0 0 0 0- 0- 0- 0 0- 0- 0- 0 0- 0- 0- 0
T8 300 0 200 83 0 22-44-32- 0 38- 0- 0- 0 60-44-32- 0
T9 300 0 200 0 181 22-44-32- 0 38- 0- 0-43 60-44-32-43
T10 300 5 0 0 0 0- 0- 0- 0 0- 0- 0- 0 0- 0- 0- 0
T11 300 5 200 83 0 22-44-32- 0 38- 0- 0- 0 60-44-32- 0
T12 300 5 200 0 181 22-44-32- 0 38- 0- 0-43 60-44-32-43
Dolomite contains 36% CaO and 16% MgO. See footnotes in Table 2 for other chemical
fertilizers.
a) At Mimosa and Antsoantany, top-dressing was evenly split in two.
Table 4. Dates of chemical fertilizer application (2012-2013)
Location Cultivar Basal application Top-dressing
1st 2nd
Main season Lowland
Kianjasoa Mailaka Feb.13, 2013 Mar. 1, 2013 Mar. 21, 2013
Mahitsy FOFIFA 160 Jan. 9, 2013 n/p n/p
Ahi
Tsilaozana Madikatra Jan. 7, 2013 Jan. 30, 2013 Mar. 7, 2013 (a)
Anosiboribory Makalioka 34 Dec.12-22, 2012 Feb. 11-13, 2013 Mar. 19-21, 2013
Tsemaka Jan.24-28, 2013 Feb.14-16, 2013 Mar. 22-24, 2013
Upland
Kianjasoa Fotsiambo Dec. 29, 2012 Jan. 22, 2013 n/p
Mimosa FOFIFA 161 Dec. 10, 2012 Dec. 10, 2012 Jan. 15, 2013
Antsoantany ditto Dec. 4, 2012 Dec. 4, 2012 Jan. 11, 2013
Off season Lowland
Kianjasoa Mailaka Sep. 24, 2012 Oct. 10, 2012 Oct. 30, 2012
TS ditto Sep. 24, 2012 Oct. 10, 2012 Nov. 4, 2012
Abbr.: n/p: not practiced. TS: Timing and split-application experiment of AS.
5
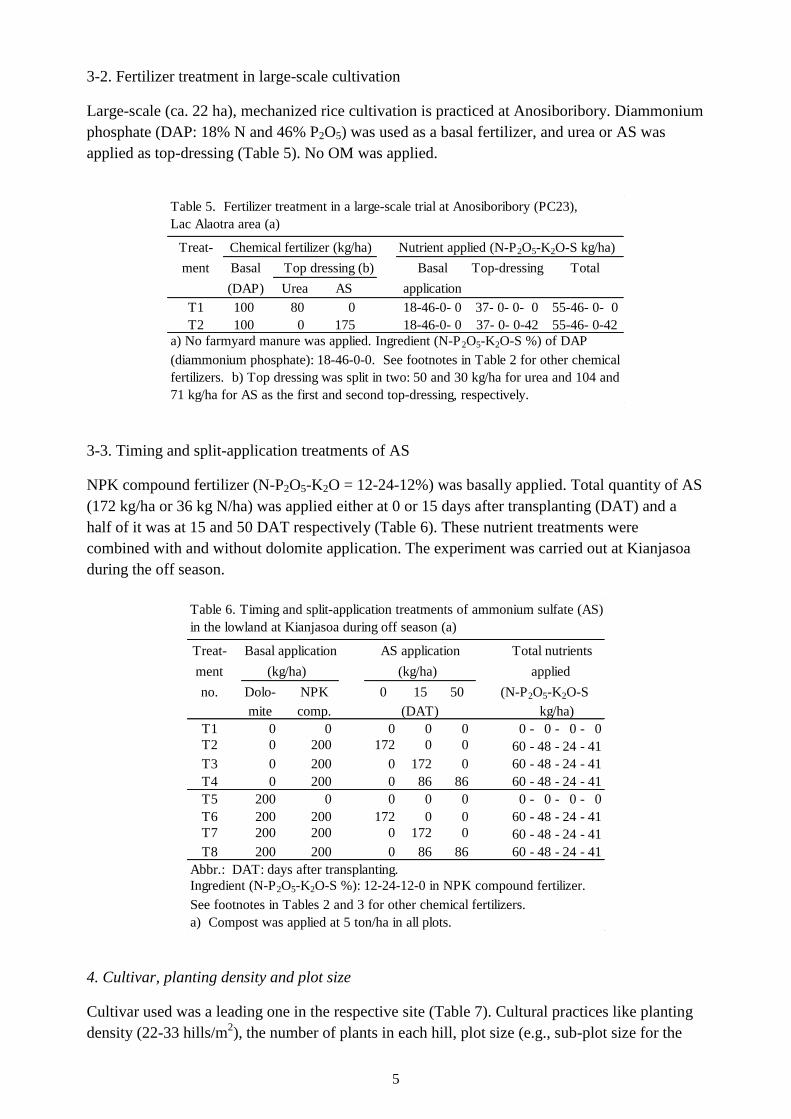
3-2. Fertilizer treatment in large-scale cultivation
Large-scale (ca. 22 ha), mechanized rice cultivation is practiced at Anosiboribory. Diammonium
phosphate (DAP: 18% N and 46% P2O5) was used as a basal fertilizer, and urea or AS was
applied as top-dressing (Table 5). No OM was applied.
3-3. Timing and split-application treatments of AS
NPK compound fertilizer (N-P2O5-K2O = 12-24-12%) was basally applied. Total quantity of AS
(172 kg/ha or 36 kg N/ha) was applied either at 0 or 15 days after transplanting (DAT) and a
half of it was at 15 and 50 DAT respectively (Table 6). These nutrient treatments were
combined with and without dolomite application. The experiment was carried out at Kianjasoa
during the off season.
4. Cultivar, planting density and plot size
Cultivar used was a leading one in the respective site (Table 7). Cultural practices like planting
density (22-33 hills/m2), the number of plants in each hill, plot size (e.g., sub-plot size for the
Table 5. Fertilizer treatment in a large-scale trial at Anosiboribory (PC23),
Lac Alaotra area (a)
Treat- Chemical fertilizer (kg/ha) Nutrient applied (N-P2O5-K2O-S kg/ha)
ment Basal Top dressing (b) Basal Top-dressing Total
(DAP) Urea AS application
T1 100 80 0 18-46-0- 0 37- 0- 0- 0 55-46- 0- 0
T2 100 0 175 18-46-0- 0 37- 0- 0-42 55-46- 0-42
a) No farmyard manure was applied. Ingredient (N-P2O5-K2O-S %) of DAP
(diammonium phosphate): 18-46-0-0. See footnotes in Table 2 for other chemical
fertilizers. b) Top dressing was split in two: 50 and 30 kg/ha for urea and 104 and
71 kg/ha for AS as the first and second top-dressing, respectively.
Table 6. Timing and split-application treatments of ammonium sulfate (AS)
in the lowland at Kianjasoa during off season (a)
Treat- Basal application AS application Total nutrients
ment (kg/ha) (kg/ha) applied
no. Dolo- NPK 0 15 50 (N-P2O5-K2O-S
mite comp. (DAT) kg/ha)
T1 0 0 0 0 0 0 - 0 - 0 - 0
T2 0 200 172 0 0 60 - 48 - 24 - 41
T3 0 200 0 172 0 60 - 48 - 24 - 41
T4 0 200 0 86 86 60 - 48 - 24 - 41
T5 200 0 0 0 0 0 - 0 - 0 - 0
T6 200 200 172 0 0 60 - 48 - 24 - 41
T7 200 200 0 172 0 60 - 48 - 24 - 41
T8 200 200 0 86 86 60 - 48 - 24 - 41
Abbr.: DAT: days after transplanting.
Ingredient (N-P2O5-K2O-S %): 12-24-12-0 in NPK compound fertilizer.
See footnotes in Tables 2 and 3 for other chemical fertilizers.
a) Compost was applied at 5 ton/ha in all plots.
6
standard design: 13-60 m2), etc., were according to the routine method in respective
organization. Plot arrangement of the main season crop succeeded that of the off season crop in
lowland rice at Kianjasoa.
5. Dates of sowing and transplanting
Lowland rice was transplanted and upland rice was directly sown. In lowland rice, transplanting
was from December to January for the main season and September for the off season planting,
and in upland rice, sowing was from November to December (Table 8).
6. Field management
General land preparation in the central highland and surrounding areas starts with plowing
(together with incorporation of OM) about one month (sometimes a few months) before sowing
or transplanting. For lowland rice, fields are puddled a few days before transplanting and
leveling and fertilizer application are one day before transplanting. When the main season
cultivation followed the off season crop (either of rice or winter crops) in the same site, fields
were forced to plow shortly before transplanting. For upland rice, OM is applied, soils are
crushed and fields are leveled about one week before sowing, and chemical fertilizers are
applied on the day of sowing. Dolomite was preferred to incorporate at the time of plowing.
Most of the present trials adopted the general procedure of land preparation and field
management (Tables 9 and 10). Dolomite incorporation resulted in the sowing date at Mimosa,
because the experiment site was located in a part of the large field of FIFAMANOR. As the
need arose, herbicides, insecticide and raticides were applied (Table 11).
Table 7. Cultivars used, plant densities and plot sizes at respective sites (2012-2013)
Hill Hill Seedlings Sub-plot Total
Location Cultivar spacing density or seeds Size (m2) Replica- area
(cm x cm) (hill/m2) per hill Planted Harvested tion (m
2)
Main season Lowland
Kianjasoa Mailaka (a) 25 x 20 20 2 13.2 7.2 3 238
Mahitsy FOFIFA 160 (b) 20 x 20 25 2 40.0 21.9 4 960
Ahi
Tsilaozana Madikatra (c) 25 x 20 20 2-3 25.0 25.0 3 450
Anosiboribory Makalioka 34 20 x 15 33 2-3 (f) 17,500 17,500 3-4 (i) 122,500
Tsemaka (d) 20 x 15 33 2-3 (f) 16,370 (h) 16,370 (h) 3 98,200
Upland
Kianjasoa Fotsiambo (e) 20 x 20 25 3-5 60.0 45.0 3 2,160
Mimosa FOFIFA 161 (b) 20 x 20 25 4-5 (g) 20.0 20.0 2 ca. 600
Antsoantany ditto 20 x 20 25 4-5 (g) 20.0 20.0 2 ca. 600
Off season Lowland
Kianjasoa Mailaka (a) 25 x 20 20 2 13.2 7.2 3 ca. 240
TS ditto 25 x 20 20 2 9.0 4.4 3 ca. 220
Abbr.: Ahi Tsilaozana: Ambohitsilaozana. TS: Timing and split-application experiment of AS.
a) Pedigree: X265 = 3914 = IR 15579-24-2. b) Line in the FOFIFA breeding program. c) Pedigree: X1648 = IR15569
-22-2-3-2-3-1-1-3. d) Pedigree: 4012. e) Pedigree: B22. f) Seeds were used at 45 kg/ha. g) Seed rate at 60 kg/ha.
h) Sub-plot size varied 15,500-17,000 m2 (= 15.5-17 ha). i) Number of replications is 3 for urea and 4 for AS
treatment.
7
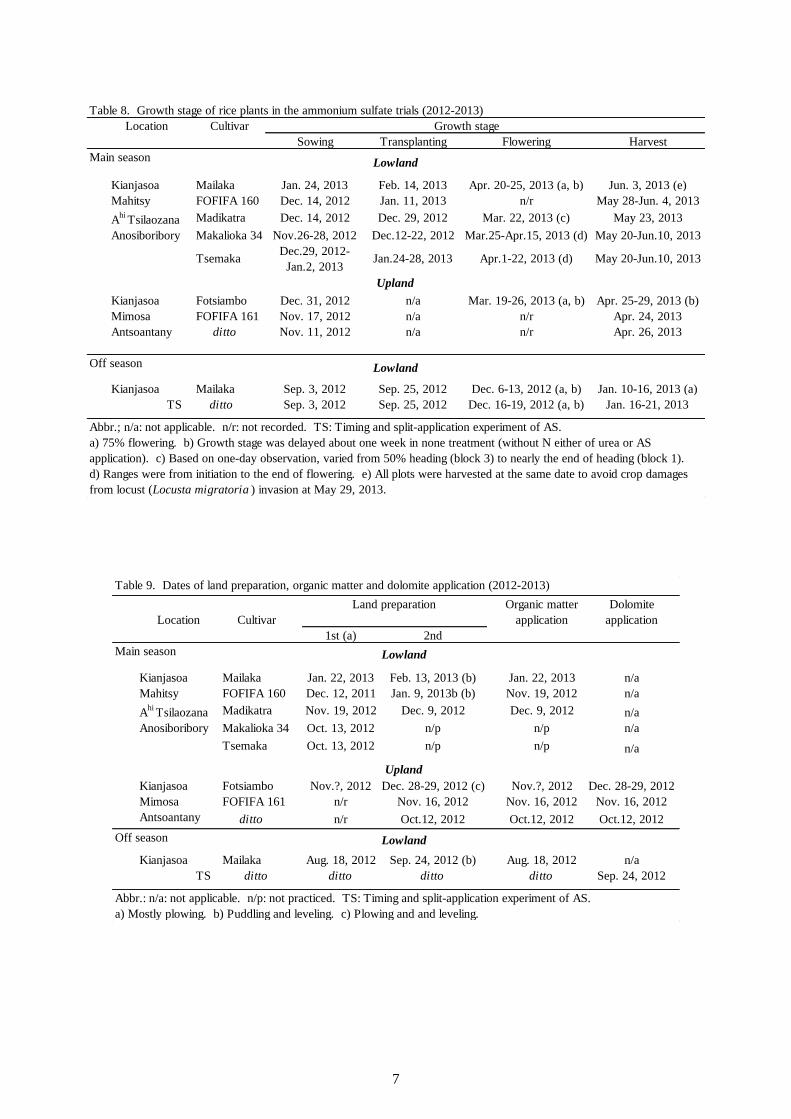
Table 8. Growth stage of rice plants in the ammonium sulfate trials (2012-2013)
Location Cultivar Growth stage
Sowing Transplanting Flowering Harvest
Main season Lowland
Kianjasoa Mailaka Jan. 24, 2013 Feb. 14, 2013 Apr. 20-25, 2013 (a, b) Jun. 3, 2013 (e)
Mahitsy FOFIFA 160 Dec. 14, 2012 Jan. 11, 2013 n/r May 28-Jun. 4, 2013
Ahi
Tsilaozana Madikatra Dec. 14, 2012 Dec. 29, 2012 Mar. 22, 2013 (c) May 23, 2013
Anosiboribory Makalioka 34 Nov.26-28, 2012 Dec.12-22, 2012 Mar.25-Apr.15, 2013 (d) May 20-Jun.10, 2013
TsemakaDec.29, 2012-
Jan.2, 2013Jan.24-28, 2013 Apr.1-22, 2013 (d) May 20-Jun.10, 2013
Upland
Kianjasoa Fotsiambo Dec. 31, 2012 n/a Mar. 19-26, 2013 (a, b) Apr. 25-29, 2013 (b)
Mimosa FOFIFA 161 Nov. 17, 2012 n/a n/r Apr. 24, 2013
Antsoantany ditto Nov. 11, 2012 n/a n/r Apr. 26, 2013
Off season Lowland
Kianjasoa Mailaka Sep. 3, 2012 Sep. 25, 2012 Dec. 6-13, 2012 (a, b) Jan. 10-16, 2013 (a)
TS ditto Sep. 3, 2012 Sep. 25, 2012 Dec. 16-19, 2012 (a, b) Jan. 16-21, 2013
Abbr.; n/a: not applicable. n/r: not recorded. TS: Timing and split-application experiment of AS.
a) 75% flowering. b) Growth stage was delayed about one week in none treatment (without N either of urea or AS
application). c) Based on one-day observation, varied from 50% heading (block 3) to nearly the end of heading (block 1).
d) Ranges were from initiation to the end of flowering. e) All plots were harvested at the same date to avoid crop damages
from locust (Locusta migratoria ) invasion at May 29, 2013.
Table 9. Dates of land preparation, organic matter and dolomite application (2012-2013)
Land preparation Organic matter Dolomite
Location Cultivar application application
1st (a) 2nd
Main season Lowland
Kianjasoa Mailaka Jan. 22, 2013 Feb. 13, 2013 (b) Jan. 22, 2013 n/a
Mahitsy FOFIFA 160 Dec. 12, 2011 Jan. 9, 2013b (b) Nov. 19, 2012 n/a
Ahi
Tsilaozana Madikatra Nov. 19, 2012 Dec. 9, 2012 Dec. 9, 2012 n/a
Anosiboribory Makalioka 34 Oct. 13, 2012 n/p n/p n/a
Tsemaka Oct. 13, 2012 n/p n/p n/a
Upland
Kianjasoa Fotsiambo Nov.?, 2012 Dec. 28-29, 2012 (c) Nov.?, 2012 Dec. 28-29, 2012
Mimosa FOFIFA 161 n/r Nov. 16, 2012 Nov. 16, 2012 Nov. 16, 2012
Antsoantany ditto n/r Oct.12, 2012 Oct.12, 2012 Oct.12, 2012
Off season Lowland
Kianjasoa Mailaka Aug. 18, 2012 Sep. 24, 2012 (b) Aug. 18, 2012 n/a
TS ditto ditto ditto ditto Sep. 24, 2012
Abbr.: n/a: not applicable. n/p: not practiced. TS: Timing and split-application experiment of AS.
a) Mostly plowing. b) Puddling and leveling. c) Plowing and and leveling.
8
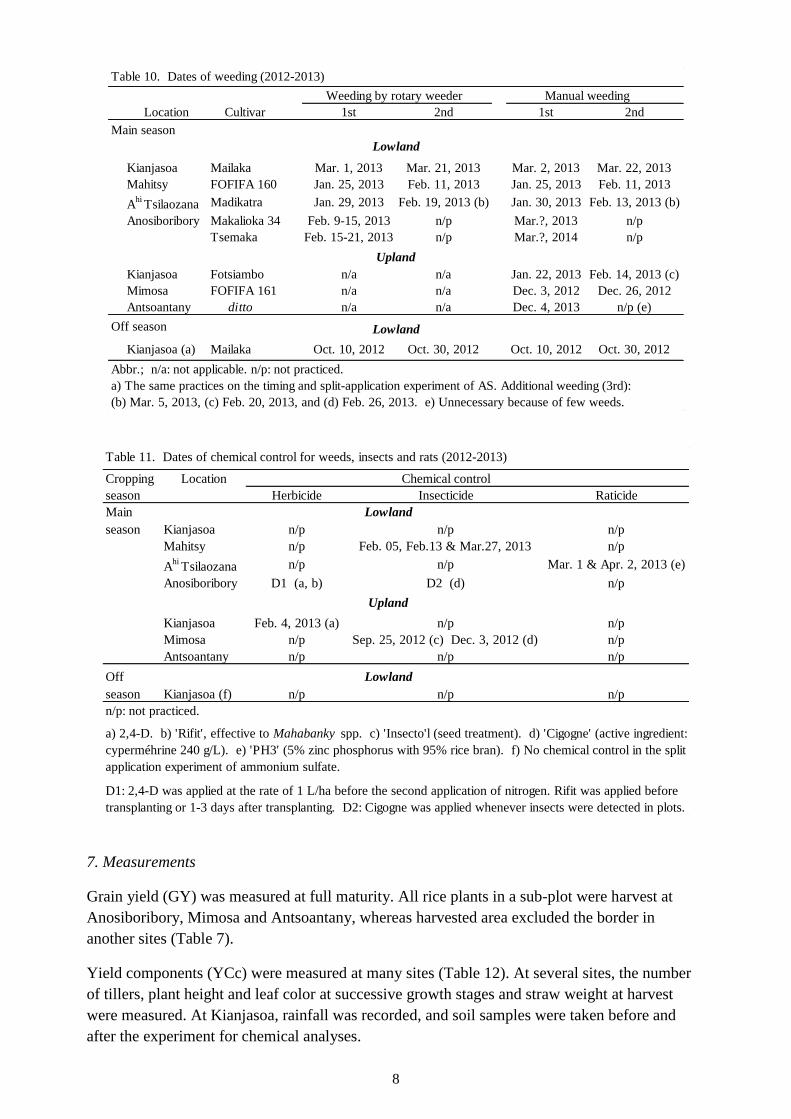
7. Measurements
Grain yield (GY) was measured at full maturity. All rice plants in a sub-plot were harvest at
Anosiboribory, Mimosa and Antsoantany, whereas harvested area excluded the border in
another sites (Table 7).
Yield components (YCc) were measured at many sites (Table 12). At several sites, the number
of tillers, plant height and leaf color at successive growth stages and straw weight at harvest
were measured. At Kianjasoa, rainfall was recorded, and soil samples were taken before and
after the experiment for chemical analyses.
Table 10. Dates of weeding (2012-2013)
Weeding by rotary weeder Manual weeding
Location Cultivar 1st 2nd 1st 2nd
Main season
Lowland
Kianjasoa Mailaka Mar. 1, 2013 Mar. 21, 2013 Mar. 2, 2013 Mar. 22, 2013
Mahitsy FOFIFA 160 Jan. 25, 2013 Feb. 11, 2013 Jan. 25, 2013 Feb. 11, 2013
Ahi
Tsilaozana Madikatra Jan. 29, 2013 Feb. 19, 2013 (b) Jan. 30, 2013 Feb. 13, 2013 (b)
Anosiboribory Makalioka 34 Feb. 9-15, 2013 n/p Mar.?, 2013 n/p
Tsemaka Feb. 15-21, 2013 n/p Mar.?, 2014 n/p
Upland
Kianjasoa Fotsiambo n/a n/a Jan. 22, 2013 Feb. 14, 2013 (c)
Mimosa FOFIFA 161 n/a n/a Dec. 3, 2012 Dec. 26, 2012
Antsoantany ditto n/a n/a Dec. 4, 2013 n/p (e)
Off season Lowland
Kianjasoa (a) Mailaka Oct. 10, 2012 Oct. 30, 2012 Oct. 10, 2012 Oct. 30, 2012
Abbr.; n/a: not applicable. n/p: not practiced.
a) The same practices on the timing and split-application experiment of AS. Additional weeding (3rd):
(b) Mar. 5, 2013, (c) Feb. 20, 2013, and (d) Feb. 26, 2013. e) Unnecessary because of few weeds.
Table 11. Dates of chemical control for weeds, insects and rats (2012-2013)
Cropping Location Chemical control
season Herbicide Insecticide Raticide
Main Lowland
season Kianjasoa n/p n/p n/p
Mahitsy n/p Feb. 05, Feb.13 & Mar.27, 2013 n/p
Ahi
Tsilaozana n/p n/p Mar. 1 & Apr. 2, 2013 (e)
Anosiboribory D1 (a, b) D2 (d) n/p
Upland
Kianjasoa Feb. 4, 2013 (a) n/p n/p
Mimosa n/p Sep. 25, 2012 (c) Dec. 3, 2012 (d) n/p
Antsoantany n/p n/p n/p
Off Lowland
season Kianjasoa (f) n/p n/p n/p
n/p: not practiced.
a) 2,4-D. b) 'Rifit', effective to Mahabanky spp. c) 'Insecto'l (seed treatment). d) 'Cigogne' (active ingredient:
cyperméhrine 240 g/L). e) 'PH3' (5% zinc phosphorus with 95% rice bran). f) No chemical control in the split
application experiment of ammonium sulfate.
D1: 2,4-D was applied at the rate of 1 L/ha before the second application of nitrogen. Rifit was applied before
transplanting or 1-3 days after transplanting. D2: Cigogne was applied whenever insects were detected in plots.
9
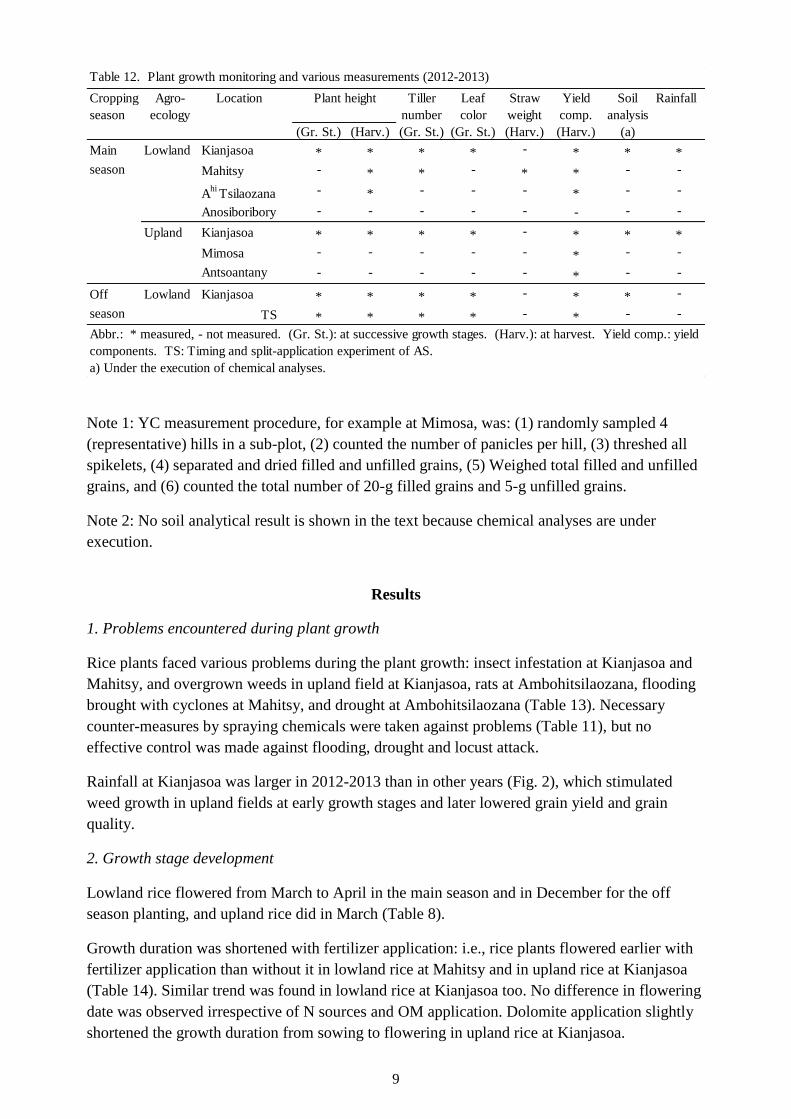
Note 1: YC measurement procedure, for example at Mimosa, was: (1) randomly sampled 4
(representative) hills in a sub-plot, (2) counted the number of panicles per hill, (3) threshed all
spikelets, (4) separated and dried filled and unfilled grains, (5) Weighed total filled and unfilled
grains, and (6) counted the total number of 20-g filled grains and 5-g unfilled grains.
Note 2: No soil analytical result is shown in the text because chemical analyses are under
execution.
Results
1. Problems encountered during plant growth
Rice plants faced various problems during the plant growth: insect infestation at Kianjasoa and
Mahitsy, and overgrown weeds in upland field at Kianjasoa, rats at Ambohitsilaozana, flooding
brought with cyclones at Mahitsy, and drought at Ambohitsilaozana (Table 13). Necessary
counter-measures by spraying chemicals were taken against problems (Table 11), but no
effective control was made against flooding, drought and locust attack.
Rainfall at Kianjasoa was larger in 2012-2013 than in other years (Fig. 2), which stimulated
weed growth in upland fields at early growth stages and later lowered grain yield and grain
quality.
2. Growth stage development
Lowland rice flowered from March to April in the main season and in December for the off
season planting, and upland rice did in March (Table 8).
Growth duration was shortened with fertilizer application: i.e., rice plants flowered earlier with
fertilizer application than without it in lowland rice at Mahitsy and in upland rice at Kianjasoa
(Table 14). Similar trend was found in lowland rice at Kianjasoa too. No difference in flowering
date was observed irrespective of N sources and OM application. Dolomite application slightly
shortened the growth duration from sowing to flowering in upland rice at Kianjasoa.
Table 12. Plant growth monitoring and various measurements (2012-2013)
Cropping Agro- Location Plant height Tiller Leaf Straw Yield Soil Rainfall
season ecology number color weight comp. analysis
(Gr. St.) (Harv.) (Gr. St.) (Gr. St.) (Harv.) (Harv.) (a)
Main Lowland Kianjasoa * * * * - * * *
season Mahitsy - * * - * * - -
Ahi
Tsilaozana - * - - - * - -
Anosiboribory - - - - - - - -
Upland Kianjasoa * * * * - * * *
Mimosa - - - - - * - -
Antsoantany - - - - - * - -
Off Lowland Kianjasoa * * * * - * * -
season TS * * * * - * - -
Abbr.: * measured, - not measured. (Gr. St.): at successive growth stages. (Harv.): at harvest. Yield comp.: yield
components. TS: Timing and split-application experiment of AS.
a) Under the execution of chemical analyses.
10
Harvesting dates for main season rice were from the end of May to the early June in lowlands
and at the end of April in uplands and those of off season rice were in the middle of January
(Table 8).
Table 13. Problems encountered during the experiment and observation on rice plants (2012-2013)
Cropping Agro- Location Problems and observation
season ecology
Main Lowland Kianjasoa Locust (Locusta migratoria ) infestation on May 29, 2013.
season
Mahitsy
Insect attack by 'Pou de riz' (Trichispa sericea Guerin and Hispa gestroï
/Dicladispa gestroïchap ) at tillering stage. Submergence of 50 cm for 2-3
days by 2 cyclones (Jan. 22-23 and Jan. 28-29, 2013) at tillering stage.
Low temperature at flowering and ripening stages. Insect attack of cutting
leaves by Nymphula spp. and Borbo spp. at vegetative growth stage.
Ahi
TsilaozanaDrought due to canal water shortage derived from less rainfall at tillering
stage (January 2013).
Anosiboribory Nothing in particular: good vegetative growth and uniform ripening.
Upland
Kianjasoa
Hill missing caused with an insect (Heteronychus spp.) in several plots
shortly after sowing (a). Weed, 'borreria' (Eleusine indica ) was overgrown
at the vegetative growth stage owing to high rainfall. Heavy rainfall (832
mm) in January and February lowed grain yield (considered to be nutrient
leaching) and grain quality.
Mimosa
Slight infection of leaf blast (Pyricularia oryzae ). Leaves turned to reddish
and then plants were dried up along one side (a few hills) of the border: a
cause was unknown.
Antsoantany Slight erosion in lower slope (Replication 2).
Off
season
Lowland
Kianjasoa
Locust (L. migratoria ) infestation in several plots on Oct. 4, 2012, causing
missing hills in all treatments at replication (rep.) 3, T4 at rep. 1 and 3, and
T6 at rep.2, but plant growth was recovered soon after.
TS
Locust infestation at T1, T2 and T7 in replication 2 and T3, T4, T6 and
T7 in replication 2 on Oct. 4, 2012. Majority of plots were temporally
suffered from water shortage on Nov. 1, 2012.
TS: Timing and split-application experiment of AS.
a) The proportion of missing hills was 3-7% at T3, T5, T10 andT11 and 14% at T12 in replication 1, 6% at T5
in replication 2, and 16-20% at T3 and T6 in replication 3. b) The similar problem in the timing and split-
application experiment of AS.
0
500
1,000
1,500
2,000
2,500
200
5-2
006
200
6-2
007
200
7-2
008
200
8-2
009
200
9-2
010
201
0-2
011
201
1-2
012
201
2-2
013
Tota
l R
ain
fall
(m
m)
Fig. 2 Total rainfall at
Kianjasoa in the past 8 years
11
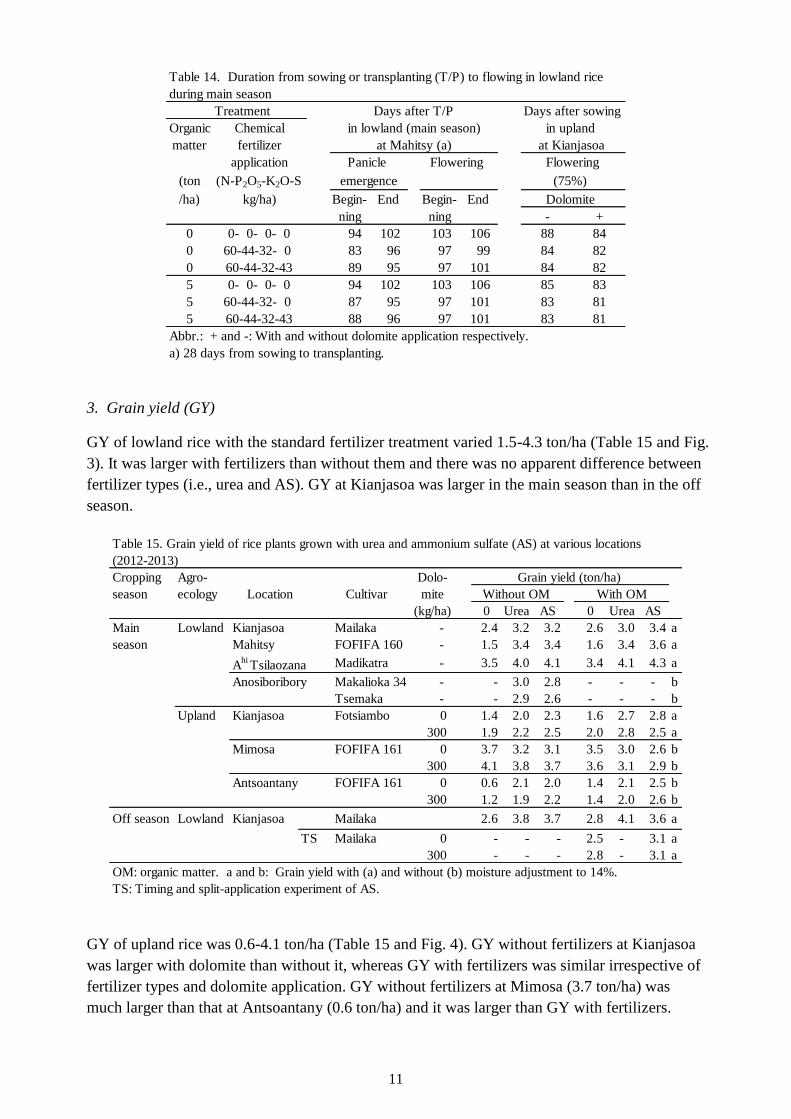
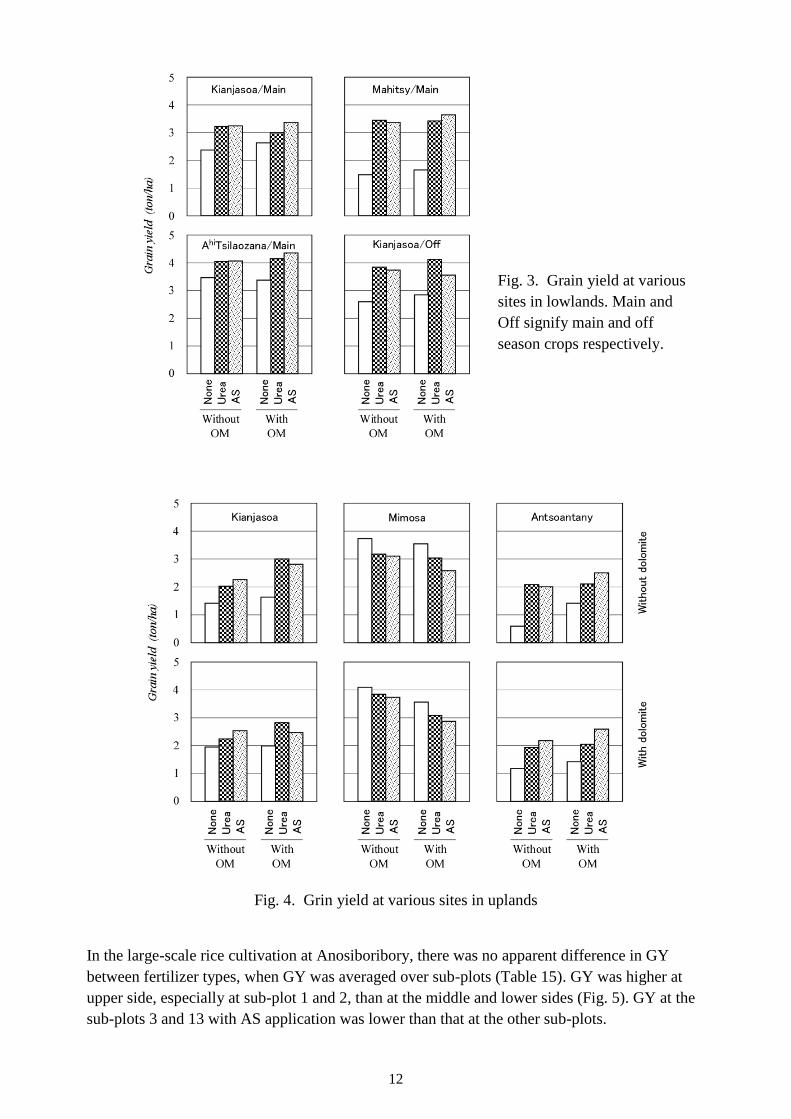
3. Grain yield (GY)
GY of lowland rice with the standard fertilizer treatment varied 1.5-4.3 ton/ha (Table 15 and Fig.
3). It was larger with fertilizers than without them and there was no apparent difference between
fertilizer types (i.e., urea and AS). GY at Kianjasoa was larger in the main season than in the off
season.
GY of upland rice was 0.6-4.1 ton/ha (Table 15 and Fig. 4). GY without fertilizers at Kianjasoa
was larger with dolomite than without it, whereas GY with fertilizers was similar irrespective of
fertilizer types and dolomite application. GY without fertilizers at Mimosa (3.7 ton/ha) was
much larger than that at Antsoantany (0.6 ton/ha) and it was larger than GY with fertilizers.
Table 14. Duration from sowing or transplanting (T/P) to flowing in lowland rice
during main season
Treatment Days after T/P Days after sowing
Organic Chemical in lowland (main season) in upland
matter fertilizer at Mahitsy (a) at Kianjasoa
application Panicle Flowering Flowering
(ton (N-P2O5-K2O-S emergence (75%)
/ha) kg/ha) Begin- End Begin- End Dolomite
ning ning - +
0 0- 0- 0- 0 94 102 103 106 88 84
0 60-44-32- 0 83 96 97 99 84 82
0 60-44-32-43 89 95 97 101 84 82
5 0- 0- 0- 0 94 102 103 106 85 83
5 60-44-32- 0 87 95 97 101 83 81
5 60-44-32-43 88 96 97 101 83 81
Abbr.: + and -: With and without dolomite application respectively.
a) 28 days from sowing to transplanting.
Table 15. Grain yield of rice plants grown with urea and ammonium sulfate (AS) at various locations
(2012-2013)
Cropping Agro- Dolo- Grain yield (ton/ha)
season ecology Location Cultivar mite Without OM With OM
(kg/ha) 0 Urea AS 0 Urea AS
Main Lowland Kianjasoa Mailaka - 2.4 3.2 3.2 2.6 3.0 3.4 a
season Mahitsy FOFIFA 160 - 1.5 3.4 3.4 1.6 3.4 3.6 a
Ahi
Tsilaozana Madikatra - 3.5 4.0 4.1 3.4 4.1 4.3 a
Anosiboribory Makalioka 34 - - 3.0 2.8 - - - b
Tsemaka - - 2.9 2.6 - - - b
Upland Kianjasoa Fotsiambo 0 1.4 2.0 2.3 1.6 2.7 2.8 a
300 1.9 2.2 2.5 2.0 2.8 2.5 a
Mimosa FOFIFA 161 0 3.7 3.2 3.1 3.5 3.0 2.6 b
300 4.1 3.8 3.7 3.6 3.1 2.9 b
Antsoantany FOFIFA 161 0 0.6 2.1 2.0 1.4 2.1 2.5 b
300 1.2 1.9 2.2 1.4 2.0 2.6 b
Off season Lowland Kianjasoa Mailaka 2.6 3.8 3.7 2.8 4.1 3.6 a
TS Mailaka 0 - - - 2.5 - 3.1 a
300 - - - 2.8 - 3.1 a
OM: organic matter. a and b: Grain yield with (a) and without (b) moisture adjustment to 14%.
TS: Timing and split-application experiment of AS.
12
Fig. 4. Grin yield at various sites in uplands
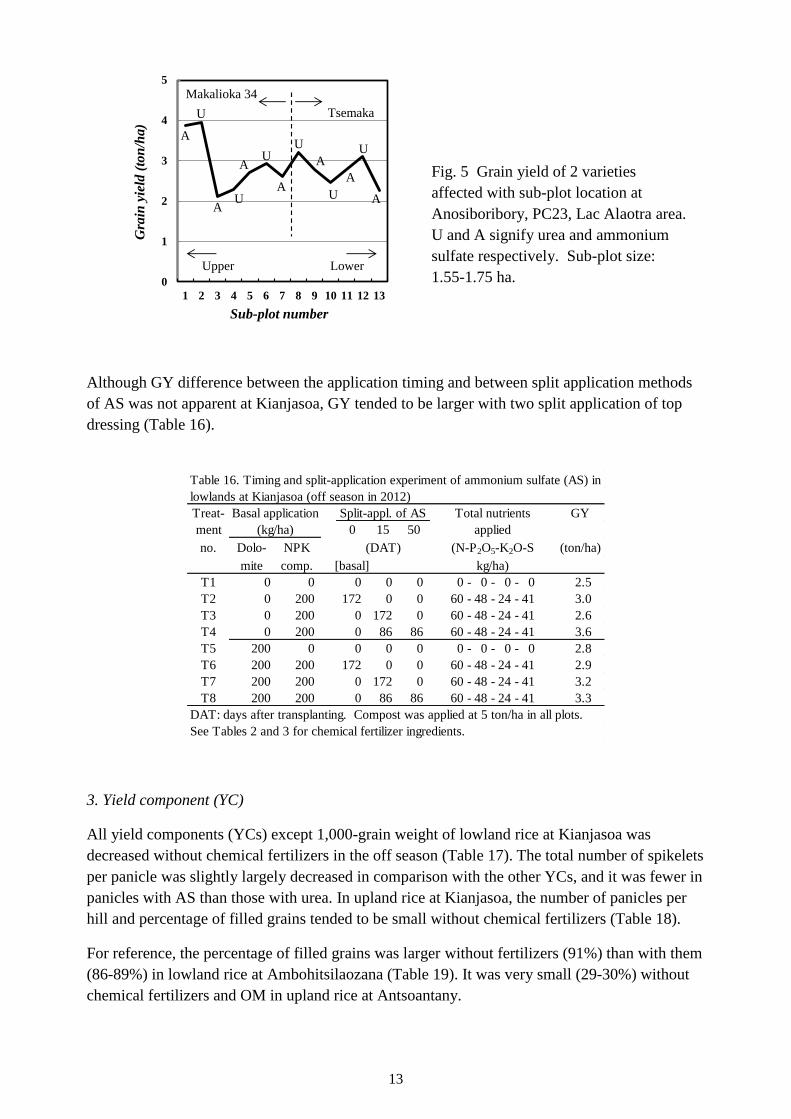
In the large-scale rice cultivation at Anosiboribory, there was no apparent difference in GY
between fertilizer types, when GY was averaged over sub-plots (Table 15). GY was higher at
upper side, especially at sub-plot 1 and 2, than at the middle and lower sides (Fig. 5). GY at the
sub-plots 3 and 13 with AS application was lower than that at the other sub-plots.
Fig. 3. Grain yield at various
sites in lowlands. Main and
Off signify main and off
season crops respectively.
13
Although GY difference between the application timing and between split application methods
of AS was not apparent at Kianjasoa, GY tended to be larger with two split application of top
dressing (Table 16).
3. Yield component (YC)
All yield components (YCs) except 1,000-grain weight of lowland rice at Kianjasoa was
decreased without chemical fertilizers in the off season (Table 17). The total number of spikelets
per panicle was slightly largely decreased in comparison with the other YCs, and it was fewer in
panicles with AS than those with urea. In upland rice at Kianjasoa, the number of panicles per
hill and percentage of filled grains tended to be small without chemical fertilizers (Table 18).
For reference, the percentage of filled grains was larger without fertilizers (91%) than with them
(86-89%) in lowland rice at Ambohitsilaozana (Table 19). It was very small (29-30%) without
chemical fertilizers and OM in upland rice at Antsoantany.
0
1
2
3
4
5
1 2 3 4 5 6 7 8 9 10 11 12 13
Upper Lower
Makalioka 34
Tsemaka
A
A
A
A
A
A
Sub-plot number
Gra
in y
ield
(to
n/h
a)
A
U
U
U
UU
U
Table 16. Timing and split-application experiment of ammonium sulfate (AS) in
lowlands at Kianjasoa (off season in 2012)
Treat- Basal application Split-appl. of AS Total nutrients GY
ment (kg/ha) 0 15 50 applied
no. Dolo- NPK (DAT) (N-P2O5-K2O-S (ton/ha)
mite comp. [basal] kg/ha)
T1 0 0 0 0 0 0 - 0 - 0 - 0 2.5
T2 0 200 172 0 0 60 - 48 - 24 - 41 3.0
T3 0 200 0 172 0 60 - 48 - 24 - 41 2.6
T4 0 200 0 86 86 60 - 48 - 24 - 41 3.6
T5 200 0 0 0 0 0 - 0 - 0 - 0 2.8
T6 200 200 172 0 0 60 - 48 - 24 - 41 2.9
T7 200 200 0 172 0 60 - 48 - 24 - 41 3.2
T8 200 200 0 86 86 60 - 48 - 24 - 41 3.3
DAT: days after transplanting. Compost was applied at 5 ton/ha in all plots.
See Tables 2 and 3 for chemical fertilizer ingredients.
Fig. 5 Grain yield of 2 varieties
affected with sub-plot location at
Anosiboribory, PC23, Lac Alaotra area.
U and A signify urea and ammonium
sulfate respectively. Sub-plot size:
1.55-1.75 ha.
14
Table 17. Yield components of lowland rice grown in dry season at Kianjasoa (2012-2013) (a)
Treatment No. of Total Percent 1,000- Grain yield
OM Chemical fetilizer panicle no. of of grain (ton/ha) Check
no. (ton (N-P2O5-K2O-S /hill spikelets filled weight Cal'd Actual
/ha) kg/ha) /panicle grains (g) A B (A/B)
T1 0 0 - 0 - 0 - 0 12 72 61 26 2.7 2.6 1.03
T2 0 60 - 44 - 32 - 0 13 89 66 25 3.9 3.8 1.01
T3 0 60 - 44 - 32 - 43 13 79 70 26 3.8 3.7 1.01
T4 5 0 - 0 - 0 - 0 12 79 65 25 3.1 2.8 1.10
T5 5 60 - 44 - 32 - 0 15 87 67 25 4.3 4.1 1.04
T6 5 60 - 44 - 32 - 43 14 80 66 25 3.8 3.6 1.06
OM: organic matter. Hill density = 20/m2. Grain weight was adjusted to 14% moisture.
a) Cal'd: calculated grain yield (GY) based on YCs was 1-10% larger than the actual GY.
Table 18. Yield components of upland rice at Kianjasoa (2012-2013) (a)
Treatment No. of Total Percent 1,000- Grain yield
Dol. OM Fetilizer panicle no. of of grain (ton/ha) Check
no. (kg (ton (N-P2O5-K2O-S /hill spikelets filled weight Cal'd Actual
/ha) /ha) kg/ha) /panicle grains (g) A B (A/B)
T1 0 0 0 - 0 - 0 - 0 6.0 62 68 24 1.5 1.4 1.09
T2 0 0 60 - 44 - 32 - 0 7.0 79 76 22 2.3 2.0 1.12
T3 0 0 60 - 44 - 32 - 43 8.0 78 70 23 2.5 2.3 1.11
T4 0 5 0 - 0 - 0 - 0 7.1 71 68 25 2.1 1.9 1.10
T5 0 5 60 - 44 - 32 - 0 9.0 60 76 25 2.5 2.2 1.11
T6 0 5 60 - 44 - 32 - 43 7.0 71 76 28 2.7 2.5 1.05
T7 300 0 0 - 0 - 0 - 0 7.0 75 67 21 1.8 1.6 1.11
T8 300 0 60 - 44 - 32 - 0 9.1 68 75 26 3.0 2.7 1.12
T9 300 0 60 - 44 - 32 - 43 7.9 79 78 26 3.1 2.8 1.12
T10 300 5 0 - 0 - 0 - 0 7.0 66 74 26 2.2 2.0 1.12
T11 300 5 60 - 44 - 32 - 0 8.0 68 82 28 3.2 2.8 1.12
T12 300 5 60 - 44 - 32 - 43 8.9 61 83 24 2.7 2.5 1.11
Dol.: dolomite. OM: organic matter. Hill density = 25/m2. Grain weight was adjusted to 14% moisture.
a) Cal'd: calculated grain yield (GY) based on YCs was 5-12% larger than the actual GY.
Table 19. Percentage of fillled grains and 1,000-grain weight of lowland rice at
Abohitsilaozana and of upland rice at Antsoantany in the main season
Treatment Lowland rice Upland rice
OM Chemical at Ahi
Tsilaozana at Antsoantany
fetilizer Percentage 1,000- Percentage 1,000-grain
(ton (N-P2O5-K2O-S of filled grain of weight
/ha) kg/ha) grains weight filled grains (g)
(g) -Dol +Dol -Dol +Dol
0 0 - 0 - 0 - 0 91 23 29 30 27 26
0 60 - 44 - 32 - 0 86 23 59 38 27 27
0 60 - 44 - 32 - 43 89 23 52 43 27 26
5 0 - 0 - 0 - 0 91 23 54 47 28 28
5 60 - 44 - 32 - 0 89 24 44 37 27 27
5 60 - 44 - 32 - 43 88 23 55 45 27 27
OM: organic matter. +Dol and -Dol.: with and without dolomite application
respectively. Grain weight was adjuted to 14% moisture.
15
Note that YCs were measured in almost all trials (Table 12), but only the YC data were
presented in the report, when the calculated GY based on YCs was within 12% error of the
actual GY. Grain filling percentage and 1,000-grain weight were supplemented because they
might be less erroneous.
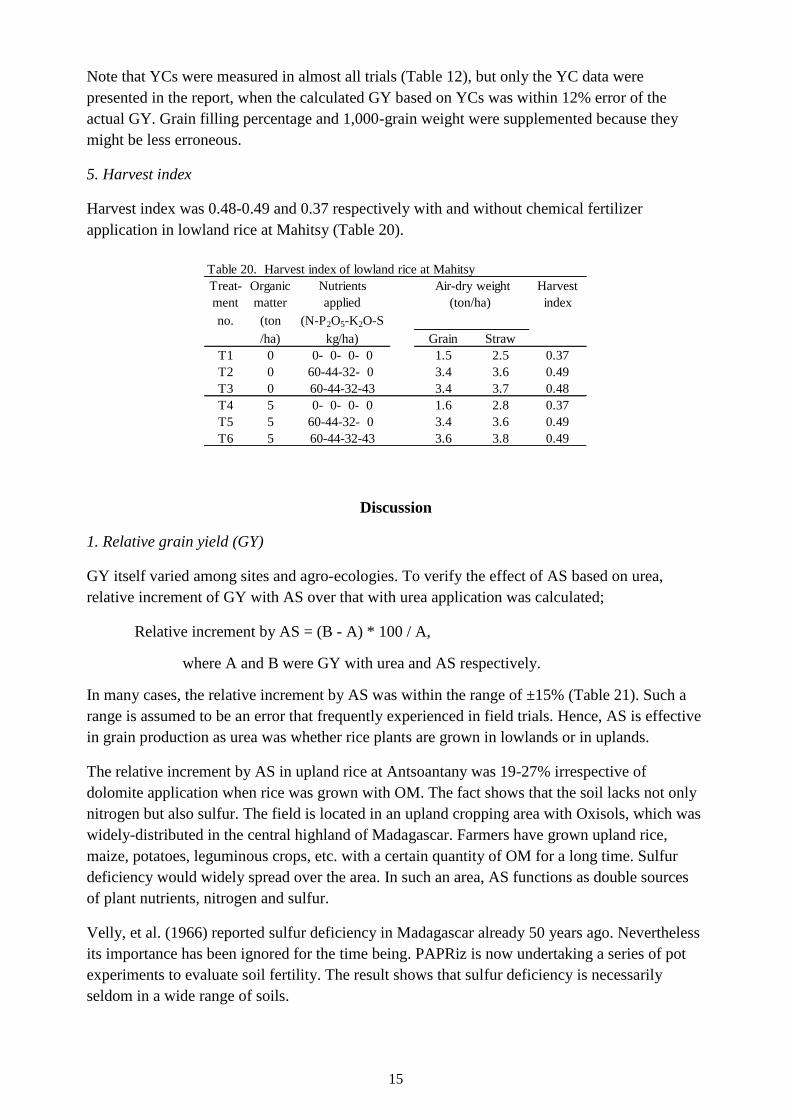
5. Harvest index
Harvest index was 0.48-0.49 and 0.37 respectively with and without chemical fertilizer
application in lowland rice at Mahitsy (Table 20).
Discussion
1. Relative grain yield (GY)
GY itself varied among sites and agro-ecologies. To verify the effect of AS based on urea,
relative increment of GY with AS over that with urea application was calculated;
Relative increment by AS = (B - A) * 100 / A,
where A and B were GY with urea and AS respectively.
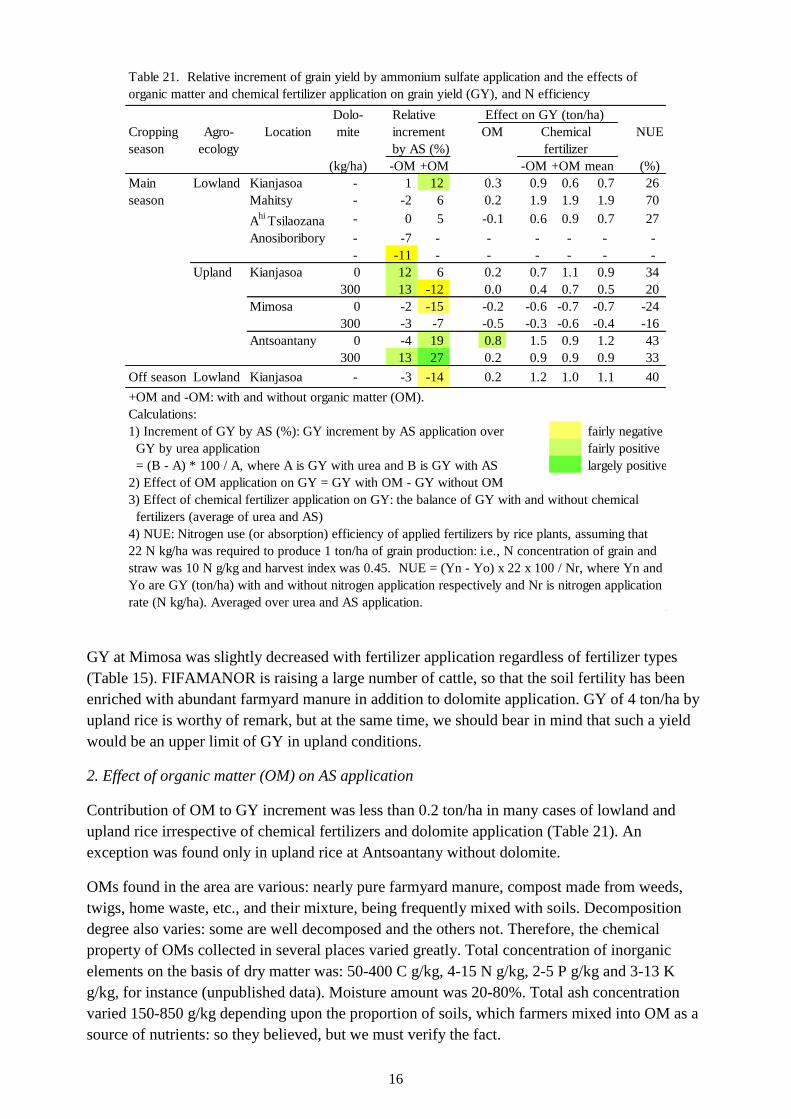
In many cases, the relative increment by AS was within the range of ±15% (Table 21). Such a
range is assumed to be an error that frequently experienced in field trials. Hence, AS is effective
in grain production as urea was whether rice plants are grown in lowlands or in uplands.
The relative increment by AS in upland rice at Antsoantany was 19-27% irrespective of
dolomite application when rice was grown with OM. The fact shows that the soil lacks not only
nitrogen but also sulfur. The field is located in an upland cropping area with Oxisols, which was
widely-distributed in the central highland of Madagascar. Farmers have grown upland rice,
maize, potatoes, leguminous crops, etc. with a certain quantity of OM for a long time. Sulfur
deficiency would widely spread over the area. In such an area, AS functions as double sources
of plant nutrients, nitrogen and sulfur.
Velly, et al. (1966) reported sulfur deficiency in Madagascar already 50 years ago. Nevertheless
its importance has been ignored for the time being. PAPRiz is now undertaking a series of pot
experiments to evaluate soil fertility. The result shows that sulfur deficiency is necessarily
seldom in a wide range of soils.
Table 20. Harvest index of lowland rice at Mahitsy
Treat- Organic Nutrients Air-dry weight Harvest
ment matter applied (ton/ha) index
no. (ton (N-P2O5-K2O-S
/ha) kg/ha) Grain Straw
T1 0 0- 0- 0- 0 1.5 2.5 0.37
T2 0 60-44-32- 0 3.4 3.6 0.49
T3 0 60-44-32-43 3.4 3.7 0.48
T4 5 0- 0- 0- 0 1.6 2.8 0.37
T5 5 60-44-32- 0 3.4 3.6 0.49
T6 5 60-44-32-43 3.6 3.8 0.49
16
GY at Mimosa was slightly decreased with fertilizer application regardless of fertilizer types
(Table 15). FIFAMANOR is raising a large number of cattle, so that the soil fertility has been
enriched with abundant farmyard manure in addition to dolomite application. GY of 4 ton/ha by
upland rice is worthy of remark, but at the same time, we should bear in mind that such a yield
would be an upper limit of GY in upland conditions.
2. Effect of organic matter (OM) on AS application
Contribution of OM to GY increment was less than 0.2 ton/ha in many cases of lowland and
upland rice irrespective of chemical fertilizers and dolomite application (Table 21). An
exception was found only in upland rice at Antsoantany without dolomite.
OMs found in the area are various: nearly pure farmyard manure, compost made from weeds,
twigs, home waste, etc., and their mixture, being frequently mixed with soils. Decomposition
degree also varies: some are well decomposed and the others not. Therefore, the chemical
property of OMs collected in several places varied greatly. Total concentration of inorganic
elements on the basis of dry matter was: 50-400 C g/kg, 4-15 N g/kg, 2-5 P g/kg and 3-13 K
g/kg, for instance (unpublished data). Moisture amount was 20-80%. Total ash concentration
varied 150-850 g/kg depending upon the proportion of soils, which farmers mixed into OM as a
source of nutrients: so they believed, but we must verify the fact.
Table 21. Relative increment of grain yield by ammonium sulfate application and the effects of
organic matter and chemical fertilizer application on grain yield (GY), and N efficiency
Dolo- Relative Effect on GY (ton/ha)
Cropping Agro- Location mite increment OM Chemical NUE
season ecology by AS (%) fertilizer
(kg/ha) -OM +OM -OM +OM mean (%)
Main Lowland Kianjasoa - 1 12 0.3 0.9 0.6 0.7 26
season Mahitsy - -2 6 0.2 1.9 1.9 1.9 70
Ahi
Tsilaozana - 0 5 -0.1 0.6 0.9 0.7 27
Anosiboribory - -7 - - - - - -
- -11 - - - - - -
Upland Kianjasoa 0 12 6 0.2 0.7 1.1 0.9 34
300 13 -12 0.0 0.4 0.7 0.5 20
Mimosa 0 -2 -15 -0.2 -0.6 -0.7 -0.7 -24
300 -3 -7 -0.5 -0.3 -0.6 -0.4 -16
Antsoantany 0 -4 19 0.8 1.5 0.9 1.2 43
300 13 27 0.2 0.9 0.9 0.9 33
Off season Lowland Kianjasoa - -3 -14 0.2 1.2 1.0 1.1 40
+OM and -OM: with and without organic matter (OM).
Calculations:
1) Increment of GY by AS (%): GY increment by AS application over fairly negative
GY by urea application fairly positive
= (B - A) * 100 / A, where A is GY with urea and B is GY with AS largely positive
2) Effect of OM application on GY = GY with OM - GY without OM
3) Effect of chemical fertilizer application on GY: the balance of GY with and without chemical
fertilizers (average of urea and AS)
4) NUE: Nitrogen use (or absorption) efficiency of applied fertilizers by rice plants, assuming that
22 N kg/ha was required to produce 1 ton/ha of grain production: i.e., N concentration of grain and
straw was 10 N g/kg and harvest index was 0.45. NUE = (Yn - Yo) x 22 x 100 / Nr, where Yn and
Yo are GY (ton/ha) with and without nitrogen application respectively and Nr is nitrogen application
rate (N kg/ha). Averaged over urea and AS application.
17
Collaborators simply described in their reports that they applied farmyard manure or compost at
the rate of 5 ton/ha. Yet, their properties were unknown at all: what the material was, how far it
was decomposed, what the moisture content was, etc. Whenever the OM is used, one should
clarify all such information, together with chemical and physical properties.
GY increment by AS was little affected with or without OM application (Table 21). Several
researchers emphasize the necessity of OM for AS application to mitigate a soil acidity problem,
although there is no scientific evidence to support it. The present study showed that GY was
unaffected by AS application irrespective of OM.
OM contribution to GY was the largest (0.8 ton/ha) at Antsoantany without dolomite application,
where GY was very low (0.6 ton/ha) without chemical fertilizer (Table 15). Low GY on the
original soil denotes poor fertility, so that OM would play an important role as a nutrient
supplier. Whatever the OM properties were its application rate at 5 ton/ha as in the present
experiments might be much larger than the rate by farmers' practice.
3. Effect of dolomite on AS application
The effect of dolomite on GY is marginal in many cases (Tables 15 and 21). Dolomite
application increased GY of upland rice at Kianjasoa and Mimosa, but the increase is minor:
2.2-2.5 vs. 2.0-2.3 and 3.7-3.8 vs. 3.1-3.2 ton/ha with and without dolomite application. The
dolomite effect was little affected with fertilizer types. Besides, dolomite application hardly
affected GY when rice plants were grown with OM. GY in lowland rice was little influenced
with dolomite treatment too.
It is well known that pH of lowland soils, whether it is originally high or low, is neutralized to
about 6.5 with submergence (Ponnamperuma. 1965). The fact that there was little effect of
dolomite application on GY shows that peculiar soils (i.e., harmful soils affecting GY by AS
use) would scarcely exist at the experiment sites. On the whole, the result indicates that AS
application would hardly induce an acidity problem in the central highland, Alaotra area and
middle-west zones.
Note that the fertilizer application rate in the present experiment was modest: the rate was
principally based on the recommended rates by FOFIFA and partly on the current socio-
economic condition in Madagascar. Few farmers use chemical fertilizers in rice cultivation
todays. We must re-examine an AS side-effect when a large quantity of AS, being similar to any
other chemical fertilizers, is used.
4. Nitrogen use efficiency and split application effect
Nitrogen use (absorption) efficiency (NUE) is about 50% with basal dressing, and it attain 80%
or higher with top-dressing. Top-dressing will help avoid eventual losses by volatilization,
runoff and leaching.
The number of trials of which NUE was higher than 40% was three, and NUE in seven other
trials was lower than 40%. NUE is generally higher when fertilizer rate was smaller (Table 21).
As described previously, fertilizer rate was modest in the present experiment, so that one has to
find the reason why the NUE was low.
18
The first possibility would be ill-water management, which was reflected in the relatively low
maximum GY. Rainfall in 2012-2013 was larger than the past average at Kianjasoa (Fig. 2),
where NUE was as low as 20-34%, possibly induced with nutrient leaching.
The second possibility would be a deficiency of nutrients other than nitrogen. Phosphorus and
potassium rates were small in comparison with nitrogen rate in the present treatment (Tables 2,
3, 5 and 6), so that NUE would be lowered if phosphorus, for example, might have been a
principal limiting factor.
Split application instead of basal application likely enhanced GY at Kianjasoa (Table 16). In
contrast, NUE was the highest at Mahitsy among all trials (Table 21), where all fertilizers were
given as basal application (Table 4). Split application of fertilizers generally promotes NUE,
which will result in higher GY. In practically, however, NUE will be influenced with soil
condition, water management (rainfall for upland rice), climatic condition, etc. Therefore, the
general tendency would not be applicable to specific cases.
Note that the reason why the NUE at Mahitsy was high was unknown although the rice field was
flooded. A feasible possibility would be derived from the wrong calculation of NUE: e.g.,
nitrogen concentration was lower and harvest index was higher in the actual plants than the
assumption. The other would be an error on yield measurement.
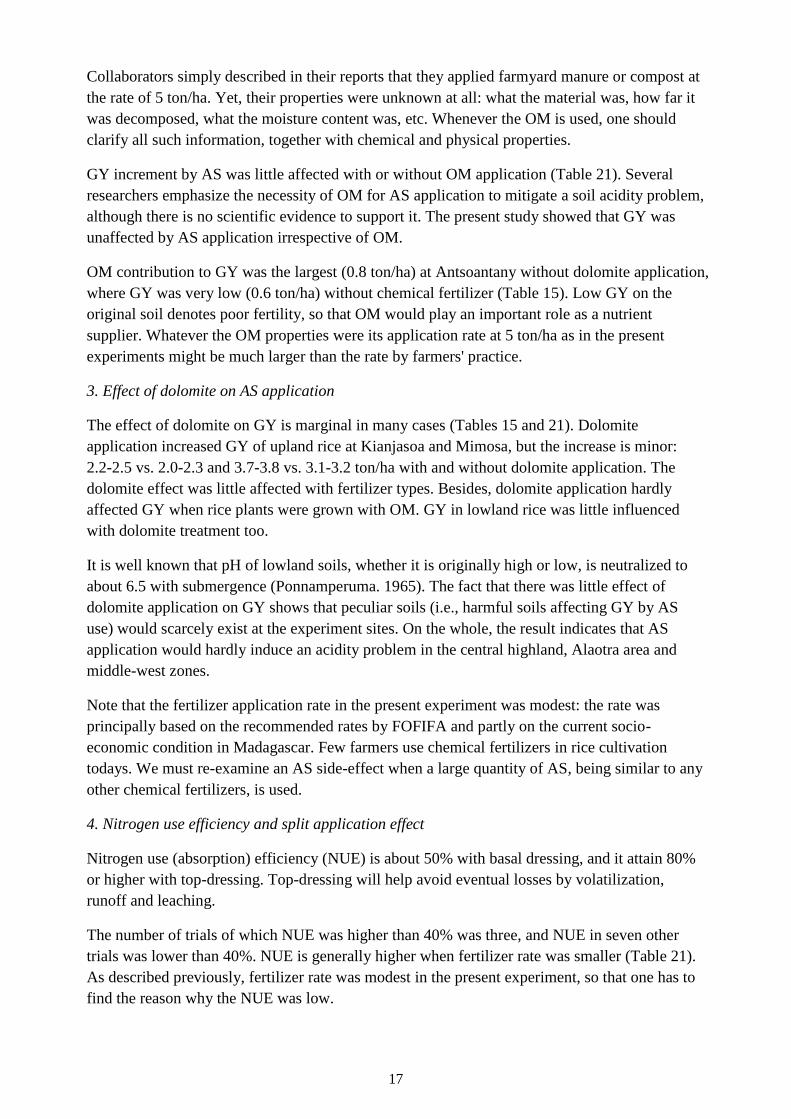
5. GY comparison with 2011-2012
Relative difference of GY between 2011-2012 and 2012-2013 plantings based on the former
was -20% or smaller in all treatments of lowland rice at Ambohitsilaozana and of upland rice at
Kianjasoa (Table 22). As for the former, water shortage during vegetative growth stage and as
for the latter insect damage and high rainfall would be the dominant factors for low GY in 2012-
2013 (Table 13).
Although GY tended to be lower with AS than with urea at Mahitsy and Ambohitsilaozana in
2011-2012, when AS was applied without OM (PAPRiz, 2012), such tendency was not observed
in 2012-2013 (Table 15). The result suggests that AS application will not be necessarily
accompanied with OM as an acidification remedy, especially in lowland rice.
Table 22. Relative difference of grain yield (GY) between 2012-2013 and 2011-2012 (a)
Agro- Dolo- Relative GY difference (%)
ecology Location Cultivar mite Without OM With OM
(kg/ha) 0 Urea AS 0 Urea AS
Lowland Kianjasoa Mailaka - -14 2 2 -7 -9 4
Mahitsy FOFIFA 160 - 7 12 34 -25 2 6
Ahi
Tsilaozana Madikatra - -29 -32 -16 -37 -29 -27
Anosiboribory Makalioka 34 - - -11 -14 - - -
Tsemaka - - 27 20 - - -
Upland Kianjasoa Fotsiambo 0 -23 -48 -36 -32 -36 -31
300 -19 -37 -30 -16 -18 -32
Mimosa FOFIFA 161 0 115 - - 66 47 5
300 - - - - - 17 -23
OM: organic matter.
a) Relative difference of GY (%) = (B-A) x 100/A, where A and B were GY in 2011-2012 and
that in 2012-2013 respectively.
19
GY was larger with AS than with urea in upland rice at Mimosa in 2011-2012, but there was no
difference between the two fertilizer sources in 202-2013. Although the field has been yearly
received abundant farmyard manure and dolomite, the entire FIFAMANOR farm was so large
and slightly undulating that the depth of surface and sub-layers would differ, farmyard manure
incorporation would not be uniform, and soil fertility would be affected with preceding crops.
GY of Tsemaka in 2012-2013 was larger than that in 2011-2012 at Anosiboribory. Nitrogen and
phosphorus application rates in 2011-2012 were respectively 1.6 and 2.1 times larger than those
in 2011-2012 but potassium was not applied. Larger doses of the two nutrients might have
contributed to the GY increase in Tsemaka. Instead, GY of Makalioka 34 was smaller in 2012-
2013 than in 2011-2012. One might carefully assess the mutual relationship between varietal
characteristics and fertilizer response.
6. Growth development affected with fertilizer application
Rice plants flowered earlier with fertilizer application than without it regardless of nitrogen
sources (Table 14). Because it is evident that nitrogen application delays flowering, the above-
mentioned phenomenon is not caused with nitrogen. Other nutrient like phosphorus, for example,
might concern it, but a real cause was remained unknown.
7. Yield components (YCs) and harvest index
To obtain reliable yield components (YCs) data, a systematic approach, especially of plant (hill)
sampling, is inevitable: random sampling will easily cause an arbitrary choice of hills. Such hills
are obvious to be far from representatives. The majority of YC data reported was invalid, being
beyond an allowable error, so that any valuable GY analysis was impossible. Besides, 1,000-
grain (filled) weight of a cultivar seldom varied 21-28 g with fertilizer treatments (Table 19), for
instance. YC measurement is a long-winded work and falls into a waste of time and money if it
is not rewarded with scientifically valid information.
Harvest index is an important indicator, which shows how efficiently plants convert total
biomass into grain. Modern, high-yielding rice varieties have been developed with harvest index
improvement based on the concept of ideal plant type. Because it is well known that fertilizer
application decreases harvest index, the result obtained in Table 20 contradicted the universal
fact. Harvest index is surely worthy in GY analysis if sampling and drying methods were
improved.
8. Strict evaluation of AS effect
In the present study, NPK compound fertilizer was forced to use for supplying phosphorus and
potassium, because the two elements were possibly deficient in the study area and single
fertilizers of phosphorus and potassium were unavailable in the market. Because of a nitrogen
ingredient in the NPK compound fertilizer, the present study fell into inadequate comparison of
the two nitrogenous fertilizers, urea and AS. Two single fertilizers like triple superphosphate
and potassium chloride are essential for fair evaluation of the AS effect.
Note that potassium sulfate is sometimes available in the market, but it is not acceptable in the
present experiment owing to its S ingredient.
20
Nevertheless, the present study would be worthy of comparing the two fertilizer sources, AS and
urea, although the effect would have been somewhat diluted. Nitrogen quantity in NPK
compound fertilizer and AS or urea in the standard treatment was respectively 22 and 38 kg/ha
(Tables 2 and 3), being the ratio of about 1:2. Besides, the sulfur rate was maintained in excess
condition. The N/S ratio was still as low as 1.4 in the standard treatment: it was 10-15 in plants
and 3-5 for the estimation of sulfur fertilizer to crop fields.
At the same time, one must consider whether the nutrient composition (i.e., the proportion of
nitrogen, phosphorus and potassium) in the present treatment well matches the soil fertility
condition or not. The nutrient rate in the present experiment was principally based on the
fertilizer rate recommended by FOFIFA. Appropriate fertilizer composition surely varies with
locations and the total quantity of fertilizers depends on yield levels. In the present study, the
rate of phosphorus and potassium was smaller than that of nitrogen. Because phosphorus
deficiency prevails in the area, the result might not properly evaluate a real nitrogenous effect.
At Anosiboribory, DAP and urea or AS were applied, where potassium is absent. If the soil were
deficient in potassium, fair comparison of urea and AS would not be satisfied. Such an issue will
be the subject in future.
Acknowledgments
PAPRiz is deeply grateful to the Ambatovy project for the provision of 3-ton AS, which was
fully used in the present field trials. We thank all of the researchers, officials and staff at
FOFIFAs, FIFAMANOR and CFAMA for conducting the AS trials.
Notes
Dr. J. Yamaguchi, a JICA short-term expert (ex-professor of Hokkaido University, Japan)
established the experiment framework and compiled the results. Dr. N. Kabaki, a chief advisor,
and Mr. R. Habara, a JICA expert, of PAPRiz, coordinated the trials.
Reports from each station are not attached to the present report. Some detailed data might
provide additional information. They are available upon request to the PAPRiz office:
References
PAPRiz, 2012: Evaluation of ammonium sulfate effect on rice production in Madagascar (Main
season, 2011-2012), PAPRiz, Antananarivo, Madagascar
Velly, J., Celton, J. and Roche, P., 1966: Fertilisation de Fond en Rizière à Madagascar -
Redressement de la Fertilité Résultats 1964-1966. Institut de Recherches Agronomiques à
Madagascar. pp.87. IRAT, Documnent no. 103.
![Index [link.springer.com]978-0-387-31435-8/1.pdf · Acylamide herbicides degradation, 207 ... Ammonium ion, 99,100, 101, IOJ, 105, 117,127 Ammonium nitrate, 168 Ammonium sulfate,](https://static.fdocuments.net/doc/165x107/5b88d4d57f8b9aaf728e71c8/index-link-978-0-387-31435-81pdf-acylamide-herbicides-degradation-207.jpg)