Evaluation of Active Management of the Norwegian ... · PDF fileEvaluation of Active...
33
Evaluation of Active Management of the Norwegian Government Pension Fund – Global Andrew Ang Ann F. Kaplan Professor of Business, Columbia Business School William N. Goetzmann Edwin J. Beinecke Professor of Finance and Management Studies, Yale School of Management Stephen M. Schaefer Professor of Finance, London Business School
Transcript of Evaluation of Active Management of the Norwegian ... · PDF fileEvaluation of Active...
Evaluation of ActiveManagement of theNorwegian GovernmentPension Fund – Global
Andrew Ang
Ann F. Kaplan Professor of Business, Columbia Business School
William N. Goetzmann
Edwin J. Beinecke Professor of Finance and Management Studies, Yale School ofManagement
Stephen M. Schaefer
Professor of Finance, London Business School
Outline
●Summary of empirical studies of active management andthe Efficient Market Hypothesis [EMH]
●Evaluation of NBIM’s historical track record
●Recommendations on how the Fund’s advantages can beexploited
2

Section I:Academic Evidence on ActiveManagement
Active Management vs. Indexing
●Modern versions of the Efficient Markets Hypothesis [EMH]recognize real-world frictions, e.g. information, transactionscosts, financing costs, etc
●Tests of the EMH recognize that there are multiple factorsdriving returns and the market portfolio is inefficient
●Tests on prices have produced violations of the EMHsuggestive of the potential for active management
●Finding active managers who consistently deliver excess risk-adjusted returns is difficult
4
Section II:Active Management of the Fund
Analysis
●Overall fund, asset class level (fixed income and equities),internal and external levels
●Variance decompositions: benchmark vs active
●Active returns: averages [alpha] and risk (tracking error),autocorrelations, reward-to-risk ratios, higher moments(skewness)
●Factor exposure: (rolling) partial correlations, fitted factorexposures
– Robustness to other “academic” factors
●Regime (break-date) analysis and rolling factor regressions
●Correlations to hedge fund strategies
6
7
Main Points
●The amount of active risk taken by the Fund is very small butin general, has added value
●The small amount of active management has very largeexposure to systematic factors: over 2/3rds of the activereturns are attributable to systematic factors
●Many of these systematic factors, especially liquidity, volatility,and credit, fared very poorly during 2008 and early 2009 andare responsible for most of the active losses
●External active management also has large exposure tosystematic factors
●The active losses are concentrated in fixed income, in bothinternal and external management

1998 2000 2002 2004 2006 2008 2010-1
0
1
2
3
4
5Overall Fund Cumulated Active Returns

1998 2000 2002 2004 2006 2008 20100
10
20
30
40
50
60
70Liquidity On-the-Run/Off-the-Run
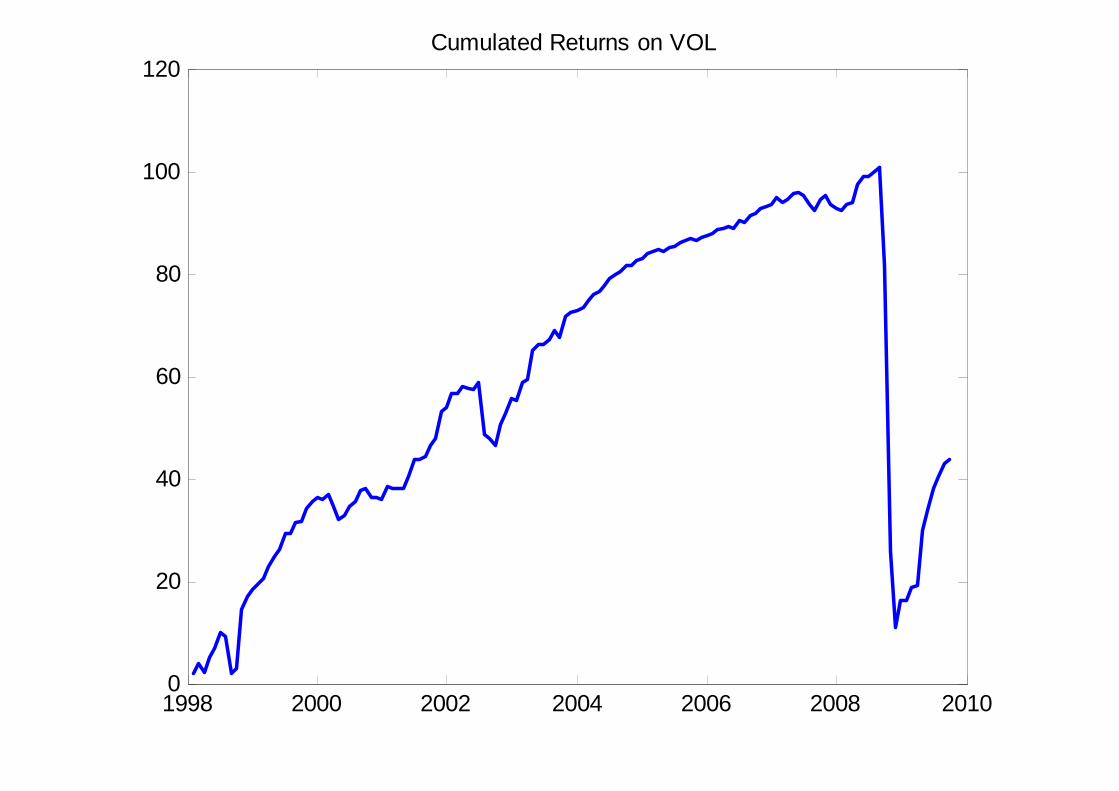
1998 2000 2002 2004 2006 2008 20100
20
40
60
80
100
120Cumulated Returns on VOL
11
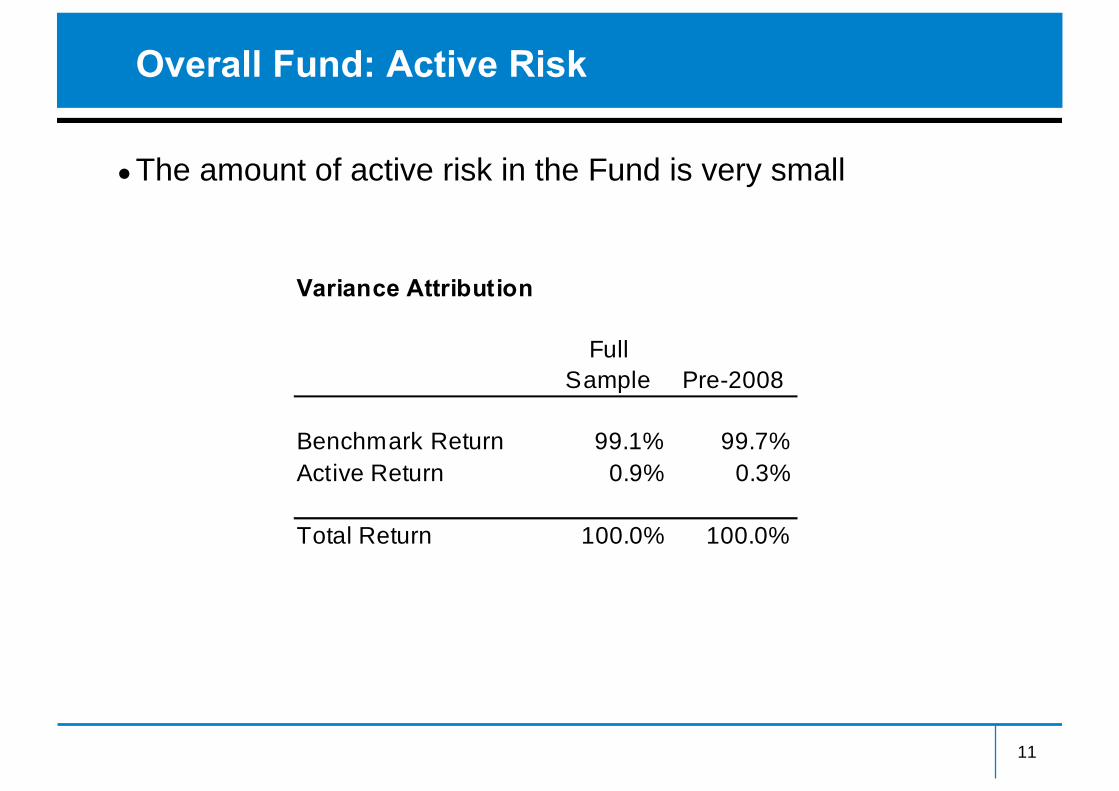
Overall Fund: Active Risk
●The amount of active risk in the Fund is very small
Variance Attribution
FullSample Pre-2008
Benchmark Return 99.1% 99.7%Active Return 0.9% 0.3%
Total Return 100.0% 100.0%

12
Overall Fund: Average Active Returns
●Active management has, in general, added value
Active Returns
Mean Autocorr SkewReward-to-Risk Ratio
Full Sample Coeff 0.02 0.55 -2.41 0.07P-value 0.56
Pre-2008 Coeff 0.03 0.16 -0.30 0.15P-value 0.01
Active Returns
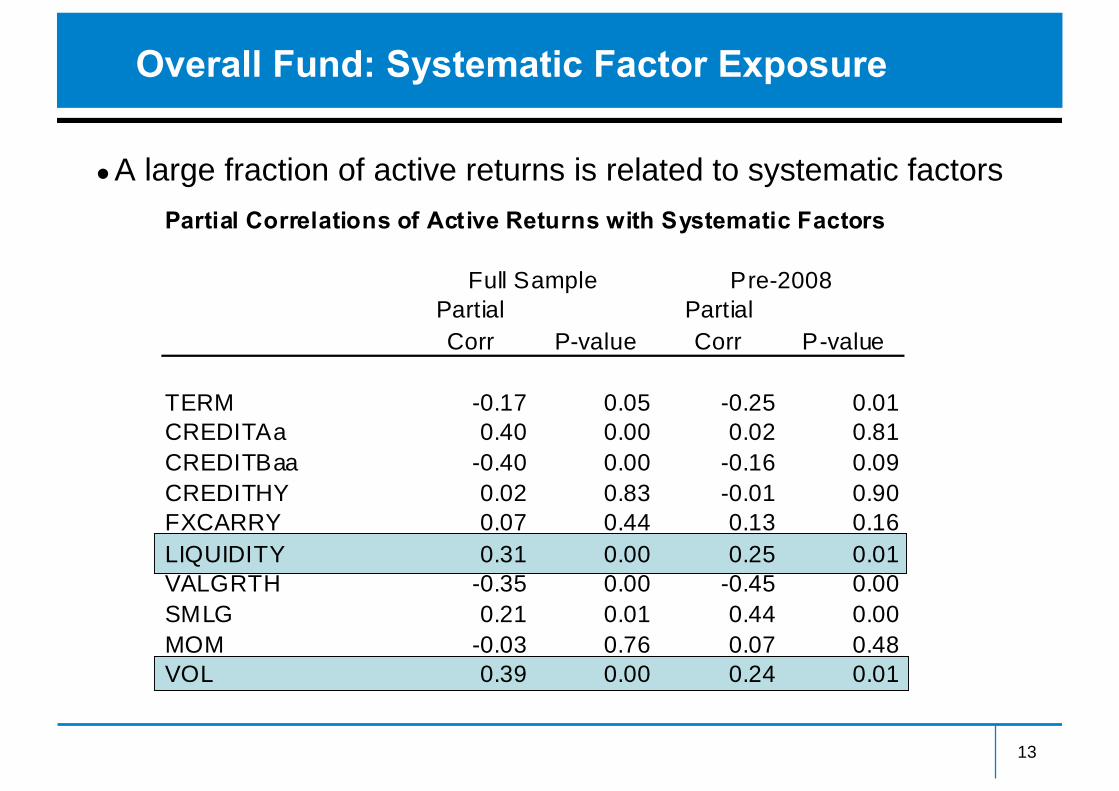
●A large fraction of active returns is related to systematic factors
13
Overall Fund: Systematic Factor Exposure
Partial Correlations of Active Returns with Systematic Factors
PartialCorr P-value
PartialCorr P-value
TERM -0.17 0.05 -0.25 0.01CREDITAa 0.40 0.00 0.02 0.81CREDITBaa -0.40 0.00 -0.16 0.09CREDITHY 0.02 0.83 -0.01 0.90FXCARRY 0.07 0.44 0.13 0.16LIQUIDITY 0.31 0.00 0.25 0.01VALGRTH -0.35 0.00 -0.45 0.00SMLG 0.21 0.01 0.44 0.00MOM -0.03 0.76 0.07 0.48VOL 0.39 0.00 0.24 0.01
Full Sample Pre-2008

14
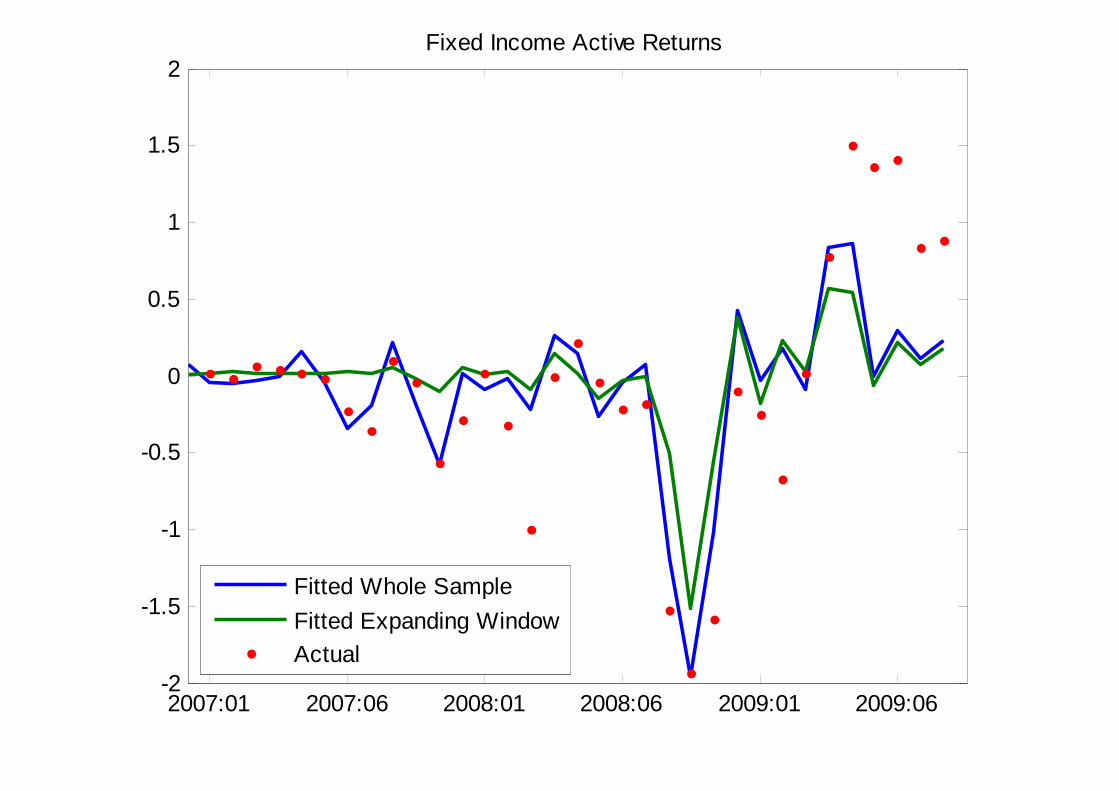
Overall Fund: Active Losses 2008-9
●Could the negative active returns over 2008-9 beenanticipated?
●If the factor exposures had been estimated pre-2008 andthe asset owner had some knowledge of the potentialdrawdowns of these factors, the Fund’s losses over 2008-9may have been within expected loss limits

2007:01 2007:06 2008:01 2008:06 2009:01 2009:06-2.5
-2
-1.5
-1
-0.5
0
0.5
1GPFG Active Returns
Fitted Whole SampleFitted Expanding WindowActual
16
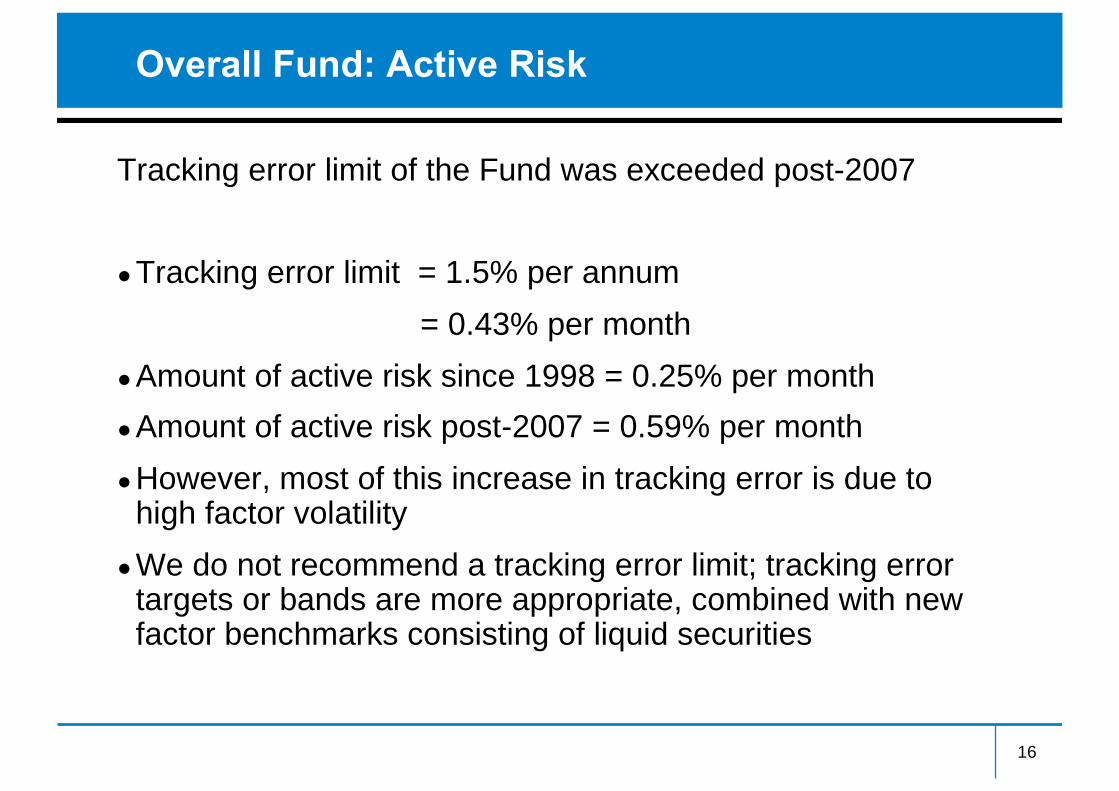
Overall Fund: Active Risk
Tracking error limit of the Fund was exceeded post-2007
●Tracking error limit = 1.5% per annum
= 0.43% per month
●Amount of active risk since 1998 = 0.25% per month
●Amount of active risk post-2007 = 0.59% per month
●However, most of this increase in tracking error is due tohigh factor volatility
●We do not recommend a tracking error limit; tracking errortargets or bands are more appropriate, combined with newfactor benchmarks consisting of liquid securities
1998 2000 2002 2004 2006 2008 2010-7
-6
-5
-4
-3
-2
-1
0
1
2
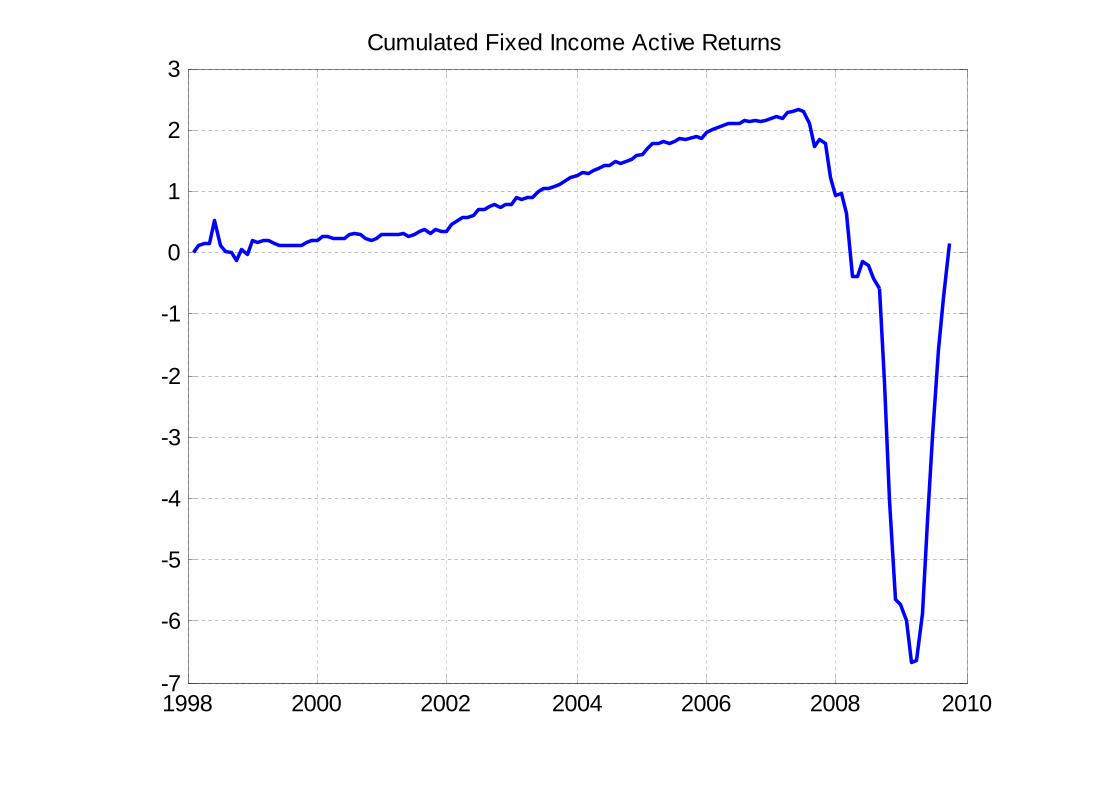
3Cumulated Fixed Income Active Returns
2007:01 2007:06 2008:01 2008:06 2009:01 2009:06-2
-1.5
-1
-0.5
0
0.5
1
1.5
2Fixed Income Active Returns
Fitted Whole SampleFitted Expanding WindowActual
19
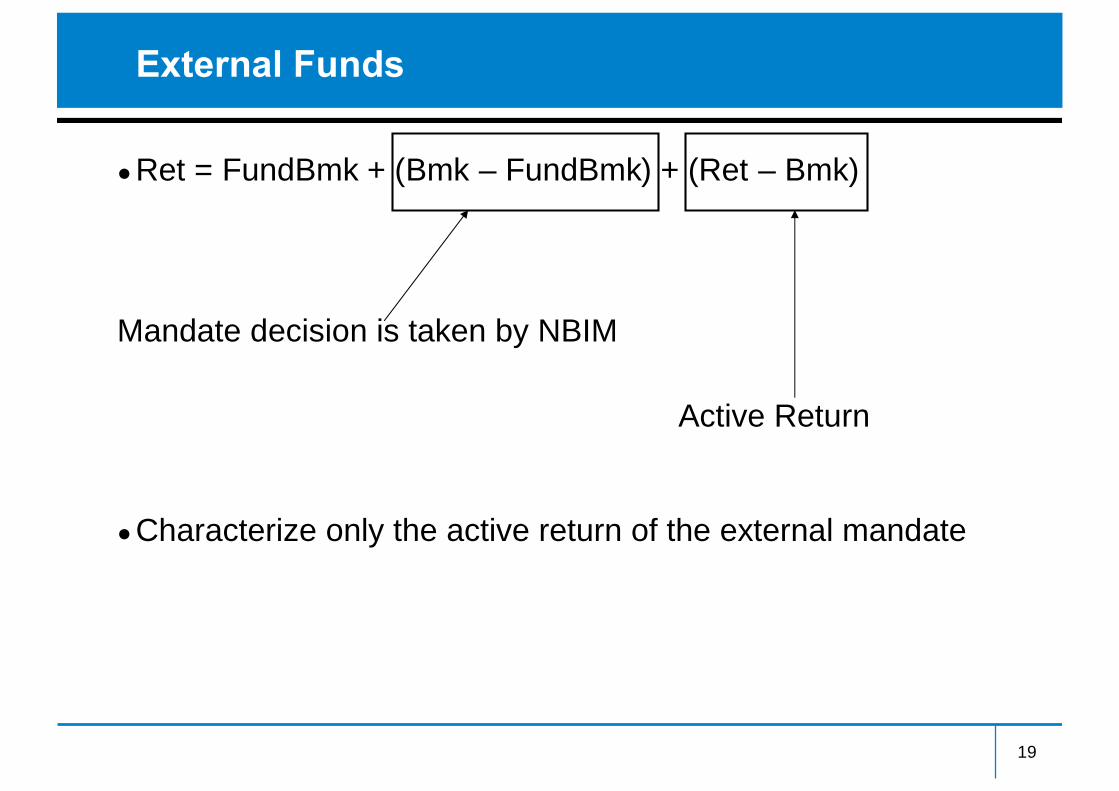
External Funds
●Ret = FundBmk + (Bmk – FundBmk) + (Ret – Bmk)
●Characterize only the active return of the external mandate
Mandate decision is taken by NBIM
Active Return
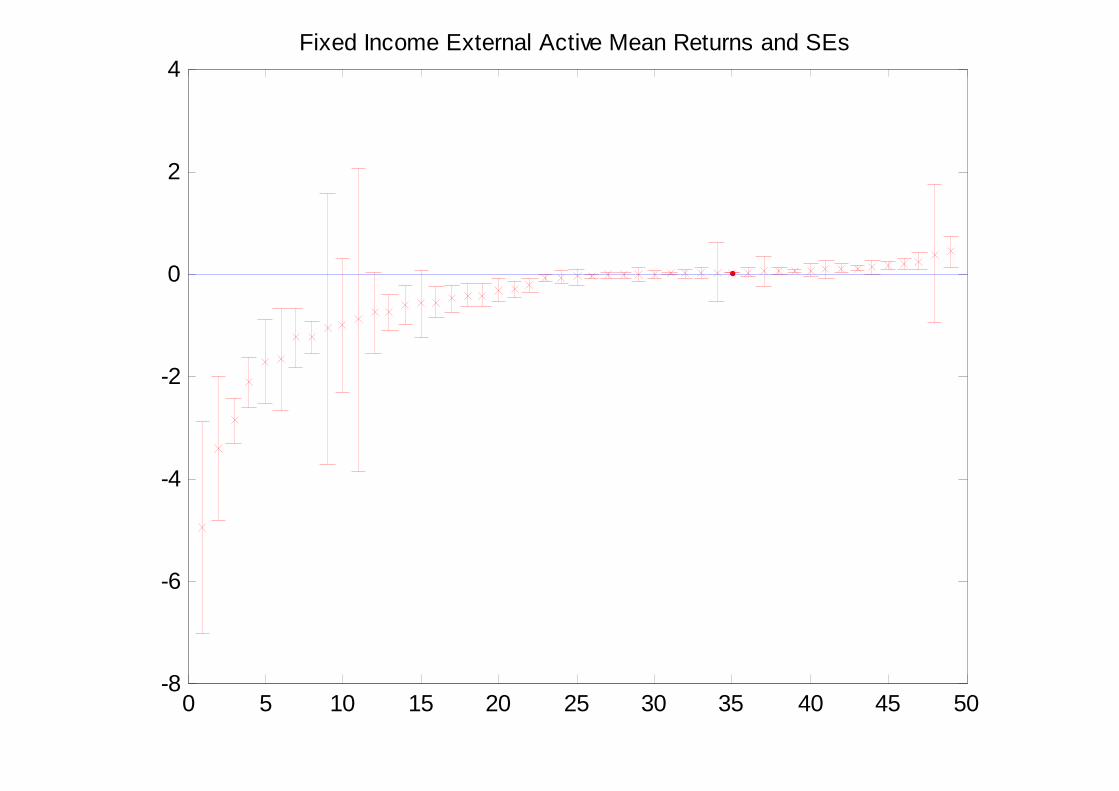
0 5 10 15 20 25 30 35 40 45 50-8
-6
-4
-2
0
2
4Fixed Income External Active Mean Returns and SEs
2000 2001 2002 2003 2004 2005 2006 2007 2008 2009 2010-4
-3
-2
-1
0
1
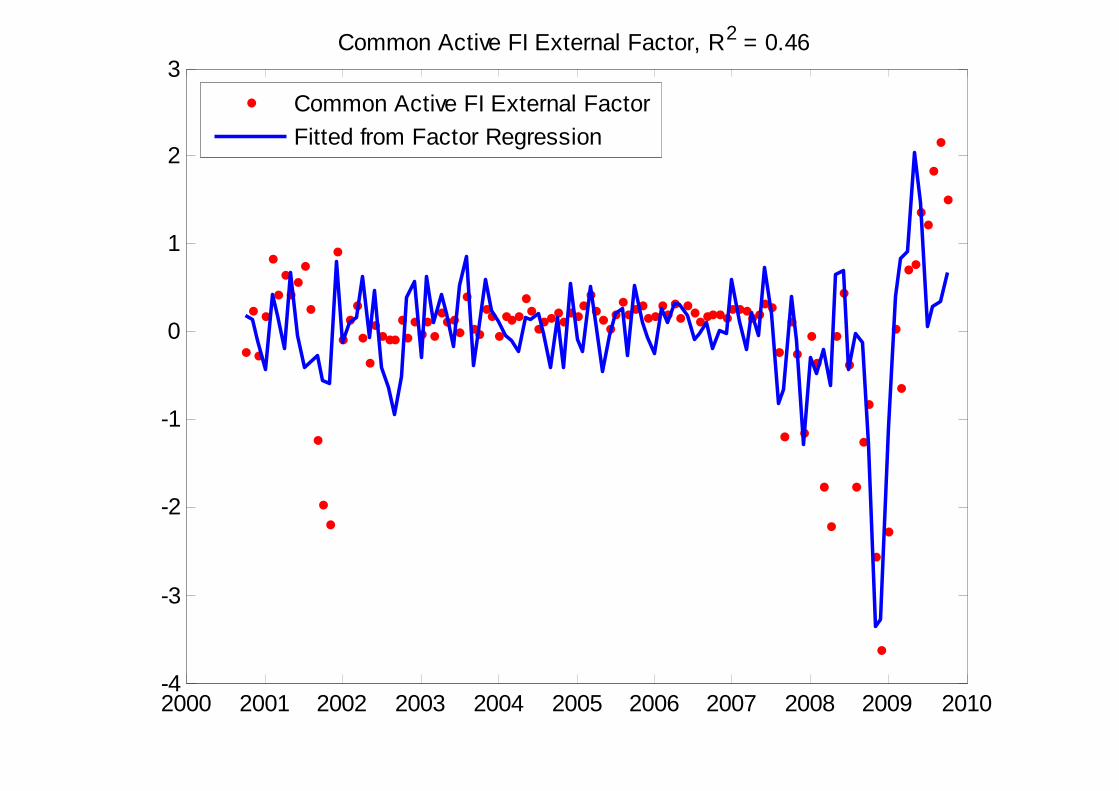
2
3Common Active FI External Factor, R2 = 0.46
Common Active FI External FactorFitted from Factor Regression

Section III:Comparative Advantages andCapabilities
Factor-Based Investing
●Active management has played a small role in the overallperformance of the fund
– Contributed positively and may be beneficial for other aims
●Active returns have had large exposure to systematic risks
– Mainly a result of bottom-up decisions
– Large systematic exposure is first order
– We believe this exposure is entirely appropriate
– These factors earn risk premiums over the long run
●We recommend the Fund move to a more top-down,intentional approach to choosing factor exposure
– Factor exposure should be an extension of current assetallocation policy
23

Factor-Based Investing
●Base investment philosophy on compensation for takingsystematic risk
– Alpha is difficult to capture in large scale
– Alpha risk is often factor risk in disguise
– Factor risk premiums are long-horizon investments
– Should separate systematic risk vs true active returns inpaying for active management
●Relative to standard market-weighted benchmarks (egFTSE and Barcap), active management is one way toaccess factor risk premiums: the Fund should remainactive in this context
24
Recommendation: Custom Benchmarks
●In-house, customized benchmarks on liquid securities
– Recommend the Fund not be a passive follower of widely usedindexes
– Costs and distortions of following common passive indexes asmany institutions track these indexes at the same time
– The Fund is a natural provider of liquidity to investors forced torebalanced to index weights and can reap liquidity premiums
– Many widely used indexes, especially fixed income indexes,contain illiquid securities which are better held in other structures
• Enhances the effectiveness of tracking error as a risk budgetingand risk management tool
25

Recommendation: Factor Benchmarks
●Express through exposure to factor risk
– Fund already capturing premiums to multiple factorexposures, but this factor exposure should be made explicit
●Factor exposures should be in the Fund’s benchmark
– “Passive but dynamic”; “index but active”
– Set desired amount of factor exposure at the level of theasset owner, not fund manager
– Measure and build your own factors: ensure lowest possiblecost, better risk management, etc
– Use the factors to evaluate internal and external activemanagement and alternative asset classes
26
Factor-Based Investing: Fund’s Advantages
Factors fit into the Fund’s comparative advantages
●Governance structure, especially transparency
– Better communication of the risks of the Fund’s strategies
– Asset owner decides on which factors and the amount of factor risk
●Scale
– Systematic factors can be implemented in large scale
●Long-term investment horizon
– Allows the Fund to ride out periods of short-term losses from somefactors which are negatively skewed
●Relationship to its management company, NBIM
– NBIM has the expertise to implement factor benchmarks
27
Factor-Based Investing: Benefits
●Better understanding of risk-return trade-offs
●Method to gauge the benefit of adding new factors or assetclasses to the portfolio
●Allows the asset owner to determine which factors shouldhave large or small exposure
– Amount of active risk independent of factors could be lowerthan today since factor risk is brought into the benchmark
●Raises the bar for active management
●More robust portfolios
Factor-Based Investing: Challenges
●Lack of widely recognized factor benchmarks
– NBIM has expertise in maintaining and tracking indexes
●No long time series
– Many factors have 20-30 years (some 100+ years) of history.Factors without long time series would not be in the benchmark
●Complete set of factors is unknown
– Removes systematic factor risk from active returns that should beobtainable more cheaply than true active strategies
●Extend asset to factor allocation
– Need for more public education on factor risk-return trade-offs
●New governance structure
– Recommend a creating a new “Factor Benchmark” Division
29
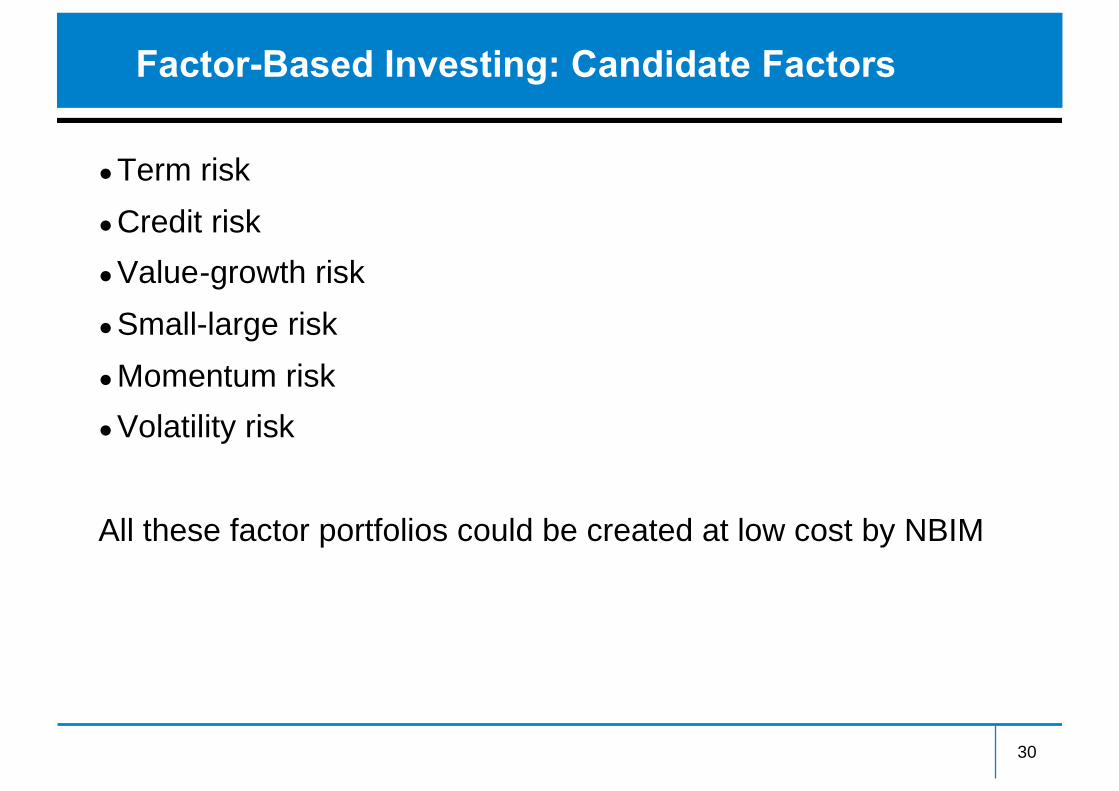
Factor-Based Investing: Candidate Factors
●Term risk
●Credit risk
●Value-growth risk
●Small-large risk
●Momentum risk
●Volatility risk
All these factor portfolios could be created at low cost by NBIM
30
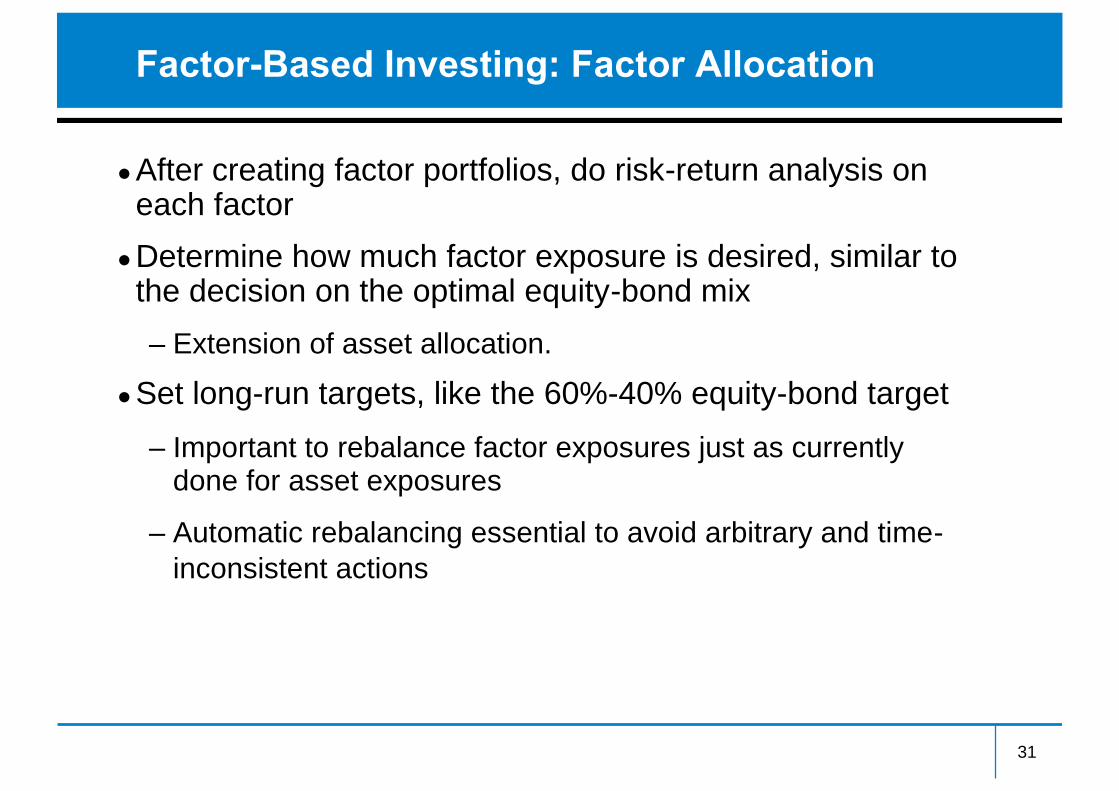
Factor-Based Investing: Factor Allocation
●After creating factor portfolios, do risk-return analysis oneach factor
●Determine how much factor exposure is desired, similar tothe decision on the optimal equity-bond mix
– Extension of asset allocation.
●Set long-run targets, like the 60%-40% equity-bond target
– Important to rebalance factor exposures just as currentlydone for asset exposures
– Automatic rebalancing essential to avoid arbitrary and time-inconsistent actions
31

Recommendation: Horizon Buckets
●Categorize assets by horizon
– Cash
– Short-term (e.g. listed equities, liquid fixed income)
– Long-term (e.g. illiquid fixed income, real estate, strategieswith long verification horizons)
●Horizon buckets set appropriate expectations
– Appropriate performance review
– Appropriate future liquidity planning
32
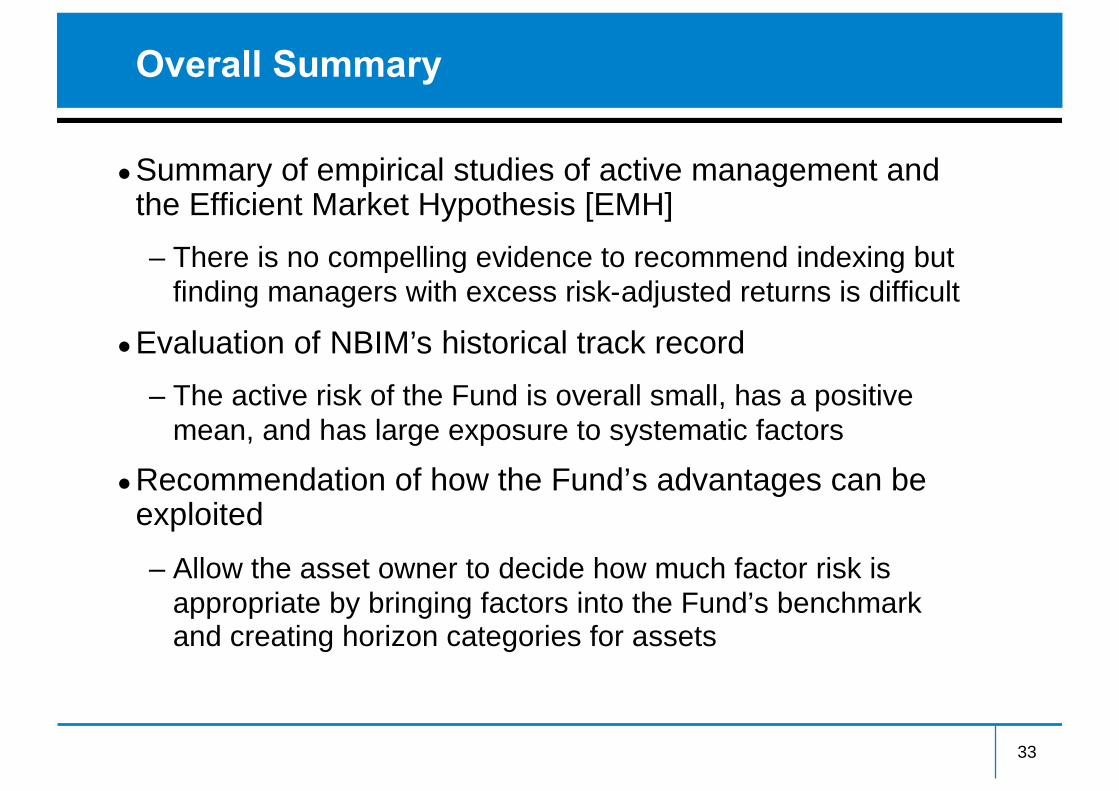
Overall Summary
●Summary of empirical studies of active management andthe Efficient Market Hypothesis [EMH]
– There is no compelling evidence to recommend indexing butfinding managers with excess risk-adjusted returns is difficult
●Evaluation of NBIM’s historical track record
– The active risk of the Fund is overall small, has a positivemean, and has large exposure to systematic factors
●Recommendation of how the Fund’s advantages can beexploited
– Allow the asset owner to decide how much factor risk isappropriate by bringing factors into the Fund’s benchmarkand creating horizon categories for assets
33