EVALUATION OF A WIND TUNNEL TECHNIQUE TO DETERMINE AIRCRAFT DEPARTURE CHARACTERISTICS ·...
31
AEDC-TR-73-183 f 084 EVALUATION OF A WIND TUNNEL TECHNIQUE TO DETERMINE AIRCRAFT DEPARTURE CHARACTERISTICS R. W. Butler ARO, Inc. March 1974 Approved for public release; distribution unlimited. PROPULSION WIND TUNNEL FACILITY ARNOLD ENGINEERING DEVELOPMENT CENTER AIR FORCE SYSTEMS COMMAND ARNOLD AIR FORCE STATION, TENNESSEE
Transcript of EVALUATION OF A WIND TUNNEL TECHNIQUE TO DETERMINE AIRCRAFT DEPARTURE CHARACTERISTICS ·...
AEDC-TR-73-183 f 084
EVALUATION OF A WIND TUNNEL TECHNIQUE
TO DETERMINE AIRCRAFT
DEPARTURE CHARACTERISTICS
R. W. Butler
ARO, Inc.
March 1974
Approved for public release; distribution unlimited.
PROPULSION WIND TUNNEL FACILITY
ARNOLD ENGINEERING DEVELOPMENT CENTER
AIR FORCE SYSTEMS COMMAND
ARNOLD AIR FORCE STATION, TENNESSEE

NOTICES When U. S. Government drawings specifications, or other data arc used for any purpose other than a definitely related Government procurement operation, the Government thereby incurs no responsibility nor any obligation whatsoever, and the fact that the Government may have formulaLed, furnished, or in any ,v*a\ supplied the said drawings, specifications, or other data, is not to be regarded by implication or otherwise, or in any manner licensing the holder or any o:hor person or corporation, or conveying any rights or permission to manufacture, use, or sell any patented invention that may in any way be related thereto.
Qualified users may obtain copies of this report from the Defense Documentation Center.
References to named commercial products in this report arc not to bo considered ^n nnv si'nsc as an endorsement of the product by the United States Air Force or the Government.
'I
AEDC-TR-73-183
EVALUATION OF A WIND TUNNEL TECHNIQUE TO DETERMINE AIRCRAFT
DEPARTURE CHARACTERISTICS
R. W. Butler ARO, Inc.
Approved for public release; distribution unlimited.
AEDC-TR-73-183
FOREWORD
The work reported herein was sponsored by the Arnold Engineering Development Center (AEDC), Air Force Systems Command (AFSC), under Program Element 65802F.
The data presented were obtained during the development of a captive aircraft testing technique by ARO, Inc. (a subsidiary of Sverdrup & Parcel and Associates, Inc.), contract operator of the AEDC, AFSC, Arnold Air Force Station, Tennessee. Testing associated with the development of the subject technique was conducted from February 2 through May 18, 1973, under ARO Project No. PF225. The manuscript was submitted for publication on September 5, 1973.
This technical report has been reviewed and is approved.
MAURICE A. CLERMONT ROBERT O. DIETZ Major, CF Director of Technology Research and Development Division Directorate of Technology

AEDC-TR-73-183
ABSTRACT
A wind tunnel pilot test was conducted at AEDC to develop a captive aircraft testing technique. By utilizing the wind tunnel to determine the static aerodynamic forces and moments in conjunction with an on-line digital computer programmed with the equations of motion, a series of aircraft stall/departure type maneuvers was generated. A 1/72-scale A-7D aircraft model was utilized in testing. All maneuvers were initiated at Mach number 0.50 at a simulated altitude of 20,000 ft. Tunnel Mach number was adjusted to correspond to the varying aircraft Mach number through the course of the maneuver. The wind tunnel test time required for generating 1 sec of full-scale flight time was approximately four minutes.
in

AEDC-TR-73-183
CONTENTS
Page
ABSTRACT iii NOMENCLATURE vi
I. INTRODUCTION 1 II. APPARATUS
2.1 Test Facility 1 2.2 Test Article 2 2.3 Instrumentation 2
III. PROCEDURE 3.1 CADS Data Acquisition 3 3.2 Precision of Data 3
IV. RESULTS AND DISCUSSION 4.1 General 4 4.2 Model Asymmetry 5 4.3 Accelerated Stalls 5
V. SUMMARY OF RESULTS 7 REFERENCES 7
APPENDIXES
I. ILLUSTRATIONS
Figure
1. Isometric Drawing of a CADS Installation and a Block Diagram of the Computer Control Loop 11
2. Model Location in Test Section 12 3. Basic Dimensions of the A-7D Aircraft Model L3 4. Photograph of the CADS Model Installation 14 5. A-7D Dynamic Stability Derivatives 15 6. A-7D Static Aerodynamic Coefficients, ß = 0, M«, = 0.50 17 7. A-7D Accelerated Stall Maneuvers 18 8. A-7D High-g Rolling Pullout Maneuver 19 9. Evaluation of Maneuver Interruption Technique 20
II. TABLE
I. Full-Scale A-7D Parameters Used in Maneuver Calculations 21
III. EQUATIONS OF MOTION 22

AEDC-TR-73-183
NOMENCLATURE
A/C Aircraft
BL A-7D buttock line from plane of symmetry, in., model scale
b Wing span, ft
CQ Drag coefficient, drag/q^S
CL Lift coefficient, lift/qJS
Cg Rolling-moment coefficient, rolling moment/qjSb about aircraft eg
Co Derivative of rolling-moment coefficient with respect to roll rate, 3C£/3(pb/2VJ, per radian
Cgr Derivative of rolling-moment coefficient with respect to yaw rate, 3C£/3(rb/2VJ, per radian
Cm Pitching-moment coefficient, pitching moment/qJSc about aircraft cg
Cm Derivative of pitching-moment coefficient with respect to pitch rate, aCm/3(qc/2V00), per radian
Cn Yawing-moment coefficient, yawing moment/qjSb about aircraft cg
Cn Derivative of yawing-moment coefficient with respect to roll rate, 3Cn/3(pb/2V0„), per radian
Cnj Derivative of yawing-moment coefficient with respect to yaw rate, 3Cn/3(rb/2VJ, per radian
Cy Side-force coefficient, side force/q„S i
Cyp Derivative of side-force coefficient with respect to roll rate, 3CY/3(pb/2Vllo), per radian
Cyr Derivative of side-force coefficient with respect to yaw rate, ,3CY/3(rb/2VJ, per radian
c Mean geometric chord, ft
DEF Deflection
VI

AEDC TR-73-183
Fx» Fyj Fz Components of the aerodynamic forces along the XB, YB, and ZB
axis, respectively, lb
Gx, Gy, Gz Components of the aerodynamic moments about the XB, YB, and ZB
axis, respectively, ft-lb
Ixx, lyy. h.z Moments of inertia about XB, Yß, and Zß axis, respectively, slug-ft2
IXy> 'xn lyz Product of inertia, slug-ft2
m Aircraft mass, slugs
p. q, r Aircraft roll, pitch, and yaw rates about Xß, YB, and ZB axis, respectively, deg/sec
p, q, f Aircraft roll, pitch, and yaw accelerations about XB, YB, and ZB
axis, respectively, deg/scc2
q„, Dynamic pressure, lb/ft2
S Wing area, ft2
u, v, w Linear velocity components along the XB, Yß, and ZB axis, respectively, ft/sec
u, v, w Linear accelerations along the XB, YB. and ZB axis, respectively, ft/see2
V,,. Free-stream velocity, (u2 + v2 + w2 )Vl, ft/sec
WL A-7D waterline from reference horizontal plane, in., model scale
XB Longitudinal body axis, positive forward
YB Lateral body axis, perpendicular to the longitudinal body axis taken in the plane of the wings, positive to the right at zero roll
ZB Perpendicular to the longitudinal and lateral body axis
a Aircraft angle of attack, tan-1 w/u, deg
ß Aircraft angle of sideslip, sin-1 v/V«,, deg
SA Aileron deflection, trailing edge down plus, deg
vii

AEDC-TR-73-183
St Horizontal stabilizer deflection, trailing edge down plus, deg
\p, 6, 0 Eulerian yaw, pitch, and roll angles, respectively, referenced to earth axis
Vlll
AEDC TR-73-183
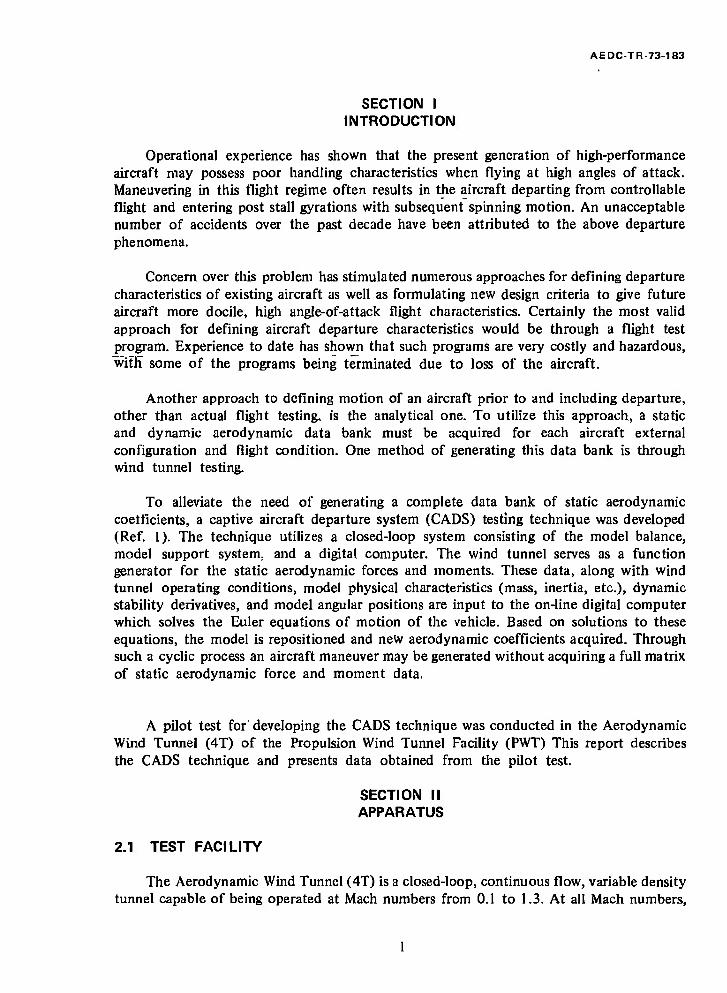
SECTION I INTRODUCTION
Operational experience has shown that the present generation of high-performance aircraft may possess poor handling characteristics when flying at high angles of attack. Maneuvering in this flight regime often results in the aircraft departing from controllable flight and entering post stall gyrations with subsequent spinning motion. An unacceptable number of accidents over the past decade have been attributed to the above departure phenomena.
Concern over this problem has stimulated numerous approaches for defining departure characteristics of existing aircraft as well as formulating new design criteria to give future aircraft more docile, higli angle-of-attack flight characteristics. Certainly the most valid approach for defining aircraft departure characteristics would be through a flight test program. Experience to date has shown that such programs are very costly and hazardous, with" some of the programs being terminated due to loss of the aircraft.
Another approach to defining motion of an aircraft prior to and including departure, other than actual flight testing, is the analytical one. To utilize this approach, a static and dynamic aerodynamic data bank must be acquired for each aircraft external configuration and flight condition. One method of generating this data bank is through wind tunnel testing.
To alleviate the need of generating a complete data bank of static aerodynamic coetficients, a captive aircraft departure system (CADS) testing technique was developed (Ref. 1). The technique utilizes a closed-loop system consisting of the model balance, model support system, and a digital computer. The wind tunnel serves as a function generator for the static aerodynamic forces and moments. These data, along with wind tunnel operating conditions, model physical characteristics (mass, inertia, etc.), dynamic stability derivatives, and model angular positions are input to the on-line digital computer which solves the Euler equations of motion of the vehicle. Based on solutions to these equations, the model is repositioned and new aerodynamic coefficients acquired. Through such a cyclic process an aircraft maneuver may be generated without acquiring a full matrix of static aerodynamic force and moment data.
A pilot test for' developing the CADS technique was conducted in the Aerodynamic Wind Tunnel (4T) of the Propulsion Wind Tunnel Facility (PWT) This report describes the CADS technique and presents data obtained from the pilot test.
SECTION II APPARATUS
2.1 TEST FACILITY
The Aerodynamic Wind Tunnel (4T) is a closed-loop, continuous flow, variable density tunnel capable of being operated at Mach numbers from 0.1 to 1.3. At all Mach numbers,
AEDC-TR-73-183
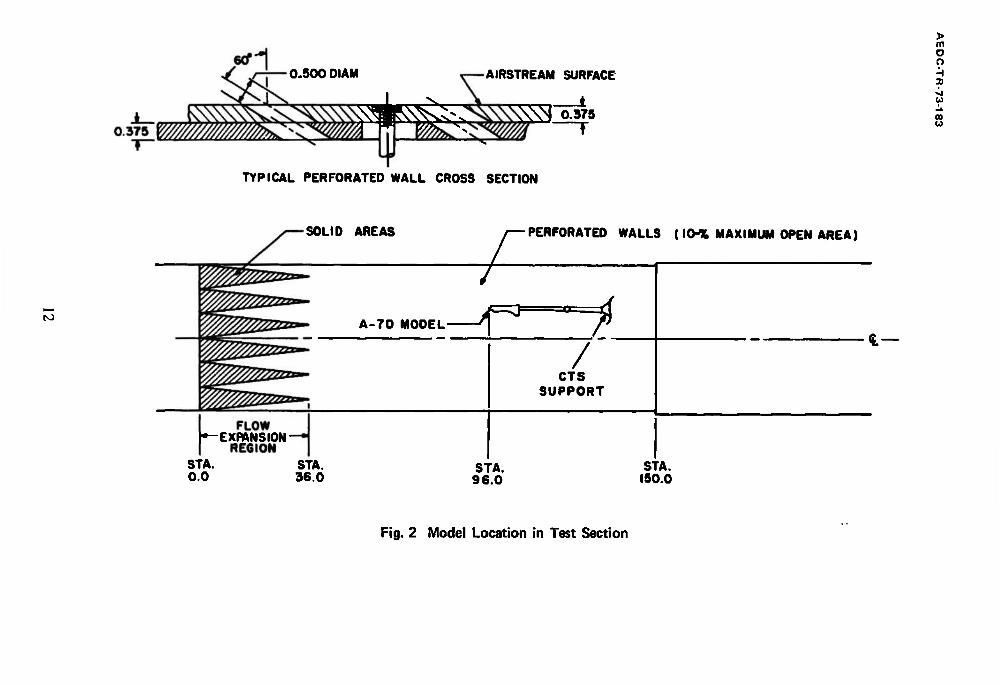
the stagnation pressure can be varied from 300 to 3700 psfa. The stagnation temperature is a function of ambient conditions and for the present test was approximately 90°F. The test section is 4 ft square and 12.5 ft long with perforated, variable porosity walls to permit operation over the Mach number range with a minimum of wall interference.
For the subject pilot test, the aircraft model was supported by the captive trajectory system (CTS) which extends down from the tunnel top wall. Although the CTS is capable of six-degree-of-freedom movement, only the angular pitch and yaw motions are required for generating CADS maneuvers. Maximum angular displacements of ±45 deg in pitch and yaw are provided. An isometric drawing of the model installation is shown in Fig. 1 (Appendix I).
Also shown in Fig. 1 is a block diagram of the computer control loop used during CADS testing. The analog control system and the digital computer work as an integrated unit and, along with required input information, control the model movement during a maneuver. The test section details and the location of the model in the tunnel are shown in Fig. 2.
2.2 TEST ARTICLE
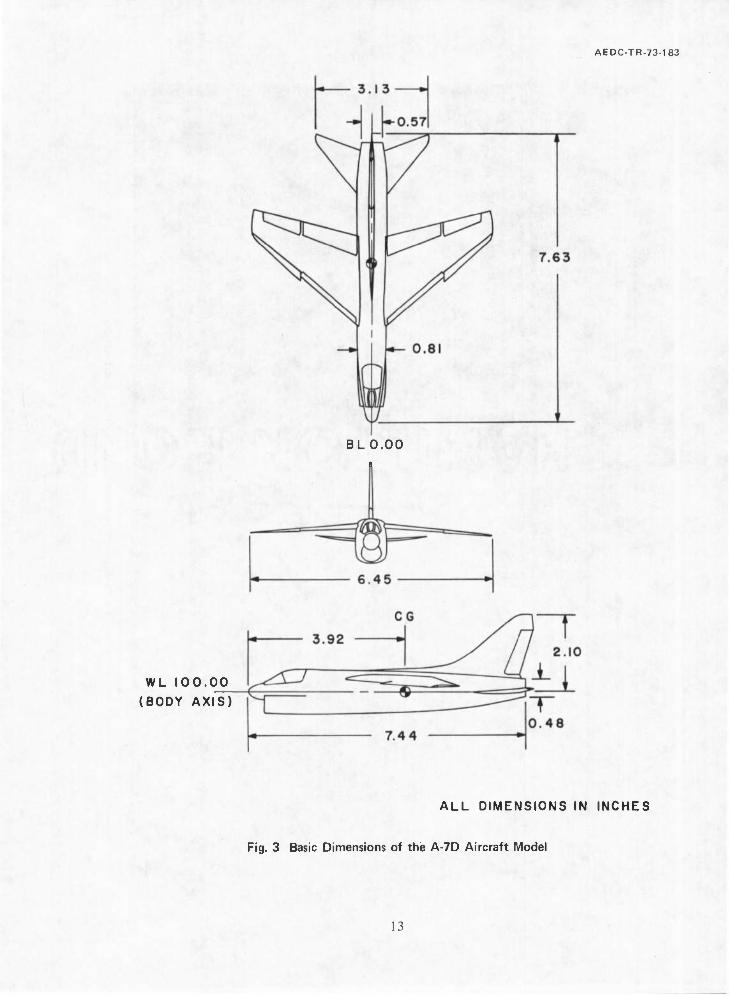
The model used during these tests was a 1/72-scale model of the A-7D aircraft as shown in Fig. 3. Model sizing was governed by structural limitations of the CTS support system and tunnel blockage considerations. Due to the limited model size, remotely operable control surfaces could not be included. However, fixed control surface deflections of -5, -15, and -25 deg for the horizontal stabilizer, 16 deg for the left aileron, -16 deg for the right aileron, and 6 deg for the rudder were incorporated. The aileron and rudder deflections were achieved with wedges of ± 16 and 6 deg, respectively. Wing spoilers were not included as a control option. The wing configuration tested was clean, with no external stores or pylons.
The simulation of engine inlet flow was not incorporated on the subject model. No attempt was made to fair-in the closed inlet. The model rear body was also slightly distorted to accommodate the six-component, internal strain-gage balance. A photograph of the model and CTS support structure is shown in Fig. 4.
2.3 INSTRUMENTATION
A six-component, internal strain-gage balance was used to obtain force and moment data on the aircraft model. Angular positions of the aircraft model were obtained from the CTS analog outputs and fed directly through an analog-to-digital converter into an on-line digital computer. On-line data reduction provided means of monitoring the aircraft motion throughout the course of a maneuver.

AEDC TR-73-183
SECTION III PROCEDURE
3.1 CADS DATA ACQUISITION
CADS testing commenced by manually positioning the aircraft model in the wind tunnel at its trim angle of attack for a prescribed set of flight conditions. After the model was set at the desired initial position, operational control of the pitch and yaw positioning systems was switched to the digital computer which controlled the angular movements during the maneuver through commands to the analog system (see block diagram. Fig. I). The computer would normally be responsible for control surface deflection positioning as a function of flight time: however, as previously stated, fixed control surface deflections were used for the subject test. By interrupting the maneuver it was possible to shut down the tunnel, vary (reset) the control surface deflection, and re-initiate the maneuver at a desired flight time with corresponding linear and angular velocity rates.
For CADS testing, the wind tunnel acts as a function generator for the static aerodynamic forces and moments. These data, along with wind tunnel operating conditions, model physical characteristics (mass, inertia, etc.), dynamic stability derivatives, and model angular positions are input to the on-line digital computer which solves the Euler equations of motion of the vehicle. These computed solutions are used in controlling the orientation of the model. In general, the program involves using the last two successive measured values of each static aerodynamic coefficient to predict the magnitude of the coefficients over the next prediction interval during the maneuver. These predicted values are used to calculate the new attitude (angle of attack and sideslip) of the model at the end of the time interval. The system is then commanded to move the model to these new angular positions and the aerodynamic loads are measured. If these new measurements agree with the predicted values, the process is continued over another time interval of the same magnitude. If the measured and predicted values do not agree within the desired precision, the calculation is repeated over a time interval one-half the previous value. This process is repeated until a complete maneuver has been obtained. With each prediction interval, the aircraft Mach number is calculated and the wind tunnel Mach number adjusted. This results in the aerodynamic coefficients being measured at the correct Mach number throughout the maneuver.
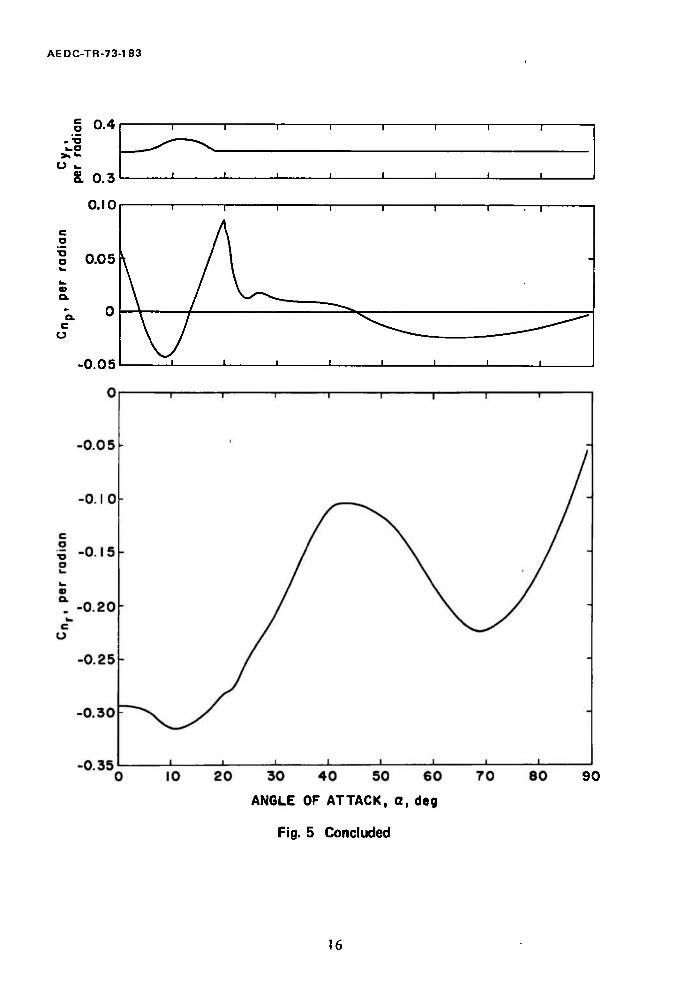
The aircraft dynamic stability derivatives were stored in the computer as functions of model angle of attack. Figure 5 presents values of the A-7D dynamic derivatives utilized in the subject pilot test.
3.2 PRECISION OF DATA
Maneuvers generated utilizing the CADS testing technique are subject to error from several sources including tunnel conditions, balance measurements, extrapolation tolerances allowed in the predicted coefficients, computer inputs, and CTS positioning control.

AEDC-TR-73-183
Maximum error in the CTS position control was ±0.09 deg for angular displacement settings in pitch and yaw. Extrapolation tolerances were ±0.10 for each of the aerodynamic coefficients. The maximum uncertainties in the full-scale position data caused by the balance inaccuracies are given below. The uncertainties in the measured force and moment readings are based on a 95-percent confidence level. The estimated uncertainty in setting Mach number was no greater than ±0.003. The tolerance accepted in maintaining the correct variation in tunnel Mach number throughout the course of a maneuver was never greater than ±0.05.
Uncertainties from Balance Inaccuracies
ji, deg 0, deg a, deg j3, deg
±1.6 ±6.0 ±0.04 ±0.03
SECTION IV RESULTS AND DISCUSSION
4.1 GENERAL
By utilizing the wind tunnel as an aerodynamic data bank, an analytical motion analysis study of an aircraft may be conducted without generation of a full matrix of static aerodynamic force and moment data. The CADS technique is capable of conducting such a study by using the wind tunnel in conjunction with an on-line digital computer with programmed equations of motion. The equations of motion used in the computer program and associated equations of motion are presented in Appendix III.
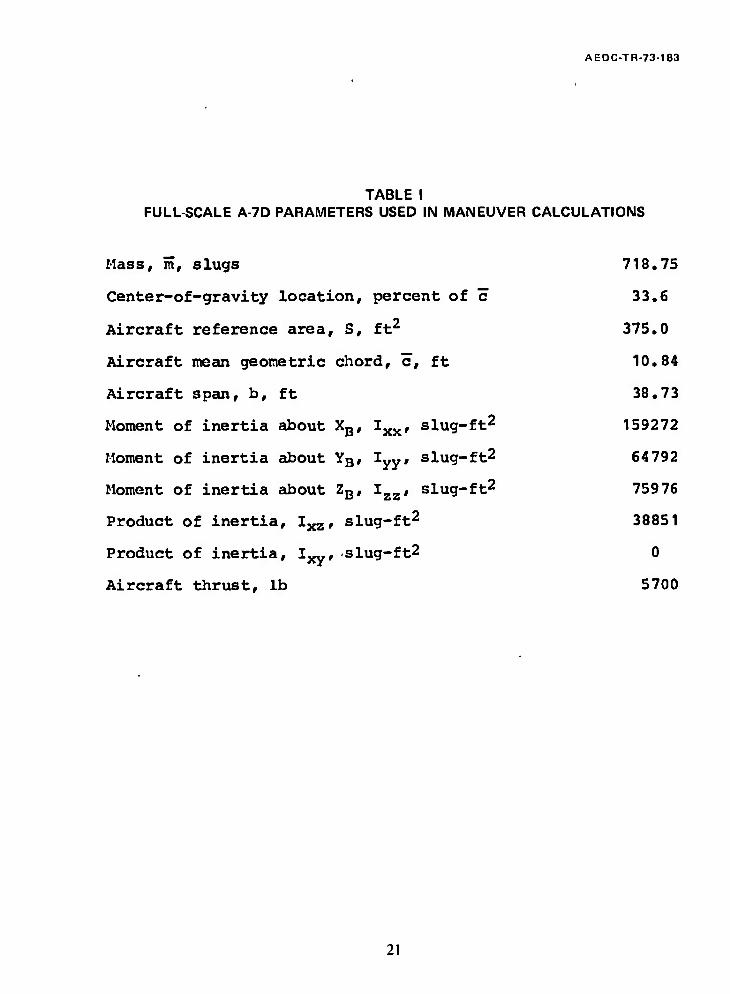
Pertinent full-scale dimensions and mass characteristics of the A-7D aircraft utilized in the motion simulation are given in Table 1 (Appendix II). It should be noted that although provisions for varying aircraft thrust as a function of angle of attack existed, the thrust required to initially trim the aircraft (see Table I) was held constant throughout the maneuver.
Time history data are presented in the Eulerian-axis system in terms of yaw and roll angles and body angular rates. Aircraft angle of attack and angle of sideslip are also included. These parameters are presented as functions of real time from the aircraft initial trim position. Angular motion in the longitudinal plane is omitted since departure rarely occurs in this plane.
The maneuvers were terminated when the CTS exceeded its physical travel limits in pitch and yaw direction. All maneuvers were initiated at a Mach number of 0.5. Through the course of the maneuver, tunnel Mach number was varied with acceleration and deceleration of the simulated aircraft. The Mach number variation was accomplished with no delay in data acquisition. Due to the short time history generated with the accelerated stall-type maneuvers, the Mach number "bleed-off" (less than 0.10), as a function of time, was minimal; therefore, Mach number variations were not included in the plots.
AEDC-TR-73-183
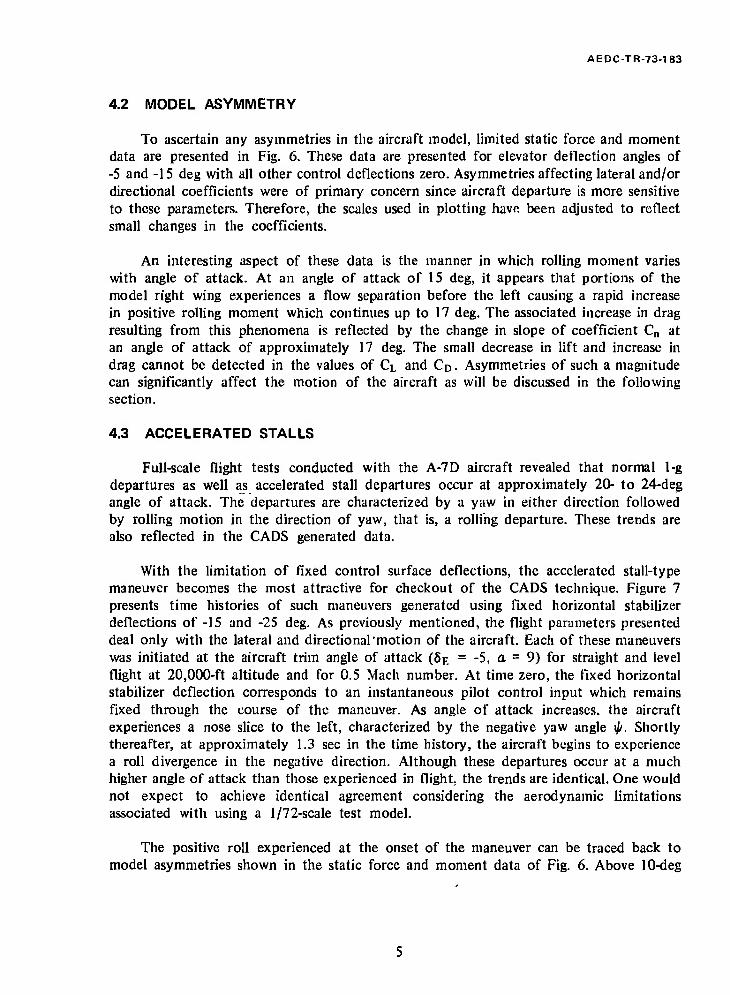
4.2 MODEL ASYMMETRY
To ascertain any asymmetries in the aircraft model, limited static force and moment data are presented in Fig. 6. These data are presented for elevator deflection angles of -5 and -15 deg with all other control deflections zero. Asymmetries affecting lateral and/or directional coefficients were of primary concern since aircraft departure is more sensitive to these parameters. Therefore, the scales used in plotting have been adjusted to reflect small changes in the coefficients.
An interesting aspect of these data is the manner in which rolling moment varies with angle of attack. At an angle of attack of 15 deg, it appears that portions of the model right wing experiences a flow separation before the left causing a rapid increase in positive rolling moment which continues up to 17 deg. The associated increase in drag resulting from this phenomena is reflected by the change in slope of coefficient Cn at an angle of attack of approximately 17 deg. The small decrease in lift and increase in drag cannot be detected in the values of CL and CD . Asymmetries of such a magnitude can significantly affect the motion of the aircraft as will be discussed in the following section.
4.3 ACCELERATED STALLS
Full-scale flight tests conducted with the A-7D aircraft revealed that normal 1-g departures as well as accelerated stall departures occur at approximately 20- to 24-deg angle of attack. The departures are characterized by a yaw in either direction followed by rolling motion in the direction of yaw, that is, a rolling departure. These trends are also reflected in the CADS generated data.
With the limitation of fixed control surface deflections, the accelerated stall-type maneuver becomes the most attractive for checkout of the CADS technique. Figure 7 presents time histories of such maneuvers generated using fixed horizontal stabilizer deflections of -J5 and -25 deg. As previously mentioned, the flight parameters presented deal only with the lateral and directional'motion of the aircraft. Each of these maneuvers was initiated at the aircraft trim angle of attack (6p, = -5, a = 9) for straight and level flight at 20,000-ft altitude and for 0.5 Mach number. At time zero, the fixed horizontal stabilizer deflection corresponds to an instantaneous pilot control input which remains fixed through the course of the maneuver. As angle of attack increases, the aircraft experiences a nose slice to the left, characterized by the negative yaw angle i//. Shortly thereafter, at approximately 1.3 sec in the time history, the aircraft begins to experience a roll divergence in the negative direction. Although these departures occur at a much higher angle of attack than those experienced in flight, the trends are identical. One would not expect to achieve identical agreement considering the aerodynamic limitations associated with using a 1/72-scale test model.
The positive roll experienced at the onset of the maneuver can be traced back to model asymmetries shown in the static force and moment data of Fig. 6. Above 10-deg

AEDC-TR-73-183
angle of attack, the model possesses an inherent positive rolling moment resulting in the roll motion experienced in the first second of simulated flight.
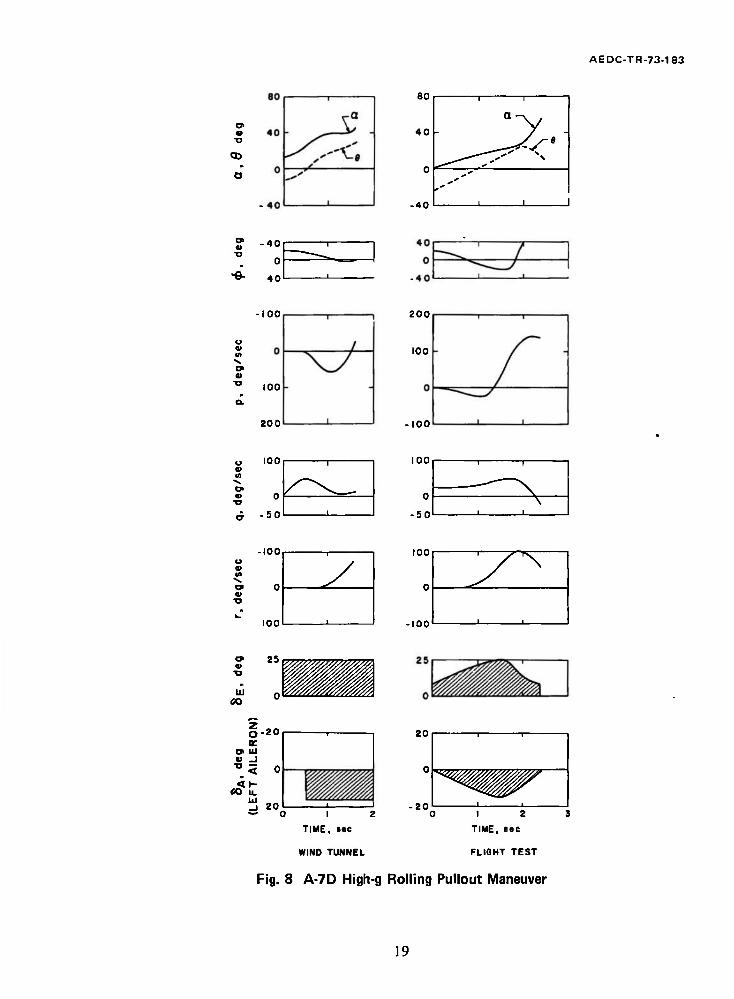
An additional check on the CADS motion was performed by generating time history of an accelerated departure following a high-g rolling pullout. Figure 8 presents these data along with flight test data of a similar A-7D maneuver. Note that the initial bank angle of each maneuver is of equal magnitude but of opposite sign. Because of this, the plots for the CADS generated lateral and directional parameters have been inverted to aid in the comparison with the flight test data. The Euler yaw angle is omitted for lack of flight test data. Again, the departure trends as indicated by flight test and CADS data acquisition are similar, both experiencing a yaw divergence followed by rolling motion in the direction of the yaw.
Elevator and aileron deflection schedules are included in Fig. 8. The fixed aileron deflection occurring at approximately 0.5-sec flight time in the CADS-generated maneuver was accomplished using the maneuver interruption technique described in Section 3.1.
To further check out the maneuver interruption technique, an accelerated stall-type maneuver was interrupted near aircraft departure for the application of antideparture control surface deflections as shown in Fig. 9. The basic maneuver presented is an accelerated stall resulting from a fixed horizontal stabilizer setting of -15 deg. Aircraft departure occurs at approximately 1.2 sec in the flight, characterized by an abrupt nose slice to the left. At 1.2 sec, the maneuver was interrupted and antideparture controls installed (applied), elevator to trim position (-5 deg), and rudder against yaw divergence (6 deg). The maneuver was re-initiated at 1.2-sec flight time with the resulting motion shown. The abrupt nose slice was arrested with the control deflections, but the rolling divergence continued. Judging from flight test data previously acquired on the A-7D, any attempt to arrest the rolling departure with aileron deflections would be futile.
Additional maneuver interruptions at flight times of 0.96 and 1.44 sec further verify feasibility of the maneuver interruption technique.
Initial CADS maneuvers required approximately 15 min of tunnel test time for generating 1 sec of flight time. By increasing the time interval over which aerodynamic coefficients were predicted (point prediction interval), data acquisition improved to 4 min of tunnel test time for 1 sec of flight time. Because tunnel Mach number was adjusted with each prediction interval, the Mach number "bleed-off" between the larger intervals increased. A point was reached (point prediction interval of 0.08 sec) such that time saved with a larger prediction interval was overshadowed by time required for readjusting tunnel Mach number.
AEDC TR-73-183
SECTION V SUMMARY OF RESULTS
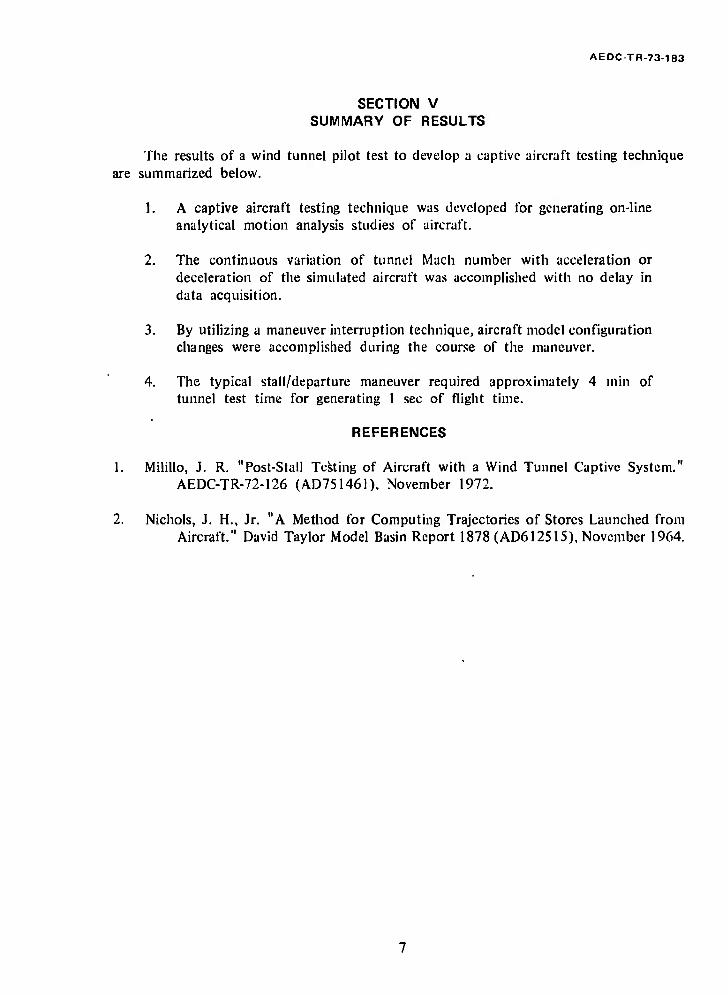
The results of a wind tunnel pilot test to develop a captive aircraft testing technique are summarized below.
1. A captive aircraft testing technique was developed for generating on-line analytical motion analysis studies of aircraft.
2. The continuous variation of tunnel Mach number with acceleration or deceleration of the simulated aircraft was accomplished with no delay in data acquisition.
3. By utilizing a maneuver interruption technique, aircraft model configuration changes were accomplished during the course of the maneuver.
4. The typical stall/departure maneuver required approximately 4 min of tunnel test time for generating 1 sec of flight time.
REFERENCES
1. Milillo, J. R. "Post-Stall Testing of Aircraft with a Wind Tunnel Captive System." AEDC-TR-72-126 (AD751461). November 1972.
2. Nichols, J. H., Jr. "A Method for Computing Trajectories of Stores Launched from Aircraft." David Taylor Model Basin Report 1878 (AD612515), November 1964.

AEDC TR-73-183
APPENDIXES I. ILLUSTRATIONS
II. TABLE III. EQUATIONS OF MOTION

COMPONENTS LOCATED INSIDE TUNNEL
MANUAL IMPUTS
• CONTROLLER
a, ß, CONTROL DEFLECTION POSITIONING SYSTEM
FEEDBACK POSITION INDICATOR
I
A/C MODEL and
BALANCE
DIGITAL-TO- ANALOG
CONVERTER
COMPUTER A/C EQS. OF
MOTION
A
;:: STATIC AERODYNAMIC — FORCES and MOMENTS
ANALOG-TO- DIGITAL
CONVERTER
INPUT PARAMETERS
1. A/C DYNAMIC CHARACTERISTICS 2. A/C THRUST CHARACTERISTICS 3. CONTROL DEFLECTION SCHEDULE
Fig. 1 Isometric Drawing of a CADS Installation and a Block Diagram of the Computer Control Loop
> m a o ■H 30
w
03 u
0.500 OIAM AIRSTREAM SURFACE
pfcfe ^JiH»
> m a n ■H 3D
GJ
00 U
TYPICAL PERFORATED WALL CROSS SECTION
to
SOLID AREAS
A-7D MODEL-
FLOW |—EXPANSION
REGION STA. STA. 0.0 36.0
PERFORATED WALLS (IO* MAXIMUM OPEN AREA)
-~=f> /
CTS SUPPORT
%.—
STA. 96.0
STA. 150.0
Fig. 2 Model Location in Test Section
AEDC-TR-73 183
BL0.00
WL I00.00
(BODY AXIS)
ALL DIMENSIONS IN INCHES
Fig. 3 Basic Dimensions of the A-7D Aircraft Model
13

> m O O
oo CO
Fig. 4 Photograph of the CADS Model Installation

AEDC-TR-73-183
2.0
a 0 10 20 30 40 50 60 70 80 90 ANGLE OF ATTACK, a, deg
Fig. 5 A-7D Dynamic Stability Derivatives
15
AEDC-TR-73-183
0.4
k-O
o & 0.3
0.10
0.05
o
-0.05
20 30 40 50 60
ANGLE OF ATTACK, a, deg
Fig. 5 Concluded
90
16

8E» de9 o - 5 □ -15
AEDC-TR-73-183
0.2
0.01
Cn 0
-0.01
x^^xv, "^-6—S—°*
0 10 20 30 40 50 ANGLE OF ATTACK, a, dag
Fig. 6 A-7D Static Aerodynamic Coefficients, ß = 0, IVL = 0.50
17

AEDC-TR-73-183
8E. dea
o - 15
A -25
« ■o
a 20
oa.
9
-20 -
-40
-40
o. •aü**V ; ' \\
-40 " H -60
i i i i
o
-40
.... ' ' '
^W*w^^
-80 V 1 1 1 1
40
o
- i -40 -
-80
Fig. 7 A-7D Accelerated Stall Maneuvers
18
AEDC-TR-73-183
w ■a
CD
a
eo
40
-40
1
a - 1
^f^"^ ** ̂ Zr9'
1
a> -40
0
40
-100
in
a» a>
100
200
ZOO
100
100
u ■n
100
-50
100
0
-50
u a> ■a
a>
-too
100
100
-IO0
""N
9 25 «I T3
LÜ «3
m
O-20 K
D> UJ a> _i
.< ° «O li.
_j 20 — 0 I 2
TIME, tec
20
•20 I 2
TIME, sec
WIND TUNNEL FLIGHT TEST
Fig. 8 A-7D High-g Rolling Pullout Maneuver
19

AEDC-TR-73-183
O
a
ELEVATOR OEF (deg)
-15 - 5 - 5 - 5
RUDDER DEF (deg)
0 6 6 6
TIME APPLIED INPUT (sec)
0 0.96 1.20 1.44
0>
«1-20
■80 1.0 2.0 3.0 4.0 5.0
TIME, sac
120 1.0 2.0 3.0 4.0 5.0
TIME, sec
Fig. 9 Evaluation of Maneuver Interruption Technique
20
AEDC-TR-73-183
TABLE I FULL-SCALE A-7D PARAMETERS USED IN MANEUVER CALCULATIONS
Mass, m, slugs 718.75
Center-of-gravity location, percent of c 33.6
Aircraft reference area, S, ft2 375.0
Aircraft mean geometric chord, c, ft 10.84
Aircraft span, b, ft 38.73
Moment of inertia about XD, Ixx, slug-ft2 159272
Moment of inertia about YB, Iyy, slug-ft2 64792
Moment of inertia about ZB, Izz, slug-ft2 75976
Product of inertia, Ix2, slug-ft2 38851
Product of inertia, Ixy, slug-ft2 0
Aircraft thrust, lb 5700
21
AEDC TR-73-183
APPENDIX III EQUATIONS OF MOTION
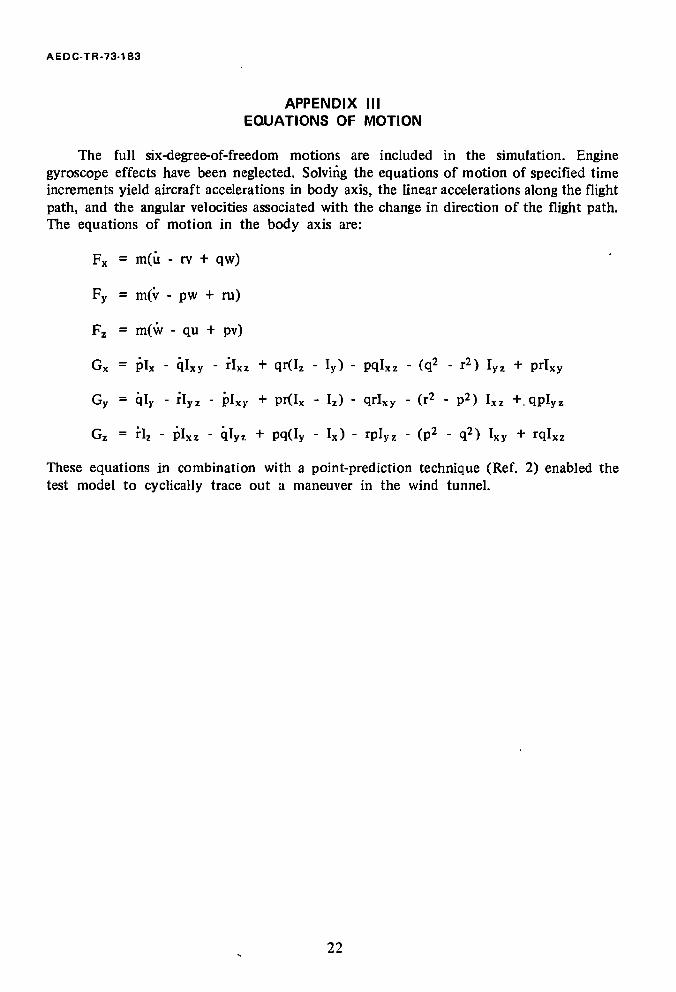
The full six-degree-of-freedom motions are included in the simulation. Engine gyroscope effects have been neglected. Solving the equations of motion of specified time increments yield aircraft accelerations in body axis, the linear accelerations along the flight path, and the angular velocities associated with the change in direction of the flight path. The equations of motion in the body axis are:
Fx = m(u - rv + qw)
Fy = m(v - pw + ru)
Fz = m(w - qu + pv)
Gx = plx - qlxy - rlxz + qr(Iz - Iy) - pqlxz - (q2 - r2) Iyz + prlxy
Gy = qly - rlyz - plxy + pr(Ix - Iz) - qrlxy - (r2 - p2) Ixz +.qplyz
Gz = rlz - plxz - qTy7 + pq(Iy - Ix) - rplyz - (p2 - q2) Ixy + rqlxz
These equations in combination with a point-prediction technique (Ref. 2) enabled the test model to cyclically trace out a maneuver in the wind tunnel.
22
UNCLASSIFIED Security Classification
DOCUMENT CONTROL DATA -R&D (Security classification of title, body of abatracI and indexing annotation must be entered when the overall report la classified)
1 ORIGINATING ACTIVITY fCorpo
Arnold Engineering Development Center Arnold Air Force Station, Tennessee 37389
2*9. REPORT SECURITY CLASSIFICATION
UNCLASSIFIED 2b GROUP
N/A 3 REPORT TITLE
EVALUATION OF A WIND TUNNEL TECHNIQUE TO DETERMINE AIRCRAFT DEPARTURE CHARACTERISTICS
4 DESCRIPTIVE NOTES (Typo o( report and Inclusive dates)
Final Report - February 2 to May 18, 1973 9 AUTHORlSl (Firsi name, middle initial, last nemo)
R„ W. Butler, ARO, Inc.
O REPORT DA TE
March 1974 7a. TOTAL NO OF PAGES
30 7b. NO OF REPS
8a. CONTRACT OR GRANT NO
b. PROJECT NO
9«. ORIGINATOR'S REPORT NUMBER(Sj
AEDC-TR-73-183
c Program Element 65802F 9b. OTHER REPORT NO.5} (Any other numbers that may be assigned this report)
ARO-PWT-TR-73-121 10 DISTRIBUTION STATEMENT
Approved for public release; distribution unlimited.
II SUPPLEMENTARY NOTES
Available in DDC
12 SPONSORING MILITARY ACTIVITY
Arnold Engineering Development Center, Air Force Systems Command \rnold Air Force Station, TN 37389
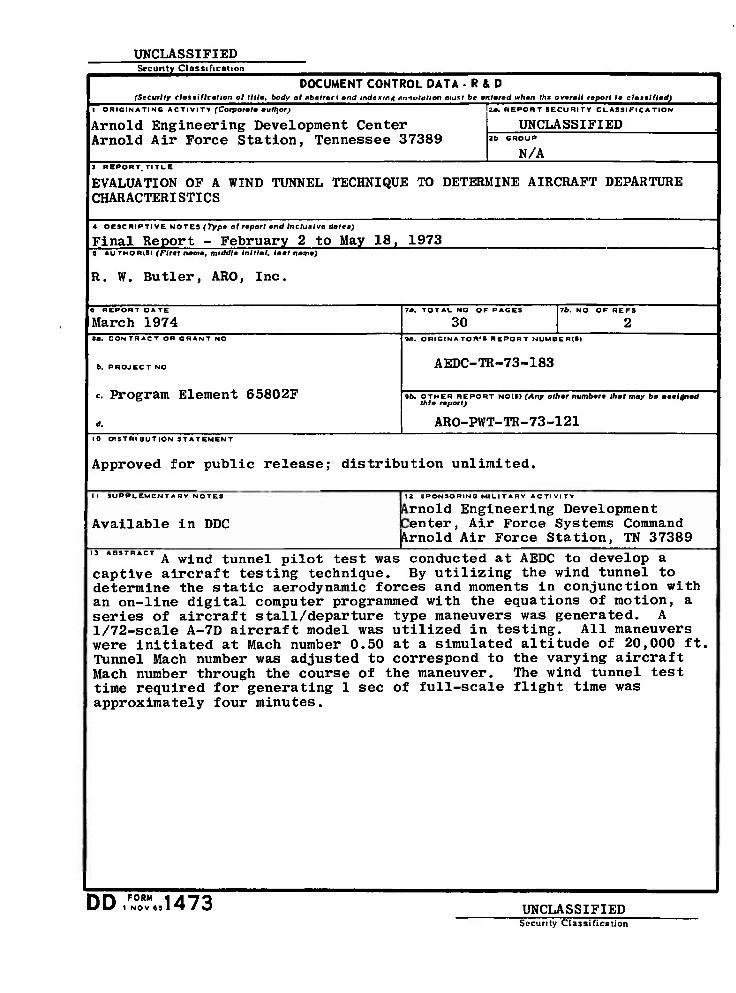
13 ABSTRACT A wind tunnel pilot test was conducted at AEDC to develop a
captive aircraft testing technique. By utilizing the wind tunnel to determine the static aerodynamic forces and moments in conjunction with an on-line digital computer programmed with the equations of motion, a series of aircraft stall/departure type maneuvers was generated. A 1/72-scale A-7D aircraft model was utilized in testing. All maneuvers were initiated at Mach number 0.50 at a simulated altitude of 20,000 ft. Tunnel Mach number was adjusted to correspond to the varying aircraft Mach number through the course of the maneuver. The wind tunnel test time required for generating 1 sec of full-scale flight time was approximately four minutes.
DD FORM 1473 UNCLASSIFIED Security Classification
UNCLASSIFIED Security Classification
KEY WORD!
evaluation
wind tunnel
technique
identifying
aircraft
characteristics (departure)
Mach numbers
aerodynamic forces
UNCLASSIFIED Security Classification