EVALUATION AND ANALYSIS OF IMPACT OF SUBSIDIES ON … · EVALUATION AND ANALYSIS OF IMPACT OF...
114
EVALUATION AND ANALYSIS OF IMPACT OF SUBSIDIES ON SMALL SCALE RENEWABLE ENERGY TECHNOLOGIES DISSEMINATION: A CASE STUDY OF NEPAL Murdoch University School of Engineering and Energy Project report submitted in the partial fulfilment of the requirements for the completion of Master’s Degree Dissertation By: Rojan Kumar Pandey 30901781 Under the supervision of Dr. Trevor Pryor Dr. August Schlaepfer November 2011
Transcript of EVALUATION AND ANALYSIS OF IMPACT OF SUBSIDIES ON … · EVALUATION AND ANALYSIS OF IMPACT OF...

EVALUATION AND ANALYSIS OF IMPACT OF SUBSIDIES ON SMALL SCALE
RENEWABLE ENERGY TECHNOLOGIES DISSEMINATION: A CASE STUDY OF
NEPAL
Murdoch University
School of Engineering and Energy
Project report submitted in the partial fulfilment of the requirements for the completion of
Master’s Degree Dissertation
By:
Rojan Kumar Pandey
30901781
Under the supervision of
Dr. Trevor Pryor
Dr. August Schlaepfer
November 2011

ii
Murdoch University
School of Engineering and Energy
November 2011
Student
Rojan Kumar Pandey
Supervisors
Dr. Trevor Pryor Dr. August Schlaepfer
Date: 21 November 2011

iii
Declaration
This work is being submitted in partial fulfilment of the requirements for the degree of
Master of Science in Renewable Energy and has not previously been accepted in substance
for any degree and is not being concurrently submitted in candidature for any degree.
Statement
I, Rojan Kumar Pandey, declare that this dissertation is the result of my own work and
investigations, except where otherwise stated. Other sources are acknowledged by giving
explicit references. A bibliography is appended.
Signed......................................................................
(Rojan Kumar Pandey)
Date..........................................................................

iv
Abstract
The report has analysed the status of rural electrification using renewable energy technologies
(RETs) and the current subsidy delivery modality of RETs in Nepal. As the Government of
Nepal is subsidizing small scale renewable energy projects, it is important to evaluate and
analyse the programme to make sure that a programme is running in an effective and efficient
way while reaching the target group.
During the course of the research, primary information collected from the field has been
compiled using appropriate tools/software (such as MS Office) and analyzed. Different sets
of questionnaires were prepared, targeting different personnel ranging from the users’ level to
the government policy level. The field survey methods include field observations of RETs
installations and operations along with interviews with selected users on a random sampling
basis to identify barriers to subsidy delivery and possible measures to overcome these
barriers; to determine user satisfaction level and time period for subsidy delivery
mechanisms.
The report started with the country background information and the rationale behind the
study. This is followed by the literature review and information on the current status of small
scale RETs in the country. Next it deals with the organizational structure and current subsidy
delivery modality of RETs in the country. The evaluation of the effectiveness of the subsidy
with the current subsidy delivery modality has been analyzed based on six parameters;
Targets and Achievements, Impact of RETs, Subsidy Delivery System Efficiency,
Transparency, Sustainability and Effectiveness.
The research shows that the subsidized government program has been successful in achieving
its goal to provide basic energy services in rural areas through RETs in terms of its
quantitative target. Although the subsidized program is successful in electrifying the rural
communities via RETs, the poorest of the poor families are still excluded from the subsidy.
The program seems to benefit more the rich and upper middle class families rather than the
poor families for which the subsidy was intended. The high capital cost and long subsidy
delivery process are the main important reasons for this failure. The author has proposed a
new modality which might overcome the time barriers and bureaucratic process in the
subsidy delivery mechanism and will decrease the lead time. This will in turn help to reduce

v
the operational cost of the private companies and will encourage more players to enter the
market, increase competition and result in lower system costs.
After identifying gaps in the current subsidy delivery modality, the project report ends with
the recommendation of a new modality improving the current modality and filling the gaps
identified. As this study has some limitations, as described in chapter one, the scope of
further works has been listed at the end.
vi
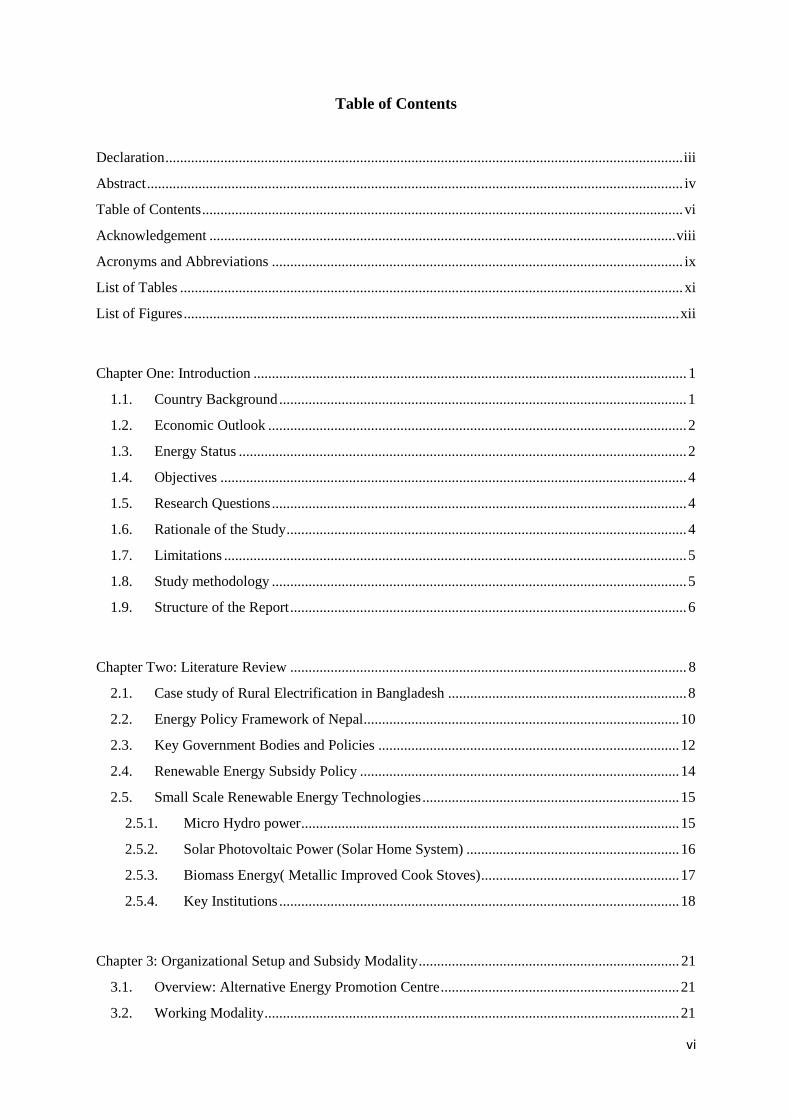
Table of Contents
Declaration ............................................................................................................................................. iii
Abstract .................................................................................................................................................. iv
Table of Contents ................................................................................................................................... vi
Acknowledgement ............................................................................................................................... viii
Acronyms and Abbreviations ................................................................................................................ ix
List of Tables ......................................................................................................................................... xi
List of Figures ....................................................................................................................................... xii
Chapter One: Introduction ...................................................................................................................... 1
1.1. Country Background ............................................................................................................... 1
1.2. Economic Outlook .................................................................................................................. 2
1.3. Energy Status .......................................................................................................................... 2
1.4. Objectives ............................................................................................................................... 4
1.5. Research Questions ................................................................................................................. 4
1.6. Rationale of the Study ............................................................................................................. 4
1.7. Limitations .............................................................................................................................. 5
1.8. Study methodology ................................................................................................................. 5
1.9. Structure of the Report ............................................................................................................ 6
Chapter Two: Literature Review ............................................................................................................ 8
2.1. Case study of Rural Electrification in Bangladesh ................................................................. 8
2.2. Energy Policy Framework of Nepal ...................................................................................... 10
2.3. Key Government Bodies and Policies .................................................................................. 12
2.4. Renewable Energy Subsidy Policy ....................................................................................... 14
2.5. Small Scale Renewable Energy Technologies ...................................................................... 15
2.5.1. Micro Hydro power ....................................................................................................... 15
2.5.2. Solar Photovoltaic Power (Solar Home System) .......................................................... 16
2.5.3. Biomass Energy( Metallic Improved Cook Stoves) ...................................................... 17
2.5.4. Key Institutions ............................................................................................................. 18
Chapter 3: Organizational Setup and Subsidy Modality ....................................................................... 21
3.1. Overview: Alternative Energy Promotion Centre ................................................................. 21
3.2. Working Modality ................................................................................................................. 21

vii
3.3. Programs and Activities ........................................................................................................ 22
3.4. Energy Sector Assistance Program ....................................................................................... 25
3.4.1. Background ................................................................................................................... 25
3.4.2. Objectives ..................................................................................................................... 26
3.4.3. Strategy ......................................................................................................................... 26
3.4.4. Programmes and Components ...................................................................................... 27
3.4.5. Programme Implementation Modality .......................................................................... 28
3.4.6. Metallic Stove Subsidy Delivery Modality ................................................................... 29
Chapter Four: Survey Details................................................................................................................ 33
4.1. Design of Survey Questionnaire ........................................................................................... 33
Chapter Five: Analysis of an effectiveness of the subsidy programme ............................................... 44
5.1. Targets Vs Achievements ..................................................................................................... 44
5.2. Impact of RETs ..................................................................................................................... 50
5.3. Subsidy Delivery System Efficiency .................................................................................... 52
5.4. Transparency ......................................................................................................................... 57
5.5. Sustainability ......................................................................................................................... 59
5.6. Effectiveness ......................................................................................................................... 62
Chapter Six: Conclusion and Recommendation ................................................................................... 68
6.1. Conclusion and Recommendation ........................................................................................ 68
6.2. Further Research ................................................................................................................... 76
References ............................................................................................................................................. 78
Appendix ............................................................................................................................................... 82
I. Survey Questionnaire ................................................................................................................ 82
II. Subsidy on Micro Hydropower ............................................................................................. 95
III. Subsidy for Solar Technology............................................................................................... 96
IV. Subsidy for Improved Cooking Stoves ................................................................................. 98
V. Subsidy Delivery Mechanism for Micro Hydro ........................................................................ 99
VI. Subsidy Delivery Mechanism for Solar Home System ....................................................... 100
VII. Administrative Map of Nepal ............................................................................................. 101

viii
Acknowledgement
I would like to express my sincere gratitude to Dr. Trevor Pryor, Academic Chair of Energy
Studies, School of Engineering and Energy of Murdoch University for providing me an
opportunity to do my project work on “"Evaluation and Analysis of Impact of Subsidies on
Small Scale Renewable Energy Technologies Dissemination: A Case Study of Nepal” . I am
greatly indebted to Dr. Pryor for his constant guidance and support as one of my supervisor
of the project.
I sincerely thank to my main project supervisor Dr. August Schläpfer (adjunct faculty
member of "Energy studies" programme of Murdoch University and now Director of Energy
and Environmental Management in Developing Countries, University of Flensburg,
Germany) for his guidance and encouragement in carrying out this project work.
I would like to thank Mr. Madhusudan Adhikari, Manager of Solar Energy Support
Programme of Energy Sector Assistance Programme (ESAP) for his advice and suggestion in
the project.
My special thanks to Mr. Niels Juhl Thomsen, Chief Advisor of ESAP for giving me
permission to do the project works in ESAP by allowing me to use the available information
and resources
I also wish to express my gratitude to the officials and all other staff members of Alternative
Energy Promotion Centre and Energy Sector Assistance Programme. I would like to
acknowledge all staffs of Regional Renewable Energy Service Centres (RRESCs) for helping
me in field survey and data collection for the project. I wish to name Mr. Gokul Gautam, Mr.
Satish Aryal, Mr. Rajeev Man Shrestha, Mr. Rajan Acharya, Mr Pradip Gyawali, Mr. Pawan
Acharya in particular for their support and cooperation.
I would like to acknowledge specially my beloved family and my fiancée Sangita Bista for
her support and encouragement throughout the project period.
Last but not least I wish to express my sincere gratitude to my sister Ms. Kusum Rajbhandari
and family and my friends for their support and strength throughout the period.

ix
Acronyms and Abbreviations
ADB Asian Development Bank
AEPB Alternative Energy Promotion Development Board
AEPC Alternative Energy Promotion Centre
BESP Biogas Energy Support Programme
BSP Biogas Support Programme
CBO Community Based Organisation
CBS Central Bureau of Statistics
CEN Clean Energy Network
CRE Centre for Renewable Energy
CRT/N Centre for Rural Technology, Nepal
CTEVT Council for Technical Education & Vocational Training
DANIDA Danish International Development Assistance
DDC District Development Committee
DEEU District Energy and Environment Unit
DEES District Energy and Environment Section
DKK Danish Kroner
ESAP Energy Sector Assistance Programme
EU European Commission
FYP Five-Year Plan
GJ Gigajoule
GoN Government of Nepal
GPS Geographical Positioning System
GTZ German Technology Co-operation
HH Household
kg Kilogram
kW kilowatt
ICIMOD International Centre for Integrated Mountain Development
ICS Improved Cooking Stove
INGO International Non Governmental Organisation
IPP Individual Power Producers
IUCN International Union for Conservation of Nature
IWM Improved Water Mill

x
KfW Kreditanstalt für Wiederaufbau (Development Bank of Germany)
MGRE Mini-Grid Rural Electrification
MGSP Mini Grid Support Programme
MHP Micro Hydro Power
MIS Management Information System
MoLD Ministry of Local Development
MoAC Ministry of Agriculture and Cooperative
MoF Ministry of Finance
MoE Ministry of Environment
MoWR Ministry of Water Resources
NEA Nepal Electricity Authority
NGO Non Governmental Organisation
NMHDA Nepal Micro-Hydro Developers’ Association
NOC Nepal Oil Corporation
NPC National Planning Commission
NPR Nepalese Rupees
PV Photovoltaic
RE Rural-Renewable Energy
REDP Rural Energy Development Programme
REF Rural Energy Fund
RESC Renewable Energy Service Contractors
RET Rural Energy Technology
RETS Renewable Energy Test Station
RRESC Regional Renewable Energy Service Centre
SC Steering Committee
SE Solar Energy
SEMAN Solar Electric Manufacturers’ Association Nepal
SHS Solar Home System
SIDA Swedish International Development Assistance
SNV-N Netherlands Development Organisation Nepal
UNDP United Nation Development Programme
VDC Village Development Committee
WB The World Bank
WECS Water and Energy Commission Secretariat

xi
List of Tables
Table 1: AEPC Programs and Activities ............................................................................................... 23
Table 2: ESAP Phase I Timeline........................................................................................................... 26
Table 3: ESAP Phase II Activities ........................................................................................................ 27
Table 4: Basic Family Information ....................................................................................................... 33
Table 5: Types and uses of Fuel............................................................................................................ 34
Table 6: Getting Fuel wood .................................................................................................................. 35
Table 7: Energy resources in hotel/business ......................................................................................... 36
Table 8: Improved Cook Stove ............................................................................................................. 37
Table 9: Solar PV and Hydropower technologies ................................................................................. 38
Table 10: Manufactures’ Detail ............................................................................................................ 40
Table 11: Validation of Survey Questionnaire ..................................................................................... 42
Table 12: ESAP 1 Status ....................................................................................................................... 45
Table 13: ESAP 2 Status as of November 2010 ................................................................................... 46
Table 14: Impact of RETs ..................................................................................................................... 51
Table 15: Subsidy Delivery Processing Time for Metallic Stoves ....................................................... 54
Table 16: Subsidy Delivery Processing Time for SHS ......................................................................... 56
Table 17: Subsidy Delivery Processing Time for MHP........................................................................ 56
Table 18: System with/without subsidy ................................................................................................ 59
Table 19: Change in Material Price of Metallic Stoves over the years ................................................. 65
Table 20: Subsidy Vs User's contribution change over the time .......................................................... 66
Table 21: Roles and Responsibilities in new modality ......................................................................... 72
Table 22: Subsidy Delivery Mechanism ............................................................................................... 75

xii
List of Figures
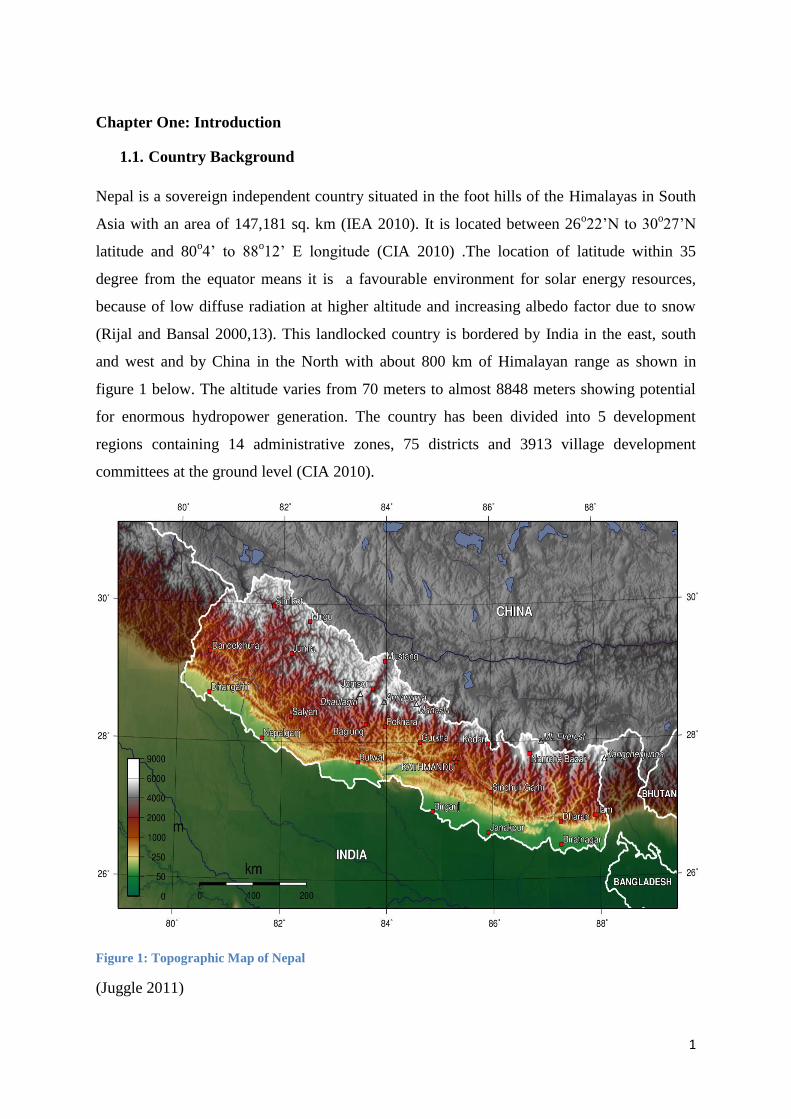
Figure 1: Topographic Map of Nepal ..................................................................................................... 1
Figure 2: Installation of Solar Home System in Bangladesh ................................................................ 10
Figure 3: Institutional Setup .................................................................................................................. 11
Figure 4: Timeline of Policy Initiatives ................................................................................................ 12
Figure 5: Network of River in Nepal .................................................................................................... 15
Figure 6: Annual Solar Irradiation at latitude angle.............................................................................. 17
Figure 7: Types of ICS being promoted ................................................................................................ 18
Figure 8: AEPC Implementation Modality ........................................................................................... 21
Figure 9: ESAP Implementation Modality ........................................................................................... 28
Figure 10: Status of BESP/ESAP Phase II as of November 2010 ........................................................ 47
Figure 11: Solar Home System Installation Trend ................................................................................ 49
Figure 12: Micro Hydro Power Installation Trend ............................................................................... 50
Figure 13: Education Level of Respondents ......................................................................................... 52
Figure 14: National identification Card Verification ............................................................................ 58
Figure 15: subsidy Receiver with Monitoring Group ........................................................................... 58
Figure 16: Market continuity in Absence of the Subsidy ..................................................................... 61
Figure 17: After Sales Service Visit in case of SHS ............................................................................. 62
Figure 18: Investment Vs subsidy in SHS ............................................................................................ 63
Figure 19: Investment Vs subsidy in MHP ........................................................................................... 64
Figure 20: Subsidy as a percentage of total investment ........................................................................ 64
Figure 21: Per kW cost at Users' End ................................................................................................... 67
Figure 22: New Working modality incorporating Renewable Energy Service Contractors ................. 70
Figure 23: Administrative Map of Nepal ............................................................................................ 101
1
Chapter One: Introduction
1.1. Country Background
Nepal is a sovereign independent country situated in the foot hills of the Himalayas in South
Asia with an area of 147,181 sq. km (IEA 2010). It is located between 26o22’N to 30
o27’N
latitude and 80o4’ to 88
o12’ E longitude (CIA 2010) .The location of latitude within 35
degree from the equator means it is a favourable environment for solar energy resources,
because of low diffuse radiation at higher altitude and increasing albedo factor due to snow
(Rijal and Bansal 2000,13). This landlocked country is bordered by India in the east, south
and west and by China in the North with about 800 km of Himalayan range as shown in
figure 1 below. The altitude varies from 70 meters to almost 8848 meters showing potential
for enormous hydropower generation. The country has been divided into 5 development
regions containing 14 administrative zones, 75 districts and 3913 village development
committees at the ground level (CIA 2010).
Figure 1: Topographic Map of Nepal
(Juggle 2011)

2
1.2. Economic Outlook
The small landlocked country has a population of around 29 million (Nepal CBS 2011) where
almost 35% of the population are under the national poverty line defined as US $160 per day
(ABD 2011, 165). The same report stated in FY2010, GDP growth rate is around 4% whereas
the inflation rate is 10%. As per the data of FY2009 provided by Finance Ministry,
Government of Nepal, GDP per capita of the country is just US$470 (Nepal Ministry of
Finance 2011). In 2008, the electricity consumption per capita was around 90kWh, which is
just about 1% of Australia’s per capita electricity consumption (IEA 2010).
1.3. Energy Status
More than 80% of the country’s population live in rural areas and are meeting their energy
needs from traditional resources (87%), such as fuel wood, agricultural residue, cattle dung
etc (WECS 2011, 12). Energy supply and balance statistics show that the major consumption
of energy in Nepal is in the domestic sector, whereas the major supply of energy comes from
biomass, of which fuel wood is the dominant energy source, as it covers 77 percent of the
total biomass energy supply in Nepal. The other energy supply sources like non-renewable
(oil and gas) and renewable energy cover 11.76 percent and 0.53 percent respectively of the
total energy supply (WECS 2011, 12).
One of the interesting facts is that although Nepal is blessed with natural resources and a
steep gradient topography, it has harnessed only 650 MW of 43,000 MW (1.51%) of
technically and economically feasible potential of hydropower (Nepal Ministry of Finance
2011, 164-175). It does not have any fossil fuels suitable for power generation.
Renewable Energy
The large proportion of the population from rural areas and their massive dependence on
traditional energy resources show that the rural sector is the most important sector for the
implementation of the concentrating development programs to accelerate the country’s
development index. The low consumption level of imported energy shows that the industrial
activity is very low whereas household energy dominates the major energy portion of the
market. Due to the geographical terrain, it will cost massive investment and time to link rural
areas with the national grid. Based on this fact, the government started to promote locally
available environmentally friendly renewable energy resources in Nepal which are more
affordable to those rural populations, helping to raise the rural economy. The National

3
Planning Commission (Nepal National Planning Commission 2008) stated in its report that
there is technically feasible potential of 50MW micro hydro power, 1132.7 MW of solar
energy (considering 5% of the area potentially suitable @ 4-5 kWh/sq.m/day) and 1.9 million
biogas plants.
The Government of Nepal (GoN) has established the Alternative Energy Promotion Centre
(AEPC) in 1996 for the promotion of renewable energy technologies in Nepal. The main
programmes are micro hydro, solar and biomass (bio-diesel, cooking stoves, and biogas).
Currently, AEPC is coordinating with Ministries, GOs, donors, INGOs, NGOs, the private
sector and stakeholder/user groups to make policy recommendations to the government. For
the small scale RE deployment, it acts as a one door channel for the mobilization of funds.
There are different programs under AEPC funded via unilateral, bilateral donor organizations
(AEPC 2010) which will be discussed in detail in chapter three.
The GoN has subsidized almost all of these renewable energy technologies through the
“Rural Energy Policy 2006” revised in 2006 and 2009. The supporting policies are “Subsidy
Policy for Renewable (Rural) Energy” and Renewable (Rural) Energy Subsidy Delivery
Mechanism” (AEPC 2010). The Subsidy Policy defines objectives as well as the types, level
of subsidy and the delivery mechanism (AEPC 2010). Since the programme is running since
last 15 years, there is a need for the evaluation and Analysis of the Impacts of Subsidies on
Small Scale Renewable Energy Technologies Dissemination in Nepal (AEPC 2010a).

4
1.4. Objectives
The main objective of this research based project is to analyse:
the status of rural electrification using RETs in Nepal; and
current delivery modality of RETs dissemination in Nepal
The specific objectives of this project are:
Identification of RETs being subsidized
Evaluation of the effectiveness of the subsidy with current subsidy delivery
modality
Identification of the gaps in the current subsidy delivery modality
Proposed improved subsidy delivery mechanisms filling the gaps identified.
1.5. Research Questions
To understand the objectives, a series of research questions will be addressed.
1. How effective is the current subsidy programme in assisting the target groups?
2. What will be the impact on projects if subsidies are discontinued?
3. What are the social costs of having or not having subsidies for the promotion of RETs
in Nepal?
4. What is the effect of the current subsidy on other RETs?
5. Are subsidies targeted at right level, in the right areas?
6. What is the technological integration effect in the subsidy programme?
1.6. Rationale of the Study
There are different types of renewable energy financing programmes. Subsidy is one among
those programmes. Also, even with subsidy options, there are a wide variety of approaches
including subsidy to producers, fuel subsidy, consumer subsidy, grants, tax exemptions etc
(UNEP 2008, 9). The same UNEP report also states that in most developing countries, energy
subsidy programmes are designed to raise the living standards of rural and poor communities;
examples could be subsidies in cooking, heating etc.

5
“Many energy subsidies programmes intended to boost poor households’ purchasing power
or rural communities’ access to modern energy can paradoxically leave the poor worse off”
(UNEP 2008, 17). So, any subsidy program that has been implemented over a period should
be assessed to make sure that a programme is running in an effective and efficient way while
reaching the target group. As the Government of Nepal is subsidizing almost all renewable
energy projects, it is important to evaluate and analyse the programme. This will be useful for
all the relevant stakeholders to know about the effectiveness of current subsidy policy and
delivery modality, as many of those are deprived of this information.
1.7. Limitations
The limitations of the projects are:
The study has only considered solar home systems, metal stoves and micro hydro
power as the small scale renewable energy technologies (RETs) for assessment.
The study is only focussed on RETs disseminated by Energy Sector Assistance
Programme (ESAP) under AEPC umbrella.
As the author is currently Australia based, all the data gathered are based on survey
questionnaire and the e-communication with people in Nepal.
1.8. Study methodology
Literature review
The comprehensive literature review has been done. It started with the identification of the
case studies of subsidy programmes operating in some neighbouring countries, with
Bangladesh being a focus. Then the study was more focussed on “The Rural Energy Policy
2006” and Renewable (Rural) Energy Subsidy Delivery Mechanism as they operate in Nepal.
Other government plan and policies related with rural renewable energy, electricity had been
studied which includes the documents from the Ministry of Finance, Nepal Rastra Bank,
National Planning Commission. All the information from these different sources was
systematically studied and analysed.

6
Field Visit
During the course of the study primary information collected from the field has been
compiled using appropriate tools/software (such as MS Office) and analyzed. There were two
field visits to Nepal during the semester break. Different sets of questionnaires were prepared
targeting different personnel ranging from the users’ level to the government policy level.
The systematic plan of the field visit was in close co-ordination with ESAP/AEPC.
Field Data Collection Method
The following field survey methods have been used to collect primary information and data
required for REF subsidy users’ study from the field to identify barriers to subsidy delivery
and possible measures to overcome barriers; to determine user satisfaction level and time
period for subsidy delivery mechanism:
Field Observation of RETs Installations and operation
Interviews with selected users on random sampling basis
Sampling Size and Place
The survey question follows the guidelines of the Human Ethics Committee of Murdoch
University. Random sampling has been done. In total, 110 survey questionnaires have been
carried out. Among them, 80 survey questionnaires are from RETs users from 15 districts of
the country comprising of different geographical areas. The remaining 40 are from
manufactures/installers/supplier and policy makers.
1.9. Structure of the Report
The report has been structured in layout as follows:
Chapter 1: Includes the project background and rational for this study.
Chapter 2: Contains literature review and the information on small scale RETs currently
disseminated in Nepal
Chapter 3: Includes the organizational setup in this sector and subsidy delivery modality with
an example.
Chapter 4: Includes the survey questionnaire details.
Chapter 5: Contains the analysis of an effectiveness of the subsidy programme in terms of six
standard criteria

7
Chapter Six: Contains Conclusion and Recommendation along with future works.
The starting of the new topic is indicated by bold “heading”. The author has tried to structure
the report in a best possible way to avoid text repetition.

8
Chapter Two: Literature Review
The literature reviews of different national and international documents were completed in
the beginning phase of the research work. The renewable energy subsidy schemes in
neighbouring countries like India, Bhutan and Bangladesh have been studied. The
Bangladesh case study has been reviewed here more specifically, as the author has
incorporated its subsidy delivery concept in the recommendation part of the study.
2.1. Case study of Rural Electrification in Bangladesh
Bangladesh is one of the developing countries located in South Asia. It has a maximum
electricity generation capacity of 6727MW electrifying 49% of its total population
(Bangladesh Ministry of Power, Energy and Mineral Resources 2011). Though the main
energy sources are biomass (traditional) and natural gas, the government is expanding its
renewable energy program for rural electrification (Bangladesh. Ministry of Power, Energy
and Mineral Resources 2011).The solar dissemination program is one of the exemplary
programs of government in collaboration with donor agencies (World Bank, GEF, kfW, GTZ
etc.) along with other partner organizations, NGOs and private bodies. These programs are
being implemented through Infrastructure Development Company Limited (IDCOL), Rural
Electrification Board (REB), Local Government Engineering Department (LGED) and
Bangladesh Power Development Board (BPDB) (Bangladesh Ministry of Power, Energy and
Mineral Resources 2008). The solar PV electrification program is a kind of subsidized
program (in the form of a grant) being delivered in a commercial way which seems more
sustainable than direct subsidies.
The programme has been financed in two ways:
“Fee for service” implemented by Rural Electrification Board (REB): Consumers pay
monthly bill based on consumption.
“Credit sell” option followed by Grameen Shakti, LGED and BPDB.
(Urmee 2009)
Implementation Modality of Infrastructure Development Company Limited (IDCOL)
The government supports the program with favourable policies; for example, the Government
of Bangladesh exempt import duty and Value Added Tax (VAT) from solar photovoltaic and

9
wind turbines in 1998 (Bangladesh Ministry of Power, Energy and Mineral Resources 2011,
3-8). They also act as a mediator to source the fund through different donor agencies. IDCOL
works through Partner Organizations (POs) (IDCOL 2010). They provide soft loans to them
and give technical assistance. They are more focussed on commercialization of technology
which is considered to be one of the main bases for sustainable markets, hence provide
capacity building programs as well. POs are the implementing organizations responsible for
selling the systems, installation and after sales service. They apply microcredit system so that
the people can afford the system in a reasonable time. One of the partner organizations is
Grameen Shakti. It follows 4 different modes of payment under which customer have to pay
15%-25% of the cost as down payment and repay the remaining under several monthly
instalments and Cash sell option followed by Grameen Shakti (Grameen Shakti 2011).
Mode-1:
“The customer has to pay 15% of the total price as down payment.
The remaining 85% of the cost are to be repaid within 36 months with 12% service
charge.
Mode-2:
The customer has to pay 25% of the total price as down payment.
The remaining 75% of the cost are to be repaid within 24 months with 8% service charge.
Mode-3:
The customer has to pay 15% of the total price as down payment.
The remaining 85% of the loan amount, including 10% service charges, are to be repaid
by 36 account payee cheques in advance.
Mode-4:

10
4% discount is allowed on listed price in cash purchase” (Grameen Shakti 2011).
Figure 2: Installation of Solar Home System in Bangladesh
(IDCOL 2010)
Figure 1 shows the sharp increase in the installation of solar home systems in Bangladesh
after the implementation of the IDCOL program. The renewable energy program and subsidy
delivery modality of Bangladesh can be one of the good examples to compare with the
renewable energy program of Nepal, where commercialization still hasn’t take place properly
and companies are totally dependent on government subsidy to run the program.
2.2. Energy Policy Framework of Nepal
National Planning Commission (NPC) is the apex body in Nepal for “...formulating
development plans and policies of the country under the directives of the National
Development Council” (Nepal National Planning Commission 2008a, 1). The same source
states that the NPC, chaired by the Honourable Prime Minister, have to approve all central
level plans and programmes before its implementation. All plans and policies are generally
based on a 5 year period (FYP). The Sixth Five-Year Plan (1980–1985) incorporated the
concept of sustainable development and formulated the Environmental Protection Act and
Regulation Act and ratified different international treaties and conventions related to the
environment. There were some donor supported activities in RETs running on a very small
scale, but only in the Eighth Five-year Plan (1992-1997) did the government realize the need
for a separate body for the promotion of alternative energy and hence, AEPC was formed in
1996 with the objective of promoting clean energy to the rural communities and hence, help
0
7,500
15,000
22,500
30,000
37,500
45,000
52,500
60,000
67,500
75,000
82,500
90,000
97,500
105,000
112,500
1997 1998 1999 2000 2001 2002 2003 2004 2005 2006
IDCO L SHS Programme

11
to raise their livelihoods. In the Tenth-Five-year-Plan (2002-2007), the government set
poverty alleviation as a theme. Among the various sectoral activities to achieve the goal,
energy is considered as one of the key sectors falling in the “Priority category 1”, which is the
sector in Poverty Reduction Strategy (PRS) (Nepal National Planning Commission 2008a, 1).
In between the period of 2002-2007, nearly 170,000 biogas plants, 5 MW of micro and pico
hydropower have been installed, as well as 81,000 solar home systems and 213,000 improved
cooking stoves, electrifying a total of 5.1% of the rural population (Nepal National Planning
Commission 2008, 228). Renewable Energy Subsidy Mechanisms and other procedures were
also formulated in the same period. Only the target has been revised in the Three-Year-
Interim-Plan (2008-2011).
Figure 3: Institutional Setup
(Banerjee et al. 2011, 4)
Figure 3 demonstrates the general institutional setup of the country. It shows all the relevant
stakeholders dealing with the overall energy sector with their hierarchy. Figure 4 below
shows the timeline of all policy initiatives taken in Nepal. The energy sector is considered to
be the one of the youngest sector as the main initiative was just taken in 1975 A.D (Banerjee
et al. 2011, 4).

12
.
Figure 4: Timeline of Policy Initiatives
(Banerjee et al. 2011, 4)
2.3. Key Government Bodies and Policies
To provide an indicator of the complex range of government that have an impact on the
overall sector, the following are the list of Ministries and other government bodies
involved in the sector and working on different acts and policies.
The National Planning Commission (NPC)
The Ministry of Environment (MoE)
Ministry of Science and Technology (MoST)
Ministry of Finance (MoF)
The Ministry of Local Development (MoLD)
The Ministry of Water Resources (MoWR)
The Ministry of Forest and Soil Conservation(MoFSC),
The Ministry of Industry, Commerce and Supplies (MoICS)
The Ministry of Labour and Transport Management (MoLT)
Nepal Electricity Authority (NEA):

13
The Water and Energy Commission Secretariat (WECS)
Source: (Nepal Ministry of Environment 2010), (Nepal Ministry of Science and
Technology 2010), (Nepal Ministry of Energy 2010) and (Nepal Ministry of Forest and
Soil Conservation 2010)
The simple example could be AEPC falling under the Ministry of Environment (MoE).
There are different Ministry for Water Resources and Energy. Though these two
ministries have different working mandates, they both are working in water
resources/energy and hence run into each other at different stages of the program. This
simply makes the process more bureaucratic. Another example is the way government
staff is utilized in the District Development Committee (DDC) in all districts. As DDC
falls under the Ministry of Local Development (MoLD), AEPC has to coordinate and
reach consent with the MoLD through the MoE.
In biofuel policy formation for example, six Ministries (MoE, MoFSC, MoICS, MoLT,
MoF, MoST) had to work together (Author Experience, 2009).
There are also regional and district level of line agencies like the District Development
Committee etc. The various acts and rules (government policies) which are governing the
energy sector a direct or indirect way are as follows:
Nepal Petroleum Act – 1983
Petroleum Rules – 1984
Nepal Electricity Authority Act – 1984
Electricity Act – 1992
Hydro Power Development Policy – 1992, 2001
Forest Act – 1993
Water Resource Act – 1993
Industrial Enterprise Act – 1992
Water Resource Regulation – 1993
Electricity Regulation – 1993
Forest Rules – 1994
Environment Protection Act – 1996
Environment Protection Rules – 1997
Source: (Nepal Ministry of Environment 2010), (Nepal Ministry of Science and Technology
2010), (Nepal Ministry of Energy 2010) and (Nepal Ministry of Forest and Soil Conservation
2010)

14
2.4. Renewable Energy Subsidy Policy
The renewable energy subsidy policy was formulated in 2000 and has been revised twice
since, in 2006 and 2009. It is supported by the Subsidy Delivery Mechanism 2000 which
incorporates the process to channelize the government subsidy for users via the Rural Energy
Fund (AEPC 2010, 1). The RE policy has targeted the following objectives:
“To maximize the service delivery and service delivery efficiency in the use of
renewable energy resources and technologies in the rural areas and to provide
opportunity to low-income rural households to use RETs.
To support rural electrification as well as gradually reduce the growing gap of
electricity supply, consumption, etc. between rural and urban areas.
To make the use of grant assistance provided by donors, existing and forthcoming,
in a more effective and objective oriented way and thereby attract additional
donors and other investor in RETs sector.
To support development and extension of RET market by attracting private sector
entrepreneurs.
To support to the envisaged long-term targets of GON in providing rural
electrification and energy services “(AEPC 2010, 2).
How the policy works in a practical situation is addressed in detail in the following sub-
chapter.

15
2.5. Small Scale Renewable Energy Technologies
The most effective renewable energy technologies in Nepal are micro and pico hydro power,
improved water mills, solar PV and thermal, improved cook stoves and biogas. Wind energy
is still in the beginning of its dissemination stage, as policy and delivery modalities are just
finalized (AEPC 2010a).
This study will be limited to three technologies, which are micro hydro power, metallic cook
stoves and solar home systems.
2.5.1. Micro Hydro power
This is one of the most prominent technologies disseminated for rural electrification in Nepal.
Being blessed with enormous water resources, the country has around 600 perennial rivers, as
shown in figure 5, giving an annual average run off of over 200 billion cubic meters (IEA
2011). The report has estimated that there are altogether “...6,000 rivers with drainage density
of about 0.3 km/km2. The cumulative length of rivers is 45,000 km” (WEPA 2011).
Figure 5: Network of River in Nepal
(Rajbanshi 2002)
The same report states that among those rivers, 1000 rivers are longer than 10 km and about
24 of them are longer than 100 km. Also, micro-hydro generates electricity throughout the

16
year with no storage dams, and hence will be a more cost effective technology for the
scattered communities living in mountains. The government has estimated that more than 50
MW of micro hydro power plants could be installed in the mountainous areas. Another
advantage is that the day time energy can be utilized in end users activities such as agro
processing mills, pumping and other income generation activities. A Hydropower plant with
capacity less than 100 kW is considered to be a micro hydro program while power plants
between 100 kW to 1 MW fall under Mini grid program (AEPC 2011).
2.5.2. Solar Photovoltaic Power (Solar Home System)
Nepal is blessed with 300 days of sunshine throughout the year. The government has
estimated the total potential at 1132.7 MW of solar energy considering 5% of the area
potentially suitable at the rate of 4-5 kWh/sq.m/day (Nepal National Planning Commission
2008), as it can be seen from figure 6 below. Traditionally, solar energy is being used for
drying and water heating purposes. PV systems between 5 -10 Watt are considered to be
small solar home systems whereas systems above 10 Watt are known as solar home systems
(AEPC 2011).The systems are being used for lighting purposes and for some electronic
appliances such as radio, TV etc. Bigger systems are also being disseminated for drinking
water pumping, medical storage, and mobile communication. These technologies provide an
alternative to traditional rural lighting systems such as Jharro (bark of tree), kerosene which
have serious health impacts (Zahnd 2010).

17
Figure 6: Annual Solar Irradiation at latitude angle
(SWERA 2010)
2.5.3. Biomass Energy( Metallic Improved Cook Stoves)
More than 80% of the Nepalese people are dependent on traditional resources such as fuel
wood, agricultural residue, cattle dung etc., of which fuel wood accounts for 77 percent of the
total biomass energy supply in Nepal (WECS 2010).In order to use these resources efficiently
and effectively in a sustainable way and to address the related health and environmental
issues, the government focussed on large scale dissemination of improved cook stoves. The
government is promoting different types and sizes of mud and metal stoves targeting different
geographical areas. Figure 7 shows the different technologies being promoted.

18
Wood Fired Stoves
Figure 7: Types of ICS being promoted
(Biomass Energy Support Programme/ESAP)
2.5.4. Key Institutions
Apart from the key government institutions and AEPC, there are many key institutions
involved in the promotion of small scale RETs in Nepal.
2.5.4.1. Donor/Financing Agencies
The main donor and financing agencies supporting this sector are
Danish International Development Agency (DANIDA),
Norwegian Agency for Development Corporation (NORAD),
United Nation Development Program (UNDP)
World Bank (WB)
Kreditanstalt für Wiederaufbau - Development Bank of Germany (KfW)
Netherlands Development Organisation (SNV)
European Union (EU)
Asian Development Bank (ADB)
The U.S. Agency for International Development (USAID)
Nepal Bank Limited

19
Rastriya Banijya Bank Limited
Clean Energy Development Bank Ltd
(Survey 2010/11)
2.5.4.2. International and National Non-Government Organizations
(INGO/NGOs)
Significant numbers of INGOs and NGOs are working in this sector. Some of the programs
are focussed on direct promotion of these technologies while most of the programs are being
integrated with gender, poverty etc projects. Some of the major organizations are:
International Union for Conservation of Nature (IUCN)
International Centre for Integrated Mountain Development (ICIMOD)
Winrock International
Practical Action
Biogas Support Program-Nepal
Centre for Rural technology (CRT/N)
Rural Integrated Development Services ( RIDS-Nepal)
Himalayan Light Foundation
Clean Energy Nepal (CEN)
Gender in Energy and Water Network (GEWNet)
The list of the donor organizations and non-government sector also indicate that this sector
has recently got the attention from a large number of bodies. This will increase the total fund
of the sector and ultimately result in a large number of beneficiaries. However, lack of proper
policy and coordination between the government bodies and agencies could result ineffective
utilization of the fund.
(Survey 2010/11)
2.5.4.3. Private Sector
This sector consists of Independent Power Producers (IPP), manufacturing companies,
installing companies, contractors and consulting firms. Government qualified manufactures,
suppliers and installers in solar, micro hydropower, improved water mill, biogas, have
already formed their national association in order to serve the consumers more effectively.

20
Solar Electric Manufacturers' Association Nepal (SEMAN) for Nepalese Solar Photovoltaic
System Manufacturing Companies, Nepal Micro Hydro Power Development Association
(NMHDA) for micro hydro and improved water mill manufacturers and installers, Water and
Energy Consultant's Association (WECAN) are some of the major association.
(Survey 2010/11)

21
Chapter 3: Organizational Setup and Subsidy Modality
3.1. Overview: Alternative Energy Promotion Centre
The Government of Nepal established AEPC in 1996 for the purpose of promoting renewable
energy technologies and encouraging the efficient use of conventional sources of energy,
specifically in rural areas. It is a semi-autonomous body governed by the AEPC board which
consists of representatives from GOs, NGOs, the private sector and donor/financing
organizations. AEPC is as main regulatory body with mandate to develop renewable energy
policy, planning, implementation, coordinating, monitoring and evaluation and assuring of
the standard of the service (AEPC 2010a).
3.2. Working Modality
AEPC highlights the importance of the public private partnership (PPP) approach for the long
term sustainability of the overall sector. In this modality, as shown below in figure 8, the
promotion of RETs is demand driven rather than supply oriented.
Procedures/ Guidelines
Subsidy
Programme Implementation Modality
Public Private
PartnershipDemand side
Public sector
Supply side
Private sector
Awareness & capacity building Technical & financial assistance Coordination & networking Quality assurance, monitoring & evaluation
Manufacturing & supply
Sales & installation
After sales services, repair & maintenance Int. Quality control &
monitoring
Users/ Beneficiary
Figure 8: AEPC Implementation Modality
(AEPC 2010b)

22
The government, as a public sector, prepares the plans and policies in consultation with all
relevant stakeholders. The main role of AEPC on behalf of the government is to facilitate
and coordinate the overall program. It creates the demand for RET services via conducting
awareness and capacity building programs, therefore creating a market for the private sector.
It monitors and evaluates the market so as to assure the quality of the product which is the
most important factor to maintain or increase the user confidence of RETs.
The private sector as shown in figure 8 is responsible for manufacturing, installing and
supplying the product as per the consumer demand. They are also liable for after sales service
followed by repair and maintenance within a fixed time period based on the government rules
and regulation.
3.3. Programs and Activities
The following are the working areas of AEPC:
Mini and Micro hydro Power
Solar Photovoltaic and Thermal (Small scale-Non grid)
Biomass (Improved Cook Stoves, Wood fired Gasifiers, Non electrification)
Bio-fuels
Biogas
Wind Energy (Small scale-Non grid)
Improved Water Mill
Energy efficiency
Climate Change and Carbon Trading

23
Currently, there are six main programs being implemented under AEPC. These are funded by various donor organizations and are summarized in
table 1.
Table 1: AEPC Programs and Activities
.No. Program Period RETs Implemented Website
1. Energy Sector Assistance Program (ESAP)-
Phase II
(Phase I : 1999-2005 followed by 2 year
bridging period for Phase II)
15th
March 2007-
14th
March 2012
Mini Grid, Micro hydro, Solar PV
,Improved cook stoves via Rural
Energy Fund
http://www.aepc.gov.np/
2. Rural Energy Development Programme
(REDP)- Phase III
(Phase I: 1996 – 2003
Phase 11: 2003-2007)
Succeeded by
The Renewable Energy for Rural Livelihood
(RERL)
(August 2007 –
2009 extended till
2011)
April 2011-
December 2012
Micro hydropower http://www.aepc.gov.np/
3. The Khimti Neighbourhood Development
Project (KiND)
June 2007- June
2011
Small hydropower http://www.hpl.com.np/soci
al_khimti.php
4. Renewable Energy Project (REP) 2003- 17th
August
2011
Institutional Solar PV, solar
thermal
http://www.rep.com.np/

24
5. Biogas Support Programme (BSP)- Phase IV
(Phase I: 1992-1994
Phase II: 1994- Feb 1997
Phase III: March 1992-June 2003
July 2003 – June
2010 and
extended
Biogas http://www.bspnepal.org.np
6. Improved Water Mill Programme (IWM) 2003- June 2012 Improved water mills http://www.crtnepal.org/
(AEPC 2010b)

25
3.4. Energy Sector Assistance Program
3.4.1. Background
The Energy Sector Assistance Programme, hereafter known as ESAP, was established for the
promotion of the renewable energy sector in Nepal in line with the Government of Nepal’s
commitment of mainstreaming renewable energy in order to raise the economic standard of
the people as described in its Eighth-Five year Plan. In 1996, the Government of Denmark
and the Government of Nepal agreed to implement ESAP as a bilateral support program
executed through DANIDA (Ministry of Foreign Affairs of Denmark from the Danish
Government) and AEPC (from the Government of Nepal). The program was initially
premeditated to support the sector for 20 years of time via a series of five year plans (AEPC
2010).Both governments signed the agreement, contributing Danish Kroner DKK154 Million
(US$ 28 Million) in March 26, 1999(ESAP 2006)..
Later on, NORAD, representing the Government of Norway, joined ESAP investing
Norwegian Kroner NOK12 million (US$ 6.14 Million) in August 2003 in response to the
GoN’s request for financial assistance for augmented sector demand (ESAP 2006). ESAP
Phase I ended in September 2004. The political instability in the country caused Phase II to
be delayed by almost 3 years as the Governments of Denmark and Norway suspended their
funding. Phase II started on March 15, 2007 and will last for 5 years, ending on March 14,
2012. During the bridging period (Between Phase I and II), the programme survived by
utilizing the unspent programme budget and an additional NOK23.5 Million (US$ 4 Million)
support provided by NORAD and 37.3 DKK(US$ 6.77 Million) from DANIDA when the
political situation became more hostile (ESAP 2006). Table 2 below shows the time frame of
ESAP Phase I in detail. In total, the Government of Nepal contributes Nepalese Rupees
(NRs) 99.6 Million (US$ 1.21 million) (ESAP 2006).
The total expenditure of ESAP Phase I including bridging period is US$ 43.12 Million using
the exchange rate as of 10th
November 2011 (Currency Converter 2011).
26
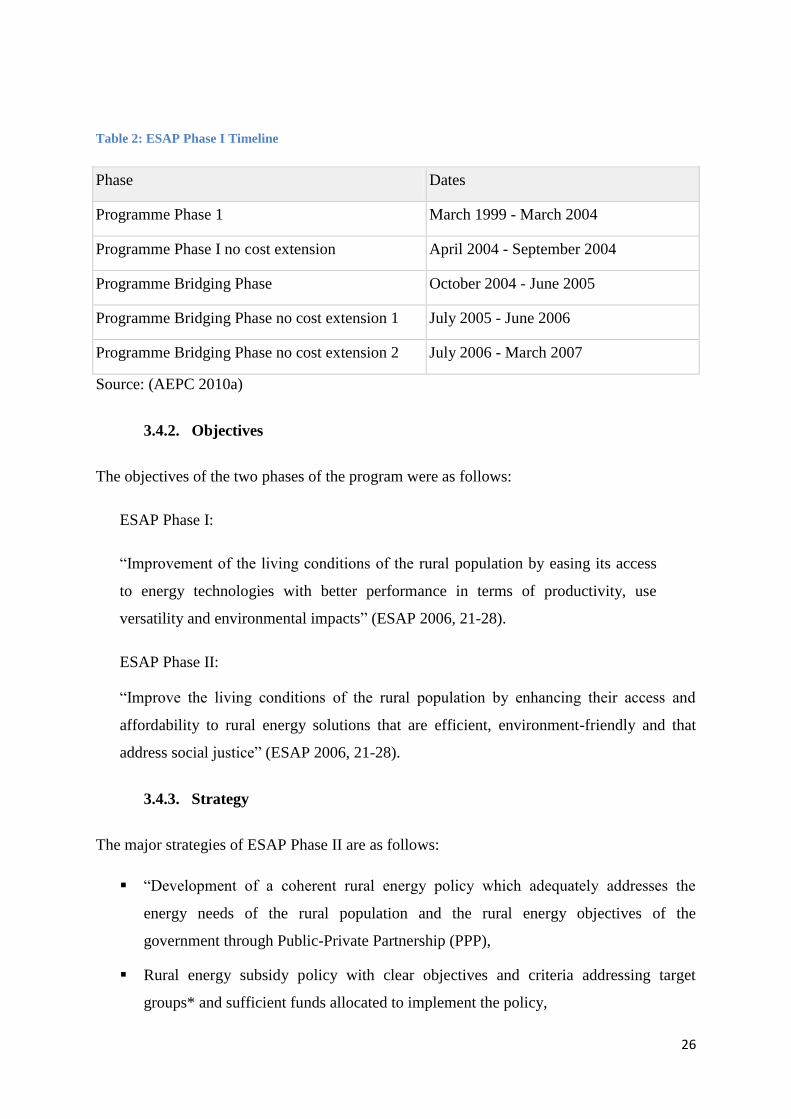
Table 2: ESAP Phase I Timeline
Phase Dates
Programme Phase 1 March 1999 - March 2004
Programme Phase I no cost extension April 2004 - September 2004
Programme Bridging Phase October 2004 - June 2005
Programme Bridging Phase no cost extension 1 July 2005 - June 2006
Programme Bridging Phase no cost extension 2 July 2006 - March 2007
Source: (AEPC 2010a)
3.4.2. Objectives
The objectives of the two phases of the program were as follows:
ESAP Phase I:
“Improvement of the living conditions of the rural population by easing its access
to energy technologies with better performance in terms of productivity, use
versatility and environmental impacts” (ESAP 2006, 21-28).
ESAP Phase II:
“Improve the living conditions of the rural population by enhancing their access and
affordability to rural energy solutions that are efficient, environment-friendly and that
address social justice” (ESAP 2006, 21-28).
3.4.3. Strategy
The major strategies of ESAP Phase II are as follows:
“Development of a coherent rural energy policy which adequately addresses the
energy needs of the rural population and the rural energy objectives of the
government through Public-Private Partnership (PPP),
Rural energy subsidy policy with clear objectives and criteria addressing target
groups* and sufficient funds allocated to implement the policy,
27
Development and enforcement of efficient and effective credit systems with
involvement of local banks and other credit facilities, viz., leading the sector towards
credit regime from subsidy regime,
Standards for energy technologies are developed and systems for monitoring
hardware quality and quality of services for reliability and preparation and
dissemination of manuals for services
Social Impact Assessments of rural energy programs systematically undertaken and
identified issues are timely resolved
Institutional strengthening of rural energy sector
Ensuring rigorous monitoring and transparency through public performance auditing
and information dissemination” (ESAP 2006, 21-28).
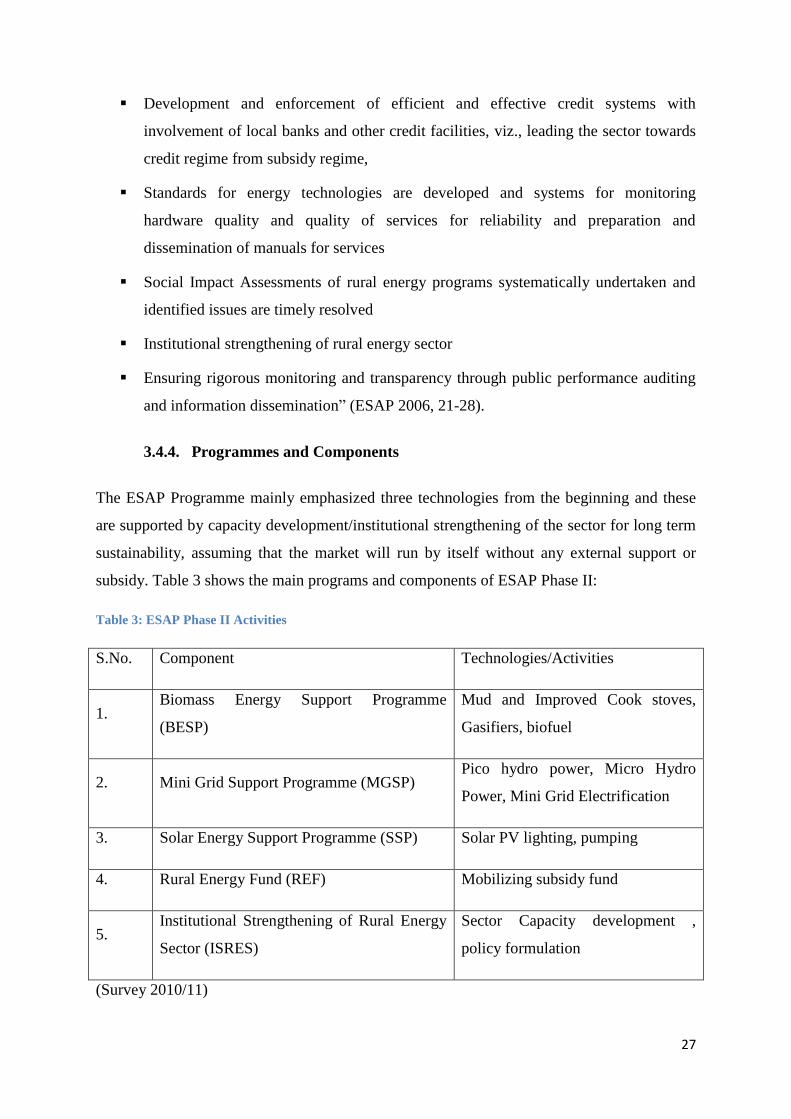
3.4.4. Programmes and Components
The ESAP Programme mainly emphasized three technologies from the beginning and these
are supported by capacity development/institutional strengthening of the sector for long term
sustainability, assuming that the market will run by itself without any external support or
subsidy. Table 3 shows the main programs and components of ESAP Phase II:
Table 3: ESAP Phase II Activities
S.No. Component Technologies/Activities
1. Biomass Energy Support Programme
(BESP)
Mud and Improved Cook stoves,
Gasifiers, biofuel
2. Mini Grid Support Programme (MGSP) Pico hydro power, Micro Hydro
Power, Mini Grid Electrification
3. Solar Energy Support Programme (SSP) Solar PV lighting, pumping
4. Rural Energy Fund (REF) Mobilizing subsidy fund
5. Institutional Strengthening of Rural Energy
Sector (ISRES)
Sector Capacity development ,
policy formulation
(Survey 2010/11)

28
3.4.5. Programme Implementation Modality
Figure 9: ESAP Implementation Modality
(ESAP 2006)
The Executive Director of AEPC is the head of the ESAP organization and is assisted by the
Chief Advisor who is appointed by DANIDA in coordination with AEPC. CA, ESAP will be
GON
(MoF, NPC, MoEST)

29
supported by program hired managers, officers and other supporting staff reporting jointly to
ED, AEPC and CA, ESAP. Figure 5 above shows the delivery modality of ESAP. The
program is implemented through different NGOs at the regional level. The main concept
behind the modality is to increase the capacity of the NGOs and private sector for sustainable
development with the support of government bodies. In the long term, the program is
designed to be handed over to government bodies, thus confirming that the program can run
with minimal or no external support.
The Government of Nepal, donor agencies and key stakeholders formed the ESAP steering
committee which is responsible for planning and implementing the activities in an efficient
and effective way. At the central level, the program components work with national level
NGOs, manufacturers, suppliers, credit agencies etc. For example, BESP works with National
level NGOs known as Rural Renewable Energy Service Centres (RRESCs). They give
financial and technical support to RRESCs which in turn are responsible for selecting
district/village level NGOs to implement the program at the ground level. The other
supporting actors would be government units (eg: District Development Committee, Village
Development Committee), local user groups from community and other development
agencies working in the same area. In this way, program goes from central level to ground
level (ESAP 2006).
3.4.6. Metallic Stove Subsidy Delivery Modality
As an example of the way, subsidies are delivered in Nepal, the case of a Nepali study will be
considered. In this case, the process consists of three steps.
STEP 1: Initial Call
(Survey 2010/11)
Public Notice for Government Pre-
Qualification programme
Expression of Interest from
Manufacturers
Selection of Manufacturers
30
This is the very basic step in the selection of manufacturers/suppliers/installers aka pre-
qualified (PQ) companies for the government subsidy programme. In general, the respective
program, (Solar, Biomass and Micro hydro program) in coordination with AEPC will form a
selection committee. They are responsible for defining standard criteria for selection and
assessment of applications. The number of PQ companies will be limited based on the target
and demand of the programme. The geographical location and coverage area is one of the
plus points considered when selecting the companies to participate with programme (Biomass
Energy Support Programme 2009).
Pre qualification of metal stove manufacturers are based on the standard criteria which
includes the minimum number of available manufacturing equipment, workshop facilities,
human resource capacity, and strategic location. The criteria also include the legal documents
such as government registration, tax and income papers. All the documents and information
provided will be verified. Either the central staff from AEPC/ESAP or regional staff will visit
the company and verify the information present in the application. The final selected PQ
companies are notified and agreement takes place between AEPC/ESAP and PQ companies
which acts as a legal document (Biomass Energy Support Programme 2009).
STEP 2: Subsidy Delivery Mechanism
Manufacturers are provided with subsidy application forms. Users can contact
manufacturer’s to seek the subsidized product (Biomass Energy Support Programme
2009).
It is the responsibility of manufacturers to generate the demand first and then the
manufacturers conduct sale/distribution/installation works of the Improved Metallic
Stoves with subsidy from the Government of Nepal while remaining within the given
terms and conditions. It should follow the manufacturing guidelines and design approved
by BESP. In the case of exceptional circumstances (changing design to suit the specific
local environment), it should seek approval from the program first.
If the company failed to comply with the terms mentioned, the company shall be required
to pay compensation pursuant to Compensation Recovery Procedure as determined by
BESP or it may expel the Company from participation in the program at any time
(Biomass Energy Support Programme 2009).

31
The major terms and conditions for manufacturers include:
(a) The Company shall be required to compulsorily put the engraved number on
top of the Improved Metallic Stove sold for the unique identification of each
stove. This is for the monitoring purpose so as to make sure that subsidy is
being utilized properly.
(b) While selling the stoves by the Company, the stoves should be sold only to the
households of V.D.Cs (Village Development Committees) situated at a height
of 2000 meters or above or to the households north facing of the V.D.Cs
situated at a height of 1500 meters or above. As the primary purpose of
metallic stoves is for cooking and space heating in cold areas, it is not suitable
in areas below 1500m in altitude where it will overheat and dry the air inside
the kitchen.
(c) After sale and installation of Improved Metallic Stoves, the Company shall be
required to provide the after sale service to the costumer as specified by the
BESP. For the purpose of ensuring that after sale service is effective, the rural
Energy Fund (REF) shall, while making payment of the subsidy amount to the
Company, deduct 10 percent of the subsidy amount and such deducted 10%
amount shall be paid to the Company one year after the completion of the
installation.
(d) The Manufacturer/Installer Company shall be required to monitor the stoves
installed by it at least twice in the year during the period of after sales service.
(Biomass Energy Support Programme 2009)
The VDC chairperson/secretary has to verify the user details and recommend that the
person is eligible to get benefits from the government subsidy program. The user details
include name, detail address, national identification number, eligibility, gender etc.
32
Afterwards, the manufacturers who installed stoves will keep installation details in the
subsidy application form. The details include the name of the installer person, the
representative company, the engraved product identification number, the date of
installation including manufacturing costs and the amount paid by the users.
The filled subsidy application form is then taken to the district Development Office
(D.D.C) where authorised government officers in the District Energy and Environment
Unit/Section (DEEU/DEEU) will verify installation details.
RRESC will facilitate the process and check the subsidy application form came via
manufactures for national database entry. The biomass Officers of RRESCs are the
persons responsible for the given task. Manufacturers have to bring the subsidy
application form to the AEPC/ESAP central office.
BESP will recommend in Memo type after verification of the hard copy of subsidy
applications in line with the electronic copy filled by RREESC.
REF will disburse subsidy amount (datewise) after the verification of hardcopy and
electronic copy. REF will disburse subsidy in favour of users to Manufacturers deducting
10% as an after sales guarantee.
The government is responsible for arranging the necessary training for the enhancement of
the capability of the Company. It helps to stimulate the demand by itself or with assistance of
RRESCs and DEES/U and make arrangement to conduct awareness programs, dissemination
of information and educational materials (posters, pamphlet, brochure, and operation of radio
program).
(Biomass Energy Support Programme 2009)
STEP 3: Quality Assurance
Quality Assurance is done by random sampling tests of the installed product which is
generally 10% of the disseminated numbers.

33
Chapter Four: Survey Details
4.1. Design of Survey Questionnaire
The main aim of the survey was to collect the information from the field about the
effectiveness of the subsidy program. With the limited resources, the author tried to analyse
collected data from the users and other beneficiaries to know the current status of the
program. The different section and subsections have been designed to gather the information
that helps to build the basis to reflect on the effectiveness of the program within the given
parameters.
The instruments used in the survey were:
Direct interviews
Emails
The survey questionnaire consists of six pages. It has been divided into three main sections
and six subsections.
The first section (refer to table 4) consists of the basic information about the interview. This
includes name, date, and place of the interview. It is designed to collect information of the
family background. It asks for vital information such as educational background and
occupation.
Table 4: Basic Family Information
Identifying Household Location:
Name of Village / VDC/Ward No.
Household Number
Date of Interview ......./……./……. Time: (a.m./p.m.)
Name of interviewee
Family information background
Q. No Questions Answer
1. Age
2. Sex
3. Educational Status
4. Primary occupation
5. Secondary occupation

34
6. Number of family member
7. Family type
8. Monthly/Annual income of the family (Rs.)
(Gender)
1=Male,
2=Female
(Educational
status)
A=Illiterate
B= Literate
1-9=School,
10=SLC, 12=
HSS,
14= BSc, 16=
MSc
17=Phd
(Occupation)
1=Agriculture,
2=Business
3=Worker, 4=Porter
5=Teacher, 6=Student
7=Private job,
8=Govt. job
9= Tourist guide,
10=Others
(Religion)
1=Hindus
2=Buddhist
3=Muslim
4=Christian
5=Others
(Family type)
1=Single
2=Joint
The second section entitled “Energy and Technologies” has six subsections.
The first subsection (refer to table 5) asks for information on the types of energy resources
used in households or at the commercial level. The users had to select three options with
priority subjected to availability.
Table 5: Types and uses of Fuel
ENERGY and TECHNOLOGIES
Types & Uses of Household/Business Fuel
Using the fuel list below, what types of fuel do you use for the following purposes?
(List in order of importance using numbers shown below)
Wood =1
Dung = 2
Agricultural residues = 3
Other residues = 4
Charcoal = 5
Kerosene (Paraffin) = 6
Bottled gas (LPG) = 7
Solar cooker = 8
Solar electric (solar PV) = 9
Grid electricity = 10
Batteries = 11
Wax candle = 12
Pico Hydro = 13
Water Mill (IWM/TWM)
If 'other' fuel used, please specify fuel
Purpose Fuel Priority
Most important fuel Second Priority Third priority
Cooking (including drinks)
Lighting
Keeping warm
Heating water for other

35
purposes
Cooking food/drink for selling
Cooking animal feed
Electrical equipment
Other tasks (specify below)
If fuel is used for another type of
household task, please specify task (s)
Task 1:
Task 2:
The second subsection (refer to table 6) collected information on the availability of fuel, the
sources of fuel wood and time/distance for the collection of firewood.
Table 6: Getting Fuel wood
Getting Fuel: Buying And Gathering
Is your main fuel gathered or bought?
1- all gathered 3- mostly bought
2- mostly gathered 4- all bought
If you gather fuel, please mention:
Source of gathering
Distance from home (in hour)
If you buy it, how much do you pay for it per month? NRs.
Wood
Charcoal
Kerosene (paraffin)
Bottled gas
Grid electricity
Batteries
Wax candles
Others
Total (in NRs.)
What are the reasons for buying fuel? (more than one
reason can be selected)
1. Scarcity of fuel for gathering
2. Faster than gathering it
3. Cleaner for cooking
4. Other reason (please specify)
If you or your family gather fuel, how often is it
gathered?
1- every week
2- every month
3- Twice in a year
4- Specific time(mention)

36
If you or your family gather it, about how long, on
average, does each collection trip take at this time of
year?
………./……….(hrs/mins.)
If you gather fuel, for how much period, it will be
sufficient
……………(months)
If you gather fuel, do you experience any problems
when gathering it?
If any, write the problems?
The third subsection (refer to table 7) requires details about the energy resources utilized by
hotels and businesses, including the electrical energy consuming appliances.
Table 7: Energy resources in hotel/business
Hotel And Business (optinal)
Types of energy sed
Fuelwood
Charcoal
Grid Electricity
Solar Energy (PV/Water Heater)
Micro hydro
If any other specify
List the electrical energy consuming
material(s)
I. Wattage consumed (if possible)
II.
III.
IV.
V.
VI.
VII.
Total
Is it sufficient for them
How much are they paying for energy per
year
Yes/No
Any other information regarding this,
include point wise,
The fourth subsection (refer to table 8) is designed to collect information on improved
cooking stoves, biomass technology. It includes details about the stove technology with date

37
of installation. This section is again divided further into technical, economical and
maintenance parts.
Table 8: Improved Cook Stove
IMPROVED COOKING STOVES
System Description
Stoves
Type of stove
Shielded mud fire or mud stove
(including chimney stove)
Wood-burning ceramic stove (made
of fired clay)
Metal stove
Improved charcoal stove
Other type of stove
Smoke Extraction Chimney/Smoke hood/Extraction
Installed Date
Economical
Capital cost of system
User’s contribution
Government contribution
Direct Subsidy
Indirect subsidy (government
bodies like VDC, DDC )
Others
Affordability in absence of subsidy
Maintenance
Fault in system components (time after
installation in months)
Water tank
Stove body
Others
No. of maintenance visit
Any other costs paid by users
Users’ comments (benefits/un-satisfaction)
…………………………………………………………………………………………………
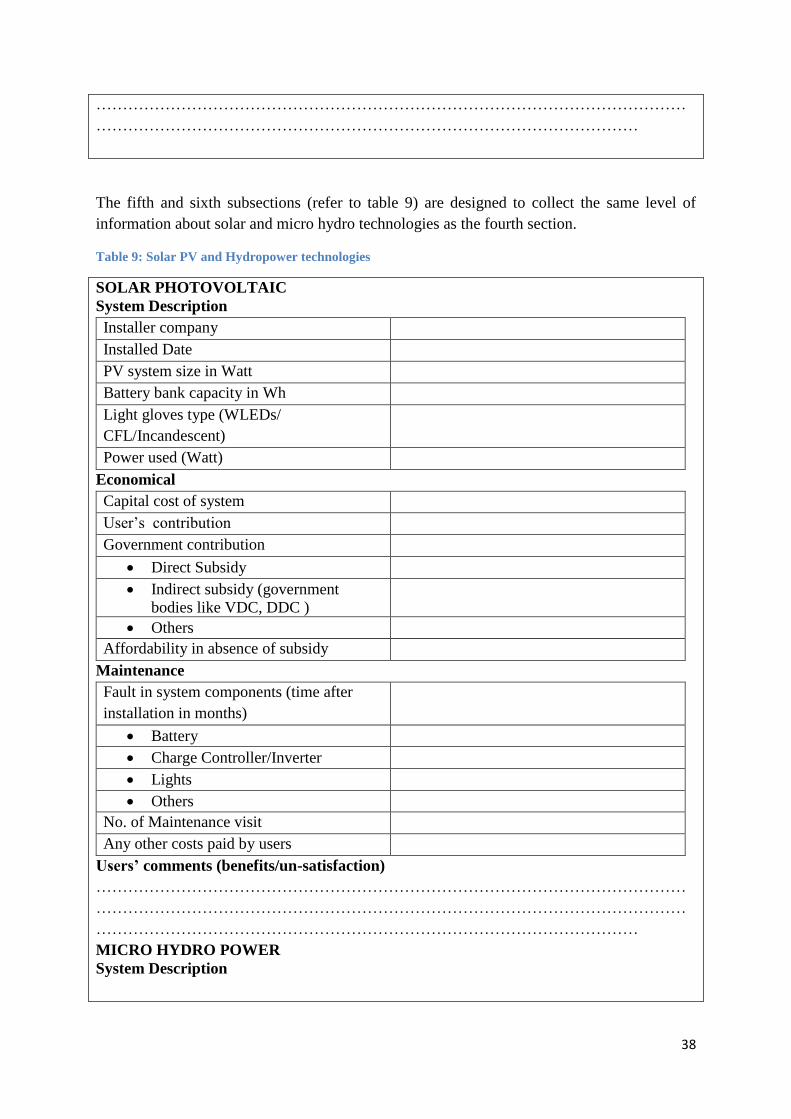
38
…………………………………………………………………………………………………
…………………………………………………………………………………………
The fifth and sixth subsections (refer to table 9) are designed to collect the same level of
information about solar and micro hydro technologies as the fourth section.
Table 9: Solar PV and Hydropower technologies
SOLAR PHOTOVOLTAIC
System Description
Installer company
Installed Date
PV system size in Watt
Battery bank capacity in Wh
Light gloves type (WLEDs/
CFL/Incandescent)
Power used (Watt)
Economical
Capital cost of system
User’s contribution
Government contribution
Direct Subsidy
Indirect subsidy (government
bodies like VDC, DDC )
Others
Affordability in absence of subsidy
Maintenance
Fault in system components (time after
installation in months)
Battery
Charge Controller/Inverter
Lights
Others
No. of Maintenance visit
Any other costs paid by users
Users’ comments (benefits/un-satisfaction)
…………………………………………………………………………………………………
…………………………………………………………………………………………………
…………………………………………………………………………………………
MICRO HYDRO POWER
System Description

39
Installer company
Installed Date
MHP Capacity
Power being generated
Load factor
Economical
Capital cost
User’s contribution
Government contribution
Direct Subsidy
Indirect subsidy (government
bodies like VDC, DDC )
Others
Affordability in absence of subsidy
Maintenance
Fault in system components (time after
installation in months)
Generator
Electronic Load Controller
Turbine
Others
No. of Maintenance visit
Any other costs paid by users
Operating cost (Human resource)
Operating cost (Others)
Users’ comments (benefits/un-satisfaction)
…………………………………………………………………………………………………
…………………………………………………………………………………………………
The third section (refer to table 10) of the questionnaire is designed to collect the information
from private manufacturers/supplier of RETs regarding their business. It also tried to see the
subsidy flow system from their point of view.

40
Table 10: Manufactures’ Detail
MANUFACTURERS/SUPPLIERS/INSTALLERS
i. Total number of system installed per year
Year No of
systems
Capacity
(Watt)
District No of
systems
Capacity
(Watt)
1997 2003
1998 2004
1999 2005
2000 2006
2001 2007
2002 2008
2009
ii. Institutional Arrangement and Human Resources
Year No of
technical
staffs
No of non
technical
administrative
staffs
Labor Total Remarks
1997
1998
1999
2000
2001
2002
2003
2004
2005
2006
2007
2008
2009
iii. Profit margin per system/project
…………………………………………………………………………………………………
…………………………………………………………

41
iv. Investment of company in this sector for commercialization of technologies
…………………………………………………………………………………………………
…………………………………………………………
v. Market in absence of subsidy
…………………………………………………………………………………………………
…………………………………………………………
vi. Support expected from government
…………………………………………………………………………………………………
…………………………………………………………
vii. System Manufacturing/Selling
Components Remarks Local Manufactured/Imported
SOLAR
Solar PV
Battery
Charge Controller
Inverter
Cables
Lights
Others
MICRO HYDRO
Turbines
Pipes
Generators
Others
BIOMASS
Stoves
Raw materials
viii. Time flow chart for Subsidy channelizing process (in days) ( included in appendix)
ix. Manufactures any comments (in relation to current subsidy delivery mechanism and
possible improvements)

42
…………………………………………………………………………………………………
…………………………………………………………
Lastly, the fourth section (refer to table 8) is targeting management level staff. It is in the
form of a direct interview with some of the key personnel of the organizations where they
were asked about SWOT (Strength, Weakness, Opportunity and Threat) of subsidy programs
and probability of RETs market without continuation of subsidy.
MANAGEMENT STAFFS (including POLICY MAKERS)
This includes management level staffs including policy makers at Ministry.
i. SWOT(Strength, Weakness, Opportunities and Threat) Analysis of the program in relation to increasing:
Affordability
Accessibility
Employment (Institutional/Commercial Capacity)
ii. RETs Market in absence of subsidized program\ It should see the policy in relation to
Ease to administer
Ease to implement
Fairness and efficient
At the end table 11 outlines the importance of designing each section of the survey
questionnaire to extract the required data which acts as input variables to research and
analyse the effectiveness of the program.
Table 11: Validation of Survey Questionnaire
Section Input variables to research
1 Family background information essential to see the level of education of
respondents and their financial status. This will show their awareness of the
technology as well as their ability to afford it.
2 Provides information on the types of energy technologies being used. This
will help to analyse the energy supply and demand scenario in that area.
3.1 This will help to calculate the time value of using the conventional
technologies.
3.2 Energy details of commercial sector shows their interest to adapt new

43
technologies and hence shows affordability and viability of the RETs.
3.3 and 3.4 Technology wise data can help to show the current status of the subsidy
program in terms of affordability, government contribution and level of
awareness among the user group. This will give a direct indication of the
effectiveness of the subsidy program from the user’s perspective. The
reliability of the technology and private players’ contribution can be analysed
from these sections.
4 Provides information on the subsidy program from the eyes of private
suppliers. This will help to analyse the timing of subsidy, as this determines
the market value of the product as well.
5 Management level views and suggestions

44
Chapter Five: Analysis of an effectiveness of the subsidy programme
The subsidy program can be seen as providing a benefit to both the supply and the demand
side. The subsidy receivers, the RETs users, are at the demand side and enjoy government
support to increase their living standard. This is always considered as a perfect tool to
highlight the government’s presence in the country. But it can be viewed from another angle;
one of the more controversial points of such a subsidy is that political parties use this as a
means to maintain their image or gain support from the public to remain in government
(UNEP 2008).
On the supply side, the subsidy program aims to increase the number of private bodies in the
RETs market, making it more competitive and commercial in the long run. This is considered
to be an essential factor for the sustainable development, as the subsidy cannot be continued
forever, especially in developing countries where the government has to rely on foreign
donors, including multi-lateral and bilateral organizations. Also, this type of donor driven
subsidy program is more tailor-made, controlled by donors on specific implementation
modality and guidelines which may lead to more bureaucratic systems. Different
implementation modalities for the same RETs, all operating within AEPC umbrella, are one
good example to demonstrate this point. Though all are targeted for the rural impoverished
communities, it creates confusion for the users and all related players involved This research
aims to analyse ESAP subsidy program based on the following parameters:
Targets and Achievements
Impact of RETs
Subsidy Delivery System Efficiency
Transparency
Sustainability
Effectiveness
The next section will describe each parameter in detail.
5.1. Targets Vs Achievements
This is the basic parameter to measure the progress of any program. The quantitative analysis
needs to differentiate between the two ESAP operational periods- Phase I and Phase II. The
data has been extracted from the ESAP administrative official document as referenced in

45
table 12 (ESAP 200, 12). It shows the status of ESAP Phase I and II based on technologies
which are Improved Cookstoves (ICS), Micro Hydro Power (MHP), and Solar PV home
systems. Considering the two programs with subsidy, MHP has achieved 102% of the target
and SHS has reached 155% of the target whereas ICS has achieved an outstanding 222% of
the given targets as shown in table 1 below. The following table clearly shows the total
coverage of the programs at the village and district level. MHP covers the mountainous areas
with 169 VDCs in 38 districts with a total of 33000 households (HHs) beneficiaries. The
sector has created 2997 jobs with 54 pre-qualified companies. Similarly, SHS benefited
69,524 HHs covering 72 districts out of total 75 districts. The overall achievement of the
Phase I program is successful as it has created thousands of jobs, almost 100 private
companies, hundreds of service centres, few local consultants and hundreds of local partner
organizations. This can be considered to be a good beginning in the subsidized sector.
Table 12: ESAP 1 Status
ESAP 1 – Status as of June 2006 ICS
(HHs)
MHP
(kW)
SHS
(HHs)
Target (2000-2006) 90,000 2,850 45,000
Achievement 200,000 2,914
69,524
Remarks 222% of the target 102% of the
target
155% of the
target
Reached VDCs 711 169 1855
Reached districts 34 38 73
Reached households 200,000 33,000 69,524
Employment implications >2,500
2997
(1230 full
time, 1767 part
time)
>1,500
Companies working in the sector - 54 qualified 30 (15
qualified)
Branches and service centres 9 4 350

46
Local consultants - 40 10
Local Partner Organizations
1) NGOs, 2) Local
Government, 3)
Companies/agents
125 1)
196 350 3)
(ESAP 2006)
ESAP Phase II started in March 2007 for 5 years till March 2012. The progress of the
program as of November 2010 is shown in table 2 and table 3 below:
Table 13: ESAP 2 Status as of November 2010
Revised Target
June 2010
Achievement
(70% of way through
Phase II period)
Remarks
Biomass Energy Support Programme (in Units)
Mud ICS 305,000 191,020 63% of the target
has been achieved
(The only program
with no direct
subsidy)
Metallic ICS 17,000 3,500 20% of the target
Institutional Stoves 2,800 354 13% of the target
Institutional Gasifiers 55 1 2% of the target
Household Gasifiers 500 27 5% of the target
Solar Energy Support Programme (in Units)
Solar Home System
(SHS)
215,000 157,000 73% of the target
Small SHS 100,000 9,000 9% of the target

47
Solar PV Pumping 100 0 0% of the target
Mini Grid Support Programme
MHP Commissioned
(kW)
13,700 2,468 18% of the target
(NORAD 2011)
Figure 10: Status of BESP/ESAP Phase II as of November 2010
(NORAD 2011)
Biomass Energy Support Programme
70% of the way through the Phase II period, the dissemination of the metallic stoves in high
altitude areas has not even achieved one quarter of its target even though the target has been
revised from 50,000 to 17,000. The major reason is the finalization of the subsidy delivery
modality for the dissemination purpose. The delivery modality was only finalized in mid
2009, whereas the subsidy had already been allocated in 2007. The author was the primarily
person responsible for finalizing the delivery modality at that time and achieved the goal
within 10 months. Hence, delay in launching the program was the primary reason for the
poor result shown above. The survey questionnaire involving metal stove manufacturers
revealed that slow processing of the subsidy application form is another reason for the low
number of stoves installed.
Solar Energy Support Programme
0
500
1000
1500
2000
2500
3000
Mud ICS*100 Metallic ICS*10 Institutional Stoves
Institutional Gasifier
No
.
ESAP Phase 2 Status
Target Achievement

48
The solar Home system program seems to be right on track, as it has already achieved 73% of
the total target with one still one and a half years to run. This system is considered to be one
of the favourite systems which are also proved by the high user demand and its target
achievement, whereas the small solar home system program is yet to achieve even one tenth
of its target. The survey revealed that the reason behind this involves the lengthy and
bureaucratic subsidy application process which is elaborated more in the next section. The
suppliers revealed that the low profit margin in SSHS is another reason for investors’
unwillingness in system dissemination even though the program is said to be demand driven.
Mini Grid Support Programme
Though almost 5 MW of MHPs is currently under construction, the programme has achieved
just 18% of the target to date. The main factor causing this is the economic status of the
villagers. Though MHP is considered to be a cheap power generation option compared with
solar, the capital investment is high for the whole plant. As the subsidy covers only 50%, the
local user committee is responsible for managing the remaining fund. Banks are yet to invest
in MHPs with confidence in the absence of insurance and also because of very low load
factors achieved, because of low end user activities. Increasing the cost of fuel, materials and
equipment are other factors contributing to the slow progress of the programme.
The installation trends for SHSs and MHPs are shown below. The installation numbers are
low in bridging period for both technologies.

49
Figure 11: Solar Home System Installation Trend
(ESAP 2010)
Figure 11 shows the SHS installation registered good growth in the first three years followed
by a downward trend for the following four years. The market again recovered in 2007 with
more subsidy funds becoming available (Survey 2010/11).
0
200
400
600
800
1000
1200
1400
2001 2002 2003 2004 2005 2006 2007 2008 2009
Pe
ak o
utp
ut
in k
W
Year
Solar Home System Installation
Capacity (kW)

50
Figure 12: Micro Hydro Power Installation Trend
Installation of MHP saw a steady growth from 2001 till 2005, and then a small downward
trend can be seen during bridging period due to reduced fund availability. Since 2008,
installation rate increased significantly as can be seen in figure 12 above. The government
policy started to emphasizing rural decentralized energy supply systems is considered to be
one of the main reasons for this trend.
5.2. Impact of RETs
No baseline study has been conducted prior to the implementation of the programme. As
stated in one Australian government document, “A Baseline Study gathers key information
early in an Activity so that later judgments can be made about the quality and development
results achieved of the Activity”(AusAID 2003,3). This is indeed quite necessary for
developing an effective monitoring and evaluation plan of the programme. Although a brief
study had been conducted just to establish realistic targets for the programme, the absence of
a detailed baseline study has limited the data available on the impact of RETs on
communities.
The survey questionnaire asked the RETs users about the impact of these RETs technologies
on their lives. The general benefits from technologies were listed as improved health and
0
500
1000
1500
2000
2500
2001 2002 2003 2004 2005 2006 2007 2008 2009
kW
Year
Micro Hydro Installation
Output Capacity (kW)

51
hygiene due to less pollution in the kitchen, enhanced visibility, and a better environment for
children to study, less pressure on the environment due to a reduction in firewood
consumption, increased employment opportunities (end user activities) etc. The random
sampling method used in this research collects information directly from users and the results
are tabulated as follows. The category has been divided into education, health, economic
condition on a priority basis. Table 14 below shows the results. Interestingly, the survey
revealed that people are now more conscious of their children’s education as the importance
of education is being realized by the many parents (Survey 2010/11).
In case of Metallic Stoves, the people are happy with the health benefits due to the clean
smokeless kitchen. Especially the women are very happy with the technology.
The study also reveals that in average, family members can save a minimum of 15 minutes
per day for fuel wood gathering due to improved cook stoves (Survey 2010/11). Hence, these
results in the direct and indirect financial benefit.
According to the survey, Solar Home System was quite popular among the children as they
provide the good visibility to study rather than the conventional “Tuki (Kerosene powered
cotton lump/lantern)” or “Jharro”. The economic and health benefits falls in second and third
preference.
In case of Micro Hydro, the response is same as of Solar PV system. The end user activities
such as agriculture processing etc are resulting good economic benefits in some of the areas.
Table 14: Impact of RETs
(Survey 2010/11)
Technology
Priority
1 2 3
Metallic stoves Health Economic Education
Solar Home System Education Economic Health
Micro Hydro Power Education Economic Health

52
This has been supported by the result (See figure 13) that 75% of respondents fell into the
category of illiterate or Under SLC (School Leaving Certificate)/Grade 10 Standard. Illiterate
consist of 32% of that. Only 4% of the people went on to University level. Those 50%
respondents have agriculture as their first background or general labour work. The remainder
are either in the government /teaching/NGOs sector. This shows that subsidy is playing a
very supportive role in increasing the literary rate in the country. The time saved in fuel
gathering, availability of smokeless kitchen is creating a good environment for students.
Figure 13: Education Level of Respondents
Another major impact can be seen in the increased access to modern forms of communication
and entertainment technologies such as radio, transistor, television and mobile phones. These
instruments act as a window for those rural communities to connect to the economically more
advanced side of the world. People are getting access to more information, connecting to their
relatives abroad, making their life much easier and more comfortable (Survey 2010/11).
5.3. Subsidy Delivery System Efficiency
The survey revealed that in all cases, the subsidy flow channel is very time demanding. As
discussed in the previous chapter, suppliers/manufacturers/installers have to go through
0
5
10
15
20
25
30
35
40
45
50
Illiterate secondary Higher Secondary University
Res
on
den
ts (
%)
Education Level
Education Level of the Respondents
53
different channels to get the subsidy on behalf of the users. A gross timeline was developed
for the subsidy flow based on the feedback provided by manufacturers/installers/suppliers of
different RETs. Though this timeline cannot be considered as perfect, it will still give an
indication of the operation of the system.
In metallic stoves, the planned and the actual time for the subsidy delivery process has been
summarized as follows based on the interviews taken with five pre-qualified metal stove
manufacturers from different zones. The table 15 shows the steps of subsidy delivery
mechanisms.

54
Table 15: Subsidy Delivery Processing Time for Metallic Stoves
Planned Actual
3 days /VDC 3 days/VDC
NA NA
NA NA
10 Metal Stoves/day (Conditional)
8 Metal Stoves/day 5-7 Metal stoves/day
7 days 15-40 days
1 day 2 days
15 days upto 21 days
Demand
Collection
Feasibility
report
Manufacturing/Im
port
Installation
Subsidy form
process
Submission to
REF
Clearance from
REF
Pre Feasibility
report

55
SUBSIDY APPLICATION PROCESS
Planned Actual
2 days 10 days
1-4 days 2-10 days
15 days up to 21 days
As soon as cleared from REF
Table 15 above shows that the actual time is at least one month longer than the planned time.
The major reason behind this is the unavailability of VDC secretaries for the users’
verification for subsidy eligibility. All the local government authorities such as VDCs, DDCs
and municipalities remain without elected representatives since July 2002 when the
government at that time dissolved all elected councils (Acharya 2011). This led to a void in
the local councils and hence the government civil servants acting as the secretariat in those
councils were actually overloaded with all their responsibilities with authority which includes
“administration of the VDC allocated budget for basic services and development projects;
registration of births, deaths and marriages, management of voter lists, tax collection,
citizenship certification, property transfers, subsidy verification etc” (OCHA Nepal 2010, 1).
OCHA Nepal’s survey showed that due to the people’s war and other political instability,
only 42% of VDC Secretaries are active in their VDCs, whereas 25% of those were stationed
in district headquarters, 14% are partially active and the remaining positions were vacant.
Subsidy
Disbursement
REF Approval
DDC/RRESCs
Approval
VDC
Approval

56
Some VDC Secretaries are handling more than one VDC. This is where most of the time is
being wasted.
DDC’s approval time and then RRESCs data entry procedure adds another significant time
delay in the process as they may not be in the same geographical area, although staff are
available most of the time unless they are in the field.
Interest Rate
Taking all these time delays into consideration, investment were almost frozen for that period
of time added by 10% after sales service guarantee. The current lender interest rate in Nepal
is 15% per annum on average (NIBL 2011). Ultimately, users will be bearing these time laps
cost as private investors included this also into their administrative expenses. Tables 16 and
17 show the subsidy delivery process for SHS and MHP respectively.
Table 16: Subsidy Delivery Processing Time for SHS
Solar Remarks
Planned Real
Demand collection 3 months 3 months
Pre-feasibility Report NA NA
Detail Feasibility
Report NA NA
Manufacturing/Import 45 days 50-55 days
Installation 7 days 10 days
Subsidy Form Process 2 months 4-6 months
This includes VDC approval, DDC
approval and submission to
Programme/REF and Subsidy
disbursement
(Survey 2010/11)
The case is almost the same as that of metallic stoves, except this process is lengthier as they
need photo documentation.
Table 17: Subsidy Delivery Processing Time for MHP
Micro hydro Remarks
Planned Real
Demand collection On demand
Pre-feasibility
Report 1 month
Detail Feasibility
Report 1-3 months
Manufacturing/Im
port
3
months 5-6 months

57
Installation
3
months
6 months - 1
year
Subsidy Form
Process
1-2
months 3-5 months
Depends on documentation and matching
fund availability
(Survey 2010/11)
In the case of MHP, the main reason for the delay is the inability of the local committee to
find the matching funds of the remaining 50% of the project after subsidy, and hence will be
seeking other sources of funding. This will increase the project lead time. The other reasons
are lower number of companies in the sector, brain drain problems, migration of skilled
manpower as skilled workers are attracted to more highly paid jobs abroad (NMS 2011).
Another problem for delays as described in the NORAD (2011) report is the dual contract
approach of ESAP. The first contract relates to electro-mechanical components of MHP and
is signed by the turbine manufacturer/installer company and the users’ committee. The
second contract concerns civil contract work which is carried out by the community itself.
The time mismanagement between the two contractors can delay the project as the installer
has to wait for the civil work to be completed. This, in turn again holds the subsidy
instalment payment from REF, increasing the cost of the project as discussed above in the
interest rate section.
5.4. Transparency
Transparency International has ranked Nepal at 146 out of 178 countries scoring just 2.2 out
of 10 on the scale in the Corruption Perceptions Index 2010, which measures the level of
public sector corruption (Transparency International 2011). In 2008 it was ranked 121 and in
2009 it was 143, showing that the situation in Nepal actually got worse. In contrast, the major
donors, Denmark and Norway, were ranked 1st and 10th in 2010. The ESAP subsidy
program as a whole is transparent. The management implemented extra features to make sure
that subsidy reaches the right people. The subsidy is fixed in all RETs rather than the
percentage of the total cost price. Other important features are:
Photo identification along with national identification card is used in SHS subsidy
documentation. The company has to submit two photos along with a photocopy of the
national identification card (see figure 14) with the subsidy application form. The first
photo should include the SHS with background to the home whereas the second photo
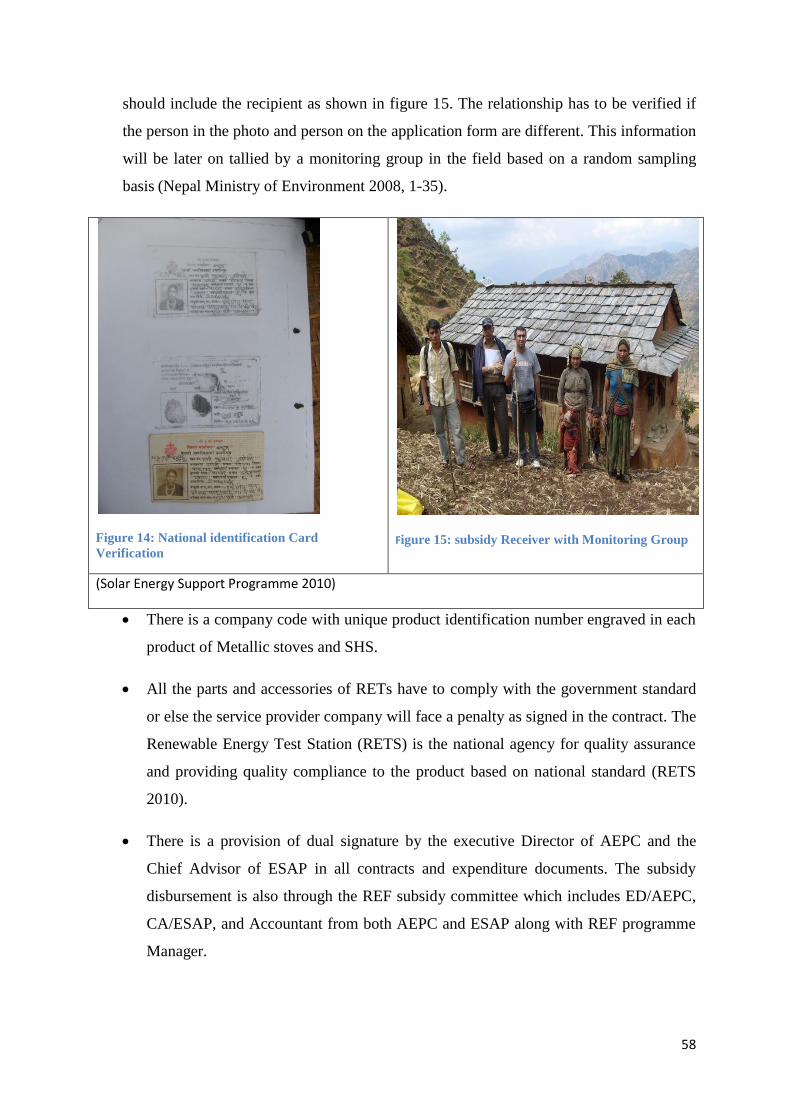
58
should include the recipient as shown in figure 15. The relationship has to be verified if
the person in the photo and person on the application form are different. This information
will be later on tallied by a monitoring group in the field based on a random sampling
basis (Nepal Ministry of Environment 2008, 1-35).
Figure 14: National identification Card
Verification
Figure 15: subsidy Receiver with Monitoring Group
(Solar Energy Support Programme 2010)
There is a company code with unique product identification number engraved in each
product of Metallic stoves and SHS.
All the parts and accessories of RETs have to comply with the government standard
or else the service provider company will face a penalty as signed in the contract. The
Renewable Energy Test Station (RETS) is the national agency for quality assurance
and providing quality compliance to the product based on national standard (RETS
2010).
There is a provision of dual signature by the executive Director of AEPC and the
Chief Advisor of ESAP in all contracts and expenditure documents. The subsidy
disbursement is also through the REF subsidy committee which includes ED/AEPC,
CA/ESAP, and Accountant from both AEPC and ESAP along with REF programme
Manager.

59
There is 10% random sampling field monitoring of installed Metallic stoves and SHS
with the help of external consultants, field and central staff. In case of MHP, there is
100% monitoring (NORAD 2011).
(Nepal Ministry of Environment 2008, 1-35)
Although the program has taken all these measures, the company profit margin seems to vary
as the market is open and free of government intervention. The survey has found two cases in
SHS distributed in the same district in 2009 as follows:
Table 18: System with/without subsidy
Power (Watt) Subsidy User’s contribution
20 Yes NRs. 12000
20 No NRs. 13000
(Survey 2010/11)
The above data shows just a difference of NRs. 1000 (around 6% of the capital cost) between
the system with subsidy and without subsidy. Though the general coverage is 30% for solar
(as shown below in figure 18), almost 24% of the subsidy amount is lost, either due to high
subsidy administration cost or high profit margins of the companies.
5.5. Sustainability
This is considered to be an important part of any programme. As already discussed, donor
driven subsidies cannot be continued on a long term basis and so the market should grow
before the end of the programme. Sustainability here has been defined as the increase in the
capacity building on the supply side of the programme so as to sustain continued operation in
the respective market without any external aid.
The capacity building activities are:
Non certified Metallic Stoves Installation Training
Solar Electrician Level 1 Training course for Installation (Certified by Government
agency known as Centre for Technical Education and Vocational Training (CTEVT)

60
Solar Electrician Level 2 Training course for Repair and Maintenance (Certified by
Government agency known as Centre for Technical Education and Vocational
Training (CTEVT)
Micro Hydro Installer’s Training
Micro Hydro Operator’s Training
(NORAD 2011)
The biomass Energy Support Programme is now working with one national and 138 district
based NGOs, as well as two Universities. It has already resulted in 15 metallic stoves
manufacturing companies. The Solar Energy Support Programme has now 26 qualified solar
PV companies for dissemination of SHS and 36 Solar PV companies for the dissemination of
SSHS. The number of companies registered for PV has increased from three to 70 over 10
years along with 500 branches. The program has trained around 2500 Solar Electrician Level
1 and 200 Solar Electrician Level 2 certified technicians. The Mini Grid Support Programme
has 57 Pre-Qualified Installation/Construction Companies for Improved Water Mills
Electrification/Pico/Micro Hydropower Projects and 52 Pre-Qualified Consulting Companies
for Survey & Design of the Micro Hydropower Projects: 52 including seven district based
NGOs (AEPC 2010).The government is now moving towards credit financing as well.
Initiated by AEPC/ESAP, three banks have given loan to 21 rural cooperatives to work to
finance solar PV systems.
Although the above data on capacity building activities seems encouraging, this survey
(2010/11) reveals migration of these trained human resources is causing problems in these
markets. Political instability is considered to be the major cause for this. 98% of the total
respondents including users, public and private sectors say that markets will collapse if the
subsidy is discontinued. The inability to afford the systems by the community and high cost
of the systems are two of the major reasons given for this. Investors are still not confident to
invest in this sector as the government cannot support the program on its own and donors are
only supporting for a fixed project time.

61
Figure 16: Market continuity in Absence of the Subsidy
(Survey 2010/11)
Figure 16 shows that 98% of the survey respondents are not confident that the market will
continue in the absence of the subsidy.
The survey showed that the average income of the respondents is Nepalese Rupees NRs.
110,636 per year (1 AU$ = NRs. 75.52 as of June 14, 2011 (NRB 2011). This does not match
with the official data, although the survey has been limited to only a number of families in
different parts of the country. The big variation in income relates to the remoteness of the
location. The lower the income, the more remote is the location and vice versa. In a country
where the average inflation rate was 9.8% over the last three years (NRB 2011), with an
average family size of 4.6, the people are very reluctant to expend significant amount of
money to buy expensive RETs. Currently, all the RETs users are still using firewood as their
primary source of energy for cooking.
This subsidy program is not yet successful in making creating a market, although it has
achieved its target of electrifying the rural areas.
0
10
20
30
40
50
60
70
80
90
100
Yes No
Res
po
nd
ents
(%
) Would the Market Continue in the absence of the
Subsidy

62
Another important part in this case would be to check the reliability of private bodies
involved in supplying/installing RETs. In case of Metallic Stoves, the subsidy process is still
in its first year so there are no cases of after sales service. As per the contract between the
private bodies and AEPC (Biomass Energy Support Programme 2009), in the first year of
installation, they have to visit field two times a year to guarantee after sale service. The parts
guarantee in case of Solar Home System and Metallic Stoves are upto the users and service
providers. The survey has found that almost 25% of the respondents confirmed that the
service providers didn’t make a single visit and one visit in case of 65% cases as shown in the
figure 17 below.
Figure 17: After Sales Service Visit in case of SHS
5.6. Effectiveness
The author defined “Effectiveness” as the subsidy program reaching the poorest
communities, addressing the following questions:
Are the current subsidies making RETs accessible to the poor?
Progression of subsidy rates over time/is the subsidy policy cost-effective?
0
10
20
30
40
50
60
70
One time Two times No Visit
Res
po
nd
ents
(%
)
Frequency of Visits
After Sales Service Visit in case of SHS

63
The primary data collected from the Rural Energy Fund/ESAP (Survey 2010/11) has shown
the following results. Figures 18 and 19 show the portion of subsidy and remaining total
investment in the Solar and Micro Hydro sector from 2001 to 2009. Data on Metallic stoves
is unavailable as the dissemination program just started in mid 2009.
0
200
400
600
800
1000
1200
1400
2001 2002 2003 2004 2005 2006 2007 2008 2009
NR
s. in
mil
lion
Year
TOTAL INVESTMENT / SUBSIDY IN SOLAR HOME SYSTEM
Total subsidy (NRs.in million) Other investment (NRs. In million)
Figure 18: Investment Vs subsidy in SHS

64
0
100
200
300
400
500
600
2001 2002 2003 2004 2005 2006 2007 2008 2009
NR
s. i
n m
illi
on
Year
TOTAL INVESTMENT/SUBSIDY IN MHP
Total subsidy (NRs.in million) Other investment (NRs. In million)
Figure 19: Investment Vs subsidy in MHP
0
10
20
30
40
50
60
70
2001 2002 2003 2004 2005 2006 2007 2008 2009
% o
f To
tal I
nve
stm
en
t
Year
Subsidy Contribution in Total Investment
Solar Home System Micro Hydro Power
Figure 20: Subsidy as a percentage of total investment

65
Figure 20 shows the subsidy contribution in the total investment. This represents the total
figure. It can be seen that in the case of MHP, it is around 50% on average and around 30% in
the case of solar. Currently, the user still has to bear a significant cost to obtain the subsidy.
Metallic Stove: Specific Case Study
In the case of metallic stoves, the survey (Survey 2010/11) showed that subsidy is covering
around 50% of the factory price only. The user also has to bear costs for the remaining
transportation and installation of the system. That varies with the geographical location. In
one location, the user might get by adding an extra 10-20%, whereas it could double in some
places like Humla. The author has conducted a specific case study of Metallic Stoves and
subsidy contribution in the far western region of Nepal to show the reality of the subsidy
program. The following tables 19 and 20 show change in material price of metallic stoves
over the years and Subsidy Vs User's contribution change over the time.
Table 19: Change in Material Price of Metallic Stoves over the years
Year
Rate (NRs. Per kg)
Materials 2006 2007 2008 2009 2010 2011
4mm iron plate 55 58 61 62 65 67
Hot Roll Sheet (16
gauge/1.6 mm) 61 64 67 69 71 75
CGI sheet (26 gauge) 80 85 105 115 120 125
Stainless Steel (26
gauge/1.25 mm) 309 325 350 360 375 400
Source: (Interview with Rijwan Engineering Udhyog, Nepalgunj/ Pre-qualified company)

66
Table 20: Subsidy Vs User's contribution change over the time
S.N. Scenario in 2006 Scenario in 2008 2011
1. Unit cost of model
Weight of
stove = 40 kg
Factory Cost =
NRs. 5000
Unit cost of model
Weight of stove =
40 kg
Factory cost =
NRs. 7345
Unit cost of model
Weight of stove =
40 kg
Factory cost = NRs.
7700
2. Transportation
Air
Transportation
charge from
Nepalgunj to
Simikot,
Humla:
Rs
75.84/kg*40kg
= NRs. 3034
Additional
local
transportation
(porter charge)
from district
headquarter/
airport to
village*NRs.5
0
Transportation
Air Transportation
charge:
Rs 84.15/kg* 40kg
= NRs. 3366
Additional local
transportation
(porter charge)
from district
headquarter/
airport to
village*NRs.80
Transportation
Transportation
charge:
Rs 130/kg* 40kg =
NRs. 5200 Additional local
transportation (porter
charge) from district
headquarter/ airport to
village*NRs.80
Per kg air transportation has
increased by almost 67%
since 2008
Source: (Interview with
staff of Yeti Airlines 2011)
Total cost
per unit
NRs 8084 NRs 10791 excluding
installation charge
NRs. 12980 excluding
installation charge
Increment
%
Baseline 33.4% 60.5%
Subsidy
Allocation
NRs. 2500 NRs. 4000 NRs. 4000
User’s
contributio
n in %
69% of the total cost 63% of total cost 69% of the total cost
Average
Per capita
income
NRs. 10128 – NRs.
13572/annum
Technology
as % of
their
income
Almost a year’s income More than a year’s income
Source: (Survey 2010/11)
The above tables 19 and 20 clearly show the subsidy contribution to the total cost and its
evolution over time. In many places, it is almost impossible for the communities to get the
subsidized system on their own as it costs them their whole income. The case is even worse

67
with solar PV systems and MHPs, as per kW cost of the system are much more expensive.
(See figure 21).
0
200000
400000
600000
800000
1000000
1200000
2001 2002 2003 2004 2005 2006 2007 2008 2009
NP
Rs.
Year
Per kW cost at Users End
Solar per kW Cost MHP per kW cost
Figure 21: Per kW cost at Users' End
Figure 21 shows per kW cost of MHPs and SHSs in different years. Considering 16 W of a
normal SHS costs NRs. 15666, of which the subsidy amounts to just NRs 7000 as of 2011.
Users have to still pay NRs. 8666 per system. Also, considering 100Watt contribution from
one user/HH which is the general case for MHP, the cost is NRs. 16058. Even though the
subsidy covers 50%, they have to bear the remaining fund which is still considerable for
those poor people. Furthermore, this is only the average cost, and it can vary significantly due
to transportation and installation based on different geographical location.

68
Chapter Six: Conclusion and Recommendation
6.1. Conclusion and RecommendationOverall, the ESAP program has achieved its goal
to reach the rural areas providing energy through renewable energy technologies. The subsidy
program can be considered as a successful program in terms of its dissemination number in
ESAP Phase I and phase II. The government subsidy programme through the Rural Energy
Fund is heading in the right direction with some adjustments recommended in its delivery
mechanism.
The positive impacts of RETs can be seen in the livelihoods of the users particularly in terms
of increasing awareness on health and education. Another major benefit can be seen in the
communication sector. Small television, radio and mobile sets are the results of this modern
access to energy. The subsidy program creates a niche market for the RETs suppliers,
manufacturers and installers and giving confidence to them. The market has grown rapidly
over the last ten years, although the confidence levels of the investors are still below the
marked line for the market to be sustainable, once the subsidy program is not continued. The
increase in the number of private bodies and office staff as discussed in section 5.5 on
“sustainability” of chapter five.
There are currently different donor organizations in the renewable energy sector with
different implementation modalities under the AEPC umbrella. The government and its
partners should work towards the implementation of the program with its single best
modality.
The ESAP has taken enough measures to make the whole subsidy delivery system transparent
by taking different measures including photo identification and the introduction of a legal
contract system with the private companies.
With reference to RETs, the subsidy amount needs to be revised and adjusted in Metallic
Stoves, based on the geographical location and remoteness of the region as supported by the
case study details. The flat subsidy rate is not serving effectively due to the variation in
transportation costs throughout the country. In the case of MHP, the end user activities need
to be encouraged to increase the load factor and hence the productivity of the system. The
government has to play a strong role in enhancing the credit mechanism system for hydro and
solar projects. The banks and the insurance companies should be brought in the market. This
completely depends on the government providing clear policies and assurance to the market.

69
Although the subsidized program is successful in electrifying the rural communities via
RETs, the poorest of the poor families are still excluded from the subsidy. The program
seems to benefiting more the rich and upper middle class families rather than the poor
families for which the subsidy was intended. The high capital cost and long subsidy delivery
process are the main important reasons for this failure. The author has proposed a new
modality which might overcome the time barriers and bureaucratic process in the subsidy
delivery mechanism and will decrease the lead time. This will in turn help to reduce the
operational cost of the private companies and will encourage more players to enter the market
increase competition and resulting in lower system costs.
The recommended subsidy delivery modality is described below (see figure 19).

70
Renewable Energy Service Contractors (RESC)
Figure 22: New Working modality incorporating Renewable Energy Service Contractors
The new modality consists of a layer (see figure 22) in between manufacturers/suppliers and
users known as Renewable Energy Service Contractors (RESC). It is a purely private body
investing in the RE sector with the aim of making profit. In the short term, its function is to
ease the subsidy application process and hence make the subsidy delivery modality more
effective and efficient. In the medium term, it starts to build a solid foundation for
commercial dissemination of the technologies. The long term target is to create a niche
market for RETs, without having to rely on external support or subsidy.
Who will fund?
The donors will give a soft loan to the RESC with a government guarantee repay the loan.
The RESC must contribute a minimum of 40% of the total investment of the project proposal.
The loan amount should be based on assessing the capacity of the organization based on the
proposal submitted by the organization. The first loan should be for a minimum of five years,
with the first two years being an interest holiday or zero interest and the last three years being
AEPC
Donors
District Level Service Providers
ESAP
RRESCs/NGO
s RESC
DDCs/GOs
Users/Communities
Users/Communities
District Level NGOs

71
as grace period, with minimal interest. This concept has been based on the Bangladeshi Solar
PV electrification project as described in the literature review in chapter two.
Formation of RESC
The RESC should be established on a regional basis. The government has to conduct
stakeholder meetings to decide the basic selection criteria for the region formation and
number of RESC in the beginning. This should be based on the availability of resources and
population rather than the current administrative division. The current qualified companies
will be given the first opportunity to form the RESC within or outside of their respective
region.
Some of the criteria should be:
Local companies’ investment should not be less than 51%.
50% of the staff should be from the local area. This has two main advantages. First, it
results in trust by the user’s committee in the organization, and second, it makes us of
local human resources, increasing the stability of the workforce. Experience has shown
that outside people are less likely to remain in the workforce and more likely to look for
outside opportunities.
Features:
The concept of this new modality of Renewable Energy Service Contractors (RESC)
incorporates two major benefits over previous subsidy delivery modality. They are as
follows:
The need of VDCs and DDCs recommendation has been removed as the responsibility is
transferred to the RESC.
The responsibility of the RRESCs/NGOs has been slashed and the RESC is responsible for
maintaining the database. The NGOs will help the RESC to create demand and assist in the
information/awareness campaign.
These two features will save the significant time and hence reduce the major administrative
cost of subsidy.
Additional advantages would be as follows:

72
They will introduce the concept of micro financing credit via rural cooperatives and
microfinance companies.
The amount of subsidy has to decrease on a fixed percentage within five years and the donor
support should be diverted to create a platform for industrial growth. This modality is more
focussed on developing the private sector and encouraging entrepreneurs in this sector. In the
long run, it will be helpful for the government to start a decentralized district energy funding
concept as described in the ESAP programme document (ESAP 2006). Within a fixed period
of time when the donors are more convinced of the system, the government can plan to
disburse the subsidy from the respective district known as the District Energy Fund.
Roles and Responsibilities:
Table 21 briefly describes the roles and responsibilities of all organizations involved in this
sector. Table 22 below shows the subsidy flow process with the new modality and the
responsible organizations. In comparison to the existing modality, it definitely saves a
significant amount of processing time; thus being not only more efficient, but more
sustainable as well.
Table 21: Roles and Responsibilities in new modality
Alternative Energy Promotion
Centre (AEPC)
Policy and plan formulation
Liaise with Ministry and donors
Quality Assurance
Liaise with donors and private bodies
Energy Sector Assistance
Programme (ESAP)
Technical Assistance particularly more
on industry development such as establishing Solar
battery manufacturing plant, turbine and generator
development etc.
Loan Sanction Selection Committee for
RESC
Implement Awareness and Information
Campaign through RRESCs with the support from
DDCs

73
Institutional Capacity development
Regional Renewable Energy
Service Centres (RRESCs)
Non Government bodies responsible for
awareness campaign and information dissemination
along with their other programmes such as health and
hygiene, income generation activities etc
District Development Committee
(DDCs): DEES/DEEUs
Coordinate the energy activities in the
district with the support of RRESCs and other
stakeholders
Monitor and support Renewable Energy
service Contractors (RESC)
Quality Assurance of the projects
Renewable Energy service
Contractors (RESC)
Private body with the aim of aiming to
generate profit in the renewable energy sector
Commercialize RETs
Work with manufacturers/suppliers for
the dissemination of projects. In the long run, it has
to act as a supplier as well.
Will give more space to manufacturers to
focus on manufacturing business, allowing them to
have more time for R&D
Will deal with subsidy application form
Responsible for maintaining database
and will be legally liable for its work
Work with DDCs, RRESCs for demand
collection and awareness campaign
Work with district based rural
cooperatives for small capital RETs and handle
bigger scale by itself
More focus on concept of institutional
Solar PV system, Grid Feed in system, Mini Grid
system , electrification through gasification

74
Acts as service centres for RETs in the
respective area with qualified technicians
Student Internship opportunities ( Field
and Theory based)

75
Table 22: Subsidy Delivery Mechanism
Work Flow Responsible Organization
Information and Awareness Campaign RESC, RRESCs, DDCs, district level
NGOs/GOs
Demand collection RESC, RRESCs, DDCs, district level
NGOs/GOs
Subsidy Application Form Filling for Users RESC ( Verification based on Citizenship
Card)
RETs Supply and Installation RESC via Manufactures/Supplier
After Sales Service RESC via Manufactures/Supplier
Maintaining Database RESC
Submission of application form to REF RESC
Fund Disbursement to Manufacturers REF (AEPC/ESAP)
Monitoring and Quality Assurance AEPC/ESAP with DDCs
Integrated Services to Community
The subsidy program can deliver integrated services with RETs to the community. As all
components (Solar, Biomass and Micro Hydro) of the program are running independently
from each other and also from other government programs in different sectors, such as health,
water, sanitation etc., there is a need to implement these technologies integrated with other
development projects to get the best result. The example can be taken from the work of one
NGO known as Rural Integrated Development Services -Nepal (RIDS-Nepal). RIDS-Nepal is
a non-Government organization working in one of the rural communities in Nepal (Zahnd
2011). According to its project director, Alex Zahnd (2011), RIDS-Nepal has developed the
concept of a holistic approach to community development which is focussed on a
comprehensive approach rather than being a project specific selective approach. The
organization works on the concept of “Family of Four” and “Family of four plus” integrated
with RETs such as Solar PV, thermal, pico hydro and biomass fired improved cook stoves.
The Family of four includes the following:
“A pit latrine for improved hygiene/health
A smokeless stove inside the house for cooking/room heating/hot water

76
Basic electric indoor lighting and
Access to clean drinking water” (Zahnd 2012, p2).
These projects are implemented in the first instance to support the basic living needs of the
impoverished people. After these projects have been implemented, the family of four plus
projects are introduced, consisting of the following:
“Greenhouse for high-altitude villages
Non-Formal-Education (NFE) classes for mothers and out-of-school children
High-Altitude Solar Water Heating (HASWH) bathing centre
Solar Cooker for cooking during the day
Solar drier to dry vegetables, fruits, meat etc. for winter and income generation
Slow Sand Water Filter (SSWF)
Nutrition program for malnourished children <5-years of age” (Zahnd 2012).
The aim of all these projects is to raise the living standard of the target communities and to
make the project more sustainable in the long run. The combined effect of all these projects is
much more than it is for individual projects working separately in the same area. This saves
the project money and time, reducing the administrative expenses.
Overall, the research project has fulfilled its given objectives as stated in chapter one. The
government has to play the major role in streamlining the RETs sector and subsidy delivery
modality. The market has to be more competitive and fair in order to ensure that the users are
being directly benefited by the subsidy program. The research has evaluated the effectiveness
of the subsidy program with the limited number of sample size. The sample size has to
increase and further works as described in section 6.2 is needed to examine the program in
much effective way. The research concluded that the effective and practical policies need to
be placed to increase the impact of the subsidy program benefiting both users and private
bodies.
6.2. Further Research
Further research is required in the following areas:

77
The recommended modality of “Renewable Energy Service Contractors” can be
studied in more detail to know its advantages and disadvantages in much more detail.
A comparative study of different implementation modalities of the different programs
under the same umbrella of AEPC will yield the pros and cons of all modalities. The
result will be helpful in preparing a common implementation modality for the
subsidized program, making the system delivery much effective and efficient.
A study can be conducted to see the subsidy delivery timeline in detail, taking
considerable sample size.
A detailed study on the credit enhancement in the subsidized RETs program is
recommended and this requires the involvement of the financial sector to ensure the
sustainability of the RETs market.

78
References
1. Acharya, A. 2011. “A Decade of Democratic Deficit.” Nepali Times. May 13-May 19.
http://nepalitimes.com/issue/2011/05/13/ByTheWay/18193 (accessed July 24, 2011).
2. ADB. 2011. Economic trends and prospects in developing Asia: South Asia.
http://www.adb.org/documents/books/ado/2011/ado2011-nep.pdf (accessed March 1,
2011).
3. AEPC. 2010. Rural Energy Policy.
http://www.aepc.gov.np/index.php?option=com_content&view=category&layout=blog&i
d=87&Itemid=116. (accessed October 15, 2010).
4. AEPC. 2010a. AEPC Homepage. http://www.aepc.gov.np/. (accessed September 11,
2010).
5. AEPC .2010b. AEPC: Introduction & Working Modality. Lalitpur: AEPC.
6. AEPC .2011. AEPC Annual Progress Report 2010. Volume 1. Lalitpur: AEPC
7. AusAID.2003. Baseline Study Guides.
http://www.ausaid.gov.au/publications/pdf/baseline_guidelines.pdf (accessed July 24,
2011).
8. Author Experience.2009. Team Member of Biofuel Technical Committee. Kathmandu:
AEPC.
9. Banerjee, Sudeshna G., A.S. Hussain, and A. Samad. 2011. Power and People: The
Benefits of Renewable Energy in Nepal. Washington: World Bank.
http://www.esmap.org/esmap/sites/esmap.org/files/RenewableEnergy_ESMAP_Nepal_7-
12-11.pdf (accessed July 2, 2011).
10. Bangladesh. Ministry of Power, Energy and Mineral Resources.2011. Bangladesh’s
Power Sector: At a Glance. http://www.powerdivision.gov.bd/index.php?page_id=262
(accessed August 11, 2011).
11. Bangladesh. Ministry of Power, Energy and Mineral Resources.2008. Renewable Energy
Policy of Bangladesh.
http://www.powerdivision.gov.bd/images/additional_images/REP_English.pdf (accessed
September 21, 2011).
12. Biomass Energy Support Programme. 2009. Metallic Stoves Subsidy Delivery Modality.
Lalitpur: AEPC.
13. Biomass Energy Support Programme/ESAP. 2001-2011 Field Photo Collection. Lalitpur:
AEPC.
14. CIA. 2010. The World Factbook: Nepal. https://www.cia.gov/library/publications/the-
world-factbook/geos/np.html (accessed August 1, 2010).

79
15. Currency Converter.2011.Tranzfers. http://www.currencyconverter.com.au/ (accessed
November 10, 2010).
16. ESAP.2010. ESAP MIS Database.Lalitpur:AEPC
17. ESAP .2006. ESAP Phase II- Programme Document: Lalitpur: AEPC.
18. ESAP.2011. Analytical Study on Subsidy Rates for Rural Renewable Energy
Technologies & their Delivery Mechanism. Lalitpur: AEPC.
19. Foundation Nepal.2011.Income Levels and Malnutrition in Humla.
http://www.foundation-nepal.org/content/income-levels-and-malnutrition-humla
(accessed June 20, 2011).
20. Grameen Shakti.2011.Solar PV Program: Financing Solar Home Systems.
http://www.gshakti.org/index.php?option=com_content&view=article&id=66&Itemid=6
2 (accessed May 15, 2011).
21. IDCOL.2010. IDCOL Solar Energy Program.
http://www.idcol.org/Download/IDCOL%20Solar%20Energy%20Program.pdf (accessed
September 21, 2010).
22. IEA. 2010. Selected 2007 Indicators for Nepal.
http://www.iea.org/stats/indicators.asp?COUNTRY_CODE=NP (accessed April 1,
2010).
23. IEA.2011. International Small-Hydro Atlas: Nepal. http://www.small-
hydro.com/index.cfm?fuseaction=welcome.home (accessed January 28, 2011).
24. Juggle. 2010. Nepal: Topographic Map of Nepal.
http://advocacynet.org/blogs/media/users/nicole/Nepal_map_topography.jpg (accessed
August 2, 2010).
25. Nepal. CBS. 2011. National Population and Housing Census 2011. Kathmandu: Central
Bureau of Statistics
26. Nepal. Ministry of Energy. 2010. Policy. http://www.moen.gov.np/policy.php (accessed
September 13, 2010).
27. Nepal. Ministry of Environment.2006.Rural Energy Policy 2006.
http://www.aepc.gov.np/images/pdf/RE-Policy-2006.pdf (accessed September 13,
2010).
28. Nepal Ministry of Environment.2008. Renewable (Rural) Energy Subsidy Mechanism,
2066. http://www.aepc.gov.np/images/pdf/resdm2011.pdf (accessed September 10, 2011).
29. Nepal. Ministry of Forest and Soil Conservation. 2010. Forest Law and Master Plan.
http://www.mfsc.gov.np/upload/downloads.htm (accessed March 13, 2010).

80
30. Nepal. Ministry of Science and Technology.2010. Policies, Acts & Regulations.
http://www.most.gov.np/np/index.php?option=com_content&view=article&id=70&Itemi
d=58&lang=en (accessed September 13, 2010).
31. Nepal. National Planning Commission.2008. About Us: Introduction.
http://www.npc.gov.np/uploads/plans/20110902104225.pdf (accessed July 14, 2010).
32. Nepal. Ministry of Finance.2011. Economic Survey FY 2008 – 2009: Energy and
Forestry. http://www.adb.org/documents/books/ado/2011/ado2011-nep.pdf (accessed
July 14, 2011).
33. Nepal. Ministry of Finance.2011. Economic Survey FY 2010 – 2011:
http://www.mof.gov.np/publication/budget/2011/surveyeng.php (accessed July 14, 2011).
34. Nepal. National Planning Commission.2008. Three Year Interim plan.
http://www.npc.gov.np/uploads/plans/20110902104225.pdf (accessed July 14, 2010).
35. NIBL. 2011. Interest Rates.
http://www.nibl.com.np/index.php?option=com_content&view=article&id=48&Itemid=3
2 (accessed August 13, 2011).
36. NMS .2011. “Brain drain major educational problem: Prime Minister Bhattarai.” Nepal
Mountain News. November 7. http://www.nepalmountainnews.com/cms/?p=41988
(accessed November 7, 2011).
37. NORAD. 2011. Joint Review of Energy Sector Assistance Programme (ESAP II).
http://um.dk/da/~/media/UM/Danish-site/Documents/Danida/Det-goer-
vi/Miljoe/WMESAP%20II%20Joint%20Rev%C3%ADewfinal.ashx (accessed July 24,
2011).
38. NRB.2011. Foreign Exchange Rates.
http://www.nrb.org.np/fxmexchangerate.php?YY=2011&MM=06&DD=14&B1=Go
(accessed June 14, 2011).
39. OCHA Nepal. 2010. VDC Secretary Presence in Nepal. http://www.internal-
displacement.org/8025708F004CE90B/(httpDocuments)/B8B7E489B28D274DC12576E
E0031A2D3/$file/2010-03-22-VDC-Secretary-Notes.pdf (accessed December 24, 2010).
40. Rajbanshi, K. J. 2002. Zoo-geographical distribution and the status of coldwater fish in
Nepal. Volume 364 DOI: Food and Agriculture Organization. United Nations
http://www.fao.org/docrep/005/y3994e/y3994e0r.htm (accessed November 16, 2010).
41. Rijan, Kamal., and N.K. Bansal.2000. Profiting from Sunshine. Kathmandu: ICIMOD.
http://books.icimod.org/uploads/ftp/Profiting%20from%20sunshine.pdf (accessed
August 1, 2010).
42. RETS. 2010. Welcome to RETS. http://www.retsnepal.org/ (accessed September 10,
2011).

81
43. Solar Energy Support Programme/ESAP. 2001-2011 Field Photo Collection. Lalitpur:
AEPC.
44. SWERA. 2010. Meteorology: Map of Nepal selected meteorological stations and
elevation from NREL.
http://swera.unep.net/index.php?id=metainfo&rowid=223&metaid=342 (accessed
September 16, 2010).
45. Survey 2010/11. Field Visit Report 2010-2011 for Thesis work entitled Evaluation and
Analysis of Impact of Subsidies on Small Scale Renewable Energy Technologies
Dissemination: A Case Study of Nepal. (Author: Pandey, Rojan Kumar)
46. Transparency International.2011. Corruption Perceptions Index.
http://www.transparency.org/policy_research/surveys_indices/cpi/2010 (accessed
November 7, 2011).
47. UNEP. 2008. The Impact of Energy Studies: Reforming Energy Subsidies.
http://www.unep.org/pdf/pressreleases/reforming_energy_subsidies.pdf (accessed
October 15, 2010).
48. UNHCR.2001. Administrative Map of Nepal. http://www.unhcr.org/3c2357144.html
(accessed October 10, 2010).
49. Urmee, Tania.2009.Solar PV Electrification Programs in developing Countries: Towards
an Holistic Approach. Murdoch: Murdoch University.
50. WECS. 2011. Energy Synopsis Report 2010. Kathmandu: Water and Energy Commission
Secretariat. http://www.wec.gov.np/noticefile/test_1309074425.pdf (accessed July 27,
2011).
51. WEPA. 2010. Nepal: State of Water Resources. http://www.wepa-
db.net/policies/state/nepal/state.htm (accessed November 16, 2010).
52. Zahnd, A. 2010. Light. http://www.rids-nepal.org/index.php/Light.html (accessed
December 10, 2010).
53. Zahnd A., 2012. “The Role of Renewable Energy Technology in Holistic Community
Development.” PhD diss., Murdoch University.

82
Appendix
I. Survey Questionnaire
BASIC INFORMATION
1. Identifying Household Location:
Name of Village / VDC/Ward No.
Household Number
Date of Interview ......./……./……. Time: (a.m./p.m.)
Name of interviewee
2. Family information background
Q. No Questions Answer
9. Age
10. Sex
11. Educational Status
12. Primary occupation
13. Secondary occupation
14. Number of family member
15. Family type
16. Monthly/Annual income of the family (Rs.)
ENERGY and TECHNOLOGIES
(Gender)
1=Male,
2=Female
(Educational
status)
A=Illiterate
B= Literate
1-9=School,
10=SLC, 12=
HSS,
14= BSc, 16=
MSc
17=Phd
(Occupation)
1=Agriculture,
2=Business
3=Worker, 4=Porter
5=Teacher, 6=Student
7=Private job, 8=Govt.
job
9= Tourist guide,
10=Others
(Religion)
1=Hindus
2=Buddhist
3=Muslim
4=Christian
5=Others
(Family type)
1=Single
2=Joint

83
1. Types & Uses of Household/Business Fuel
Using the fuel list below, what types of fuel do you use for the following purposes?
(List in order of importance using numbers shown below)
Wood =1
Dung = 2
Agricultural residues = 3
Other residues = 4
Charcoal = 5
Kerosene (Paraffin) = 6
Bottled gas (LPG) = 7
Solar cooker = 8
Solar electric (solar PV) = 9
Grid electricity = 10
Batteries = 11
Wax candle = 12
Pico Hydro = 13
Water Mill (IWM/TWM)
If 'other' fuel used, please specify fuel
Purpose Fuel Priority
Most important fuel Second Priority Third priority
Cooking (including drinks)
Lighting
Keeping warm
Heating water for other purposes
Cooking food/drink for selling
Cooking animal feed
Electrical equipment
Other tasks (specify below)
If fuel is used for another type of household
task, please specify task (s)
Task 1:
Task 2:

84
1. Getting Fuel: Buying And Gathering
Is your main fuel gathered or bought?
1- all gathered 3- mostly bought
2- mostly gathered 4- all bought
If you gather fuel, please mention:
Source of gathering
Distance from home (in hour)
If you buy it, how much do you pay for it per month? NRs.
Wood
Charcoal
Kerosene (paraffin)
Bottled gas
Grid electricity
Batteries
Wax candles
Others
Total (in NRs.)
What are the reasons for buying fuel? (more than one reason
can be selected)
1. Scarcity of fuel for gathering
2. Faster than gathering it
3. Cleaner for cooking
4. Other reason (please specify)
If you or your family gather fuel, how often is it gathered?
1- every week
2- every month
3- Twice in a year
4- Specific time(mention)
If you or your family gather it, about how long, on average,
does each collection trip take at this time of year?
………./……….(hrs/mins.)
If you gather fuel, for how much period, it will be sufficient ……………(months)
If you gather fuel, do you experience any problems when
gathering it?
If any, write the problems?
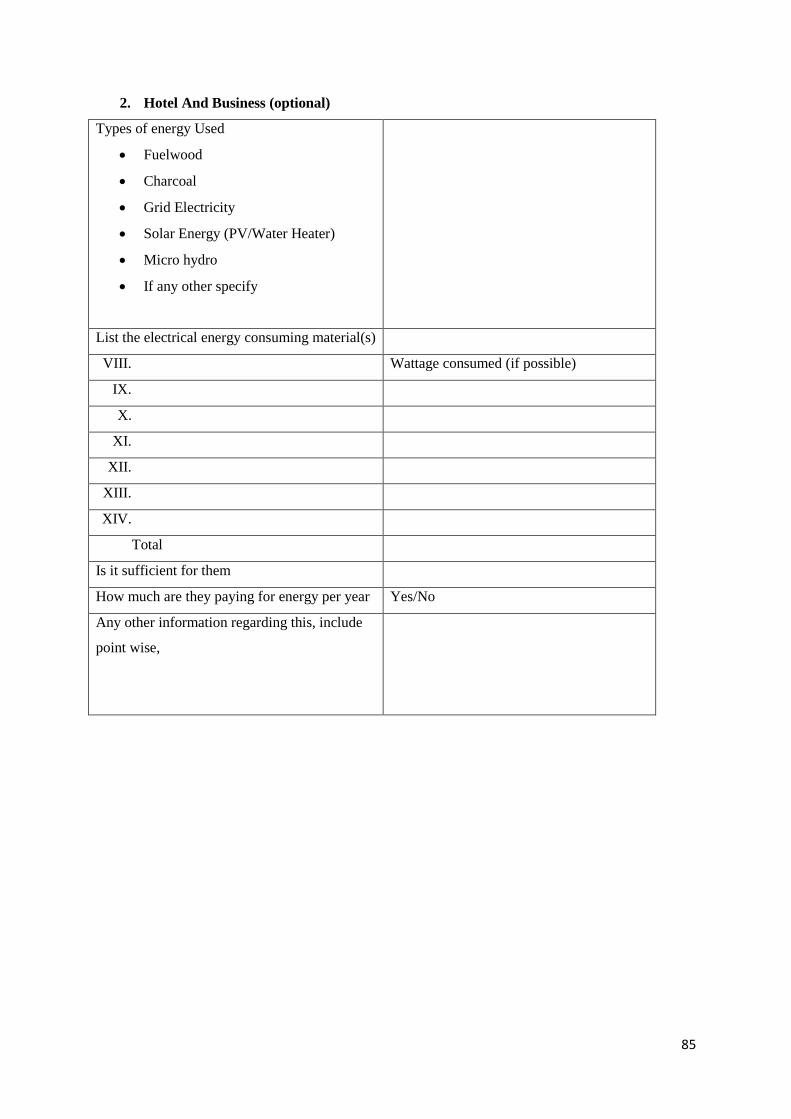
85
2. Hotel And Business (optional)
Types of energy Used
Fuelwood
Charcoal
Grid Electricity
Solar Energy (PV/Water Heater)
Micro hydro
If any other specify
List the electrical energy consuming material(s)
VIII. Wattage consumed (if possible)
IX.
X.
XI.
XII.
XIII.
XIV.
Total
Is it sufficient for them
How much are they paying for energy per year Yes/No
Any other information regarding this, include
point wise,

86
3. IMPROVED COOKING STOVES
System Description
Stoves
Type of stove
Shielded mud fire or mud stove
(including chimney stove)
Wood-burning ceramic stove (made of
fired clay)
Metal stove
Improved charcoal stove
Other type of stove
Smoke Extraction Chimney/Smoke hood/Extraction
Installed Date
Economical
Capital cost of system
User’s contribution
Government contribution
Direct Subsidy
Indirect subsidy (government bodies
like VDC, DDC )
Others
Affordability in absence of subsidy
Maintenance
Fault in system components (time after
installation in months)
Water tank
Stove body
Others
No. of Maintenance visit
Any other costs paid by users
Users’ comments (benefits/un-satisfaction)

87
4. SOLAR PHOTOVOLTAIC
System Description
Installer company
Installed Date
PV system size in Watt
Battery bank capacity in Wh
Light gloves type (WLEDs/ CFL/Incandescent)
Power used (Watt)
Economical
Capital cost of system
User’s contribution
Government contribution
Direct Subsidy
Indirect subsidy (government bodies
like VDC, DDC )
Others
Affordability in absence of subsidy
Maintenance
Fault in system components (time after
installation in months)
Battery
Charge Controller/Inverter
Lights
Others
No. of Maintenance visit
Any other costs paid by users
Users’ comments (benefits/un-satisfaction)
……………………………………………………………………………………………………………
……………………………………………………………………………………………………………
……………………………………………………………………

88
5. MICRO HYDRO POWER
System Description
Installer company
Installed Date
MHP Capacity
Power being generated
Load factor
Economical
Capital cost
User’s contribution
Government contribution
Direct Subsidy
Indirect subsidy (government bodies
like VDC, DDC )
Others
Affordability in absence of subsidy
Maintenance
Fault in system components (time after
installation in months)
Generator
Electronic Load Controller
Turbine
Others
No. of Maintenance visit
Any other costs paid by users
Operating cost (Human resource)
Operating cost (Others)
Users’ comments (benefits/un-satisfaction)

89
MANUFACTURERS/SUPPLIERS/INSTALLERS
x. Total number of system installed per year
Year No of
systems
Capacity
(Watt)
District No of
systems
Capacity
(Watt)
1997 2003
1998 2004
1999 2005
2000 2006
2001 2007
2002 2008
2009
xi. Institutional Arrangement and Human Resources
Year No of
technical
staffs
No of non
technical
administrative
staffs
Labor Total Remarks
1997
1998
1999
2000
2001
2002
2003
2004
2005
2006
2007
2008
2009
xii. Profit margin per system/project
……………………………………………………………………………………………………………
……………………………………………………………………………………………………………

90
xiii. Investment of company in this sector for commercialization of technologies
……………………………………………………………………………………………………………
……………………………………………………………………………………………………………
xiv. Market in absence of subsidy
……………………………………………………………………………………………………………
……………………………………………………………………………………………………………
xv. Support expected from government
……………………………………………………………………………………………………………
……………………………………………………………………………………………………………
……………………………………………………………………………………………………………
………………………………………………………
xvi. System Manufacturing/Selling
Components Remarks Local Manufactured/Imported
SOLAR
Solar PV
Battery
Charge Controller
Inverter
Cables
Lights
Others
MICRO HYDRO
Turbines
Pipes
Generators
Others
BIOMASS
Stoves
Raw materials

91
xvii. Time flow chart for Subsidy channelizing process (in days)
Planned Real
Demand
Collection
Feasibility
report
Manufacturing/I
mport
Installation
Subsidy form
process
Submission
to REF
Clearance
from REF
Pre Feasibility
report

92
xviii.
Planned Actual
Subsidy
Disbursement
REF Approval
DDC/RRESCs
Approval
VDC
Approval

93
xix. Manufactures any comments (in relation to current subsidy delivery mechanism and possible
improvements)
……………………………………………………………………………………………………………
……………………………………………………………………………………………………………
……………………………………………………………………………………………………………
……………………………………………………………………………………………………………
……………………………………………………………………………………………………………
……………………………………………………………………………………………………………
………………
……………………………………………………………………………………………………………
……………………………………………………………………………………………………………
……………………………………………………………………………………………………………
……………………………………………………………………………………………………………
……………………………………………………………………………………………………………
……………………………………………………………………………………………………………
………………
……………………………………………………………………………………………………………
……………………………………………………………………………………………………………
……………………………………………………………………………………………………………
……………………………………………………………………………………………………………
……………………………………………………………………………………………………………
……………………………………………………………………………………………………………
………………
……………………………………………………………………………………………………………
……………………………………………………………………………………………………………
……………………………………………………………………………………………………………
……………………………………………………………………………………………………………
……………………………………………………………………………………………………………
……………………………………………………………………………………………………………
………………

94
MANAGEMENT STAFFS (including POLICY MAKERS)
This includes management level staffs including policy makers at Ministry.
iii. SWOT(Strength, Weakness, Opportunities and Threat) Analysis of the program in relation to
increasing:
Affordability
Accessibility
Employment (Institutional/Commercial Capacity)
iv. RETs Market in absence of subsidized program\
It should see the policy in relation to
Ease to administer
Ease to implement
Fairness and efficient
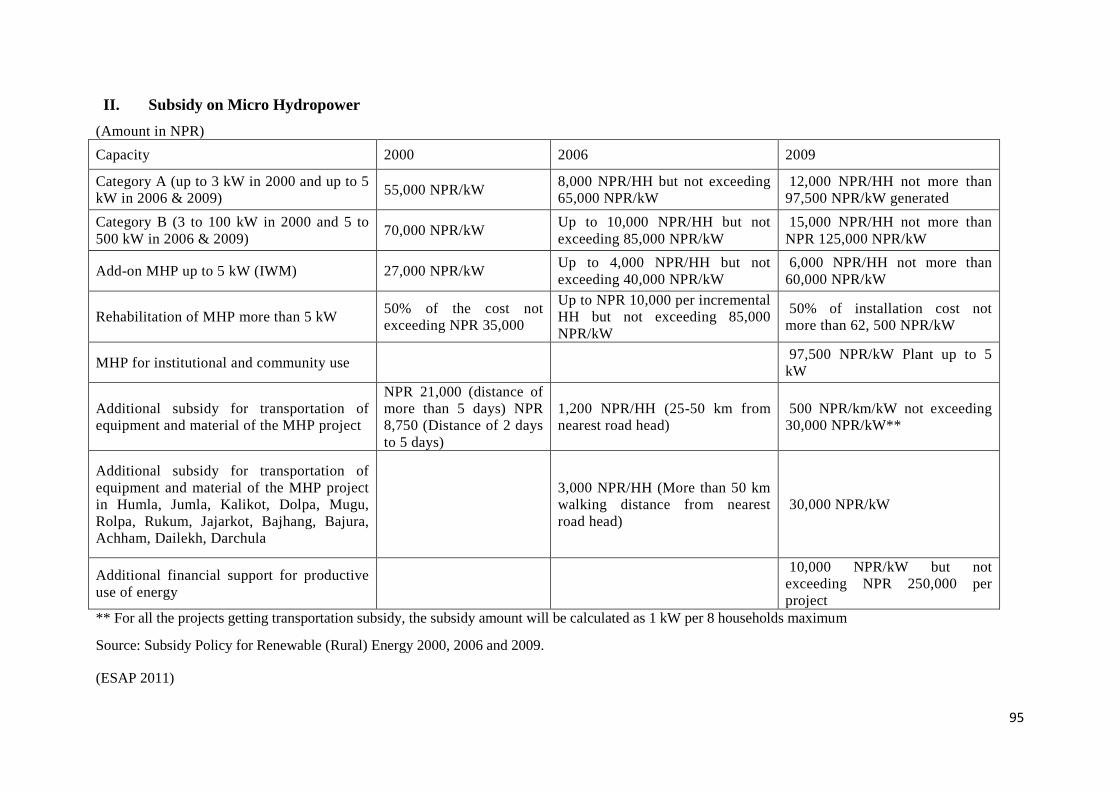
95
II. Subsidy on Micro Hydropower
(Amount in NPR)
Capacity 2000 2006 2009
Category A (up to 3 kW in 2000 and up to 5
kW in 2006 & 2009) 55,000 NPR/kW
8,000 NPR/HH but not exceeding
65,000 NPR/kW
12,000 NPR/HH not more than
97,500 NPR/kW generated
Category B (3 to 100 kW in 2000 and 5 to
500 kW in 2006 & 2009) 70,000 NPR/kW
Up to 10,000 NPR/HH but not
exceeding 85,000 NPR/kW
15,000 NPR/HH not more than
NPR 125,000 NPR/kW
Add-on MHP up to 5 kW (IWM) 27,000 NPR/kW Up to 4,000 NPR/HH but not
exceeding 40,000 NPR/kW
6,000 NPR/HH not more than
60,000 NPR/kW
Rehabilitation of MHP more than 5 kW 50% of the cost not
exceeding NPR 35,000
Up to NPR 10,000 per incremental
HH but not exceeding 85,000
NPR/kW
50% of installation cost not
more than 62, 500 NPR/kW
MHP for institutional and community use 97,500 NPR/kW Plant up to 5
kW
Additional subsidy for transportation of
equipment and material of the MHP project
NPR 21,000 (distance of
more than 5 days) NPR
8,750 (Distance of 2 days
to 5 days)
1,200 NPR/HH (25-50 km from
nearest road head)
500 NPR/km/kW not exceeding
30,000 NPR/kW**
Additional subsidy for transportation of
equipment and material of the MHP project
in Humla, Jumla, Kalikot, Dolpa, Mugu,
Rolpa, Rukum, Jajarkot, Bajhang, Bajura,
Achham, Dailekh, Darchula
3,000 NPR/HH (More than 50 km
walking distance from nearest
road head)
30,000 NPR/kW
Additional financial support for productive
use of energy
10,000 NPR/kW but not
exceeding NPR 250,000 per
project
** For all the projects getting transportation subsidy, the subsidy amount will be calculated as 1 kW per 8 households maximum
Source: Subsidy Policy for Renewable (Rural) Energy 2000, 2006 and 2009.
(ESAP 2011)

96
III. Subsidy for Solar Technology
(Amount in NPR)
S. N. Type 2000 2006 2009
1 Solar Home System 10 Wp 20 Wp >30
Wp
10-18
Wp
More than
18 Wp
5 Wp WLED
Based
10-18
Wp
More
than 18
Wp
5 Wp WLED
Based
Category A Additional 150% of category C
subsidy 7,000 10,000
50% subsidy
but not
exceeding
NPR 1250
7,000 10,000
2,000 Category B
Additional 125% of category C
subsidy 6,000 8,000 6,000 8,000
Category C
50% of the cost not
exceeding NPR
8,000*
8,000 5,000 6,000 5,000 6,000
Category Description
Category A
VDCs categories as Category
A by Ministry of Local
Development (GON) in Nepal
Gazette
Karnali and adjoining districts
(Humla, Jumla, Kalikot, Dolpa,
Mugu, Rolpa, Rukum, Jajarkot,
Bajhang, Bajura, Achham, Dailekh,
Darchula) and VDCs categories as
Category A by Ministry of Local
Development GON in Nepal Gazette
Karnali and adjoining districts
(Humla, Jumla, Kalikot, Dolpa,
Mugu, Rolpa, Rukum, Jajarkot,
Bajhang, Bajura, Achham, Dailekh,
Darchula) and VDCs categories as
Category A by Ministry of Local
Development GON in Nepal Gazette
Category B
VDCs categories as Category
B by Ministry of Local
Development (GON) in Nepal
Gazette
VDCs categories as Category B by
Ministry of Local Development
(GON) in Nepal Gazette
VDCs categories as Category B by
Ministry of Local Development
(GON) in Nepal Gazette
Category C Remaining Districts Accessible VDCs Accessible VDCs
* The subsidy amount will be reduced every year by 10% for >30 Wp of category C and it was done till 2005.
Source: Subsidy Policy for Renewable (Rural) Energy 2000, 2006 and 2009, GoN
(ESAP 2011)

97
Subsidy for Solar Technology (contd..)
S. N. Type 2000 2006 2009
2 Institutional Solar PV
System
Subsidy for public
institution 75% of the cost 75% of the cost
Subsidy for lighting of
public places
75% of the cost not exceeding NPR
15,000
3 Solar Water Pump
Subsidy for solar PV 75% of the cost up to 500 Wp 75% of the cost up to 1000 Wp 75% of the cost not exceeding NPR
1,000,000
4 Solar Cooker
Subsidy for solar
Cooker
50% of the cost but not
exceeding NPR 3,750 per
Cooker
50% of the cost but not exceeding
NPR 4,000 per Cooker
50% of the cost not exceeding NPR
5,000,000
5 Solar Dryer
Subsidy for household
use 50% of the cost
50% of the cost but not exceeding
NPR 20,000 per Cooker 50% of the cost up to NPR 20,000
Subsidy for commercial
purpose 70% of the cost 70% of the cost 70% of the total cost
* The subsidy amount will be reduced every year by 10% for >30 Wp of category C and it was done till 2005.
Source: Subsidy Policy for Renewable (Rural) Energy 2000, 2006 and 2009, GoN
(ESAP 2011)
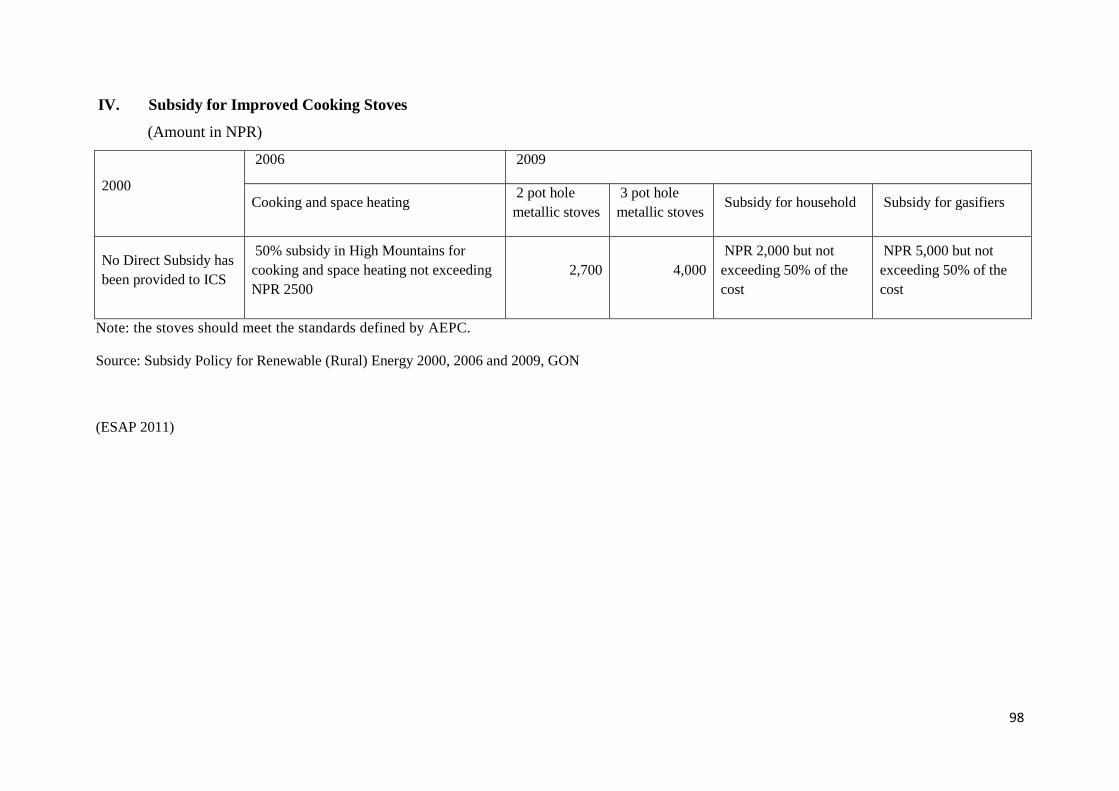
98
IV. Subsidy for Improved Cooking Stoves
(Amount in NPR)
2000
2006 2009
Cooking and space heating 2 pot hole
metallic stoves
3 pot hole
metallic stoves Subsidy for household Subsidy for gasifiers
No Direct Subsidy has
been provided to ICS
50% subsidy in High Mountains for
cooking and space heating not exceeding
NPR 2500
2,700 4,000
NPR 2,000 but not
exceeding 50% of the
cost
NPR 5,000 but not
exceeding 50% of the
cost
Note: the stoves should meet the standards defined by AEPC.
Source: Subsidy Policy for Renewable (Rural) Energy 2000, 2006 and 2009, GON
(ESAP 2011)

99
V. Subsidy Delivery Mechanism for Micro Hydro
(ESAP 2011)
Request from
community for Micro-
hydro/Pico-hydro
installation and
subsidy
Disbursement of
Subsidy to Company Pre-feasibility study
pre-qualified
Company/DDC/REDS
Recommendation
to IREF/PMC for
subsidy
Appraisal of feasibility
study report through
technical review
committee of AEPC
Detailed feasibility
study from qualified
consultant/company

100
VI. Subsidy Delivery Mechanism for Solar Home System
(ESAP 2011)
AEPC/ESAP SSP
(Process/Appraisal)
Application from
company for subsidy
delivery
Application from
users / consumers
REF
Verified for fulfilment
of criteria
REF Executive
Committee
(Approved Subsidy)

101
VII. Administrative Map of Nepal
Figure 23: Administrative Map of Nepal
Source: (UNHCR 2001)

102