Evaluating User Experience for Interactive Television: Towards the ...
18
Evaluating User Experience for Interactive Television: Towards the Development of a Domain-Specific User Experience Questionnaire Regina Bernhaupt 1 and Michael Pirker 2 1 IRIT, Team ICS, 118, Route de Narbonne, 31062 Toulouse, France 2 ruwido, Köstendorferstr. 8, 5202 Neumarkt, Austria [email protected]; [email protected] Abstract. This paper presents a questionnaire-based approach to evaluate the user experience (UX) while interacting with interactive Television (iTV) sys- tems. Current contributions in the field of UX propose generic methods appli- cable to various application domains, whereas our contribution is dedicated to the specific domain of interactive TV systems. Based on a classification of UX dimensions from a literature review, the first version of the questionnaire is fo- cusing on the dimension’s aesthetics, emotion, stimulation and identification. A validation study with 106 participants was performed to assess the relations be- tween the evaluated UX dimensions, as well as their fit to the underlying theo- retical assumptions. Results showed that the UX dimensions aesthetics, emotion and stimulation are important for the domain of iTV, while identification was not confirmed. The study revealed significant correlations between the type of IPTV system used and the emotional and stimulation dimension. Additionally, a significant effect of the TV reception mode and the type of IPTV box owned on the emotion towards the system was observed. Beyond the contribution of the questionnaire that is directly applicable for any iTV system, the findings de- scribed in the paper demonstrate the need for user experience evaluation meth- ods targeted at specific domains: the validation of the questionnaire shows that identification is not a central dimension of user experience when interacting with interactive TV. Keywords: interactive TV, iTV, user experience, UX, questionnaire, Internet Protocol Television, IPTV, emotion, stimulation, identification. 1 Introduction User experience (UX) is described as dynamic, time dependent [29] and beyond the instrumental [18]. The overall goal of UX is to understand the role of affect as an antecedent, a consequence and a mediator of technology [18]. The concept of UX focuses rather on positive emotions and emotional outcomes such as joy, fun and pride [18]. The development of a general definition of UX is still focus of scientific discourse [32], and despite the lack of a clear definition, the concept of UX has become an important design aspect of interactive systems.
Transcript of Evaluating User Experience for Interactive Television: Towards the ...
Evaluating User Experience for Interactive Television:
Towards the Development of a Domain-Specific User
Experience Questionnaire
Regina Bernhaupt1 and Michael Pirker
2
1 IRIT, Team ICS, 118, Route de Narbonne, 31062 Toulouse, France 2 ruwido, Köstendorferstr. 8, 5202 Neumarkt, Austria
[email protected]; [email protected]
Abstract. This paper presents a questionnaire-based approach to evaluate the
user experience (UX) while interacting with interactive Television (iTV) sys-
tems. Current contributions in the field of UX propose generic methods appli-
cable to various application domains, whereas our contribution is dedicated to
the specific domain of interactive TV systems. Based on a classification of UX
dimensions from a literature review, the first version of the questionnaire is fo-
cusing on the dimension’s aesthetics, emotion, stimulation and identification. A
validation study with 106 participants was performed to assess the relations be-
tween the evaluated UX dimensions, as well as their fit to the underlying theo-
retical assumptions. Results showed that the UX dimensions aesthetics, emotion
and stimulation are important for the domain of iTV, while identification was
not confirmed. The study revealed significant correlations between the type of
IPTV system used and the emotional and stimulation dimension. Additionally, a
significant effect of the TV reception mode and the type of IPTV box owned on
the emotion towards the system was observed. Beyond the contribution of the
questionnaire that is directly applicable for any iTV system, the findings de-
scribed in the paper demonstrate the need for user experience evaluation meth-
ods targeted at specific domains: the validation of the questionnaire shows that
identification is not a central dimension of user experience when interacting
with interactive TV.
Keywords: interactive TV, iTV, user experience, UX, questionnaire, Internet
Protocol Television, IPTV, emotion, stimulation, identification.
1 Introduction
User experience (UX) is described as dynamic, time dependent [29] and beyond the
instrumental [18]. The overall goal of UX is to understand the role of affect as an
antecedent, a consequence and a mediator of technology [18]. The concept of UX
focuses rather on positive emotions and emotional outcomes such as joy, fun and
pride [18]. The development of a general definition of UX is still focus of scientific
discourse [32], and despite the lack of a clear definition, the concept of UX has
become an important design aspect of interactive systems.
There are a growing number of methods available to evaluate user experience in all
stages of the development process. Surveys on these contributions are already availa-
ble such as in [3] where Bargas-Avila and Hornbæk present an overview on UX and
UX evaluation methods or in [55] where Vermeeren and colleagues have been col-
lecting and classifying user experience methods. Beyond that work on generic meth-
ods, contributions have been proposed for specific application domains, e.g. for
games and entertainment [4] or for the evaluation of mobile devices like mobile
phones [49].
What is still not answered is whether generic user experience evaluation methods
provide meaningful and sufficiently precise insights when applied to specific applica-
tion domains. In the field of usability the answer to that question was already negative
[12]. Due to the idiosyncratic nature of user experience that is situational, time de-
pendent, and influenced by the technological context especially the type of system
and functionality, we advocate that there is a need to adapt, customize and validate
specific UX evaluation methods for the respective application areas.
The domain of interactive TV (iTV) is described as being specific due to a variety
of contextual factors, including the spatial, temporal, social, personal and technologi-
cal context [42]. Beyond the difficulties brought by these factors, the evaluation of
user experience for iTV is complex, as the system to be evaluated consists of multiple
components: the TV screen, (a set of) remote controls, (possibly) a set top box (i.e.
the hardware device connecting the TV to the IP network) and potentially other de-
vices in the living room (e.g. surround sound system). One of the characteristics of the
iTV domain is also the multiple goals of the users aiming at being entertained and
informed.
We have been applying various UX methods in the area of iTV [5, 44, 45] which
otherwise has received only limited attention. These studies have been carried out in
close cooperation with one of the industry leaders in hardware and software systems
for iTV. However, even though the evaluation results were iteratively fed into the
development process of the systems, customer feedback reported by our client were
exhibiting users’ frustration and dissatisfaction, demonstrating a user experience far
below expectations. Based on these results we have been working on the definition of
a user experience evaluation method specifically adapted for iTV systems.
This paper presents the development and the validation of the first version of a user
experience evaluation questionnaire called iTV-UX. The goal of the questionnaire is
to enable the evaluation of all types of iTV systems in terms of user experience. The
iTV-UX is based on four UX dimensions: visual and aesthetic experience, emotion
and affect, stimulation, and identification.
2 State of the Art
User Experience (UX) is a research topic within the HCI community that has gained a
lot of attention within the past years [3]. The term UX still lacks a clear and agreed-on
definition. The reasons therefore are rooted in the nature of UX, which is associated
within a lot of different concepts and meanings within the community, or as Law et al.
[34, p. 1] put it “User Experience (UX) is a catchy as well as tricky research topic,
given its broad applications in a diversity of interactive systems and its deep root in
various conceptual frameworks, for instance, psychological theories of emotion.”
Despite several attempts to define and better explain the user’s experience when in-
teracting with an interactive system in the past, the HCI community still has no uni-
fied definition of what really makes up UX, how to measure or evaluate UX, and how
to rate it. An ISO Standard defining UX exists, but leaves a lot of room for interpreta-
tion, and is said to be too imprecise [24]: “A person’s perceptions and responses that
result from the use and/or anticipated use of a product, system or service.”
Additionally, the term UX is also influenced by several concepts from other areas,
like fun, playability, or Csikszentmihalyi’s concept of flow [8, 26]. Within this multi-
tude of concepts, as pointed out by Law et al. [32], the inclusion and exclusion of
particular variables seem arbitrary, depending on the author’s background and inter-
est. Further reasons stated by Law et al. include the differences in the unit of analysis,
ranging from a single aspect of a single user’s interaction with a specific application
to multi-users’ interactions with a company and its services from multiple disciplines;
and finally the fragmented landscape of UX research with diverse theoretical models
with different foci [32]. In more recent work, Law [28] argues that the current UX
researchers and practitioners may also roughly be divided into two camps, a “design-
based UX research camp” which focuses more on qualitative approaches and a “mod-
el-based UX research camp” with a focus on quantitative approaches.
Similar reasons have already been pointed out by Hassenzahl [17]. He stated that
the lack of agreement in definition of key elements makes building up empirical
knowledge about what constitutes UX difficult, and that future research must aim at
unifying approaches to UX, with its major objectives being the selection of key con-
structs and a better understanding of their interplay. Hassenzahl and Tractinsky [18]
categorize current UX approaches and concepts in three groups:
1. Beyond the instrumental: One of the criticisms of usability evaluation was that a
focus only on tasks is too narrow. Beauty as a perceptual experience, on the other
hand, goes beyond the instrumental, functional concept of usability. It satisfies a hu-
man need, and was also described as an important quality of technology usage [1].
Other needs that are described as being important and should be addressed by tech-
nology include needs such as surprise, diversion or intimacy [14]. Further concepts
falling into this category can be summarized as hedonic aspects of technology usage,
like stimulation and identification [17]. All these UX approaches link product attrib-
utes with needs and values, the common goal is to enrich current models of product
quality with non-instrumental aspects.
2. Emotion and affect: There are two basic ways in dealing with emotions in UX
concepts. One way can be summarized as research that stresses the importance of
emotions as consequences of product use, focusing on emotion as a result of the inter-
action or usage of a product. The other way concentrates on emotions that are preced-
ing product use and contributing to the formation of evaluative judgments [18]. Cur-
rent UX research rather, focuses on positive emotions and emotional outcomes such
as joy, fun and pride, and also deals with emotion as a design goal [11].
3. The experiental: The third perspective looks at temporal and situational influ-
ences, asking for the dynamics of an interaction, how unique, complex, temporary or
situated an experience is. In this view, an experience is a unique combination of vari-
ous elements, such as the product and internal user states (e.g. mood, expectations,
active goals), which extend over time with a definitive beginning and end. The expe-
riential assumes all these elements to be interrelated – to interact and modify each
other. The outcome of this process is the actual experience [13].
Generally, UX is described as focusing on the interaction between a person and a
product, and is likely to change over time and with an embedding context [18, 32].
2.1 User Experience Evaluation
A broad variety of UX evaluation methods is available today, which are described and
discussed in detail by Vermeeren et al. [55, 57] regarding their methodological
approach (e.g. field studies, lab studies), the development phase they can be applied
(from concepts to products on the market), the studied period of experience, and the
evaluator. Law and van Schaik [33] summarize that UX measurement should
essentially be self-reported, trajectory-based and adaptive, in accordance with the
common understanding of UX as subjective, dynamic and context-dependent [18].
Thus, traditional techniques such as questionnaire, interview, and think-aloud remain
important for capturing self-reported data [33].
Following the classification of UX approaches and concepts by Hassenzahl and
Tractinsky [18], approaches focusing on the evaluation of emotion and affect include
questionnaires like EmoCards [11] that ask the user to indicate the emotional state
based on graphical representations. Other ways to measure the emotional response
include physiological measurements (e.g. heart rate, skin conductance) or the evalua-
tion of valence and arousal, which are currently also applied in the games area [39].
To measure the user experience beyond the instrumental, task-based approach, Has-
senzahl [17] introduced the AttrakDiff questionnaire. In order to evaluate situational
or temporal experiences, some approaches in mobile UX exist, using conceptual-
analytical research and data gathering techniques [49]. For prototypes, usability eval-
uation methods can be enhanced by including experimental aspects to the evaluations,
e.g. in long-term field trials, where diaries, experience sampling, questionnaires, and
focus groups can be used to collect additional data [49].
2.2 User Experience Evaluation of interactive TV
In the TV and entertainment sector, UX has been evaluated using a broad variety of
methods. Dimensions that are addressed include emotions [36, 43], social factors [15],
values and requirements [5, 42, 44], the perception of the quality of the interaction or
representation [53, 47], or service quality and content [16, 31].
These user experience evaluations have been applying standard UX methods, like
the AttrakDiff questionnaire [45]. Other measurements include the SUXES evaluation
method, as used by Turunen et al. [53] to evaluate UX with different modalities in a
mobile phone controlled home entertainment system. Experiences in gaming and TV
applications were evaluated using psycho-physiological measurements [36]. These
measurements were also used to evaluate the users’ experiences with multi-view 3D
displays [47] or to classify emotional reactions to video content [43]. Obrist et al. [42]
investigated users’ requirement and experiences within an ethnographic study and
identified patterns how iTV services can support people. Tsekleves et al. [54] investi-
gated the TV experience and media use habits using ethnographic observations.
Roibas et al. [48] used ethno-methodologies like cultural probing and collaborative
design to uncover the UX in future scenarios of mobile and pervasive iTV.
None of the methods applied for evaluating the overall user experience of interac-
tive TV systems has been adapted to fit the interactive TV context. Interactive TV is
special as the interaction with the system typically takes place at home, involving a
certain type of setting (physical context) or influenced by people who might join the
TV experience (social context) (see [42] for a discussion of the different contextual
factors). While for the area of social factors and social TV Geerts and De Groof [15]
have been proposing sociability heuristics, there is no adapted and validated UX eval-
uation method focusing on a set of UX dimensions specific for interactive TV in gen-
eral.
3 Research Goals and Approach
Goal of our research is to develop a user experience evaluation method that allows us
to evaluate the iTV specific user experience. Our research goal is motivated by the
demand from the industry to have only one questionnaire combining the most
important UX dimensions in this specific domain. The problem for the construction of
such a method lies in the specificities of the iTV domain: it is necessary to take into
account iTV characteristics and the context of usage. The user experience is shaped
by interacting (using an interaction technology, i.e. a remote control, or other means
of interaction) from a distance to control an interactive TV system and navigate in its
menu structure, services and features. The spatial and temporal context of usage also
influences the perception of the system (likely at home, at leisure time), as well as
possible social factors (shared usage, co-experience). The UX of the iTV system itself
is of interest, not the UX related to entertainment content.
The goal is to cover an extensive and holistic collection of user experience dimen-
sions for the domain of iTV. The questionnaire development proceeds in three major
steps, and the following methodological approach was chosen to identify the user
experience dimensions used in the questionnaire and its subsequent development and
iteration:
1. Identification of UX dimensions from the literature and development of a set of
attributes based on existing questionnaires (presented in this paper),
2. Development and validation of the questionnaire including a set of the most im-
portant UX dimensions to verify their applicability in the domain with currently
available iTV systems (presented in this paper), and finally
3. Extension of the set of dimensions to address the context specifics by adding
additional dimension, and revalidation (future work).
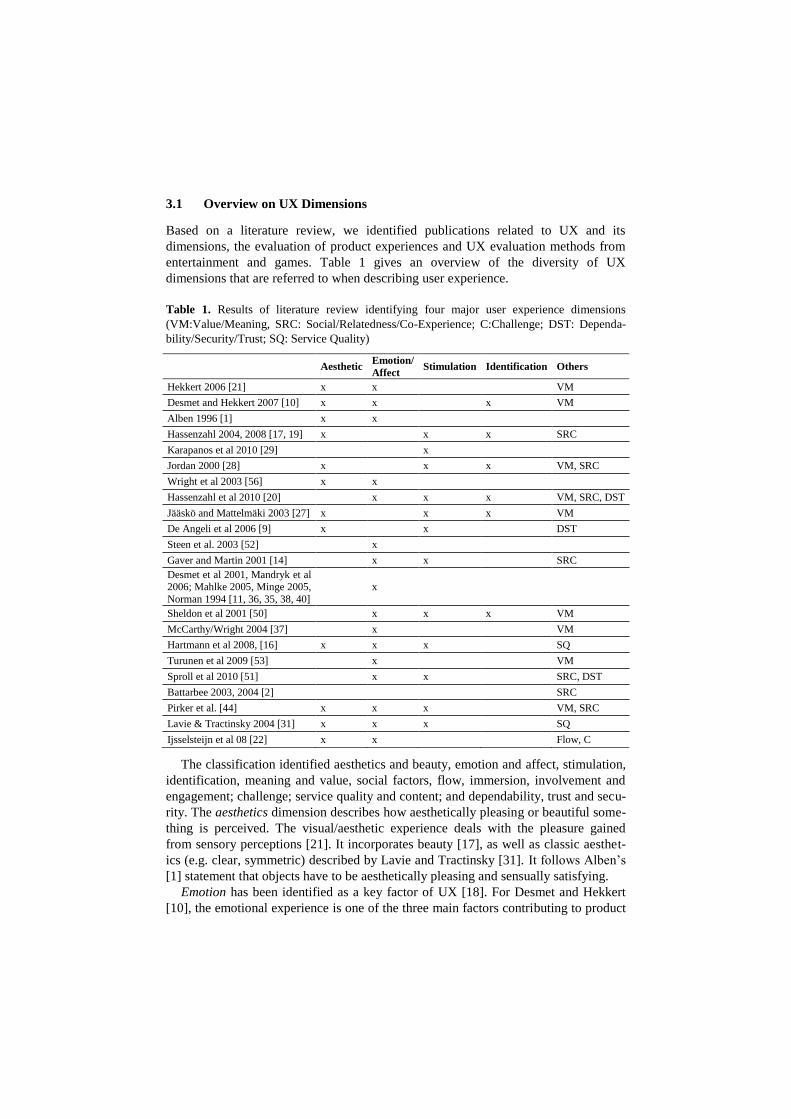
3.1 Overview on UX Dimensions
Based on a literature review, we identified publications related to UX and its
dimensions, the evaluation of product experiences and UX evaluation methods from
entertainment and games. Table 1 gives an overview of the diversity of UX
dimensions that are referred to when describing user experience.
Table 1. Results of literature review identifying four major user experience dimensions
(VM:Value/Meaning, SRC: Social/Relatedness/Co-Experience; C:Challenge; DST: Dependa-
bility/Security/Trust; SQ: Service Quality)
Aesthetic Emotion/
Affect Stimulation Identification Others
Hekkert 2006 [21] x x VM
Desmet and Hekkert 2007 [10] x x
x VM
Alben 1996 [1] x x
Hassenzahl 2004, 2008 [17, 19] x
x x SRC
Karapanos et al 2010 [29]
x
Jordan 2000 [28] x
x x VM, SRC
Wright et al 2003 [56] x x
Hassenzahl et al 2010 [20]
x x x VM, SRC, DST
Jääskö and Mattelmäki 2003 [27] x
x x VM
De Angeli et al 2006 [9] x
x
DST
Steen et al. 2003 [52]
x
Gaver and Martin 2001 [14]
x x
SRC
Desmet et al 2001, Mandryk et al 2006; Mahlke 2005, Minge 2005,
Norman 1994 [11, 36, 35, 38, 40]
x
Sheldon et al 2001 [50]
x x x VM
McCarthy/Wright 2004 [37]
x
VM
Hartmann et al 2008, [16] x x x
SQ
Turunen et al 2009 [53]
x
VM
Sproll et al 2010 [51]
x x
SRC, DST
Battarbee 2003, 2004 [2] SRC
Pirker et al. [44] x x x VM, SRC
Lavie & Tractinsky 2004 [31] x x x SQ
Ijsselsteijn et al 08 [22] x x Flow, C
The classification identified aesthetics and beauty, emotion and affect, stimulation,
identification, meaning and value, social factors, flow, immersion, involvement and
engagement; challenge; service quality and content; and dependability, trust and secu-
rity. The aesthetics dimension describes how aesthetically pleasing or beautiful some-
thing is perceived. The visual/aesthetic experience deals with the pleasure gained
from sensory perceptions [21]. It incorporates beauty [17], as well as classic aesthet-
ics (e.g. clear, symmetric) described by Lavie and Tractinsky [31]. It follows Alben’s
[1] statement that objects have to be aesthetically pleasing and sensually satisfying.
Emotion has been identified as a key factor of UX [18]. For Desmet and Hekkert
[10], the emotional experience is one of the three main factors contributing to product
experience, including feelings and emotions elicited. Also Alben [1] addressed the
factor emotion in the form of the emotional response as an outcome of the interaction.
Izard [25] described ten basic emotions, of which the three clearly positive emotions
were chosen to be included in the questionnaire (interest, joy and surprise), as UX is
described as focusing on positive experiences [18]. Additionally, the feeling of com-
petence as a need fulfillment is covered within this dimension [50, 20, 39].
The stimulation dimension describes to what extent a product can support the hu-
man need for innovative and interesting functions, interactions and contents. Hassen-
zahl [19] describes stimulation as a hedonic attribute of a product, which can lead to
new impressions, opportunities and insights. Hedonic experiences were subsumed by
Karapanos et al [29] under the term innovativeness to describe hedonic experiences
and the ability of a product to excite the user through its novelty. In the area of games,
Jääskö and Mattelmäki [27] defined product novelty as one of the qualities of user
experience.
The identification dimension indicates to what extent a certain product allows the
user to identify with it. For Hassenzahl [17], the identification dimension addresses
the human need to express one’s self through objects. Thus, using or owning a specif-
ic product is a way to reach a desired self-presentation. Identification can be seen as
self-expression through an object to communicate identity.
3.2 Developing the Questionnaire
For the questionnaire we chose the most prominent UX dimensions to verify their
applicability in the domain with currently available iTV systems: aesthetics, emotion,
stimulation and identification. The decision to not include dimensions like social
connectedness, interaction and value in this first version of the questionnaire is based
on the current market situation for TV and I(P)TV products.
At the moment, most IPTV systems do not support social communication or ser-
vices; additionally, the interaction takes place using a standard infra-red remote con-
trol. The dimension of Value might not be addressed properly in a broad evaluation of
different TV systems as it is heavily influenced by the assembly of IPTV and enter-
tainment-oriented devices and might provide better results when used in a specific
setting in the future.
The questionnaire is based on a set of word-pairs for each of the dimensions identi-
fied. Each word pair represents an item of the questionnaire and is based on a seven-
point semantic differential rating scale. The bi-polar adjectives used in the semantic
differential scale where placed at the extremes of the scale; inversion of items was
used to avoid fill-in schemes. This kind of scale was chosen as semantic differentials
are described as a good choice to evaluate positive affective responses [58], which is
the case for the evaluated UX dimensions.
The dimension visual/aesthetic experience is evaluated using seven bi-polar adjec-
tives addressing beauty, the composition (classic aesthetics) and the design of the
IPTV system.
It includes items like beautiful vs. ugly, or appealing vs. unappealing. Items were
based on the work of Hassenzahl [17], Lavie [31] and Desmet et al [10].
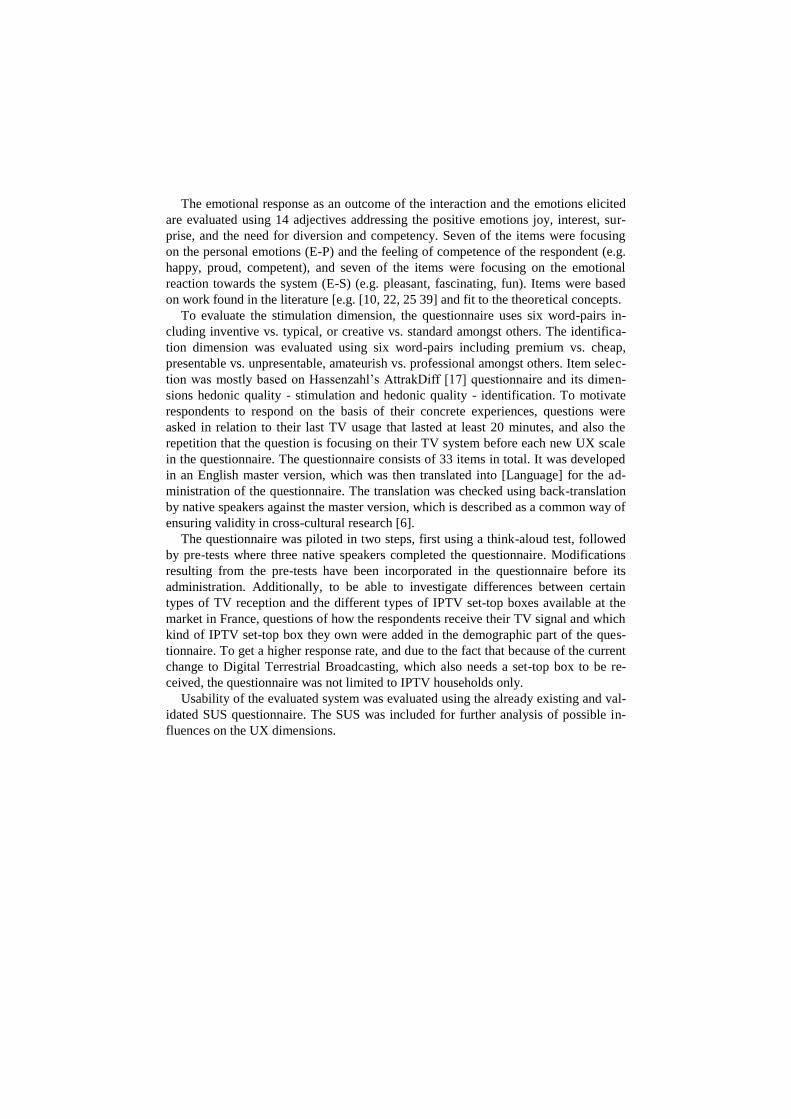
The emotional response as an outcome of the interaction and the emotions elicited
are evaluated using 14 adjectives addressing the positive emotions joy, interest, sur-
prise, and the need for diversion and competency. Seven of the items were focusing
on the personal emotions (E-P) and the feeling of competence of the respondent (e.g.
happy, proud, competent), and seven of the items were focusing on the emotional
reaction towards the system (E-S) (e.g. pleasant, fascinating, fun). Items were based
on work found in the literature [e.g. [10, 22, 25 39] and fit to the theoretical concepts.
To evaluate the stimulation dimension, the questionnaire uses six word-pairs in-
cluding inventive vs. typical, or creative vs. standard amongst others. The identifica-
tion dimension was evaluated using six word-pairs including premium vs. cheap,
presentable vs. unpresentable, amateurish vs. professional amongst others. Item selec-
tion was mostly based on Hassenzahl’s AttrakDiff [17] questionnaire and its dimen-
sions hedonic quality - stimulation and hedonic quality - identification. To motivate
respondents to respond on the basis of their concrete experiences, questions were
asked in relation to their last TV usage that lasted at least 20 minutes, and also the
repetition that the question is focusing on their TV system before each new UX scale
in the questionnaire. The questionnaire consists of 33 items in total. It was developed
in an English master version, which was then translated into [Language] for the ad-
ministration of the questionnaire. The translation was checked using back-translation
by native speakers against the master version, which is described as a common way of
ensuring validity in cross-cultural research [6].
The questionnaire was piloted in two steps, first using a think-aloud test, followed
by pre-tests where three native speakers completed the questionnaire. Modifications
resulting from the pre-tests have been incorporated in the questionnaire before its
administration. Additionally, to be able to investigate differences between certain
types of TV reception and the different types of IPTV set-top boxes available at the
market in France, questions of how the respondents receive their TV signal and which
kind of IPTV set-top box they own were added in the demographic part of the ques-
tionnaire. To get a higher response rate, and due to the fact that because of the current
change to Digital Terrestrial Broadcasting, which also needs a set-top box to be re-
ceived, the questionnaire was not limited to IPTV households only.
Usability of the evaluated system was evaluated using the already existing and val-
idated SUS questionnaire. The SUS was included for further analysis of possible in-
fluences on the UX dimensions.
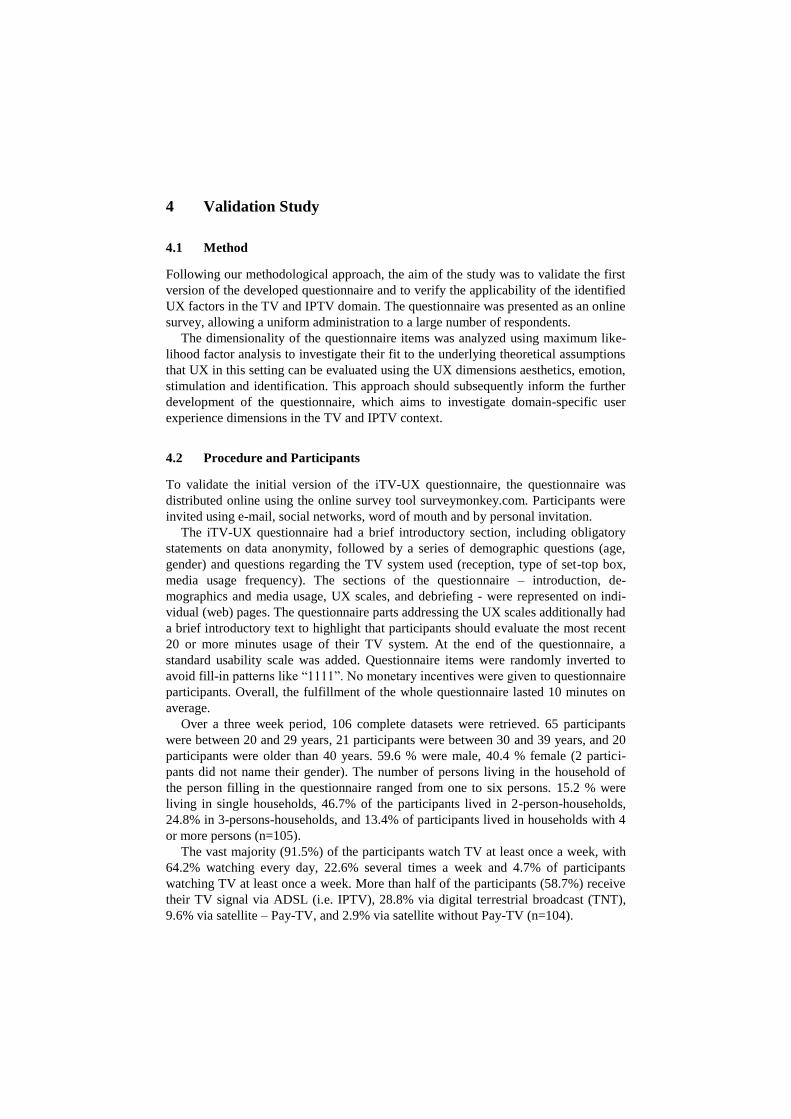
4 Validation Study
4.1 Method
Following our methodological approach, the aim of the study was to validate the first
version of the developed questionnaire and to verify the applicability of the identified
UX factors in the TV and IPTV domain. The questionnaire was presented as an online
survey, allowing a uniform administration to a large number of respondents.
The dimensionality of the questionnaire items was analyzed using maximum like-
lihood factor analysis to investigate their fit to the underlying theoretical assumptions
that UX in this setting can be evaluated using the UX dimensions aesthetics, emotion,
stimulation and identification. This approach should subsequently inform the further
development of the questionnaire, which aims to investigate domain-specific user
experience dimensions in the TV and IPTV context.
4.2 Procedure and Participants
To validate the initial version of the iTV-UX questionnaire, the questionnaire was
distributed online using the online survey tool surveymonkey.com. Participants were
invited using e-mail, social networks, word of mouth and by personal invitation.
The iTV-UX questionnaire had a brief introductory section, including obligatory
statements on data anonymity, followed by a series of demographic questions (age,
gender) and questions regarding the TV system used (reception, type of set-top box,
media usage frequency). The sections of the questionnaire – introduction, de-
mographics and media usage, UX scales, and debriefing - were represented on indi-
vidual (web) pages. The questionnaire parts addressing the UX scales additionally had
a brief introductory text to highlight that participants should evaluate the most recent
20 or more minutes usage of their TV system. At the end of the questionnaire, a
standard usability scale was added. Questionnaire items were randomly inverted to
avoid fill-in patterns like “1111”. No monetary incentives were given to questionnaire
participants. Overall, the fulfillment of the whole questionnaire lasted 10 minutes on
average.
Over a three week period, 106 complete datasets were retrieved. 65 participants
were between 20 and 29 years, 21 participants were between 30 and 39 years, and 20
participants were older than 40 years. 59.6 % were male, 40.4 % female (2 partici-
pants did not name their gender). The number of persons living in the household of
the person filling in the questionnaire ranged from one to six persons. 15.2 % were
living in single households, 46.7% of the participants lived in 2-person-households,
24.8% in 3-persons-households, and 13.4% of participants lived in households with 4
or more persons (n=105).
The vast majority (91.5%) of the participants watch TV at least once a week, with
64.2% watching every day, 22.6% several times a week and 4.7% of participants
watching TV at least once a week. More than half of the participants (58.7%) receive
their TV signal via ADSL (i.e. IPTV), 28.8% via digital terrestrial broadcast (TNT),
9.6% via satellite – Pay-TV, and 2.9% via satellite without Pay-TV (n=104).
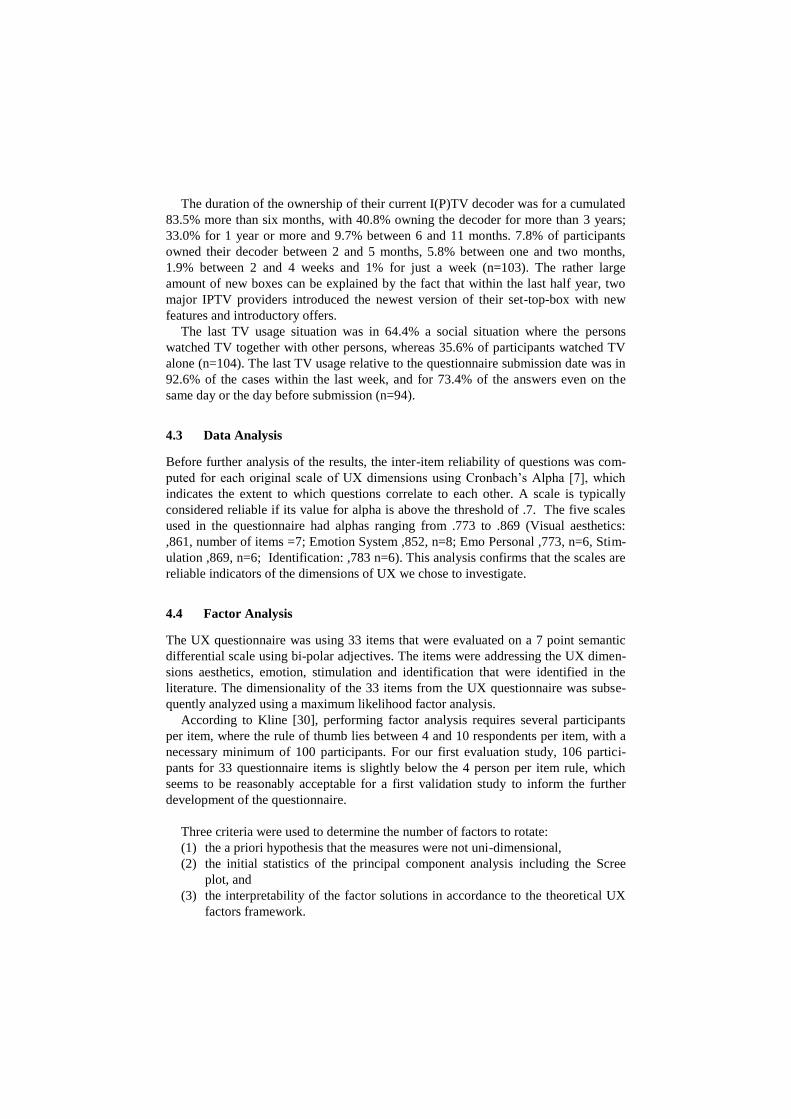
The duration of the ownership of their current I(P)TV decoder was for a cumulated
83.5% more than six months, with 40.8% owning the decoder for more than 3 years;
33.0% for 1 year or more and 9.7% between 6 and 11 months. 7.8% of participants
owned their decoder between 2 and 5 months, 5.8% between one and two months,
1.9% between 2 and 4 weeks and 1% for just a week (n=103). The rather large
amount of new boxes can be explained by the fact that within the last half year, two
major IPTV providers introduced the newest version of their set-top-box with new
features and introductory offers.
The last TV usage situation was in 64.4% a social situation where the persons
watched TV together with other persons, whereas 35.6% of participants watched TV
alone (n=104). The last TV usage relative to the questionnaire submission date was in
92.6% of the cases within the last week, and for 73.4% of the answers even on the
same day or the day before submission (n=94).
4.3 Data Analysis
Before further analysis of the results, the inter-item reliability of questions was com-
puted for each original scale of UX dimensions using Cronbach’s Alpha [7], which
indicates the extent to which questions correlate to each other. A scale is typically
considered reliable if its value for alpha is above the threshold of .7. The five scales
used in the questionnaire had alphas ranging from .773 to .869 (Visual aesthetics:
,861, number of items =7; Emotion System ,852, n=8; Emo Personal ,773, n=6, Stim-
ulation ,869, n=6; Identification: ,783 n=6). This analysis confirms that the scales are
reliable indicators of the dimensions of UX we chose to investigate.
4.4 Factor Analysis
The UX questionnaire was using 33 items that were evaluated on a 7 point semantic
differential scale using bi-polar adjectives. The items were addressing the UX dimen-
sions aesthetics, emotion, stimulation and identification that were identified in the
literature. The dimensionality of the 33 items from the UX questionnaire was subse-
quently analyzed using a maximum likelihood factor analysis.
According to Kline [30], performing factor analysis requires several participants
per item, where the rule of thumb lies between 4 and 10 respondents per item, with a
necessary minimum of 100 participants. For our first evaluation study, 106 partici-
pants for 33 questionnaire items is slightly below the 4 person per item rule, which
seems to be reasonably acceptable for a first validation study to inform the further
development of the questionnaire.
Three criteria were used to determine the number of factors to rotate:
(1) the a priori hypothesis that the measures were not uni-dimensional,
(2) the initial statistics of the principal component analysis including the Scree
plot, and
(3) the interpretability of the factor solutions in accordance to the theoretical UX
factors framework.
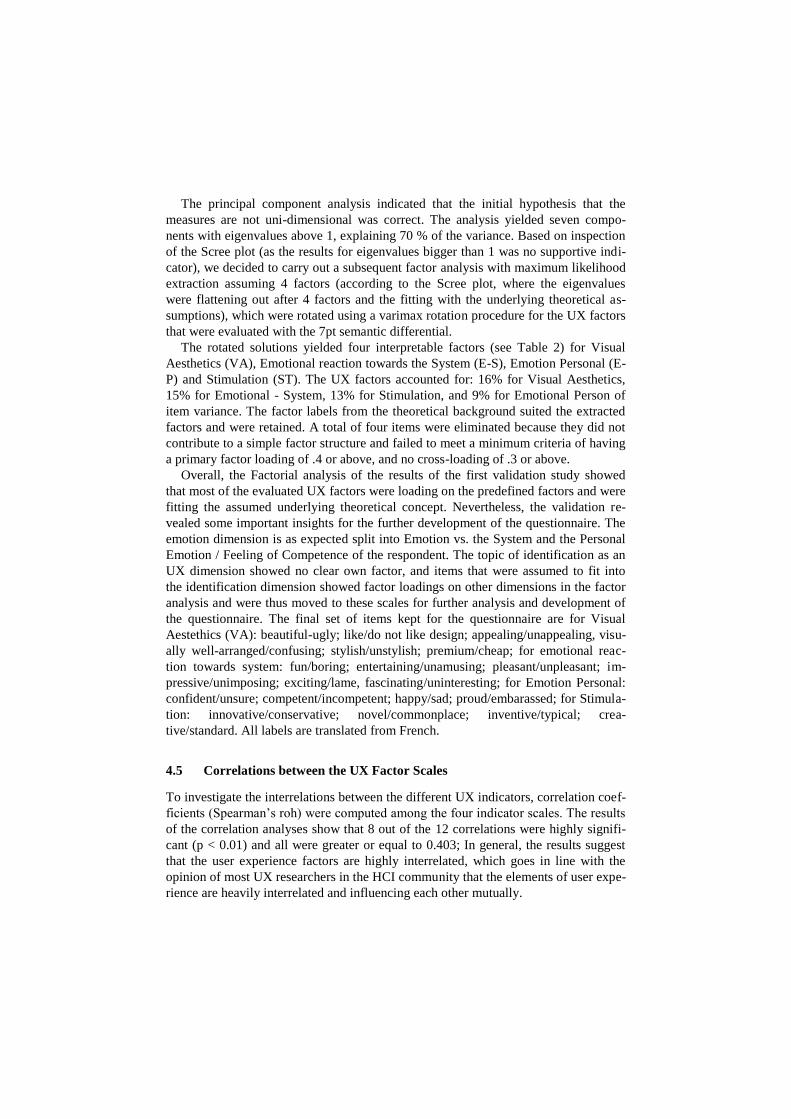
The principal component analysis indicated that the initial hypothesis that the
measures are not uni-dimensional was correct. The analysis yielded seven compo-
nents with eigenvalues above 1, explaining 70 % of the variance. Based on inspection
of the Scree plot (as the results for eigenvalues bigger than 1 was no supportive indi-
cator), we decided to carry out a subsequent factor analysis with maximum likelihood
extraction assuming 4 factors (according to the Scree plot, where the eigenvalues
were flattening out after 4 factors and the fitting with the underlying theoretical as-
sumptions), which were rotated using a varimax rotation procedure for the UX factors
that were evaluated with the 7pt semantic differential.
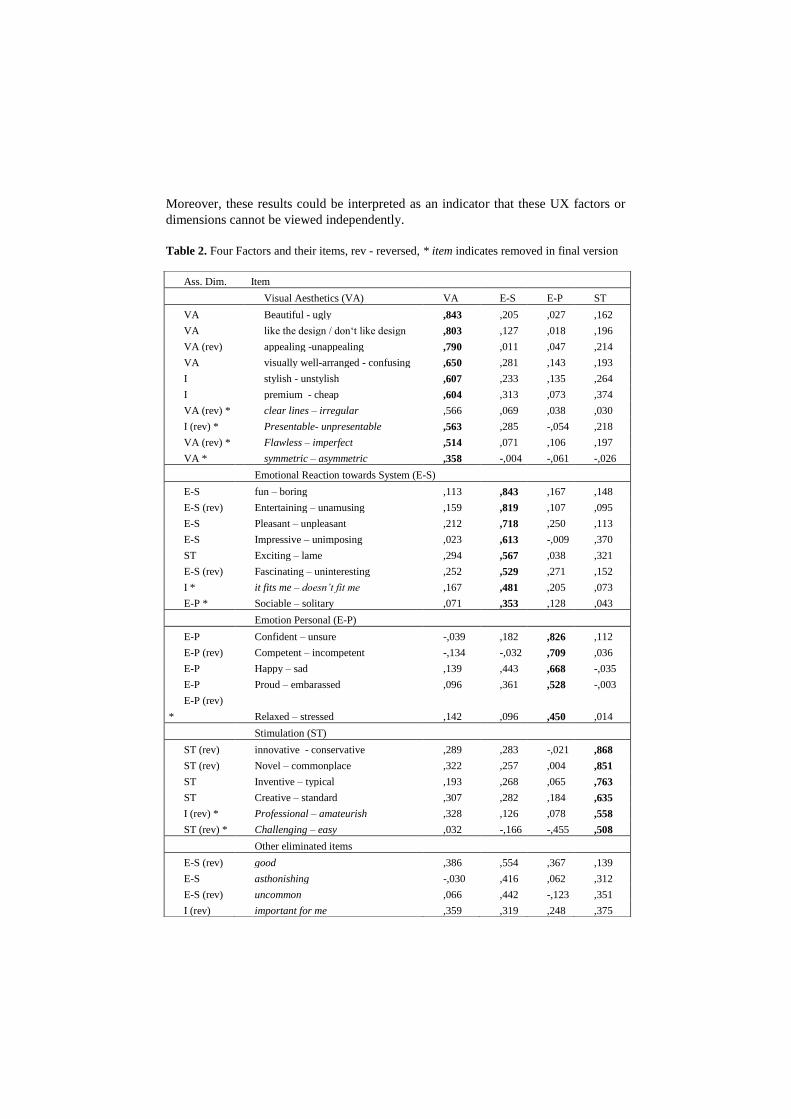
The rotated solutions yielded four interpretable factors (see Table 2) for Visual
Aesthetics (VA), Emotional reaction towards the System (E-S), Emotion Personal (E-
P) and Stimulation (ST). The UX factors accounted for: 16% for Visual Aesthetics,
15% for Emotional - System, 13% for Stimulation, and 9% for Emotional Person of
item variance. The factor labels from the theoretical background suited the extracted
factors and were retained. A total of four items were eliminated because they did not
contribute to a simple factor structure and failed to meet a minimum criteria of having
a primary factor loading of .4 or above, and no cross-loading of .3 or above.
Overall, the Factorial analysis of the results of the first validation study showed
that most of the evaluated UX factors were loading on the predefined factors and were
fitting the assumed underlying theoretical concept. Nevertheless, the validation re-
vealed some important insights for the further development of the questionnaire. The
emotion dimension is as expected split into Emotion vs. the System and the Personal
Emotion / Feeling of Competence of the respondent. The topic of identification as an
UX dimension showed no clear own factor, and items that were assumed to fit into
the identification dimension showed factor loadings on other dimensions in the factor
analysis and were thus moved to these scales for further analysis and development of
the questionnaire. The final set of items kept for the questionnaire are for Visual
Aestethics (VA): beautiful-ugly; like/do not like design; appealing/unappealing, visu-
ally well-arranged/confusing; stylish/unstylish; premium/cheap; for emotional reac-
tion towards system: fun/boring; entertaining/unamusing; pleasant/unpleasant; im-
pressive/unimposing; exciting/lame, fascinating/uninteresting; for Emotion Personal:
confident/unsure; competent/incompetent; happy/sad; proud/embarassed; for Stimula-
tion: innovative/conservative; novel/commonplace; inventive/typical; crea-
tive/standard. All labels are translated from French.
4.5 Correlations between the UX Factor Scales
To investigate the interrelations between the different UX indicators, correlation coef-
ficients (Spearman’s roh) were computed among the four indicator scales. The results
of the correlation analyses show that 8 out of the 12 correlations were highly signifi-
cant (p < 0.01) and all were greater or equal to 0.403; In general, the results suggest
that the user experience factors are highly interrelated, which goes in line with the
opinion of most UX researchers in the HCI community that the elements of user expe-
rience are heavily interrelated and influencing each other mutually.
Moreover, these results could be interpreted as an indicator that these UX factors or
dimensions cannot be viewed independently.
Table 2. Four Factors and their items, rev - reversed, * item indicates removed in final version
Ass. Dim. Item
Visual Aesthetics (VA) VA E-S E-P ST
VA Beautiful - ugly ,843 ,205 ,027 ,162
VA like the design / don‘t like design ,803 ,127 ,018 ,196
VA (rev) appealing -unappealing ,790 ,011 ,047 ,214
VA visually well-arranged - confusing ,650 ,281 ,143 ,193
I stylish - unstylish ,607 ,233 ,135 ,264
I premium - cheap ,604 ,313 ,073 ,374
VA (rev) * clear lines – irregular ,566 ,069 ,038 ,030
I (rev) * Presentable- unpresentable ,563 ,285 -,054 ,218
VA (rev) * Flawless – imperfect ,514 ,071 ,106 ,197
VA * symmetric – asymmetric ,358 -,004 -,061 -,026
Emotional Reaction towards System (E-S)
E-S fun – boring ,113 ,843 ,167 ,148
E-S (rev) Entertaining – unamusing ,159 ,819 ,107 ,095
E-S Pleasant – unpleasant ,212 ,718 ,250 ,113
E-S Impressive – unimposing ,023 ,613 -,009 ,370
ST Exciting – lame ,294 ,567 ,038 ,321
E-S (rev) Fascinating – uninteresting ,252 ,529 ,271 ,152
I * it fits me – doesn’t fit me ,167 ,481 ,205 ,073
E-P * Sociable – solitary ,071 ,353 ,128 ,043
Emotion Personal (E-P)
E-P Confident – unsure -,039 ,182 ,826 ,112
E-P (rev) Competent – incompetent -,134 -,032 ,709 ,036
E-P Happy – sad ,139 ,443 ,668 -,035
E-P Proud – embarassed ,096 ,361 ,528 -,003
E-P (rev)
* Relaxed – stressed ,142 ,096 ,450 ,014
Stimulation (ST)
ST (rev) innovative - conservative ,289 ,283 -,021 ,868
ST (rev) Novel – commonplace ,322 ,257 ,004 ,851
ST Inventive – typical ,193 ,268 ,065 ,763
ST Creative – standard ,307 ,282 ,184 ,635
I (rev) * Professional – amateurish ,328 ,126 ,078 ,558
ST (rev) * Challenging – easy ,032 -,166 -,455 ,508
Other eliminated items
E-S (rev) good ,386 ,554 ,367 ,139
E-S asthonishing -,030 ,416 ,062 ,312
E-S (rev) uncommon ,066 ,442 -,123 ,351
I (rev) important for me ,359 ,319 ,248 ,375
4.6 Correlations between Usability and UX Scales
For further investigation of the interrelations between different indicators, correlation
coefficients (Spearman’s roh) were computed. As a reference for usability, the ques-
tionnaire included the items from the SUS questionnaire.
The SUS rating of the system showed a significant correlation with all UX factor
scales (Visual Aestethic ,447 p<0.001, ES ,642 p<0.001; EP ,528 p <0.01; ST ,271
p<005). The results indicate that the usability of interactive systems remains an im-
portant issue in evaluating iTV systems and usability is influencing the overall user
experience of the evaluated IPTV systems. It is important to investigate in more detail
how usability influences the perception of user experience, or if the two concepts are
independent.
During further investigation and correlation analysis of the SUS rating indicator,
no significant correlations could be found regarding the independent variables “Type
of TV Reception”, “Type of IPTV Bow owned”, “Period of ownership of decoder”,
“Age”, “Sex”, “Number of Persons in Household”, or “TV usage frequency” and
“Number of Persons in Household”.
4.7 Other Insights
Regarding the independent variables “Age”, “Sex” and “Number of Persons in
Household”, no significant correlation could be found for the UX indicators.
We observed no significant correlations between the UX scales and the type of TV
signal reception (Terrestrial, ADSL, Satellite). Nevertheless, we discovered a signifi-
cant correlation between the type of IPTV box owned and the Emotion-System scale
(rho= 0.346, p<0.01), as well as for the Stimulation scale (rho= 0.267, p<0.05).
Overall, the UX ratings for the observed dimensions in our sample were rather low,
but with a positive trend for the Visual Aesthetics and both Emotion vs. System and
Emotion Personal dimensions. The negative trend in the results regarding the Stimula-
tion dimension suggest that in general, TV systems are not perceived as stimulating
devices. This shows that the user experience can be different for systems, even if the
perceived usability is the same.
Using One-Way ANOVA on the means of the four UX scales extracted from the
factor analysis, there is a significant effect of TV reception type on the Emotion-
System scale at the p<.05 level for the four conditions [F(3,99) = 2.88, p = .04].
Post hoc comparisons using the Tukey HSD test indicated that the mean score for
the satellite Pay-TV condition (M = 1.11, SD = 0.80) was significantly different than
the ADSL-IPTV condition (M = .17, SD = 1.02) and the TNT condition (M = .14, SD
= .92). However, the Satellite (without Pay-TV) condition (M = .34, SD = .76) did not
significantly differ from the other conditions. Taken together, these results suggest
that the Pay-TV offer via satellite does have a positive effect on the emotion versus
the system.
Another One-Way ANOVA was conducted to compare the effect of the type of
ADSL box on the on the means of the four User Experience scales extracted from the
factor analysis.
There was a significant effect of the type of ADSL box, again on the Emotion-
System Scale, at the p<.05 level for the six conditions [F(5,52) = 2.79, p = .026].
Post hoc comparisons using the Tukey HSD test indicated that the mean score for
one of the recently introduced IPTV boxes (M = 1.08, SD = .88) was significantly
different than the other IPTV boxes.
As the sample size was low (58, 3 entries for 2 types of IPTV boxes were exclud-
ed), and Type II Errors are frequently in small sample sizes, additional post hoc com-
parisons using LSD were carried out, which resulted in a significant difference of the
same IPTV box compared to all the other boxes. Taken together, these results suggest
that this newly introduced IPTV set-top box which is including e.g. a BluRay Player,
HDTV, a remote control that includes some simple gesture interaction and has a very
elaborate design approach does have a positive effect on the emotional reaction versus
the system.
4.8 Discussion of Results
The work reported here is clearly the first validation of the questionnaire. At current
stage we have to deal with the following limitations: (1) the composition of the cur-
rent sample influences the results; (2) the systems used influence the results; (3) par-
ticipants answered the questionnaire not directly after the interaction with their iTV
system. The clear limitation of the rather small sample size will be addressed in the
next iteration of the questionnaire, which will be evaluated using a larger sample to
assure the validity of the factor analysis.
The strong correlations between the UX factors up to now only show that variables
are related, but not the determining influence in a particular direction. Moreover,
Spearman’s Roh correlations also do not state which influences are dominating de-
terminants on particular factors. Therefore, a regression analysis will be conducted in
future to come up with a model for iTV-UX, which can also be used and applied by
fellow researchers in the field. This statistical model approach will enable fellow re-
searchers to use the complete questionnaire or to focus only on specific influences,
which means only a part of the UX dimensions are used. This step will be taken with-
in the analysis of the next iteration of the questionnaire to assure validity through a
higher sample size and coverage of a higher number of UX dimensions.
The extensibility of the questionnaire is critical for the development of a successful
iTV user experience evaluation method, as next generation iTV system will include
for instance social functionalities, new ways of representation of content and infor-
mation (e.g. 3D), and also more sophisticated interaction modalities like touch, ges-
ture or motion interaction.
5 Summary and Future Work
In this paper, we presented the results of a study aiming at the evaluation of a set of
literature-based user experience dimensions for TV and IPTV systems using a ques-
tionnaire-based approach. The assessed UX dimensions were aesthetics, emotion,
stimulation and identification. Results from a performed factor analysis showed that
except for the identification dimensions all evaluated UX dimensions were loading on
the predefined assumed factors and were fitting the assumed underlying concept. Also
the factor labels from the theoretical framework suited the extracted factors and were
retained; the extracted factors were labeled Visual Aesthetics, Emotion vs. the Sys-
tem, Emotion Personal, and Stimulation. Correlation analysis showed that the UX
dimensions are highly interrelated, which goes in line with the opinion of most UX
researchers in the HCI community that the elements of User Experience are heavily
interrelated and influencing each other mutually. Additional analysis revealed also
strong correlations of the UX scales to the Usability rating gained from the SUS scale.
The assumed UX dimension identification did not show a clear own factor, the items
assumed to fit into this dimensions showed mostly loadings on other factors. This
suggests that identification may not be a major UX dimension for the domain of
IPTV. A detailed list of the results of the factor analysis and the items used in the
evaluation can be found in Table 2. Overall UX ratings for the observed UX dimen-
sions were rather low, although all dimensions except stimulation showed a positive
trend, which suggests that in general, TV and IPTV systems are not perceived as
stimulating devices.
During further analysis we observed significant correlations between the type of
IPTV box owned and the emotional reaction towards the system and the stimulation
dimension. We also observed a significant effect of the TV reception mode on the
emotion towards the system, which was significantly better for Pay-TV Systems via
satellite compared to ADSL/IPTV offers and TNT. Also the type of ADSL/IPTV box
showed a significant effect on the emotion towards the system, where a newly intro-
duced IPTV set-top box which is including e.g. a BluRay Player, HDTV and has a
very elaborate design approach is evaluated significantly better than other boxes.
While the usability of the systems was perceived the same for all IPTV offers, the
UX evaluation indicates differences in the perception, indicating that the two concepts
are different.
For our research goal to develop a questionnaire that covers an extensive and holis-
tic collection of UX dimensions for the iTV domain, the present evaluation study was
the first step. We followed our methodological approach to start with a smaller set of
literature-based UX dimensions (aesthetics, emotion, stimulation and identification)
and validate their applicability for the IPTV domain. Results are promising and sup-
ported our underlying theoretical assumptions that these dimension are important in
this setting and measurable.
A second phase of validation with a revised questionnaire will address the identi-
fied limitations by extending the sample, ensuring that the interaction with the iTV
system occurs closely related to filling in the questionnaire and by enclosing addition-
al UX factors. These will include the value of the system for the user, social factors
(shared usage, co-experience), the interaction and interaction technology, and also the
perception of the quality of service. This next version aims to cover the major dimen-
sions that are influencing the user experience in this field. When looking at recent
attempts on social interactive TV systems, social factors seem to become an important
factor for the evaluation of future systems. The construct of relatedness will be ad-
dressed together with other social factors like shared usage and co-experience. Evalu-
ating these social factors can provide more valuable insights if future TV or connected
home systems support social applications like communication. Also the ongoing de-
velopment of interaction technologies that go beyond a standard button remote, e.g.
by integrating gyroscopes or using touch-screens, will be considered in future ver-
sions of the questionnaire, and the interaction will be addressed as a factor influencing
the UX of an IPTV system. The next iteration of the questionnaire will also incorpo-
rate entertainment-oriented UX factors like flow, as on state of the art IPTV set top
boxes, games and other services are introduced and iTV systems and gaming consoles
are moving closer towards each other.
References
1. Alben, L. 1996. Quality of experience: defining the criteria for eff. interaction design. In-
teractions 3, 11-15.
2. Battarbee, K. 2003. Co-Experience the social UX. In Proc. CHI03 EA, 730-731. ACM.
3. Bargas-Avila J. and Hornbæk, K. 2011. Old wine in new bottles or novel challenges. Proc.
CHI '11. 2689-2698.
4. Bernhaupt, R., 2010. User Experience Evaluation in Games and Entertainment. Springer.
5. Bernhaupt, R., Pirker, M., Weiss, A., Wilfinger, D., Tscheligi, M. 2012. Security, Privacy,
and Personalization: ACM C. in Entertainment, 6,2.
6. Brislin, R. W. 1970. Back-Translation for Cross-Cultural Research, Journ. Cross-Cultural
Psych. 1, 3 (1970), 185-216.
7. Cronbach, L. J. 1951. Coefficient alpha and the internal structure of tests. Psychometrika,
16(3), 297-334.
8. Csikszentmihalyi, M. 1991. Flow: The Psych. of Opt. Experience. Harper Perennial, N.Y.
9. De Angeli A., Sutcliffe A., and Hartmann J. 2006. Interaction, usability and aesthetics:
what influences users' preferences?. In Proc. DIS '06. ACM, New York.
10. Desmet, P. M. A., & Hekkert, P. 2007. Framework of product experience. International
Journal of Design, 1(1), 57-66.
11. Desmet, P.M.A., Overbeeke, C.J., Tax, S.J.E.T. 2001. Designing products with added
emotional value. The Design Journal, 4(1), 32-47.
12. Forbrig, P., Bernhaupt, R., Winckler, M., Wesson, J. 2011. 5th Workshop on Software and
Usability Eng.Cross-Pollination: Patterns, Usability and UX, Proc. Interact 2011, 718-719.
13. Forlizzi, J. and Battarbee, K. 2004. Understanding experience in interactive systems. In
Proc. DIS 2004. 261-268. ACM, New York.
14. Gaver, B., & Martin, H. 2000. Alternatives: exploring information appliances through con-
ceptual design proposals. Proc. CHI 2000, 209-216. ACM, New York.
15. Geerts, D. and De Grooff, D. 2009. Supporting the social uses of television: sociability
heuristics for social tv. In Proc. CHI '09. ACM, New York, NY, USA, 595-604.
16. Hartmann J., De Angeli A., and Sutcliffe A. 2008. Framing the user experience: infor-
mation biases on website quality judgement. In Proc. CHI '08. ACM, NY.
17. Hassenzahl, M. 2004. The interplay of beauty, goodness, and usability in interactive prod-
ucts. J. of HCI 19, 4 319-349.
18. Hassenzahl, M., and Tractinsky, N.2006. User Experience - a research agenda. In: Behav-
ior & Information Technology, 25(2), 91--97.
19. Hassenzahl, M. 2008. Aesthetics in interactive products: Correlates and consequences of
beauty. Product Experience, Chapter 11, 287-302, Elsevier.
20. Hassenzahl, M., Diefenbach, S., & Göritz, A. 2010. Needs, affect, and interactive products
- Facets of user experience. Interacting with Computers, 22(5), 353-362.
21. Hekkert, P. 2006. Design aesthetics: Principles of pleasure in product design. Psychology
Science, Volume 48, 2006 (2), p. 157 – 172.
22. IJsselsteijn, W. A., Poels, K. and de Kort, Y. A. W. Measuring Player Experiences in Digi-
tal Games. Development of the Game Experience Questionnaire (GEQ).
23. ISO 9241. 1998. ISO 9241: Ergonomic requirements for office work with visual display
terminals (VDTs)—Part 11: Guidance on usability. ISO, Geneva, Switzerland.
24. ISO 9241-210. 2010. Ergonomics of Human–System Interaction – Part 210: Human-
centred Design for Interactive Systems.
25. Izard, L. 1971. Die Emotionen des Menschen. Psychologie Verlags Union, Weinheim.
26. Järvinen, A., Heliö, S. and Mäyrä, F. 2002. Communication and Community in Digital En-
tertainment Services. Online.
27. Jääskö, V. and Mattelmäki, T. 2003 Observing and probing. In Proc. DPPI 03, 126-131.
ACM, New York.
28. Jordan, P. 2000. Designing Pleasurable Products. Taylor & Francis, London.
29. Karapanos, E., Zimmerman, J., Forlizzi, J., & Martens, J.-B. 2010. Measuring the dynam-
ics of remembered experience over time. IwC 22(5), 328-335.
30. Kline P. 1993. The handbook of psychological testing. London: Routledge.
31. Lavie, T., and Tractinsky, N. 2004. Assessing dimensions of perceived visual aesthetics of
web sites. Int. Journ. Of Human-Computer Studies, 60(3), 269-298
32. Law, E., Roto, V., Hassenzahl, M., Vermeeren, A., Kort, J., 2009. Understanding, scoping
and defining user experience: a survey approach. In: Proc. CHI 09, ACM.
33. Law E., and Van Schaik, P. 2010. Modelling user experience - An agenda for research and
practice. Interacting with Computers, 22 (5), 313-322.
34. Law, E. 2011. The measurability and predictability of user experience. In Proc. EICS '11.
1-10. ACM, NY.
35. Mahlke, S. 2005. Studying affect and emotions as important parts of the UX. Position pa-
per HCI2005.
36. Mandryk R., Inkpen K., Calvert T. 2006. Using psychophysiological techniques to meas-
ure UX with entertainment technologies. Beh. and Inf. Techn. 25, 2
37. McCarthy, J. and Wright, P. 2004. Technology as experience. interactions 11, 5, 42-43.
38. Minge, M. 2005. Methoden zur Erhebung emotionaler Aspekte bei der Interaktion mit
technischen Systemen. Master's thesis, Freie Universität Berlin. 2005.
39. Nacke, L. E., Grimshaw, M. N., and Craig A. Lindley, C. A. 2010. More than a feeling:
Measurement of sonic UX and psychophysiology in a first-person shooter game. Interact.
Comput. 22, 5, 336-343.
40. Norman, D. A. 2004. Emotional design: why we love (or hate) everyday things. New
York: Basic Books.
41. O'Brien, J. and Rodden, T. 1997. Interactive systems in domestic environments. In Proc
DIS '97. ACM, NY.
42. Obrist, M., Bernhaupt, R., Tscheligi, M. 2008. Interactive television for the home: An eth-
nographic study on users’ requirements and experiences. Int. Journ. of HCI. 24,2.
43. Oliveira, E., Benovoy, M., Ribeiro, N., and Chambel, T. 2011. Towards emotional interac-
tion: using movies to automatically learn users' emotional states. In Proc. INTERACT'11,
152-161, Springer.
44. Pirker, M. and Bernhaupt, R. 2011. Measuring User Experience in the Living Room: Re-
sults from an Ethnographically Oriented Field Study Indicating Major Evaluation Factors.
In Proc. EuroITV 2011, 79 – 82.
45. Pirker, M., Bernhaupt, R. and Mirlacher, T. 2010. Investigating usability and user experi-
ence as possible entry barriers for touch interaction in the living room. In Proc. EuroITV
2010. ACM, New York. 145-154.
46. Quinn, J.M. and Tran, T.Q. 2010. Attractive phones don't have to work better: independent
effects of attractiveness, effectiveness, and efficiency on perceived usability. In Proc. CHI
2010. 353-362. ACM, NY.
47. Rajae-Joordens, R. 2008. Measuring experiences in gaming and TV applications. In Prob-
ing Experience: From assessment of user emotions and behaviour to development of prod-
ucts, pages 77--90.
48. Roibás, A. and Johnson, S. 2006. Unfolding the user experience in new scenarios of perva-
sive interactive TV. In CHI '06 extended abstracts. ACM.
49. Roto, V., Ketola, P., Huotari, S. 2008. User Experience Evaluation in Nokia. Now Let's Do
It in Practice - User Experience Evaluation Methods in Product Development workshop in
CHI'08, Florence, Italy.
50. Sheldon, K. M., Elliot, A. J., Kim, Y., & Kasser, T. 2001. What Is Satisfying About Satis-
fying Events? Testing 10 Candidate Psychological Needs. Journal of Personality and So-
cial Psychology, 80(2), 325-339.
51. Sproll S., Peissner M., and Sturm C. 2010. From product concept to user experience: ex-
ploring UX potentials at early product stages. In Proc. NordiCHI '10. ACM, NY.
52. Steen, M., Koning, N.d. and Hoyng, L. 2003. The ‘wow’ experience – Conceptual model
and tools. in COST269 Conference Helsinki, 2003.
53. Turunen M.,et al. 2009. User expectations and user experience with different modalities in
a mobile phone controlled home entertainment system. Proc MobileHCI '09. ACM, NY.
54. Tsekleves, E., Whitham, R., Kondo, K., and Hill, A. 2009. Bringing the television experi-
ence to other media in the home: an ethnographic study. Proc. EuroITV '09. ACM
55. Vermeeren, A., Law, E., Roto, V., Obrist, M., Hoonhout, J. and Väänänen-Vainio-Mattila,
K., 2010. User experience evaluation methods. In Proc. NordiCHI’10, ACM, NY.
56. Wright, P., McCarthy, J. and Meekison, L. 2003 Making Sense of Experience. In Funolo-
gy: From Usability to Enjoyment, Kluwer Academic Publ., Dordrecht.
57. http://www.allaboutux.org/ accessed 20/01/2012
58. Heise, D. R. 1970. The Semantic Differential and Attitude Research. Attitude Measure-
ment. Chicago: Rand McNally, 1970, pp. 235-253.