
Questions on Green Taxes. Pollution Permits/ Tradable Permits.

University of Massachusetts Amherst
Department of Resource Economics Working Paper No. 2003-9
Evaluating Tradable Property Rights for Natural Resources: The Role of Strategic
Entry and Exit
Sylvia Brandt1
Abstract: This paper presents an econometric approach to the evaluation of environmental regulation using tradable property rights. Existing empirical research on this issue, which compares overall industry efficiency before and after the introduction of new regulations, conflates two distinct phenomena: efficiency changes due to exit of excess capital, and changes in the efficiency of individual firms. Because the regulatory process induces firms of different types to enter and exit the industry at different rates, the true efficiency and equity effects of tradable property rights cannot be assessed without correcting for these changes in sample composition. This paper examines the impact of regulatory change in the Mid-Atlantic surf clam fishery, using an econometric model that separates its effects on industry structure and vessel efficiency. The analysis finds that, contrary to widely held belief, tradable property rights did not disproportionately benefit either large fishing firms or highly integrated firms. Keywords: fisheries, efficiency, regulation, property rights JEL Classification: L1, L5, L2, Q2 ________________________ 1 Sylvia Brandt, Department of Resource Economics University of Massachusetts, 212G Stockbridge Hall, 80 Campus Center Way Amherst, MA 01003 E: [email protected] P: 413-545-5722 F: 413-545-5853

1
EVALUATING TRADABLE PROPERTY RIGHTS FOR NATURAL RESOURCES:
THE ROLE OF STRATEGIC ENTRY AND EXIT *
Sylvia Brandt Corresponding author: Sylvia Brandt Department of Resource Economics Stockbridge Hall University of Massachusetts, Amherst Amherst, MA 01003-9246 Voice: 413-545-5722 Fax: 413-545-5853 [email protected]
* The author respectfully thanks the participants at the Second World Congress of Environmental and Resource Economists in Monterey, California, June 24-27, the Ocean Governance Studies Group Conference in Berkeley, California, April 6-7, 2002 and the Sea Grant - National Marine Fisheries Service Fellows Conference in Silver Spring, Maryland, May 10, 2002. For helpful discussions, I would like to thank Michael Hanemann and Michael Ward. Funding for this research was provided by the National Science Foundation Graduate Research Grant, and the National Sea Grant-National Marine Fisheries Research Fellowship. Collaborative fieldwork with Dr. Bonnie McCay, Rutgers University, was funded by a Cooperative Marine Education and Research Grant from the Northeast Fishery Science Center, National Marine Fishery Service.

2
EVALUATING TRADABLE PROPERTY RIGHTS FOR NATURAL RESOURCES:
THE ROLE OF STRATEGIC ENTRY AND EXIT
ABSTRACT
This paper presents an econometric approach to the evaluation of environmental
regulation using tradable property rights. Existing empirical research on this issue, which
compares overall industry efficiency before and after the introduction of new regulations,
conflates two distinct phenomena: efficiency changes due to exit of excess capital, and changes
in the efficiency of individual firms. Because the regulatory process induces firms of different
types to enter and exit the industry at different rates, the true efficiency and equity effects of
tradable property rights cannot be assessed without correcting for these changes in sample
composition. This paper examines the impact of regulatory change in the Mid-Atlantic surf clam
fishery, using an econometric model that separates its effects on industry structure and vessel
efficiency. The analysis finds that, contrary to widely held belief, tradable property rights did
not disproportionately benefit either large fishing firms or highly integrated firms.

3
I. INTRODUCTION
This paper analyzes the impact of regulatory change – in this case, the implementation of
tradable property rights – on efficiency in a resource-based industry. We find that simply
measuring industry-level changes in efficiency obscures both the change in efficiency of
production and the distribution of efficiency gains. In particular, industry-level change can result
from changes in the efficiency of individual productive units, or from changes in the composition
of the industry. We show that rent-seeking behavior of firms will change the composition of the
industry prior to policy change, and that this shift will upwardly bias estimates of efficiency
change. By analyzing panel data with firm identifiers, this paper empirically demonstrates rent-
seeking behavior during policy negotiations and estimates the distribution of efficiency gains
over industry participants.
Economic theory establishes that a given environmental standard can be met at a lower
cost under well-defined tradable property rights than under traditional command-and-control
regulation.1 Significant recent research has empirically evaluated tradable property rights
systems in areas such as the U.S. Acid Rain Program2 and more recently in U.S. fisheries3.
However, in measuring the impact of policy change, it is necessary to account for the behavioral
response of regulated firms to the design of the new policy. Rent-seeking behavior has been
1 For example, D.W. Montgomery, Markets in Licenses and Efficient Pollution Control Programs, 74 J. Econ. Theory 941 (1972). For the case of fisheries see D. Moloney, D. and P. Pearse, Quantitative Rights as an Instrument for Regulating Commercial Fisheries, 36 Journal of Fisheries Research Board Canada. 859 (1979). 2 For a comprehensive review see A. Denny Ellerman et al., Markets for Clean Air: The U.S. Acid Rain Program (2000). 3 An extensive analysis includes R. Quentin Grafton et al., Private Property and Economic Efficiency: A Study of a Common-Pool Resource, 38 J. Law & Econ. 679 (2000). The authors measure change in efficiency using three different random samples in the British Columbia halibut fishery. The years in which the samples were taken include 1988 (the year a small group of fishermen requested individual fishing quotas), 1991 (the first year of a trial program), and 1994 (the second year that the quotas were tradable).

4
documented in the case of tradable emissions permits;4 this paper looks at analogous behavior in
response to the design of tradable property rights. The results demonstrate that firms' forward-
looking behavior biases estimates of both the change in efficiency of vessel production and the
distribution of these gains across firm and vessel types.
While command-and control regulation of fisheries often produces tremendous
overcapitalization and inefficient use of capital,5 tradable property rights are predicted to
eliminate inefficient vessels and increase the efficiency of remaining capital6. In the long run,
tradable property rights should result in the cost-minimizing fleet; therefore, their effectiveness
can be measured by comparing levels of efficiency under the competing policy approaches7.
Carefully measuring the impact of this strategic behavior is especially important given
current policy debates over tradable property rights systems. However, measuring relative
efficiency is complicated by the effect of incentives during the policy negotiations that precede
the implementation of tradable property rights. In commercial fisheries, property rights have
4 See Paul. L. Joskow & Richard Schmalensee, The Political Economy of Market-Based Environmental Policy: The U.S. Acid Rain Program, 41 J. Law & Econ. 37 (1998) and Juan-Pablo Montero et al., A Market-Based Environmental Policy Experiment in Chile, 35 J. Law & Econ. 267 (2002). 5 Gear restrictions, trip limits and limits on the number of allowed fishing hours are often met with increased capital in the fishery. A classic case is the halibut fishery, in which increasingly strict command-and-control regulations were circumvented by increasing capitalization. At the peak capitalization the entire year’s allowable harvest could be harvested in a single day, commonly referred to as the Halibut Derby. 6 For a comparison of labor productivity across fisheries with differing property rights structures see Richard J. Agnello and Lawrence P. Donnelley, Property Rights and Efficiency in the Oyster Industry, 18 J. Law & Econ. 521 (1975). Additional reviews of property rights in fisheries include Keith E. Casey et al., The Effects of Individual Vessel Quotas in the British Columbia Halibut Fishery, 10 Marine Resource Econ. 211 (1995). Gerry Geen & Mark Nayar, Individual Transferable Quotas In The Southern Bluefin Tuna Fishery: An Economic Appraisal Marine Resource Economics, 5 Marine Resource Econ. 365 (1988); R. Linder, H. Campbell, & G. Bevin, Rent Generation During the Transition to a Managed Fishery: The Case of the New Zealand ITQ System, 7 Marine Resource Econ. 229 (1992). 7 Previous studies of economic benefits of tradable property rights over command-and-control include simulations of cost savings with the technically minimum size fishing fleet and elimination of excess capital under costly reversibility and uncertainty. See Quinn Weninger and Richard Just, Assessing Efficiency Gains from Individual Transferable Quotas: An Application to the Mid-Atlantic Surf Clam and Ocean Quahog Fishery, 80 Amer. J. Agr. Econ. 750 (1998); and Quinn Weninger and Richard Just, Firm Dynamics with Tradable Output Permits, 84 Amer. J. Agr. Econ. 572 (2002). This study uses a larger panel of vessels as well as unique firm identifiers, making it possible to evaluate the efficiency change by type of firm (integrated or independent).

5
historically been allocated a gratis based on the total past harvests of boats,8 a principle that is
likely to be incorporated into national legislation. As a result, firms that foresee a policy change
will adapt their current behavior to maximize their benefits under the new policy9.
Political debate has surrounded the economic evaluation of the industry studied in this
paper, the Mid-Atlantic surf clam fishery10. The resulting controversy over the distribution of
gains and losses from policy change in this and other domestic fisheries has dominated the
national debate, frustrated attempts to introduce policy alternatives, and led to lawsuits against
the regulatory agency11.
The econometric issues involved in measuring growth of efficiency and distribution of
these gains over types of firms are similar to those involved in identifying the relationship
between firm size and firm growth, beginning with Gibrat; however, attrition of firms can lead to
sample selection bias if the disturbance of the selection equation is correlated with the
disturbance of the growth equation12. This paper explores the consequences of policy-induced
attrition in estimating efficiency gains on the vessel level. In addition, this paper examines how
behavior prior to the policy change exaggerates the potential for sample selection bias.
There is ample evidence that tradable property rights are not implemented as an
exogenous shock, but are anticipated by fishing firms and incorporated into their economic
8 National Research Council, Sharing the Fish (1999). 9 Anecdotal evidence of this rent seeking behavior is available for the Alaskan halibut and sablefish individual tradable quota programs. See National Research Council, supra note 8, for a discussion. 10 The surf clam and ocean quahog fishery has been cited both as successful and a failed tradable property rights system. For conflicting views see, National Research Council, supra note 8 and Reauthorization of the Magnuson-Stevens Fishery Conservation and Management Act before the Subcomm. of Fisheries Conservation, Wildlife and Oceans Comm. on Resources, 4-5 (2002) (statement of William Hogarth, Assistant Administrator for Fisheries, National Marine Fisheries Service, U.S. Department of Commerce). 11 Two example of lawsuits over this issue are: Sea Watch International, et al. v. Secretary of Commerce, 762 F. Supp. 370 (1991) and Alliance Against IFQs, et al. v. Secretary of Commerce 84 F.3d 343 (9thCir. 1996). The plaintiffs in Sea Watch International, et al., v. Robert Mosbacher argue that the property rights system violated the national equity and fairness standard, National Standard Four of the Magnuson-Stevens Act, because it is intended to drive a particular group of individuals - single vessel owners and small fleet owners - out of fisheries. 12 Bronwyn Hall, The Relationship Between Firm Size and Firm Growth in the US Manufacturing Sector, 35 J. of Industrial Econ. 583 (1987).

6
decisions13. This anticipation of policy reform produces three effects: re-entry into the industry
by marginal firms to “stake their claim” for quotas; increased effort in order to increase the size
of that claim; and a spike of exits after policy change. This adaptive behavior determines both
the relative efficiency of vessels in the fishery and the types of firms (vertically integrated,
horizontally integrated, or independent) that make up the industry. As a result, simply
comparing mean efficiency levels before and after policy change suffers from sample selection
bias, because strategic behavior affects the composition of the industry and hence the sample.
This paper shows the direction and scale of this bias when measuring changes in efficiency, and
estimates mean efficiency change after correcting for sample selection. In addition, it identifies
what types of vessels and firms gain the greatest benefits from tradable property rights.
II. THEORETICAL MODELS OF SAMPLE SELECTION
This section presents two alternative models of firm behavior under property rights
implementation: one in which firms do not play a role in policymaking, and one in which they
do. These models demonstrate two points: first, participation in the regulatory process changes
the composition of the industry prior to policy change; and second, firms that remain in the
industry after policy change are systematically different from those firms that do not. Mean
aggregate efficiency under the two polices is driven primarily by the composition of the fleet;
only after correcting for strategic behavior and sample selection is it possible to estimate the
change in efficiency of individual vessels.
Because this paper is concerned with forward-looking firm behavior, complications such
as uncertainty, stochastic population, and so on are disregarded in favor of specifically relevant
behavior. A common approach to limiting capital in fisheries is to ration licenses or permits to
13 All regional fishery management council meetings are open to the public and are preceded by mailings to stakeholders and multiple forms of public notice.

7
harvest. Typically, there are only nominal fees to obtain licenses; consequently, in many
fisheries, the total number of licenses N exceeds the number of licenses being used in any year
(where tn = "active licenses" in year t, tN n≥ )14. Because licenses in federal commercial
fisheries are granted to vessels, not vessel owners, the total number of licenses defines the
population of vessels permitted to harvest, not the number of fishing firms (which is less than or
equal to the number of vessels). From the firm's perspective, an unutilized fishery license is an
option to enter that fishery in the future. In this model, licensed but inactive vessels can re-enter
the fishery in the future: this potential for additional harvesting is termed "latent effort"15.
Therefore, the stylized model encompasses two regulatory states: regulation by license
limitations with latent effort, and regulation by transferable property rights. The transition
between states is compared under two scenarios of firm behavior. In the first scenario, firms are
naïve in that they do not foresee the introduction of property rights: in the second scenario, firms
are informed of the negotiation of property rights and anticipate their introduction.
A. Scenario One: No Policy Expectations
We begin by describing the transition from limited licenses to tradable property rights
without the expectation of policy change. Following the classic model of the competitive
fishery, each fishing firm faces an exogenously given price ( p ) and population ( x ) of fish16.
Define the harvest ( ih ) of each vessel as a function of the vessel's standardized fishing effort
14 The granting of licenses may be restricted by participation requirements. In some cases replacement of vessels lost at sea and capital improvements are strictly regulated to preserve the initial distribution of vessel technologies. 15 Between 1995 and 2000 the federal government spent $130 million in “buyback” programs. In order to reduce latent effort, these funds were used to purchase fishing permits, fishing gear, and vessels from fishermen in three fisheries - New England groundfish, Bering Sea pollock and Washington State salmon. 16 A review of fisheries economics is Gordon Munro, Mathematical Bioeconomics and the Evolution of Modern Fisheries Economics, 54 Bulletin of Math. Bio. 163 (1992).

8
( iE ), the fish population biomass ( x ), and a constant that reflects the catchability of the fish
given its population ( ( ), where 0= >q q x q ):
(1) ( , , )i ih H E x q=
The ith vessel has a net revenue flow given by the difference between the revenue from
the harvest ( iph ) and the variable cost for the effort expended ( ( )i ic E ). The vessel's cost
function is defined to include the vessel's opportunity cost in any alternative fisheries. Under
command and control regulation, the firm's level of effort must be less than the regulatory cap on
effort, E , and the last vessel to re-enter the fishery must not exceed the number of allowable
licenses, N .
(2) i
t
E E
n N
≤
≤
Thus the constrained optimization for effort is17:
(3) ( )1( , , ) ( )i i i iL pH E x q c E E Eλ= − − −
Activity in the industry is then determined by a firm's short-run choice of the optimal
level of effort and the firm's long-run choice of the optimal level of capital (vessels). A vessel
will harvest if it can cover its minimum average variable cost, ir ; otherwise the optimal level of
effort will be zero. Thus, in the short run, the fishing firm maximizes its current net revenue
taking the population and price of fish as given, which yields the following first order condition:
(4) 1( ) ( , , ) if ( , , )
0 if ( , , )
l′ ′ ′+ = ≥′= <
i i i i i
i i i
c E pH E x q pH E x q r
E pH E x q r
17 In the dynamic setting the change in the population of fish is driven by the difference between the growth rate of the population and the aggregate harvest over all vessels. Note that as in the open access case, each vessel does not take into account its harvest on the total impact on the population of the fish. Here we are not comparing the social optimum to the industry outcome, but industry outcomes under alternative regulations.

9
The level of capital in the industry is determined by the exit of currently active vessels
and re-entry of vessels that have licenses but are not currently active. In order to compare the
salient changes in behavior, we use a simple model of re-entry and exit. We assume perfect
foresight of prices of harvest and effort and zero costs of re-entry and exit. For the empirical
case presented here these are reasonable approximations18. Exit occurs when a vessel's marginal
revenue falls below its minimum average cost. Because the cost function includes the
opportunity cost represented by alternative fisheries, vessel j will re-enter the fishery when the
exit condition is reversed. Entry will continue until the largest number of vessels that can break
even is reached with the only binding constraint being the total number of vessels with licenses,
N . The exit condition for a currently active fishing vessel, i, and the entry condition for a
potential fishing vessel, j, are summarized as:
(5) ( , , ) Exit condition for vessel
( , , ) Re-entry condition for vessel i i
i j
pH E x q r i
pH E x q r j
′ <′ >
Under license limitations, the total number of boats active is determined by the exit and
re-entry conditions for the inframarginal vessels with average cost, nr , for which
(6) ( , , )n ir pH E x q′=
At any point in time, all licensed vessels could be ranked in ascending order by minimum
average cost (descending order by marginal efficiency):
(7) 1 2 ... nr r r≤ ≤ ≤
Conditions (4) through (7) describe the fishery under command and control regulation limiting
both capital and effort.
18 In this empirical example, long-run contracting between processor and harvester ensured stable output prices. In addition, because the vessels that exit and re-enter are moving between fisheries, the costs of exit and re-entry are relatively minimal.

10
The standard fishery model differs under tradable property rights, because the regulatory
constraint is not on inputs (effort and capital) but rather on outputs. The vessel's total harvest
must not exceed the vessel's allocated quota (8), where the total harvest quota,Q , is the sum of
each individual vessel's harvest quota.
(8)
1
i i
n
ii
h Q
Q Q=
≤
= ∑
Once the market for quotas is established, there is a price, m , for a unit of harvesting
quota. The price per unit of quota can be interpreted as the opportunity cost incurred by using
the quota to harvest rather than selling it to the next vessel. The property right to harvest then
becomes an additional capital asset to the firm. The vessel's choice of effort level under
transferable property rights is a modification of (4):
(9)
2
2
( , , ) [ ( , , ) ] ( ) ( ( , , ) )
F.O.C.
( ) ( , , ) ( ) ( , , ) if ( ) ( , , )
0
l
l
= − − − − −
′ ′ ′ ′+ = − − ≥=
i i i i i i i
i i i i i i
i
L pH E x q m H E x q Q c E H E x q Q
c E H E x q p m H E x q p m H E x q r
E if ( ) ( , , )
′− < i ip m H E x q r
The total number of vessels actively harvesting is determined by the re-entry/exit
condition, which differs from (5) by the opportunity cost of holding the quota rather than selling
it at price m .
(10) ( ) ( , , ) Exit condition for vessel
( ) ( , , ) Re-entry condition for vessel i i
i j
p m H E x q r i
p m H E x q r j
′− <′− >
Under tradable property rights, the exit condition (10) reflects the cost of the new capital
asset, the quota. Thus the condition for the inframarginal fishing vessel (6) becomes:

11
(11) ˆ ( ) ( , , ) n ir p m H E x q′= −
Therefore, under tradable property rights the average cost n̂r of the inframarginal vessel is
less than that of the inframarginal vessel under license limitations ˆ, thus n n nr r r< . Otherwise
stated, the marginal vessel is more efficient under tradable property rights than under license
limitations.
This is the standard model of a fishery under command and control and under tradable
property rights. In contrast, the next section extends the standard model by allowing firms to be
aware of policy negotiations and impending policy changes, with implications for both firm
behavior and overall fleet composition.
B. Scenario Two: Anticipated Policy Change
The previous section demonstrates that the efficiency of the inframarginal firm depends
on the current period's policy instrument, where the change in efficiency is a discrete event at the
time of the policy change. This section focuses on the period preceding actual implementation of
tradable property rights, involving lengthy negotiations and significant industry participation in
policy design and approval. Although economists envision initial distribution of property rights
via auction, regulatory history shows that initial allocation is typically based on past
production19. Therefore, firm behavior is characterized here using a stylized two-period model
where harvesters maximize profits and expect to receive allocations based on their historical
harvests. In this extended model, anticipation of impending policy change produces a change in
behavior in the current period; empirical evidence of this change is presented in Section III.
Policy periods are distinguished with a time subscript: period 1 is the period of license
limitations and property rights negotiations, and period 2 is the period of tradable property
19 National Resource Council, supra note 8 and Montero et al., supra note 4.

12
rights20. The profit functions for each period are extensions of the profit functions in the first
scenario. The quota allocation rule, ( )1 1 1, , A H E x q , grants each firm quota as an increasing
function of its harvest in the first period. Although its specific functional form varies, the
allocation of quota as an increasing function of previous production is consistent across
fisheries21. The general allocation rule is given by:
(12) ( )1 1 1, , where 0∂ = > ∂i
AQ A H E x q
H
Forward-looking behavior dictates choosing effort in each period to maximize the two-
period profit function, where the second period profit is discounted by d and regulations are
binding on the individual vessels. Thus the objective function for the representative vessel is
(13)
( )( ) ( ){ }
1 1 1 1 1 1 1
2 2 2 2 2 2 2 1 1 1 2 2 2 2 2 1 1 1
( , , ) ( )
( , , ) ( ( , , ) , , ) ( ) ( ( , , ) , ,
ld l
= − − − + − − − − −
L p H E x q c E E E
p H E x q m H E x q A H E x q c E H E x q A H E x q
The first-order conditions in period one and period two are given by (14). Note the additional
term "strategic effort effect" in the first-order condition for period one.
(14) ( )
( )
1
1 1 21 1
strategic effort effect
2
2 22 2 2
F.O.C. w.r.t
F.O.C. w.r.t
l d l
l
∂ ∂ ∂ + = + + ∂ ∂ ∂
∂ ∂ ∂+ = −∂ ∂ ∂
144444424444443
E
c H Ap m
E E H
Ec H H
p mE E E
20 For the ease of exposition, the subscript for the individual vessel, i , is suppressed 21 In all five U.S. fisheries that have implemented tradable property rights, initial quotas were allocated based on vessels’ harvest over a defined timeframe. See National Research Council, supra note 8.

13
These first-order conditions show how firms modify their behavior prior to property
rights implementation in order to maximize their initial allocation. In period one, effort is
increased until the marginal cost of effort equals the marginal profit of harvests plus the
discounted marginal profit from the additional quota allocation in the second period. Thus the
expectation that quota will be allocated based on past production increases the incentives for
production.
Because quota are allocated to vessels, not firms, a firm that retires a vessel before
property rights are implemented loses its claim to that vessel’s harvest. Therefore, the second
effect of forward-looking behavior is that the re-entry/exit condition must be adjusted to reflect
the benefits of initial quota allocation. In period one, the equilibrium re-entry/exit condition
includes the additional “strategic entry effect” term, which reflects the discounted value of the
additional quota allocated in the period two:
(15) 1
strategic re-entry effect
( , , )d ∂ ′= + ∂ 1442443n i
Ar p m H E x q
H
The effort conditions and exit/re-entry conditions for the representative firm are summarized in
TABLE 1. Notice that the difference between the naïve and forward-looking models occurs in
the first period prior to the actual policy change.

14
TABLE 1:
EFFORT AND RE-ENTRY/EXIT CONDITIONS
Effort Condition Equilibrium Re-entry/exit Condition
Naïve model
Period 1 1 1l∂ ∂+ =∂ ∂
c Hp
E E 1
∂= ∂n
Hr p
E
Period 2 2 2( )l∂ ∂ ∂+ = −∂ ∂ ∂
c H Hp m
E E E ˆ 2( )
∂= − ∂n
Hr p m
E
Forward-looking model
Period 1
( )1 1 21 1
strategic effort effect
l d l ∂ ∂ ∂ + = + + ∂ ∂ ∂ 144444424444443
c H Ap m
E E H 1
1strategic re-entry effect
d ∂ ∂ = + ∂ ∂ 1442443n
A Hr p m
H E
Period 2 ( )2 22 2 2
l∂ ∂ ∂+ = −∂ ∂ ∂c H H
p mE E E
ˆ 22
( )∂= − ∂n
Hr p m
E
Thus we can rank the average costs of the inframarginal fishing vessel, r, and the level of
effort, E, under the three states:
(16)
ˆ
ˆ
where = license limitations, forward-looking model = license limitations, naive model
ˆ = tradable property rights, both models
> >< <
n n n
n n n
r r rE E E
nnn
These two models identify three important behavioral factors that must be incorporated
into econometric models. First, in the period prior to policy change, vessels will increase effort
in order to maximize their initial quota allocations. Second, the threshold for re-entry is lower

15
under the forward-looking model, and so the vessels that re-enter in anticipation of policy change
will be less efficient than if there is no such expectation. Third, vessels that exit after policy
change will by design be the least efficient.
These factors have important implications for the empirical analysis of efficiency under
the competing policies. Observed changes in mean efficiency under the two policies will be
largely driven by changes in industry composition (that is, the efficiency of the inframarginal
vessel). Strategic behavior in the negotiation period – primarily re-entry of particularly
inefficient vessels – will upwardly bias simple estimates of change in mean efficiency. In order
to assess efficiency gains across firm types – and thereby measure relative benefits from policy
change – it is necessary to compare vessels that were active in both periods, correcting for
sample selection.
The next section presents empirical evidence of the strategic behavior predicted in the
model presented above.
III. EMPIRICAL EVIDENCE OF STRATEGIC BEHAVIOR
In the preceding model, strategic firm behavior prior to actual policy implementation
leads to changes in industry composition, implying the need to correction for sample selection
bias when evaluating the efficiency impact of tradable property rights. This section provides
empirical evidence of this predicted behavior. The first sub-section measures change in
production effort and change in exit/re-entry of vessels; the second sub-section shows that the
vessels that re-entered the fishery during the negotiation period and those that exited
immediately after policy change were significantly less efficient than those vessels that remained
in the fishery. The evidence is drawn from sixteen years of input and output data from the Mid-
Atlantic surf clam industry.

16
A. Changes in Effort and Vessel Re-entry
The Mid-Atlantic surf clam and ocean quahog fishery was chosen for this analysis
because it has a history of innovative management and has been a touchstone in the debate over
the distribution of gains of tradable property rights. This fishery provides almost the entire
supply for domestic processed clam products22. Data used to estimate the models are from the
National Marine Fishery Service logbook reporting system, which documents every harvesting
trip taken by every vessel23. In 1976 legislation was enacted restricting allowable fishing time
and limiting access for a period of fourteen years. By the mid-1980s, however, rapid growth in
harvesting capacity and resulting inefficiencies led to a proposal to implement a property rights
system; from the mid 1980s through 1988, council meetings were dominated by the contentious
issue of distributing quotas among the industry participants24. Throughout the period, however,
it was clear that allocations would be based in some form on each vessel’s catch history25.
The most common allocation scheme used in fisheries at that time was to grant individual
allocations in proportion to the catch history of each vessel. Therefore, while harvesters were
maximizing their current profit, they expected to receive an allocation based on their catch
history, as characterized in the second stylized model above. The allocation formula was
22 National Marine Fisheries Service, Fisheries of the United States (1999). While two clam species, the surf clam and ocean quahog, can be harvested with the same vessel, subject to gear modifications, the surf clam fishery is the dominant fishery both in terms of value of the resource and harvest effort. 23 Compliance with reporting regulations is rated as high. See Dayna Matthews, Beyond ITQ Implementation: A Study Of Enforcement Issues In The Mid Atlantic Surf Clam And Ocean Quahog Individual Transferable Quota Program (1997). 24 The policy negotiations throughout this entire period focused solely on the surf clam fishery. The addition of ocean quahogs, an imperfect substitute, to the tradable property rights plan occurred in the final stages of policy revisions. 25 The formal discussion of ITQs began with a discussion paper written and circulated by the management council in 1986. For more, see Mid-Atlantic Fishery Management Council, Limited Entry, the Magnuson Act and the National Standards (1986). The plan to design and implement tradable property rights went through several revisions. See Mid-Atlantic Fishery Management Council, Amendment Eight: Fishery Management Plan for the Atlantic Surf Clam and Ocean Quahog Fishery: Draft (1988).

17
finalized in 1988,26 and the first full year of tradable property rights was 1991. After
implementation the quotas were disaggregated from vessels and could be traded as a second form
of capital.
The first indicator that firms anticipated the implementation of property rights is an
increase in harvesting effort. Because of existing regulation, firms could not simply increase
their time spent harvesting. While quantities of time, gear, and fuel are all measurable inputs,
the quality of the labor input and utilization of the observable inputs are unobserved. Given that
the technology remained essentially unchanged throughout this period, an increase in
unobservable effort is reflected in an increase in average catch. As TABLE 2 shows, the period
of negotiation of property rights was marked by a significant increase in the average harvest of
surf clams per vessel. Between 1983 and 1984 there was an unprecedented 21% increase in
bushels harvested per vessel, at the same time that the number of vessels in the fishery was
increasing. The harvest of surf clams per vessel over 1985-1988 was, on average, 26% higher
than 1980-1984. At the same time, harvest per vessel in the ocean quahog fishery – the
alternative opportunity for surf clam vessels - actually declined.27 Over 1985-1988 the harvest of
quahogs per vessel was, on average, 4% lower than during 1980-198428. At the same time,
fishing firms increased their competitiveness in the race for shares of the property rights by
26 The National Oceanic and Atmospheric Administration approved the final version of the tradable property rights program in 1990. See Mid-Atlantic Fishery Management Council, Amendment Eight, Fishery Management Plan for the Atlantic Surf Clam and Ocean Quahog Fishery (1990). The surf clam allocation included vessel catch (80%) and vessel capacity (20%). For vessels harvesting surf clams, the historical catch was equal to the vessel’s total harvest over 1979-1988 (counting the years 1985-88 twice and dropping the vessel’s worst two years). Each vessel’s catch ratio was the vessel’s historical catch divided by the sum of all vessels’ historical catch. The vessel’s cost factor was equal to the product of the vessel length, width and volume. The vessel’s cost ratio was equal to the vessel’s cost factor divided by the sum of the cost factors over all vessels. The vessel’s initial surf clam allocation was: surf clam initial allocation percentage = 0.8 (catch ratio) + 0.2 (cost ratio) 27 Recall that in this period, there was no expectation that tradable property rights would be implemented for the ocean quahog fishery. 28 Over the entire period 1983-1989 there were insignificant changes in populations of the two clam species.

18
replacing smaller vessels with larger vessels; in 1987 the mean vessel was 11% larger in gross
registered tonnage than in 198329.
TABLE 2: CHARACTERISTICS OF SURF CLAM FISHERY 1980-2000
Year Average Surf Clam Bushels per
Boat Average Substitute Bushels
per Boat Number of Active
Vessels 1980 15,150 56,957 127 1981 16,069 61,453 123 1982 17,416 75,367 115 1983 20,615 86,909 117 1984 24,933 69,526 119 1985 22,379 71,399 130 1986 22,088 57,878 144 1987 19,858 66,803 142 1988 22,624 72,087 134 1989 21,025 71,453 135 1990 24,328 82,543 128 1991 35,646 98,772 75 1992 47,666 114,853 59 1993 53,485 133,665 53 1994 60,567 128,094 48 1995 68,792 128,565 37 1996 75,568 121,984 34 1997 73,139 138,034 33 1998 76,302 162,395 31 1999 76,905 163,926 33
Source: Mid-Atlantic Fishery Management Council, Overview of the Surf Clam and Ocean Quahog
Fisheries and Quota Recommendations for 2001 (2000).
While firms were increasing harvesting effort, the threshold for vessels to re-enter the
fishery was lowered. As seen in TABLE 2, the decline in the number of vessels harvesting surf
clams reversed in the mid-1980s, and the number of vessels increased 23% between 1983 and
1986 and remained high until after property rights were implemented. This period also saw a
shift in ownership of capital: between 1983 and 1987 the largest fishing firm increased its
capital by six units to bolster its claim to future property rights. Processing firms, who could
receive a property right only through ownership of harvesting vessels, also increased vessel
29 The industry means for 1984 and 1987 are 111 and 123 gross registered tons, respectively.

19
ownership to accumulate future property rights, the median processor acquiring an additional
vessel during the negotiations and then decreasing its vessel ownership by 50% immediately
after property rights were separated from vessels. The processor with the greatest number of
vessels acquired four vessels prior to the policy change and decreased its vessel ownership by
75% within the first three years of tradable property rights.
B. Changes in Vessel Efficiency
The previous sub-section discusses changes in effort and in participation in the industry
during property rights negotiations. To evaluate the efficiency impact of tradable property
rights, however, it is necessary to establish how strategic behavior affected the efficiency of the
inframarginal producer. Empirical estimates of vessel efficiency for 1984-1999 demonstrate two
significant differences among vessels. First, vessels that stayed in the fishery under tradable
property rights were significantly more efficient than those that exited the fishery after policy
change. Second, vessels that re-entered the fishery during the negotiation period were
significantly less efficient than all other vessels. This strategic behavior determines which
vessels are observed in each period, affecting estimates of the change in efficiency. In order to
separate the effect of strategic behavior from the effect of the new policy, the econometric model
must correct for this effect30.
Each vessel's annual efficiency is calculated by first estimating a stochastic production
function for the industry. The stochastic production function breaks the deviation from the
theoretical production function into two sources, production inefficiency and white noise; it is
30 Additionally, the results imply that the allocation of property rights should take into account the strategic behavior of producers in constructing the allocation formulas so as to reduce incentive for socially inefficient behavior prior to implementation. The topic of allocating tradable property rights given forward-looking behavior is addressed in our working paper.

20
written as an ordinary production function with the addition of a one-sided inefficiency term,
indicating the distance from the production frontier for a given vessel in each year.31
In the surf clam fishery, the log of outputs is modeled as linear in the log of inputs (fuel,
labor, and capital) and the log of the population of the resource.32 Thus the regression equation
for firm i is linear in logarithms of output (harvest, h) and inputs (fuel, labor and capital,
population) and allows for inefficiency (u) and white noise (v)33:
(17) 2
2
( ) ( ) ( ) ( )
where:1,2,...,
(0, )
0, where distributed as the normal truncated at zero of ( , )
a b b b b
sm s
∗ = + + + + + −
= ×
≥∼
i fuel i labor i population capital i i i
i v
i i u
h fuel labor population capital v u
i N T
v N
u u N
( )12 2 2
2
2 2
es s s
sg s s
= −= +
= +
i i i
u v
u
u v
v u
Despite its asymmetric distribution, the compound error term, ( )i iv u− , can be estimated
using maximum likelihood estimation34. The parameter γ reflects the appropriateness of using
the stochastic production function over a deterministic production function35.
31 Disaggregating natural variation, or white noise, from the inefficiency term is particularly appealing in modeling output in an industry such as a fishery in which weather and other natural forces can cause normal variation in output. 32 The fuel input reflects distance and speed traveled. Labor is the measure of total man-hours spent harvesting. The measure of capital is the length of the vessel, a standard proxy in the fisheries economics literature. The measure of population of the clams reflects resource scarcity, where the population of clams is a type of natural capital. 33 This specification of the production function follows George Battese, Tim Coelli and T. Colby, Estimation of Frontier Production Functions and the Efficiencies of Indian Farms Using Panel Data from ICRISAT's Village Level Studies, 5 J. of Quantitative Econ. 327 (1989). 34 See William Greene, Econometric Analysis (2000). 35 Following established literature, we use the parameterization of σ and γ from G.E. Battese and G.S. Corra, Estimation of a Production Frontier Model With Application to the Pastoral Zone of Australia, 21 Australian J. of

21
The panel data consists of vessels that harvested surf clams over 1983-1999 yielding a
total of 1298 unique observations (vessel-year observations). Summary statistics for the inputs
and outputs of the stochastic production function are shown in TABLE 3.
TABLE 3:
SUMMARY STATISTICS FOR HARVESTS AND EXPLANATORY VARIABLES OF PRODUCTION FUNCTION
Variables
1983-1990 1991-1999 1983-1999 Harvest
Mean 9.57 9.78 9.63 Standard deviation 1.21 1.16 1.20
Capital (vessel length) Mean 4.41 4.42 4.41 Standard deviation 0.24 0.18 0.23
Labor (crew hours) Mean 7.13 7.10 7.12 Standard deviation 0.95 1.13 1.00
Fuel (gallons) Mean 9.28 9.20 9.26 Standard deviation 0.96 1.17 1.02
Population of clams (metric tons of biomass) Mean 14.09 14.01 14.06 Standard deviation 0.04 0.03 0.05
NOTE. – There are 947 observations in the Command and Control period, 351 observations in the
Tradable Property Rights period, and 1298 observations overall.
The coefficients and standard errors for the estimated stochastic production function are
presented in TABLE 4, which shows that all the parameters for the inputs chosen by the
harvester (fuel, labor, length) are positive and statistically significant at the 1% level36. The
population of clams is not statistically significant, reflecting the relative stability of population
Agricultural Econ. 169 (1977). Note that γ does not have chi-square distribution because the hypothesis that it equals zero means that it is on the boundary of the parameter space. Since the restriction is on the boundary space, the distribution of the test statistics for gamma is a mixed chi-square. 36 The null hypothesis of constant returns to scale in all inputs and both vessel and resource capital (fuel, labor, population, capital) is not rejected at the 5% level.

22
over the entire time period.37 The parameter γ is significant at the 1% level, implying that
technical inefficiency exists in the production function and accounts for more than the variation
from random white noise and that a stochastic frontier production is appropriate38. The
importance of the parameters of the stochastic production function is in the estimation of
efficiency of each vessel-year observation.
TABLE 4
MAXIMUM-LIKELIHOOD ESTIMATES OF STOCHASTIC PRODUCTION FUNCTION, 1983-1999
ln(Harvest in Bushels) Constant 6.216 (4.104) Fuel 0.409** (0.054) Labor 0.455** (0.059) Population 0.337 (0.288) Length 0.418** (0.074)
2σ 0.961 (0.048) g 0.940** (0.010)
2uσ 0.903 2vσ 0.058
Log likelihood -1134.762 NOTE. – Standard errors are in parentheses. The parameter estimates are the coefficients on the log of
output in logs from the production function with a compound error term. The model uses a total of 1298
vessel-year observations.
** Significant at the 1 percent level.
To estimate the change in efficiency of an individual vessel, the efficiency score of each
vessel-year was estimated. Technical efficiency is expressed as the ratio of the vessel’s mean
production, conditional on the observed levels of factor inputs and firm effects, to the maximum
level of production, conditional on the same levels of inputs, but assuming those inputs are 37 Since the recovery of the population following the die-off of the clams in the mid-70s, both the population and total allowable harvests have been very stable. 38 The calculated likelihood ratio for γ is 325.2.

23
utilized optimally39. The efficiency score of each vessel-year is defined as the vessel-year's
output conditional on its inefficiency term, ui, relative to the production frontier (maximum
output with inefficiency term equal to zero)40.
(18) ( )
( ),
0,i i i
ii i i
h u eefficiency
h u e
Ε= Ε =
||
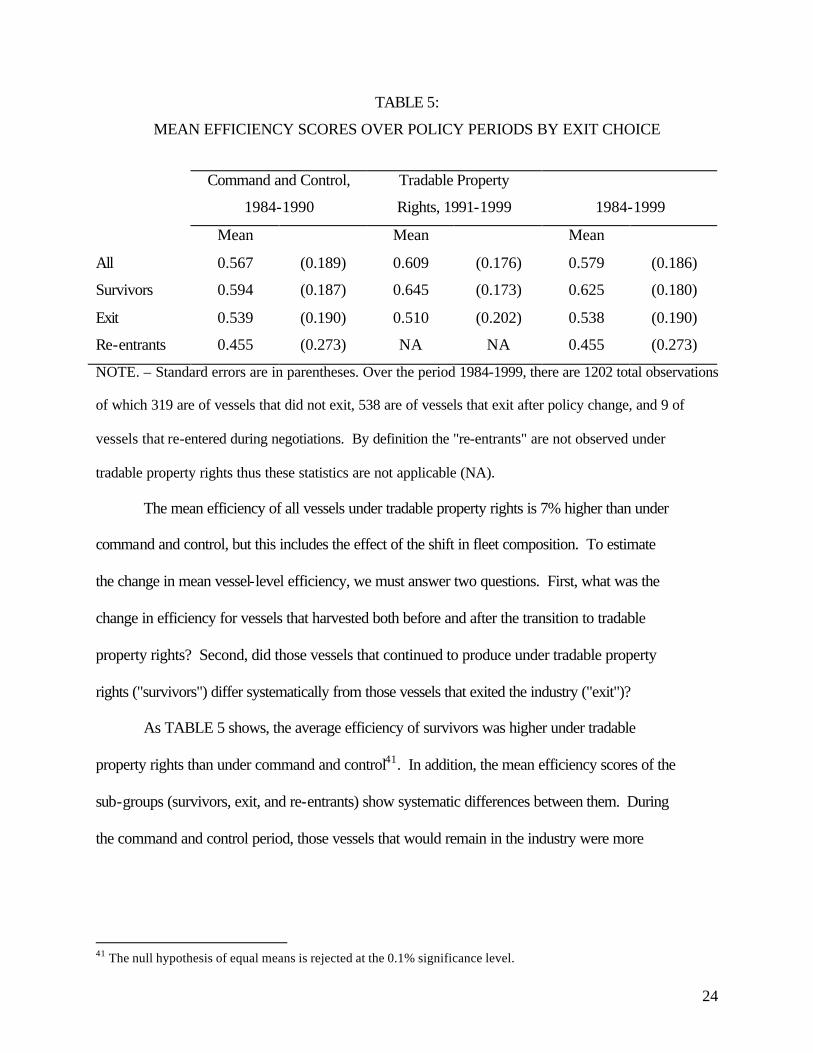
Thus, the efficiency score is bounded by zero and one, and a score closer to one indicates
a higher level of efficiency. TABLE 5 presents the mean efficiency scores over four categories
of vessels and three time periods. The four categories of vessels are defined by their re-entry or
exit decisions. “All” refers to all active vessels, regardless of re-entry/exit decision; "survivors"
are vessels that continued to harvest in the fishery after the transition to tradable property rights;
"exit" includes those vessels that ceased harvesting after the policy change; and “re-entrants” are
vessels that re-entered the fishery seeking to claim a share of future property rights. The three
time periods are the negotiation period (1984-1990), the tradable property rights period (1991-
1999), and the entire period (1984-1999).
39 Battese, G. Tim Coelli and T. Colby, Frontier Production Functions, Technical Efficiency and Panel Data: With Application to Paddy Farmers in India, 3 J. Productivity Analysis 153 (1992). 40 Note that the total disturbance, ei, not the inefficiency term, ui, is directly observed. The inefficiency term is estimated conditional on the observable total error.
24
TABLE 5:
MEAN EFFICIENCY SCORES OVER POLICY PERIODS BY EXIT CHOICE
Command and Control,
1984-1990
Tradable Property
Rights, 1991-1999 1984-1999
Mean Mean Mean
All 0.567 (0.189) 0.609 (0.176) 0.579 (0.186)
Survivors 0.594 (0.187) 0.645 (0.173) 0.625 (0.180)
Exit 0.539 (0.190) 0.510 (0.202) 0.538 (0.190)
Re-entrants 0.455 (0.273) NA NA 0.455 (0.273)
NOTE. – Standard errors are in parentheses. Over the period 1984-1999, there are 1202 total observations
of which 319 are of vessels that did not exit, 538 are of vessels that exit after policy change, and 9 of
vessels that re-entered during negotiations. By definition the "re-entrants" are not observed under
tradable property rights thus these statistics are not applicable (NA).
The mean efficiency of all vessels under tradable property rights is 7% higher than under
command and control, but this includes the effect of the shift in fleet composition. To estimate
the change in mean vessel-level efficiency, we must answer two questions. First, what was the
change in efficiency for vessels that harvested both before and after the transition to tradable
property rights? Second, did those vessels that continued to produce under tradable property
rights ("survivors") differ systematically from those vessels that exited the industry ("exit")?
As TABLE 5 shows, the average efficiency of survivors was higher under tradable
property rights than under command and control41. In addition, the mean efficiency scores of the
sub-groups (survivors, exit, and re-entrants) show systematic differences between them. During
the command and control period, those vessels that would remain in the industry were more
41 The null hypothesis of equal means is rejected at the 0.1% significance level.

25
efficient that those that would exit after property rights,42 implying that the survivor group
would have remained more efficient than the exit group, regardless of the policy change.
Vessels that entered during the negotiation period (re-entrants) are significantly less efficient
than any other group – as predicted by the theoretical model above. In summary, the three
groups can be ranked as follows:
efficiency (re-entrant) < efficiency (exit) < efficiency (survivor)
The change in industry composition brought on by policy negotiations had a significant effect on
mean efficiency, as illustrated by the time series in FIGURE 1. The trough in mean efficiency
during 1986-1988 was caused by substantial re-entry of inefficient vessels. Once quota
ownership was separated from vessel ownership, there was a drastic decline in the number of
vessels in the fleet, which was concurrent with an upward turn in mean efficiency after 1990.
Because vessels that exit after policy change are generally less efficient than those that
remain, the attrition after the policy change (exit) is correlated with the compound error term,
ei=vi - ui, producing selection bias. In addition, vessels entering the fishery during the policy
negotiation period are distinguished by significantly below-average efficiency. These re-
entrants, therefore, downwardly bias the estimated mean efficiency level prior to policy
implementation; as a result, estimates of the change in mean efficiency level will significantly
overstate the true change in efficiency. To correct for this bias and estimate the distribution of
efficiency gains across firm and vessel types, a regression model allowing for sample selection is
presented in the next section.
42 The null hypotheses of equal means between those that exit and those that survive is rejected at the 2% significance level.

26
IV. REGRESSION RESULTS: DISTRIBUTION OF EFFICIENCY GAINS
Two economic goals of tradable property rights are the elimination of overcapacity and
increasing the efficiency of remaining vessels. At first glance, it appears that these goals were
achieved in the surf clam fishery; from 1987 to 1993, the average level of efficiency in the
fishery as a whole increased by 14%, while the number of vessels harvesting decreased by 63%.
Despite these aggregate economic benefits, however, this dramatic change in the fishery created
substantial turmoil in policy discussions over tradable property rights. The essential economic
and legal question of "Who gains from tradable property rights?" remained unanswered. One
reason for this controversy is that simply looking at the mean efficiency of the industry as a
whole obscures the comparative impact of tradable property rights on different types of vessels
and firms. Two central issues are how are gains are distributed across vessel size categories and
across firm types43. This section presents regression results that show the importance of
forward-looking behavior and attrition in estimating both changes in vessel-level efficiency (in
contrast to aggregate industry efficiency) and comparative gains in efficiency across vessel and
firm types.
In order to isolate the effect of policy change on vessel-level efficiency, it is necessary to
look at the change in efficiency for a vessel that harvested under command and control (CC) and
then under tradable property rights (TPR). This change in efficiency relative to the starting
efficiency is:
(19) -
TPR CC
CC
efficiency efficiencygrowth in efficiency
efficiency=
One possibility might be to measure this growth in efficiency for the industry as a whole,
or for all vessels that operated both before and after the policy change. However, the empirical 43 Vessels are categorized into size classes based on their total gross registered tonnage; firm types include independent firms, harvesters vertically integrated with processing or distribution operations, and horizontally integrated harvesters

27
results described in the previous section indicate the potential problems with this approach.
First, the vessels that entered the industry immediately prior to the policy change were
particularly inefficient. Second, vessels that remained in the industry after the policy change
were significantly more efficient than those that exited after implementation. These findings
demonstrate the importance of sample selection: in fact, there are several distinct groups of
boats, and their relative presence in the industry shifted significantly over time. Therefore,
simply applying (19) to the industry as a whole will conflate this change in industry composition
with the change in vessel-level efficiency brought about by new policy.
The econometric model presented here begins with vessel-level efficiency estimates and
adds a second step that estimates the determinants of the change in vessel efficiency44, correcting
for biases caused by sample selection. This model is analogous to that used elsewhere to study
the relationship between firm size and firm growth45. The model compares a representative year
for each period: 1987 for command and control and 1993 for tradable property rights. 1987 was
chosen for the initial period because it includes the complete set of vessels that harvested in the
fishery; 1993 was chosen to reflect an initial period of restructuring during which vessels
adjusted to the new harvesting strategy46. Thus equation (19) becomes:
(20) 1993 1987
1987
-
efficiency efficiencygrowthin efficiency G
efficiency= =
44 For examples of this procedure in which estimated firm-level efficiencies are regressed on firm specific variables, see M.M. Pitt and L.F. Lee, Measurement and Sources of technical Inefficiency in the Indonesian Weaving Industry, 9 J. of Development Econ. 43 (1981). 45 In the manufacturing sector it has been observed that small firms that have slow or negative growth are more likely to disappear from the panel than are large firms. Because of the selective attrition the growth rate of firms is observed only for those firms that do not exit over the panel. A selection model is necessary to model the relationship between firm size and growth. See Hall supra note 12. Likewise, the current paper relies on the Heckman selection model to examine the determinants of the change in efficiency. 46 By reducing the window of analysis to the years 1987-1993, we capture the significant restructuring after the policy change while reducing reduce the influence of changes in other aspects of the system.

28
The growth in efficiency, however, is only observed for vessels that do not exit the
industry. As described in the previous section, these vessels are distinct from those vessels that
remain in the industry and those vessels that re-entered during negotiations. The determinants of
efficiency change are vessel age (age), type of firm that owns the vessel (firm=1 for integrated, 0
for independent), and vessel size in gross registered tonnage (GRT) (size=1 for GRT>100, 0
otherwise). However, a vessel is observed under tradable property rights only if it chooses not to
exit after the policy change. To determine the factors relevant to the selection equation we
conducted fieldwork in the industry. Interviews of harvesters and testimony at meetings of the
Mid-Atlantic Council clam industry indicate that there are three critical factors to the exit
decision: the number of contracts a vessel has with processors (contracts), vessel age (age), and
profit (profit).
The selection model captures these effects and models the change in efficiency
conditional on the decision to exit or to continue harvesting. Because all harvests in the surf
clam fishery go into processed products, contractual relationships with processors are crucial to
harvesters’ viability. The institutional norm in this fishery is a long-run relationship with
processors, both in the form of written contracts and mutual understandings, where violations of
trust can have significant consequences for locating a buyer of clams47. The variable contracts is
the number of processors a vessel delivers to in each year, relative to the industry mean.
Another important factor in the exit decision is the age of the vessel itself. First, older
vessels have increased wear and older technology, and are more likely to be retired by
horizontally integrated harvesters. Second, for independent harvesters, vessel age is positively
47 The surf clam fishery has been the subject of anthropological studies of natural resource use. For comprehensive reviews see Bonnie McCay et al., Individual Transferable Quotas in Canadian and U.S. Fisheries, 28 Ocean and Coastal Mgmt. 85 (1995); and Bonnie McCay and Carolyn Creed, Social Structure and Debates on Fisheries Management in the Mid-Atlantic Surf Clam Fishery, 13 Ocean and Coastal Mgmt. 199 (1990).

29
correlated with the length of time the harvester has been in the industry, and hence older vessels
are more likely to be owned by owners who are close to retirement age.
The third important driver of the exit decision is vessel profit, which has an obvious
interpretation. The summary statistics for vessels are presented in TABLE 6 and TABLE 7.
TABLE 6:
SUMMARY STATISTICS FOR EXPLANATORY VARIABLES IN SELECTION MODEL
Mean
Growth in Efficiency 0.265 (0.630)
Age in 1987 22.583 (19.117)
Relative number of contracts in 1987 0.248 (0.175)
Relative profit in 1987 .006 (0.004)
NOTE. – Standard deviations are in parentheses.
TABLE 7:
FREQUENCY OF FIRM AND VESSEL TYPES
Vessel Size in 1987
Firm type in 1987 <= 100 GRT > 100 GRT
Independent 20 17
Fleet or vertically integrated 29 66

30
Therefore the regression model is:
(21)
age firm size 1
contracts age profit 2
1
2
1
( ) ( ) ( ) ( )
the firm is observed in the second period if( ) ( ) ( ) ( ) 0
where (0, )(0,1)
( ,
∼∼
i i i i i
i i i i
G contracts age firm size
c contracts age profit
NN
corr
α α α α ε
β β β β ε
ε σε
ε ε
= + + + +
+ + + + >
2) ρ=
For comparison the data are used to estimate two models, one in which selection issues
are ignored, and one in which the determinants of efficiency change are estimated given the
selection equation. The results are given in Table 8.
A. Results ignoring sample selection
The first set of results in Table 8 shows the coefficients and significance levels for an
OLS regression of change in relative efficiency on vessel age, firm type, and vessel size48. The
regression covers all vessels that harvested in both 1987 and 1993, and therefore includes vessels
that chose not to exit over the period. In these results, the mean growth in efficiency of a new,
small (≤100 GRT) vessel owned by an independent firm is 0.786, which is significant at the 1%
level. The relevant interpretation of the constant is that the mean efficiency change was positive
rather than negative for those vessels that remained in the industry. Overall the model explains
only 4% of the variation in efficiency growth.
Of particular interest from a policy and economic perspective is whether firm integration
or size of capital is related to efficiency growth. In these results, ignoring the systematic re-entry
and exit of vessels, none of the other variables of interest has any explanatory power. If the
disturbances of the survival equation and the growth equation are not correlated, then these 48 Note that while the efficiency score is bounded from below and above, this regression uses the growth in efficiency. Thus the variable growth is not censored, and a Tobit regression is unnecessary.

31
results would contradict arguments that tradable property rights systematically favor one type of
harvester over another. To fully answer the question, however, it is essential is to correct for the
types of firms that are in the panel, because as shown previously those vessels that exited had
lower efficiency than those that did not exit, even under command and control.
Table 8: Determinants of Change in Efficiency, 1984 to 1993
OLS Heckman Selection
Constant 0.786** (0.287) 0.638** (0.255)
Age -0.028 (0.019) -0.069** (0.018)
Firm -0.140 (0.209) -0.389* (0.186)
Size -0.123 (0.331) 0.232 (0.234)
Constant 0.832** (0.362)
Relative number of contracts -2.944** (0.875)
Age -0.076** (0.017)
Relative profit 107.853** (38.620)
Log likelihood -78.061
ρ 0.960* * (0.035)
p-value of ρ 0.01
Number of observations 41 115
Censored observations 74
Uncensored observations 41
NOTE. – Standard errors are in parentheses. * Statistically significant at the .05 level. ** Statistically significant at the .01 level.

32
B. Results correcting for sample selection
To address the potential bias caused by less efficient vessels' strategic re-entry prior to
policy change and attrition afterward, the Heckman selection model is used, with results
reported in Table 8. The first test for sample selection issues is whether the error terms of the
regression equation for growth and the selection equation are correlated. The estimated
correlation between the error terms is ρ=0.96 and is statistically significant at the 5% level; this
result indicates that the estimates of the regression equation will be upwardly biased if sample
selection is ignored.
The estimates of the selection equation suggest that contracting relationships and vessel
age are the most important determinants of exit. The coefficient for the relative number of
contracts is -2.944 and is statistically significant at the 1% level, the negative coefficient
reflecting the importance of loyalty to processors. Tradable property rights enabled processors to
ensure a regular supply of clams to match their production schedules by contracting with a
smaller number of harvesters49. Thus, in the period of restructuring after tradable property rights
were implemented, the more contracts a harvester had relative to the number of total processors,
the less likely the harvester was to remain in the industry. Older vessels were also more likely to
exit the industry, suggesting that fleets rationalized by eliminating older capital. The coefficient
for vessel age is -0.076 and is statistically significant at the 1% level. As expected the
coefficient for vessel profit is positive (107.853) and statistically significant at the 1% level.
The combined effect of sample selection is that after the implementation of tradable
property rights, the remaining vessels were on average newer, contractually related to fewer
processors, and more profitable. The positive and statistically significant correlation between the
49 Based on ownership of tradable quota, processors can coordinate harvests with production. Processors can also affect harvesting schedules by coordinating the leasing or provisioning of additional quota in order for the harvesters to meet the production requirement.

33
disturbances of the two equations suggests that the initial estimates of the change in efficiency
were biased upwards, as is verified by the results in Table 8.
Given that those vessels that stayed were more efficient on average to start with, the first
question is how changes in efficiency correspond to vessel and firm traits. When correcting for
the correlation between the disturbances of the survival equation and the efficiency growth
equation, the mean change in the efficiency of a new, small vessel owned by an independent firm
is still positive, but is smaller than estimated by the OLS model (0. 638 in the Heckman model,
0.786 in the OLS model).
In addition, these sample selection issues have important implications for the estimated
relationships between growth in efficiency and characteristics of the harvester. The coefficient
on age is negative (-0.069) and statistically significant at the 1% level, indicating that older
vessels are less able to exploit the flexibility provided by the new policy to achieve efficiency
gains. There are two possible explanations of this effect: either the older vessels have older
captains who are less likely to adapt to new tactics rewarded by tradable property rights, or older
vessels are less easily re-purposed as required by tradable property rights.
The most important policy implications are presented by the coefficients on firm structure
and vessel size, because they directly address the concern that tradable property rights unfairly
benefit large producers at the expense of small producers. By including both firm type and
vessel size, the model captures two key issues in this equity debate. The first is the fear that
tradable property rights favor large vessels over smaller ones50. However, the coefficient for
vessel size (recall that size=1 if GRT>100, 0 otherwise) provides counterevidence of
discrimination against small vessels; although positive (0.232), the size coefficient is not
statistically significant (p-value=0.32).
50 National Research Council, supra note 8.

34
Second is the fear that tradable property rights facilitate domination of the industry by
either vertically or horizontally integrated fishing firms51. This concern was explicitly addressed
in the national debates over property rights in US fisheries. Recall that the coefficient on firm
type (firm=0 for independents, 1 for integrated firms) is not statistically significant in the OLS
regression; however, in the selection model, the coefficient is negative and statistically
significant at the 5% level. The implication is not only that independent firms were not unfairly
damaged, but that they actually increased efficiency more than integrated firms. This negative
relationship between firm integration and efficiency change highlights the importance of
addressing sample selection issues.
While looking at the aggregate change in efficiency in the industry as a whole can show
the scale of total benefits resulting from policy change, it leaves unanswered the fundamental
and politically important issue of equity. By contrast, this model addresses this issue by
estimating efficiency change on the vessel level. The results are important because they
contradict the common, naïve belief that efficiency gains accrued predominately to large vessels
or integrated firms. While there are potential inequities in any policy, inequities are not an
inherent quality of tradable property rights, but depend on the way property rights systems are
designed and implemented. And in order to accurately assess the impact of a policy change, it is
necessary to carefully distinguish between its effect on industry composition and its effect on
firm-level efficiency, rather than simply measuring the change in efficiency as a whole.
V. CONCLUSIONS
Economists have long recognized the theoretical benefits of replacing command-and-
control regulation with tradable property rights in fisheries management. Not only should excess
capital exit the industry, but remaining vessels should become more efficient; no longer
51 National Research Council, supra note 8.

35
subjected to rigorous input and output constraints, harvesters can adjust inputs and make
harvesting decisions to operate at the most efficient rate.52 Despite these seemingly clear
theoretical benefits, however, tradable property rights are still far from the norm in fisheries
management. In the United States, policy debates concerning market-based regulatory systems
center on a single key question: who benefits? Empirical studies attempting to sort out this
thorny issue must cope with the realities of the complex processes by which new policies are
negotiated and implemented. Invariably, firms take advantage of the policy negotiation period to
stake their claims to benefits under the new system, complicating simple before-and-after
analyses that ignore firms’ strategic behavior.
In the surf clam fishery, the result was that large numbers of economically inefficient
vessels re-entered the industry in the final years of command-and-control regulation, seeking to
establish claims to initial quota allocations that could then be used by other vessels or sold on the
market. These high-cost vessels then exited the fishery once the quotas were allocated. This
short-term influx of inefficient vessels made the gains due to tradable property rights seem
greater than they actually were, since efficiency was artificially low in the years prior to policy
change. Correcting for this distortion – by separating vessel entry and exit from changes in
individual vessel efficiency – gives a more accurate picture of the benefits provided by tradable
property rights.
This analysis is also critical to understanding the equity effects of tradable property rights
– how gains in efficiency are distributed across different types of vessels and firms. Because this
econometric model isolates vessel-level efficiency from industry structure effects, it is possible
to see how different classes of vessels were affected by the new policy. The results would be
surprising to many participants in the current policy debate over tradable property rights. After 52 Tradable property rights provide the flexibility to optimally choose fishing grounds, departure and arrival ports, days on which to harvest, and crew composition.

36
correcting for the effects of strategic re-entry and attrition, we found that older vessels enjoyed a
smaller efficiency gain than younger vessels, which is not itself surprising. More interestingly,
individual vessel size had no effect on efficiency gains, and independent firms actually benefited
more than did vertically or horizontally integrated firms. These last two conclusions directly
contradict the common belief that market-based regulatory systems unfairly benefit large and
integrated firms at the expense of smaller, independent firms.
This example demonstrates several important points concerning the economic analysis of
regulatory change. First, regulatory changes are not pure exogenous shocks, but are lengthy
processes in which affected firms are intimately involved; as a result, these firms engage in
strategic behavior in anticipation of new policies, clouding any assessment of their impact.
Second, this strategic behavior has its own effects on industry composition and efficiency, and
must be isolated in order to measure the change in efficiency of individual firms or classes of
firms. And third, this correction produces results that are significantly different from those
obtained otherwise – and, in this case, results with significant impact on the current debate over
tradable property rights in fisheries management.

37
BIBLIOGRAPHY
Agnello, Richard J. and Donnelley, Lawrence P. “Property Rights and Efficiency in the Oyster Industry.” Journal of Law and Economics 18 (1975): 521-33.
Battese, G., Coelli, T. and Colby, T. "Estimation of Frontier Production Functions and the Efficiencies the Indian Farms Using Panel Data from ICRISAT's Village Level Studies." Journal of Quantitative Economics. 5 (1989):327-348.
Battese, G., Coelli, T. and Colby, T. "Frontier Production Functions, Technical Efficiency and Panel Data: With application to Paddy Farmers in India." Journal of Productivity Analysis 3 (1992):153-169.
Battese, G.E. and Corra, G.S. "Estimation of a Production Frontier Model With Application to the Pastoral Zone of Australia." Australian Journal of Agricultural Economics. 21 (1977): 169-179.
Casey, Keith E., et al. “The Effects of Individual Vessel Quotas in the British Columbia Halibut Fishery.” Marine Resource Economics 10 (1995): 211-30.
Ellerman, A. Denny et al. Markets for Clean Air: The U.S. Acid Rain Program, edited by Paul L. Joskow. Cambridge: Cambridge Press, 2000.
Geen, Gerry and Nayar, Mark. “Individual Transferable Quotas In The Southern Bluefin Tuna Fishery: An Economic Appraisal.” Marine Resource Economics 5 (1988) 365-387.
Grafton, R. Quentin et al. “Private Property and Economic Efficiency: A Study of a Common-Pool Resource.” Journal of Law and Economics 33 (2000): 679-714.
Greene, William, Econometric Analysis, Upper Saddle River: Prentice-Hall, 2000.
Hall, Bronwyn. “The Relationship Between Firm Size and Firm Growth in the US Manufacturing Sector.” Journal of Industrial Economics 35 (1987): 583-606.
Joskow, Paul. L., and Schmalensee Richard. “The Political Economy of Market-Based Environmental Policy: The U.S. Acid Rain Program.” Journal of Law and Economics 41 (1998): 37-83.
Linder, R., H. Campbell, G. Bevin. “Rent Generation During the Transition to a Managed Fishery: The Case of the New Zealand ITQ System.” Marine Resource Economics 7 (1992) 229-248.
Matthews, Dayna. “Beyond ITQ Implementation: A Study Of Enforcement Issues In The Mid Atlantic Surf Clam And Ocean Quahog Individual Transferable Quota Program.” Document prepared for Office For All Enforcement, National Marine Fisheries Service, National Oceanic And Atmospheric Administration, 1997.
McCay, Bonnie, and Carolyn Creed. " Social Structure and Debates on Fisheries Management in the Mid-Atlantic Surf Clam Fishery." Ocean and Coastal Management 13 (1990): 199-229.
McCay, Bonnie et al. "Individual Transferable Quotas in Canadian and U.S. Fisheries." Ocean and Coastal Management 28 (1995): 85-116.

38
Mid-Atlantic Fishery Management Council. "Limited Entry, the Magnuson Act and the National Standards". Document prepared by Mid-Atlantic Fishery Management Council, Dover, Delaware, 1986.
Mid-Atlantic Fishery Management Council. “Amendment #8, Fishery Management Plan for the Atlantic Surf Clam and Ocean Quahog Fishery: Draft.” Document prepared by Mid-Atlantic Fishery Management Council in cooperation with the National Marine Fisheries Service and the New England Fishery Management Council, Dover, Delaware, 1988.
Mid-Atlantic Fishery Management Council. “Amendment #8, Fishery Management Plan for the Atlantic Surf Clam and Ocean Quahog Fishery: Final Approved.” Document prepared by Mid-Atlantic Fishery Management Council in cooperation with the National Marine Fisheries Service and the New England Fishery Management Council, Dover, Delaware, 1990.
Mid-Atlantic Fishery Management Council. "Overview of the Surf Clam and Ocean Quahog Fisheries and Quota Recommendations for 2001." Document prepared by Mid-Atlantic Fishery Management Council, Dover, Delaware, August 2000.
Moloney, D. and Pearse, P. “Quantitative Rights As an Instrument for Regulating Commercial Fisheries.” Journal of Fisheries Research Board Canada 36 (1979): 859-866.
Montero, Juan-Pablo et al. “A Market-Based Environmental Policy Experiment in Chile” Journal of Law and Economics 35 (2002): 267-87.
Montgomery, D.W. “Markets in Licenses and Efficient Pollution Control Programs.” Journal of Economic Theory 74 (1972): 941-50.
Munro, Gordon. “Mathematical Bioeconomics and the Evolution of Modern Fisheries Economics.” Bulletin of Mathematical Biology 54 (1992): 163-184.
National Marine Fisheries Service, Fisheries of the United States. Silver Spring: National Oceanic and Atmospheric Administration,1999.
National Research Council, Committee to Review Individual Fishing Quotas, Sharing the Fish: Toward a National Policy on Individual Fishing Quotas. Washington, D.C.: National Academy Press, 1999.
Pitt M.M and Lee, L.F. "Measurement and Sources of technical Inefficiency in the Indonesian Weaving Industry" Journal of Development Economics 9 (1981): 43-64.
Reauthorization of the Magnuson-Stevens Fishery Conservation and Management Act before the Subcomm. of Fisheries Conservation, Wildlife and Oceans Comm. on Resources, 4-5 (2002) (statement of William Hogarth, Assistant Administrator for Fisheries, National Marine Fisheries Service, U.S. Department of Commerce).
Weninger, Quinn and Just, Richard. "Firm Dynamics with Tradable Output Permits." American Journal of Agricultural Economics 84 (2002): 572-584.
Weninger, Quinn and Just, Richard. "Assessing Efficiency Gains from Individual Transferable Quotas: An Application to the Mid-Atlantic Surf Clam and Ocean Quahog Fishery." American Journal of Agricultural Economics 80 (1998): 750-764.

39
FIGURE 1
EFFICIENCY VERSUS PARTICIPATION
0
20
40
6080
100
120
140
160
1984198
5198
6198
7198
8198
9199
0199
1199
2199
3199
4199
5199
6199
7199
8199
9
Year
Ves
sels
0.200.250.300.350.400.450.500.550.600.650.70
Eff
icie
ncy
Scor
e
# Vessels
Efficiency