Evaluating the Sources and Functions of Gradiency in ...
18
Evaluating the Sources and Functions of Gradiency in Phoneme Categorization: An Individual Differences Approach Efthymia C. Kapnoula University of Iowa Matthew B. Winn University of Washington Eun Jong Kong Korea Aerospace University Jan Edwards University of Wisconsin-Madison Bob McMurray University of Iowa During spoken language comprehension listeners transform continuous acoustic cues into categories (e.g., /b/ and /p/). While long-standing research suggests that phonetic categories are activated in a gradient way, there are also clear individual differences in that more gradient categorization has been linked to various communication impairments such as dyslexia and specific language impairments (Joanisse, Manis, Keating, & Seidenberg, 2000; López-Zamora, Luque, Álvarez, & Cobos, 2012; Serniclaes, Van Heghe, Mousty, Carré, & Sprenger-Charolles, 2004; Werker & Tees, 1987). Crucially, most studies have used 2-alternative forced choice (2AFC) tasks to measure the sharpness of between- category boundaries. Here we propose an alternative paradigm that allows us to measure categorization gradiency in a more direct way. Furthermore, we follow an individual differences approach to (a) link this measure of gradiency to multiple cue integration, (b) explore its relationship to a set of other cognitive processes, and (c) evaluate its role in individuals’ ability to perceive speech in noise. Our results provide validation for this new method of assessing phoneme categorization gradiency and offer preliminary insights into how different aspects of speech perception may be linked to each other and to more general cognitive processes. Public Significance Statement Labeling sounds and images is an essential part of many cognitive processes that allow us to function efficiently in our everyday lives. One such example is phoneme categorization, which refers to listeners’ ability to correctly identify speech sounds (e.g., /b/) and is required for understanding spoken language. The present study presents a novel method for studying differences among listeners in how they categorize speech sounds. Our results show that (a) there is substantial variability among individuals in how they categorize speech sounds, and (b) this variability likely reflects fundamental differences in how listeners use the speech signal. The study of such differences will lead to a more comprehensive understanding of both typical and atypical patterns of language processing. There- fore, in addition to its theoretical significance, this study can also help us advance the ways in which we remediate behaviors linked to atypical perception of speech. Keywords: speech perception, individual differences, categorical perception, multiple cue integration, executive function Supplemental materials: http://dx.doi.org/10.1037/xhp0000410.supp This article was published Online First April 13, 2017. Efthymia C. Kapnoula, Department of Psychological and Brain Sciences, DeLTA Center, University of Iowa; Matthew B. Winn, Department of Speech and Hearing Sciences, University of Washington; Eun Jong Kong, Department of English, Korea Aerospace University; Jan Edwards, Department of Com- munication Sciences and Disorders, Waisman Center, University of Wisconsin- Madison; Bob McMurray, Department of Psychological and Brain Sci- ences, Department of Communication Sciences and Disorders, Department of Linguistics, DeLTA Center, University of Iowa. Jan Edwards is now at the Department of Hearing and Speech Sciences, University of Maryland. The authors thank Jamie Klein, Dan McEchron, and the students of the MACLab for assistance with data collection. This project was supported by NIH Grant DC008089 awarded to BM. Correspondence concerning this article should be addressed to Efthymia C. Kapnoula, who is now at the Basque Center on Cognition, Brain and Language, Mikeletegi Pasealekua, 69, 20009, Donostia, Gipuzkoa, Spain. E-mail: kapnoula@ gmail.com This document is copyrighted by the American Psychological Association or one of its allied publishers. This article is intended solely for the personal use of the individual user and is not to be disseminated broadly. Journal of Experimental Psychology: Human Perception and Performance © 2017 American Psychological Association 2017, Vol. 43, No. 9, 1594 –1611 0096-1523/17/$12.00 http://dx.doi.org/10.1037/xhp0000410 1594
Transcript of Evaluating the Sources and Functions of Gradiency in ...
Evaluating the Sources and Functions of Gradiency in PhonemeCategorization: An Individual Differences Approach
Efthymia C. KapnoulaUniversity of Iowa
Matthew B. WinnUniversity of Washington
Eun Jong KongKorea Aerospace University
Jan EdwardsUniversity of Wisconsin-Madison
Bob McMurrayUniversity of Iowa
During spoken language comprehension listeners transform continuous acoustic cues into categories(e.g., /b/ and /p/). While long-standing research suggests that phonetic categories are activated in agradient way, there are also clear individual differences in that more gradient categorization has beenlinked to various communication impairments such as dyslexia and specific language impairments(Joanisse, Manis, Keating, & Seidenberg, 2000; López-Zamora, Luque, Álvarez, & Cobos, 2012;Serniclaes, Van Heghe, Mousty, Carré, & Sprenger-Charolles, 2004; Werker & Tees, 1987). Crucially,most studies have used 2-alternative forced choice (2AFC) tasks to measure the sharpness of between-category boundaries. Here we propose an alternative paradigm that allows us to measure categorizationgradiency in a more direct way. Furthermore, we follow an individual differences approach to (a) link thismeasure of gradiency to multiple cue integration, (b) explore its relationship to a set of other cognitiveprocesses, and (c) evaluate its role in individuals’ ability to perceive speech in noise. Our results providevalidation for this new method of assessing phoneme categorization gradiency and offer preliminaryinsights into how different aspects of speech perception may be linked to each other and to more generalcognitive processes.
Public Significance StatementLabeling sounds and images is an essential part of many cognitive processes that allow us to functionefficiently in our everyday lives. One such example is phoneme categorization, which refers tolisteners’ ability to correctly identify speech sounds (e.g., /b/) and is required for understandingspoken language. The present study presents a novel method for studying differences among listenersin how they categorize speech sounds. Our results show that (a) there is substantial variability amongindividuals in how they categorize speech sounds, and (b) this variability likely reflects fundamentaldifferences in how listeners use the speech signal. The study of such differences will lead to a morecomprehensive understanding of both typical and atypical patterns of language processing. There-fore, in addition to its theoretical significance, this study can also help us advance the ways in whichwe remediate behaviors linked to atypical perception of speech.
Keywords: speech perception, individual differences, categorical perception, multiple cue integration,executive function
Supplemental materials: http://dx.doi.org/10.1037/xhp0000410.supp
This article was published Online First April 13, 2017.Efthymia C. Kapnoula, Department of Psychological and Brain Sciences,
DeLTA Center, University of Iowa; Matthew B. Winn, Department of Speechand Hearing Sciences, University of Washington; Eun Jong Kong, Departmentof English, Korea Aerospace University; Jan Edwards, Department of Com-munication Sciences and Disorders, Waisman Center, University of Wisconsin-Madison; Bob McMurray, Department of Psychological and Brain Sci-ences, Department of Communication Sciences and Disorders, Departmentof Linguistics, DeLTA Center, University of Iowa.
Jan Edwards is now at the Department of Hearing and Speech Sciences,University of Maryland.
The authors thank Jamie Klein, Dan McEchron, and the students of theMACLab for assistance with data collection. This project was supported byNIH Grant DC008089 awarded to BM.
Correspondence concerning this article should be addressed to Efthymia C.Kapnoula, who is now at the Basque Center on Cognition, Brain and Language,Mikeletegi Pasealekua, 69, 20009, Donostia, Gipuzkoa, Spain. E-mail: [email protected]
Thi
sdo
cum
ent
isco
pyri
ghte
dby
the
Am
eric
anPs
ycho
logi
cal
Ass
ocia
tion
oron
eof
itsal
lied
publ
ishe
rs.
Thi
sar
ticle
isin
tend
edso
lely
for
the
pers
onal
use
ofth
ein
divi
dual
user
and
isno
tto
bedi
ssem
inat
edbr
oadl
y.
Journal of Experimental Psychology:Human Perception and Performance
© 2017 American Psychological Association
2017, Vol. 43, No. 9, 1594–16110096-1523/17/$12.00 http://dx.doi.org/10.1037/xhp0000410
1594

Speech varies along multiple acoustic dimensions (e.g., for-mant frequencies, durations of various events, etc.) that arecontinuous and highly variable. From this signal, listeners ex-tract linguistically relevant information that serves as the basisof recognizing words. This process represents a transformationfrom a continuous input that is both ambiguous and redundantinto relatively discrete categories, such as features, phonemes,and words.
During this process, listeners face a critical problem: stimuliwith the same acoustic cue values1 may correspond to differentcategories depending on the context (e.g., speech rate or talker’ssex). For example, Voice Onset Time (VOT) is the time be-tween the onset of the release of the articulators and the onsetof laryngeal vibration. VOT is the primary cue distinguishingvoiced from unvoiced stop consonants with VOTs below 20 mstypical for /b/,/d/,/g/, while VOTs over 20 ms are typical for/p/,/t/,/k/. However, contextual factors can make VOT moreambiguous. For example, a stimulus with a VOT of 20 ms couldbe a /b/ in slow speech or a /p/ in fast speech. Despite over 40years of research, speech scientists have identified few (if any)acoustic cues that unambiguously identify a phoneme acrossdifferent contexts (e.g., McMurray & Jongman, 2015; Ohala,1996).
Traditional approaches suggest that this problem is solved viaspecialized mechanisms that discard irrelevant information,leading to the perception of distinct phonemic categories(Liberman, Harris, Hoffman, & Griffith, 1957). However, re-cent studies show that typical listeners maintain informationthat is seemingly irrelevant for discriminating between phone-mic categories (i.e., within-category information; Massaro &Cohen, 1983; McMurray, Tanenhaus, & Aslin, 2002; Toscano,McMurray, Dennhardt, & Luck, 2010).
Recent theoretical approaches suggest that such gradientrepresentations may be useful for coping with ambiguity andintegrating different pieces of information (Clayards, Tanen-haus, Aslin, & Jacobs, 2008; Kleinschmidt & Jaeger, 2015;McMurray & Farris-Trimble, 2012; Oden & Massaro, 1978).However, there is little empirical data that speaks to the func-tional role of maintaining within-category information (thoughsee McMurray, Tanenhaus, & Aslin, 2009).
The present study addresses this issue using an individualdifferences approach. Work by Kong and Edwards (2011, 2016)suggests listeners vary in the degree to which they maintainwithin-category information (i.e., how gradiently they catego-rize speech sounds). We examined these individual differencesand their role in speech perception by (a) linking them to adifferent aspect of speech perception (the use of secondaryacoustic cues), (b) investigating their potential sources in ex-ecutive function, and (c) examining how they relate to speechperception in noise.
The Problem of Lack of Invariance andCategorical Perception
Variability in the acoustic signal is commonly described interms of acoustic/phonetic cues such as VOT. Critically, whileacoustic cues are continuous, our percept (as well as most linguis-tic analyses) reflects more or less discrete categories (/b/ and /p/).Mapping continuous cues onto discrete categories is complex
because the same cue values can map onto different categories,depending on many factors, including the talker’s gender (Hillen-brand, Getty, Clark, & Wheeler, 1995), neighboring speech sounds(coarticulation, Hillenbrand, Clark, & Nearey, 2001), and speakingrate (Miller, Green, & Reeves, 1986). This is the problem of lackof invariance: speech sounds do not have invariant acoustic attri-butes, and a single acoustic cue cannot be reliably mapped to asingle speech sound.
One solution to the lack of invariance problem was suggested byCategorical Perception (CP; Liberman et al., 1957). CP describesthe well-established behavioral phenomenon that discriminationwithin a category (e.g., between two instances of a /b/) is poor, butdiscrimination of an equivalent acoustic difference that spans acategory boundary is quite good (e.g., Liberman Harris, Kinney, &Lane, 1961; Pisoni & Tash, 1974; Schouten & van Hessen, 1992;Repp, 1984 for a review; and see Chang et al., 2010; Dehaene-Lambertz, 1997; Phillips et al., 2000; Sams, Aulanko, Aaltonen, &Näätänen, 1990, for related neural evidence).
One hypothesis is that CP derives from some form of warping ofthe perceptual space that amplifies the influence of categories.Under this view, a [b] with a VOT of 15 ms is encoded moresimilarly to one with a VOT of 0 ms than to a [p] with a VOT of30 ms. Such warping is often attributed to specialized processesthat discard within-category variation in favor of discrete encodingat both the auditory/cue level and at the level of phoneme catego-ries. This view—perhaps best exemplified by motor theory (Liber-man & Whalen, 2000)—suggests that auditory encoding is alignedto the discrete goals of the system (phoneme categorization). As aresult, acoustic variation, arising from talker differences and/orcoarticulation, does not pose a challenge for speech perception,because the underlying representations (gestures or phonologicalunits) can be rapidly extracted by such specialized mechanisms.
The Gradient Alternative
According to CP, encoding of acoustic cues is somewhat dis-crete, and, this enables cues to be easily mapped to fairly discretecategories. However, the claim of discreteness at both levels hasnot held up to scrutiny. Serious concerns have been raised aboutthe discrimination tasks used to establish CP, while the degree towhich discrimination is categorical (i.e., better discriminationacross a boundary) depends on the specific task (Carney, Widin, &Viemeister, 1977; Gerrits & Schouten, 2004; Pisoni & Lazarus,1974; Schouten, Gerrits, & van Hessen, 2003). Gerrits andSchouten (2004) and Schouten et al. (2003) found that workingmemory demands associated different tasks can lead listeners torely on subjective labels (rather than auditory codes, which maydecay more rapidly). A reliance on labels could lead to a morecategorical pattern of responses, even if the precategorized per-ceptual representation is continuous (see also Carney et al., 1977;Gerrits & Schouten, 2004; Pisoni & Tash, 1974). Therefore, CPmay in fact reflect the influence of categories on memory anddecision processes, not on perceptual processes per se. Indeed,when less biased discrimination measures are employed, CP-like
1 Even though we use the term “cues” here, we do not make a strongtheoretical commitment as to the kind of auditory information this termentails.
Thi
sdo
cum
ent
isco
pyri
ghte
dby
the
Am
eric
anPs
ycho
logi
cal
Ass
ocia
tion
oron
eof
itsal
lied
publ
ishe
rs.
Thi
sar
ticle
isin
tend
edso
lely
for
the
pers
onal
use
ofth
ein
divi
dual
user
and
isno
tto
bedi
ssem
inat
edbr
oadl
y.
1595INDIVIDUAL DIFFERENCES IN PHONEME CATEGORIZATION

effects disappear (Gerrits & Schouten, 2004; Massaro & Cohen,1983; Pisoni & Lazarus, 1974).
This dependence of CP on the discrimination task implies thatencoding of speech cues may not be warped at all, but rather mayreflect the input monotonically. Consistent with this idea, ERP andMEG responses to isolated words from VOT continua reflect alinear pattern of response to changes along the continuum with noevidence of warping (Frye et al., 2007; Toscano et al., 2010; andsee Myers, Blumstein, Walsh, & Eliassen, 2009 for MRI evi-dence). Moreover, beyond auditory encoding, there is substantialevidence that fine-grained detail is preserved at higher levels of thepathway, affecting even lexical processing (Andruski, Blumstein,& Burton, 1994; McMurray et al., 2002; Utman, Blumstein, &Burton, 2000).
The Functional Role of Gradiency
The usefulness of maintaining within-category informationthroughout levels of processing is a key idea of several theoreticalapproaches (Goldinger, 1998; Kleinschmidt & Jaeger, 2015; Kro-nrod, Coppess, & Feldman, 2016; McMurray & Jongman, 2011;Oden & Massaro, 1978). It is hypothesized to allow for moreflexible and efficient speech processing via at least three mecha-nisms. First, processes such as coarticulation and assimilationleave fine-grained, subcategorical traces in the signal (e.g., Gow,2001), which can be used to anticipate upcoming input, speedingup processing. Multiple studies suggest that listeners take advan-tage of anticipatory coarticulatory information in this way (Gow,2001; Mahr, McMillan, Saffran, Ellis Weismer, & Edwards, 2015;McMurray & Jongman, 2015; Salverda, Kleinschmidt, & Tanen-haus, 2014; Yeni-Komshian & Soli, 1981). As these modificationsare largely within-category, such anticipation is only possible iflisteners are sensitive to this fine-grained detail.
Second, gradient encoding may offer greater flexibility in howcues map onto categories (e.g., Massaro & Cohen, 1983; Toscanoet al., 2010). Continuous encoding of cues may, for example,permit for the values of one cue (e.g., VOT) to be interpreted inlight of the values of another cue (e.g., F0). Such processes mayunderlie the well-known trading relations that have been docu-mented in speech perception (Repp, 1982; Summerfield & Hag-gard, 1977; Winn, Chatterjee, & Idsardi, 2013). This kind ofcombinatory process would also be necessary for accurately com-pensating for higher level contextual expectations—for example,recoding pitch relative to the talker’s mean pitch (McMurray &Jongman, 2011, 2015).
Third, gradient responding at higher levels, at the level ofphonemes (McMurray, Aslin, Tanenhaus, Spivey, & Subik, 2008;Miller, 1997); or words (Andruski et al., 1994; McMurray et al.,2008) may help cope with uncertainty. With a gradient encoding,the degree to which the perceptual system commits to one repre-sentation over another (e.g., /b/ vs. /p/) is monotonically related tothe degree of support in the signal. For example, a labial stop witha VOT of 5 ms activates /b/-onset words more than a labial stopwith a VOT of 15 ms, even though both map onto the samecategory. Superficially, this may appear disadvantageous as itcould slow an efficient decision. However, given the variability,and noise in the signal, gradiency may allow listeners to “hedge”their bets in the face of ambiguity. It is precisely when cue valuesare more ambiguous that listeners should not commit too strongly
and keep their options open until more information arrives (Cla-yards et al., 2008; McMurray et al., 2009).
In sum, gradiency may allow the system to (a) harness fine-grained (within-category) differences that may be helpful; (b)integrate information from multiple sources more flexibly; and (c)delay commitment when insufficient information is available.Thus, while the somewhat empirical question of the gradientversus discrete nature of speech representations has been hotlydebated (Chang et al., 2010; Gerrits & Schouten, 2004; Liberman& Whalen, 2000; Massaro & Cohen, 1983; McMurray et al., 2002;Myers et al., 2009; Toscano et al., 2010), it has important theo-retical ramifications for how listeners solve a fundamental percep-tual problem.
Individual Differences in Phoneme Categorization
Despite the evidence for gradiency in typical listeners, it is lessclear whether there are individual differences. Mounting evidencenow exists in neuroscience for multiple pathways of speech pro-cessing (Blumstein, Myers, & Rissman, 2005; Hickok & Poeppel,2007; Myers et al., 2009) that can be flexibly deployed underdifferent conditions (Du, Buchsbaum, Grady, & Alain, 2014).Given this, different listeners may adopt different solutions to thisproblem, perhaps providing more weight to either dorsal or ventralpathways (see Ojemann, Ojemann, Lettich, & Berger, 1989 foranalogous evidence in word production). Similarly, the Pisoni andTash (1974) model of CP suggests that listeners have simultaneousaccess to both continuous acoustic cues and discrete categories.Again, this raises the possibility that listeners may weight thesetwo sources of information differently during speech perception.
Considering the function of gradiency in speech perception, thepossibility of individual differences raises three questions: (a) Arelisteners gradient to varying degrees? (b) What are the sources ofthese differences? (c) Do such differences impact speech percep-tion as a whole?
Much of the debate around categorical versus gradient percep-tion in typical listeners concerns the degree to which gradiencymight be adaptive (or maladaptive). In this regard, a considerationof listeners with communication disorders may be useful. Work onlanguage-related disorders such as specific language impairment(SLI) and dyslexia suggests significant differences in the gradi-ency of speech perception between impaired and typical listeners(Coady, Evans, Mainela-Arnold, & Kluender, 2007; Robertson,Joanisse, Desroches, & Ng, 2009; Serniclaes, 2006; Sussman,1993; Werker & Tees, 1987, but see Coady, Kluender, & Evans,2005; McMurray, Munson, & Tomblin, 2014). Much of this workhas examined phoneme categorization in a 2-alternative forcedchoice (2AFC) task. In this task, participants hear a word (orphoneme sequence; e.g., ba or pa) from a continuum ranging insmall steps from one endpoint to the other and assign one of twolabels. Listeners typically show a sigmoidal response function witha sharp transitioning from one phoneme category to the other.Critically, the steepness of the slope of the response function isused as a measure of category discreteness.
Using this measure, impaired listeners generally show shallowertransitions between categories (but see Blomert & Mitterer, 2004;Coady, Kluender, & Evans, 2005; McMurray et al., 2014). Forexample, Werker and Tees (1987) found that children with reading
Thi
sdo
cum
ent
isco
pyri
ghte
dby
the
Am
eric
anPs
ycho
logi
cal
Ass
ocia
tion
oron
eof
itsal
lied
publ
ishe
rs.
Thi
sar
ticle
isin
tend
edso
lely
for
the
pers
onal
use
ofth
ein
divi
dual
user
and
isno
tto
bedi
ssem
inat
edbr
oadl
y.
1596 KAPNOULA, WINN, KONG, EDWARDS, AND MCMURRAY
difficulties had shallower slopes on a /b/-to-/d/ continuum thantypical children (see also Godfrey, Syrdal-Lasky, Millay, & Knox,1981; Serniclaes, Sprenger-Charolles, Carré, & Demonet, 2001).Joanisse, Manis, Keating, and Seidenberg (2000) found a similarpattern for language impaired (LI) children. More recently, López-Zamora, Luque, Álvarez, and Cobos (2012) found that shallowerslopes in a phoneme identification task predict atypical syllablefrequency effects in visual word recognition, suggesting some kindof atypical pattern of sublexical processing. Lastly, Serniclaes,Ventura, Morais, and Kolinski (2005) found that illiterate adultshave shallower identification slopes than literate ones.
These findings are typically attributed to nonoptimal CP; ifimpaired learners encode cues inaccurately (e.g., they hear a VOTof 10 ms occasionally as 5 or 15 ms), then tokens near theboundary are likely to be encoded with cue values on the otherside, flattening the function. This assumes a sharp, discrete cate-gory boundary as the optimum response function, which is cor-rupted by internal noise (in the encoding of acoustic cues) fordisordered listeners (Moberly, Lowenstein, & Nittrouer, 2016;Winn & Litovsky, 2015). Thus, impaired listeners may haveequally sharp underlying categorization functions as nonimpairedlisteners, but the categorization output is corrupted due to noisierauditory encoding.
This account offers a clear explanation for listeners with obvi-ous sensory impairments (e.g., hearing impairment), however, itmay be less compelling, in the case of listeners with dyslexia orSLI, who may have impairments at higher levels than cue encod-ing. One alternative explanation is that children with dyslexia haveheightened within-category discrimination (Werker & Tees, 1987).This links dyslexia to a difficulty in discarding acoustic detail thatis linguistically irrelevant (Bogliotti, Serniclaes, Messaoud-Galusi,& Sprenger-Charolles, 2008; Serniclaes et al., 2004), a failure of afunctional goal of categorization. Even in this case, however, theassumption is that discrete categorization, and a reduction ofwithin-category sensitivity are to be desired, and a failure of anyaspect of this process drives the shallower response slope (but seeMessaoud-Galusi, Hazan, & Rosen, 2011).
Few studies have examined individual differences from theperspective that gradient perception may be beneficial (though seeMcMurray et al., 2014). An exception is Clayards et al., (2008)who manipulated within-category variability of VOT across trials.When VOTs were more variable, listeners’ response patterns fol-lowed shallower 2AFC slopes. This suggests that a shalloweridentification slope may reflect a different (and more useful) wayof mapping cue values onto phoneme categories in that it reflectsuncertainty in the input.
It is not clear how to reconcile the classic (categorical) view,arguing for the utility of more categorical labeling functions, withthe more recent view that gradiency may be beneficial. Both sidesmay hold truth; shallower functions could derive from both noisiercue encoding and a more graded mapping of cues to categories.What is clear from the work on disordered language is that groupdifferences in categorization relate to differences in language pro-cessing. More importantly, our review suggests that measures suchas 2AFC phoneme identification may not do a good job measuringthese differences, because it is difficult to distinguish noisy cueencoding from more gradient categorization.
Toward a New Measure of PhonemePerception Gradiency
The foregoing review reveals a fundamental limitation of 2AFCtasks: the systematicity with which listeners identify acoustic cuesand map them to phoneme categories (noise) may be orthogonal tothe degree to which they maintain within-category information(López-Zamora et al., 2012; Messaoud-Galusi et al., 2011). This ispartly because the 2AFC task only allows binary responses. Whena listener reports a stimulus as /b/ 30% of the time and as /p/ 70%,it could be because they discretely thought the stimulus was a /b/on 30% of trials, or because they thought it had some likelihood ofbeing either or both (on every trial) and the responses reflect theprobability distributions of cues-to-categories mappings. A contin-uous measure may be more precise; if listeners hear the stimuluscategorically as /b/ on 30% of trials, the trial-by-trial data shouldreflect a fully /b/-like response on those trials. In contrast, iflisteners’ representations reflect partial ambiguity, they shouldrespond in between with variance clustered around the meanrating. As Massaro and Cohen (1983) argue: “relative to discretejudgment, continuous judgments may provide a more direct mea-sure of the listener’s perceptual experience”.
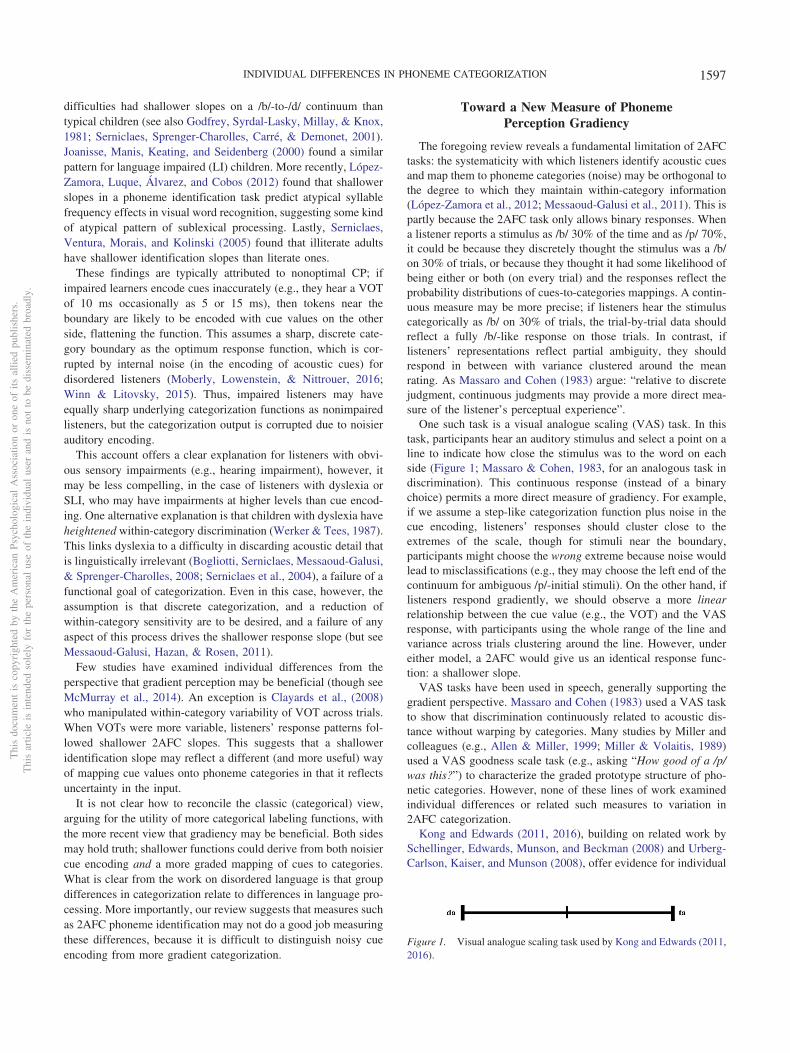
One such task is a visual analogue scaling (VAS) task. In thistask, participants hear an auditory stimulus and select a point on aline to indicate how close the stimulus was to the word on eachside (Figure 1; Massaro & Cohen, 1983, for an analogous task indiscrimination). This continuous response (instead of a binarychoice) permits a more direct measure of gradiency. For example,if we assume a step-like categorization function plus noise in thecue encoding, listeners’ responses should cluster close to theextremes of the scale, though for stimuli near the boundary,participants might choose the wrong extreme because noise wouldlead to misclassifications (e.g., they may choose the left end of thecontinuum for ambiguous /p/-initial stimuli). On the other hand, iflisteners respond gradiently, we should observe a more linearrelationship between the cue value (e.g., the VOT) and the VASresponse, with participants using the whole range of the line andvariance across trials clustering around the line. However, undereither model, a 2AFC would give us an identical response func-tion: a shallower slope.
VAS tasks have been used in speech, generally supporting thegradient perspective. Massaro and Cohen (1983) used a VAS taskto show that discrimination continuously related to acoustic dis-tance without warping by categories. Many studies by Miller andcolleagues (e.g., Allen & Miller, 1999; Miller & Volaitis, 1989)used a VAS goodness scale task (e.g., asking “How good of a /p/was this?”) to characterize the graded prototype structure of pho-netic categories. However, none of these lines of work examinedindividual differences or related such measures to variation in2AFC categorization.
Kong and Edwards (2011, 2016), building on related work bySchellinger, Edwards, Munson, and Beckman (2008) and Urberg-Carlson, Kaiser, and Munson (2008), offer evidence for individual
Figure 1. Visual analogue scaling task used by Kong and Edwards (2011,2016).
Thi
sdo
cum
ent
isco
pyri
ghte
dby
the
Am
eric
anPs
ycho
logi
cal
Ass
ocia
tion
oron
eof
itsal
lied
publ
ishe
rs.
Thi
sar
ticle
isin
tend
edso
lely
for
the
pers
onal
use
ofth
ein
divi
dual
user
and
isno
tto
bedi
ssem
inat
edbr
oadl
y.
1597INDIVIDUAL DIFFERENCES IN PHONEME CATEGORIZATION
differences (see also Schellinger, Munson, & Edwards, 2016).They tested adults on a /da/-/ta/ continuum, asking them to rateeach token on a continuous scale. Participants varied in theirratings; some exhibited a more categorical pattern, preferring theendpoints of the line, while others were more gradient, using theentire scale. Further, more gradient responders showed a strongerreliance on a secondary acoustic cue in a separate categorizationtask—a pattern that was consistent across two separate testingsessions. Lastly, there was a correlation between gradiency andcognitive flexibility (assessed by the switch version of the TrailMaking task), suggesting a link between speech perception andexecutive function.
These findings speak to the potential strengths of an individualdifferences approach for studying fundamental aspects of speechperception. Kong and Edwards (2011, 2016) demonstrate the re-liability of VAS measures, and provide preliminary support for alink between gradiency and the use of secondary cues (a keyprediction of accounts suggesting gradiency could be beneficial tospeech perception). However, some important methodological re-finements and experimental extensions are necessary to fully ad-dress the key questions we ask here.
First, to assess secondary cue use, Kong and Edwards used theanticipatory eye movement (AEM) task (McMurray & Aslin,2004). This is a somewhat nontraditional measure of phonemecategorization that makes it difficult to evaluate their results inrelation to studies using more traditional (e.g., 2AFC) measures ofphoneme categorization. It is, therefore, unclear how the sameindividual may perform the more traditional 2AFC task versus atask such as the VAS, and the differences between the two patternsof performance would inform our understanding of the speechperception processes these two tasks tap into.
The previous point is particularly important given the discrep-ancy between studies of language disorders that have found shal-lower 2AFC slopes (e.g., Werker & Tees, 1987), and the newerview from basic research showing that gradiency is the typicalpattern in nonimpaired listeners and may be adaptive (Clayards etal., 2008). The VAS task may offer unique insight into the rela-tionship between the 2AFC task and these contrasting theoreticalviews of gradiency.
The second motivation for the current study is arguably the mostimportant; Kong and Edwards’s (2011) statistical measure of gra-diency captured the overall distributions of ratings (e.g., how oftenparticipants use the VAS endpoints) independently of the stimuluscharacteristics. While this documents individual differences, itmay also be limited for two reasons. First, it leaves open thepossibility that individual differences may also be sensitive toother aspects of speech perception (e.g., multiple cue integration ornoise). For example, a flatter distribution could be obtained iflisteners matched their VAS ratings to the VOT, or if they showeda large effect of F0 (which would spread out their responses), oreven if they simply guessed. In contrast, by taking into account thestimulus (e.g., the VOT) we can estimate categorization gradiencyindependently of potentially confounding factors. Second, by de-veloping a stimulus-dependent measure we can also compute anestimate of trial-by-trial noise in the encoding of stimuli, address-ing a main critique of the 2AFC task.
Finally, executive function (EF) is a multifaceted construct.Kong and Edwards used two measures (Trail Making and color-word Stroop), which possibly load on different aspects of EF, but
only found a correlation between the former and gradiency (thoughthis should be qualified by their moderate sample size of 30). Onegoal here was to employ additional measures of EF, along with amuch larger sample size to obtain a more definitive answer to thisquestion.
Thus, the present study built on the Kong and Edwards VASparadigm, but addressed the aforementioned issues with a num-ber of changes and refinements of the methodology, includingthe use of a novel technique specifically developed to help usdisentangle categorization gradiency from other aspects ofspeech perception.
The Present Study
We sought to examine individual differences in speech percep-tion by (a) establishing a precise and theoretically grounded mea-sure of gradiency from the VAS task, (b) exploring the role ofseveral factors that may be linked to these differences, and (c)assessing the role of gradiency in the perception of speech in noise(an issue not addressed by prior studies).
We collected VAS responses from a large sample (N � 131), sothat we could better evaluate individual differences in phonemecategorization gradiency. Listeners heard tokens from a two-dimensional voicing continuum (matrix) that simultaneously var-ied in VOT and F0 (a secondary cue) and rated each token (howb-like vs. p-like it sounded) using the VAS. Critically, we devel-oped and validated a new set of statistical tools for assessing anindividual subject’s gradiency that captured gradiency in respond-ing in the same model that captured the relationship betweenstimulus-related factors and VAS responses.
Secondarily, we used a variety of continua (word and non-word, labial- and alveolar-initial) to assess the effects of lexicalstatus and place of articulation respectively. While these ma-nipulations were exploratory, prior results suggest that listenersmay be more sensitive to subphonemic detail in real words(McMurray et al., 2008). This raises the possibility that theindividual differences reported by Kong and Edwards are onlyseen with nonwords, while most listeners show a gradientresponse pattern with words.
Next, we related our gradiency measure to the more standard2AFC measure of categorization. As described, the 2AFC slopemay reflect both categorization gradiency and internal noise in cueencoding. Thus, an explicit comparison between the VAS and2AFC tasks may help disentangle what the 2AFC task is primarilymeasuring. Since both tasks are thought to reflect, at least to somedegree, categorization gradiency, we expected a positive correla-tion between the VAS and 2AFC slopes. However, it was not clearhow strong a correlation should be expected, given the ambiguityas to what affects the 2AFC task.
We also related gradiency (in the VAS task) to cue integration(from the 2AFC task), indexed by the influence of a secondary cueon categorization. As described above, we predicted that gradientlisteners would be more sensitive to fine-grained information andshould, therefore, be better at taking advantage of multiple cues(see Kong & Edwards, 2016).
Next, we extended earlier investigations by addressing whetherthese speech measures (gradiency and multiple cue integration)were related to nonlinguistic cognitive abilities. We collected a setof individual differences measures tapping different aspects of
Thi
sdo
cum
ent
isco
pyri
ghte
dby
the
Am
eric
anPs
ycho
logi
cal
Ass
ocia
tion
oron
eof
itsal
lied
publ
ishe
rs.
Thi
sar
ticle
isin
tend
edso
lely
for
the
pers
onal
use
ofth
ein
divi
dual
user
and
isno
tto
bedi
ssem
inat
edbr
oadl
y.
1598 KAPNOULA, WINN, KONG, EDWARDS, AND MCMURRAY

executive function to evaluate these higher cognitive processes aspossible (direct or indirect) sources of gradiency. Our hypothesiswas that, to the extent that speech categorization may draw ondomain-general skills such as EF or working memory, individualdifferences in these skills may be reflected in the gradiency ordiscreteness of categorization.
Finally, we performed a preliminary assessment of the func-tional role of gradiency (i.e., whether it is beneficial for speechperception) using a speech-in-noise recognition task.
Method
Participants
Participants were 131 adult monolingual speakers of AmericanEnglish, all of whom completed a hearing screening at four octave-spaced audiometric test frequencies for each ear; one participantwas excluded on this basis because of thresholds greater than 25dB HL. Participants received course credit, and underwent in-formed consent in accord with University of Iowa IRB policies.Technical problems with several tasks led to their results not beingavailable for one or more participants. Consequently, between twoand 11 participants were excluded from the analyses of the specifictasks for which there were missing data.
Overview of Design
Participants performed six tasks (see Table 1). To explorestimulus-driven effects on gradiency, we included voicing conti-nua for labials and alveolars (within subject) in words, nonwords,and phonotactically impermissible nonwords (between subjects).VAS stimuli varied on seven VOT steps and five F0 steps (sec-ondary cue).
A conventional 2AFC task was compared to the more continu-ous VAS task. The VAS task was always performed before the2AFC task to avoid inducing any step-like bias on the former bythe latter. The 2AFC task was conducted on continua that varied onseven steps of VOT and only two steps of F0; this allowed anindependent estimate of secondary cue use measured as the dif-ference in the category boundary between the two VOT continua.
We used three measures of nonlanguage cognitive function,tapping different aspects of executive function (EF). We used theFlanker task to assess inhibition, the N-Back task, which tapsprimarily working memory, and the Trail Making task as a mea-sure of planning and executive performance. Finally, as a measureof speech perception accuracy, we administered a computerizedversion of the AzBio sentences (Spahr et al., 2012), a speech-in-noise measure.
Measuring Phoneme Categorization Gradiency
To measure individual differences in phoneme categorizationgradiency we used the VAS task with three types of continua(stimulus-types): (a) consonant-vowel-consonant (CVC) realwords (RW); (b) CVC nonwords, (NW); and (c) phonotacticallyimpermissible nonword CVs2 that violated an English phonotacticconstraint that lax vowels cannot appear in open syllables. Eachparticipant was only tested on one stimulus-type (randomly se-lected). Within that, each participant was tested on two places of
articulation (PoA), labial (e.g., bull-pull) and alveolar (e.g., ten-den; see Table 2).
VAS stimuli and design. For each of the six pairs (see Table2) we created a two-dimensional continuum by orthogonally ma-nipulating VOT and F0 in Praat (Boersma & Weenink, 2016;[version 5.3.23]). VOT were manipulated in natural speech usingprogressive cross-splicing (Andruski et al., 1994; McMurray et al.,2008). Progressively longer portions of the onset of a voiced sound(/b/ or /d/) were replaced with equivalent amounts from the aspi-ration of the voiceless sound (/p/ or /t/). Prior to splicing, voicoidswere multiplied by a 3 ms onset ramp, and cross-spliced with theconsonant burst/aspiration segment using a symmetrical 2-mscross-fading envelope, to remove any waveform discontinuities atthe splice point.
At each VOT step, the pitch contour was extracted and modifiedusing the pitch-synchronous overlap-add (PSOLA) algorithm in Praat.Pitch onset varied in five steps spaced equally from 190 Hz to 125 Hz.Pitch was kept steady over the first two pitch periods of the vowel andfell (or rose) linearly until returning to the original contour 80 ms intothe vowel. Final stimuli varied along seven VOT steps (1 to 45 ms)and five F0 steps (90 to 125 Hz). During the VAS task, each partic-ipant was presented with all 35 stimuli from each of the two PoAseries with three repetitions of each stimulus resulting in 210 trials.Stimulus presentation was blocked by PoA, with the block ordercounterbalanced between participants.
VAS procedure. On each trial, participants saw a line with aprinted word at each end (e.g., bull and pull, Figure 1). Voiced-initial stimuli were always on the left side. Participants used acomputer mouse to click on a vertical bar and drag it from thecenter to a point on the line to indicate where they thought thesound fell in between the two words. Before starting, participantsperformed a few practice trials. Unless the participant had clari-fying questions, no further instructions were given. The VAS tasktook approximately 15 min.
Preprocessing of VAS data. One obvious analytic strategywould be to fit a logistic to each participant’s VAS data and use theslope as a measure of gradiency. However, since stimuli also variedalong a secondary cue, this method is problematic; if a listener has adiscrete boundary in VOT space, but the location of this boundaryvaries with F0, the average boundary (across F0s) would look gradi-ent. Instead what is needed is a two-dimensional estimate of the slope.While logistic regression can handle this by weighting and summingthe two independent factors, there is no single term separating thecontribution of each cue from the overall slope.
To solve this problem, we developed a new function (Eq.1), therotated logistic. This assumes a diagonal boundary in a two-dimensional space described by a line with some cross-over point(along the primary cue) and an angle, � (see Figure 2). A 90° �indicates exclusive use of the primary cue, while a 45° � indicatesroughly equal use of both cues. Once � is identified, we rotate thecoordinate space to be orthogonal to this boundary and estimatethe slope of the response function perpendicular to the boundary.
This allows us to model gradiency with a single parameter thatreflects the derivative of the function orthogonal to the diagonalboundary; shallower slopes indicate more gradient responses, in-dependently of cue use (see Figure 3).
2 Similar to those used by Kong and Edwards (2011, 2016)
Thi
sdo
cum
ent
isco
pyri
ghte
dby
the
Am
eric
anPs
ycho
logi
cal
Ass
ocia
tion
oron
eof
itsal
lied
publ
ishe
rs.
Thi
sar
ticle
isin
tend
edso
lely
for
the
pers
onal
use
ofth
ein
divi
dual
user
and
isno
tto
bedi
ssem
inat
edbr
oadl
y.
1599INDIVIDUAL DIFFERENCES IN PHONEME CATEGORIZATION

p(resp) � b1 �(b2 � b1)
1 � e��4·s·2·����
(b2�b1) �·� tan(�)·(x0�VOT)�F0)
�1�tan���2� (1)
Here, b1 and b2 are the lower and upper asymptotes, and s is theslope (as in the four-parameter logistic). The new parameters are:�, the angle of the boundary (in radians), and x0, is the boundary’sx-intercept. The independent variables are VOT and F0. q(�) (inthe denominator, seen in [2]) switches the slope direction if � isless than 90° to keep the function continuous.
�(�) � �1 if � � � (�/2)0 otherwise
(2)
For each participant, we calculated the average of the threeresponses for each of the 70 stimuli participants heard duringthe VAS task (separately for each PoA). The equation in (1, 2)was then fit to each subject’s averaged VAS data using aconstrained gradient descent method implemented in Matlab(using FMINCON) that minimized the least squared error (seeS.1 for details about the curvetting procedure).
To assess the validity of this procedure, we conducted extensiveMonte Carlo analyses. These tested both the ability of this proce-dure to estimate the true values of the data, and looked for anyspurious correlations imposed on the data by the function or thecurve fitting (e.g., if parameters were confounded with each other).These are reported in supplement S.2 and show very high validity,and no evidence of spurious correlation between the estimatedparameters.
Measuring Multiple Cue Integration
We used a 2AFC task for two purposes. First, it offered ameasure of multiple cue integration that is independent of theVAS. Second, by relating VAS slope to categorization slope wehoped to determine what drives changes in categorization slope.
2AFC stimuli and design. The 2AFC task was performedimmediately after the N-Back task for all participants. A subset ofthe VAS stimuli was used in the 2AFC task: all 7 VOT steps, butonly the two extreme F0 values. This simplified quantification oflisteners’ use of F0 as the difference between boundaries for eachF0. Each of the 28 (7 VOTs � 2 F0s � 2 PoA) stimuli waspresented 10 times (280 total trials). Similarly to the VAS task,trials were presented in two separate blocks, one for each PoA, andblock order was counterbalanced between participants.
2AFC procedure. On each trial participants saw two squares,one on each side of the screen, each containing one of two printedwords (e.g., bull/pull). The voiced-initial word was always in theleft square. Participants were prompted to listen carefully to eachstimulus and click in the box with the word that best matched whatthey heard. At the beginning of the task participants performed afew practice trials. The 2AFC task took approximately 11 min.
Preprocessing of 2AFC data. To quantify F0 use, we fittedeach participant’s response curve using a four-parameter logisticfunction (see McMurray, Samelson, Lee, & Bruce Tomblin, 2010)that provides estimates for minimum and maximum asymptotes,slope, and crossover (see Eq. 3).
p(resp) � b1 �b2 � b1
1 � e� �4·s(b2�b1)
(x�co)�(3)
In this equation, b1 is the lower asymptote, b2 is the upper asymp-tote, s is the slope, and co is the x-intercept (see hypothetical datain Figure 4). This function was fit to each participant’s responsesseparately for each F0 and for each PoA. Curves were fit using aconstrained gradient descent method implemented with FMIN-CON in Matlab.
Measures of Executive Function
To investigate whether individual differences in cognitive func-tion are related to gradiency in phoneme categorization, we usedthree tasks measuring aspects of executive function: (a) theFlanker task (available through the NIH Toolbox; Gershon et al.,2013), (b) the N-Back task, and (c) the switch version of the TrailMaking task (TMT-B).
Flanker task (inhibitory control). The Flanker task is com-monly considered a measure of inhibitory control (Eriksen &Eriksen, 1974). Participants saw five arrows at the center of thescreen and reported the direction of the middle arrow by pressinga key. The direction of the other four surrounding arrows (flankers)was either consistent or inconsistent with the target. On inconsis-
Table 1Order and Description of Tasks
Order Task Domain Primarily measure of . . .
1 VAS Speech categorization Phoneme categorization gradiency2 Flanker Cognitive Executive function: inhibitory control3 N-Back Cognitive Executive function: working memory4 2AFC Speech categorization Secondary cue use5 Trail Making Cognitive Executive function: general6 AzBio Speech perception in noise Speech perception accuracy
Note. VAS � visual analogue scaling; 2AFC � 2-alternative forced choice.
Table 2Stimuli Used in the VAS and the 2AFC Tasks
Place of articulationof first phoneme
Stimulus type
Real word Nonword CV
Labial bull—pull buv—puv buh—puhAlveolar den—ten dev—tev deh—teh
Note. VAS � visual analogue scaling; 2AFC � 2-alternative forcedchoice; CV � consonant-vowel.
Thi
sdo
cum
ent
isco
pyri
ghte
dby
the
Am
eric
anPs
ycho
logi
cal
Ass
ocia
tion
oron
eof
itsal
lied
publ
ishe
rs.
Thi
sar
ticle
isin
tend
edso
lely
for
the
pers
onal
use
ofth
ein
divi
dual
user
and
isno
tto
bedi
ssem
inat
edbr
oadl
y.
1600 KAPNOULA, WINN, KONG, EDWARDS, AND MCMURRAY

tent trials, the degree to which participants inhibit the flankingstimuli predicts response speed. The Flanker task had 20 trials(approximately 3 min). Inhibition measures were a composite ofboth speed and accuracy, following NIH toolbox guidelines.3
N-Back task (working memory). The N-Back task was usedto measure complex working memory (Kirchner, 1958). Partici-pants viewed a series of numbers (each presented for 2,000 ms)and indicated whether the current number matched the previousone (1-back), the one two numbers before (2-back), or three before(3-back). The three levels of difficulty were presented in this orderfor all participants. There were 41, 42, and 43 trials for eachdifficulty level (respectively), yielding 40 responses to be scored ineach level. The N-Back task took approximately 9 min. Averageaccuracy across the three difficulty levels was used as an indicatorof working memory capacity.
Trail Making task (cognitive control). Part B of the TrailMaking task assesses cognitive control (Tombaugh, 2004). Duringthis task participants were given a sheet of paper with circlescontaining numbers 1 through 16 and letters A through P. Theyused a pencil to connect the circles in order, alternating betweennumbers and letters, starting at number 1 and ending at letter P.The time it took to complete this task was recorded by a trainedexaminer and used as a measure of cognitive control. On average,the Trail Making task took 2.5 mins to administer.
Speech Recognition in Noise: The AzBio Sentences
To measure how well participants perceive speech in noise, weadministered the AzBio sentences (Spahr et al., 2012), whichconsists of 10 sentences masked with multitalker babble (0 dBSNR). Sentences were delivered over high-quality headphones andparticipants repeated each sentence with no time constraint. Anexaminer recorded the number of correctly identified words on acomputer display by clicking on each word of the sentence thatwas correctly produced. The logit-transformed percentage of cor-rectly identified words was used as a measure of overall perfor-mance. The AzBio task took approximately 7 min.
Results
We start with a brief descriptive overview of the VAS and the2AFC data to validate the tasks and examine stimulus factors suchas the role of word/nonword status. We then proceed to ourtheoretical questions.
Descriptive Overview of VAS Data
Participants performed the VAS task as instructed, except threewho responded with random points on the line and were excludedfrom analyses. In addition, technical problems led to missing datafor five participants, leaving 123 participants with data for thistask.
Participants used both VOT and F0 to categorize stimuli. Asexpected, participants rated stimuli with higher VOT and higher F0
values as more /p/ (or /t/) like (see Figure 5). Replicating Kong andEdwards (2011), participants differed substantially in how theyperformed the VAS task. This can be clearly seen by computingsimple histograms of the points that were used along the scale. AsFigure 6A shows, some participants primarily responded using theendpoints of the line (Figure 6A), suggesting a more categoricalmode of responding, while others used the entire line (Figure 6B),suggesting a more gradient pattern.
While histograms such as those shown in Figure 6 show indi-vidual differences, this approach cannot address our primary ques-tions because it ignores the stimulus. For example, Subject 9 couldshow a flat distribution because they guessed or because theyaligned VAS ratings with the stimulus characteristics. A betterapproach must consider the relationship between stimulus andresponse.
3 Flanker task accuracy score � 0.125 � Number of Correct Responses;Reaction Time (reaction time [RT]) Score � 5-(5�[(log[RT]-log(500])/(log(3000-log[500]). If accuracy levels are 80%, the final “total” com-puted score is the accuracy score. If accuracy levels are �80%, RT scoreand accuracy score are combined.
Figure 2. Hypothetical response patterns based on mono-dimensional (left) and bidimensional (right) categoryboundaries. VOT � Voice Onset Time; VAS � visual analogue scaling.
Thi
sdo
cum
ent
isco
pyri
ghte
dby
the
Am
eric
anPs
ycho
logi
cal
Ass
ocia
tion
oron
eof
itsal
lied
publ
ishe
rs.
Thi
sar
ticle
isin
tend
edso
lely
for
the
pers
onal
use
ofth
ein
divi
dual
user
and
isno
tto
bedi
ssem
inat
edbr
oadl
y.
1601INDIVIDUAL DIFFERENCES IN PHONEME CATEGORIZATION

Figure 7 shows results for two participants plotting the indi-vidual (trial by trial) VAS responses as a function of VOT andF0. Subject 7 gives mostly binary responses, VAS scores near 0or 100. What differs as a function of VOT is the likelihood ofgiving a 0 or 100 rating. In this case, at intermediate VOTs wesee random fluctuations between the two endpoints, rather thanresponses clustered around an intermediate VAS value. Thus,this participant appears to have adopted a categorical approach.In contrast, Subject 8’s responses closely follow the cue values
of each stimulus, and variation is tightly clustered around themean. Thus, subject 8’s responses seem to reflect the gradientnature of the input.
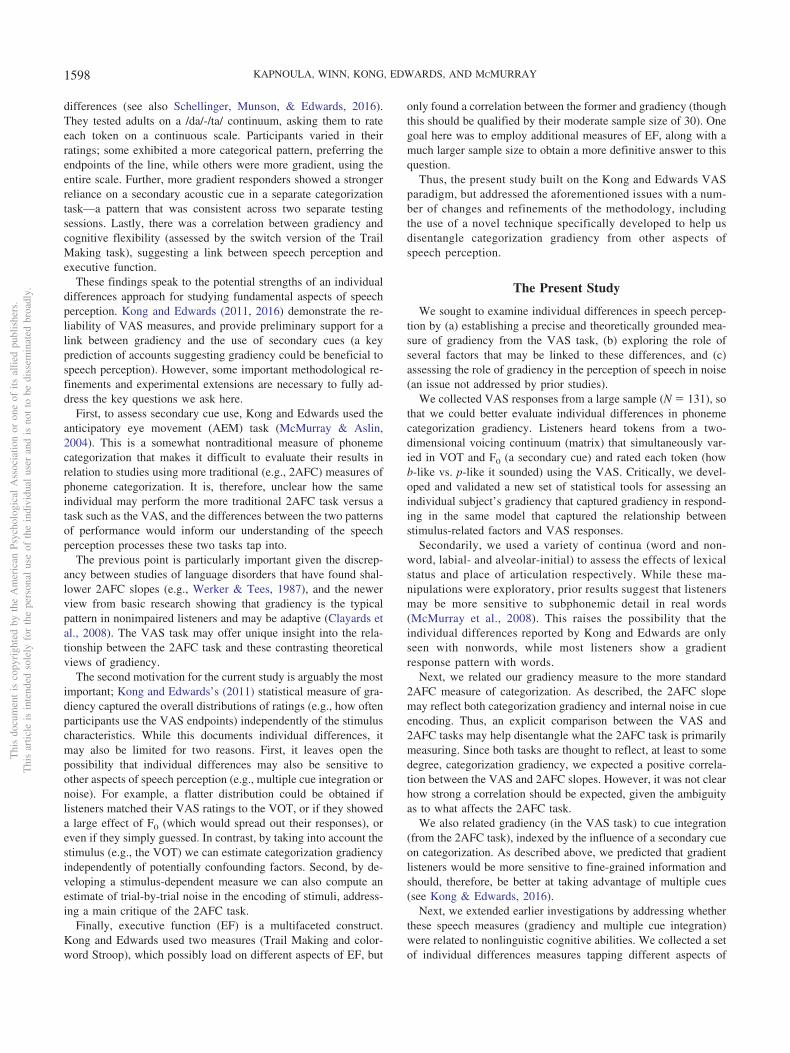
To quantify individual differences, we fitted participants’ VASratings using the rotated logistic function provided in Eq.1. Figure8 shows the actual and fitted response functions for the two typesof stimuli (labial and alveolar) across participants. Because thedistribution of raw VAS slopes was positively skewed, we log-transformed values for analysis.
Figure 3. Measuring phoneme categorization gradiency using the rotated logistic; Panel A: 3D depictionof voiced/unvoiced stop categorization as a function of VOT and F0 information (blue/lower front edge atmore voiced VAS rating; red/high back edge at more unvoiced VAS rating); Panel B: 2D depiction of thesame categorization function; � marks the theta angle that we use to rotate the x-axis so that it is orthogonalto the categorization boundary; Panel C: depiction of categorization slope using the rotated x-axis (x=).VOT � Voice Onset Time; VAS � visual analogue scaling. See the online article for the color version ofthis figure.
0
0.25
0.5
0.75
1
1 8 16 23 30 38 45
% /p
/ res
pons
es in
2A
FC ta
sk
VOT step (ms)
90125
Max asymptote
Min asymptote
Slope
Crossover difference
90 Hz125 Hz
Figure 4. Hypothetical response curves in the 2AFC; (dark: low pitch; light: high pitch). 2AFC � 2-alternativeforced choice; VOT � Voice Onset Time.
Thi
sdo
cum
ent
isco
pyri
ghte
dby
the
Am
eric
anPs
ycho
logi
cal
Ass
ocia
tion
oron
eof
itsal
lied
publ
ishe
rs.
Thi
sar
ticle
isin
tend
edso
lely
for
the
pers
onal
use
ofth
ein
divi
dual
user
and
isno
tto
bedi
ssem
inat
edbr
oadl
y.
1602 KAPNOULA, WINN, KONG, EDWARDS, AND MCMURRAY

We conducted an analysis of VAS scores as a function ofstimulus type and place of articulation (PoA; see supplement S.3for details). In brief, we found no significant effects of stimulustype or PoA on VAS slope. We also found evidence for higher useof F0 for labial compared to alveolar stimuli.
Descriptive Overview of 2AFC Data
The three participants that were excluded from the VAS anal-yses were also excluded from the 2AFC analyses. In addition, twoadditional participants were excluded due to technical issues, leav-ing 126 participants with data for this task.
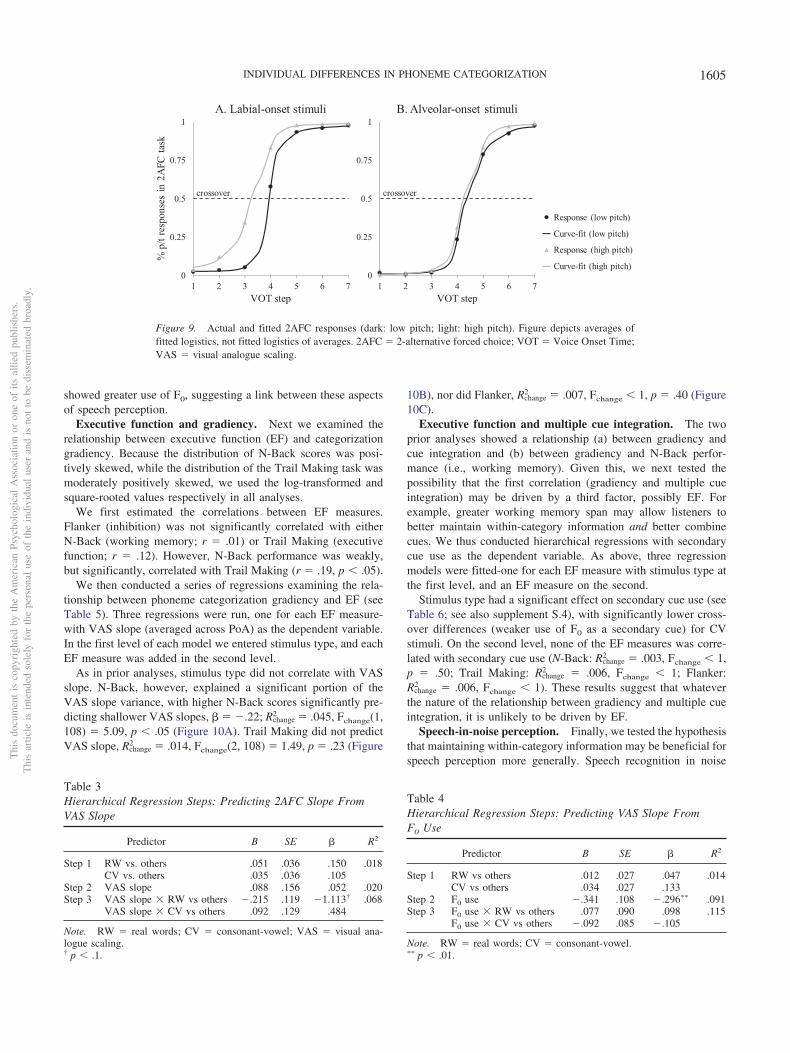
Participants used both VOT and F0 in the 2AFC task. They weremore likely to categorize stimuli as /p/ (or /t/) when they hadhigher VOTs and higher F0 values (see Figure 9). We fitted 2AFCdata using Eq. 3. The distribution of 2AFC slopes was positivelyskewed, so these were log-transformed for analyses. Similarly, thedistribution of raw crossover differences (our measure of F0 use)was moderately positively skewed, so these were square-roottransformed.
Average VAS rating< 5 20 35 50 65 80 95 <
F0ste
p
5
4
3
2
1
1 2 3 4 5 6 7VOT step
Figure 5. Visual analogue scaling responses by Voice Onset Time and F0
steps.
Figure 6. Histograms of sample individual visual analogue scaling responses.
0
25
50
75
100
1 2 3 4 5 6 7
Mean rating (lab)Mean rating (alv)labalv
0
25
50
75
100
1 2 3 4 5 6 7
Mean rating (lab)
Mean rating (alv)
lab
alv
pets TOVpets TOV
VAS
ratin
gb/
dp/
t
Mean rating (labials)
Mean rating (alveolars)
Unique rating (labials)
Unique rating (alveolars)
A. Subject 7 B. Subject 8
Figure 7. Sample VAS ratings per VOT and F0 value exhibiting highlydissimilar patterns of noise; Subject 7 (left) responds categorically (close tothe endpoints), but sometimes picks the wrong endpoint, whereas Subject8 (right) closely maps his ratings to the VOT steps. VOT � Voice OnsetTime; VAS � visual analogue scaling.
Thi
sdo
cum
ent
isco
pyri
ghte
dby
the
Am
eric
anPs
ycho
logi
cal
Ass
ocia
tion
oron
eof
itsal
lied
publ
ishe
rs.
Thi
sar
ticle
isin
tend
edso
lely
for
the
pers
onal
use
ofth
ein
divi
dual
user
and
isno
tto
bedi
ssem
inat
edbr
oadl
y.
1603INDIVIDUAL DIFFERENCES IN PHONEME CATEGORIZATION
We analyzed 2AFC results by stimulus type and PoA (seesupplement S.4 for details). In brief, we found no main effects ofstimulus type or PoA on 2AFC slope. Second, similarly to theVAS task, listeners used F0 more for labial stimuli and hardly at allfor alveolars (Figure 9B).
Descriptive Analyses: Summary
Listeners were highly consistent across tasks in how they cate-gorized stimuli (e.g., there was no main effect of stimulus type orPoA on slope in either task; and there was greater use of pitchinformation for labials in both tasks; see supplement S.5). Basedon these results, we averaged slopes across PoA to compute asingle slope estimate for each participant in each task. In addition,given the importance of multiple cue integration for our questions,only labial-initial stimuli were included in the analyses of F0 use.More broadly, this close similarity in the pattern of effects betweenthe VAS and 2AFC results validates the VAS task and is in linewith a pattern of categorization that is relatively stable withinindividuals.
Individual Differences in Speech Perception
We next addressed our primary theoretical questions by exam-ining how our speech perception measures were related to eachother and to other measures.
Noise and gradiency in phoneme categorization. We firstexamined the relationship between VAS slope (categorization gra-diency) and 2AFC slope (which may reflect categorization gradi-ency and/or internal noise in cue encoding). As slope was averagedacross the two PoA, there were no repeated measurements, en-abling us to use hierarchical regression to evaluate VAS slope asa predictor of 2AFC slope.
On the first level of the model (see Table 3), stimulus type wasentered, contrast-coded into two variables, one comparing CVs tothe other two (CV � 2; RW � �1; NW � �1), and the othercomparing RWs to the other two (RW � 2; NW � �1;CV � �1). This explained 1.78% of the variance, F(2, 117) �1.06, p � .35. On the second step, VAS slope was added to the
model, which did not account for significantly additional vari-ance (Rchange
2 � .002, Fchange � 1). On the last step, we enteredthe VAS Slope � Stimulus Type interaction, which accountedfor a marginally significant additional variance (Rchange
2 � .048,Fchange(5,114) � 2.96, p � .056). To examine this interaction,we split the data by stimulus type; however, VAS slope did notaccount for a significant portion of the 2AFC slope variance inany of the subsets.4
This lack of correlation between 2AFC and VAS slope impliesthe two measures may reflect different aspects of speech catego-rization. As described, this may be because the 2AFC task is moresensitive to noise (in the encoding of cues), while the VAS reflectscategorization gradiency. This is in line with Figure 7, whichsuggests that two subjects may have similar mean slopes in theVAS task despite large differences in the trial-to-trial noise aroundthat mean. While the 2AFC task cannot assess this, the VAS taskmay be able to do so.
To test this hypothesis, we extracted a measure of noise in cueencoding from the VAS task using residuals. We first computedthe difference between each VAS rating (on a trial-by-trial basis)and the predicted value from that subject’s rotated logistic. Wethen computed the standard deviation of these residuals. This wasdone separately for each PoA and averaged to estimate the noisefor each subject. The SD of the residuals in the VAS task wasmarginally correlated with 2AFC slope in the expected direction(negatively), r � �.168, p � .063. Listeners with shallower 2AFCslopes showed more noise in the VAS task. Interestingly, noisewas weakly positively, though not significantly, correlated withVAS slope, r � .120, p � .185, suggesting that, if anything,listeners with higher gradiency (shallower VAS slope) are lessnoisy in their VAS ratings. This seems to agree with the sampleresults presented in Figure 7, as more gradient listeners tend togive ratings that more systematically reflect the stimulus charac-teristics.
Secondary cue use as a predictor of gradiency. Next, weexamined whether gradiency in phoneme categorization waslinked to multiple cue integration. As above, we used hierarchicalregression with VAS slope as the dependent variable. Independentvariables were stimulus type (coded as before) and F0 use (thedifference in 2AFC crossover points between low and high F0).
Only labial-initial stimuli were included. In the first level (seeTable 4), stimulus type did not significantly account for variancein VAS slope, R2 � .014, F � 1. In the second level, F0 expla-ined significant new variance, � � �.296; Rchange
2 � .077,Fchange(1, 116) � 9.87, p � .01. On the last level, the F0 use �Stimulus Type interaction did not significantly account for addi-tional variance (Rchange
2 � .024, Fchange(2, 114) � 1.53, p � .220).These results corroborate Kong and Edwards (2016): listeners withmore phoneme categorization gradiency (shallower VAS slope)
4 The lack of a significant relationship between the slopes for the twotasks raised the possibility that perhaps the VAS task is not related to morestandard speech categorization measures. To confirm that the VAS taskcould provide good measures of basic aspects of speech perception (suchas category boundary and secondary cue use), we also examined correla-tions between the crossover and F0 use extracted from the two tasks (seesupplement S.6). These show a robust relationship, supporting the validityof the VAS task.
0
25
50
75
100
1 2 3 4 5 6 7VOT step
b/d
VA
S ra
ting
p/
t
Response (alveolars)
Curve-fit (alveolars)
Response (labials)
Curve-fit (labials)
Figure 8. Actual and fitted VAS ratings (dark: labial; light: alveolar).VAS � visual analogue scaling; VOT � Voice Onset Time.
Thi
sdo
cum
ent
isco
pyri
ghte
dby
the
Am
eric
anPs
ycho
logi
cal
Ass
ocia
tion
oron
eof
itsal
lied
publ
ishe
rs.
Thi
sar
ticle
isin
tend
edso
lely
for
the
pers
onal
use
ofth
ein
divi
dual
user
and
isno
tto
bedi
ssem
inat
edbr
oadl
y.
1604 KAPNOULA, WINN, KONG, EDWARDS, AND MCMURRAY
showed greater use of F0, suggesting a link between these aspectsof speech perception.
Executive function and gradiency. Next we examined therelationship between executive function (EF) and categorizationgradiency. Because the distribution of N-Back scores was posi-tively skewed, while the distribution of the Trail Making task wasmoderately positively skewed, we used the log-transformed andsquare-rooted values respectively in all analyses.
We first estimated the correlations between EF measures.Flanker (inhibition) was not significantly correlated with eitherN-Back (working memory; r � .01) or Trail Making (executivefunction; r � .12). However, N-Back performance was weakly,but significantly, correlated with Trail Making (r � .19, p � .05).
We then conducted a series of regressions examining the rela-tionship between phoneme categorization gradiency and EF (seeTable 5). Three regressions were run, one for each EF measure-with VAS slope (averaged across PoA) as the dependent variable.In the first level of each model we entered stimulus type, and eachEF measure was added in the second level.
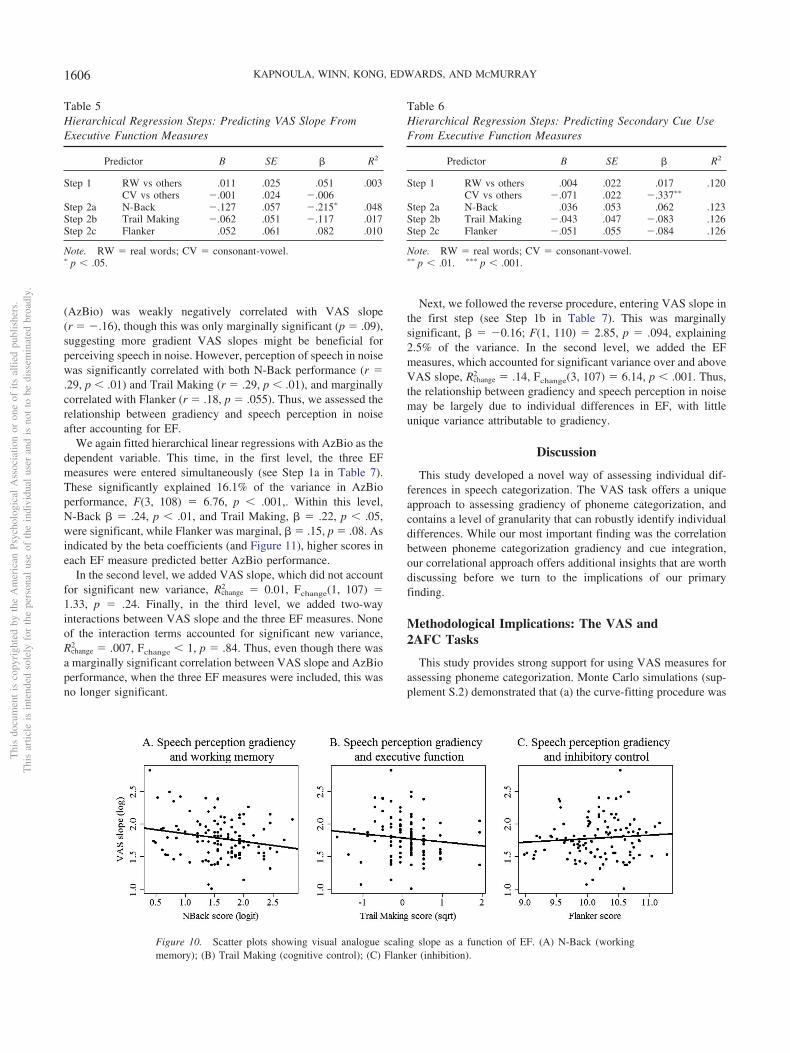
As in prior analyses, stimulus type did not correlate with VASslope. N-Back, however, explained a significant portion of theVAS slope variance, with higher N-Back scores significantly pre-dicting shallower VAS slopes, � � �.22; Rchange
2 � .045, Fchange(1,108) � 5.09, p � .05 (Figure 10A). Trail Making did not predictVAS slope, Rchange
2 � .014, Fchange(2, 108) � 1.49, p � .23 (Figure
10B), nor did Flanker, Rchange2 � .007, Fchange � 1, p � .40 (Figure
10C).Executive function and multiple cue integration. The two
prior analyses showed a relationship (a) between gradiency andcue integration and (b) between gradiency and N-Back perfor-mance (i.e., working memory). Given this, we next tested thepossibility that the first correlation (gradiency and multiple cueintegration) may be driven by a third factor, possibly EF. Forexample, greater working memory span may allow listeners tobetter maintain within-category information and better combinecues. We thus conducted hierarchical regressions with secondarycue use as the dependent variable. As above, three regressionmodels were fitted-one for each EF measure with stimulus type atthe first level, and an EF measure on the second.
Stimulus type had a significant effect on secondary cue use (seeTable 6; see also supplement S.4), with significantly lower cross-over differences (weaker use of F0 as a secondary cue) for CVstimuli. On the second level, none of the EF measures was corre-lated with secondary cue use (N-Back: Rchange
2 � .003, Fchange � 1,p � .50; Trail Making: Rchange
2 � .006, Fchange � 1; Flanker:Rchange
2 � .006, Fchange � 1). These results suggest that whateverthe nature of the relationship between gradiency and multiple cueintegration, it is unlikely to be driven by EF.
Speech-in-noise perception. Finally, we tested the hypothesisthat maintaining within-category information may be beneficial forspeech perception more generally. Speech recognition in noise
Table 3Hierarchical Regression Steps: Predicting 2AFC Slope FromVAS Slope
Predictor B SE � R2
Step 1 RW vs. others .051 .036 .150 .018CV vs. others .035 .036 .105
Step 2 VAS slope .088 .156 .052 .020Step 3 VAS slope � RW vs others �.215 .119 �1.113† .068
VAS slope � CV vs others .092 .129 .484
Note. RW � real words; CV � consonant-vowel; VAS � visual ana-logue scaling.† p � .1.
Table 4Hierarchical Regression Steps: Predicting VAS Slope FromF0 Use
Predictor B SE � R2
Step 1 RW vs others .012 .027 .047 .014CV vs others .034 .027 .133
Step 2 F0 use �.341 .108 �.296�� .091Step 3 F0 use � RW vs others .077 .090 .098 .115
F0 use � CV vs others �.092 .085 �.105
Note. RW � real words; CV � consonant-vowel.�� p � .01.
0
0.25
0.5
0.75
1
1 2 3 4 5 6 7VOT step
% p
/t re
spon
ses
in 2
AFC
task
crossover
A. Labial-onset stimuli
0
0.25
0.5
0.75
1
1 2 3 4 5 6 7VOT step
1 - Average of Response2
1 - Average of logistic_CON
5 - Average of Response2
5 - Average of logistic_CON
crossover
Response (low pitch)
Curve-fit (low pitch)
Response (high pitch)
Curve-fit (high pitch)
B. Alveolar-onset stimuli
Figure 9. Actual and fitted 2AFC responses (dark: low pitch; light: high pitch). Figure depicts averages offitted logistics, not fitted logistics of averages. 2AFC � 2-alternative forced choice; VOT � Voice Onset Time;VAS � visual analogue scaling.
Thi
sdo
cum
ent
isco
pyri
ghte
dby
the
Am
eric
anPs
ycho
logi
cal
Ass
ocia
tion
oron
eof
itsal
lied
publ
ishe
rs.
Thi
sar
ticle
isin
tend
edso
lely
for
the
pers
onal
use
ofth
ein
divi
dual
user
and
isno
tto
bedi
ssem
inat
edbr
oadl
y.
1605INDIVIDUAL DIFFERENCES IN PHONEME CATEGORIZATION
(AzBio) was weakly negatively correlated with VAS slope(r � �.16), though this was only marginally significant (p � .09),suggesting more gradient VAS slopes might be beneficial forperceiving speech in noise. However, perception of speech in noisewas significantly correlated with both N-Back performance (r �.29, p � .01) and Trail Making (r � .29, p � .01), and marginallycorrelated with Flanker (r � .18, p � .055). Thus, we assessed therelationship between gradiency and speech perception in noiseafter accounting for EF.
We again fitted hierarchical linear regressions with AzBio as thedependent variable. This time, in the first level, the three EFmeasures were entered simultaneously (see Step 1a in Table 7).These significantly explained 16.1% of the variance in AzBioperformance, F(3, 108) � 6.76, p � .001,. Within this level,N-Back � � .24, p � .01, and Trail Making, � � .22, p � .05,were significant, while Flanker was marginal, � � .15, p � .08. Asindicated by the beta coefficients (and Figure 11), higher scores ineach EF measure predicted better AzBio performance.
In the second level, we added VAS slope, which did not accountfor significant new variance, Rchange
2 � 0.01, Fchange(1, 107) �1.33, p � .24. Finally, in the third level, we added two-wayinteractions between VAS slope and the three EF measures. Noneof the interaction terms accounted for significant new variance,Rchange
2 � .007, Fchange � 1, p � .84. Thus, even though there wasa marginally significant correlation between VAS slope and AzBioperformance, when the three EF measures were included, this wasno longer significant.
Next, we followed the reverse procedure, entering VAS slope inthe first step (see Step 1b in Table 7). This was marginallysignificant, � � �0.16; F(1, 110) � 2.85, p � .094, explaining2.5% of the variance. In the second level, we added the EFmeasures, which accounted for significant variance over and aboveVAS slope, Rchange
2 � .14, Fchange(3, 107) � 6.14, p � .001. Thus,the relationship between gradiency and speech perception in noisemay be largely due to individual differences in EF, with littleunique variance attributable to gradiency.
Discussion
This study developed a novel way of assessing individual dif-ferences in speech categorization. The VAS task offers a uniqueapproach to assessing gradiency of phoneme categorization, andcontains a level of granularity that can robustly identify individualdifferences. While our most important finding was the correlationbetween phoneme categorization gradiency and cue integration,our correlational approach offers additional insights that are worthdiscussing before we turn to the implications of our primaryfinding.
Methodological Implications: The VAS and2AFC Tasks
This study provides strong support for using VAS measures forassessing phoneme categorization. Monte Carlo simulations (sup-plement S.2) demonstrated that (a) the curve-fitting procedure was
Table 5Hierarchical Regression Steps: Predicting VAS Slope FromExecutive Function Measures
Predictor B SE � R2
Step 1 RW vs others .011 .025 .051 .003CV vs others �.001 .024 �.006
Step 2a N-Back �.127 .057 �.215� .048Step 2b Trail Making �.062 .051 �.117 .017Step 2c Flanker .052 .061 .082 .010
Note. RW � real words; CV � consonant-vowel.� p � .05.
Figure 10. Scatter plots showing visual analogue scaling slope as a function of EF. (A) N-Back (workingmemory); (B) Trail Making (cognitive control); (C) Flanker (inhibition).
Table 6Hierarchical Regression Steps: Predicting Secondary Cue UseFrom Executive Function Measures
Predictor B SE � R2
Step 1 RW vs others .004 .022 .017 .120CV vs others �.071 .022 �.337��
Step 2a N-Back .036 .053 .062 .123Step 2b Trail Making �.043 .047 �.083 .126Step 2c Flanker �.051 .055 �.084 .126
Note. RW � real words; CV � consonant-vowel.�� p � .01. ��� p � .001.
Thi
sdo
cum
ent
isco
pyri
ghte
dby
the
Am
eric
anPs
ycho
logi
cal
Ass
ocia
tion
oron
eof
itsal
lied
publ
ishe
rs.
Thi
sar
ticle
isin
tend
edso
lely
for
the
pers
onal
use
ofth
ein
divi
dual
user
and
isno
tto
bedi
ssem
inat
edbr
oadl
y.
1606 KAPNOULA, WINN, KONG, EDWARDS, AND MCMURRAY

unbiased and generated independent fits of gradiency and multiplecue integration, and (b) the fits accurately represented the under-lying structure of the data even with as few as three repetitions perstimulus step.
In addition, when relating the pattern of effects obtained in theVAS and 2AFC task, we found the same stimulus-driven effects inboth measures (supplement S.5), and that category boundaries andestimates of multiple cue use were correlated in the two tasks(supplement S.6). These findings (supplement S.3–6) suggestedthat our estimates of various effects are relatively stable acrosstasks. Therefore, these effects seem to reflect underlying aspects ofthe processing system that are somewhat stable for any givenindividual, validating our individual differences approach. Further-more, the similarity between the VAS and the 2AFC resultsprovides strong validation of the VAS task as an accurate andprecise measure of phoneme categorization.
Given this, the lack of correlation between the VAS and 2AFCslopes was striking. We expected to find some correlation betweenthe two, since both are thought to reflect at least partly the degreeof gradiency in speech categorization. However, the 2AFC slopedid not predict VAS slope. This could mean that these two mea-sures assess different aspects of speech perception, perhaps more
so than initially thought. That is, the 2AFC slope may largelyreflect internal noise, rather than the gradiency of the responsefunction (as does the VAS slope).
This study cannot speak to the exact locus of the noise that the2AFC is tapping; it could be noise at a processing stage as early asthe perception of acoustic cues, or it could be that cues areperceived accurately, but noise is introduced when they are main-tained or as they are mapped to categories. In all these cases, thelikely result would be greater inconsistency in participants’ re-sponses particularly near the boundary.
A number of arguments support the claim that the 2AFC taskmay reflect noise in how cues are encoded and used. For example,even if listeners make underlying probabilistic judgments aboutphonemes, when it comes to mapping this judgment to a response,the optimal strategy is to always choose the most likely response(rather than attempting to match the distribution of responses to theinternal probability structure; Nearey & Hogan, 1986). Though itis unclear if some (or all) listeners do this, it suggests that the2AFC slope may not necessarily reflect the underlying probabilis-tic mapping from cues to categories. In contrast to the 2AFC task,the VAS task may offer a unique window into this mapping,allowing us to extract information that is not accessible with othertasks. This is supported by our own analyses of trial-by-trialvariation (i.e., noise) showing a markedly different relationshipbetween noise and slopes from the 2AFC and VAS tasks. Inter-preting these results cautiously, they suggest that variation in2AFC slope may be more closely tied to noise in the system(higher noise � shallower slope), whereas VAS slope reflects thegradiency of speech categories.
This has a number of implications when we consider the use ofphoneme categorization measures to assess populations with com-munication impairments. First, our findings seem to explain whygradient 2AFC responding is often associated with SLI and dys-lexia, even as theoretical models and work with typical populationssuggest a more gradient mode of responding is beneficial. In theformer case, the 2AFC task is not tapping gradiency at all, butrather is tapping internal noise (which is likely increased in im-paired listeners). As we show here, the VAS simultaneously tapsboth, with the slope of the average responding reflecting catego-rization gradiency and the SD of the residuals reflecting noise. A
Table 7Hierarchical Regression Steps: Predicting AzBio Score FromExecutive Function Measures and VAS Slope
Predictor B SE � R2
Step 1a N-Back .164 .062 .238� .158Trail Making .138 .056 .223�
Flanker .113 .065 .155†
Step 1b VAS slope �.184 .109 �.159 .025Step 2 N-Back .150 .063 .218� .168
Trail Making .132 .056 .214�
Flanker .120 .065 .165†
VAS slope �.121 .105 �.105Step 3 VAS slope � N-Back .140 .191 .073 .175
VAS slope � Trail Making �.025 .195 �.012VAS slope � Flanker �.109 .263 �.039
Note. VAS � visual analogue scaling.† p � .1. � p � .05.
Figure 11. Scatter plots showing speech-in-noise perception (AzBio) as a function of EF. (A) N-Back (workingmemory). (B) Trail Making (cognitive control). (C) Flanker (inhibition). Note that an AzBio logit score of 0(zero) corresponds to 50% accuracy.
Thi
sdo
cum
ent
isco
pyri
ghte
dby
the
Am
eric
anPs
ycho
logi
cal
Ass
ocia
tion
oron
eof
itsal
lied
publ
ishe
rs.
Thi
sar
ticle
isin
tend
edso
lely
for
the
pers
onal
use
ofth
ein
divi
dual
user
and
isno
tto
bedi
ssem
inat
edbr
oadl
y.
1607INDIVIDUAL DIFFERENCES IN PHONEME CATEGORIZATION

combination of measures may thus offer more insight into thelocus of perceptual impairments than traditional 2AFC measures,particularly when combined with online measures such as eye-tracking (cf., McMurray et al., 2014) that overcome other limita-tions of phoneme judgment tasks.
It is also helpful to consider how the 2AFC and VAS measuresrelate to other measures of gradiency. Many of the seminal studiessupporting an underlying gradient form of speech categorizationused a variant of the Visual World Paradigm (Clayards et al., 2008;McMurray et al., 2002, 2008). Here, gradiency is usually measuredas the proportion of looks to a competitor (e.g., bear when thetarget is pear) as a function of step along a continuum such asVOT. Typically, as the step nears the boundary, competitor fixa-tions increase linearly, suggesting sensitivity to within-categorychanges. This measure is computed relative to each participant’sboundary, and only for trials on which participants click on thetarget. This allows us to extract a measure that may be lesssusceptible to the noise issues that appear with the 2AFC task.However, it is an open question whether this measure of gradiencymay tap into the same underlying processes as those tapped by theVAS task.
Primary finding: Gradiency and cue integration. A criticalresult was that phoneme categorization gradiency was linked tomultiple cue integration, such that greater gradiency predictedhigher use of pitch-related information (see also Kong & Edwards,2016). This finding is correlational, and therefore consistent witha number of possible causal accounts. First, multiple cue integra-tion may allow for more gradient categorization. Under this view,the ability to integrate multiple cues may help listeners form amore precise graded estimate of speech categories. Alternatively,as we proposed, the causality may be reversed, with more gradi-ency helping listeners to be more sensitive to small differences ineach cue, permitting better integration. Third, a gradient represen-tation could help listeners avoid making a strong commitment onthe basis of a single cue, allowing them to use both cues moreeffectively. Lastly, there could be a third factor that links the two.In this regard, we examined EF measures and found a relationshipwith gradiency for only the N-Back task, but no relationshipbetween any EF measures and multiple cue integration. Additionalfactors of this sort—such as auditory acuity—should be consideredin future research. Even though our study was not designed todistinguish between these mechanisms, it offers strong evidencefor a link between these two aspects of speech perception, whichremains to be clarified.
Links to other cognitive processes. Our findings show apotential link between working memory (N-Back) and partici-pants’ response pattern in the VAS task. One possibility for thiscorrelation is that working memory mediates the relationship be-tween gradiency and individuals’ responses; there may be individ-uals who have gradient speech categories, but this gradient acti-vation is not maintained all the way to the response stage due toworking memory limitations. That is, the degree to which gradi-ency at the cue/phoneme level is reflected in an individual’sresponse pattern may depend on their working memory span.Furthermore, measures that tap earlier stages of processing (e.g.,ERPs, see Toscano et al., 2010), or earlier times in processing(e.g., eye-movements in the visual world paradigm: McMurray etal., 2002) may be less susceptible to working memory constraints,possibly explaining why these measures offer some of the stron-
gest evidence for gradiency as a characterization of the modallistener.
Speech perception in noise. We predicted that higher gradi-ency would allow listeners to be more flexible in their interpreta-tion of the signal and, thus, outperform listeners with lower levelsof gradiency in a speech-in-noise task (AzBio sentences). Ourresults did not support this: gradiency was not a significant pre-dictor of AzBio performance, which was, however, significantlypredicted by our three EF measures (N-Back, Trail Making, andFlanker task).
The lack of correlation between gradiency and AzBio perfor-mance may reflect difficulties in linking laboratory measures ofunderlying speech perception processes (and cognitive processesmore generally) to simple outcome measures. Such difficulty couldarise from at least two sources. First, speech-in-noise perceptionmay be more dependent on participants’ level of motivation andeffort than laboratory measures. This is supported by recent workon listening effort (Wu, Stangl, Zhang, Perkins, & Eilers, 2016;Zekveld & Kramer, 2014), which suggests that listeners put forthvery low effort at low signal-to-noise ratios, they often appear togive up. Even though it is unlikely that in our study participantsgave up in the AzBio task, the point being made here is thatmotivation may be a significant source of unwanted variability inthese measures. Indeed, the significant correlations between ourspeech-in-noise measure and scores on the three executive func-tion tasks may derive from a similar source. If so, this correlationmay have little to do with speech perception.
Furthermore, while speech-in-noise perception is a standardassessment of speech perception accuracy, performance in suchtasks may not be strongly affected by differences in categorizationgradiency. As we describe in the introductory section of thisarticle, theoretical arguments for gradiency are not typicallyframed in terms of speech-in-noise perception; rather, the motiva-tion seems to derive from the demands of interpreting ambiguousacoustic cues, such as those related to anticipatory coarticulation,speaking rate, or speaker differences. Noise does not necessarilyalter the cue values; rather, it masks the listeners’ ability to detectthem. Thus, this task may not properly target the functional prob-lems that categorization gradiency is attempting to solve.
In a related vein, it may be the case that both gradient andcategorical modes of responding are equally adaptive for solvingthe problem of speech perception in noise. That is, to the extentthat differences in listeners’ mode of categorization reflects adifferent weighting of different sorts of information (e.g., betweenacoustic or phonological representations in the Pisoni & Tash,1974 model; or between dorsal and ventral stream processing inthe Hickok & Poeppel, 2007 model), both sources of informationmay be equally useful for solving this problem (even as there areadvantages of gradiency for other problems).
Gradiency and nongradiency in the categorization of speechsounds can both be advantageous in different ways. Therefore, inorder to find the link that connects the underlying cognitive pro-cesses to a performance estimate, we need to use different mea-sures of performance that are more closely tied to the theoreticalview of speech perception that is being evaluated. Similar concernsmay suggest the need to reconsider the way we evaluate speechperception tests used in a variety of different settings, including forclinical evaluations, so that they tap more into the underlyingprocesses linked to our predictions.
Thi
sdo
cum
ent
isco
pyri
ghte
dby
the
Am
eric
anPs
ycho
logi
cal
Ass
ocia
tion
oron
eof
itsal
lied
publ
ishe
rs.
Thi
sar
ticle
isin
tend
edso
lely
for
the
pers
onal
use
ofth
ein
divi
dual
user
and
isno
tto
bedi
ssem
inat
edbr
oadl
y.
1608 KAPNOULA, WINN, KONG, EDWARDS, AND MCMURRAY
Conclusions. We evaluated individual differences in pho-neme categorization gradiency using a VAS task. This task, cou-pled with a novel set of statistical tools and substantial experimen-tal extensions, allowed us for the first time to extract independentmeasures of speech categorization gradiency, multiple cue integra-tion, and noise, at the individual level.
Our main results can be summarized as follows: First, we foundsubstantial individual differences in how listeners categorizespeech sounds, thus verifying the results by Kong and Edwards(2016) with a significantly larger sample. Second, we showed thatdifferences in phoneme categorization gradiency seem to be the-oretically independent from differences in the degree of internalnoise in the encoding of acoustic cues and/or cue-to-phonememappings, and thus should not be confused with the traditionalinterpretation of shallow slopes as indicating noisier categorizationof phonemes. Both categorization gradiency and such forms ofnoise contribute to speech perception, but may be tapped bydifferent tasks. Third, differences in categorization gradiency arenot epiphenomenal to other aspects of speech perception andappear to be linked to differences in multiple cue integration. Thefunctional role of gradiency, however, is not yet clear, as the causaldirection of this relationship remains to be defined. Fourth, wefound only limited relationship between executive function andgradiency, suggesting that differences in categorization sharpnessmay derive from lower-level sources. Lastly, gradiency may beweakly related to speech perception in noise, but this seems to bemodulated by executive function�related processes.
These results provide useful insights as to the mechanisms thatsubserve speech perception. Most importantly, they seem to standin opposition to the commonly held assumption (see “Individualdifferences in phoneme categorization” section) that a sharp cate-gory boundary (and poor within-category discrimination) is thedesired strategy for categorizing speech sounds efficiently andaccurately. Overall, speech categorization is gradient, although todifferent degrees among listeners, and further work is necessary toreveal the sources of these differences and the consequences theyhave for spoken language comprehension.
References
Allen, J. S., & Miller, J. L. (1999). Effects of syllable-initial voicing andspeaking rate on the temporal characteristics of monosyllabic words. TheJournal of the Acoustical Society of America, 106(4 Pt 1), 2031–2039.http://dx.doi.org/10.1121/1.427949
Andruski, J. E., Blumstein, S. E., & Burton, M. (1994). The effect ofsubphonetic differences on lexical access. Cognition, 52, 163–187.http://dx.doi.org/10.1016/0010-0277(94)90042-6
Blomert, L., & Mitterer, H. (2004). The fragile nature of the speech-perception deficit in dyslexia: Natural vs. synthetic speech. Brain andLanguage, 89, 21–26. http://dx.doi.org/10.1016/S0093-934X(03)00305-5
Blumstein, S. E., Myers, E. B., & Rissman, J. (2005). The perception ofvoice onset time: An fMRI investigation of phonetic category structure.Journal of Cognitive Neuroscience, 17, 1353–1366. http://dx.doi.org/10.1162/0898929054985473
Boersma, P., & Weenink, D. (2016). Praat: Doing phonetics by computer(Version 5.3) [Computer Program]. Retrieved from http://www.praat.org
Bogliotti, C., Serniclaes, W., Messaoud-Galusi, S., & Sprenger-Charolles,L. (2008). Discrimination of speech sounds by children with dyslexia:Comparisons with chronological age and reading level controls. Journal
of Experimental Child Psychology, 101, 137–155. http://dx.doi.org/10.1016/j.jecp.2008.03.006
Carney, A. E., Widin, G., & Viemeister, N. F. (1977). Noncategoricalperception of stop consonants differing in VOT. Journal of the Acous-tical Society of America, 62, 961–970. http://dx.doi.org/10.1121/1.381590
Chang, E. F., Rieger, J. W., Johnson, K., Berger, M. S., Barbaro, N. M., &Knight, R. T. (2010). Categorical speech representation in human supe-rior temporal gyrus. Nature Neuroscience, 13, 1428–1432. http://dx.doi.org/10.1038/nn.2641
Clayards, M., Tanenhaus, M. K., Aslin, R. N., & Jacobs, R. A. (2008).Perception of speech reflects optimal use of probabilistic speech cues.Cognition, 108, 804–809. http://dx.doi.org/10.1016/j.cognition.2008.04.004
Coady, J. A., Evans, J. L., Mainela-Arnold, E., & Kluender, K. R. (2007).Children with specific language impairments perceive speech mostcategorically when tokens are natural and meaningful. Journal ofSpeech, Language, and Hearing Research, 50, 41–57. http://dx.doi.org/10.1044/1092-4388(2007/004)
Coady, J. A., Kluender, K. R., & Evans, J. L. (2005). Categorical percep-tion of speech by children with specific language impairments. Journalof Speech, Language, and Hearing Research, 48, 944–959. http://dx.doi.org/10.1044/1092-4388(2005/065)
Dehaene-Lambertz, G. (1997). Electrophysiological correlates of categor-ical phoneme perception in adults. Neuroreport: An International Jour-nal for the Rapid Communication of Research in Neuroscience, 8,919–924. http://dx.doi.org/10.1097/00001756-199703030-00021
Du, Y., Buchsbaum, B. R., Grady, C. L., & Alain, C. (2014). Noisedifferentially impacts phoneme representations in the auditory andspeech motor systems. Proceedings of the National Academy of Sciencesof the United States of America, 111, 7126–7131. http://dx.doi.org/10.1073/pnas.1318738111
Eriksen, B. A., & Eriksen, C. W. (1974). Effects of noise letters upon theidentification of a target letter in a nonsearch task. Perception & Psy-chophysics, 16, 143–149. http://dx.doi.org/10.3758/BF03203267
Frye, R. E., Fisher, J. M., Coty, A., Zarella, M., Liederman, J., & Halgren,E. (2007). Linear coding of voice onset time. Journal of CognitiveNeuroscience, 19, 1476–1487. http://dx.doi.org/10.1162/jocn.2007.19.9.1476
Gerrits, E., & Schouten, M. E. H. (2004). Categorical perception dependson the discrimination task. Perception & Psychophysics, 66, 363–376.http://dx.doi.org/10.3758/BF03194885
Gershon, R. C., Wagster, M. V., Hendrie, H. C., Fox, N. A., Cook, K. F.,& Nowinski, C. J. (2013). NIH toolbox for assessment of neurologicaland behavioral function. Neurology, 80(11, Suppl. 3), S2–S6. http://dx.doi.org/10.1212/WNL.0b013e3182872e5f
Godfrey, J. J., Syrdal-Lasky, A. K., Millay, K. K., & Knox, C. M. (1981).Performance of dyslexic children on speech perception tests. Journal ofExperimental Child Psychology, 32, 401–424. http://dx.doi.org/10.1016/0022-0965(81)90105-3
Goldinger, S. D. (1998). Echoes of echoes? An episodic theory of lexicalaccess. Psychological Review, 105, 251–279. http://dx.doi.org/10.1037/0033-295X.105.2.251
Gow, D., Jr. (2001). Assimilation and anticipation in continuous spokenword recognition. Journal of Memory and Language, 45, 133–159.http://dx.doi.org/10.1006/jmla.2000.2764
Hickok, G., & Poeppel, D. (2007). The cortical organization of speechprocessing. Nature Reviews Neuroscience, 8, 393–402. http://dx.doi.org/10.1038/nrn2113
Hillenbrand, J. M., Clark, M. J., & Nearey, T. M. (2001). Effects ofconsonant environment on vowel formant patterns. Journal of the Acous-tical Society of America, 109, 748–763. http://dx.doi.org/10.1121/1.1337959
Thi
sdo
cum
ent
isco
pyri
ghte
dby
the
Am
eric
anPs
ycho
logi
cal
Ass
ocia
tion
oron
eof
itsal
lied
publ
ishe
rs.
Thi
sar
ticle
isin
tend
edso
lely
for
the
pers
onal
use
ofth
ein
divi
dual
user
and
isno
tto
bedi
ssem
inat
edbr
oadl
y.
1609INDIVIDUAL DIFFERENCES IN PHONEME CATEGORIZATION
Hillenbrand, J., Getty, L. A., Clark, M. J., & Wheeler, K. (1995). Acousticcharacteristics of American English vowels. Journal of the AcousticalSociety of America, 97, 3099–3111. http://dx.doi.org/10.1121/1.411872
Joanisse, M. F., Manis, F. R., Keating, P., & Seidenberg, M. S. (2000).Language deficits in dyslexic children: Speech perception, phonology,and morphology. Journal of Experimental Child Psychology, 77, 30–60.http://dx.doi.org/10.1006/jecp.1999.2553
Kirchner, W. K. (1958). Age differences in short-term retention of rapidlychanging information. Journal of Experimental Psychology, 55, 352–358. http://dx.doi.org/10.1037/h0043688
Kleinschmidt, D. F., & Jaeger, T. F. (2015). Robust speech perception:Recognize the familiar, generalize to the similar, and adapt to the novel.Psychological Review, 122, 148 –203. http://dx.doi.org/10.1037/a0038695
Kong, E. J., & Edwards, J. (2011). Individual differences in speech per-ception: evidence from visual analogue scaling and eye-tracking. Pro-ceedings of the XVIIth International Congress of Phonetic Sciences,Hong Kong.
Kong, E. J., & Edwards, J. (2016). Individual differences in categoricalperception of speech: Cue weighting and executive function. Journal ofPhonetics, 59, 40–57. http://dx.doi.org/10.1016/j.wocn.2016.08.006
Kronrod, Y., Coppess, E., & Feldman, N. H. (2016). A unified account ofcategorical effects in phonetic perception. Psychonomic Bulletin & Re-view, 23, 1681–1712. http://dx.doi.org/10.3758/s13423-016-1049-y
Liberman, A. M., Harris, K. S., Hoffman, H. S., & Griffith, B. C. (1957).The discrimination of speech sounds within and across phoneme bound-aries. Journal of Experimental Psychology, 54, 358–368. http://dx.doi.org/10.1037/h0044417
Liberman, A. M., Harris, K. S., Kinney, J. A., & Lane, H. (1961). Thediscrimination of relative onset-time of the components of certain speechand nonspeech patterns. Journal of Experimental Psychology, 61, 379–388. http://dx.doi.org/10.1037/h0049038
Liberman, A. M., & Whalen, D. H. (2000). On the relation of speech tolanguage. Trends in Cognitive Sciences, 4, 187–196. http://dx.doi.org/10.1016/S1364-6613(00)01471-6
López-Zamora, M., Luque, J. L., Álvarez, C. J., & Cobos, P. L. (2012).Individual differences in categorical perception are related to sublexical/phonological processing in reading. Scientific Studies of Reading, 16,443–456. http://dx.doi.org/10.1080/10888438.2011.588763
Mahr, T., McMillan, B. T. M., Saffran, J. R., Ellis Weismer, S., &Edwards, J. (2015). Anticipatory coarticulation facilitates word recog-nition in toddlers. Cognition, 142, 345–350. http://dx.doi.org/10.1016/j.cognition.2015.05.009
Massaro, D. W., & Cohen, M. M. (1983). Categorical or continuous speechperception: A new test. Speech Communication, 2, 15–35. http://dx.doi.org/10.1016/0167-6393(83)90061-4
McMurray, B., & Aslin, R. (2004). Anticipatory eye movements revealinfants’ auditory and visual categories. Infancy, 6, 203–229. http://dx.doi.org/10.1207/s15327078in0602_4
McMurray, B., Aslin, R. N., Tanenhaus, M. K., Spivey, M. J., & Subik, D.(2008). Gradient sensitivity to within-category variation in words andsyllables. Journal of Experimental Psychology: Human Perception andPerformance, 34, 1609–1631. http://dx.doi.org/10.1037/a0011747
McMurray, B., & Farris-Trimble, A. (2012). Emergent information-levelcoupling between perception and production. In A. C. Cohn, C. Foug-eron, & M. Huffman (Eds.), The Oxford Handbook of LaboratoryPhonology (pp. 369–395). Oxford, UK: Oxford University Press.
McMurray, B., & Jongman, A. (2011). What information is necessary forspeech categorization? Harnessing variability in the speech signal byintegrating cues computed relative to expectations. Psychological Re-view, 118, 219–246. http://dx.doi.org/10.1037/a0022325
McMurray, B., & Jongman, A. (2016). What comes after /f/? Prediction inspeech derives from data-explanatory processes. Psychological Science,27, 43–52. http://dx.doi.org/10.1177/0956797615609578
McMurray, B., Munson, C., & Tomblin, J. B. (2014). Individual differ-ences in language ability are related to variation in word recognition, notspeech perception: Evidence from eye movements. Journal of Speech,Language, and Hearing Research, 57, 1344–1362. http://dx.doi.org/10.1044/2014_JSLHR-L-13-0196
McMurray, B., Samelson, V. M., Lee, S. H., & Bruce Tomblin, J. (2010).Individual differences in online spoken word recognition: Implicationsfor SLI. Cognitive Psychology, 60, 1–39. http://dx.doi.org/10.1016/j.cogpsych.2009.06.003
McMurray, B., Tanenhaus, M. K., & Aslin, R. N. (2002). Gradient effects ofwithin-category phonetic variation on lexical access. Cognition, 86(2), B33–B42. http://dx.doi.org/10.1016/S0010-0277(02)00157-9
McMurray, B., Tanenhaus, M. K., & Aslin, R. N. (2009). Within-categoryVOT affects recovery from “lexical” garden paths: Evidence againstphoneme-level inhibition. Journal of Memory and Language, 60, 65–91.http://dx.doi.org/10.1016/j.jml.2008.07.002
Messaoud-Galusi, S., Hazan, V., & Rosen, S. (2011). Investigating speechperception in children with dyslexia: Is there evidence of a consistentdeficit in individuals? Journal of Speech, Language, and Hearing Re-search, 54, 1682–1701. http://dx.doi.org/10.1044/1092-4388(2011/09-0261)
Miller, J. L., Green, K. P., & Reeves, A. (1986). Speaking rate andsegments: A look at the relation between speech production and speechperception for the voicing contrast. Phonetica, 43(1–3), 106–115. http://dx.doi.org/10.1159/000261764
Miller, J. L. (1997). Internal structure of phonetic categories. Languageand cognitive processes, 12(5-6), 865–870. http://dx.doi.org/10.1080/016909697386754
Miller, J. L., & Volaitis, L. E. (1989). Effect of speaking rate on theperceptual structure of a phonetic category. Perception & Psychophys-ics, 46, 505–512. http://dx.doi.org/10.3758/BF03208147
Moberly, A. C., Lowenstein, J. H., & Nittrouer, S. (2016). Word recogni-tion variability with cochlear implants: “Perceptual attention” versus“auditory sensitivity”. Ear and Hearing, 37, 14–26. http://dx.doi.org/10.1097/AUD.0000000000000204
Myers, E. B., Blumstein, S. E., Walsh, E., & Eliassen, J. (2009). Inferiorfrontal regions underlie the perception of phonetic category invariance.Psychological Science, 20, 895–903. http://dx.doi.org/10.1111/j.1467-9280.2009.02380.x
Nearey, T., & Hogan, J. (1986). Phonological contrast in experimentalphonetics: Relating distributions of production data to perceptual cate-gorization curves. In J. J. Ohala & J. J. J (Eds.), Experimental Phonology(pp. 141–146). Orlando, FL: Academic Press.
Oden, G. C., & Massaro, D. W. (1978). Integration of featural informationin speech perception. Psychological Review, 85, 172–191. http://dx.doi.org/10.1037/0033-295X.85.3.172
Ohala, J. J. (1996). Speech perception is hearing sounds, not tongues.Journal of the Acoustical Society of America, 99, 1718–1725. http://dx.doi.org/10.1121/1.414696
Ojemann, G., Ojemann, J., Lettich, E., & Berger, M. (1989). Corticallanguage localization in left, dominant hemisphere: An electrical stim-ulation mapping investigation in 117 patients. Journal of Neurosurgery,71, 316–326. http://dx.doi.org/10.3171/jns.1989.71.3.0316
Phillips, C., Pellathy, T., Marantz, A., Yellin, E., Wexler, K., Poeppel, D.,. . . Roberts, T. (2000). Auditory cortex accesses phonological catego-ries: An MEG mismatch study. Journal of Cognitive Neuroscience, 12,1038–1055. http://dx.doi.org/10.1162/08989290051137567
Pisoni, D. B., & Lazarus, J. H. (1974). Categorical and noncategoricalmodes of speech perception along the voicing continuum. Journal of theAcoustical Society of America, 55, 328–333. http://dx.doi.org/10.1121/1.1914506
Pisoni, D. B., & Tash, J. (1974). Reaction times to comparisons within andacross phonetic categories. Perception & Psychophysics, 15, 285–290.http://dx.doi.org/10.3758/BF03213946
Thi
sdo
cum
ent
isco
pyri
ghte
dby
the
Am
eric
anPs
ycho
logi
cal
Ass
ocia
tion
oron
eof
itsal
lied
publ
ishe
rs.
Thi
sar
ticle
isin
tend
edso
lely
for
the
pers
onal
use
ofth
ein
divi
dual
user
and
isno
tto
bedi
ssem
inat
edbr
oadl
y.
1610 KAPNOULA, WINN, KONG, EDWARDS, AND MCMURRAY
Repp, B. H. (1982). Phonetic trading relations and context effects: Newexperimental evidence for a speech mode of perception. PsychologicalBulletin, 92, 81–110. http://dx.doi.org/10.1037/0033-2909.92.1.81
Repp, B. (1984). Categorical perception: Issues, methods, findings. Speechand Language: Advances in Basic Research and Practice, 10, 243–335.http://dx.doi.org/10.1016/B978-0-12-608610-2.50012-1
Robertson, E. K., Joanisse, M. F., Desroches, A. S., & Ng, S. (2009).Categorical speech perception deficits distinguish language and readingimpairments in children. Developmental Science, 12, 753–767. http://dx.doi.org/10.1111/j.1467-7687.2009.00806.x
Salverda, A. P., Kleinschmidt, D., & Tanenhaus, M. K. (2014). Immediateeffects of anticipatory coarticulation in spoken-word recognition. Jour-nal of Memory and Language, 71, 145–163. http://dx.doi.org/10.1016/j.jml.2013.11.002
Sams, M., Aulanko, R., Aaltonen, O., & Näätänen, R. (1990). Event-related potentials to infrequent changes in synthesized phonetic stimuli.Journal of Cognitive Neuroscience, 2, 344–357. http://dx.doi.org/10.1162/jocn.1990.2.4.344
Schellinger, S. K., Edwards, J., Munson, B., & Beckman, M. E. (2008,November). Assessment of children’s speech production 1: Transcrip-tion categories and listener expectations. Poster presented at the 2008ASHA Convention, Chicago, IL.
Schellinger, S. K., Munson, B., & Edwards, J. (2017). Gradient perceptionof children’s productions of /s/ and /�/: A comparative study of ratingmethods. Clinical Linguistics & Phonetics, 31, 80–103. http://dx.doi.org/10.1080/02699206.2016.1205665
Schouten, B., Gerrits, E., & van Hessen, A. (2003). The end of categoricalperception as we know it. Speech Communication, 41, 71–80. http://dx.doi.org/10.1016/S0167-6393(02)00094-8
Schouten, M. E. H., & van Hessen, A. J. (1992). Modeling phonemeperception. I: Categorical perception. Journal of the Acoustical Societyof America, 92, 1841–1855. http://dx.doi.org/10.1121/1.403841
Serniclaes, W. (2006). Allophonic perception in developmental dyslexia:Origin, reliability and implications of the categorical perception deficit.Written Language and Literacy, 9, 135–152. http://dx.doi.org/10.1075/wll.9.1.09ser
Serniclaes, W., Sprenger-Charolles, L., Carré, R., & Demonet, J. F. (2001).Perceptual discrimination of speech sounds in developmental dyslexia.Journal of Speech, Language, and Hearing Research, 44, 384–399.http://dx.doi.org/10.1044/1092-4388(2001/032)
Serniclaes, W., Van Heghe, S., Mousty, P., Carré, R., & Sprenger-Charolles, L. (2004). Allophonic mode of speech perception in dyslexia.Journal of Experimental Child Psychology, 87, 336–361. http://dx.doi.org/10.1016/j.jecp.2004.02.001
Serniclaes, W., Ventura, P., Morais, J., & Kolinsky, R. (2005). Categoricalperception of speech sounds in illiterate adults. Cognition, 98(2), B35–B44. http://dx.doi.org/10.1016/j.cognition.2005.03.002
Spahr, A. J., Dorman, M. F., Litvak, L. M., Van Wie, S., Gifford, R. H.,Loizou, P. C., . . . Cook, S. (2012). Development and validation of theAzBio sentence lists. Ear and Hearing, 33, 112–117. http://dx.doi.org/10.1097/AUD.0b013e31822c2549
Summerfield, Q., & Haggard, M. (1977). On the dissociation of spectraland temporal cues to the voicing distinction in initial stop consonants.Journal of the Acoustical Society of America, 62, 435–448. http://dx.doi.org/10.1121/1.381544
Sussman, J. E. (1993). Perception of formant transition cues to place ofarticulation in children with language impairments. Journal of SpeechLanguage and Hearing Research, 36, 1286–1299. http://dx.doi.org/10.1044/jshr.3606.1286
Tombaugh, T. N. (2004). Trail making test A and B: Normative datastratified by age and education. Archives of Clinical Neuropsychology,19, 203–214. http://dx.doi.org/10.1016/S0887-6177(03)00039-8
Toscano, J. C., McMurray, B., Dennhardt, J., & Luck, S. J. (2010).Continuous perception and graded categorization: Electrophysiologicalevidence for a linear relationship between the acoustic signal and per-ceptual encoding of speech. Psychological Science, 21, 1532–1540.http://dx.doi.org/10.1177/0956797610384142
Urberg-Carlson, K., Kaiser, E., & Munson, B. (2008, November).Assessment of children’s speech production 2: Testing gradient mea-sures of children’s productions. Poster presented at the 2008 ASHAConvention, Chicago, IL.
Utman, J. A., Blumstein, S. E., & Burton, M. W. (2000). Effects ofsubphonetic and syllable structure variation on word recognition.Perception & Psychophysics, 62, 1297–1311. http://dx.doi.org/10.3758/BF03212131
Werker, J. F., & Tees, R. C. (1987). Speech perception in severely disabledand average reading children. Canadian Journal of Psychology, 41,48–61. http://dx.doi.org/10.1037/h0084150
Winn, M. B., Chatterjee, M., & Idsardi, W. J. (2013). Roles of voice onsettime and F0 in stop consonant voicing perception: Effects of maskingnoise and low-pass filtering. Journal of Speech, Language, and HearingResearch, 56, 1097–1107. http://dx.doi.org/10.1044/1092-4388(2012/12-0086)
Winn, M. B., & Litovsky, R. Y. (2015). Using speech sounds to testfunctional spectral resolution in listeners with cochlear implants. Journalof the Acoustical Society of America, 137, 1430–1442. http://dx.doi.org/10.1121/1.4908308
Wu, Y.-H., Stangl, E., Zhang, X., Perkins, J., & Eilers, E. (2016). Psycho-metric Functions of Dual-Task Paradigms for Measuring Listening Ef-fort. Ear and Hearing, 37, 660–670. http://dx.doi.org/10.1097/AUD.0000000000000335
Yeni-Komshian, G. H., & Soli, S. D. (1981). Recognition of vowels frominformation in fricatives: Perceptual evidence of fricative-vowel coar-ticulation. Journal of the Acoustical Society of America, 70, 966–975.http://dx.doi.org/10.1121/1.387031
Zekveld, A. A., & Kramer, S. E. (2014). Cognitive processing load acrossa wide range of listening conditions: Insights from pupillometry. Psy-chophysiology, 51, 277–284. http://dx.doi.org/10.1111/psyp.12151
Received March 7, 2016Revision received January 29, 2017
Accepted January 30, 2017 �
Thi
sdo
cum
ent
isco
pyri
ghte
dby
the
Am
eric
anPs
ycho
logi
cal
Ass
ocia
tion
oron
eof
itsal
lied
publ
ishe
rs.
Thi
sar
ticle
isin
tend
edso
lely
for
the
pers
onal
use
ofth
ein
divi
dual
user
and
isno
tto
bedi
ssem
inat
edbr
oadl
y.
1611INDIVIDUAL DIFFERENCES IN PHONEME CATEGORIZATION