EVALUATING THE ROLE OF RACE IN CRIMINAL JUSTICE ...
39
EVALUATING THE ROLE OF RACE IN CRIMINAL JUSTICE ADJUDICATIONS IN DELAWARE FINAL REPORT September 19, 2016 Prepared by John M. MacDonald, Ph.D. Ellen A. Donnelly, Ph.D. Department of Criminology School of Arts and Sciences University of Pennsylvania Submitted to Chief Justice of the Delaware Supreme Court & Delaware Access to Justice Commission’s Subcommittee on Fairness in the Adult Criminal Justice System
Transcript of EVALUATING THE ROLE OF RACE IN CRIMINAL JUSTICE ...
EVALUATING THE ROLE OF RACE
IN CRIMINAL JUSTICE ADJUDICATIONS IN DELAWARE
FINAL REPORT September 19, 2016
Prepared by John M. MacDonald, Ph.D. Ellen A. Donnelly, Ph.D.
Department of Criminology School of Arts and Sciences University of Pennsylvania
Submitted to Chief Justice of the Delaware Supreme Court & Delaware Access to Justice Commission’s
Subcommittee on Fairness in the Adult Criminal Justice System
2
ACKNOWLEDGMENTS This work was supported by a contract from the Delaware Administrative Office of the Courts (AOC) to the University of Pennsylvania (Penn). The authors thank Chief Justice Leo E. Strine, Jr. for initiating this project in conjunction with the Delaware Access to Justice Commission’s Subcommittee on Fairness in the Adult Criminal Justice System. We thank the Chief Justice and members of the subcommittee for the constructive comments they provided. We acknowledge the special assistance in accessing the Delaware Criminal Justice Information System (DELJIS) and the details of the data from Executive Director Peggy Bell and Operations Manager Lynn Gedney. Special thanks are also due to Deputy State Court Administrator Amy Quinlan for coordinating data access and project funding and Research and Planning Coordinator Patti Mattson for overseeing the project. The opinions in the report are those of the authors and do not reflect the official positions of the AOC or the Penn. This study was approved by the Penn institutional review board.

3
EXECUTIVE SUMMARY
In Delaware, African Americans are overrepresented throughout the criminal justice system. Data from 2012 to 2014 show that African Americans represent 22% of the state’s general population, 42% of arrestees, 42% of criminal dispositions, 51% of incarceration sentences, and 57% of Delaware’s incarcerated population.
Previous studies have examined African Americans’ overrepresentation in the Delaware criminal justice system by highlighting aggregate differences in the state’s arrest and incarcerated population relative to its general population,1 or differences in incarcerated individuals relative to those arrested for common felony offenses.2 This study expands on these earlier efforts by conducting a more fine-grained analysis that tracks outcomes among all adults arrested for criminal offenses in Delaware between 2012 and 2014. Using detailed administrative data, the study was able to measure important information related to the case and defendant characteristics of each arrest that is processed in the Delaware state courts.
This study examined criminal justice adjudications in Delaware to determine the extent to which race played a role in an arrestee’s final disposition to incarceration (i.e. a SENTAC Level V sentence) and length of an incarceration sentence. The study calculated the size of disparities between Whites and African Americans arrested at each stage of criminal procedure in Delaware. The study then documented the extent to which observable case-level factors reduced disparities in incarceration sentences and sentence lengths. The study assessed what racial disparities in incarceration sentences and sentence lengths would look if White defendants had the same case-level characteristics as African American defendants. The study also estimated the evolution of African American-White disparities in incarceration as criminal histories accumulate.
The study found there were significant disparities in incarceration sentences and sentence lengths for African Americans relative to Whites arrested on criminal offenses. These disparities decreased substantially to levels that were practically small after controlling for current charge and case characteristics, contextual information related to county location, detention between arrest and disposition, and criminal history. The African American-White incarceration sentence disparity was 60% before controlling for other variables. When African American defendants were compared to similarly situated White defendants the relative disparity in incarceration sentences was reduced to 11%, a raw difference of less than 1%. Similarly, the average incarceration sentence length was 40% longer for African Americans relative to Whites when no other factors were considered. When African American defendants were compared to similarly situated White defendants, the relative difference in incarceration sentence length was reduced to an 11% difference, or approximately 39 days, which is no longer statistically significant. When racial disparities are estimated that gave Whites the same characteristics as African American defendants, differences in incarceration sentencing were largely driven by current charge and case characteristics and contextual factors. African American-White differences in
1 Eichler, Thomas. 2005. Race and Incarceration in Delaware: A Preliminary Consideration. Available: http://www.prisonpolicy.org/scans/RaceIncarceration.pdf 2 Delaware Statistical Analysis Center. 2011. Race and Incarceration: A Report to the Delaware General Assembly. Available: https://sentencing.umn.edu/sites/sentencing.umn.edu/files/race_incarceration.pdf
4
the probability of incarceration can be specifically attributed to differences in arrest charges, detention between arrest and final disposition, having a juvenile criminal record, county location, and the number of prior arrests. Differences in sentence length are accounted for primarily by arrest charge types and the seriousness of arrest charges.
Examination of the evolution of criminal histories shows that as defendants accumulate criminal histories, their probability of incarceration increases, but racial differences do not change. An analysis of defendants first arrested in 2002-2004 and rearrested in 2012-2014, shows an elevated risk of receiving an incarceration sentence with each successive arrest. Differences between African American and White defendants in the probability of incarceration are constant across successive arrests, showing that racial disparities in the 2012-2014 period are not uniquely impacted by earlier arrests.
The results of this study suggest that current charge and case characteristics from the arrest stage are the primary drivers of racial disparities in incarceration sentences and sentence length. Contextual factors related to county location and detention between arrest and court disposition are important, but less influential contributors to racial differences in incarceration sentencing. Taking into account these three sets of case-level factors suggests that discretion in criminal processing after arrests plays little role in explaining the relatively high rates of African Americans serving an incarceration sentence in Delaware in 2012-2014. The results indicate that criminal justice system reform efforts to reduce racial disparities in incarceration in Delaware will need to focus on how sentences are determined.
5
TABLE OF CONTENTS
EXECUTIVE SUMMARY ............................................................................................................ 3
TABLE OF CONTENTS ................................................................................................................ 5
LIST OF TABLES AND FIGURES............................................................................................... 6
INTRODUCTION .......................................................................................................................... 7
BACKGROUND ............................................................................................................................ 8
DATA ........................................................................................................................................... 11
GEOGRAPHIC PATTERNS OF ARRESTS ............................................................................... 12
RACIAL DISPARITIES AT DIFFERENT CRIMINAL PROCESSING STAGES ................... 13
STATISTICAL METHODS FOR ESTIMATING DISPARITIES IN INCARCERATION ....... 17
THE EVOLUTION OF RACIAL DISPARITIES IN INCARCERATION SENTENCES AND CRIMINAL HISTORY ................................................................................................................ 29
CONCLUSION ............................................................................................................................. 30
APPENDIX ................................................................................................................................... 33
6
LIST OF TABLES AND FIGURES TABLE 1: RACIAL COMPOSITION OF ARREST CASES IN ANALYTIC DATABASE, DELAWARE (2012-
2014) ..................................................................................................................................... 12 TABLE 2: SENTENCING LEVELS IN THE DELAWARE JUSTICE SYSTEM ............................................ 15 TABLE 3: AVERAGES AND PROPORTIONS FOR ARRESTS, DELAWARE (2012-2014) ........................ 19 TABLE 4: PROBABILITY OF INCARCERATION, DELAWARE (2012-2014) ......................................... 23 TABLE 5: EFFECTIVE LENGTH OF INCARCERATION SENTENCE IN DAYS, DELAWARE (2012-2014) 23 TABLE 6: DECOMPOSITION OF INCARCERATION FOR WHITE AND AFRICAN AMERICAN DEFENDANTS,
DELAWARE (2012-2014) ....................................................................................................... 25 TABLE 7: DECOMPOSITION OF EFFECTIVE LENGTH OF INCARCERATION SENTENCE IN DAYS FOR
WHITE AND AFRICAN AMERICAN DEFENDANTS, DELAWARE (2012-2014) ........................... 27 FIGURE 1: DELAWARE INCARCERATED POPULATION (1978-2014) .................................................. 9 FIGURE 2: RACIAL COMPOSITION OF PERSONS IN CUSTODY, DELAWARE (1978-2014) ................. 10 FIGURE 3: ARREST AND POPULATION CHARACTERISTICS OF DELAWARE, 2012-2014 ................... 13 FIGURE 4: RACIAL COMPOSITION OF CASES IN CRIMINAL PROCESSING ......................................... 14 FIGURE 5: RACIAL COMPOSITION OF SENTENCES, DELAWARE (2012-2014) .................................. 16 FIGURE 6: PREDICTED PROBABILITY OF INCARCERATION, DELAWARE (2012-2014) ..................... 21 FIGURE 7: EFFECTIVE LENGTH OF INCARCERATION SENTENCES IN DAYS, DELAWARE (2012-2014)
............................................................................................................................................... 22 FIGURE 8: DECOMPOSITION OF DIFFERENCES IN PROBABILITY OF INCARCERATION ...................... 26 FIGURE 9: DECOMPOSITION OF DIFFERENCES IN EFFECTIVE LENGTH OF INCARCERATION SENTENCE
............................................................................................................................................... 28 FIGURE 10: PREDICTED PROBABILITY OF INCARCERATION, ARRESTEE COHORT OF 2002-2004 .... 30
7
INTRODUCTION
African Americans are overrepresented in the criminal justice system of Delaware. African Americans represent 22% of the population of residents in Delaware.3 Data from 2012-2014 show that African Americans represent roughly 42% of arrests, 42% of criminal convictions, and 51% of incarceration sentences.4 During this time, approximately 57% of inmates serving time in the Delaware Department of Correction (DOC)’s facilities were African American.5 Despite substantial evidence of African American overrepresentation in Delaware’s correctional system, the sources of these disparities remain largely unknown. It remains unclear if the overrepresentation of African Americans among the state’s incarcerated population is the consequence of discretion at key decision points between arrest and sentencing, or if it is an artifact of some common case-level factors that decrease their eligibility for community corrections. Understanding factors that limit access to probation and other community-based corrections options for minority populations in Delaware is important for designing policies that reduce racial disparities in those sentenced to incarceration and maintain public safety.
Using the population of adults arrested in Delaware from 2012 to 2014, this study investigates racial disparities in criminal adjudications that lead to incarceration sentences. Incarceration refers to a SENTAC Level V sentence that involves jail (i.e. a sentence of one year or less), prison (i.e. a sentence of over one year), or life or death in Delaware’s unified correctional system. This study relies on administrative records to track individuals from their arrest to their corresponding court dispositions, and examines the extent to which observed racial disparities in incarceration sentences and sentence lengths remain after statistically controlling for current case and charge characteristics, contextual factors, and criminal history. This study also details what racial disparities in incarceration commitments and sentences lengths would look like if White defendants had similar characteristics as African American defendants. Finally, this study analyzes the extent to which disparities between African American and White defendants in incarceration sentences unfold as criminal histories accumulate.
The results from this study indicate there are significant disparities in incarceration sentences and sentence lengths for African Americans relative to Whites. These disparities decreased to levels that were practically small for sentences to incarceration in a multivariate regression model that controlled for current case and charge characteristics, criminal history, and contextual factors (gender, age, county location, public defender, and pretrial detention), as well as a multivariate reweighting method that compared African Americans to similarly situated Whites. In both comparisons the unexplained differences in the probability of receiving an incarceration sentence were less than 1% (0.5%). The disparities in effective length of incarceration sentences decreased overall to levels (under 40 days) that were no longer statistically significant in the multivariate regression model, as well as the reweighting method that compared African Americans to similarly situated Whites. 3 U.S. Census Bureau. QuickFacts: Delaware 2014. Available: http://www.census.gov/quickfacts/chart/RHI225214/10 4 Authors’ calculations from final analytic file using DELJIS records. 5 Authors’ calculations from U.S. Bureau of Justice Statistics. 2014. National Prisoner Statistics, 1978-2014. Available: http://www.icpsr.umich.edu/icpsrweb/NACJD/studies/36281.
8
A decomposition of the racial disparity in incarceration sentences shows that African American and White differences in the probability of incarceration are explained by differences in the seriousness of arrest charges, the type of arrest charge, county location, gender (more males), pretrial detention, and criminal history factors. For incarceration sentence lengths, a decomposition of the racial disparity shows differences between African Americans and Whites in severity of arrest charge, type of arrest charge, and prior felony convictions account for most of the differences in sentenced days.
A comparison of the evolution of criminal histories for African Americans and Whites, for those with arrests dating back to 2002, shows that the probability of incarceration increases with successive arrests. These differences grow over time for African Americans relative to Whites, but they do not diverge in any substantive way at earlier stages of criminal history.
Disparities in incarceration sentences and sentence lengths have resulted in African Americans becoming an increasingly prevalent group of inmates serving time in Delaware’s correctional system. The results from this study suggest that the racial disparity in incarceration is driven by differences between African American and White defendants in their arrest charges and case characteristics followed by distinctions in the context of cases, including county location and pretrial detention. Differences in accumulated criminal histories matter to a lesser degree in incarceration sentencing. After considering these three sets of case-level factors, discretion between arrest and conviction appears to play less of a role in explaining African American-White disparities in incarceration. The results indicate that criminal justice system reform efforts to reduce racial disparities in incarceration in Delaware will need to focus on how sentences are determined.
BACKGROUND
Criminal justice policy in Delaware has followed national trends of sentencing reform over the past five decades. Delaware established its statewide adult correctional system in 1956 and opened the Delaware Correctional Center for adult males in 1971. Changes to sentencing laws in the 1970s and 1980s expanded the use of incarceration sentences and prison capacities. The Delaware General Assembly introduced numerous mandatory minimum statutes that stipulated incarceration sentences could not be suspended for community corrections alternatives like intensive supervised probation and partial confinement. The Truth in Sentence Act of 1989 also required minimums for time served in jail or prison. By 1991, Delaware possessed over 220 mandatory minimum sentencing provisions affecting criminal penalties, sentence lengths, and the treatment of repeat offenders.6 Prison populations subsequently swelled. Throughout the 1990s, the state ranked among the highest in the nation for rates of incarceration, longest percentages of time served for incarceration sentences, and levels of prison overcrowding.7
6 U.S. Bureau of Justice Statistics. 1992. Mandatory Sentencing in Delaware 1981-1991. Available: http://www.bjs.gov/content/pub/pdf/msd8191.pdf 7 Boyer, William and Edward Ratledge. 2013. Pivotal Policies in Delaware: From Desegregation to Deregulation. Newark: University of Delaware Press.
9
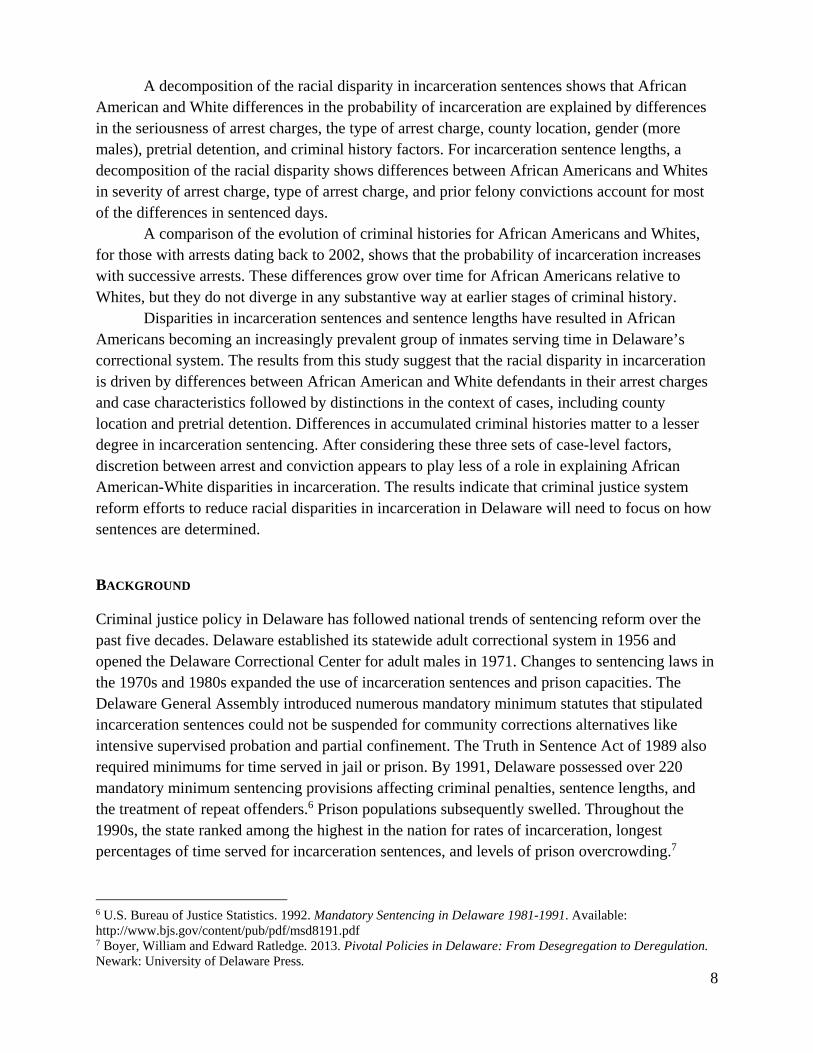
Figure 1 shows the state’s yearend jail and prison population grew nearly 500% over a 30-year period, from 1,375 inmates in 1978 to a peak of 7,257 inmates in 2007.8 Interest in reducing the size of Delaware’s incarcerated population has motivated recent sentencing reforms, such as the Drug Law Reform Bill (H.B. 19) that reduces mandatory minimum sentences for drug involved-offenses.9 Figure 1: Delaware Incarcerated Population (1978-2014)
African Americans have been the most affected demographic group in the growth of
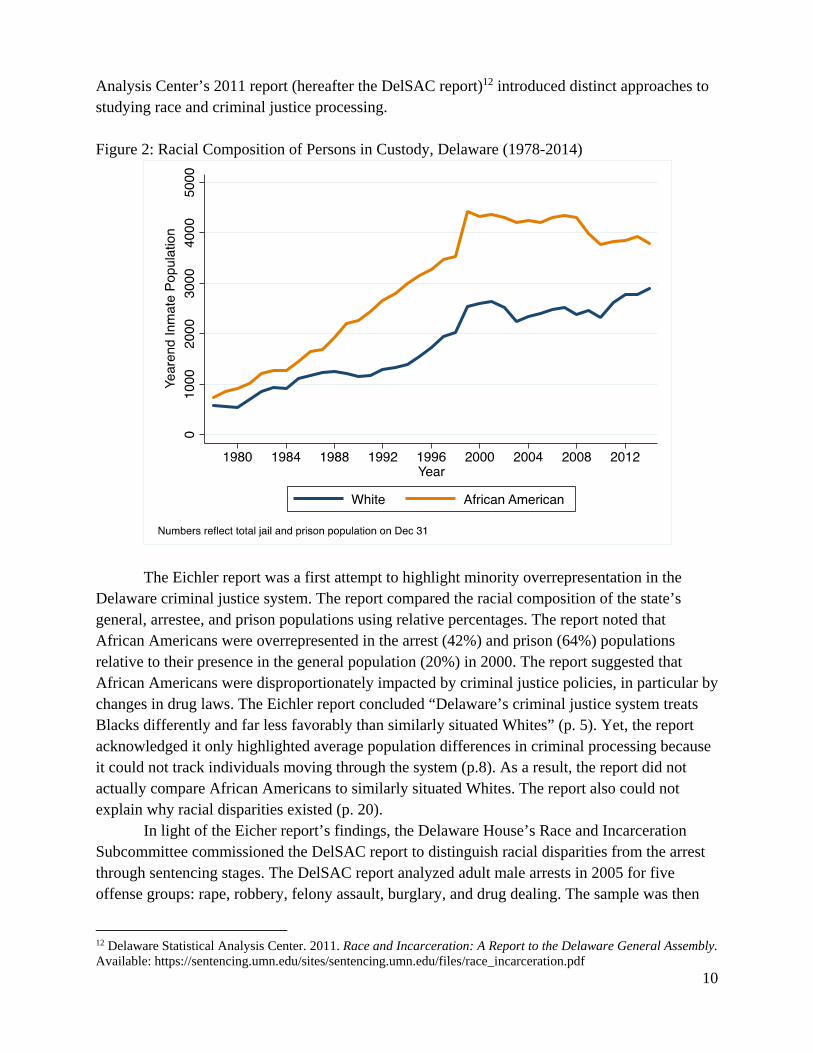
Delaware’s incarcerated population. Figure 2 shows the growth in the total number of White and African Americans persons in custody for Delaware from 1978-2014.10 During this time of massive prison growth, the share of incarcerated African Americans has remained larger than that of Whites. African Americans represented an average of 65% of persons in custody over this period. Racial disparities in the Delaware criminal justice system have been previously explored by two studies. Eichler’s 2005 report (hereafter the Eichler report)11 and the Delaware Statistical
8 Authors’ calculations from U.S. Bureau of Justice Statistics. 2014. Corrections Statistical Analysis Tool-Prisoners. Available: http://www.bjs.gov/index.cfm?ty=nps. Because prisons and jails form an integrated system in Delaware, custody counts include jail and prison inmates. 9 House of Representatives, 146th General Assembly of the State of Delaware. 2011. “An Act To Amend Titles 10, 11, 16 and 21 of the Delaware Code Relating to Drug- Involved Offenses.” Available: https://static.votesmart.org/static/billtext/34405.pdf 10 Author’s calculations from U.S. Bureau of Justice Statistics. 2014. National Prisoner Statistics, 1978-2014. Available: http://www.icpsr.umich.edu/icpsrweb/NACJD/studies/36281 11 Eichler, Thomas. 2005. Race and Incarceration in Delaware: A Preliminary Consideration. Available: http://www.prisonpolicy.org/scans/RaceIncarceration.pdf
10
Analysis Center’s 2011 report (hereafter the DelSAC report)12 introduced distinct approaches to studying race and criminal justice processing.
Figure 2: Racial Composition of Persons in Custody, Delaware (1978-2014)
The Eichler report was a first attempt to highlight minority overrepresentation in the
Delaware criminal justice system. The report compared the racial composition of the state’s general, arrestee, and prison populations using relative percentages. The report noted that African Americans were overrepresented in the arrest (42%) and prison (64%) populations relative to their presence in the general population (20%) in 2000. The report suggested that African Americans were disproportionately impacted by criminal justice policies, in particular by changes in drug laws. The Eichler report concluded “Delaware’s criminal justice system treats Blacks differently and far less favorably than similarly situated Whites” (p. 5). Yet, the report acknowledged it only highlighted average population differences in criminal processing because it could not track individuals moving through the system (p.8). As a result, the report did not actually compare African Americans to similarly situated Whites. The report also could not explain why racial disparities existed (p. 20).
In light of the Eicher report’s findings, the Delaware House’s Race and Incarceration Subcommittee commissioned the DelSAC report to distinguish racial disparities from the arrest through sentencing stages. The DelSAC report analyzed adult male arrests in 2005 for five offense groups: rape, robbery, felony assault, burglary, and drug dealing. The sample was then
12 Delaware Statistical Analysis Center. 2011. Race and Incarceration: A Report to the Delaware General Assembly. Available: https://sentencing.umn.edu/sites/sentencing.umn.edu/files/race_incarceration.pdf

11
narrowed by offense severity to only include class A through F felonies. The report indicated that African Americans constitute a larger proportion of arrests for these offense groups (58%) than for all offenses (42%). The racial disparity in arrests for these offenses was largely similar to racial differences found in crime complaints in Delaware in which the victims reported the perceived race of offenders. The report found that African Americans were less likely to be convicted of class A through F felonies. If convicted, African Americans were more likely than Whites to receive a sentence of incarceration. The report noted that African Americans were more likely than Whites to have prior felony arrests. The DelSAC report concluded it is possible that current case characteristics and criminal history are important contributors to African American-White disparities at various criminal processing stages. The DelSAC report, however, did not compare sentencing outcomes for African American defendants to similarly situated White defendants arrested for all offense types.
This study improves on previous efforts to explore African American-White disparities in the Delaware justice system in several ways. First, this study examines all adult arrests and sentencing outcomes between 2012 and 2014. As a result, the study is able to track the same cases among individuals from the point of arrest to final court disposition. The study is able to compare African American-White disparities in the criminal adjudication process with a more fine-grained analysis than earlier research in Delaware. The study is able to examine court dispositions to incarceration, taking into account the most serious charge, the types of charges, and the presence of a violation of probation charge for each arrest and disposed case. Such characteristics of current cases and charges could contribute to racial disparities in incarceration sentences in Delaware. Additionally, this study is able to account for various prior contacts with the Delaware criminal justice system found in a defendant’s criminal history. Contact is measured from a defendant’s juvenile records, prior arrests, and prior convictions by type/offense severity. These factors are supplemented with other contextual factors, such as a defendant’s age, gender, pretrial detention, and legal representation by a public defender. By taking into consideration current case and charge characteristics, criminal history, and contextual factors, the study can better approximate criminal justice decision-making and assess sources for racial disparities in incarceration in Delaware.
DATA
This study relies on data from the Delaware Criminal Justice Information System (DELJIS). All criminal arrests and traffic violations involving D.U.I. between 2012 and 2014 were requested. All juveniles who were arrested before the age of 18 were excluded from the analysis file, regardless of whether the juveniles were processed as adults.13 The total analytic database included 140,627 adult arrests. A final analytic database was then created to include cases with no missing information on the key defendant and case characteristics used in the subsequent analyses. The final analytic database consisted of 127,204 adult arrests with 395,828
13 Only 188 cases in the DELJIS records involved individuals arrested under the age of 18 and processed by the superior courts, which is the best signal in the data that a juvenile was treated as an adult.
12
charges and 67,675 distinct persons that contained information on all current charge and case characteristics, contextual factors, and criminal history factors.14 These figures show that an individual often faces multiple charges on a single arrest, and that the same individuals are arrested multiple times.
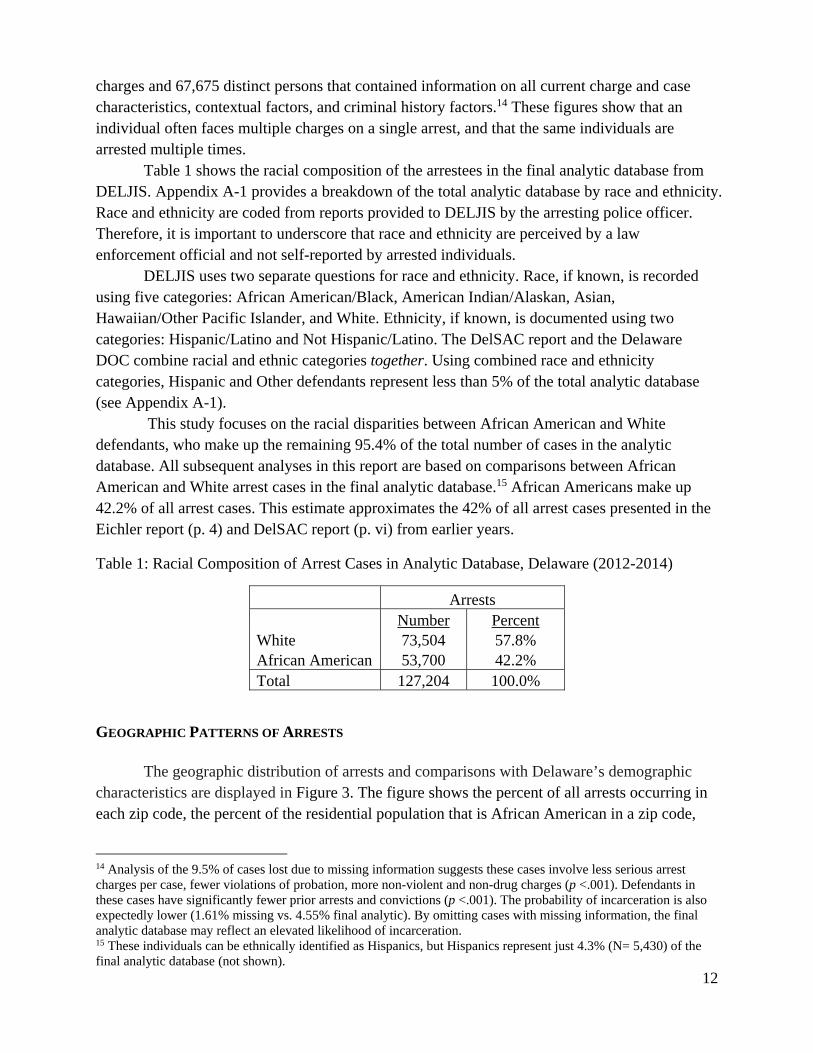
Table 1 shows the racial composition of the arrestees in the final analytic database from DELJIS. Appendix A-1 provides a breakdown of the total analytic database by race and ethnicity. Race and ethnicity are coded from reports provided to DELJIS by the arresting police officer. Therefore, it is important to underscore that race and ethnicity are perceived by a law enforcement official and not self-reported by arrested individuals.
DELJIS uses two separate questions for race and ethnicity. Race, if known, is recorded using five categories: African American/Black, American Indian/Alaskan, Asian, Hawaiian/Other Pacific Islander, and White. Ethnicity, if known, is documented using two categories: Hispanic/Latino and Not Hispanic/Latino. The DelSAC report and the Delaware DOC combine racial and ethnic categories together. Using combined race and ethnicity categories, Hispanic and Other defendants represent less than 5% of the total analytic database (see Appendix A-1).
This study focuses on the racial disparities between African American and White defendants, who make up the remaining 95.4% of the total number of cases in the analytic database. All subsequent analyses in this report are based on comparisons between African American and White arrest cases in the final analytic database.15 African Americans make up 42.2% of all arrest cases. This estimate approximates the 42% of all arrest cases presented in the Eichler report (p. 4) and DelSAC report (p. vi) from earlier years.
Table 1: Racial Composition of Arrest Cases in Analytic Database, Delaware (2012-2014)
Arrests Number Percent White 73,504 57.8% African American 53,700 42.2% Total 127,204 100.0%
GEOGRAPHIC PATTERNS OF ARRESTS
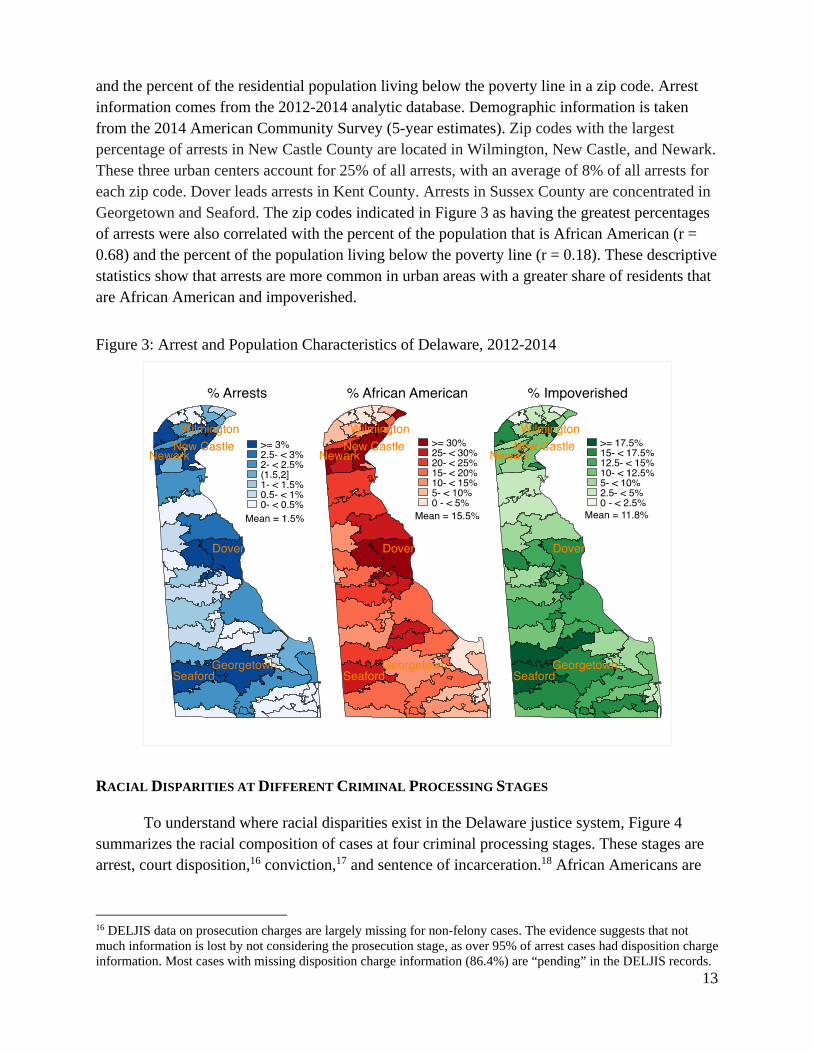
The geographic distribution of arrests and comparisons with Delaware’s demographic characteristics are displayed in Figure 3. The figure shows the percent of all arrests occurring in each zip code, the percent of the residential population that is African American in a zip code,
14 Analysis of the 9.5% of cases lost due to missing information suggests these cases involve less serious arrest charges per case, fewer violations of probation, more non-violent and non-drug charges (p <.001). Defendants in these cases have significantly fewer prior arrests and convictions (p <.001). The probability of incarceration is also expectedly lower (1.61% missing vs. 4.55% final analytic). By omitting cases with missing information, the final analytic database may reflect an elevated likelihood of incarceration. 15 These individuals can be ethnically identified as Hispanics, but Hispanics represent just 4.3% (N= 5,430) of the final analytic database (not shown).
13
and the percent of the residential population living below the poverty line in a zip code. Arrest information comes from the 2012-2014 analytic database. Demographic information is taken from the 2014 American Community Survey (5-year estimates). Zip codes with the largest percentage of arrests in New Castle County are located in Wilmington, New Castle, and Newark. These three urban centers account for 25% of all arrests, with an average of 8% of all arrests for each zip code. Dover leads arrests in Kent County. Arrests in Sussex County are concentrated in Georgetown and Seaford. The zip codes indicated in Figure 3 as having the greatest percentages of arrests were also correlated with the percent of the population that is African American (r = 0.68) and the percent of the population living below the poverty line (r = 0.18). These descriptive statistics show that arrests are more common in urban areas with a greater share of residents that are African American and impoverished.
Figure 3: Arrest and Population Characteristics of Delaware, 2012-2014
RACIAL DISPARITIES AT DIFFERENT CRIMINAL PROCESSING STAGES To understand where racial disparities exist in the Delaware justice system, Figure 4
summarizes the racial composition of cases at four criminal processing stages. These stages are arrest, court disposition,16 conviction,17 and sentence of incarceration.18 African Americans are
16 DELJIS data on prosecution charges are largely missing for non-felony cases. The evidence suggests that not much information is lost by not considering the prosecution stage, as over 95% of arrest cases had disposition charge information. Most cases with missing disposition charge information (86.4%) are “pending” in the DELJIS records.

14
almost twice as represented among arrestees (42%) compared to Delaware’s general population (22%). The proportional representation of African American and Whites does not change much between arrest and court disposition. Figure 4: Racial Composition of Cases in Criminal Processing
The racial composition of cases involving at least one conviction is also almost entirely
driven by underlying differences the prevalence of arrests between the two groups. Whites become more represented by a small fraction (0.3%) among conviction cases relative to their representation in arrests and dispositions. This pattern is affirmed by comparing within-race conviction rates (not shown). Among disposed cases involving African Americans, 51% had at least one conviction compared to 52% of disposed cases involving Whites.
Racial disparities become more apparent for incarceration sentences. Approximately 51% of cases with at least one incarceration sentence involve African Americans. The difference between the composition of arrest and incarceration sentences cases grows by 8.5% for African Americans while it decreases by 8.8% for Whites. The racial make-up of cases with incarceration sentences in this comparison is lower than the statistics reported by the Delaware DOC’s breakdown.19 The DOC figure is based on persons currently in jail/prison and is influenced by the length of sentences. If African Americans on average receive longer incarceration sentences they will become a larger share of the Level V correctional population on any given day.
17 Conviction is measured by whether or not a defendant was found guilty, responsible, or in violation for one or more disposed charges. 18 Incarceration sentence refers to any unmodified or modified (e.g. suspended after/credit-time) Level V sentence. 19 See footnote 8 for 2012-2014 estimates. As of June 2015, the DOC’s Level V population was 57% African American and 39% White. See p. 16 of Delaware Department of Correction. 2015. Annual Report, 2015. Available: http://www.doc.delaware.gov/downloads/DOC_2015AnnualReport.pdf
15
Incarceration Sentences
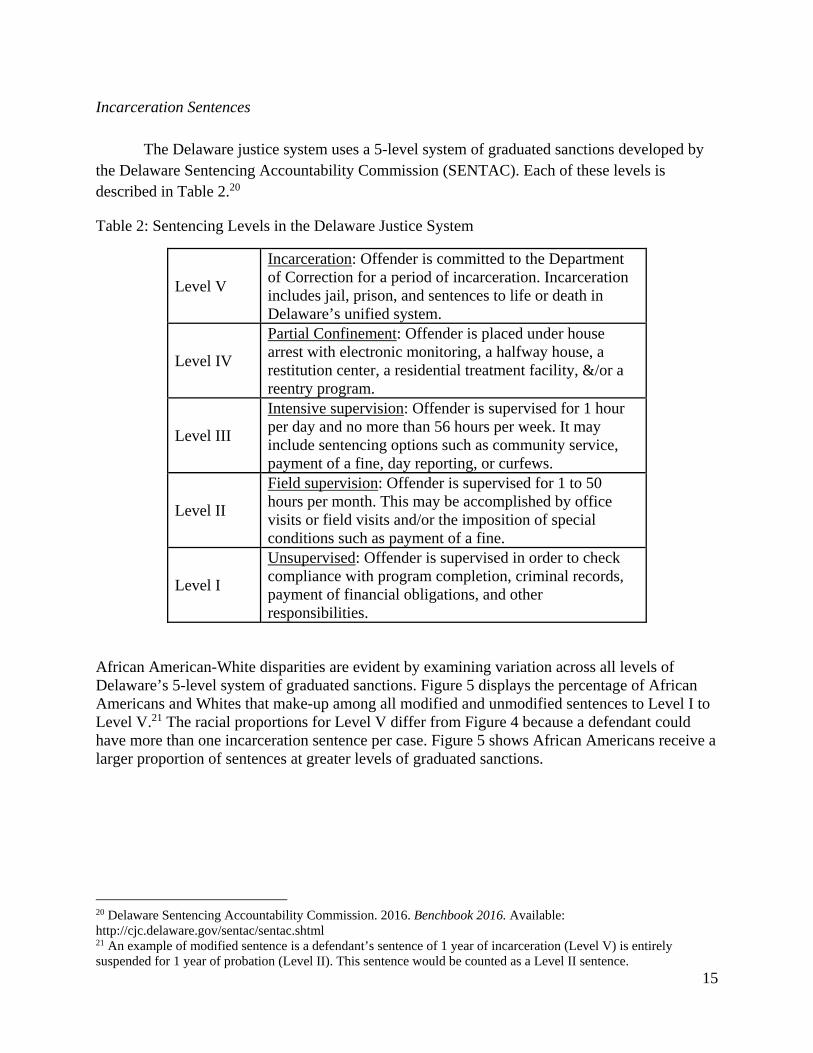
The Delaware justice system uses a 5-level system of graduated sanctions developed by
the Delaware Sentencing Accountability Commission (SENTAC). Each of these levels is described in Table 2.20
Table 2: Sentencing Levels in the Delaware Justice System
Level V
Incarceration: Offender is committed to the Department of Correction for a period of incarceration. Incarceration includes jail, prison, and sentences to life or death in Delaware’s unified system.
Level IV
Partial Confinement: Offender is placed under house arrest with electronic monitoring, a halfway house, a restitution center, a residential treatment facility, &/or a reentry program.
Level III
Intensive supervision: Offender is supervised for 1 hour per day and no more than 56 hours per week. It may include sentencing options such as community service, payment of a fine, day reporting, or curfews.
Level II
Field supervision: Offender is supervised for 1 to 50 hours per month. This may be accomplished by office visits or field visits and/or the imposition of special conditions such as payment of a fine.
Level I
Unsupervised: Offender is supervised in order to check compliance with program completion, criminal records, payment of financial obligations, and other responsibilities.
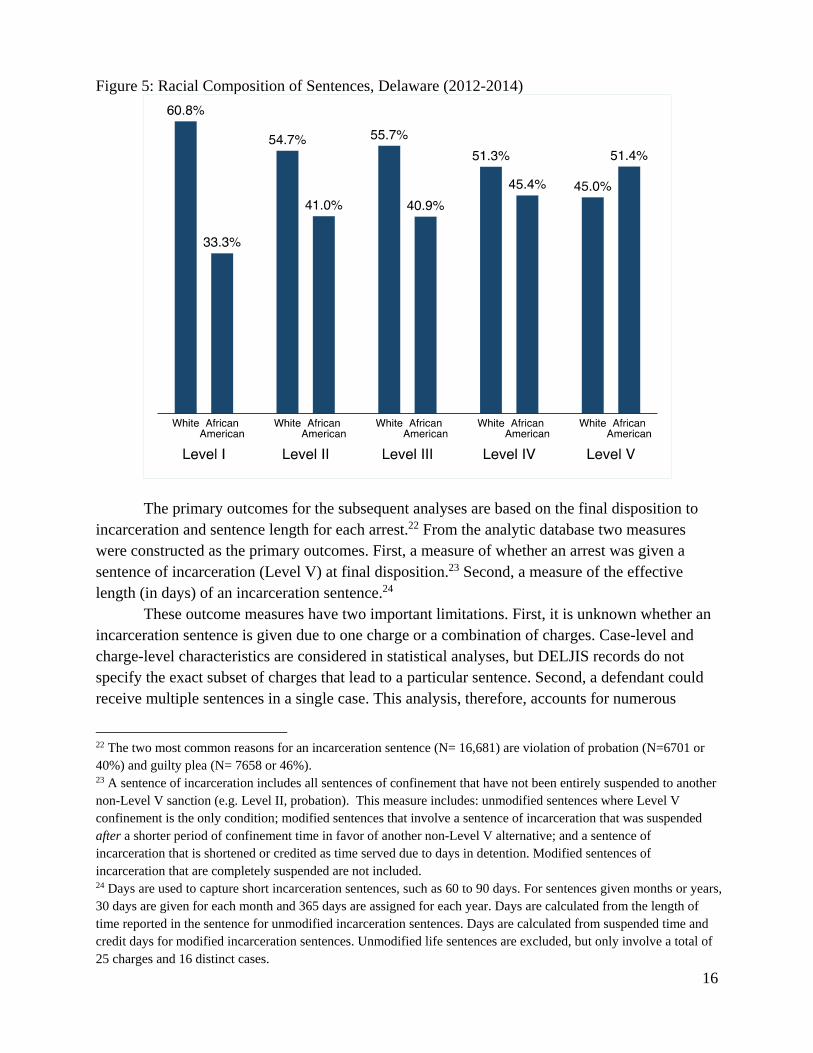
African American-White disparities are evident by examining variation across all levels of Delaware’s 5-level system of graduated sanctions. Figure 5 displays the percentage of African Americans and Whites that make-up among all modified and unmodified sentences to Level I to Level V.21 The racial proportions for Level V differ from Figure 4 because a defendant could have more than one incarceration sentence per case. Figure 5 shows African Americans receive a larger proportion of sentences at greater levels of graduated sanctions.
20 Delaware Sentencing Accountability Commission. 2016. Benchbook 2016. Available: http://cjc.delaware.gov/sentac/sentac.shtml 21 An example of modified sentence is a defendant’s sentence of 1 year of incarceration (Level V) is entirely suspended for 1 year of probation (Level II). This sentence would be counted as a Level II sentence.
16
Figure 5: Racial Composition of Sentences, Delaware (2012-2014)
The primary outcomes for the subsequent analyses are based on the final disposition to
incarceration and sentence length for each arrest.22 From the analytic database two measures were constructed as the primary outcomes. First, a measure of whether an arrest was given a sentence of incarceration (Level V) at final disposition.23 Second, a measure of the effective length (in days) of an incarceration sentence.24
These outcome measures have two important limitations. First, it is unknown whether an incarceration sentence is given due to one charge or a combination of charges. Case-level and charge-level characteristics are considered in statistical analyses, but DELJIS records do not specify the exact subset of charges that lead to a particular sentence. Second, a defendant could receive multiple sentences in a single case. This analysis, therefore, accounts for numerous
22 The two most common reasons for an incarceration sentence (N= 16,681) are violation of probation (N=6701 or 40%) and guilty plea (N= 7658 or 46%). 23 A sentence of incarceration includes all sentences of confinement that have not been entirely suspended to another non-Level V sanction (e.g. Level II, probation). This measure includes: unmodified sentences where Level V confinement is the only condition; modified sentences that involve a sentence of incarceration that was suspended after a shorter period of confinement time in favor of another non-Level V alternative; and a sentence of incarceration that is shortened or credited as time served due to days in detention. Modified sentences of incarceration that are completely suspended are not included. 24 Days are used to capture short incarceration sentences, such as 60 to 90 days. For sentences given months or years, 30 days are given for each month and 365 days are assigned for each year. Days are calculated from the length of time reported in the sentence for unmodified incarceration sentences. Days are calculated from suspended time and credit days for modified incarceration sentences. Unmodified life sentences are excluded, but only involve a total of 25 charges and 16 distinct cases.
17
incarceration sentences in a case. The analysis does not pursue sentenced incarceration time given consecutive or concurrent Level V sentences. As a result, the study may be underestimating the length of particularly long incarceration sentences.
STATISTICAL METHODS FOR ESTIMATING DISPARITIES IN INCARCERATION
For African American defendants, we estimated the odds of receiving an incarceration sentence and the length of an incarceration sentence relative to Whites. Because racial disparities in incarceration sentences may be a result of differences in legal characteristics of current cases, criminal history, or other contextual factors between cases, these issues are examined in the subsequent multivariate regression analyses.
In addition to race, arrests are analyzed with respect to current case and charge characteristics, contextual factors, and criminal history. The current case and charge characteristics are evaluated using three factors: type of charge, most serious charge per case, and violation of probation case. The regression analyses rely on the charges and case characteristics at the arrest stage. This choice reflects an interest in predicting a defendant’s likelihood of incarceration from an initial point of contact with the criminal justice system. Arrest charge type describes whether an arrest charge involves a violent, drug, serious property, or weapon offense. Offense categories follow the definitions of the Federal Bureau of Investigation’s Uniform Crime Reporting (UCR) Program. Violent offenses include murder and non-negligent manslaughter, forcible rape, robbery, and aggravated assault. Drug offenses include the unlawful possession, use, sale, purchase, manufacture, or distribution of any controlled drug or narcotic substance as well as equipment utilized in preparing drugs or narcotics. Serious property offenses include burglary, larceny theft, motor vehicle theft, and arson. Weapon offenses include the unlawful possession, sale, purchase, manufacture, or use of firearms, explosives, incendiary devices, and other deadly weapons.25 Most serious arrest charge identifies the single most serious offense grade among all arrest charges on a current case. Offense grades follow the Delaware Criminal Code and include felonies (A-F), misdemeanors (A-B; unclassified), and other offenses.26 Violation of probation (VOP) case measures whether a defendant faces at least one charge of a violation of probation in the current case.27
Five contextual factors describe the defendant and circumstances related to the case: male, age, county of judicial processing, use of public defender, and pretrial detention. Male records whether the defendant is male or not. Age is the defendant’s age at arrest broken into discrete categories as shown later in Table 3. County identifies the county in Delaware in which the courts process a defendant’s case (i.e. New Castle, Kent, or Sussex). Public defender indicates whether the defendant used a public defender for legal representation or a private attorney.
25 All charges were categorized based upon the UCR code provided in the DELJIS data. 26 The most serious charge in a case can influence whether a defendant is disposed or convicted of other (often lesser) charges. 27 Cases involving a violation of probation charge may be handled more punitively than cases with new offenses, especially if someone has a suspended sentence from an earlier conviction.

18
Detention denotes whether or not a defendant was detained for any period between arrest and final disposition.28
Criminal history is measured using five factors: juvenile record, prior arrests, prior felony convictions, prior violent convictions, and prior drug convictions.29 Juvenile record measures whether a defendant was arrested before the age of 18 and processed by the Delaware Family Courts. Prior arrests measure a defendant’s previous number of criminal arrests and traffic violations involving D.U.I. for a given arrest date.30 Prior felony convictions, prior violent convictions, and prior drug convictions—are measured by the number of previous cases involving a conviction for one or more these offenses.31
Table 3 displays the averages and proportions for measures in the final analytic database and how they vary for African American and White arrestees.32 The percentage of African Americans receiving an incarceration sentence is significantly greater than that of Whites (5.4% African American vs. 3.4% White; p < 0.001). Upon receiving an incarceration sentence, effective sentence time is 125 days (~4 months) longer on average for African Americans than for Whites (453 African American vs. 328 White; p < 0.001).
Other racial differences exist on current charge and case characteristics, contextual factors, and criminal history factors. The distributions of most serious charge and arrest charge types are significantly different between African Americans and Whites. On average, Whites are more likely to be arrested for property and other offenses while African Americans are more likely to be arrested for violent or drug offenses. A greater proportion of cases for African Americans compared to Whites involve Felony A-D offenses. Cases involving African Americans are more likely to be to be adjudicated in New Castle and Kent Counties. African Americans are more likely to be male (80% African American vs. 73% White; p < 0.001), represented by a public defender (59% African American vs. 55% White; p < 0.001), and detained between arrest and final disposition (50% African American vs 43% White; p < 0.001).
Differences are also evident with respect to criminal history. The majority of African American defendants (56%) have a juvenile record. Whites have on average four fewer arrests than African Africans. Prior convictions across offense types are also more common among African Americans than Whites. The average African American defendant, for instance, has 0.46 felony convictions while the average White defendant has 0.28 felony convictions.
28 Defendants may be detained for different reasons, including multiple active cases at the time of an arrest, history of non-appearances in court, and residential status. Beyond helping to capture complications of a case, detention can also affect sentencing through credit time. Days in detention can be credited toward a Level V sentence of incarceration, sometimes with entire Level V sentences being served with credit days from detention. 29 Criminal histories only include Delaware records, so contact with justice systems may be undercounted for defendants who have offended in other jurisdictions. 30 Arrests due to other traffic violations like speeding are not counted. 31 For instance, a defendant convicted of three drug offenses in a 2003 case, one drug offense in a 2004 case, and one violent offense in a 2005 case would have two prior drug convictions and one prior violent convictions in a 2012 case. 32 Racial differences are statistically evaluated using proportional differences (z-tests) for dichotomous variables and Chi-squared tests for categorical variables.

19
Table 3: Averages and Proportions for Arrests, Delaware (2012-2014)
Variable White African American Dependent Variables
Incarceration Sentence 3.38 5.42*** Effective Days of Incarceration 327.60 452.91***
Independent Variables Arrest Charge Type (%) Violent 2.54 3.06***
Drug 12.81 15.35 Property 16.64 11.97 Weapon 1.99 4.66 Other 66.01 64.96
Violation of Probation Case (%) 24.11 23.52*** Most Serious Arrest Charge (%) Felony A 0.88 0.97***
Felony B 7.74 13.58 Felony C 1.86 4.34 Felony D 10.64 11.33 Felony E 3.08 4.27 Felony F 8.54 4.71 Felony G 8.7 8.14 Misdemeanor A 25.29 24.24 Misdemeanor B 5.66 4.45 Misdemeanor Unclassified 26.33 22.89 Other 1.28 1.09
Male (%) 72.59 79.68*** Age at Arrest (%) 18- <21 10.54 14.61*** 21- <25 17.41 20.86
25- <30 20.35 19.41 30- <35 15.66 14.12 35- <40 10.19 9.44 40- <45 8.44 7.48 45- <50 7.06 6.25 50- <55 5.29 4.29 55- <60 2.54 1.93 60-<65 1.3 1.00 65+ 1.22 0.62
County (%) New Castle 41.66 54.60***
Kent 21.27 24.48 Sussex 37.08 20.92
Public Defender (%) 55.47 58.68*** Detained (%) 43.49 49.58*** Juvenile Record (%) 39.94 56.11 *** Number of Prior Arrests 8.61 13.02*** Number of Prior Violent Convictions 0.01 0.02*** Number of Prior Drug Convictions 0.15 0.35*** Number of Prior Felony Convictions 0.28 0.46*** Charge, No. 236,455 159,373 *p < 0.05, ** p < 0.01, *** p <0.001
20
The significant differences in current case characteristics, contextual factors, and criminal history factors between African Americans and Whites cases affirms the need to account for these differences when analyzing racial disparities in incarceration sentences.
We start with a simple model (Model 1) that only includes a measure of race. This model is the same as the probability of an incarceration sentence or the average number of effective sentenced days of incarceration conditional on race, as displayed in Table 3.
The remaining four models provide an estimate for how much of the racial disparity in the probability of an incarceration sentence or average number of sentence days of incarceration remains after controlling for differences in other relevant case and defendant characteristics. The second model (Model 2) adds current case and charge information to examine how much of the African American-White disparity in incarceration sentencing is attributed to average differences in these factors. The third model (Model 3) adds the contextual information related to age, gender, public defender, pretrial detention, and county location. The fourth (Model 4) contains all current case and charge, contextual, and criminal history factors. The fifth model (Model 5) estimates the effect of race using entropy balancing that reweights White defendants to be statistically identical to African Americans on all current case, contextual, and criminal history characteristics.33 Model 5 is the most robust comparison as it assures that the estimate of the African American-White disparity in incarceration sentencing is based on cases with identical characteristics.
Figure 6 shows the results for the predicted probability of incarceration for African Americans and Whites from all five models.34 For Models 2 through 4, these predicted probabilities of incarceration compare African Americans to Whites, holding other variables in the models constant at their average values. The details from the models are presented in Table 4. The size of the African American-White disparity shrinks between Models 1 and 4, as factors aside from race are included in predicted odds of an incarceration sentence. The largest change
33 Entropy balancing is a procedure that reweights White defendants to be similar to African American defendants on all observable characteristics. We used entropy balance to reweight Whites to be similar to African Americans on the means, variance, and skewness. The appendix provides a balance table displaying the characteristics of African American and White defendants before and after generating associated weights. Technical details can be found in Hainmueller, Jens and Xu, Yiqing. 2013. “Ebalance: A Stata Package for Entropy Balancing (September 1, 2013).” Journal of Statistical Software Vol. 54, Issue 7, 1-18. See Table A-3 for details on balancing the observations. 34 Logistic regression is used to predict a defendant’s probability of incarceration because receiving an incarceration sentence is a dichotomous outcome (i.e. not received or received). The probability of an incarceration sentence is given by
log
⋯
where the log odds of incarceration is a function of to relevant case factors.

21
occurs between Models 1 and 3, showing that charge type, most serious charge, and contextual factors are key sources of racial disparities in receiving an incarceration sentence. Model 5 shows the odds of incarceration remain 11% greater for African Americans compared to Whites with identical case characteristics, contextual factors, and criminal histories. While this relative difference is statistically significant, it is practically small, as it equates to an absolute difference of 0.5%. Model 5’s results are consistent with the regression estimates shown for Model 4 that contains all variables. Figure 6: Predicted Probability of Incarceration, Delaware (2012-2014)
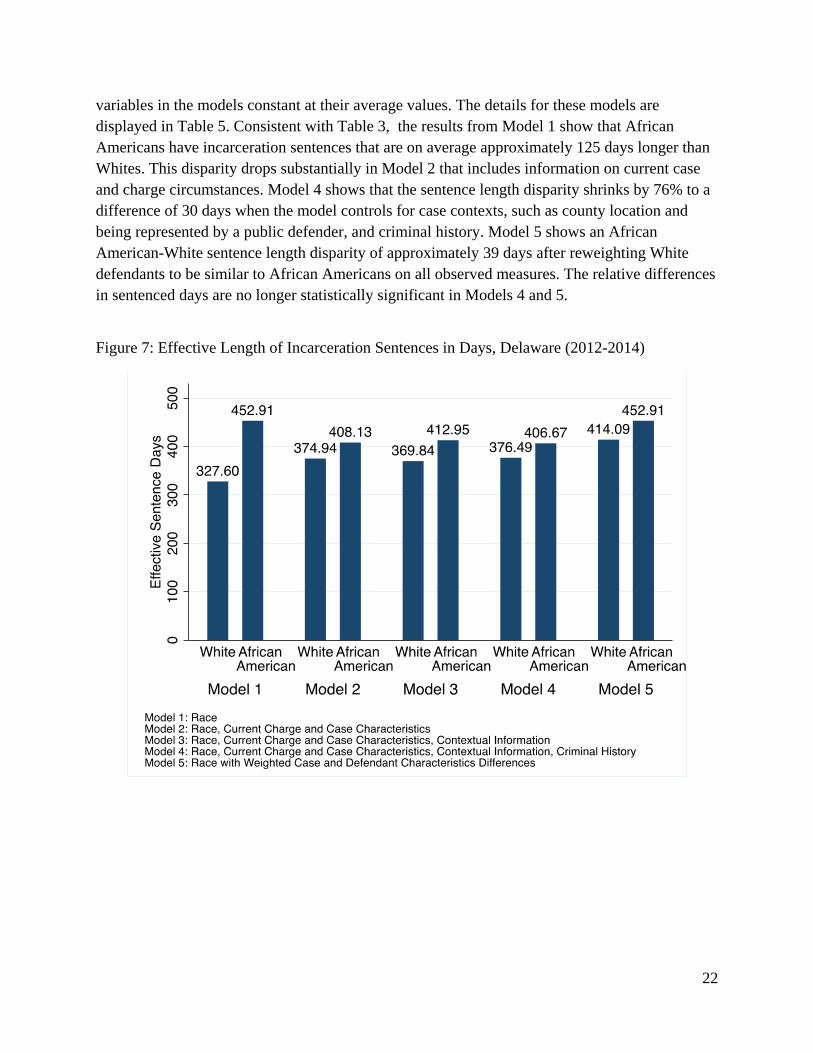
Figure 7 shows the results from the estimates of Models 1 to 5 that predict the effective
number of days sentenced to incarceration by race.35 For Models 2 through 4, estimates of the number of effective sentenced days compare African Americans to Whites, holding other
35 Ordinary least squares regression is used to predict effective length of an incarceration sentence in days because this is a continuous, numeric outcome. This is represented by
EffectiveSentenceDays ⋯
where the predicted number of effective sentenced days of incarceration is a function of a to relevant case factors.
22
variables in the models constant at their average values. The details for these models are displayed in Table 5. Consistent with Table 3, the results from Model 1 show that African Americans have incarceration sentences that are on average approximately 125 days longer than Whites. This disparity drops substantially in Model 2 that includes information on current case and charge circumstances. Model 4 shows that the sentence length disparity shrinks by 76% to a difference of 30 days when the model controls for case contexts, such as county location and being represented by a public defender, and criminal history. Model 5 shows an African American-White sentence length disparity of approximately 39 days after reweighting White defendants to be similar to African Americans on all observed measures. The relative differences in sentenced days are no longer statistically significant in Models 4 and 5.
Figure 7: Effective Length of Incarceration Sentences in Days, Delaware (2012-2014)

23
Table 4: Probability of Incarceration, Delaware (2012-2014)
Model 1 Model 2 Model 3 Model 4 Model 5 Effect of Race (OR) 1.60*** 1.51*** 1.25*** 1.12*** 1.11*** CI (1.55-1.65) (1.46-1.58) (1.19-1.29) (1.08-1.17) (1.07-1.16) Standard Error 0.02 0.03 0.02 0.02 0.02 Case Characteristics No Yes Yes Yes Yes Contextual Factors No No Yes Yes Yes Criminal history No No No Yes Yes Charge, No. 395,828 395,828 395,828 395,828 395,828 Case, No. 127,204 127,204 127,204 127,204 127,204 Notes: OR= Odds ratio. CI= 95 pct. confidence interval. The effective charge no. in Model 5 is 298,359 due to weighting. Standard errors are clustered at the case level.
* p < 0.05, ** p < 0.01, *** p < 0.01.
Table 5: Effective Length of Incarceration Sentence in Days, Delaware (2012-2014) Model 1 Model 2 Model 3 Model 4 Model 5 Effect of Race 125.31*** 33.19* 43.11** 30.18 38.82 CI (79.87-170.76) (0.94-65.43) (11.48-74.78) (-1.42-61.78) (-11.99-89.64) Standard Error 23.19 16.45 16.16 16.12 26.00 Current Case Characteristics No Yes Yes Yes Yes Contextual Factors No No Yes Yes Yes Criminal history No No No Yes Yes Charge, No. 16,657 16,657 16,657 16,657 16,657 Case, No. 13,282 13,282 13,282 13,282 13,282 Notes: CI=95 pct. confidence interval. The effective charge no. in Model 5 is 13,239 due to weighting. Standard errors are clustered at the case level.
*p < 0.05, ** p < 0.01, *** p < 0.001.

24
EXPLAINING RACIAL DIFFERENCES IN INCARCERATION SENTENCES
The results from the multivariate regression and entropy balancing models suggest African American-White differences in the probability and length of an incarceration sentence can be largely explained by current charge and case, contextual, and criminal history factors. This claim is further validated using a Blinder-Oaxaca regression decomposition model. This method divides average differences between African Americans and Whites on each outcome into the amount that is accounted for by differences in case characteristics (explained difference) and amount that is due to differences in unobserved characteristics (unexplained difference).36
Specifically, the decomposition model identifies any racial differences after supposing White defendants had the same characteristics as African American defendants. In the decomposition models that follow, logistic regression is used to predict a defendant’s probability of incarceration and ordinary least squares regression is used to predict the effective length of an incarceration sentence in days. All current charge and case, contextual, and criminal history factors are included, as in Model 4 in Table 4 and Table 5.37
36 Computationally, this decomposition can be represented in the following. Assume the effective length of an incarceration sentence in days is predicted for two groups (African Americans and Whites) given number of previous felony convictions. This is given by:
Y Y
where Y is the average number of effective sentenced days of incarceration, is an intercept term, is the coefficient for number of previous felony convictions (F), w stands for Whites, and b stands for African Americans. The difference of interest is Y Y , which represents the difference in the effective sentenced days of incarceration for African Americans and Whites. The Blinder-Oaxaca decomposition divides this total racial difference into explained and unexplained parts. This is represented as
Y The first bracket of terms represents the “explained” variation in sentence length due to previous felony convictions. The second bracket of terms then represents the variation in sentence length that is “unexplained” by previous felony convictions. The equation can be extended to more than one independent variable, and the interpretation is the same. 37 Some included measures, like arrest charge type, most serious arrest charge, age, and county, are categorical. These variables are normalized to avoid distortions in the decomposition results due choice of an excluded category.

25
Table 6: Decomposition of Incarceration for White and African American Defendants, Delaware (2012-2014)
Probability of Incarceration
Contribution to Absolute Explained Difference
White 0.034*** (0.001) African American 0.054*** (0.001) Difference -0.020*** (0.001) Explained -0.014*** (0.001) Unexplained -0.005*** (0.001)
Explained Difference Arrest Charge Type -0.000*** (0.000) 2.46%
Most Serious Arrest Charge -0.001*** (0.000) 4.59% Violation of Probation Case 0.000 (0.000) 1.13% Male -0.001*** (0.000) 5.52% Age at Arrest 0.000 (0.000) 1.00% County -0.006*** (0.000) 41.20% Public Defender 0.000 (0.000) 0.10% Detention -0.003*** (0.000) 19.94% Juvenile Record -0.001*** (0.000) 5.78% Number of Prior Arrests -0.002*** (0.000) 14.62% Number of Prior Violent Convictions 0.000 (0.000) 0.08%
Number of Prior Drug Convictions -0.000* (0.000) 1.26% Number of Prior Felony Convictions -0.000*** (0.000) 2.33%
Charge, No. 395,828
Case, No. 127,204 Notes: Standard errors are reported in parentheses. * p < 0.05, ** p < 0.01, *** p < 0.001.
Table 6 displays the results of the decomposition of incarceration for African Americans
and Whites. The first two entries present the familiar finding that 5.4% of African Americans and 3.4% of Whites receive an incarceration sentence. The total difference of 2.0% in the probability of receiving an incarceration sentencing between the groups is then separated into explained and unexplained components. Approximately 1.4% of this 2.0% difference in the incarceration sentences between African Americans and Whites can be explained by observable case and defendant characteristics. That is, differences in current charge and case characteristics, contextual factors, and criminal history account for most of the racial difference in receiving an incarceration sentence. About 0.5% of the 2.0% total difference is unexplained by differences in case characteristics between African Americans and Whites. Unobservable characteristics are thus statistically significant but a small contributor to racial disparities in incarceration sentencing, as the logistic regression models in Table 5 show. These differences are also
26
consistent with the estimates shown for Model 5 that relied on entropy balancing to compare African American defendants to similar White defendants.
Figure 8: Decomposition of Differences in Probability of Incarceration
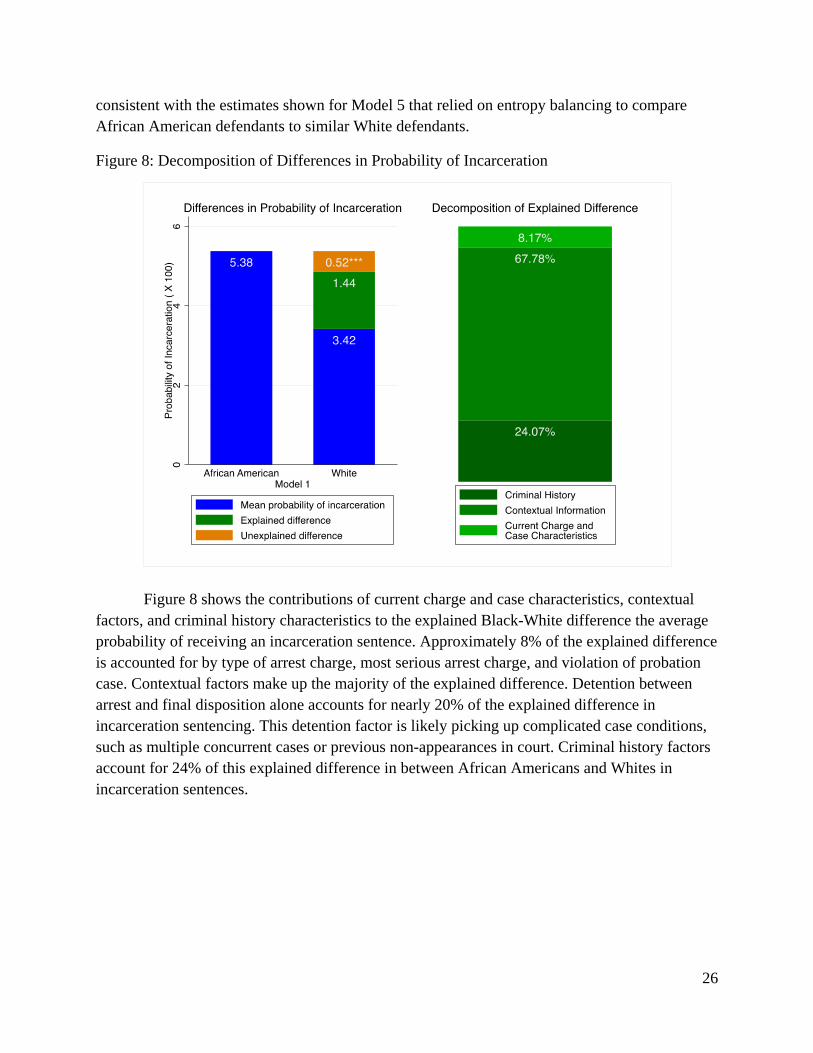
Figure 8 shows the contributions of current charge and case characteristics, contextual
factors, and criminal history characteristics to the explained Black-White difference the average probability of receiving an incarceration sentence. Approximately 8% of the explained difference is accounted for by type of arrest charge, most serious arrest charge, and violation of probation case. Contextual factors make up the majority of the explained difference. Detention between arrest and final disposition alone accounts for nearly 20% of the explained difference in incarceration sentencing. This detention factor is likely picking up complicated case conditions, such as multiple concurrent cases or previous non-appearances in court. Criminal history factors account for 24% of this explained difference in between African Americans and Whites in incarceration sentences.

27
Table 7: Decomposition of Effective Length of Incarceration Sentence in Days for White and African American Defendants, Delaware (2012-2014)
Effective Length of
Incarceration SentenceContribution to Absolute
Explained Difference White 327.60*** (13.98) African American 452.92*** (16.59)
Difference -125.32*** (21.69) Explained -95.14*** (15.37) Unexplained -30.18 (15.91) Explained Difference
Arrest Charge Type -22.94*** (5.19) 15.95% Most Serious Arrest Charge -66.82*** (11.81) 46.46% Violation of Probation Case -1.40 (1.66) 0.97% Male -3.48** (1.26) 2.42% Age at Arrest 16.22*** (2.94) 11.28% County -5.85*** (1.03) 1.34% Public Defender -0.31 (0.33) 0.22% Detention 1.93 (2.16) 4.07% Juvenile Record -3.26 (2.92) 2.26% Number of Prior Arrests -1.10 (3.67) 0.76%
Number of Prior Violent Convictions -0.01 (0.49) 0.01%
Number of Prior Drug Convictions 6.20*** (1.72) 4.31%
Number of Prior Felony Convictions -14.33*** (2.42) 9.96%
Charge, No. 16,657 Case, No. 13,282
Notes: Standard errors are reported in parentheses. * p < 0.05, ** p < 0.01, *** p < 0.001
28
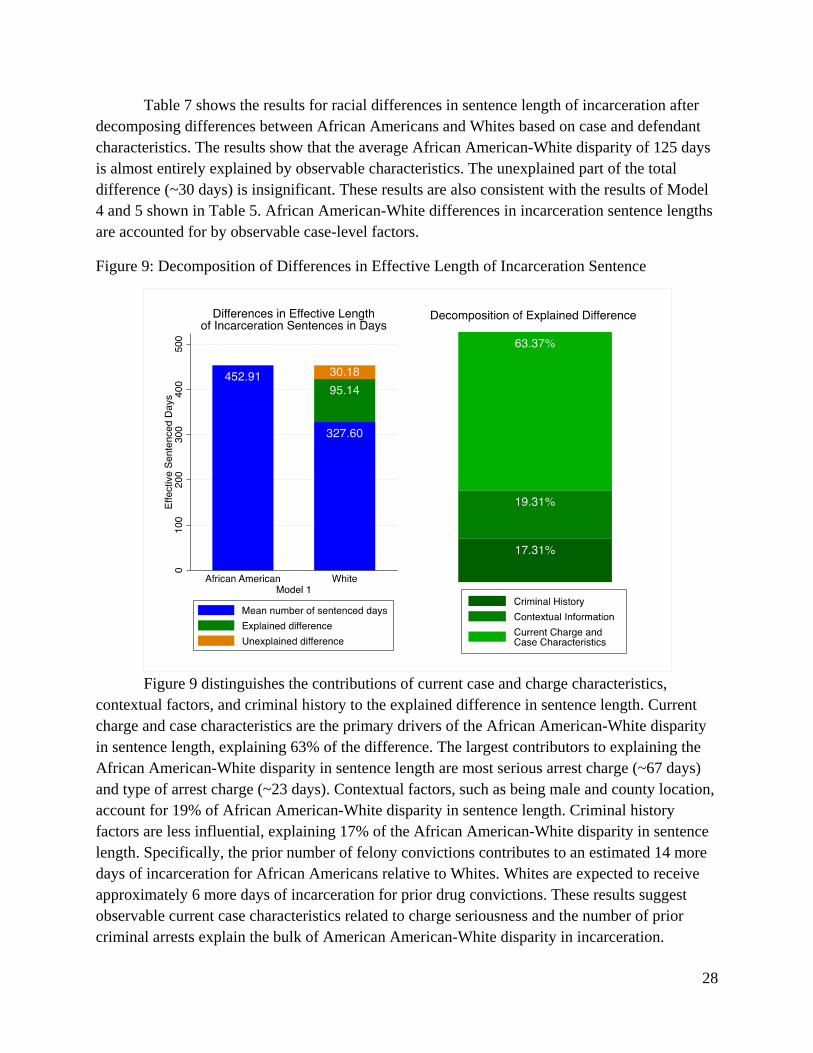
Table 7 shows the results for racial differences in sentence length of incarceration after decomposing differences between African Americans and Whites based on case and defendant characteristics. The results show that the average African American-White disparity of 125 days is almost entirely explained by observable characteristics. The unexplained part of the total difference (~30 days) is insignificant. These results are also consistent with the results of Model 4 and 5 shown in Table 5. African American-White differences in incarceration sentence lengths are accounted for by observable case-level factors.
Figure 9: Decomposition of Differences in Effective Length of Incarceration Sentence
Figure 9 distinguishes the contributions of current case and charge characteristics,
contextual factors, and criminal history to the explained difference in sentence length. Current charge and case characteristics are the primary drivers of the African American-White disparity in sentence length, explaining 63% of the difference. The largest contributors to explaining the African American-White disparity in sentence length are most serious arrest charge (~67 days) and type of arrest charge (~23 days). Contextual factors, such as being male and county location, account for 19% of African American-White disparity in sentence length. Criminal history factors are less influential, explaining 17% of the African American-White disparity in sentence length. Specifically, the prior number of felony convictions contributes to an estimated 14 more days of incarceration for African Americans relative to Whites. Whites are expected to receive approximately 6 more days of incarceration for prior drug convictions. These results suggest observable current case characteristics related to charge seriousness and the number of prior criminal arrests explain the bulk of American American-White disparity in incarceration.

29
THE EVOLUTION OF RACIAL DISPARITIES IN INCARCERATION SENTENCES AND CRIMINAL
HISTORY
Because current case characteristics and contextual factors appear to be the largest contributors to African American-White disparities in incarceration, the final part of this study considers how the disparities in incarceration evolve as defendants accumulate criminal histories. A subgroup of defendants who experienced their first adult arrest between 2002 and 2004 were identified in the analytic database. Adult arrests are defined for this analysis as A) an arrest at the age of 18 or older or B) an arrest below the age of 18, but the defendant was treated as an adult by the courts. This means observations in this analytic database had at least two contacts with the adult criminal justice system. A total of 4,364 defendants fit this definition. Approximately 57% of these individuals are White and 43% are African American. These adults had a total of 38,562 distinct arrests with 131,537 charges. The average defendant experienced 6.5 arrests between 2002 and 2014. Arrest information was created from DELJIS criminal history files. Like Model 5 for the 2012-2014 final analytic database, entropy balancing is used to compare the probability of incarceration for African American and similarly situated White defendants in this select criminal history sample.38 The African American-White disparity in receiving a sentence of incarceration is only examined given the diminished sample size. The entropy balancing model contains fewer variables than the 2012-2014 analytic database, due unavailable information in the criminal history file (e.g. public defender and detention). This model specifically includes all current arrest and charge characteristics, gender (male), county, and prior juvenile record. A measure of the year is also included to control for yearly variation in the average probability of incarceration. In effect, the model is comparing the probability of incarceration for African Americans to Whites at each successive arrest that have similar charges, the same gender, county locations, and a juvenile arrest record. The model is estimated separately from a defendant’s first arrest (i.e. zero prior arrests) to sixth arrest (i.e. five prior arrests).
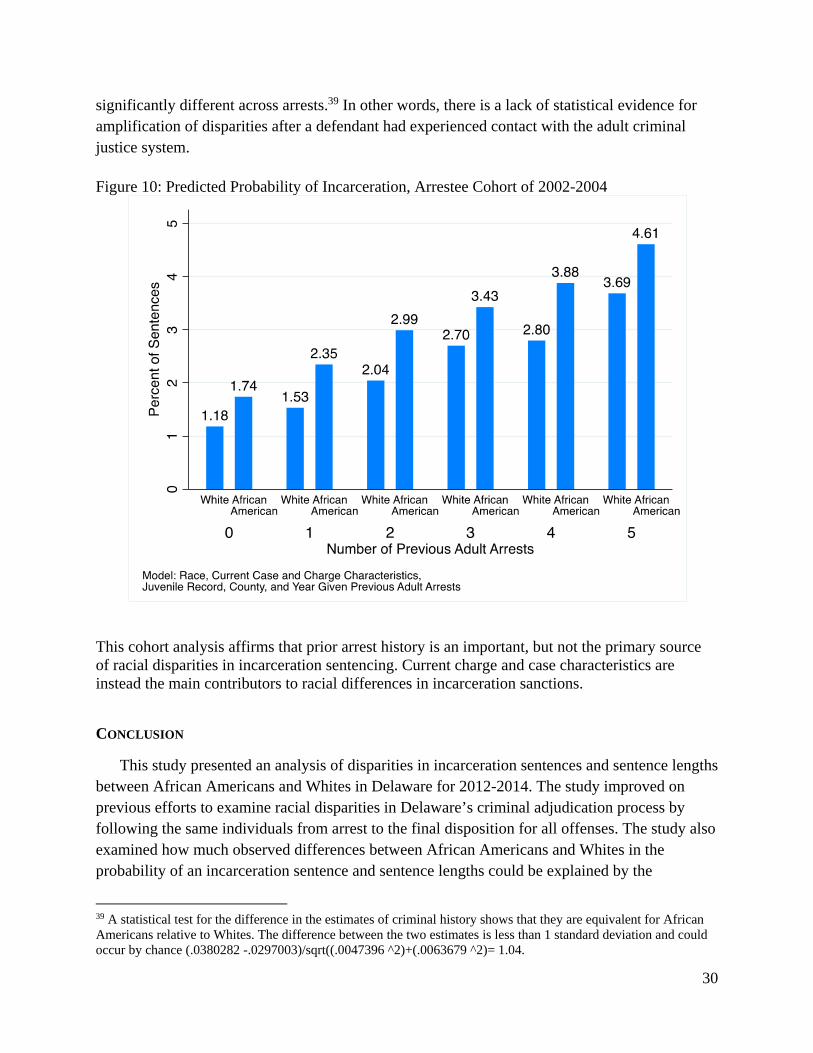
Figure 10 summarizes the changes in the probability of receiving an incarceration sentence as defendants accumulate more arrests. Two patterns are recognizable. First, the probability of incarceration steadily increases when a defendant has a longer criminal history, regardless of whether the defendant is White or African American. Second, a small gap in the probability of receiving an incarceration sentence exists for White and African American defendants across successive arrests. For instance, a White defendant with no prior adult arrests has a 1.2% chance of incarceration while a similarly situated African American defendant has a 1.7% chance. This raw difference of 0.6% suggests African Americans are 32% more likely to receive an incarceration sentence at first contact with the adult criminal justice system. This difference is marginally significant for the first three arrests (p < 0.05), but insignificant for subsequent arrests. Although this gap appears to grow with more arrests, disparities are not
38 Table A- 4 provides details on entropy balancing for the 2002-2004 cohort.
30
significantly different across arrests.39 In other words, there is a lack of statistical evidence for amplification of disparities after a defendant had experienced contact with the adult criminal justice system. Figure 10: Predicted Probability of Incarceration, Arrestee Cohort of 2002-2004
This cohort analysis affirms that prior arrest history is an important, but not the primary source of racial disparities in incarceration sentencing. Current charge and case characteristics are instead the main contributors to racial differences in incarceration sanctions.
CONCLUSION
This study presented an analysis of disparities in incarceration sentences and sentence lengths between African Americans and Whites in Delaware for 2012-2014. The study improved on previous efforts to examine racial disparities in Delaware’s criminal adjudication process by following the same individuals from arrest to the final disposition for all offenses. The study also examined how much observed differences between African Americans and Whites in the probability of an incarceration sentence and sentence lengths could be explained by the
39 A statistical test for the difference in the estimates of criminal history shows that they are equivalent for African Americans relative to Whites. The difference between the two estimates is less than 1 standard deviation and could occur by chance (.0380282 -.0297003)/sqrt((.0047396 ^2)+(.0063679 ^2)= 1.04.
31
differences in these two groups’ current charge and case characteristics, contextual factors, and criminal histories.
Using administrative data on criminal arrests in Delaware between 2012 and 2014, the study first documented evidence that African Americans were significantly more likely to receive an incarceration sentence and a longer sentence than Whites. Looking at defendant and case-level factors, African Americans were statistically more likely to have violent and weapons crime arrest charges, face felony A and D charges as their most serious offense, be represented by a public defender, and possess a prior juvenile arrest record and conviction history. These racial differences in defendants’ cases demonstrated the need for a statistical analysis that would adjust for these potential confounders of sentence decisions to incarceration and sentence length.
The study results indicate that the disparities in incarceration sentences and sentence lengths for African Americans relative to Whites were reduced to levels that were practically small in a multivariate regression model that controlled for current case and charge, criminal history, and contextual factors, as well as in a multivariate entropy weighting method that compared African Americans to similarly situated Whites. In both comparisons, the unexplained differences in the probability of receiving an incarceration sentence were less than 1%. The disparities in the length of incarceration sentences for African Americans relative to Whites decreased overall to levels (under 40 days) that were no longer statistically significant in these multivariate comparisons. These findings suggest that differences in current case and charge characteristics and contexts of cases are sources of African American-White disparities in incarceration sentences in Delaware.
A decomposition of the racial disparity in incarceration sentences showed that African American-White disparities in incarceration sentences are largely explained by differences in most serious of arrest charge, type of arrest charge, detention between arrest and final disposition, and county location. For incarceration sentence lengths, the differences between African Americans and Whites in severity of arrest charge, type of arrest charge, and prior felony convictions account for most of the differences in sentenced days. These findings underscore that incarceration sentencing differences are based on legal conditions.
The analysis that compared the evolution of criminal histories for African American and White defendants with arrests dating back to 2002 showed that incarceration disparities emerge early and are consistent with successive arrests. No clear amplification of racial disparities occurred as a defendant accumulated more prior arrests. These findings suggest that the 2012-14 racial disparities in incarceration sentences would not be meaningfully reduced by a single change in sentencing decisions made earlier in one’s criminal history.
Although the data and analysis provided a comprehensive assessment of the sizes and sources of African American-White disparities in incarceration in Delaware, several limitations must be kept in mind. The study does not identify exact causes for these disparities. While the study distinguishes the influence of numerous observable differences between African Americans and Whites and their association with differences in incarceration and sentence length outcomes, it does not provide a causal explanation for these differences or how they manifest as

32
cases move across the criminal justice process from the point of arrest to the decision to incarcerate a criminal defendant. For example, the study cannot explain why detention prior to final disposition is more prevalent among African Americans or why detention is an important contributor to differences in incarceration sentences. Furthermore, the study does not examine criminal justice practices prior to arrest. African Americans are more represented among arrestees than they are among the general population in Delaware. This study does not address racial disparities in arrests. To address this issue, a study would need to examine racial disparities in offending, the allocation of police resources, and arrest decision-making. Importantly, this study makes no judgment on whether the current level of incarceration is fair or justified. This point is especially true in interpreting multivariate analyses that show an observed reduction in African American-White disparities.
Nevertheless, the results from this study point to the need for reforms in how sentences to incarceration are determined if the goal is to reduce African American-White disparities in Delaware’s prison population. Sentencing policies that increase incarceration and sentence lengths for felony A and B offenses and for weapons and violent offenses will need to be addressed if the state wants to reduce the incarceration rate of African Americans. Addressing minority overrepresentation in Delaware’s correctional system requires consideration of the weight to which criminal history and current charge types are factored into the decision for whom is eligible for incarceration and how long they will stay incarcerated. Additionally, the role that pretrial detention and differences between counties has in contributing to African American defendants’ greater risk of an incarceration sentence should be further examined.
33
APPENDIX
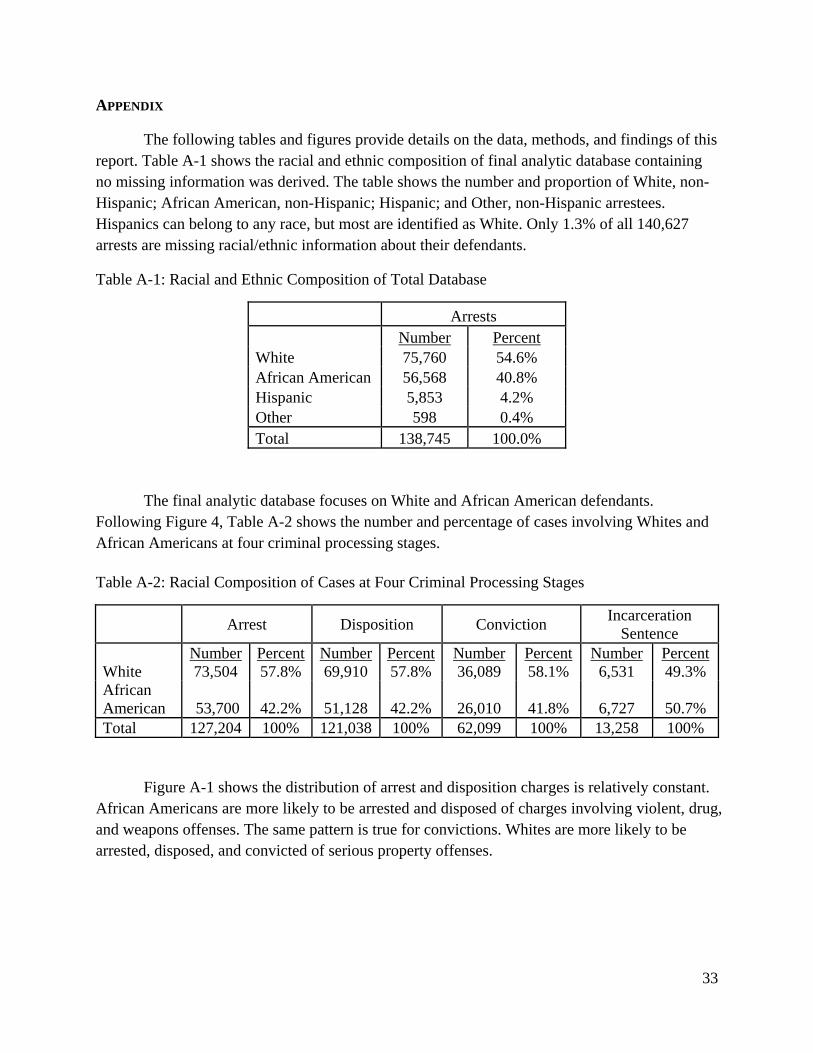
The following tables and figures provide details on the data, methods, and findings of this report. Table A-1 shows the racial and ethnic composition of final analytic database containing no missing information was derived. The table shows the number and proportion of White, non-Hispanic; African American, non-Hispanic; Hispanic; and Other, non-Hispanic arrestees. Hispanics can belong to any race, but most are identified as White. Only 1.3% of all 140,627 arrests are missing racial/ethnic information about their defendants.
Table A-1: Racial and Ethnic Composition of Total Database
Arrests Number Percent White 75,760 54.6% African American 56,568 40.8% Hispanic 5,853 4.2% Other 598 0.4% Total 138,745 100.0%
The final analytic database focuses on White and African American defendants.
Following Figure 4, Table A-2 shows the number and percentage of cases involving Whites and African Americans at four criminal processing stages. Table A-2: Racial Composition of Cases at Four Criminal Processing Stages
Arrest Disposition Conviction Incarceration
Sentence Number Percent Number Percent Number Percent Number Percent White 73,504 57.8% 69,910 57.8% 36,089 58.1% 6,531 49.3% African American 53,700 42.2% 51,128 42.2% 26,010 41.8% 6,727 50.7% Total 127,204 100% 121,038 100% 62,099 100% 13,258 100%
Figure A-1 shows the distribution of arrest and disposition charges is relatively constant. African Americans are more likely to be arrested and disposed of charges involving violent, drug, and weapons offenses. The same pattern is true for convictions. Whites are more likely to be arrested, disposed, and convicted of serious property offenses.

34
Figure A-1: Percent of Charges by Type at Different Criminal Processing Stages
35
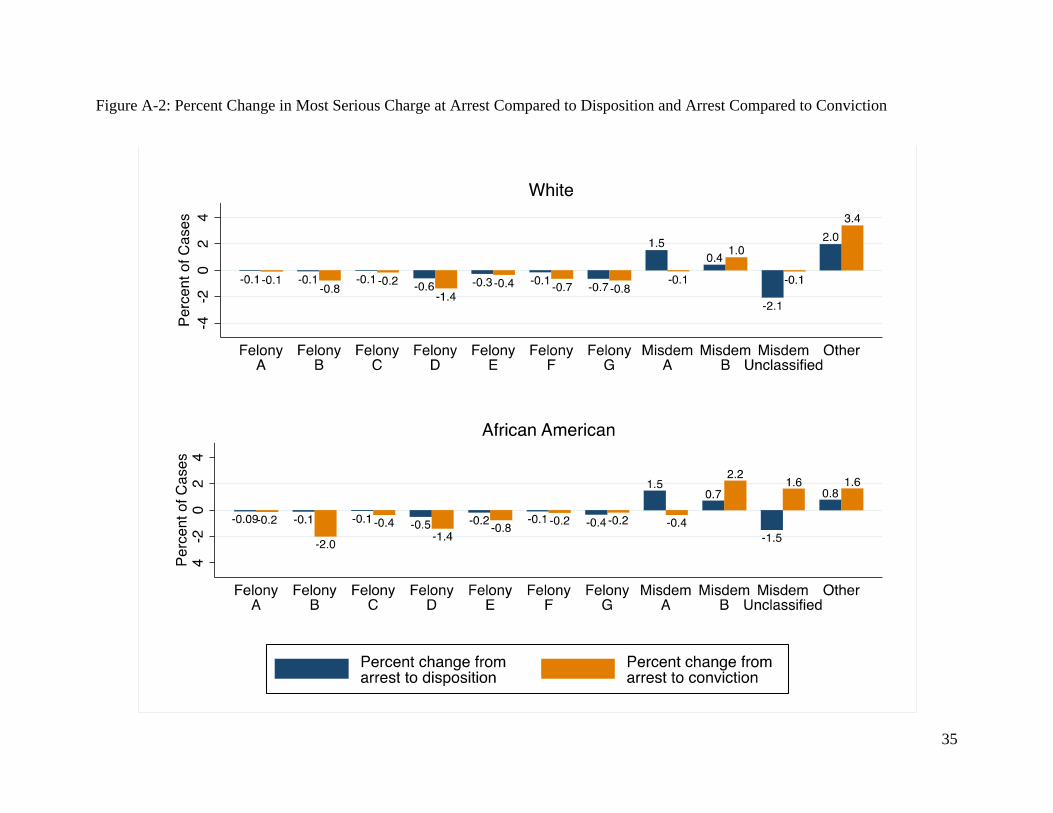
Figure A-2: Percent Change in Most Serious Charge at Arrest Compared to Disposition and Arrest Compared to Conviction

36
37
Figure A-2 depicts percent changes in the distribution of the most serious charge per case from arrest to disposition and arrest to conviction. For African Americans and Whites, the distribution of most serious charges at the arrest stage is similar to the disposition and conviction stages. Somewhat fewer defendants are disposed with felonies and fewer defendants are convicted of felonies as their most serious charges. Defendants of both races are more likely to be convicted of misdemeanors and other offenses as their most serious charge.
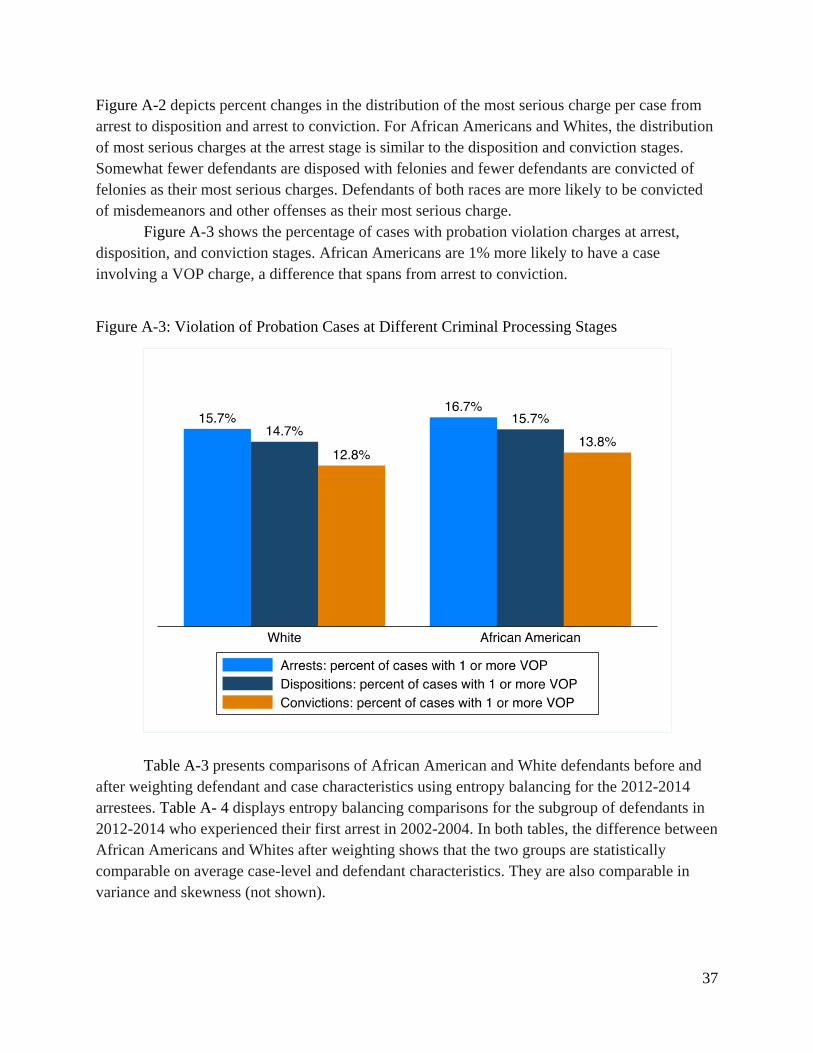
Figure A-3 shows the percentage of cases with probation violation charges at arrest, disposition, and conviction stages. African Americans are 1% more likely to have a case involving a VOP charge, a difference that spans from arrest to conviction.
Figure A-3: Violation of Probation Cases at Different Criminal Processing Stages
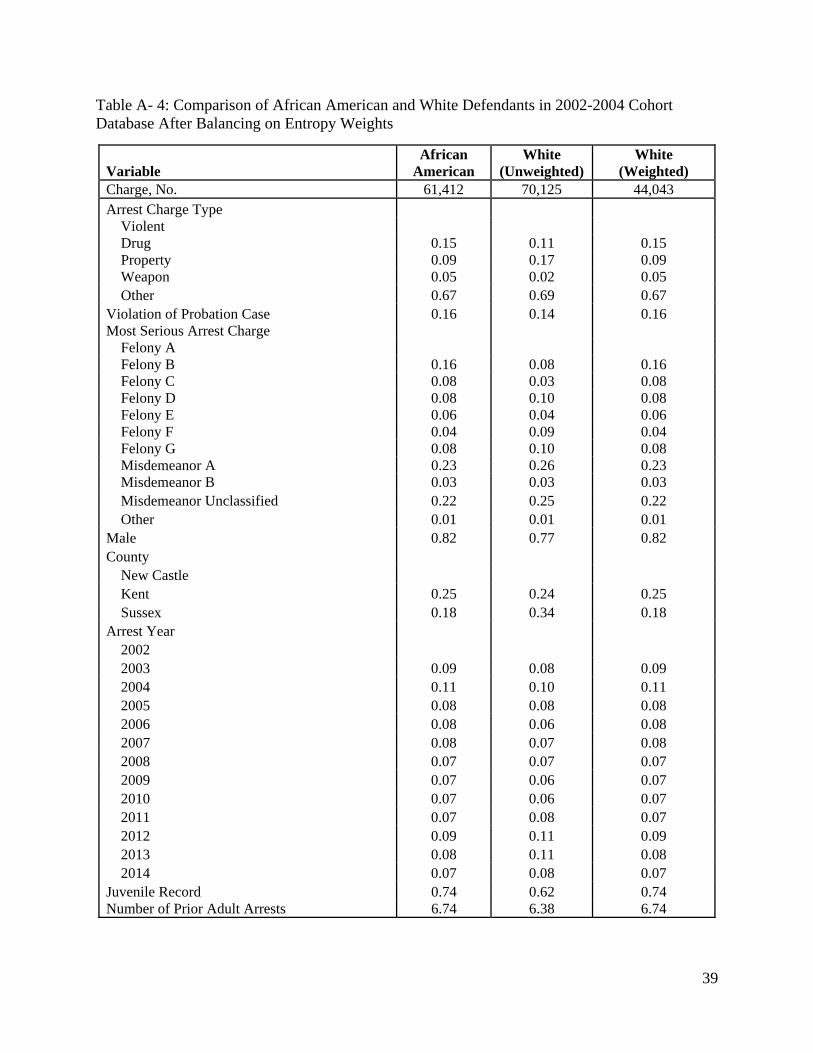
Table A-3 presents comparisons of African American and White defendants before and
after weighting defendant and case characteristics using entropy balancing for the 2012-2014 arrestees. Table A- 4 displays entropy balancing comparisons for the subgroup of defendants in 2012-2014 who experienced their first arrest in 2002-2004. In both tables, the difference between African Americans and Whites after weighting shows that the two groups are statistically comparable on average case-level and defendant characteristics. They are also comparable in variance and skewness (not shown).

38
Table A-3: Comparison of African American and White Defendants in 2012-2014 Analytic Database After Balancing on Entropy Weights
Variable African
American White
(Unweighted) White
(Weighted) Charge, No. 159,373 236,455 140,212 Arrest Charge Type Violent Drug 0.15 0.13 0.15 Property 0.12 0.17 0.12 Weapon 0.05 0.02 0.05 Other 0.65 0.66 0.65 Violation of Probation Case 0.24 0.24 0.24 Most Serious Arrest Charge Felony A Felony B 0.14 0.08 0.14 Felony C 0.04 0.02 0.04 Felony D 0.11 0.11 0.11 Felony E 0.04 0.03 0.04 Felony F 0.05 0.09 0.05 Felony G 0.08 0.09 0.08 Misdemeanor A 0.24 0.25 0.24 Misdemeanor B 0.04 0.06 0.04 Misdemeanor Unclassified 0.23 0.26 0.23 Other 0.01 0.01 0.01 Male 0.80 0.73 0.80 Age at Arrest 18- <21 21- <25 0.21 0.17 0.21 25- <30 0.19 0.20 0.19 30- <35 0.14 0.16 0.14 35- <40 0.09 0.10 0.09 40- <45 0.08 0.08 0.08 45- <50 0.06 0.07 0.06 50- <55 0.04 0.05 0.04 55- <60 0.02 0.03 0.02 60-<65 0.01 0.01 0.01 65+ 0.01 0.01 0.01 County New Castle Kent 0.24 0.21 0.24 Sussex 0.21 0.37 0.21 Public Defender 0.59 0.56 0.59 Detained 0.50 0.44 0.50 Juvenile Record 0.56 0.40 0.56 Number of Prior Arrests 13.02 8.61 13.00 Number of Prior Violent Convictions 0.02 0.01 0.02 Number of Prior Drug Convictions 0.35 0.15 0.35 Number of Prior Felony Convictions 0.46 0.28 0.46
39
Table A- 4: Comparison of African American and White Defendants in 2002-2004 Cohort Database After Balancing on Entropy Weights
Variable African
American White
(Unweighted) White
(Weighted) Charge, No. 61,412 70,125 44,043 Arrest Charge Type Violent Drug 0.15 0.11 0.15 Property 0.09 0.17 0.09 Weapon 0.05 0.02 0.05 Other 0.67 0.69 0.67 Violation of Probation Case 0.16 0.14 0.16 Most Serious Arrest Charge Felony A Felony B 0.16 0.08 0.16 Felony C 0.08 0.03 0.08 Felony D 0.08 0.10 0.08 Felony E 0.06 0.04 0.06 Felony F 0.04 0.09 0.04 Felony G 0.08 0.10 0.08 Misdemeanor A 0.23 0.26 0.23 Misdemeanor B 0.03 0.03 0.03 Misdemeanor Unclassified 0.22 0.25 0.22 Other 0.01 0.01 0.01 Male 0.82 0.77 0.82 County New Castle Kent 0.25 0.24 0.25 Sussex 0.18 0.34 0.18 Arrest Year 2002 2003 0.09 0.08 0.09 2004 0.11 0.10 0.11 2005 0.08 0.08 0.08 2006 0.08 0.06 0.08 2007 0.08 0.07 0.08 2008 0.07 0.07 0.07 2009 0.07 0.06 0.07 2010 0.07 0.06 0.07 2011 0.07 0.08 0.07 2012 0.09 0.11 0.09 2013 0.08 0.11 0.08 2014 0.07 0.08 0.07 Juvenile Record 0.74 0.62 0.74 Number of Prior Adult Arrests 6.74 6.38 6.74