EVALUATING THE POTENTIAL OF ELECTROSPUN MEMBRANES...
73
EVALUATING THE POTENTIAL OF ELECTROSPUN MEMBRANES FOR TISSUE SPECIFIC SIGNAL DELIVERY IN CARTILAGE AND BONE TISSUE ENGINEERING A DISSERTATION SUBMITTED By DEXY JOSEPH IN PARTIAL FULFILMENT OF THE REQUIREMENTS FOR THE DEGREE OF MASTER OF PHILOSOPHY SREE CHITRA TIRUNAL INSTITUTE FOR MEDICAL SCIENCES AND TECHNOLOGY THIRUVANANTHAPURAM– 695 012 July 2013
Transcript of EVALUATING THE POTENTIAL OF ELECTROSPUN MEMBRANES...

EVALUATING THE POTENTIAL OF ELECTROSPUN MEMBRANES FOR TISSUE SPECIFIC SIGNAL DELIVERY
IN CARTILAGE AND BONE TISSUE ENGINEERING
A DISSERTATION SUBMITTED
By
DEXY JOSEPH
IN PARTIAL FULFILMENT OF THE REQUIREMENTS FOR THE DEGREE OF
MASTER OF PHILOSOPHY
SREE CHITRA TIRUNAL INSTITUTE FOR MEDICAL SCIENCES AND TECHNOLOGY
THIRUVANANTHAPURAM– 695 012
July 2013

DECLARATION
I, Dexy Joseph, hereby declare that I had personally carried out the work depicted
in the thesis entitled “Evaluating the potential of electrospun membranes for
tissue specific signal delivery in cartilage and bone tissue engineering” under
the direct supervision of Dr. Neethu Mohan, CHVF-D, Division of Tissue
Engineering and Regenerative Technologies, Biomedical Technology Wing, Sree
Chitra Tirunal Institute for Medical Sciences and Technology, Thiruvananthapuram,
Kerala, India. External help sought are acknowledged.
Signature
Dexy Joseph

SREE CHITRA TIRUNAL INSTITUTE FOR MEDICAL SCIENCES & TECHNOLOGY
THIRUVANANTHAPURAM – 695011, INDIA (An Institute of National Importance under Govt.of India)
CERTIFICATE
This is to certify that the dissertation entitled “Evaluating the potential of
electrospun membranes for tissue specific signal delivery in cartilage and
bone tissue engineering” submitted by Dexy Joseph in partial fulfilment for the
degree of Master of Philosophy in Biomedical Technology to be awarded by this
Institute. The entire work was done by her under my supervision and guidance at,
Division of Tissue Engineering and Regenerative Technologies, Biomedical
Technology Wing, Sree Chitra Tirunal Institute for Medical Sciences and Technology
(SCTIMST), Thiruvananthapuram, 695012.
Thiruvananthapuram Signature Date Dr. Neethu Mohan CHVF- D DTERT, SCTIMST

The Dissertation
Entitled
EVALUATING THE POTENTIAL OF ELECTROSPUN MEMBRANES FOR TISSUE
SPECIFIC SIGNAL DELIVERY IN CARTILAGE AND BONE TISSUE
ENGINEERING
Submitted
By
Dexy Joseph
For
Master of Philosophy in Biomedical Technology
Of
SREE CHITRA TIRUNAL INSTITUTE FOR MEDICAL SCIENCES AND TECHNOLOGY
THIRUVANANTHAPURAM
Evaluated and approved
By
Supervisor Examiner’s Name and Designation Dr. Neethu Mohan CHVF- D DTERT

ACKNOWLEDGEMENTS
I would like to express my heartfelt gratitude to my guide Dr. Neethu Mohan and
HOD, DTERT, Dr. Prabha D Nair, for their guidance, constant encouragement,
inspiring discussions and valuable suggestions to do this work with confidence. I
would forever be grateful to you especially for giving me this incredible opportunity to
be a part of DTERT.
I express my sincere gratitude to Dr. K. Radhakrishnan (Former Director), Dr.
Jagan Mohan Tharakan (Present Director), Dr. A.V George (Registrar), Dr. C P
Sharma (Head, BMT wing) and Dr. S. Sundar Jaya Singh (Deputy Registrar),
SCTIMST for granting me permission to work in this institute and to make use of the
facilities needed during the course.
I am indebted, to Dr. Jayabalan, Dr. Sunitha, our course coordinators, for
providing me this opportunity. I thank Dr. Kallyana Krishnan, Dr. Anoop Kumar T, Dr.
K.Sreenivasan, Dr. Harikrishna Varma P. R., Dr. Lissy K Krishnan, Dr. Maya
Nandakumar and Dr. Shabareeswaran A. for allowing me to use various equipments
for my studies. I thank all other Scientists and staff at BMT campus. I would like to
thank all MPhil faculties who had conducted various course works. I thank Mrs.
Radha, Mr. Renjith, Mr. Joseph and Mr. Nishad for helping me to do my works.
On personal note, I would like to thank every member of DTERT for their support
and encouragement. I would like to thank Dr. Babitha, Dr. Dhanya, Dr. Bindu, Dr.
Lynda, Mrs. Neena, Mr. Merlin, Mr. Dhanesh, Ms. Rakhi, Mrs. Geetha, Ms. Anupama
and Ms. Neelima, Division of Tissue Engineering and Regenerative Technology for
their friendly support and helping hands.
I thank my beloved parents and all those who have directly or indirectly
contributed to the success of my work.
Above all, I thank God almighty for His blessings
Dexy Joseph

LIST OF ABBREVIATIONS
OA Osteoarthritis
ACT Autologous cell transplantation
ECM Extracellular matrix
PCL Poly(caprolactone)
PEG Poly(ethylene glycol)
PLA Poly(lactic) acid
PLGA Poly(lactic-co-glycolic)acid
FDA Food and drug administration
HCA Hydroxyl carbonate apatite
CS Chondroitin sulfate
FTIR Fourier transform infrared spectroscopy
ESEM Environmental scanning electron microscope
ADMSC Adipose derived mesenchymal stem cell
BG Bioactive glass
SEM Scanning electron microscope
GAG Glycosaminoglycans
AC Articular cartilage
MACT Matrix assisted autologous cartilage transplantation
HA Hydroxy apatite
TGF Transforming growth factor
BMP Bone morphogenic protein
IGF Insulin like growth factor
FGF Fibroblastic growth factor

ASC Adipose stem cell
MSC Mesenchymal stem cell
CSL Chondroitin sulfate low concentration
CSH Chondroitin sulfate high concentration
BGL Bioactive glass low concentration
BGH Bioactive glass high concentration
FACS Fluorescent activated cell sorting
FBS Fetal bovine serum
CD Cluster of differentiation

LIST OF CONTENTS SYNOPSIS..................................................................................................................1 1. INTRODUCTION ....................................................................................................5
1.1 Background............................................................................................................5
1.2 Literature review....................................................................................................6
1.2.1 Composition and anatomy of articular cartilage [AC] and subchondral bone.................6
1.2.2 Articular cartilage injury...................................................................................................9
1.2.3 Treatments strategies.....................................................................................................9
1.2.4 Tissue engineering.......................................................................................................10
1.2.5 Osteochondral tissue engineering................................................................................11
1.2.6 Signals used for osteochondral tissue engineering......................................................12
1.2. 7 Cells sources for osteochondral tissue engineering....................................................13
1.2.8 Chondroitin sulfate and its role in cartilage tissue engineerin ………………………....13
1.2.9 Bioactive glass in bone tissue engineering...................................................................14
1.2.10 Electrospinning...........................................................................................................14
.
1.2 Hypothesis...........................................................................................................16
1.3 Objectives............................................................................................................16
2. MATERIALS AND METHODS...............................................................................17
2.1Fabrication of biosignal incorporated membranes................................................17
2.2 Characterizations of membranes.........................................................................18
2.2.1Environmental scanning electron microscope...............................................................18
2.2.2 Total encapsulation efficiency and release profile study of CS....................................18
2.2.3 Thermo gravimetric analysis (TGA)……………………………………………………….18
2.2.4 Biomineralization studies..............................................................................................19
2.3 Isolation and culture of chondrocytes...................................................................19
2.4 Chondrocyte culture on membranes....................................................................19
2.5 Cytotoxicity analysis with chondrocytes...............................................................20
2.5.1 Live dead assay............................................................................................................20
2.5.2 Apoptosis assay............................................................................................................20
2.6 Characterizations of chondrocyte seeded constructs...........................................20
2.6.1Biochemical analysis.........................................................................................20

2.6.1.1GAG assay.................................................................................................................20
2.6.1.2 Collagen assay..........................................................................................................21
2.6.2 Histological analysis.....................................................................................................21
2.6.2.1 Safranin O.................................................................................................................21
2.6.2.2 Toluidine blue staining for GAGs..............................................................................21
2.6.2.3 Sirius red...................................................................................................................22
2.6.2.4 Alizarin red staining...................................................................................................22
2.6.3 Immunohistochemistry .................................................................................................22
2.7 Rabbit adipose derived mesenchymal stem cell isolation and culture…………23
2.8 ADMSC characterizations...................................................................................23
2.8.1 Mesenchymal marker vimentin ...................................................................................23
2.8.2 Stem cell marker CD 90...............................................................................................23
2.8.3 Cytoskeletal marker actin………………………………………………………………….23
2.9 Cytotoxicity analysis of membranes with ADSC..................................................24
2.9.1 Live dead......................................................................................................................24
2.10 ADMSC differentiation study..............................................................................24
2.10.1 Differentiation on CS membranes..............................................................................24
2.10.2 Differentiation on BG membranes..............................................................................24
2.11 Characterizations of ADMSC.............................................................................25
2.12 Gene expression studies – PCR…………………………………………………..25
2.12 Statiatical analysis.............................................................................................26
3. RESULTS AND DISCUSSION- SECTION A.........................................................27
3.1 Fabrication of biosignal embraced membranes...................................................27
3.2 Characterisation of membranes...........................................................................28
3.2.1 Environmental scanning electron microscope..............................................................28
3.2.2 Total encapsulation efficiency and release profile study of CS....................................29
3.2.3 Thermo gravimetric analysis (TGA)……………………………………………………….30

3.2.4 Biomineralization studies..............................................................................................30
3.2 Isolation and culture of chondrocytes.................................................................31
3.3 Cytotoxicity analysis with chondrocytes............................................................32
3.3.1 Live/dead assay............................................................................................................32
3.3.2 Apoptosis......................................................................................................................32
3.3.3 SEM images of cell seeded constructs……………………………………….…………..34
3.4 Characterisation of chondrocyte seeded constructs..........................................34
3.5.1 Biochemical analsyis....................................................................................................34
3.5.1.1 GAG assay................................................................................................................34
3.5.1.2Collagen assay...........................................................................................................34
3.5.2 Staining............................................................................................................35
3.5.2.1 Safranin O.....................................................................................................35
3.5.2.2 Alizarin red.....................................................................................................36
3.5.3 Immunostaining................................................................................................37
RESULTS AND DISCUSSION –SECTION B............................................................39
3.6 Rabbit adipose derived stem cell isolation and culture .......................................39
3.7 ADSC Characterisations......................................................................................39
3.8 Cytotoxicity analysis of membranes with ADMSCs.............................................40
3.8.1 Live Dead...................................................................................................................40
3.9 ADMSC differentiation on the membranes........................................................41
3.9.1 Chondrogenic differentiation – macroscopic observation of the constructs……….....41
3.9.2 Osteogenic differentiation– macroscopic observation of the constructs.......................41
3.10 Characterisation of constructs diiferentiated to chondrogenic lineage ..............42
3.10.1 Biochemical analysis..................................................................................................42
3.10.2 Staining of cryosections of constructs differentiated to chondrogenic lineage...........43
3.10.2.1 Toluidine blue staining.............................................................................................43
3.10.2.2 Sirius red staining for collagen.................................................................................44

3.10.3 Immunostaining of constructs differentiated to chondrocyte lineage…………………45
3.10.3.1 Aggrecan..............................................................................................................45
3.10.4 Gene expression studies – PCR…………………………………………………………46
3.11 Characterisation of constructs diiferentiated to osteogenic lineage…………....48
3.11.1 Staining of constructs differentiated to osteogenic lineage.........................................48
3.11.1.1 Alizarin red staining for calcium mineralization........................................................48
3.11.1.2 Sirius red staining for collagen.................................................................................49
3.11.2 Immunostaining of constructs differentiated to osteogenic lineage.............................50
3.11.2.1 Osteocalcin..............................................................................................................50
3.11.2.2 Collagen type x........................................................................................................51
3.11.3 Gene expression studies……………………………………………………….…………52
4. SUMMARY AND CONCLUSION...........................................................................54
Future prospects........................................................................................................57
Bibliography...............................................................................................................58
LIST OF FIGURES
Figure 1-1: A schematic representation of different layers of joint...........................................7
Figure 1-2: Defected cartilage..................................................................................................9
Figure 1-3: A general tissue engineering process..................................................................11
Figure 3-1: ESEM images of electrospun membranes .........................................................28
Figure 3-2: Graph showing CS release and FTIR..................................................................29
Figure 3-3: Thermogravimetric analysis of BG................................................................…...30
Figure 3-4: The ESEM images of BG membranes soaked in SBF........................................31
Figure 3-5: Goat chondrocytes of passage 2 showing a confluent monolaye….…………....31
Figure 3-6: Live dead assay of membranes...........................................................................32
Figure 3-7: Quantitative data of apoptosis assay by FACS..................................................33
Figure 3-8: SEM images of cell seeded membranes………………………………………..…34

Figure 3-9: Total GAG content...............................................................................................35
Figure 3-10: Total collagen content.......................................................................................35
Figure 3-11: Safranin O staining............................................................................................36
Figure 3-12: Alizarin red staining...........................................................................................36
Figure 3-13: Immunostaining for collagen II and aggrecan....................................................37
Figure 3-14: Immunostaining for collagen x and osteocalcin.................................................38
Figure 3-15: Phase contrast images of ADMSC....................................................................39
Figure 3-16: Immunoflourescent staining showing markers..................................................40
Figure 3-17: Live dead assay images of ADMSCs................................................................41
Figure 3-18: Macroscopic images of cell seeded constructs.................................................42
Figure 3-19: Quantitative estimation of GAG for CS.............................................................42
Figure 3-20: Toluidine blue staining for GAG........................................................................43
Figure 3-21: Sirius red staining for collagen foe CS..............................................................44
Figure 3-22: Immunostaining for aggrecan...........................................................................45
Figure 3-23: Gene expression studies – PCR………………………………………………….46
Figure 3-24: Alizarin red for calcium.....................................................................................48
Figure 3-25: Sirius red staining for collagen for BG..............................................................49
Figure 3-26: Immunostaining for osteocalcin........................................................................50
Figure 3-27: Immunostaining for collagen x...........................................................................51
Figure 3-28: Gene expression studies – PCR……………………………………………….…52
LIST OF TABLES
Table 2-1: Composition of media..........................................................................................25
Table 2-2: Primer details…………………………………………………………………………26

1
SYNOPSIS
The articular cartilage damage and associated osteoarthritis (OA) is one of
the most significant challenges facing the global health care community today.
Osteochondral defects (i.e., defects which affect both the articular cartilage and
underlying subchondral bone) that arise due to injury, genetic defects or gradual
wear and tear at the old age are often associated with mechanical instability of the
joint, and can progress to osteoarthritic degenerative changes. The process is
initiated by the loss of proteoglycans from the extracellular matrix and a disruption of
the collagenous fibrillar network, these events being followed by cell metaplasia and
matrix loss. They are frequently associated with disability and with symptoms such
as joint pain, locking phenomena and reduced or disturbed function. Since cartilage
shows very little tendency for se``lf-repair due to lack of blood supply and less
proliferative capacity of cells; these injuries are maintained for years and can
eventually lead to further degeneration (secondary osteoarthritis).
When bone surfaces become less well protected by cartilage, bone may be
exposed and get damaged. The breakdown products from the cartilage are released
into the synovial space, and the cells lining the joint attempt to remove them. New
bone outgrowths, called "spurs" or osteocysts, can form on the margins of the joints,
possibly in an attempt to improve the congruence of the articular cartilage surfaces.
These bone changes, together with the inflammation, can be both painful and
debilitating.
Some of the therapeutic interventions include lavage and arthroscopy,
debridement, shaving, laser abrasion/laser chondroplasty, subchondral drilling,
spongialization and microfracture technique. Microfracture is a process of drilling the
subchondral bone; bone marrow mesenchymal stromal cells (BMSCs) are thus
stimulated so that they migrate from the subchondral bone to the defected site in the
cartilage. However microfracture only results in the production of fibrocartilage with
inferior mechanical properties. Another technique is the replacement of damaged
cartilage with new tissue grafts (autografts or allografts). Autologous chondrocyte
transplantation (ACT) is a suitable technique where autologous chondrocytes are
isolated from healthy and non weight bearing cartilage, expanded in culture and
implanted back to the defected area. Limitations of this approach include periosteal

2
hypertrophy, ablation, uneven cell distribution, and loss of cells into the joint cavity,
resulting in repetition of surgery in up to 25% to 36% of patients.
Tissue engineering which includes principles of life sciences, material
sciences and engineering to restore or partially reconstruct a tissue is a promising
approach. The emergence of tissue engineering strategies for the repair and
regeneration of articular cartilage may provide a novel treatment foundation for the
repair and regeneration of OA. The role of the biomaterial scaffold in tissue
engineering strategies is to serve as an artificial extracellular matrix (ECM),
mimicking and recreating to some extent the structural organization and functionality
of the native ECM, so as to guide cell response and promote appropriate tissue
regeneration.
Different scaffolding materials and fabrication techniques have been
developed and explored for cartilage and bone tissue engineering individually.
However, the scaffold design requirements for osteochondral tissue engineering are
more complex than the single tissue type strategies. Recent studies have
incorporated bilayered, heterogeneous, and homogenous biomaterial scaffolds; cell
sources ranging from progenitor mesenchymal cells to autologous chondrocytes;
various growth factors; and proteins combined under physiochemical conditioning
within in vivo and in vitro environments. Simultaneous regeneration of osteogenic
and chondrogenic tissues using multiple bioactive factors via a single cell source
differentiating into different lineages within the same construct can be a better
system.
Electrospinning represents a versatile fabrication technique for tissue
engineering. It is a simple and inexpensive process by which nanofibrous scaffolds
that mimic the natural ECM can be fabricated incorporating various signal molecules.
The synthetic polymers poly (ethylene glycol) (PEG), and poly (caprolactone) (PCL)
poly (lactic acid) (PLA), poly (glycolic acid) (PGA), and their copolymer poly (lactic-
co-glycolic) acid (PLGA) have shown potential for cartilage regeneration due to their
relatively easy processability, controllable biodegradability, and already existing FDA
clinical use approval. Bioceramic materials such as bioactive glasses,
hydroxyapatite, and other calcium phosphates have been successfully adopted for
bone tissue engineering applications. This is due mainly to their excellent

3
osteoconductive and osteoinductive capabilities and their ability to deposit hydroxyl
carbonate apatite (HCA).
The present study focus on evaluating the potential of biosignal incorporated
electrospun membranes a substrate for signal delivery system towards
osteochondral tissue engineering. PCL is a FDA approved, non toxic and
biodegradable synthetic polymer widely used as a scaffold for tissue engineering.
This polymer is incorporated with tissue specific biosignals (chondroitin sulfate for
cartilage and bioactive glass for bone) and spun in the form of nano fibers using
electrospinning process. Mechanical stability of the membrane forms a major
requirement for both cartilage and bone tissue engineering. Therefore signal
incorporated nanofibrous membranes used in this study is intended to serve as a
signal delivery substrate within a mechanically stable 3 dimensional scaffold. The
present study is focused only on the development of electrospun membranes as
suitable substrates for signal delivery system.
The first chapter gives an overview of composition and anatomy of articular
cartilage, bone and interface, the articular cartilage injury, osteoarthritis, the current
treatment strategies available and limitations, promise of tissue engineering of
cartilage and bone, a review of some important tissue engineering approaches tried
so far, biosignals used for osteochondral tissue engineering, important cell sources
used and the role of electrospinning in tissue engineering.
The second chapter describes the various materials and methods employed
like the fabrication of the signal incorpotrated PCL membranes by electrospinning,
the membrane characterizations using Fourier transform infrared spectroscopy
(FTIR), Environmental scanning electron microscope (ESEM) analysis, Chondroitin
sulfate (CS) release study, Thermo gravimetric analysis (TGA) and biomineralization
study of Bioactive glass (BG) is described. The next section comprises of the
isolation of goat chondrocytes, culturing on these membranes for 21 days in
chondrocyte culture medium, cytotoxicity assays, biochemical, staining and
immunological characterizations of the cell seeded constructs. Next section of this
chapter describes the isolation of rabbit adipose derived stem cells, characterizations
for stemness, cytotoxicity assays, differentiation to chondro and osteogenic lineages,
biochemical, histological, immunohistochemical and gene expression studies of the
ADMSCs seeded constructs.

4
The third chapter includes the results and discussions of the study. Signal
incorporated PCL membranes were successfully spun. SEM analysis showed their
nanofibrous nature. The CS release study and the TGA analysis of BG confirmed the
presence of signal molecules in the PCL. The biomineralization studies showed the
enhanced bioactivity of BG. Cytotoxicity assays with both the chondrocytes and
adipose derived mesenchymal stem cells (ADMSCs) indicated that the membranes
were nontoxic to the cells. The CS membranes induced faster synthesis of cartilage
specific proteins collagen type II and aggrecan in chondrocytes. The
glycosaminiglycan (GAG) content also increased in the CS groups. The BG
constructs showed enhanced mineralization, induced hypertrophy in chondrocytes
by secreting collagen type X and osteocalcin. The ADMSCs cultured on these
membranes for 21 days showed the differentiation to osteochondral lineages. The
chondrogenic constructs showed enhanced production of aggrecan and GAG;
helped to retain the cell phenotype by expressing collagen II and did not show the
expression of collagen I (the marker for fibrocartilage). The osteogenic groups
enhanced production of osteocalcin, collagen type X and increased calcium
depositions when compared to the control.
The fourth chapter deals with summary, conclusions and future prospects of
the study. The PCL membranes fabricated by electrospinning process and
incorporated with biosignals for cartilage and bone tissues had nanofibrous
architecture. They promoted cell attachment and chondrocyte seeded on these
membranes showed enhanced production of tissue specific proteins. They also
enhanced the differentiation of ADMSCs to chondrogenic and osteogenic lineages
thus opening a new door towards signal delivery in cartilage, bone and
osteochondral tissue engineering.
Future studies include the fabrication of membranes with different
concentration of the biosignals, evaluating differentiation in the presence of lower
concentrations of growth factors or avoiding growth factors. The potential of these
membranes as signal delivery substrates within a mechanically stable 3D scaffold for
osteochondral tissue engineering also needs to be explored.

5
CHAPTER 1 - INTRODUCTION
1.1 Background
The articular cartilage damage and associated osteoarthritis (OA) is one of
the most significant challenges facing the global health care community today.
Osteoarthritis (OA) also known as degenerative arthritis or degenerative joint
disease or osteoarthrosis, is a group of mechanical abnormalities involving
degradation of joints, including articular cartilage and subchondral bone. A variety of
causes like hereditary, developmental, metabolic, and mechanical deficits may
initiate processes leading to loss of cartilage. When bone surfaces become less well
protected by cartilage, bone may be exposed and damaged. Worldwide estimates of
osteoarthritis according to WHO (2012) are that 9.6% of men and 18.0% of women
aged over 60 years have symptomatic osteoarthritis. 80% of those with osteoarthritis
will have limitations in movement, and 25% cannot perform their major daily activities
of life. It has been shown that up to 16% of injuries to the knee cause intra-articular
bleeding. Since cartilage shows very little tendency for self-repair, these injuries are
maintained for years and can eventually lead to further degeneration (secondary
osteoarthritis).
Numerous experimental and clinical attempts that have been made to induce
the healing of macroscopic lesions within mature articular cartilage aimed at re-
establishing a structurally and functionally competent repair tissue of an enduring
nature. Such lesions are generated during the course of many joint diseases, notably
osteoarthritis (OA), in conjunction with a large number of genetic or metabolic
conditions or as a result of trauma. Some of the therapeutic interventions include
lavage and arthroscopy, debridement, laser abrasion/laser chondroplasty,
subchondral drilling, spongialization, microfracture, ACT etc.
Tissue engineering holds a promising approach. Tissue engineering has
become a biological solution for the articular cartilage and osteochondral repair. The
emergence of tissue engineering strategies for the repair and regeneration of
articular cartilage may provide a novel treatment foundation for the repair and
regeneration of OA. Tissue engineering of articular cartilage involves the isolation of
articular chondrocytes or their precursor cells that may be expanded in vitro and then
seeded into a biocompatible matrix, or scaffold, for cultivation and subsequent

6
implantation into the joint. Different types of cell populations can be used for tissue
engineering like articular cartilage chondrocytes, nasal and auricular chondrocytes,
allogenic chondrocytes, embryonic stem cells, mesenchymal stem cells, bone
marrow derived stem cells etc.
Various scaffold materials have been proposed, including both naturally derived
and synthetic polymers. The role of the biomaterial scaffold in tissue engineering
strategies is to operate as an artificial extracellular matrix (ECM), mimicking and
recreating to some extent the structural organization and functionality of the native
ECM so as to guide cell response and promote appropriate tissue growth.
1.2 Literature review
Cartilage is a smooth, glistening connective tissue that lines the joints and
also found in many areas of our body. There are mainly three types of cartilage
namely hyaline cartilage that is found in knee joints, elastic cartilage found in ear and
noses and fibro cartilage found at the ends of tendons and ligaments. Articular
cartilage is a highly organized tissue that covers articular surfaces of bone that
reduces friction, resists compression, distributes load and acts as a shock absorbent.
The only cells found in cartilage are chondrocytes and these cells produce and
maintain the extra cellular matrix. Damage to articular cartilage can be caused by
several conditions including: aging, joint injury, osteochondritis, osteoarthritis and
rheumatoid arthritis. Treatment of cartilage lesion remains a major problem because
of the intrinsic biology of cartilage tissue such as limited blood supply and lack of
self-repair capacity (Redman S. N et al., 2005).
1.2.1 Composition and anatomy of articular cartilage [AC] and subchondral
bone
Chondrocytes are the only cells of cartilage and form 1% of hyaline cartilage.
Mature articular chondrocytes are has limited proliferation, appear rounded and are
completely encased in the extracellular matrix. The matrix contains different collagen
types, proteoglycans, non collagenous proteins and tissue fluid. The major collagen
types found in the cartilage are collagen type II, VI, IX, X, and XI, although type II
accounts for 90-95% of the collagen in the matrix. Type II collagen has a high
amount of bound carbohydrate groups, allowing more interaction with water (Cohen

7
NP et al., 1998). Proteoglycans are composed of 95% of polysaccharides and about
5% of protein. The protein core is associated with one or more varieties of
glycosaminoglycan (GAG) chains, hyaluronic acid, chondroitin sulfate, keratan
sulfate, dermatan sulfate and heparan sulphate; some of the GAGs generally found
in articular cartilage (Buckwalter JA et al., 1998). Aggrecan forms a major structural
component of cartilage, particularly articular cartilage and play an important role in
mediating chondrocyte-chondrocyte and chondrocyte-matrix interactions through its
ability to bind hyaluronan (Chris kiani et al., 2002). Aggrecan provides the osmotic
properties necessary for normal tissue function with the GAGs producing the
swelling pressure that counters compressive loads on the tissue. This functional
ability is dependent on a high GAG/aggrecan concentration being present in the
tissue extracellular matrix (Roughley P. et al.,2006).
Aggrecans fill most of the interfibrillar space of the ECM and are thought to be
responsible for much of the resilience and stress distribution in articular cartilage
through their ability to attract water. The non collagenous polypeptides help to
stabilize the ECM matrix and aid in chondrocyte-matrix interactions. Tissue fluid is an
essential part of hyaline cartilage, comprising up to 80% of the wet weight of the
tissue. It is the exchange of this fluid with the synovial fluid that provides nutrients
and oxygen to the avascular cartilage (Buckwalter JA, 1983).
Figure 1-1: A schematic representation of different layers of cartilage and
osteochondral interface

8
Articular cartilage can be divided into four zones (superficial, transitional,
middle and calcified) based on differences in matrix morphology and biochemistry.
The superficial zone is the thinnest having a top acellular layer and a deep layer with
flattened chondrocytes. The transitional layer has spherical chondrocytes and matrix
with high proteoglycan content and less collagen. The middle zone is the biggest
with more proteoglycans, chondrocytes are rounded, but are stacked in columns
perpendicular to the articulating surface. The calcified cartilage zone lies closest to
the subchondral bone and acts as a transition from soft hyaline cartilage to bone.
The chondrocytes here are small and mostly surrounded by calcified ECM
(Buckwalter JA et al., 1998). Chondrocytes secrete enzymes called matrix
metalloproteinase (MMPs) that degrade the cartilage matrix. The secretion of MMPs
is regulated to maintain a balance between the matrix synthesis and degradation.
Bone is a complex tissue consisting of water, collagen type I and
hydroxyapatite crystals, with the two latter components providing the tissue’s
stiffness and compressive strength. The compressive modulus of subchondral bone
(5.7 GPa) is higher than that of cartilage. The different compositions and mechanical
properties of bone and cartilage indicate the complexity of this tissue interface,
making it challenging for the design and fabrication of tissue engineering scaffold.
Bones are rigid organs that constitute part of the endoskeleton of vertebrates. They
support and protect the various organs of the body, produce red and white blood
cells and store minerals.
The different tissues found in bone are osseous tissue, bone marrow,
endosteum, periosteum, nerves, blood vessels and cartilage. The hard outer layer of
bone is composed of compact bone tissue, so-called due to its minimal gaps and
spaces. Its porosity is 5–30%. This tissue gives bones their smooth, white, and solid
appearance, and accounts for 80% of the total bone mass of an adult skeleton. The
interior of the bone is the trabecular bone tissue (an open cell porous network also
called cancellous or spongy bone), which is composed of a network of rod-like and
plate-like elements that make the overall organ lighter and allow room for blood
vessels and marrow. Trabecular bone accounts for the remaining 20% of total bone
mass but has nearly ten times the surface area of compact bone. Its porosity is 30–
90%.
9
There are several types of cells constituting the typical bone: osteoblasts,
osteocytes and osteoclasts. The majority of bone is made of the bone matrix. It is
composed primarily of inorganic hydroxyapatite and organic collagen. The inorganic
composition of bone (bone mineral) is formed from carbonated hydroxyapatite
(Ca10 (PO4)6 (OH)2) with lower crystallinity. The organic part of matrix is mainly
composed of type I collagen. This is synthesised intracellularly as tropocollagen and
then exported, forming fibrils. The organic part is also composed of various growth
factors including glycosaminoglycans, osteocalcin, osteonectin and cell attachment
factor.
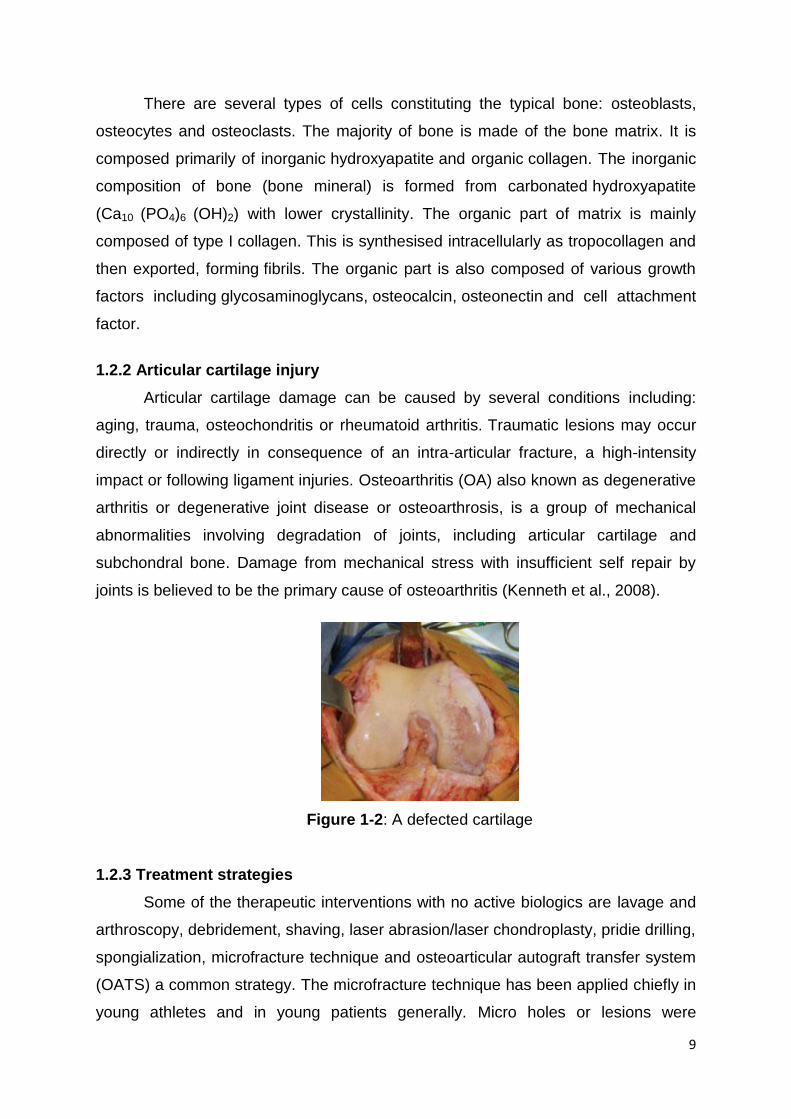
1.2.2 Articular cartilage injury
Articular cartilage damage can be caused by several conditions including:
aging, trauma, osteochondritis or rheumatoid arthritis. Traumatic lesions may occur
directly or indirectly in consequence of an intra-articular fracture, a high-intensity
impact or following ligament injuries. Osteoarthritis (OA) also known as degenerative
arthritis or degenerative joint disease or osteoarthrosis, is a group of mechanical
abnormalities involving degradation of joints, including articular cartilage and
subchondral bone. Damage from mechanical stress with insufficient self repair by
joints is believed to be the primary cause of osteoarthritis (Kenneth et al., 2008).
Figure 1-2: A defected cartilage
1.2.3 Treatment strategies
Some of the therapeutic interventions with no active biologics are lavage and
arthroscopy, debridement, shaving, laser abrasion/laser chondroplasty, pridie drilling,
spongialization, microfracture technique and osteoarticular autograft transfer system
(OATS) a common strategy. The microfracture technique has been applied chiefly in
young athletes and in young patients generally. Micro holes or lesions were

10
surgically created to the subchondral bone, causing the release of multipotent
mesenchymal stem cells from the bone marrow, may heal with repair tissue
consisting of fibrous tissue, fibrocartilage or hyaline-like cartilage.
Surgical treatments include osteotomy and distraction of joints. Osteotomy is
most frequently adopted for the treatment of painful OA. Osteotomy is undertaken to
relieve pain and to improve alignment as well as biomechanical load transfer in knee
joints. Joint distraction has been forwarded as a treatment mode for OA. This
measure has also been postulated to promote an articular cartilage repair response
within the treated joint, usually the ankle (E. B. Hunziker, 2001).
ACT is a suitable technique to improve cartilage repair where autologous
chondrocytes are isolated from small articular cartilage biopsies harvested from
healthy and non weight bearing cartilage in the joint. Chondrocytes are expanded in
monolayer (two-dimensional [2D]) culture conditions before being implanted into the
cartilage defect. Cells are injected into the defect size under a periosteal flap.
Limitations of this approach are ACT application may be impossible in certain areas
of the joint because of anatomic factors, and the fixation of the periosteal flap or
collagen sheets covering the chondrocyte suspension may be insecure, especially in
degenerative defects that lack an intact cartilage rim. Other potential complications
reported have included periosteal hypertrophy, ablation, uneven cell distribution, and
loss of cells into the joint cavity, resulting in repetition of surgery in up to 25% to 36%
of patients. A novel strategy to implant 3D cultured chondrocytes, embedded in their
own preformed neomatrix in a cartilage defect, is called matrix-assisted autologous
cartilage transplantation (MACT). Another important feature of this technique is the
ability to achieve a homogenous 3D distribution of the chondrocytes within the
biomatrix to promote their redifferentiation to build up a cartilaginous neomatrix
(Panossian A et al., 2001).
1.2.4 Tissue engineering
Tissue engineering involves the application of the principles and methods of
engineering and life science which leads to the development of biological substitutes
that restore, maintain or improve tissue function. Conventional tissue engineering is
facilitated through the use of three principal elements: scaffolds, cells, and bioactive
molecules which are combined in a suitable biological environment to produce
engineered tissue. The scaffold or three-dimensional (3D) construct provides the

11
necessary support for cells to proliferate and maintain their differentiated function,
and its architecture defines the ultimate shape of the new tissue (Redman S. N et al.,
2005). A variety of scaffolds have been developed for tissue engineering technique
like ceramic components for bone tissue engineering, hydrogels for soft tissues and
different types of natural and synthetic polymers. Hybrid scaffolds with combination
of polymers can be used for better results. Different cell populations can be used
based on the tissue to be regenerated. Stem cells and differentiated cells are the two
main options.
Figure 1-3: A general tissue culture process
1.2.5 Osteochondral tissue engineering
Simultaneous regeneration of both cartilage and bone tissues to restore the
biological and mechanical functionality of the joint with better stability and integration
is the aim of osteochondral tissue engineering. Different strategies were formulated
to fabricate osteochondral constructs.
Composite implants can be produced by seeding and culturing a high density
of chondrogenic cells directly on top of an osteoconductive biomaterial – a scaffold
for bone and scaffold free for cartilage. Wang et al. seeded primary porcine articular
chondrocytes directly onto the top surface of three commonly used biomaterials:
poly-L-lactide, poly-D-Lactide or collagen-hydroxyapatite (HA) (Wang et al., 2004). In

12
this regard, promising results were recently reported in a sheep model using
cartilage tissues grown on top of porous ceramic scaffolds (Kandel et al., 2006).
Another approach was using different scaffolds for cartilage and bone
components. Cartilaginous and/or bone-like tissues can then be engineered in vitro
within the respective scaffold layer and combined into a single composite graft by
suturing or adhering together the two layers. Schaefer et al. seeded and cultured
differentiated bovine articular chondrocytes into poly-glycolic acid (PGA) meshes and
periosteal-derived cells into polylactic-co-glycolic acid/poly-ethylene glycol foams
(PLGA/ PEG) to independently generate the cartilage and bone layers and after
culturing both the tissues were then sutured together (Schaefer et al., 2000).
Fabrication of bi/tri/multilayered scaffolds with distinct phases resulted in an
abrupt or discrete interface created by the joining of two materials. There was a
severe lack of integration at the interface, limiting the biological performance of the
regenerated tissue. Consequently, investigators explored methods to construct
scaffolds with graded structures and better integration for a smooth transition of
properties at the interface (Milind Singh et al., 2008).
1.2.6 Signals used for osteochondral tissue engineering
Cells in developing organs and tissues have the ability to detect and respond
to various types of signalling gradients by chemotaxis for viability, migration,
proliferation, and differentiation. A variety of growth factors, like the members of
transforming growth factor (TGF)-β family and bone morphogenetic proteins (BMPs),
insulin-like growth factors (e.g., IGF-1) and fibroblast growth factors (FGFs) have
shown promising roles in the regeneration of cartilage, bone, and ligament (N.
Mohan and M. Detamore, 2013).
Utilization of materials that occur naturally within the human body, such as
collagen, chondroitin sulfate (CS) and calcium phosphates, has gained immense
attention within the tissue engineering community (Amanda N. Renth and M.
Detamore 2012). Growth factors are expensive, labile, have low shelf life and might
lead to excessive tissue growth and therefore control delivery is needed. These
growth factors can be replaced by natural biosignal molecules which are less
expensive, have more shelf life and nontoxic.

13
1.2. 7 Cells sources for osteochondral tissue engineering
Articular chondrocytes have been the most popular source of cells to engineer
cartilage grafts. From the perspective of osteochondral tissue engineering, an in vitro
study reported that co-culture with chondrocytes was successful at promoting
osteogenic differentiation of mesenchymal stem cells, indicating the importance of
simultaneous triggering of osteo and chondro induction for osteochondral tissue
regeneration (Nathan H. Dormer et al., 2010). Due to the limitation in the availability
of chondrocytes for treatment, stem cells are another good alternative source, having
higher proliferation and differentiation potential. Due to ease of harvest and
abundance, adipose-derived mesenchymal stem cells (ADMSC) are an attractive,
readily available adult stem cell that has become increasingly popular for use in
many applications (HazeL Tapp et al., 2009). ADMSCs can be isolated from excess
fat which are less painful when compared to bone marrow aspiration and thus
autologous cells can be used for treatment.
MSCs (mesenchymal stem cells) have the ability to differentiate into multiple
mesenchymal tissues such as cartilage, bone, and fat (Pittenger et al., 1999).
Interactions of MSCs with their microenvironment play an important role in their
morphogenesis and downstream differentiation commitment. Using gradients of
multiple bioactive factors, multiple tissue regeneration can be done by a single cell
source, for example, stem cells can be differentiated along different lineages within
the same constructs.
1.2.8 Chondroitin sulfate and its role in cartilage tissue engineering
Chondroitin sulfate (CS) has a number of useful biological properties for
cartilage engineering including anti-inflammatory activity, water and nutrient
absorption, would healing, and biological activity at the cellular level that helps
restore arthritic joint function (Li et al., 2004; Pipitone, 1991; Ronca et al., 1998). The
presence of CS in the scaffold facilitated chondrogenesis of MSCs by providing a
chondro-inductive microenvironment. Previous studies have shown that
chondrocytes cultured on CS-modified chitosan membranes retained their phenotype
and produced cartilage specific matrix (Sechriest et al., 2000). In another study,
Huang has reported a modulatory effect of extracellular CS on chondrocytes (Huang,
1977) and a stimulatory effect of CS on proteoglycan production (Huang, 1974).

14
Additionally, CS (Versican/PG-M) is highly expressed during pre-cartilage
condensation of MSCs, suggesting its importance in chondrogenesis (Kamiya et al.,
2006; Barry et al., 2001). Although the influence of CS on chondrocytes has been
explored before, little is known about its effect on adipose derived MSC and its
chondrogenesis.
1.2.9 Bioactive glass in bone tissue engineering
Bioactive glass (BG) is a typical bioactive inorganic material. When it is
implanted in human body, a biologically active hydroxycarbonate apatite (HCA) layer
is formed on the surface. Subsequently, the bioactive materials spontaneously bond
to and integrate with living bone (Xia Li et al., 2007). Bioactive materials used for
either tissue engineering scaffolds or for in situ tissue regeneration must possess
controlled release kinetics that synchronise with the sequence of cellular changes
occurring in wound repair (Larry L. Hench et al., 2004). Another study explained the
efficacy of PLGA-BG composites in inducing the expression of the osteoblast
phenotype and subsequent development of mineralized tissue in MSC (Jun Yao et
al., 2005). V.V. Valimaki et al demonstrated the osteopromotive ability of bioactive
glass (V.V. Valimaki et al., 2004). Experiments have shown that bioactive glass
stimulates the secretion of angiogenic growth factors in fibroblasts (Gerhardt L-C et
al., 2010).
1.2.10 Electrospinning
Scaffolds for tissue engineering should mimic the structural and functional
properties of extracellular matrix in the natural environment and should help in the
formation of new tissue. Many techniques have been developed to produce different
types of scaffolds to mimic this environment but not met the adequate requirements.
Natural ECM contains collagen fibers embedded in proteoglycans. Collagen fibers
are organized in a porous 3D network.
The electrospun membranes that contains nano fibers with interconnected
pores become a biomimetric system similar to natural ECM. Another attractive
feature of electrospinning is that it can incorporate a variety of nanometer sized
objectives (eg: nanowires or nanotubes) and also growth factors, signal molecules,
drugs, dyes, enzymes etc that too alone or in combinations (Xia and Li, 2004) thus
developing multifunctional drug-releasing and bioactive scaffolds. It is a very simple

15
and inexpensive process. Due to the small fiber diameters and the overall porous
structure, electrospun fabrics have a high surface area that is beneficial for tissue
engineering applications mainly drug delivery. Electrospinning, on the other hand,
always results in an interconnected pore structure as the fibers are essentially
deposited around the pores. It is a one-step process and does not require a second
step to induce porosity. In addition, due to the small fiber diameters, the specific
surface area is high, thus resulting in more rapid solvent evaporation (H. Yoshimotoa
et al., 2003).
Having potential applications as scaffolds in cell biology and tissue
engineering, a large number of biodegradable polymers that include
polycaprolactone, pol-L-lactide and poly glycolide have been directly electrospunned
into fibers. A number of polymers have been used for producing electrospun
nanofibers in the field of cartilage and bone tissue engineering.
Li et al. have used human bone marrow-derived MSCs to assess cell
proliferation and mouse fibroblasts to assess cell interaction with electrospun PLGA
scaffolds towards cartilage tissue engineering (Li et al., 2002). PCL nano fibers were
also found to promote proliferation of chondrocytes when serum-containing cultures
were used (Li et al., 2003). Shields et al. have developed and investigated collagen
type II nano scaffolds with immortalized cell line of adult human articular
chondrocytes (Shields et al., 2004).
The potential of starch/PCL (30:70%)-based scaffolds for bone tissue
engineering was studied by Tuzlakoglu et al. (Tuzlakoglu et al., 2005). Yoshimoto et
al. have also seeded PCL nano scaffolds with neonatal rat bone marrow-derived
MSCs towards bone tissue engineering (Yoshimoto et al., 2003). Li et al.
investigated multifunctional bioactive silk fibroin fiber-based scaffolds in combination
with either BMP-2, nanoparticles of hydroxyapatite (nHAp), or with both. Scaffolds
were seeded with human bone marrow-derived MSCs towards bone tissue
engineering (Li et al., 2006). Badami et al. investigated MC3T3-E1 (mouse calvaria-
derived osteoprogenitor cell line) for osteoblastic differentiation using erlectrospun
scaffolds of copolymers (Badami et al., 2006).
The major limitation of electrospun membranes for osteochondral application
is the low mechanical properties and limited cell penetration. Also there is a limit in
the thickness at which the scaffold can be fabricated.

16
Encapsulating signals within the nanofibers are very useful to generate
substrates for appropriate cell response. Such a system helps to recreate the
structural and biochemical features of extra cellular matrix present in the native
tissue. They cannot serve as a standalone system for osteochondral tissue
engineering; where mechanical property is an important factor in the design of
scaffold. However they can serve as a suitable tissue specific signal delivery system
and be part of mechanically stable 3D scaffolds or hydrogels for osteochondral
tissue engineering.
1.3 Hypothesis
In the present study it is hypothesised that signal embraced electrospun
membranes can promote enhancement of tissue specific proteins and differentiation
of adipose derived stem cells to osteo and chondro lineages.
1.4 Objectives
1. Fabricate signal incorporated electrospun membranes and its characterizations.
2. Evaluate the cell response (chondrocytes) on signals incorporated membranes.
3. Evaluate the differentiation of ADMSCs to chondrogenic and osteogenic lineages
on signals these membranes.

17
CHAPTER 2- MATERIALS AND METHODS
MATERIALS
PCL (Mn 70,000-90,000 Da) from Sigma (Birmingham, AL) and CS
(lyophilized powder of chondroitin sulfate A sodium salt from bovine trachea) Sigma
(St. Louis MO). Bioactive glass of composition SiO2 (67.12 mol %), CaO (28.5 mol
%), and P2O5 (4.38 mol %) was synthesized by a sol-gel method as previously
reported (Mukundan L et al., 2013). Other materials used were Blyscan Sulfated
Glycosaminoglycan assay kit (Biocolor, UK), Sircoll soluble collagen assay kit
(Biocolor, UK), Ultra Tech HRP DAB kit (Immunotech Inc, France), Vybrant
Apoptosis Assay Kit. All the primers used were from IDT, antibodies were from
ABCAM and Santa Cruz and PCR reagents were from Thermo Scientific. All other
reagents and organic solvents utilized were of cell culture or ACS grade.
METHODS
2.1 Fabrication of biosignal embraced membranes
Electrospinning was used for the fabrication of membranes. For preparation of
PCL membranes, 20g of PCL (Mw 70,000 – 90,000, Sigma Aldrich) was dissolved in
100 ml of chloroform: methanol solvent mixture in the ratio (80:20). Signal molecules
were added at two different concentrations (low and high) to the polymer
solution.The polymer-biomolecule mixture were then sonicated at 50% amplitude for
50 s. This mixture was transferred to a 5 mL syringe with a 23 guage needle. A flow
rate of 0.5-1ml/hour and a voltage of 13KV were applied. The fibers were collected
on a mandrel (cathode), rotated at a speed of 500 rpm and placed at a distance of
10 -15 cms from the needle tip (anode).
The membranes were spun for 2 hrs to obtain sheets of < 2 mm thickness.
The spun membranes were carefully removed from the rotating mandrel for
subsequent use. Five different sets of electrospun membranes were fabricated for
the whole study: (1) PCL membranes (control); chondrogenic membranes were (2)
chondroitin sulfate encapsulated in PCL at low concentration and (3) chondroitin
sulfate encapsulated in PCL at high concentration. Osteogenic membranes were (4)
bioglass encapsulated in PCL at low concentration (BGL) and (5) bioglass
encapsulated in PCL at high concentration (BGH).

18
2.2 Characterizations of membranes
2.2.1 Environmental scanning electron microscope
The fiber thickness, alignment pattern and morphology of the fibers were
analysed by environmental scanning electron microscopy (ESEM) analysis (ESEM;
FET Quanta 200, FEI Netherlands). The membranes were sputter coated with gold
for better contrast in vacuum (Hitachi E101) and images were taken at two different
magnifications (4000x and 15000 x) under 20 KV. The fiber diameter was evaluated
from the SEM images using ImajeJ software.
2.2.2 Total encapsulation efficiency and release profile study of CS
The total CS encapsulated in the spun membranes was estimated.
Membranes of 1cm x1cm dimensions of both CSL and CSH groups were dissolved
using 50μL chloroform, vortexed, added 200μL of DI H2O to extract the water soluble
CS into the aqueous phase, again vortexed and centrifuged at 12000 rpm for 5
minutes. The supernatant was collected and the CS content was quantified using
Blyscan Sulfated Glycosaminoglycan Assay kit (Biocolor, UK). From this value total
CS encapsulated was calculated.
The CS release profile from the membranes, CSL and CSH was studied.
Membranes of equal dimensions (5mm x 5mm) were incubated in 1mLof PBS at
370C. At different time points (1 hr, 3 hr, 6 hr, 24 hr, 48hr, 72hr, 7 day, 10 day and 14
day) the membranes were transferred to fresh PBS and the released PBS was used
for analysis. The chondroitin sulfate released into PBS was quantified using Blyscan
dimethylmethylene blue (DMMB) assay kit (Biocolor, UK) and the percentage
release was calculated. The data was collected from 3 replicates at each time points.
The FTIR of the CS powder and the released CS were also taken and compared.
2.2.3 Thermo gravimetric analysis
Thermo gravimetric analysis was carried out to calculate the amount of
bioactive glass encapsulated in the membranes. Membranes (~ 5mg) were heated at
a rate of 10°C per minute from room temperature to 800°C and the change in weight
was determined from the thermograms.

19
2.2.4 Biomineralization studies
Biomineralization was carried out using simulatory body fluid (SBF), a
technique to study the formation of apatite layer which indicates bone bioactivity.
Membranes of dimension 2 cm x 2 cm were used for the study. The control
membrane PCL and bone signal incorporated membranes BGL and BGH were
soaked in stimulatory body fluid (SBF) for 14 days. They were further washed with
deionized water once, frozen at -80oC, lyophilized for 6 hrs and analyzed using
ESEM with energy dispersive X-ray spectroscopy (EDS) (OXFORD X-ray
microanalysis software, OXFORD Instruments, UK).
2.3 Isolation and culture of chondrocytes
Primary cells were isolated from articular cartilage of goat knee obtained from
slaughter house. In a sterile environment the knee joints were opened and cartilage
tissue was scraped using scalpel blade and washed with PBS containing antibiotic-
antimycotic solution. The tissue was chopped into 0.5mm size and digested using
0.2% collagenase type II, 10 ml of solution per gram of tissue (Sigma Aldrich
422units/mg) for 3.5 hrs. Collagenase activity was stopped by adding 10% serum
containing media. The cells were collected by centrifugation at 1750 rpm for 10
minutes and seeded into T25 flasks and supplemented with chondrocyte culture
media (DMEM-HG supplemented with 10% FBS (US Origin, Life technologies), 1x
antibiotic-antimycotic, 1x non essential amino acid (NEAA), 1mM sodium pyruvate, 2
mM glutamine, 40 µg/mL proline, 50 µg/mL ascorbic acid, 10-7 M
dexamethasone).The flasks were incubated in a 37°C, 5% CO2 humidified incubator
until it forms a confluent monolayer. The cells were trypsinized and passaged for
further studies. All the studies were done on cells of passage 2 or 3.
2.4 Chondrocyte culture on membranes
Chondrocytes at a density of 0.2x10⁶ were seeded on five different groups of
electrospun membranes (5mm x 5mm) kept in 96 well plate. After keeping for 45
minutes for cell adhesion all the groups were supplemented with chondrocyte culture
medium (table 1-1). The constructs were incubated at 370 C for a period of 21 days
by supplementing the medium once in 2 days and retrieved for further analysis.
Three replicates were used for biochemical analysis.

20
2.5 Cytotoxicity analysis with chondrocytes
2.5.1 Live dead assay
The viability of the cells on the membranes was qualitatively assessed using
live/dead assay. The constructs were incubated with 100μl (2μL in 1000μL PBS) of
calcein (4mM) for 30 minutes in dark at 370C. Then100μL (1μL in 1000μL PBS) of
EtBr (2mM) was added and incubated for 10 minutes, the dye was removed, washed
with PBS and observed under microscope (DMIL, Leica Generic, Switzerland).
Calcien was observed using green filter and EtBr using red filter. The images were
captured and merged using the Leica overlay software.
2.5.2 Apoptosis assay
Quantitative estimation of cytotoxicity was carried out with apoptosis assay. For
this, membranes of dimension 2 cm x 2 cm were kept in direct contact on a
monolayer of 1 x10⁶ cells. After 96 hrs the cells were trypsinized and were stained
using Vybrant Apoptosis Assay Kit according to the manufacturer's protocol. After
staining, the cells were washed and resuspended in 300 μl PBS, and analyzed using
a flow cytometer (FACS Aria, BD Biosciences, San Jose, CA, USA) and estimated
the percentage of apoptotic/necrotic cells.
2.6 Characterizations of chondrocyte seeded constructs
2.6.1 Biochemical Analysis
The ECM produced by the cells were digested using papain solution by
incubating at 650 C for 3 hrs, vortexed and centrifuged at 14,000 rpm for 10 minutes
at 20 0 C. Supernatent was transferred to another vial and frozen at -200C for further
studies. This digested solution was used for GAG assay and collagen assay.
2.6.1.1 GAG assay
Glycosaminoglycan content in the papain digested samples was measured
using the Blyscan Sulfated Glycosaminoglycan Assay kit (Biocolor lifescience
assays, UK). GAG of standards, tests and blank were used for analysis. To each

21
tube added 1ml of dye reagent, mixed and incubated for 30 minutes with gentle
shaking.
After incubation the tubes were centrifuged at 12,000 rpm for 10 minutes. The
supernatant was discarded and the dye-GAG complex was redissolved in 0.5 ml of
dissociation reagent. The tubes were vortexed till all the unbound dye is dissolved.
200 ul of each sample were transferred to 96 well plate and read at 656nm.
2.6.1.2 Collagen assay
The total soluble collagen in the papain digested solution was measured using
Sircoll soluble collagen assay kit (Biocolor life science assays). Collagen standards
of concentrations 2.5, 5, 7.5, 10 and 12.5 μg were prepared using the reference
standard collagen in the kit. 100ul of standards, tests and blank were used for
analysis. To each tube 1ml of dye reagent was added, mixed and incubated for 30
minutes with gentle shaking. After incubation the tubes were centrifuged at 12,000
rpm for 10 minutes. The supernatant was discarded and the dye-collagen complex
was redissolved in 250 μl of dissociation reagent. The tubes were vortexed till all the
unbound dye is dissolved. 200 μl of each sample was transferred to 96 well plate
and read at 555nm.
2.6.2 Staining of membranes
2.6.2.1 Safranin O
Safranin O was used to stain the glycosaminiglycans present in the cells and
ECM. For this the cells were fixed with 4% paraformaldehyde for 20 minutes,
washed thrice with PBS, added nuclear stain Mayer’s hematoxylin for 5-15 minutes,
destained with acid alcohol, rinsed with tap water, stained with 0.02% FCF for 3
minutes and washed with acetic acid for 30 seconds. Further 0.1% safranin O stain
was added for 5 – 15 minutes. Washed with distilled water, air dried, mounted and
viewed under microscope (Leica DM 4000M).
2.6.2.2 Toluidine blue staining for GAGs
Toluidine blue staining was also used for detecting the presence of
glycosaminoglycans. For this the cells on membranes were fixed with 4% PFA for 20
minutes and then washed thrice with PBS. Toluidine blue stain was added for 5

22
minutes, washed with distilled water to remove the excess stain, air dried, observed
under microscope and images were taken.
2.6.2.3 Sirius red
Sirius red was used to stain the collagen present in the ECM and for this the
cells were fixed with 4% paraformaldehyde, washed thrice with PBS, stained nuclei
using Mayer’s Hematoxylin for 5 minutes, allowed for bluing in tap water for 10
minutes. Picro Sirius red solution A was added for 60 minutes at room temperature.
The excess stain was physically removed by vigorous shaking/ gentle blotting.
Dehydrated in 100 % alcohol, mounted and images were taken.
2.6.2.4 Alizarin red staining
The presence of calcium depositions and mineralizations can be detected
using Alizarin red staining. The cells were fixed with 4% paraformaldehyde for 20
minutes, washed thrice with PBS and added the nuclear stain Mayer’s Hematoxylin
for 5 minutes. Then they were allowed for bluing in tap water for 10 minutes. Added
Alizarin red solution and incubated at dark for 45 minutes. Removed the stain and
washed twice to remove the dye particles. The samples were air dried, mounted and
imaged using microscope (Leica DM 4000M).
2.6.3 Immunostaining (DAB)
For immunohistochemistry, the samples were fixed with 4%
paraformaldehyde and then blocked with protein blocking agent in the DAB kit. PCL,
CSL and CSH membranes were stained for the presence of collagen type II and
aggrecan with rabbit polyclonal anti-collagen type II (1:20 dilution;abcam- AB 746P),
rabbit anti-aggrecan (1:10 dilution; Santa Cruz- SC 25674), primary antibodies. The
PCL, BGL and BGH membranes were stained for collagen X and osteocalcin with
rabbit polyclonal anti-collagen type X (1:20 dilution; abcam-AB 58632), rabbit anti-
osteocalcin (1:20 dilution; Santa Cruz- SC 30044), primary antibodies. The primary
antibodies were followed by incubation with a secondary antibody, the streptavidin-
biotin, and DAB substrate as per the manufacturer’s protocol in Ultra Tech HRP
(DAB) kit (Immunotech Inc, Beckman Coulter, Marseille, France). Nuclear staining
was done using Mayer’s hematoxylin. Negative controls were run with the primary
antibody omitted.

23
2.7 Rabbit adipose derived stem cell (ADSC) isolation and culture
Adipose tissue from the dorsal side of New Zealand white rabbits were
collected with approval of IAEC under CPCSEA guidelines. The tissue was
incubated in PBS with 5x antibiotic-antimycotic solution for 15 minutes, then washed
many times with 2x and then 1x antibiotic-antimycotic solutions in sterile
environment, then removed all other tissue reminents like blood vessels, chopped
into fine pieces, digested with 0.1% collagenase type II for 30 minutes. After
digestion, collagenase activity was stopped with 10% FBS containing media,
centrifuged at 1750 rpm, collected the cells and seeded into T 25 flasks. The isolated
cells were cultured in alpha MEM with 5% FBS, cultured upto 3rd passage and used
for ADMSC characterization and then differentiation study.
2.8 ADMSC characterizations
2.8.1 Mesenchymal marker vimentin
ADMSC cells of passage 3 were seeded on coverslips at a density of
0.05x10⁶. After 24 hours the cells were fixed with 4% paraformaldehyde for 20
minutes, permeabilized with 50% chilled methanol for 30 minutes, blocked with 0.5%
BSA for 300 minutes, and incubated with flouroscein conjugated mouse anti-porcine
Vimentin IgG (1:50 dilution) for 1hr and observed under fluorescent microscope
(DMIL, Leica Generic, Switzerland ).
2.8.2 Stem cell marker CD 90
ADMSC cells of passage 3 were seeded on coverslips at a density of
0.05x10⁶. After 24 hrs the cells were fixed with 4% paraformaldehyde for 20 minutes,
blocked with 0.5 % BSA for 30 minutes, incubated with FITC conjugated CD 90 (1:25
dilution) for overnight at 40C and observed under fluorescent microscope (DMIL,
Leica Generic, Switzerland).
2.8.2 Cytoskeletal marker actin
ADMSC cells of passage 3 were seeded on well plate at a density of
0.05x10⁶. After 24 hrs the cells were fixed with 4%paraformaldehyde for 20 minutes,
permeabilized with 50% chilled methanol for 20 minutes and incubated with actin-

24
phalloidin (1:50 dilution) at room temperature for 1 hr. After incubation added the
nuclear stain hoescht and incubated for 10 minutes and then observed under
fluorescent microscope (DMIL, Leica Generic, Switzerland).
2.9 Cytotoxicity analysis of membranes with ADSC
2.9.1 Live dead
The viability of ADSCs on the membranes was assessed using live/dead
assay kit. Cells were seeded on to coverslips coated with membranes at a density of
0.05 x 10⁶, cultured till 80% confluent and cytotoxicity was checked. Live dead assay
was done as described in section 2.5.1.
2.10 ADMSC differentiation study
2.10.1 Differentiation on CS membranes
Cells of passage 3 were used for the differentiation studies. Chondrogenic
differentiation was done on chondroitin sulfate incorporated scaffolds CSL and CSH.
PCL membranes were used as the control. Cells were seeded at a density of
0.2x10⁶ on each membrane, kept for 45 minutes incubation and supplemented with
DMEM HG with 10% FBS.
After 24 hrs the scaffolds were divided into 2 groups namely with growth
factor and without growth factor. The group with growth factor was supplemented
with chondrogenic media (Table 1-1) and IGF (100 ng/mL) as growth factor. The
group without growth factor was supplemented with chondrogenic media only. Day 7
and day 21 were taken as two time points for the study.
2.10.2 Differentiation on BG membranes
Cells of passage 3 were used for the differentiation. Osteogenic
differentiation was done on bioactive glass incorporated scaffolds BGL and BGH.
PCL membranes were used as the control. Cells were seeded at a density of
0.2x10⁶ on each scaffold, kept for 45 minutes incubation and supplemented with
DMEM HG with 10% FBS.
After 24 hrs the scaffolds were divided into 2 groups namely with growth
factor and without growth factor. The group with growth factor was supplemented
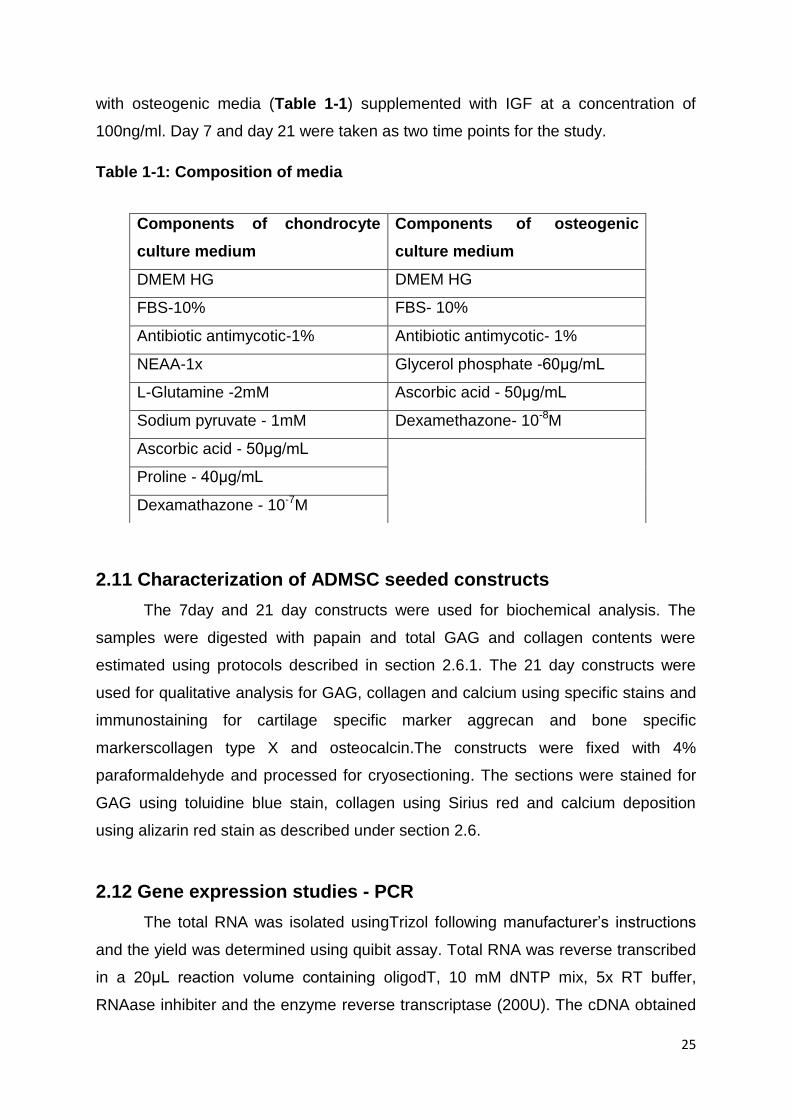
25
with osteogenic media (Table 1-1) supplemented with IGF at a concentration of
100ng/ml. Day 7 and day 21 were taken as two time points for the study.
Table 1-1: Composition of media
2.11 Characterization of ADMSC seeded constructs
The 7day and 21 day constructs were used for biochemical analysis. The
samples were digested with papain and total GAG and collagen contents were
estimated using protocols described in section 2.6.1. The 21 day constructs were
used for qualitative analysis for GAG, collagen and calcium using specific stains and
immunostaining for cartilage specific marker aggrecan and bone specific
markerscollagen type X and osteocalcin.The constructs were fixed with 4%
paraformaldehyde and processed for cryosectioning. The sections were stained for
GAG using toluidine blue stain, collagen using Sirius red and calcium deposition
using alizarin red stain as described under section 2.6.
2.12 Gene expression studies - PCR
The total RNA was isolated usingTrizol following manufacturer’s instructions
and the yield was determined using quibit assay. Total RNA was reverse transcribed
in a 20μL reaction volume containing oligodT, 10 mM dNTP mix, 5x RT buffer,
RNAase inhibiter and the enzyme reverse transcriptase (200U). The cDNA obtained
Components of chondrocyte
culture medium
Components of osteogenic
culture medium
DMEM HG DMEM HG
FBS-10% FBS- 10%
Antibiotic antimycotic-1% Antibiotic antimycotic- 1%
NEAA-1x Glycerol phosphate -60μg/mL
L-Glutamine -2mM Ascorbic acid - 50μg/mL
Sodium pyruvate - 1mM Dexamethazone- 10-8M
Ascorbic acid - 50μg/mL
Proline - 40μg/mL
Dexamathazone - 10-7M

26
were amplified using specific primers collagen type II & collagen type I for
chondrogenic samples and osteonectin for osteogenic samples in a 12.5 μL reaction
volume containing 10x Taq buffer, 10 mM dNTP mix and MgCl2 and the enzyme Taq
Polymerase (100U). The primer details are described in the table 1-2.
Electrophoresis of the amplified products was carried out using 2% agarose gels
against the control β-actin. Gel images were taken using Alpha imager.
Table 1-2: Primer details
Primers Sequence
1.β-actin F- 5’ GCT CGT CGA CAA CGG CTC 3’
R- 5’ CAA ACA TGA TCT GGG TCA TCT TCT C 3’
2.Collagen type II F- 5’ GCA CCC ATG GAC ATT GGA GGG 3’
R- 5’ GAC ACG GAG TAG CAC CAT CG 3’
3.Collagen type I F- 5’ CGT GGT GAC AAG GGT GAG AC 3’
R- 5’ TAG GTG ATG TTC TGG GAG GC 3’
4.Osteonectin F- 5’ AGT AGG GCC TGG ATC TTC TT3’
R- 5’ CTG CTT CTC AGT CAG AAG GT 3’
2.13 Statistical analysis
Statistical analyses were performed using a single factor analysis of variance
(ANOVA) with a Tukey’s post-hoc test using GraphPad Prism version 5.02 for
Windows, (GraphPad software, La Jolla, CA, USA). All quantitative results were
expressed as the average ± standard deviation. Values of p<0.05 were considered
significant.

27
CHAPTER 3 - RESULTS AND DISCUSSION - SECTION A
3.1 Fabrication of biosignal embraced membranes
The process electrospinning generates nanofibrous membranes that mimic
the extra cellular matrix in its structure, with open interconnected pores and the large
surface area of the fibers is suitable for signal delivery The present study used PCL
(20 wt %) as polymer to incorporate the biosignals for bone and cartilage. PCL is a
FDA approved, biocompatible and biodegradable polymer and is widely used in the
fabrication of scaffolds for bone and cartilage tissue engineering (Yoshimoto et al.,
2003).
Chondroitin sulfate (CS) was used as the signal molecule for the fabrication of
chondrogenic membranes. CS is the major glycosaminoglycan molecule found in the
ECM of cartilage. An in vitro study demonstrated that the synergistic action of the CS
moieties of the scaffold along with TGFβ can provide a microenvironment that is
conducive for MSC chondrogenesis (Shyni Varghese et al., 2008). It has been
shown that CS has anti-apoptotic properties which reduced the sensibility of rabbit
chondrocytes to apoptosis (Jomphe et al., 2008). However dispersion of CS in
nanoscale within nanofibrous membranes and response to it has not been explored
so far. PCL-CS membranes with two concentrations were fabricated; a lower
concentration and a higher concentration scaffold.
For the present study bioactive glass was used as the osteogenic signal in
PCL nanofibers. Bioactive glass (BG) is a typical bioactive inorganic material and
spontaneously bond to and integrate with living bone as extensively reported by
Larry L. Hench. A sol gel derived BG of composition SiO2 (67.12 mol%), CaO
(28.5mol%), and P2O5 (4.38mol%) was used for the study. Sol gel method is a
chemical synthesis technique that involves the conversion of a sol which is a
suspension of very small, colloidal particles to a three dimensional interconnected
network termed gel (Lakshmi et al., 2013).

28
3.2 Characterisation of membranes
3.2.1 Scanning electron microscopy
Electrospinning helps in fabricating nanofibers that mimic the natural ECM
which favors the cell attachment and growth. The polymer concentration, solvent
mixture ratio, the concentration of biosignals, the electrospinning parameters were
optimised to obtain the nanofibrous membranes as described in methods.
The ESEM and image analysis (Fig. 3-1) depicts the fiber diameter, fiber
alignment and morphology. A semi aligned pattern was obtained with fiber diameter
in the range of 200-400nm and few large fibers with less than 2 microns. PCL, CSL
and CSH groups had a similar alignment pattern and smooth fibers which indicated
that the biomolecule incorporated was uniformly mixed in the polymer solution. BGL
and BGH groups contained a mixture of small and large diameter fibers, BGL
appeared smooth but BGH fibers contained depositions of bioactive aggregates.
Figure 3-1: SEM images of electrospun membranes

29
3.2.2 Total encapsulation efficiency and release profile study of CS
The total CS incorporated in the membranes was estimated as 0.1wt% in CS
low concentration and 0.5wt% in CS high concentration. The graph (Fig. 3-2(a))
shows the release profile of CS incorporated in the membranes CSL and CSH at
different time points from 1hr to 14 day in PBS. The release at different time points
and the cumulative release were calculated. CS is a water soluble molecule and in
both the groups 30% of CS was released in the 1st hr. 100% of the incorporated CS
was released in the 3rd day in CSL and in the CSH group 80% was released by 14th
day and remaining 20% was retained within the membrane beyond 14th day. This
released CS would be available to the cells for generating a favourable
microenvironment or it could be utilised by the cells.
The FTIR spectra (Fig. 3-2(b)) showed similar peaks [1616 and 1416 cm−1 for
COO− group (*), 1230 cm−1 for SO42− group (**), sugar groups in the range of 1000-
1200 cm−1 (@)] in the raw CS powder and the CS released from the membranes
indicating that the fabrication process have not affected the chemical structure of the
biosignal.
Figure 3-2: Graph showing a)CS release and b) FTIR spectra

30
3.2.3 Thermogravimetric analysis
Thermogravimetric analysis (TGA) was carried out to quantify the amount of
bioactive glass present in the prefabricated membranes. PCL was found to be
completely burnt out at 4280C. At this temperature, about 3wt% was present for BGL
and 15wt% was present for BGH. This indicated that the polymer (PCL with melting
point 60-650C) was completely burnt out at this temperature and the remaining
residues left behind could be the bioactive glass particles which melts only at a
higher temperature.Thus the amount of BG encapsulated in BGL was found to be
3wt% and BGH was found to be 15wt%.
Figure 3-3: TGA thermogram showing the percentage weight of different samples at
4280C.
3.2.4 Biomineralization studies
The SBF can be used as an in vitro testing method to study the formation of
apatite layer on the surface of implants so as to predict the in vivo bone bioactivity (Li
et al.2007). ESEM images of the control PCL and BG membranes after soaking in
SBF for 2 weeks were shown in fig. 3-4. A continuous layer of dense spherical
nodules was formed on the surface of the BG membrane that resembled apatite

31
formation while the control PCL showed only salt crystals that did not resemble the
apatite in its morphology.
Figure 3-4: The ESEM images of control PCL and BG membranes after soaking in
SBF for 14 days.
3.2 Isolation and culture of chondrocytes
The phase contrast image below shows a confluent monolayer of passage 2
chondrocytes showing hexagonal morphology. Cells of passage 3 were used for
further studies. Cells were seeded on the membranes at a density of 0.2 x10⁶ on the
five different groups (PCL, CSL, CSH, BGL and BGH) and cultured for a period of 21
days.
Figure 3-5: Goat chondrocytes of passage 2 showing a confluent monolayer
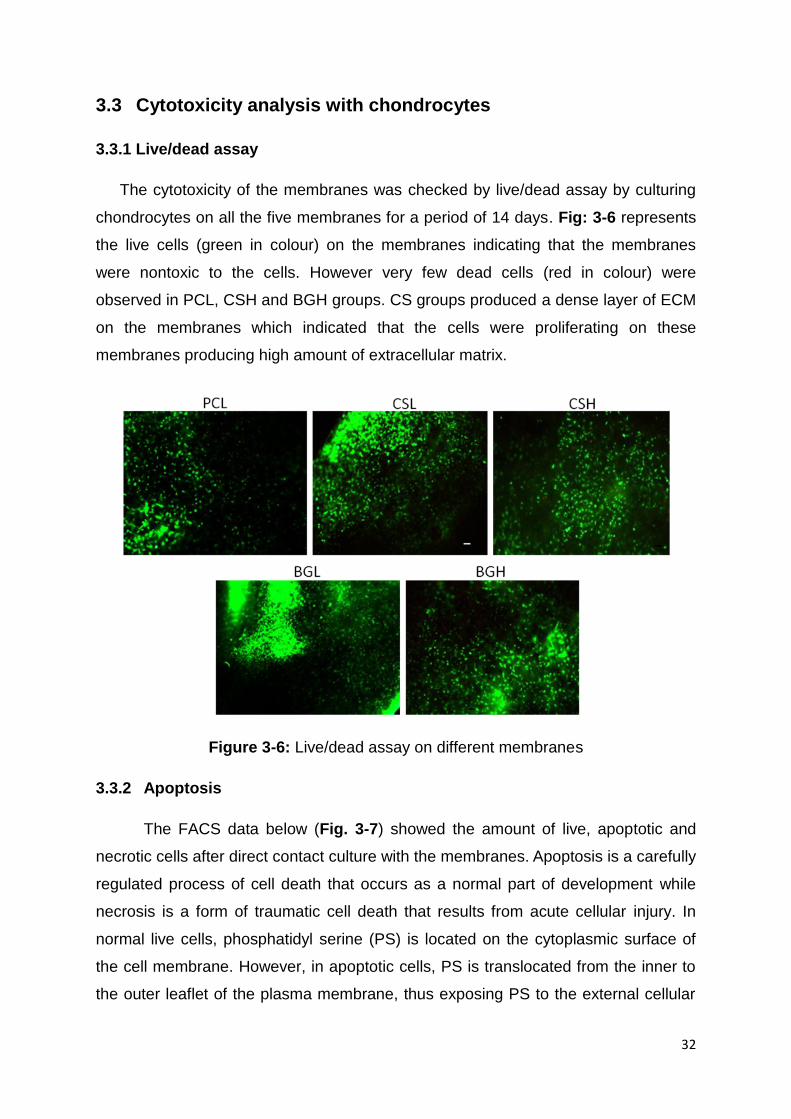
32
3.3 Cytotoxicity analysis with chondrocytes
3.3.1 Live/dead assay
The cytotoxicity of the membranes was checked by live/dead assay by culturing
chondrocytes on all the five membranes for a period of 14 days. Fig: 3-6 represents
the live cells (green in colour) on the membranes indicating that the membranes
were nontoxic to the cells. However very few dead cells (red in colour) were
observed in PCL, CSH and BGH groups. CS groups produced a dense layer of ECM
on the membranes which indicated that the cells were proliferating on these
membranes producing high amount of extracellular matrix.
Figure 3-6: Live/dead assay on different membranes
3.3.2 Apoptosis
The FACS data below (Fig. 3-7) showed the amount of live, apoptotic and
necrotic cells after direct contact culture with the membranes. Apoptosis is a carefully
regulated process of cell death that occurs as a normal part of development while
necrosis is a form of traumatic cell death that results from acute cellular injury. In
normal live cells, phosphatidyl serine (PS) is located on the cytoplasmic surface of
the cell membrane. However, in apoptotic cells, PS is translocated from the inner to
the outer leaflet of the plasma membrane, thus exposing PS to the external cellular

33
environment. The human anticoagulant, annexin V, is a Ca2+ dependent
phospholipid-binding protein that has a high affinity for PS. Annexin V labeled with a
fluorophore or biotin can identify apoptotic cells by binding to PS exposed on the
outer leaflet. The red-fluorescent propidium iodide (PI) is impermeant to live cells
and apoptotic cells, but stains dead cells with red fluorescence, binding tightly to the
nucleic acids in the cell.
Figure 3-7: Quantitative data of apoptosis assay by FACS
For CSL group 3.4% cells were apoptic and 0.2% were both apoptic and
necrotic. For CS H 1.6% were apoptic 0.1 % were both apoptic and necrotic. For
BHL 4.9% of cells were apoptic and only 0.1% were both apoptic and necrotic and
for BGH 5.1% cells were apoptic and only 0.1% were both apoptic and necrotic.
However the apoptic and necrotic cells were less than 5% and our further results
indicated that they did not significantly influence the culture.

34
3.3.3 SEM of cell seeded constructs
The SEM images of cell seeded PCL and CSL membranes were taken after
24 hours. The results indicated that the membranes helped to maintain the spherical
morphology of the chondrocytes.
PCL CSL
Figure 3-8: SEM images of membranes seeded with chondrocytes after 24 hrs.
3.4 Characterisation of chondrocyte seeded constructs
3.4.1 Biochemical analsyis
3.4.1.1 GAG assay
The ECM produced by the cells was digested using papain and the GAGs
presented in the digested solution were estimated using Blyscan GAG assay. The
samples on incubating with the dye reagent formed a GAG-dye complex which was
precipitated out from and redissolved for analysis. The graph (Fig 3-9) showed the
quantitative values of the total GAG content produced by chondrocytes after
culturing on the membranes for 21 days. CSL group showed the highest GAG
content when compared to other groups. CSH, BGL and BGH had higher GAG when
compared to the control group PCL. Values are reported as mean of ± of standard
deviation, n=3. ** (p=0.0002) represents significantly higher values than all other
groups and * (p=0.05) represents higher values when compared to the control.

35
Figure 3-9: Total GAG content of day 21 chondrocyte seeded constructs
3.4.1.2 Collagen assay
The total collagen content was evaluated by Sircol collagen assay kit which
showed (Fig 3-10) no significant difference in the collagen content among different
groups. Though CSL and CSH groups showed higher collagen when compared to
PCL, our statistical analysis indicated that there was no significant difference with
respect to control PCL.
Figure 3-10: Total collagen content of day 21 chondrocyte seeded constructs
3.4.2 Staining of membranes
3.5.2.1 Safranin O
Safranin O staining (Fig 3-11) also showed a similar observation as in the
quantitative data for total GAG. The higher staining intensity in CSL indicated the

36
increased GAG content and CSH also showed comparatively higher GAG content
than the bioactive groups BGL and BGH and control PCL.
Figure 3-11: Safranin O staining of chondrocytes seeded on membranes.
3.5.2.2 Alizarin red
The Alizarin red staining (Fig 3-12) clearly showed calcium depositions in red
colour in both the BG groups; when compared to the control PCL and the CS groups
with higher amount in BGH. The data indicated that the encapsulated BG has
enhanced mineralization in chondrocytes. Mineralization of chondrocyte is observed
in hypertrophic phenotype and also in calcified zone of cartilage-bone interface
(Johnna S. Temeno and Antonios G. Mikos, 2000).
Figure 3-12: Alizarin red staining of chondrocytes seeded on membranes.

37
3.4.3 Immunostaining
The fig 3-13 shows the immunostaining of the CS incorporated membranes
and control PCL for antibodies aggrecan and collagen type II. All the groups showed
positivity which was indicated by brown color but both the CS groups have showed
higher staining intensity when compared to the control. Negative controls showed no
positivity for the staining.
Figure 3-13: Immunostaining of chondrocyte seeded membranes after 21 days for
Aggrecan and Collagen type II.

38
The fig 3-14 shows the immunostaining of bioactive glass incorporated
membranes with PCL as positive control for antibodies collagen X and osteocalcein.
BG groups showed increased protein content when compared to the control groups.
Collagen X is secreted by chondrocytes in hypertrophic condition (L.C. Gerstenfeild
and F.D. Shapiro, 1996). The data indicated that bioactive glass induced hypertrophy
in chondrocytes and enhanced the production of bone protein.
Figure 3-14: Immunostaining of chondrocyte seeded membranes after 21 days for
Osteocalcin and Collagen type X.

39
CHAPTER 3 - RESULTS AND DISCUSSION - SECTION B
3.6 Rabbit adipose derived mesenchymal stem cell (ADMSC)
isolation and culture
Adipose tissue was collected from New Zealand white rabbits with the approval of
the institute. ADMSCs were isolated using standard protocols and cultured in α-MEM
with 5% FBS. The isolated cells displayed a fibroblastic morphology and were plastic
adherent. Most of the blood cells and other nonspecific cells were removed in 1st and
2nd passages and the stem cell population thus obtained were used for further
studies. The cells were maintained by giving only 5% FBS which avoids any
differentiation and maintains the stem cell property. The fig 3-15 is a confluent
monolayer of ADMSCs at two different magnifications showing typical fibroblastic
morphology.
Figure 3-15: Phase contrast image of ADMSCs at 10 x and 20 x.
3.7 ADMSC Characterisations
It is essential to confirm that the isolated population possess stem cell properties.
Fig 3-16 shows the positivity of ADMSCs to mesenchymal marker a)Vimentin, b)
stem cell marker CD 90 and c) cytoskeletal marker actin. Vimentin is an intracellular
marker and is indicated in green colour in the figure (a) and counter stained with
hoechst for the nucleus. CD 90 or Thy-1 is a surface marker which is indicated in

40
green colour in the figure (b) with hoechst staining the nuclei. This data proved that
the cells were of mesenchymal origin and had stem cell property.
Figure 3-16: a) Mesenchymal marker vimentin and b) Stem cell marker CD90 and c)
cytoskeletal marker actin.
3.8 Cytotoxicity analysis of membranes with ADMSCs
3.8.1 Live Dead
The cytotoxicity of membranes on ADMSCs was assessed by live dead
assay. ADMSCs were cultured on PCL, CSH and BGH membranes spun and
collected on glass coverslips. The image below shows uniform distribution of cells on
all the membranes with CSH and BGH groups having cell aggregation and faster cell
spreading than in PCL control. Very few dead cells were observed in all the three
groups which indicated that the membranes were nontoxic to ADMSCs. The cell
aggregation and faster spreading in CSH and BGH membranes indicated that the
cells responded positively to the biosignals incorporated and started multiplying.

41
Figure 3-17: Live dead image of ADMSCs cultured on nano fibers collected on glass
coverslips a) PCL, b) CSH and c) BGH after 3 days incubation.
3.9 ADMSC differentiation on the membranes
3.9.1 Chondrogenic differentiation – macroscopic observation of the
constructs
Biosignal (CS) incorporated membranes supplemented with chondrogenic
medium have induced the differentiation of ADMSCs which showed high amount of
ECM at day7 and was observed in both the groups –IGF and +IGF and the
membranes were found to be folded inside the ECM layer. IGF induced more ECM
production and cell proliferation when compared with the other groups. In the 21 day
constructs, the membranes were totally covered with ECM and the membranes were
observed to be rolled inside this thick ECM layer.
3.9.2 Osteogenic differentiation– macroscopic observation of the constructs
At day 7 no visible layer of ECM was observed on these constructs; however by
21 day they also developed a thick layer of ECM around the membrane and the
membranes were found embedded inside this ECM.

42
Figure 3-18: Macroscopic observation of constructs after 21 days
3.10 Characterisation of ADMSC seeded constructs differentiated
to chondrogenic lineage
3.10.1 Biochemical analysis
The total GAG content on day 7 and day 21 in CS encapsulated and control
PCL constructs are represented in fig 3-19. An increase in total GAG content was
observed from day 7 to day 21 in all the groups. At day 7 no significant differences
could be observed between the constructs. At day 21 the CS encapsulated
constructs showed higher GAG in both growth factor deprived and supplemented
groups.
Figure 3-19: The qualitative estimation of GAGs for ADMSCs cultured with
chondrogenic induction.

43
3.10.2 Staining of cryosections of constructs differentiated to chondrogenic
lineage
3.10.2.1 Toluidine blue staining
Toluidine blue exhibit metachromasia when bound to the glycosaminoglycans
and appear in purple to pink colour, while the nucleus of the cells appears in blue.
Purple colour becomes more evident in constructs with higher GAG content. The
growth factor supplemented groups showed higher GAG with stain in purple colour
when compared to growth factor deprived groups. In the growth factor supplemented
groups; CSL, CSH had higher GAG when compared to control PCL, The ECM on
these constructs appeared in a well arranged pattern as in tissues.
Figure 3-20: Toluidine blue staining of sections after 21 days

44
3.10.2.2 Sirius red staining for collagen
Sirius red stains the collagen fibers in the extracellular matrix. In bright-field
microscopy collagen is red. The observations indicated that except the control PCL
in –IGF group, all other samples showed higher stain intensity. In presence of IGF
the collagen production was enhanced in both the PCL and CS constructs. The
macroscopic observations indicated that the PCL sample in the –IGF group had only
a thin layer of ECM which correlates the lower stain intensity in sirius red and lower
collagen content.
FIigure 3-21: Sirius red staining for collagen after 21 days

45
3.10.3 Immunostaining of constructs differentiated to chondrocyte lineage
3.10.3.1 Aggrecan
Aggrecan is a proteoglycan which forms a major structural component of
cartilage, particularly articular cartilage. The figure 3-22 shows the immunostaining
for aggrecan which indicated that the stain intensity were higher in CSL and CSH
membranes in both –IGF and + IGF groups when compared to the control PCL. This
indicated that the presence of CS promoted the synthesis of proteoglycans. Brown
colour indicates positivity of proteins on the ECM secreted by the cells and black
color represents the membrane cross sections.
Figure 3-22: Immunostaining on cryosections for chondrogenic marker aggrecan.

46
3.10.4 Gene expression study – PCR
The samples were analysed for the presence of typical chondrocyte marker
collagen type II. All the differentiated samples expressed collagen type II which
indicated that the samples were undergone differentiation in the presence of the
chondrogenic media alone and in presence of chondrogenic media supplemented
with IGF. The fibro cartilage marker collagen type I was found only in the PCL- GF
but was absent in the CS incorporated groups both in presence and absence of IGF
Indicating that the signals helped in maintaining the cartilage phenotype and does
not promote fibro cartilage formation.
Figure 3-23: Gels showing the expression of β-actin (353 bps), collagen type II
(366bps) and type I (827bps) in ADMSCs differentiated to chondrogenic lineage
(after 21 days).

47
MSCs have the ability to differentiate into multiple mesenchymal lineages
such as cartilage, bone, and fat (Pittenger et al., 1999). Interactions of MSCs with
their microenvironment play an important role in their morphogenesis and
downstream differentiation. Nanofibrous PCL membranes provided a suitable niche
for MSC attachment and proliferation and this was observed in the enhanced cell
aggregation on live dead assay results.
In a study, Huang has reported a modulatory effect of extracellular CS on
chondrocytes (Huang, 1977) and a stimulatory effect of CS on proteoglycan
production (Huang, 1974). Although the influence of CS on chondrocytes has been
explored before, little is known about its effect on chondrogenesis of ADMSCs.
Distinct differences in cellular response were observed between PCL and CS
supplemented scaffolds.
We found that the CS-mediated microenvironment significantly influenced the
expression of cartilage specific marker aggrecan, The increased GAG content and
collagen content in the CS constructs when compared with the PCL indicated that
the biosignal CS have a potential role in the differentiation to ADMSCs to
chondrogenic lineage along with other supplements in the medium. The
chondrogenic media had a stimulatory effect in the differentiation; which induced the
differentiation of PCL constructs. The IGF has the ability to mediate chondrogenesis
by increasing proteoglycan and collagen type II production (Adelola O. Oseni et al.,
2011). This was observed in the +IGF group in which the PCL also showed positivity
to aggrecan and GAG and increased collagen content similar to the CS groups.
Our results indicated that the semi aligned biosignal (CS) incorporated
nanofibers of PCL enhanced the cell aggregation and differentiation of rabbit adipose
derived stem cells to chondrogenic lineage in the chondrogenic medium. The growth
factor supplementation enhanced the secretion of chondrogenic markers. The
approach of encapsulating biosignal within nanofibrous scaffolds is a promising
approach in designing biomaterials to direct stem cell differentiation to cartilage.

48
3.11 Characterizations of ADSC seeded membranes differentiated
to osteogenic lineage
3.11.1 Staining of cryosections
3.11.1.1 Alizarin red staining for calcium mineralizations
Mineralization in constructs was evaluated by Alizarin red staining. Alizarin
red stains calcium depositions and mineralized matrices. The sections in the fig 3-24
showed an increase in stain intensity from PCL to BGL to BGH in both –IGF and
+IGF groups. The data indicated that the bioactive glass induced the mineralizations
in constructs.
Figure 3-24: Alizarin red staining on cryosections for calcium mineralizations.

49
3.11.1.2 Sirius red staining for collagen
To evaluate the presence of collagen, the constructs were stained with
Sircoll dye. At day 7 the BG constructs showed higher staining intensity than other
groups. At day 21 the collagen constructs was enhanced in all groups when
compared to day 7. The BG encapsulated constructs showed deeper staining
indicating more secretion of collagen.
Figure 3-25: Sirius red staining for collagen on cryosections.

50
3.11.2 Immunostaining of cryosections
3.11.2.1 Osteocalcin
Osteocalcin is produced by osteoblasts and it is often used as a marker for
osteogenic lineage. The figure below represents the immunostaining for osteocalcin
which showed high stain intensity in BGL and BGH membranes of –IGF group than
the control PCL which indicated that the bioactive glass in the membranes along with
the osteogenic medium helped in the differentiation of ADMSCs that enhanced the
production of bone specific protein osteocalcin. Brown colour indicates positivity of
proteins on the ECM secreted by the cells and black colour represents the
membrane cross sections.
Figure 3-26: Immunostaining of cryosections for bone marker osteocalcin

51
3.11.2.2 Collagen type X
Collagen type X is expressed by hypertrophic chondrocytes during
endochondral ossification, in mineralized cartilage and also during osteogenesis.
The immunostaining results of ADMSCs after 21 day osteogenic induction showed
positivity to collagen X by BGH and BGL with highest stain intensity when compared
to the control PCL with low staining intensity.
Figure 3-27: Immunostaining of cryosections for collagen type X.

52
3.11.3 Gene expression studies - PCR
The samples were analysed for the presence of bone marker osteonectin.
The PCR data indicated the presence of the osteogenic marker osteonectin in BGL
sample even in the absence of IGF.The other BG incorporated groups also showed
faint expression of the marker and at the same time it was found to be completely
absent in PCL.This indicated that the BG helped in differentiation and enhanced
production of bone specific protein.
Figure 3-28: The gel images showing the expression of β- actin as control (353bps) and bone specific protein osteonectin (575bps) in ADMSCs differentiated to
osteogenic lineage.

53
Electrospinning holds great promise in scaffold fabrication, due to its
capability of producing nanofibers with both morphology and dimension similar to the
ECM fibers of native tissues (Xuening Chen et al., 2013). Bioactive glasses have
previously been shown to induce bone formation when placed in vivo at skeletal
tissue sites (Wheeler DL et al., 2000). In natural bone, highly oriented ECM and
associated bone cells play a determinant role in regulating the unique anisotropic
performance.
We found that the ADMSCs on the BG membranes expressed a higher level
of osteocalcin, a marker for the osteoblastic phenotype. The collagen X, a marker
found in the mineralized matrices of bone was also found to be higher. The
histological staining for Alizarin red showed the distinct differences in the staining
intensity in the PCL and BG membranes. These observations explained that the
bioactive glass enhanced osteogenic differentiation of adipose derived stem cells in
presence of osteogenic medium. The osteogenic potential of BG is very evident even
in groups without growth factor. On supplementing IGF the expression of osteogenic
proteins were enhanced. The bioactive glass acted as a signal molecule for
osteoinduction that triggered the ADMSC differentiation to osteoblast - like cells.
54
CHAPTER 4 -SUMMARY AND CONCLUSION
The present study was focused on evaluating the potential of signal embraced
electrospun membranes for enhanced cell response towards osteochondral tissue
engineering. The polymer used for the fabrication of membranes was PCL which is a
FDA approved non-toxic and biodegradable material. The fabrication technique used
was electrospinning by which nanofibrous scaffolds were synthesized by
incorporating the tissue specific signals chondroitin sulfate and bioactive glass. Due
to the small fiber diameters and the overall porous structure, electrospun fabrics
have a high surface area that is beneficial for signal delivery in tissue engineering.
But the major limitation of electrospun scaffolds for osteochondral application
is the low mechanical properties and thus they cannot serve as a standalone system
for osteochondral tissue engineering. Also there is a limit in the thickness at which it
can be fabricated. Beyond that limit, the cell penetration into the scaffolds will be
difficult. So the present study was only focused on electrospun membranes as
suitable substrates for signal delivery system.
Components like chondroitin sulfate (CS) and bioactive glass (BG) in 3D
scaffolds may serve as biosignals for synthesis of new extracellular matrix (ECM),
and may have the potential to completely or partially replace expensive growth
factors. In the present study we explored the role of these simple biomolecules as a
potential component of nanofibrous electrospun membranes and the cell responses
to these signals towards osteochondral tissue engineering
Chondroitin sulfate was used as cartilage specific signal while bioactive glass
was used as osteogenic signal. The potential of chondroitin sulfate in enhancing the
cartilage tissue matrix and differentiation of MSCs were already reported. We focus
on a novel approach of incorporating this biosignal molecule in PCL electrospun
membranes for cartilage tissue engineering. The response to chondrogenic signal
was evaluated in presence of chondrocytes; the cells present in cartilage. The
influence of osteogenic signals (BG) on chondrocytes towards hypertrophy and
mineralization is also explored in this work. Further we also evaluated the response
of adipose derived stem cell towards differentiation to chondrogenic and osteogenic
lineages on these signal encapsulated membranes.

55
The cells used for the study were goat chondrocytes and rabbit adipose
derived stem cells. Chondrocytes were used in the initial study to evaluate the
potential of these signal embraced membranes in signal delivery and the cell
response to these signal molecules. Observing the results in a differentiated cell
helped a lot before moving to differentiation study. In the next study we used rabbit
adipose derived stem cells to study the differentiating potential of these membranes
to cartilage and bone cells. Due to the limitation in the availability of chondrocytes for
treatment, stem cells are another good alternative source, having higher proliferation
and differentiation potential. Due to ease of harvest and abundance, adipose-derived
mesenchymal cells (ASC) are an attractive, readily available adult stem cell.
ADMSCs can be isolated from excess fat which are less painful when compared to
BMSCs and thus autologous cells can be used for treatment.
With the standardizations in polymer concentration, solvent ratio, voltage
applied, distance between anode and cathode and the flow rate we obtained
nanofibrous membranes that mimic the natural ECM. The membrane
characterizations indicated that the fibers were of semi aligned, smooth, nano fibers
that indicated that the signal molecules were successfully incorporated and were
uniformly dispersed in the polymer.
The total encapsulation efficiency results of CS was calculated to determine
the amount of biosignal encapsulated on the membranes and to determine the
maximum concentration which can be successfully incorporated in the electrospun
membranes with the parameters standardised for this study. Two different
concentrations of CS were used for the study designated as CSL and CSH.
Chondroitin sulfate being a water soluble compound was slowly released into the
culture medium and showed controlled release upto 3 days in CSL and beyond 14
days in CSH as observed in the results. The membranes were nontoxic to both
chondrocytes and ADSCs. The uniform staining pattern indicated the uniform
distribution of CS within the nanofibers. In the presence of cells the released CS
might have been entrapped within the cell-fiber mesh and the CS retained within the
fibers might have been utilized by the cells. Our results also showed that lower
concentration of CS was sufficient for chondrocytes for faster synthesis of ECM and
cartilage specific proteins; collagen type II and aggrecan.

56
The cytotoxicity assays indicated that bioactive glass incorporated
membranes were nontoxic to the cells and moreover the cell aggregates were
formed with the production of more ECM. The TGA analysis helped to calculate the
amount of BG incorporated in the membranes BGL and BGH. The bioactive glass
incorporated membranes formed hydroxyapatite like crystals in SBF and showed
higher calcium deposition in the presence of cells when compared with the control.
We observed enhanced calcium depositions and biomineralizations when
chondrocyte were seeded on the BG membranes. Our results showed that the
bioactive glass have induced hypertrophy in chondrocytes with the enhanced
production of proteins like collagen type X and osteocalcin. However the different
concentration did not make any significant differences in the results. The deeper
zone of native cartilage is of calcified nature and lies closest to the subchondral bone
which acts as a transition from soft hyaline cartilage to calcified bone. The
chondrocytes here are mostly surrounded by calcified ECM. Hence cartilage
mineralizations in BG membranes are relevant at the osteochondral interface in
osteochondral tissue engineering.
Our results indicated that the signal incorporated membranes in the presence
of differentiation medium promoted the differentiation of ADMSCs to chondrogenic
and osteogenic lineages. We observed the difference in the lineage specific proteins
in the biosignal incorporated and control groups. Their differentiation was enhanced
in the presence of growth factor IGF. The growth factor definitely enhanced cell
proliferation and faster synthesis of matrix proteins.
These membranes with different signal concentrations (CSL, CSH, BGL and
BGH) can be used as gradient signal delivery system (CSH↔CSL↔BGL↔BGH)
that would mimic the osteochondral interface. However they cannot be used alone
because mechanical property is a major factor. But they can serve as a suitable
tissue specific signal delivery system and can be used in combination with 3D
scaffolds or hydrogels for osteochondral tissue engineering.

57
FUTURE PROSPECTS
In our future studies we would like to explore other concentrations of CS, BG
and other bioactive signals or combinations for favourable chondrocyte response
and in ADMSC differentiation to osteochondral lineages. Also we would like to
evaluate ADMSC response by supplementing lower concentration of growth factor or
by completely avoiding growth factor. It will be more beneficial if we could be able to
retain the bio molecule within the membranes for a longer time by tailoring the
release profiles. And finally we would like to incorporate these membranes within a
mechanically stable 3D scaffold for osteochondral tissue engineering.
58
BIBLIOGRAPHY
1. Amanda N Renth and Michael S Detamore. Leveraging ‘‘raw materials’’ as building
blocks and bioactive signals in regenerative medicine. Tissue Engineering: Part B. 2012 (5); 18.
2. Badami AS, Kreke MR, Thompson MS, Riffle JS, Goldstein AS. Effect of fiber diameter on spreading, proliferation, and differentiation of osteoblastic cells on electrospun poly(lactic acid) substrates. Biomaterials. 2006; 27: 596.
3. Barry F, Boynton RE, Liu B, Murphy JM. Chondrogenic differentiation of mesenchymal stem cells from bone marrow: differentiation-dependent gene expression of matrix components. Exp. Cell Res. 2001; 268: 189–200.
4. Buckwalter JA, Mankin HJ. Articular cartilage: tissue design and chondrocyte-matrix interactions. AAOS Inst Course Lect. 1998; 47:477- 486.
5. Buckwalter JA. Articular cartilage. AAOS Inst Course Lect. 1983; 32: 349-370.
6. Chris Kian, Liwen Chen, Yao Jiong WU, Albert J Yee and Burton B Yang. Structure and function of aggrecan. Cell Research. 2002; 12 :19–32.
7. Cohen NP, Foster RJ, Mow VC. Composition and dynamics of articular cartilage: structure, function, and maintaining healthy state. J Orthop Sports Phys Ther.1998; 28: 203-215.
8. Dan Li and Younan Xia. Electrospinning of Nanofibers: Reinventing the Wheel? Advanced Materials. 2004; 16(14).
9. Debora W Lin, Jennifer Elisseeff. Chondroitin sulfate based niches for chondrogenic differentiation of mesenchymal stem cells. Matrix Biology. 2008: 12–21.
10. E. B. Hunziker. Articular cartilage repair: basic science and clinical progress- A review of the current status and prospects. Osteoarthritis and Cartilage. 2001; 10: 432–463.
11. Gerhardt LC, Boccaccini AR. Bioactive glass and glass-ceramic scaffolds for bone tissue engineering. Materials. 2010; 3(7): 3867-3910.
12. Huang D. Effect of extracellular chondroitin sulfate on cultured chondrocytes. J. Cell Biol.1974; 62: 881–886.

59
13. Huang D. Extracellular matrix–cell interactions and chondrogenesis. Clin. Orthop.
Relat. Res. 1977; 123: 169–176.
14. Johnna S. Temeno and Antonios G. Mikos. Review: tissue engineering for regeneration of articular cartilage. Biomaterials. 2000; 21: 431-440.
15. Jomphe CJ, Gabriac M, Hale TM, Heroux L, Trudeau LE, Deblois D. Chondroitin sulfate inhibits the nuclear translocation of nuclear factor-kappaB in interleukin-lbeta-stimulated chondrocytes. Basic Clin Pharmacol Toxicol.2008; 102: 59–65.
16. Jun Yaoa, Shula Radina, Phoebe S Leboyb, Paul Ducheynea. The effect of bioactive glass content on synthesis and bioactivity of composite poly (lactic-co-glycolic acid)/ bioactive glass substrate for tissue engineering. Biomaterials. 2005; 26: 1935–1943.
17. Kamiya N, Watanabe H, Habuchi H, Takagi H, Shinomura T, Shimizu K, Kimata KJ. Versican/PG-M regulates chondrogenesis as an extracellular matrix molecule crucial for mesenchymal condensation. J. Biol. Chem. 2006; 281: 2390–2400.
18. Kandel RA, Grynpas M, Pilliar R, Lee J, Wang J, Waldman S, Zalzal P, Hurtig M. Repair of osteochondral defects with biphasic cartilage-calcium polyphosphate constructs in a sheep model. Biomaterials. 2006 (in press).
19. Kenneth D. Brandt, Paul Dieppe, Eric L. Radin. Etiopathogenesis of Osteoarthritis; Rheumatic Disease Clinics of North America. 2008; 34: 531–559.
20. Lakshmi M Mukundan, Remya Nirmal, Dhanesh Vaikkath and Prabha D Nair. A new
synthesis route to high surface area sol gel bioactive glass through alcohol washing: A preliminary study. Biomatter. 2013; 3: 2.
21. Larry L. Hench, Ionnis D Xynos and Julia M Polak. Bioactive glasses for in situ
tissue regeneration. J. Biomater. Sci. Polymer Edn. 2004;15 (4): 543–562.
22. LC Gerstenfeld and FD Shapiro. Expression of bone specific genes by hypertrophic
chondrocytes: Implications of the complex functions of the hypertrophic chondrocyte during endochondral bone devolpoment. Journal of cellular Biochemistry. 1996; 62: 1-9.
23. Li Q, Williams CG, Sun DD, Wang J, Leong K, Elisseeff JH. Photocrosslinkable
polysaccharides based on chondroitin sulfate. J. Biomed. Mater. Res. A. 2004; 68: 28–33.
24. Li WJ, Danielson KG, Alexander MG, Tuan RS. Biological response of chondrocytes
cultured in three-dimensional nanofibrous poly (epsilon-caprolactone) scaffolds. J Biomed Mater Res. 2003; 67A: 1105.

60
25. Li WJ, Laurencin CT, Caterson EJ, Tuan RS, Ko FK. Electrospun nanofibrous
structure: a novel scaffold for tissue engineering. J Biomed Mater Res.2002; 60: 613.
26. Milind Singh, Nathan Dormer, Jean R. Salash, Jordan M. Christian, David S. Moore, Cory Berkland, Michael S. Detamore. Three-dimensional macroscopic scaffolds with a gradient in stiffness for functional regeneration of interfacial tissues. Wiley InterScience:2009
27. Mukundan L, Nirmal R,Vaikkath D, Nair PD. A new synthesis route to high surface area sol gel bioactive glass through alcohol washing: A preliminary study. Biomatter 2013; 3.
28. Nathan H Dormer, Milind Singh, Limin Wang, Cory J Berkland and Michael S Detamore. Osteochondral interface tissue engineering using macroscopic gradients of bioactive signals. Annals of Biomedical Engineering. 2010(1); 38: 2167–2182.
29. Neethu Mohan and Michael S Detamore. Engineering Graded Tissue Interfaces 2.
Book chapter, chaptet14: 2013.
30. Panossian A, Ashiku S, Kirchhoff CH, Randolph MA, Yaremchuk MJ. Effects of cell concentration and growth period on articular and ear chondrocyte transplants for tissue engineering. Plast Reconstr Surg. 2001; 108(2):392–402.
31. Pipitone VR. Chondroprotection with chondroitin sulfate. Drug Exp. Clin. Res. 1991; 17: 3–7.
32. Pittenger MF, Mackay AM, Beck SC, Jaiswal RK, Douglas R, Mosca JD, Moorman MA, Simonetti DW, Craig S, Marshak DR. Multilineag potential of adult human mesenchymal stem cells.Science. 1999; 284: 143– 147.
33. Redman SN, Oldfield SF and Archer CW. Current strategies for articular cartilage repair. European Cells and Materials. 2005; 9: 23 -32.
34. Ronca F, Palmieri L, Panicucci P, Ronca G. Anti-inflammatory activity of chondroitin sulfate. Osteoarthr. Cartil. 1998; 6: 14–21.
35. Roughley P, Martens D, Rantakokko J, Alini M, Mwale F and Antoniou J. The
involvement of aggrecan polymorphism in degeneration of human intervertebral disc and articular cartilage. Eur Cell Mater. 2006; 11: 1-7.
36. Schaefer D, Martin I, Shastri P, Padera RF, Langer R, Freed LE, Vunjak-Novakovic
G. In vitro generation of osteochondral composites. Biomaterials. 2000; 21 (24): 2599–2606.

61
37. Sechriest VF, Miao YJ, Niyibizi C, Larson AW, Matthew HW, Evans CH, Fu FH, Suh JK. GAG-augmented polysaccharide hydrogel: a novel biocompatible and biodegradable material to support chondrogenesis. J.Biomed. Mater. Res. 2000; 49: 534–541.
38. Shields KJ, Beckman MJ, Bowlin GL, Wayne JS. Mechanical properties and cellular
proliferation of electrospun collagen type II. Tissue Eng. 2004; 10: 1510.
39. Shyni Varghese, Nathaniel S Hwang, Adam C Canver, Parnduangji Theprungsirikul, Debora W Lin, Jennifer Elisseeff. Chondroitin sulfate based niches for chondrogenic differentiation of mesenchymal stem cells. Matrix Biology. 2008; 27: 12–21.
40. Tuzlakoglu K, Bolgen N, Salgado AJ, Gomes ME. Nano and micro-fiber combined
scaffolds: a new architecture for bone tissue engineering. J Mater Sci Mater Med. 2005; 16:1099.
41. V V Valimaki, J J Yrjans, E Vuorio, H T Aro. Combined effect of BMP-2 gene transfer and bioactive glass microspheres on enhancement of new bone formation. Wiley Inter Science. 2004 (online).
42. Wang X, Grogan, SP, Rieser F, Winkelmann V, Maquet V, Berge M L, Mainil-Varlet
P. Tissue engineering of biphasic cartilage constructs using various biodegradable scaffolds: an in vitro study. Biomaterials. 2004; 25 (17), 3681–3688.
43. Xia Li, Jianlin Shi, Xiaoping Dong, Lingxia Zhang, Hongyu Zeng. A mesoporous bioactive glass/polycaprolactone composite scaffold and its bioactivity behaviour. Wiley InterScience. 2007 (online).
44. Xiaofeng Cui,Kurt Breitenkamp, MG Finn, Martin Lotz, and Darryl D D’Lima. Direct
human cartilage repair using three-dimensional bioprinting technology. Tissue Engineering: Part A. 2012;18: 11-12.
45. Yoshimoto H, Shin YM, Terai H, Vacanti JP. A biodegradable nanofiber scaffold by electrospinning and its potential for bone tissue engineering. Biomaterials. 2003; 24: 2077.