Evaluating the Effectiveness of Tree Locations and ...
121
Evaluating the Effectiveness of Tree Locations and Arrangements for Improving Urban Thermal Environment by Qunshan Zhao A Dissertation Presented in Partial Fulfillment of the Requirements for the Degree Doctor of Philosophy Approved August 2017 by the Graduate Supervisory Committee: Elizabeth A. Wentz, Chair David J. Sailor Zhi-Hua Wang ARIZONA STATE UNIVERSITY December 2017
Transcript of Evaluating the Effectiveness of Tree Locations and ...

Evaluating the Effectiveness of Tree Locations and Arrangements for Improving Urban
Thermal Environment
by
Qunshan Zhao
A Dissertation Presented in Partial Fulfillment
of the Requirements for the Degree
Doctor of Philosophy
Approved August 2017 by the
Graduate Supervisory Committee:
Elizabeth A. Wentz, Chair
David J. Sailor
Zhi-Hua Wang
ARIZONA STATE UNIVERSITY
December 2017

ProQuest Number:
All rights reserved
INFORMATION TO ALL USERSThe quality of this reproduction is dependent upon the quality of the copy submitted.
In the unlikely event that the author did not send a complete manuscriptand there are missing pages, these will be noted. Also, if material had to be removed,
a note will indicate the deletion.
ProQuest
Published by ProQuest LLC ( ). Copyright of the Dissertation is held by the Author.
All rights reserved.This work is protected against unauthorized copying under Title 17, United States Code
Microform Edition © ProQuest LLC.
ProQuest LLC.789 East Eisenhower Parkway
P.O. Box 1346Ann Arbor, MI 48106 - 1346
10623641
10623641
2017

i
ABSTRACT
Trees serve as a natural umbrella to mitigate insolation absorbed by features of
the urban environment, especially building structures and pavements. For a desert
community, trees are a particularly valuable asset because they contribute to energy
conservation efforts, improve home values, allow for cost savings, and promote enhanced
health and well-being. The main obstacle in creating a sustainable urban community in a
desert city with trees is the scarceness and cost of irrigation water. Thus, strategically
located and arranged desert trees with the fewest tree numbers possible potentially
translate into significant energy, water and long-term cost savings as well as conservation,
economic, and health benefits. The objective of this dissertation is to achieve this
research goal with integrated methods from both theoretical and empirical perspectives.
This dissertation includes three main parts. The first part proposes a spatial
optimization method to optimize the tree locations with the objective to maximize shade
coverage on building facades and open structures and minimize shade coverage on
building rooftops in a 3-dimensional environment. Second, an outdoor urban physical
scale model with field measurement is presented to understand the cooling and locational
benefits of tree shade. The third part implements a microclimate numerical simulation
model to analyze how the specific tree locations and arrangements influence outdoor
microclimates and improve human thermal comfort. These three parts of the dissertation
attempt to fill the research gap of how to strategically locate trees at the building to
neighborhood scale, and quantifying the impact of such arrangements.
Results highlight the significance of arranging residential shade trees across
different geographical scales. In both the building and neighborhood scales, research

ii
results recommend that trees should be arranged in the central part of the building south
front yard. More cooling benefits are provided to the building structures and outdoor
microclimates with a cluster tree arrangement without canopy overlap; however, if
residents are interested in creating a better outdoor thermal environment, open space
between trees is needed to enhance the wind environment for better human thermal
comfort. Considering the rapid urbanization process, limited water resources supply, and
the severe heat stress in the urban areas, judicious design and planning of trees is of
increasing importance for improving the life quality and sustaining the urban
environment.

iii
Dedicated to Ruirui and Aaron
&
my parents
for all your love and support

iv
ACKNOWLEDGMENTS
First and foremost, I would like to express my gratitude to my doctoral advisor
and committee chair, Professor/Dean Elizabeth A. Wentz. As a Ph.D. student straight
from undergraduate, I have been amazingly fortunate to have an advisor who gave me the
freedom and support to explore the research ideas on my own, and advise me when I am
hesitated and confused. Over the past four years, her consistent encouragement have
helped me overcome many difficulties both in my academic development and in my life.
I am truly grateful for her mentorship.
Second, I would like to thank my best committee members, Professors David J.
Sailor and Zhi-Hua Wang, for their invaluable advice and guidance throughout my
dissertation research. Without their continuous assistance and encouragement, I will not
be able to enter the field of urban climatology and enjoy the truth of the interdisciplinary
research in my doctoral dissertation. Their time, instructions, and suggestions are greatly
appreciated.
During my Ph.D. study, I received countless support, assistance, and
encouragement from many friends and colleagues at Arizona State University. I was
fortunate to have many great friends across the campus, including Chao Fan, Levi Wolf,
Shuyao Hong, Taylor Oshan, Jiachuan Yang, Yinlue Wang, Sangdi Lin, Wei Kang, Shule
Yu, Hu Shao, Xiran Zhou, Feng Wang, and Ziqi Li. I also want to mention current and
former members of the GeoDa Center/Spatial Analysis Research Center (SPARC) – Insu
Hong, Xin Feng, Yue Zhang, Heather Fischer, Lindsey Conrow, Joanna Merson, and
Marynia Kolak, for providing a supportive, friendly, and positive working environment.
Further, I want to sincerely acknowledge the assistance from the faculty and students in
v
the Urban Climate Research Center (UCRC) including Ariana Middel, Anthony Brazel,
Peter Crank, Scott Krayenhoff, and Amir Baniassadi. Finally, I give sincere appreciation
to Professors Scott Yabiku, Jennifer Glick, Michael Kuby, Soe Myint, Stewart
Fotheringham, Sergio Rey, and Alan Murray, who provided suggestions and insight
numerous times throughout my graduate studies.
I received multiple financial support for finishing this doctoral dissertation. I
would like to acknowledge the generous financial support from the Dissertation Research
Grant from American Association of Geographers, the Decision Center for a Desert City
II: Urban Climate Adaptation (NSF grant number SES-0951366), the Central Arizona-
Phoenix Long-Term Ecological Research (NSF grant number DEB-1637590), Matthew
G. Bailey Scholarship Award from School of Geographical Sciences and Urban Planning,
and JumpStart Research Grant from Arizona State University.
Last but not least, I want to give my deepest gratitude to some of the most
important people in my life. To my parents, Wenli Chen and Tongguo Zhao, for always
encouraging and believing in me during my life. To my longtime friends, Kai Zhuang,
Qixin Wang, Shengan Zhan and Xuan Kuai, to help me and provide support while I
pursue my Ph.D. degree in a foreign country. Finally, to my wife, Ruirui Han – you have
always been my side to give me love, care, patience, and inspiration that carried me
through the difficult periods of my graduate studies. I truly appreciate your support and
understanding to allow me always working in my office during the past three years. Most
importantly, thanks for bringing our adorable son, Aaron, to this world. I am looking
forward to our life together in the future.

vi
TABLE OF CONTENTS
Page
LIST OF TABLES ............................................................................................................ IX
LIST OF FIGURES ........................................................................................................... X
CHAPTER
1 INTRODUCTION ........................................................................................................... 1
1.1 Problem Statement .................................................................................................... 1
1.2 Research Objectives .................................................................................................. 4
1.3 Outline of the Dissertation ........................................................................................ 5
2 TREE SHADE COVERAGE OPTIMIZATION IN AN URBAN RESIDENTIAL
ENVIRONMENT ............................................................................................................... 7
2.1 Introduction ............................................................................................................... 7
2.2 Literature Review ..................................................................................................... 9
2.2.1 Impact of Tree Shade ......................................................................................... 9
2.2.2 Spatial Optimization in 3D .............................................................................. 11
2.3 Methods .................................................................................................................. 15
2.3.1 Study Area ....................................................................................................... 15
2.3.2 Data Sources .................................................................................................... 16
2.3.3 Modeling Approach ......................................................................................... 17
2.3.3.1 GIS: Surface Coverage Derivation ........................................................... 18
2.3.3.2 Spatial Optimization: Tree Placement ...................................................... 21
2.3.3.3 Heuristic .................................................................................................... 22
2.3.3.4 Model Parameter Explanation and Simplification .................................... 23

vii
CHAPTER Page
2.4 Results ..................................................................................................................... 26
2.5 Discussion ............................................................................................................... 33
2.6 Conclusions ............................................................................................................. 36
3 ASSESSING THE COOLING AND LOCATIONAL BENEFITS OF TREE SHADE
BY AN OUTDOOR URBAN PHYSICAL SCALE MODEL AT TEMPE, AZ ............. 37
3.1 Introduction ............................................................................................................. 37
3.2 Experimental Details ............................................................................................... 41
3.2.1 Experimental Site and Period ........................................................................... 41
3.2.2 Experimental Design ........................................................................................ 47
3.2.3 Measurement Equipment ................................................................................. 49
3.3 Experimental Results .............................................................................................. 51
3.3.1 Instrumentation Calibration and Quality Control ............................................ 51
3.3.2 Tree Shade Cooling Benefits to the Target Building ....................................... 55
3.3.3 Tree Shade Cooling Benefits to the Surrounding Buildings ............................ 60
3.4 Discussion ............................................................................................................... 62
3.5 Conclusions ............................................................................................................. 65
4 IMPACT OF TREE LOCATIONS AND ARRANGEMENTS ON OUTDOOR
MICROCLIMATES AND HUMAN THERMAL COMFORT IN AN URBAN
RESIDENTIAL ENVIRONMENT .................................................................................. 67
4.1 Introduction ............................................................................................................. 67
4.2 Study Area and Climatic Conditions ...................................................................... 70
4.3 Methodology ........................................................................................................... 72

viii
CHAPTER Page
4.3.1 Fieldwork Design and Measurement ............................................................... 73
4.3.2 Microclimate Numerical Simulation ................................................................ 74
4.3.3 Human Thermal Comfort Calculation ............................................................. 79
4.4 Results ..................................................................................................................... 80
4.4.1 Fieldwork Validation ....................................................................................... 80
4.4.2 Numerical Simulation Results ......................................................................... 81
4.4.2.1 Outdoor Microclimates Comparison......................................................... 81
4.4.2.2 Human Thermal Comfort Comparison ..................................................... 84
4.5 Discussion ............................................................................................................... 86
4.6 Conclusions ............................................................................................................. 89
5 CONCLUSIONS............................................................................................................ 90
5.1 Summary of Dissertation ........................................................................................ 90
5.2 Limitation and Future Work ................................................................................... 92
5.2.1 Tree Characteristics ......................................................................................... 92
5.2.2 Tree Placement and Energy Saving ................................................................. 92
5.2.3 Tree Location Optimization Index ................................................................... 93
REFERENCES ................................................................................................................. 94

ix
LIST OF TABLES
Table Page
3.1 Weather Conditions in the 10 Experimental Dates ..................................................... 42
3.2 Summary of Tree Number, Location, and Arrangement in Different Experimental
Groups ............................................................................................................................... 49
3.3 Key Factors in Different Experimental Groups .......................................................... 49
3.4 Temperature Measurement Errors Between the Thermal Images and IButton Loggers
........................................................................................................................................... 54
3.5 Cooling Benefits Comparison for Each Experimental Group (Referring to Figure 3.2
and 3.3 for IButton Locations and Tree Locations) .......................................................... 60
4.1 Summary of Area Input and Configuration Parameters for Validated Simulation ..... 76
4.2 Summary of Surface Information ............................................................................... 77
4.3 Summary of Tree Information .................................................................................... 77
4.4 Numerical Simulation Scenarios................................................................................. 78
4.5 Temperature Differences Between the Simulated and Validated Dataset .................. 81

x
LIST OF FIGURES
Figure Page
2.1 Sample Home and Parcel in the Residential Neighborhood of Tempe ...................... 16
2.2 3D Building and Tree Models ..................................................................................... 17
2.3 Shade Projections from a Point (x, y, z) on a 3D Object (Redraw from Gomez-Munoz
et al. (2010) (Gomez-Munoz et al., 2010)) ....................................................................... 20
2.4 Potential Tree Placement Area in the Study Site (Plan View) .................................... 24
2.5 Potential Tree Locations in the Study Site (Plan View) ............................................. 25
2.6 Tree Shade Coverage in One Tree Scenario ............................................................... 27
2.7 Optimal Shading from One Tree (August 15th, at Location 4) ................................... 28
2.8 Accumulated Weighted Shaded Area (m2) Comparison for Two Trees (Only Showing
the Two Tree Combination from Location 1 to 7) ............................................................ 29
2.9 The Best Near-optimal Shading Results from Two Trees (August 15th, at Location 3
and 5) ................................................................................................................................ 30
2.10 Tree Shade Coverage with the Best Near-optimal Arrangement (Location 3 and 5) 32
3.1 Pictures of the Outdoor Urban Physical Scale Model (Red Outline Represents a
Single Unit of the Target Building) .................................................................................. 47
3.2 Potential Tree Locations in the Outdoor Urban Physical Scale Model ...................... 48
3.3 The Digital Photo of IButton Logger Locations ......................................................... 50
3.4 Thermal Image and Digital Photo from FLIR P620 Thermal Camera (Taken at 13:59,
July 13th) ........................................................................................................................... 54
3.5 Temperature Comparison between IButtons and Thermal Images of Proximal
Exposed Concrete Block Surfaces. ................................................................................... 55

xi
Figure Page
3.6 Cooling Effect of Tree Shade on the Target Building Facade Temperature (One-tree,
at the Central Part of Front Yard) ..................................................................................... 57
3.7 Cooling Effect of Tree Shade on the Target Building Facade Temperature (Two-trees)
........................................................................................................................................... 58
3.8 Cooling Effect of Tree Shade on the Surrounding Building Facade Temperature
(One-tree) .......................................................................................................................... 62
4.1 Study Area .................................................................................................................. 70
4.2 Methodology Framework............................................................................................ 72
4.3 Qstarz Travel Recorder XT (GPS Loggers)................................................................ 73
4.4 Car-Based Air Temperature Thermocouples .............................................................. 74
4.5 Base Model with Existing Tree Locations and Arrangements ................................... 75
4.6 Simulated Tree Locations and Arrangements Scenarios ............................................ 79
4.7 The Boxplot of Surface Air Temperature Comparison in the Neighborhood. (The
Upper and Lower Bounds of the Box Plots Indicate the 25th and 75th Percentile of the
Values, the Whiskers Represent the 5th and 90th Percentiles, the Red Plots Show the
Mean value, and the Red Lines Illustrate the Median Value) ........................................... 82
4.8 The Boxplot of 1.5 m Air Temperature Comparison in the Neighborhood................ 82
4.9 The Boxplot of MRT Comparison in the Neighborhood ............................................ 83
4.10 The Boxplot of Wind Speed Comparison in the Neighborhood ............................... 84
4.11 The Boxplot of PET Comparison in the Neighborhood ........................................... 85
4.12 The Boxplot of PET Comparison for Individual Houses.......................................... 86

1
CHAPTER 1
INTRODUCTION
1.1 Problem Statement
Urbanization is an integrated natural and social phenomenon involving growth to the
built environment due to economic drivers and population growth that influence thermal,
hydrologic, and atmospheric characteristics of the region (Ma, Zhou, Pei, Haynie, & Fan,
2012; Zhang & Seto, 2011). Urban areas are home to 54% of the current world population
and that level is projected to reach 66% by 2050 within only 3% of the Earth’s terrestrial
surface (United Nations, 2014). However, more than 78% of carbon emissions, 76% of
industrial wood consumption, and 60% of residential water use occur in urban areas
(Grimm et al., 2008). The rapid urban sprawl and expanded urban population has led to
emerging problems including higher energy consumption, air quality degradation, human
thermal discomfort, and the urban heat island (UHI) effects (Nazaroff, 2013; Oke, 1982;
Song & Wang, 2014). The goal of this dissertation is to address one dimension of the
challenges of urbanization, mitigation methods for the urban heat island effect.
To alleviate the extreme thermal stress and improve urban residents’ quality of life in
the urban area, urban green infrastructure such as trees, shrubbery and turf grass are
frequently used for residential landscaping, green roofs and walls, urban parks, as well as
green corridors (Akbari, Pomerantz, & Taha, 2001; Middel, Chhetri, & Quay, 2015; Z.-H.
Wang, Zhao, Yang, & Song, 2016). Trees and grass provide various environmental, social,
health, and economic benefits to the urban environment, but at the related costs and
expenditures such as water supply and maintenance costs (Roy, Byrne, & Pickering, 2012;
Sarajevs, 2011; Shashua-Bar, Pearlmutter, & Erell, 2011). Thus, the guidelines for using

2
urban green infrastructure significantly rely on the local climate conditions and heat
mitigation objectives (Norton et al., 2015).
For a desert city such as Phoenix Arizona, the water cost of urban lawns is significantly
more than trees because of the high irrigation demand from grass. In addition, trees provide
valuable shading benefits to the built environment as compared to lawns. Hence, desert
trees are a more water-friendly strategy to cool down the outdoor environment and human
dwellings (Z.-H. Wang et al., 2016). In a desert community, residential trees are a valuable
asset to conserve energy, improve home values, mitigate UHI effects, add
aesthetic/recreational/cultural values, decrease crime rate, and promote human thermal
comfort, health, and well-beings (Akbari, 2002; Akbari et al., 2001; Bolund & Hunhammar,
1999; Gold, 1976; Heisler & Grant, 2000; Nowak & Dwyer, 2007; O’Neill et al., 2009, p.
200; Roy et al., 2012; Sander, Polasky, & Haight, 2010; Seo, Golub, & Kuby, 2014; Troy,
Morgan Grove, & O’Neil-Dunne, 2012; Wolfe & Mennis, 2012). All of these benefits
make residential trees be an indispensable part of the residential urban environment.
Although the benefits provided by trees are important and valuable, trees also have
financial costs as well as contributing to certain environmental and health problems. Life
cycle costs of trees, include planting and establishment, irrigation, maintenance (pruning,
crown thinning and removal) and green waste disposal (G. McPherson et al., 2004).
Furthermore, trees contribute to environmental problems such as generating and releasing
volatile organic compounds (Kesselmeier & Staudt, 1999; Owen, MacKenzie, Stewart,
Donovan, & Hewitt, 2003), and health issues to the elderly and children from pollen allergy
or insect attacks and diseases (Donovan, Michael, Gatziolis, Prestemon, & Whitsel, 2015;

3
Lovasi et al., 2013). Avoiding and minimizing these drawbacks from trees are necessary to
help the development of urban green infrastructure in the desert city.
Besides the costs and expenditures issues of trees, inappropriate tree locations generate
unnecessary shade to solar panels on the residential rooftops. Exposed residential rooftop
space is ideally reserved for placing solar panels to generate electricity from direct solar
radiation. Although the rooftop is the optimal place to capture solar energy, trees
significantly influence photovoltaic efficiency of the solar panels if their shade obscures the
direct solar radiation (Fogl & Moudrý, 2016; Levinson, Akbari, Pomerantz, & Gupta, 2009;
Li, Zhang, & Davey, 2015; Tooke, Coops, Voogt, & Meitner, 2011). Wisely locating
residential shade trees with the consideration of solar energy production on rooftops will
significantly benefit the overall energy conservation of the city residents and utility
companies.
Considering all the advantages and disadvantages of trees, the tradeoffs between energy,
water, and related costs and expenditures limit the number of trees to be planted in the
desert community (Livesley, McPherson, & Calfapietra, 2016; G. McPherson et al., 2004;
Sawka, Millward, Mckay, & Sarkovich, 2013). Effective strategies are therefore needed to
maximize the overall benefits from trees with the fewest tree numbers in an effort to
simultaneously reduce water consumption, tree maintenance cost, and energy use (E. G.
McPherson, Simpson, & Livingston, 1989). All of these conditions require a better method
to design and locate the trees optimally at the building and neighbourhood scale.
Strategically locating trees in a hot arid residential environment is significant and necessary.
Existing research uses a variety of methods such as remote sensing and numerical
simulation to explore how the locations and arrangements of trees influence the built

4
environment. Remotely sensed data supports research at the city and regional scales and
shows how a clustered arrangement of trees contributes to improved cooling effects (Fan,
Myint, & Zheng, 2015; Myint et al., 2015). These studies however do not examine the
specific relationship between trees and buildings and neglect to derive temperatures under
the tree canopies or the building facade. Numerical simulation methods have also been
utilized to understand the locational benefits of trees in the neighborhood to building scale.
Like the remotely sensed methods, researchers have used numerical simulation models to
show that a clustered arrangement of trees offer improved cooling benefits (Ooka, Chen, &
Kato, 2008). However, some other numerical simulation results suggest that a scattered tree
pattern provides a better ventilation environment for improving human thermal comfort (H.
Chen, Ooka, & Kato, 2008). These contrasting results and the gaps in research leave it
unclear how tree spacing and layouts influence microclimate effects and human thermal
comfort.
1.2 Research Objectives
The overarching objective of this dissertation research is to identify tree locations and
design arrangements to maximize the environmental benefits at building and neighborhood
scales in an urban desert residential environment. Three individual research projects were
designed and implemented to better understand the relationship between trees, buildings,
and the urban microclimate through a case study in a residential neighborhood in the City
of Tempe, AZ (SE and adjacent to Phoenix, AZ). The first research project will introduce
and demonstrate a 3D spatial optimization method to quantify optimal tree locations and
arrangements that provide the most benefit for single family building structures. Further,
the second research goal will aim to better quantify the direct thermal characteristics of tree

5
shade to buildings through an outdoor urban physical scale model experiment. These two
research projects attempt to identify the best tree locations and arrangements to maximize
the shading coverage and cooling benefits at the single-family building scale. The third
research goal will bridge the optimal tree locations from building scale to neighborhood
scale through a microclimate numerical simulation analyzing dispersed and clustered
arrangements of trees. The overall research findings of this dissertation will provide a
quantitative method to locate trees at the different geographical scales (parcel and
neighborhood) with consideration of urban microclimate effects and human thermal
comfort, and offer insights to maximize tree benefits for the individual residents as well as
their residential neighborhood. Research outcomes can help policy makers, urban planners,
homeowners, and landscape architects to design and plant trees to create a sustainable
urban environment.
1.3 Outline of the Dissertation
This dissertation includes five chapters: an introductory chapter, three individual
chapters each serves as a first-authored research article, and a concluding chapter. This
section describes them in more details.
Chapter 2 integrates geographic information systems (GIS) with spatial optimization to
precisely and optimally locate shade trees for a residential household. Shade coverage on
different building structures (rooftops, facade, and windows) and nearby buildings are
considered in the optimization model. The research in this chapter attempts to identify the
best tree locations and arrangement at the single-family building scale. This Chapter was
published in Building and Environment in February 2017 with co-authors Elizabeth A.
Wentz and Alan T. Murray.

6
Chapter 3 evaluates the cooling benefits of tree shade to the building facade under
different tree densities, locations and arrangements. The locational benefits of trees are
evaluated in the outdoor urban physical scale model experiment. The research in this
chapter validates the research results in chapter 2 and further provides realistic
recommendation to planting trees in the building scale. This chapter is under revision and
will be submitted to Urban Forestry & Urban Greening in September 2017 with co-
authors Jiachuan Yang, Zhi-Hua Wang, and Elizabeth A. Wentz.
Chapter 4 assesses the impact of tree locations and arrangements for the outdoor
microclimate and human thermal comfort in the urban desert residential environment.
Outdoor microclimate and human thermal comfort under different tree locations and
arrangements are simulated by the microclimate numerical simulation platform. The
research in this chapter inherits the research results from chapter 2 and 3, and evaluates
whether optimal tree planting scenarios for the individual buildings create optimal
microclimate built environment in the residential neighborhood. This chapter is under
preparation and will be submitted to Landscape and Urban Planning in September 2017
with co-authors David J. Sailor and Elizabeth A. Wentz.
Chapter 5 is the conclusion of the dissertation. This chapter summarizes the main
achievements of this dissertation and proposes future research directions.
7
CHAPTER 2
TREE SHADE COVERAGE OPTIMIZATION IN AN URBAN RESIDENTIAL
ENVIRONMENT
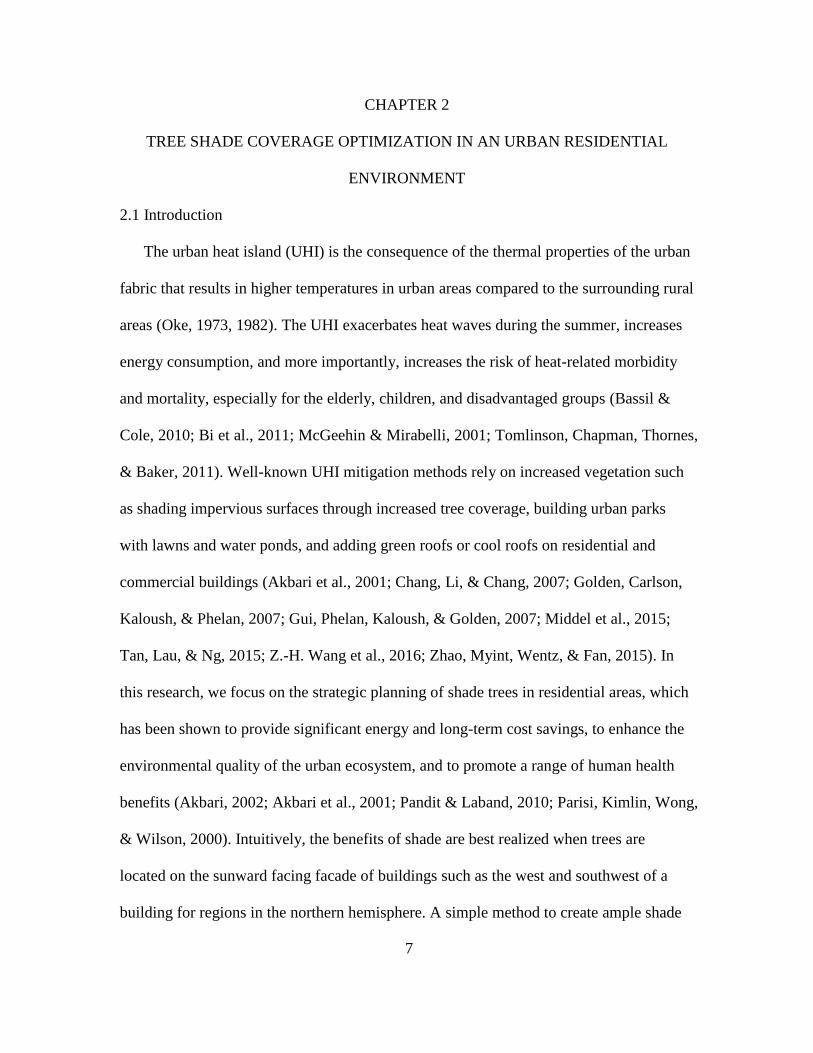
2.1 Introduction
The urban heat island (UHI) is the consequence of the thermal properties of the urban
fabric that results in higher temperatures in urban areas compared to the surrounding rural
areas (Oke, 1973, 1982). The UHI exacerbates heat waves during the summer, increases
energy consumption, and more importantly, increases the risk of heat-related morbidity
and mortality, especially for the elderly, children, and disadvantaged groups (Bassil &
Cole, 2010; Bi et al., 2011; McGeehin & Mirabelli, 2001; Tomlinson, Chapman, Thornes,
& Baker, 2011). Well-known UHI mitigation methods rely on increased vegetation such
as shading impervious surfaces through increased tree coverage, building urban parks
with lawns and water ponds, and adding green roofs or cool roofs on residential and
commercial buildings (Akbari et al., 2001; Chang, Li, & Chang, 2007; Golden, Carlson,
Kaloush, & Phelan, 2007; Gui, Phelan, Kaloush, & Golden, 2007; Middel et al., 2015;
Tan, Lau, & Ng, 2015; Z.-H. Wang et al., 2016; Zhao, Myint, Wentz, & Fan, 2015). In
this research, we focus on the strategic planning of shade trees in residential areas, which
has been shown to provide significant energy and long-term cost savings, to enhance the
environmental quality of the urban ecosystem, and to promote a range of human health
benefits (Akbari, 2002; Akbari et al., 2001; Pandit & Laband, 2010; Parisi, Kimlin, Wong,
& Wilson, 2000). Intuitively, the benefits of shade are best realized when trees are
located on the sunward facing facade of buildings such as the west and southwest of a
building for regions in the northern hemisphere. A simple method to create ample shade
8
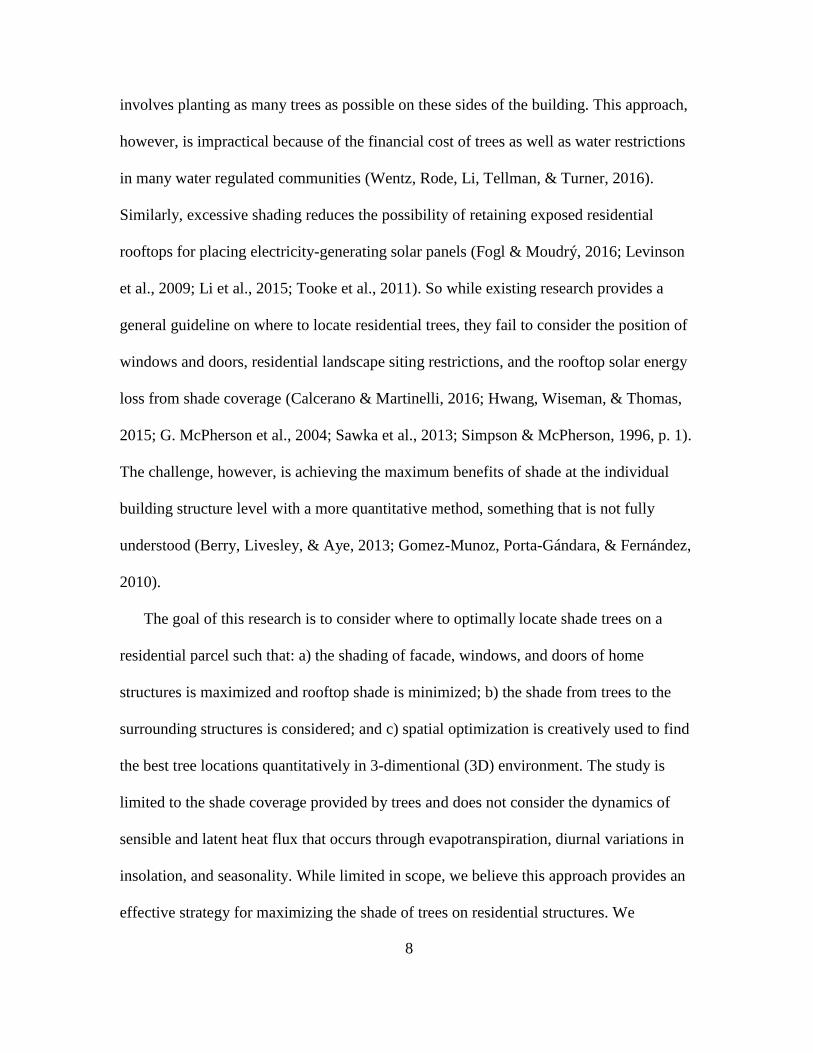
involves planting as many trees as possible on these sides of the building. This approach,
however, is impractical because of the financial cost of trees as well as water restrictions
in many water regulated communities (Wentz, Rode, Li, Tellman, & Turner, 2016).
Similarly, excessive shading reduces the possibility of retaining exposed residential
rooftops for placing electricity-generating solar panels (Fogl & Moudrý, 2016; Levinson
et al., 2009; Li et al., 2015; Tooke et al., 2011). So while existing research provides a
general guideline on where to locate residential trees, they fail to consider the position of
windows and doors, residential landscape siting restrictions, and the rooftop solar energy
loss from shade coverage (Calcerano & Martinelli, 2016; Hwang, Wiseman, & Thomas,
2015; G. McPherson et al., 2004; Sawka et al., 2013; Simpson & McPherson, 1996, p. 1).
The challenge, however, is achieving the maximum benefits of shade at the individual
building structure level with a more quantitative method, something that is not fully
understood (Berry, Livesley, & Aye, 2013; Gomez-Munoz, Porta-Gándara, & Fernández,
2010).
The goal of this research is to consider where to optimally locate shade trees on a
residential parcel such that: a) the shading of facade, windows, and doors of home
structures is maximized and rooftop shade is minimized; b) the shade from trees to the
surrounding structures is considered; and c) spatial optimization is creatively used to find
the best tree locations quantitatively in 3-dimentional (3D) environment. The study is
limited to the shade coverage provided by trees and does not consider the dynamics of
sensible and latent heat flux that occurs through evapotranspiration, diurnal variations in
insolation, and seasonality. While limited in scope, we believe this approach provides an
effective strategy for maximizing the shade of trees on residential structures. We

9
therefore present a 3D spatial optimization model that identifies optimal tree locations for
residential structures by integrating geographic information systems (GIS) with spatial
optimization methods to solve this problem as a mathematical model. We demonstrate
the method on a residential neighborhood in the greater Phoenix metropolitan area of
Arizona, where tree shade coverage, water conservation, and solar energy potential are
critical because of the hot and dry conditions.
2.2 Literature Review
The study described here draws upon literature examining residential tree shade and
spatial optimization in 3D environment. From the residential tree shade literature,
research shows that west and east tree shade outside of house open structures provide the
optimal cooling effects and energy reduction on residential homes (G. McPherson et al.,
2004). The 3D spatial optimization literature guides the research on how to extend the 2-
dimentional (2D) maximum coverage location problem into the 3D space (Lee, 2015).
The following sections elaborate on these bodies of work.
2.2.1 Impact of Tree Shade
Existing research on the impact of tree shade on home structures associates tree shade
with energy use savings in a single-family house setting. Larger energy savings, up to 54%
in some studies (Sawka et al., 2013), are found with trees located on the west side of a
home, followed by trees on the east or southwest (G. McPherson et al., 2004; Simpson &
McPherson, 1996). These conclusions are similar across different northern hemisphere
climate zones where both heating and cooling conditions are considered. For example,
Hwang et al. (Hwang et al., 2015) evaluated the tree shade effects from a single tree to a
single family house during the cooling and heating season at both northern (Minneapolis

10
and Indianapolis) and lower latitude (Charlotte and Orlando) locations. Using the
distance between the tree and the building through eight cardinal (E, S, W, N) and inter-
cardinal points (NE, SE, SW, NW), they show that trees on the west and east side of the
house provided more energy conservation than those on the south side during the summer
followed by the southeast or southwest.
The beneficial relationship between tree shade and energy is well established but
there are only general guidelines on tree placement strategies and the optimal number of
trees. Tree placement strategies emphasize cardinal direction with precision only
specified at the inter-cardinal level (Hwang et al., 2015) and without incorporating the
distance from the home structure. This type of information is limited when it is infeasible
to plant trees in specific cardinal directions. Furthermore, the distance trees are planted
from the house structure, independent of the directionality, can further impact the area
tree shade on a facade. Similarly, the number of planted trees is understudied, with most
research focusing on the impact of a single tree. The starting point for these issues is
research such as Simpson & McPherson (Simpson & McPherson, 1996), McPherson et al.
(G. McPherson et al., 2004), Calcerano & Martinelli (Calcerano & Martinelli, 2016),
Huang et al. (Y. J. Huang, Akbari, Taha, & Rosenfeld, 1987), and Akbari & Taha
(Akbari & Taha, 1992), who examined shading effects on different tree heights, multiple
story buildings, and number of trees. Results are consistent with prior research showing
optimal tree placement for energy savings is the east and west side of the buildings.
These studies offer a broader range of design considerations, but they still do not consider
the relationship to neighboring houses, the open features on the building facade, and a
potential for rooftop solar panels.

11
Design considerations for tree placement additionally need to consider the
relationship to nearby buildings, additional shade for windows and doors, and rooftop
exposure for solar panel installations. There are two considerations for nearby buildings
and tree placement. Nearby buildings, depending on distance, can simultaneously provide
shade as well as receive shade from target building trees, although little research has
examined this dual relationship. Also missing from the literature is tree placement to
maximize shade on windows and doors. Windows and doors have less heat-insulation
comparing to facades, so shading the windows by trees or other nearby structures will
provide significant energy saving to the household comparing to facade (Safarzadeh &
Bahadori, 2005). On the other hand, residential building rooftops are the preferred
location for photovoltaic solar panels to generate electricity from direct solar radiation,
shown in multiple geographic locations (Ordóñez, Jadraque, Alegre, & Martínez, 2010).
Tree canopy coverage and shade will significantly reduce the photovoltaic efficiency of
solar panels (Fogl & Moudrý, 2016; Levinson et al., 2009; Tooke et al., 2011).
2.2.2 Spatial Optimization in 3D
A challenge in maximizing shade coverage is that the buildings and trees are 3D
objects, where the comparative location of the trees, roof, facade, doors and windows are
important components for insolation remediation. Many real world facility location
modeling problems have service coverage in the 3D environment such as camera
surveillance or Wi-Fi connection services (Amriki & Atrey, 2014; H. Huang et al., 2014;
Lee, 2015). Nevertheless, existing facility location modeling problems are mostly
abstracted and formulated in the 2D environment, such as the location set covering
problem (LSCP) and the maximal covering location problem (MCLP) (R. Church &

12
ReVelle, 1974; Toregas, Swain, ReVelle, & Bergman, 1971). To manage the 3D space,
these 3D coverage problems were simplified into 2D environment to ease the formulation
and solution of the facility location problems (Letourneux, Corre, Suteau, & Lostanlen,
2012). Because of the dimensional simplification, the reliability and accuracy of optimal
facility locations were unavoidably lost projecting from a 3D to a 2D environment.
With the development of 3D computational tools, several attempts have been made to
appropriately formulate and solve the facility location modeling problems in the 3D
environment (Lee, 2015). Some of this has taken place through a 2.5D surface, such as
digital elevation model (DEM), by using a visibility analysis or viewshed analysis
(Podobnikar & Vrečko, 2012). Goodchild & Lee (Goodchild & Lee, 1989) utilized
visibility analysis to locate the minimum number of viewpoints to observe the entire
DEM surface, or to locate a fixed number of viewpoints to maximize the overall visible
area on the DEM. This research extended the concept of set-covering problems to the
topographic surface, and viewshed analysis was used to derive coverage on the DEM
surface rather than the 2D planar surface. However, DEM is not a real 3D surface and the
coverage derivation by visibility analysis required extensive computation. These
limitations make it difficult to use their method to obtain the optimal coverage in a true
3D environment. To overcome the computational inefficiency, Kim et al. (Kim, Rana, &
Wise, 2004) extended Goodchild and Lee’s research by only utilizing terrain features
(peak, pass and pit) as candidate viewpoints to acquire the maximal coverage with given
number of viewpoints. Their method solved the problems faster and overcame the
computational difficulty, but they used the same viewshed method to derive the coverage
in 2.5D. Murray et al. (Murray, Kim, Davis, Machiraju, & Parent, 2007) found optimal

13
security sensor placements in a 3D university environment utilizing the MCLP and the
backup coverage location problem with visibility analysis. They considered the 3D
building blocking effects in the coverage derivation process, but the coverage was only
derived on the ground surface and did not consider the coverage on campus building
facades. Most recently, Bao et al. (Bao, Xiao, Lai, Zhang, & Kim, 2015) applied
viewshed analysis to derive the watchtower coverage on the DEM, and integrated LSCP
and MCLP solutions to determine the optimal watchtower locations for forest fire
monitoring. To simplify the coverage representation, they used viweshed analysis to
derive coverage on the 2D raster surface. Although their methods integrate different
methods to improve the efficiency of optimizing watchtower location, the coverage
representation is still limited in the 2D rather than 3D. All of the research above
demonstrate that visibility analysis or viewshed analysis are useful methods to help
derive service coverage in the 2.5D or 3D environment. However, none of these existing
literature deals with the service coverage on the real 3D objects. This remains as an
obvious research opportunity to extend this type of research into 3D environment.
To extend existing facility location modeling analysis into 3D, a range of problems
exist such as computational complexity, 3D data availability, problem size, and model
complexity. However, the key question is how to extend the 2D service coverage into the
3D environment. Besides the visibility analysis, several researchers have attempted to
solve the facility location problems with 3D coverage in the real 3D space (Amriki &
Atrey, 2014; Dao, Zhou, Thill, & Delmelle, 2012; Lee, 2015). Lee (Lee, 2015)
introduced a 3D coverage location model of Wi-Fi access points in an indoor
environment. Euclidean distance in the 3D space was utilized to generate the 3D

14
volumetric coverage rather than the 2D circular coverage. The software environment
ArcGIS was able to generate demand nodes and candidate facility sites within the 3D
representation, calculate 3D Euclidean distance, and visualize solutions in a 3D
environment. Commercial optimization software (CPLEX) successfully solved the
problem in seconds with no computational difficulty. Lee’s research provides a
successful example to extend facility location modeling problems by using 3D volumetric
coverage in the 3D GIS environment, however, the 3D volumetric coverage was all
perfectly sphere shape and did not consider the coverage change by surrounding obstacles.
Similar attempts were made by Amriki & Atrey (Amriki & Atrey, 2014) on bus
surveillance system. In their research, they optimized camera locations and orientations
in a 3D interior bus space that was simulated by Autodesk 3ds Max. Maximal overall
surveillance coverage with a specific number of cameras and minimum number of
cameras to reach specified coverage in the bus were presented. They were able to
evaluate the camera’s visible region in 3D while avoiding obstacles, but they evaluated
the empty space rather than coverage on 3D objects. Zhao et al. (Zhao, Wentz, & Murray,
2014) demonstrated a simple version of shade coverage optimization for the single family
household in Tempe, AZ. Shade coverage was derived on different 3D building structures
in the 3D environment. Zhao et al.’s research provides limited details about formulating
and solving the facility location modelling problems in 3D, requiring more detailed
research on service coverage in 3D objects and decide the best facility locations.

15
2.3 Methods
2.3.1 Study Area
The study focuses on a parcel with a detached single-family home and the
surrounding buildings within a residential neighborhood in the City of Tempe, Arizona
(33.4 N, 111.9 W, Figure 2.1). Tempe is a municipality within the greater Phoenix
metropolitan area in the Sonoran Desert of the U.S. Southwest. The population of Tempe
in 2010 was more than 160,000 with greater than 40% of the residents living in single-
family detached dwellings (US Census Bureau., n.d.). With summertime temperatures
reaching or exceeding 43C, heat mitigation strategies such as tree shade are essential for
reducing heat-related diseases and energy consumption.
The specific parcel we analyzed is a generic residential parcel in a Tempe residential
neighborhood where most of the single-family households were built during the 1950s
and 1960s. The average parcel size is 695 m2 and the typical home is single story with an
average size of 134 m2. The residential neighborhood has a dense building arrangement
with neighboring structures next to one another on the west and east side, except those
close to the major roads running north-south. This specific neighborhood layout makes it
infeasible to plant trees on the west or east side of the building to provide shade.
Although there are no regulations that specify the type of landscaping, 95% of the parcels
in this neighborhood contain trees (identified from remotely sensed images), which offer
some level of shade on the home structures.
16
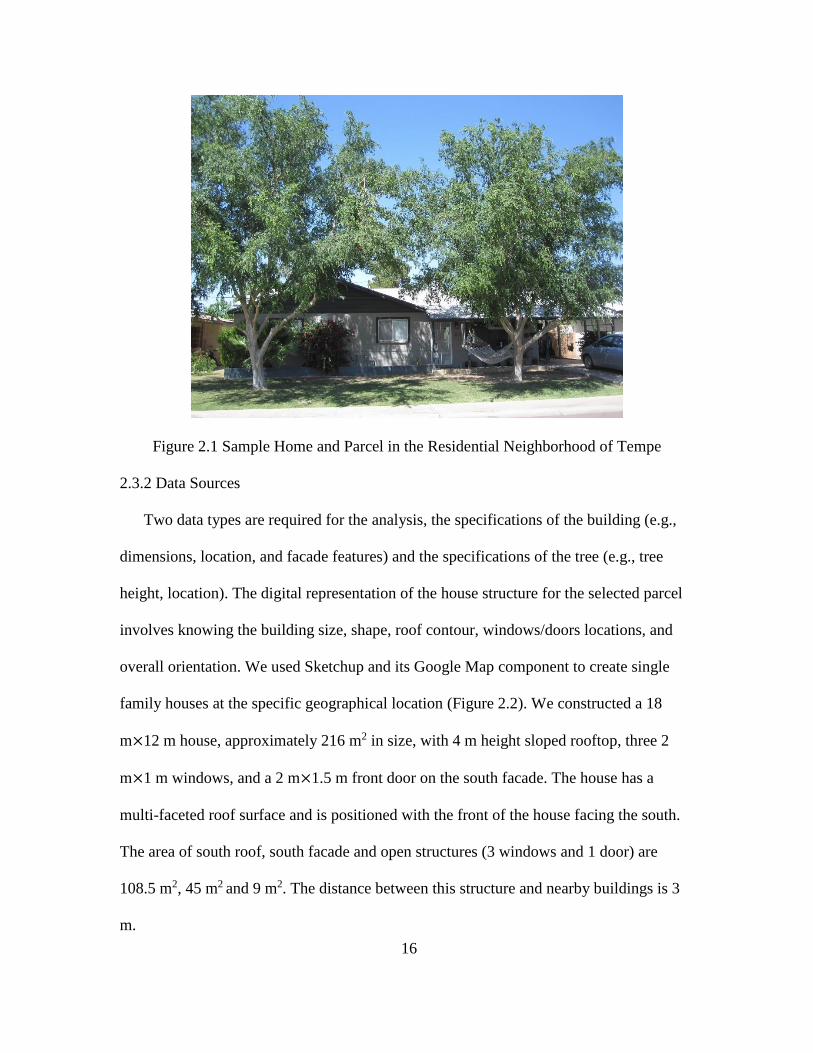
Figure 2.1 Sample Home and Parcel in the Residential Neighborhood of Tempe
2.3.2 Data Sources
Two data types are required for the analysis, the specifications of the building (e.g.,
dimensions, location, and facade features) and the specifications of the tree (e.g., tree
height, location). The digital representation of the house structure for the selected parcel
involves knowing the building size, shape, roof contour, windows/doors locations, and
overall orientation. We used Sketchup and its Google Map component to create single
family houses at the specific geographical location (Figure 2.2). We constructed a 18
m×12 m house, approximately 216 m2 in size, with 4 m height sloped rooftop, three 2
m×1 m windows, and a 2 m×1.5 m front door on the south facade. The house has a
multi-faceted roof surface and is positioned with the front of the house facing the south.
The area of south roof, south facade and open structures (3 windows and 1 door) are
108.5 m2, 45 m2 and 9 m2. The distance between this structure and nearby buildings is 3
m.

17
The digital representation of the tree includes tree size, shape, and position. The 3D
tree plugin in Sketchup was used to create a theoretical 7 m high, 6 m crown diameter,
and 3 m trunk height to represent a thornless mature mesquite (Prosopis thornless hybrid
‘AZT™’), a common xeriscape flora found in Tempe residential neighborhoods. The
advantage of our tree model is that we can represent realistic desert trees with low
leaf/area index rather than other simple “cylinder-like” or “cone-like” tree models. By
using this tree model, we can derive a more accurate tree shade on the structure.
Although different tree shapes, sizes, species can be selected and these parameters would
definitely influence the level of tree shade on different building structures such as
rooftops, this 7 m thornless mesquite is typical of those found in Tempe (“Eligible desert-
adaptive shade trees,” n.d.; “Urban Tree Scientist - Central Arizona–Phoenix Long-Term
Ecological Research,” n.d.) (see Figure 2.2). The challenge, of course, is identifying the
best placement of one or more trees to provide shade coverage to this building structure.
Figure 2.2 3D Building and Tree Models
2.3.3 Modeling Approach
We utilized GIS and spatial optimization to model the tree shade coverage
optimization problem. GIS tools provide data storage, spatial analysis, and 3D topology.

18
Optimization methods are used to abstract the real world situation as a mathematical
problem as well as solve this problem. This section describes the analytical procedures
we used.
2.3.3.1 GIS: Surface Coverage Derivation
Spatial topology and trigonometry principles are used to store the spatial information
and to derive surface coverage. Topological data structures in GIS store the location,
configuration, and attribute information of 2D and 3D objects. More specifically, to
derive the shadow location, trigonometry principles are used. The formal trigonometry
specifications are shown in equation (2.1) - (2.4). In these equations, (𝑥, 𝑦, 𝑧) represents
points from a tree, ε is the solar profile angle, γ is the difference between solar azimuth
and surface azimuth angles, β is the solar altitude angle, and H is the height of the roof.
All solar angles are calculated based on Duffie and Beckman (2013) (Duffie, 2013).
Figure 2.3 shows that it is possible to mathematically derive shade coverage associated
with 3D object across a range of conditions. Figure 2.3(a) shows the solar angles and
ground shading, the shading point on the ground is at (𝑥′, 𝑦′, 0). Figure 2.3(b) represents
the facade shading, the shading point on the facade is (0, 𝑦′′, 𝑧′′). Figure 2.3(c) explains
the roof shading, the shading point on the rooftop is (𝑥′′′, 𝑦′′′, 𝐻).
h = z
tan β
(2.1)
where h is the shadow length on the 2D plane by solar altitude angle (β)
x′ = x −z
tan ε; y′ = y − hsinγ
(2.2)
which calculates the horizontal shadow projection (𝑥′, 𝑦′) based on solar profile

19
angle (ε) and azimuth angle (γ)
y′′ = y − xtanγ; z′′ =x′z
x′ − x
(2.3)
which determines the vertical shadow projection, (y′′, z′′), over a house facade
according to horizontal shadow (x′) and azimuth angle (γ)
x′′′ = x −z − H
tan ε; y′′′ = y − (x − x′′′)tanγ
(2.4)
which derives the horizontal projection (x′′′, y′′′) on a roof given building height
(H), solar profile angle (ε) and azimuth angle (γ)
(a) Ground shading.

20
(b) Facade shading.
(c) Roof shading.
Figure 2.3 Shade Projections from a Point (x, y, z) on a 3D Object (Redraw from Gomez-
Munoz et al. (2010) (Gomez-Munoz et al., 2010))

21
2.3.3.2 Spatial Optimization: Tree Placement
Using Church & Murray (Church & Murray, 2009) and the MCLP of Church &
ReVelle (Church & ReVelle, 1974), we define the following notation:
i = index of 3D object components;
j = index of potential tree locations;
d = index of extreme heat days;
t = index of extreme heat hours in a day d;
wi = weight of object component i;
gi = area of object component i;
p = number of trees to be located;
f( ) = shade coverage function relating parameters of an object using
trigonometry equation (2.1) - (2.4);
Std = solar angles at time t on day d;
Ni = set of potential tree siting locations that shade object component i;
Decision variables are:
Citd = amount of object component i covered at time t, day d;
This notation allows for the specification of object components, such as roof, facade,
windows and doors. Accordingly, Citd tracks shade provided to object component i at
time t on day d as a function of surface coverage. Using this notation, the model for 3D
object coverage is as follows:
Xj = {1,0,
if tree located at potential site j
otherwise

22
Maximize ∑ wi ∑ ∑ Citdtdi (2.5)
Subject to:
Citd = f(gi, Std, Xj, j ∈ Ni) ∀i, t, d (2.6)
∑ Xj = p
j
(2.7)
Xj = {0,1} ∀j (2.8)
Citd ≥ 0 ∀i, t, d (2.9)
The objective, (2.5), is to maximize tree shade coverage of different object
component i (roof, facade and windows/doors) during a particular time period and date
with a predefined weight wi. wi represents the priority of tree shade coverage to different
building structure i. In general, windows/doors are open structures and need the most
shade to mitigate direct solar radiation in the desert environment, following with building
facade. Roof needs less or no shading because residential roof is always built with heat-
insulation materials and is a perfect place to install solar panels to generate electricity
from solar energy. Constraints (2.6) define the amount of coverage that will be provided
to object component i (roof, facade and windows/doors) based upon the tree locations and
solar angles at a specific time period and date. Constraints (2.7) specify the number of
trees to be located. Integer restrictions on the siting variables are stipulated in Constraints
(2.8). Non-negative restrictions on coverage variables are indicated in Constraints (2.9).
2.3.3.3 Heuristic
We solve the 3D tree shade optimization problem through a heuristic solution
approach for three reasons. First, it is computationally intensive to calculate shade
23
coverage on different building structures by trigonometry principles we mention above,
especially when we have a detailed and complicated 3D tree and building models. Second,
there is not an exact method that can be applied to solve this optimization problem with a
nonlinear constraint involving a trigonometric function. Third, trees can be located
anywhere in the continuous space resulting in infinite combinations of different tree
arrangements with multiple trees. Thus, we used a greedy-adding algorithm combining
with brute-force (enumeration of all possible candidate sites) method to find a near-
optimal solution for this problem. The detailed steps are:
1) Define the set of potential tree siting locations (Ni) based on tree height, tree crown
diameter, outdoor landscaping codebook, and building layouts.
2) Brute-force method is used to locate the first tree by enumerating all the potential
tree locations around the building during heat hours at given number of summer days.
The best tree location can be found by maximizing tree shade coverage (Citd) on building
structures with predefined shading weights (wi).
3) To avoid tree crown overlap, the potential tree siting locations (Ni) within the
existing tree crown is eliminated.
4) Repeat step 2) and 3) to locate the next tree around the building, until the potential
tree siting location set is empty or locates p trees.
2.3.3.4 Model Parameter Explanation and Simplification
Because infinite potential tree locations exist, the simplification of potential tree
siting location set is necessary. Potential tree placement on the residential parcel is
summarized based on landscape design guidelines (City of Tempe, AZ : Zoning and
Development Code - Appendix, 2011; City of Tempe, AZ : Zoning and Development Code

24
- Part 4: Development Standards, 2011). In the northern hemisphere, landscape design
guidelines suggest that trees should be planted on the south, west, or east of structures.
Because of the space limitation on the west and east side of the house, we limited tree
placement to the south of the building. Further, to avoid unnecessary tree shade coverage
on the rooftops, a minimum distance of 3 m between the tree and the building is
predefined (Figure 2.4).
Figure 2.4 Potential Tree Placement Area in the Study Site (Plan View)
To simplify the solution process, the continuous space was discretized into 42
potential tree locations as the potential facility location set (Ni) (3 m intervals in the east-
west direction and 1 m intervals in the south-north direction). Figure 2.5 shows half of
the potential tree locations in the study site. Besides testing the shading benefits for the
target building, we also derive the shade coverage on the two nearby buildings to obtain
the shading benefits for the surrounding building structures. We locate two trees (p=2)
because this is the most common number of trees to be planted in the desert city
considering the water usage and landscape regulation, but in general, the spatial
optimization method can be used to locate any number of trees in the 3D environment.

25
Figure 2.5 Potential Tree Locations in the Study Site (Plan View)
The weight of object component i (wi) was defined as 0.7, 0.4 and -0.1 for
windows/doors, facade and rooftops. Several reasons helped to define these weighting
coefficients. The structure components we assigned as most important for shading were
open structures such as windows and doors. Although these open structures are a small
area compared to facades and rooftops, solar radiation impacts are greatest through
windows and doors (Wagar, 1984). From existing literature, the heat conduction from the
sun through 1 ft2 of facade or roof was only about 2% of the heat that passed through a
window (Heisler, 1986). Thus, when tree shade covers open structures, there are greater
energy savings. Considering heat conduction and solar radiation, shade coverage on
windows/doors had the highest priority, followed by facade, and rooftops. Further,
residential roof was an appropriate location to place solar panels to generate solar energy.
We penalized the rooftop shading by using a small negative weight.
The shade was determined using trigonometry principles detailed in section 3.3.1.
Sun location and radiation was simulated in Sketchup. The criteria for measuring shade
effects on different structures of a single-family residence are based on the work of

26
Shaviv & Yezioro (Shaviv & Yezioro, 1997), who proposed the use of a geometrical
shading coefficient to express the ratio between shaded and total examined surface areas.
We selected the heat period from 9:30 to 15:30 in a 30 minutes’ interval during four heat
days (June 15th, July 15th, August 15th, and September 15th) to represent the periods of
greatest insolation (Pidwirny, 2006). To simplify the optimization criterion, we assume
the most shading coverage will result in the most cooling benefits for the building
structures in this research. A heuristic approach for solving the optimization model, (5) -
(9), was structured based on the section 3.3.3. The accumulated weighted shaded area,
objective (5), was calculated for each potential location with the given weights (wi) for
windows/doors, facade and rooftops.
2.4 Results
The optimization results illustrate how tree shade area changes across different
locations and building-tree distances (Figure 2.6). From Figure 2.6(a), tree shade
coverage significantly decreases when we increase the distance between the tree and the
building, and the central parts of the front yard will provide the most shade for the overall
household in regardless of building-tree distance. Figure 2.6(b) shows the tree shade
coverage surface in the potential tree planting area by interpolation in the GIS
environment. The results show that facade tree shade area could be reduced to zero if
trees are planted near the southern parcel boundary and far away from the buildings. This
demonstrates that simply following the guidelines, planting trees on a specific side of a
buildings, could result in little or no shade on the house structure.

27
(a) Accumulated weighted shaded area (m2) under different locations and tree-building
distances (distance of 3 m, 4 m and 5 m from left to right).
(b) Geographical representation of tree location priority when planting one tree.
Figure 2.6 Tree Shade Coverage in One Tree Scenario
The results of the heuristic modeling for the first tree show that the best site is at
location 4, which is 3 m from the building’s south facade and 9 m from the building west
0
50
100
150
200
250
Target building Surrounding building

28
and east facades (Figure 2.6(a) and 2.7(a)). The accumulated shading time from this
single mature mesquite tree to the central part of the building south facade and open
structures on August 15th is up to four hours (Figure 2.7(b)). Results show that the single
mature mesquite tree can provide this shading to the central parts of building facade and
open structures on this day.
(a) Tree location (plan view).
(b) Shading time in 3D environment.
Figure 2.7 Optimal Shading from One Tree (August 15th, at Location 4)
To locate a second tree with our heuristic method, we first eliminated the potential
facility set based on the first tree location and landscaping limitation (no tree crown

29
overlap), then enumerate all remaining options. To improve the performance of the
heuristic algorithm, we repeated the heuristic algorithm with three different starting
conditions (the first tree locates at 3, 4, or 5). The results show that the best near-optimal
solution is at location 3 and 5 (see Figure 2.8 and Figure 2.9(a)). The accumulated
shading time from these two trees on August 15th is shown in Figure 2.9(b). Two mature
mesquite trees can provide up to 6 hours shading to the central parts of the building south
facade and open structures in this day, and provide at least one hour shading to the whole
building facade. The top three two-trees siting arrangements are location 3 and 5, location
4 and 6, and location 2 and 5.
Figure 2.8 Accumulated Weighted Shaded Area (m2) Comparison for Two Trees (Only
Showing the Two Tree Combination from Location 1 to 7)
0
50
100
150
200
250
300
350
400
450
Target building Surrounding building

30
(a) Tree locations (plan view).
(b) Shading time in 3D environment.
Figure 2.9 The Best Near-optimal Shading Results from Two Trees (August 15th, at
Location 3 and 5)
A breakdown of component coverage (windows/doors, facade and rooftops) is
summarized in Figure 2.10 for the thirteen 30-minutes time periods between 9:30 and
15:30 with the average value of June 15th, July 15th, August 15th and September 15th in
2016. Two trees are located at location 3 and 5, which presents the best near-optimal
shading area found by the spatial optimization method in a two-tree setting. In Figure
2.10(a), the tree shade coverage ratio demonstrates the shade to different components of

31
the residential structures. For example, windows/door had more than 35% shade coverage
ratio during 11:00 to 15:00. This results in a steady solar radiation deduction provided by
these two trees for this single family household during the heat hours. The south facade
of the house was covered by shade more than 30% from 10:00 to 15:00. Significant
blocking effects for solar radiation from tree shade were provided. With less solar
radiation penetrates the open structures and heats up building facade, the individual
household can significantly reduce its energy consumption. The south roof coverage ratio
was all less than 7%, which represents a good exposed rooftop for the solar energy
potential. From Figure 2.10(b), the four-day average open structure accumulated shade
coverage is 41.96 m2, with the maximum coverage of 3.82 m2 out of 9 m2 at 12:00. The
four-day average accumulated shade coverage is 202.94 m2, with the maximum coverage
of 18.38 m2 out of 45 m2 at 12:00 as well. The four-day average accumulated shade
coverage of rooftop is 80.26 m2, with the maximum coverage of 7.03 m2 out of 108.5 m2
at 10:30. By using the spatial optimization method, we successfully maximize the
building facade and open structure shading, and minimize the shade on the building
rooftop.

32
(a) Average summer month shade coverage ratio (%) at optimal location.
(b) Average summer month shade coverage area (m2) at optimal location.
Figure 2.10 Tree Shade Coverage with the Best Near-optimal Arrangement (Location 3
and 5)
0
5
10
15
20
25
30
35
40
45
9:30 10:00 10:30 11:00 11:30 12:00 12:30 13:00 13:30 14:00 14:30 15:00 15:30
Roof coverage ratio Façade coverage ratio Open structure coverage ratio
0
2
4
6
8
10
12
14
16
18
20
9:30 10:00 10:30 11:00 11:30 12:00 12:30 13:00 13:30 14:00 14:30 15:00 15:30
Roof coverage area Façade coverage area Open structure coverage area
33
2.5 Discussion
This study shows that maximizing shade area occurs with trees planted 3 m south of
central part of the home structure, unlike the results from prior studies that measure
energy efficiency or consumption from nearby tree shade. The reason behind this
difference is that the compact urban setting restricts residents to plant trees in the west
and east side of the household. When locating trees in front of the building south facade,
the locations of windows & doors are significant factor to influence the decision making.
With limited number of trees to be planted for each residential household, homeowners
should focus more on planting shade trees in the central area of their south front yard to
provide shade (30%-35% shade coverage with two trees) for their own open structures
and facade. Previous research recommend to plant trees at the southwest corner of the
building front yard, this research result shows that it is not always optimal to simply plant
trees at the southwest side of the buildings. A quantitative method that incorporates
neighborhood conditions and building/tree characteristics is a more reliable way to
achieve the maximum shade.
The near-optimal two-tree arrangement (location 3 and 5) provides around 35% shade
coverage of open structures and facades during the peak heat hours at summer months.
Since most of the previous literature did not recommend to plant trees on the south side
of buildings (limited shade coverage during the summer), the results demonstrate that two
desert trees at optimal locations can still provide a significant amount of shading
residential household. To consider the aesthetic design and add the landscaping variety of
residential trees, different tree spacing can be adapted in the residential yard based on the

34
results in Figure 2.8. Besides the tree arrangement at location 3 and 5, location 4 and 6 or
location 2 and 5 also provide significant shade coverage to the residential household.
The breakdown of the building components (windows & doors, facade, and rooftops)
make it possible to maximize tree shade coverage on the “shade-friendly” building
structures such as windows & doors. With the weighting coefficients in the optimization
method, the emphasis of tree shade coverage can be easily adjusted depending on
different types of building materials and structures. On the other hand, rooftop exposure
is preserved by minimizing tree shade coverage on the building rooftops, which is not
examined or achieved in the previous tree shade related research. Besides considering the
separated building components, tree shade coverage to the surrounding buildings are also
evaluated. In this particular compact residential neighborhood, tree shade coverage on the
nearby buildings cannot be ignored, especially when planting trees near the parcel
boundaries. However, the results show little shade coverage on the surrounding buildings.
The reason behind this finding is that shadow length is relatively limited during the
greatest insolation hours from 9:30 to 15:30. The shading benefits to the surrounding
buildings need to be further explored in the future study.
In addition to the specifics of tree shade, this paper also demonstrates the way in
which a 3D spatial optimization model can support the identification of optimal tree
locations for providing shade to 3D urban building structures. To implement this model,
3D modeling along with GIS spatial processing techniques are used to determine the
three dimensional geometric properties of structures to be shaded by the optimal location
of trees. We provide a demonstration and implementation of the model using a single-
family house with its surrounding buildings in Tempe, Arizona. GIS and spatial

35
optimization techniques were employed to formalize a mathematical model that could be
used for identifying optimal placement of the single tree that optimize accumulated shade
coverage on building structures. Heuristic was used to solve the optimization problem
involving trigonometry functions and provided the near-optimal solutions of the two trees
scenario (real world scenario) for policy makers and planners. The optimization results
show that two trees can provide a maximum of 244.90 m2 accumulated shade coverage to
a single-story residential house’s south facade and open structures from 9:30 to 15:30
(shade area was calculated in every 30 minutes) on a hot summer day from June to
September, and the maximum shade coverage is achieved at 12:00 with the shade area of
22.20 m2 in the 54 m2 south facade and open structures. Optimal tree locations can offer
significant energy savings, reduce long-term economic costs and create a healthier living
environment.
This is the first known attempt to identify the precise location and number of trees to
maximize tree shade on home structures. There is, however, more that can be done to
extend this work. For example, this study only considers an individual single-family
household and its surrounding buildings. A large residential region will require
automated 3D building extraction and construction techniques combining remote sensing
and GIS. Also, different tree species, varying growing processes and alternative tree
height and crown size reflect important options for flora. In this research, we use a 7 m
high mature desert tree to represent a common situation in the desert setting, however,
different tree species will have different tree height, leaf area index/canopy density, and
crown size (Armson, Rahman, & Ennos, 2013). Furthermore, all of the tree-related
parameters will change during the tree’s growing process (Rahman, Armson, & Ennos,

36
2015). All of these factors would influence the final optimization results. Also, it must be
noted that maximizing the number of hours of shade does not necessarily correlate with
minimizing air conditioning energy use, as the latter is highly dependent upon diurnal
cycles in internal/external loads as well as occupancy. Future research can extend this
work to focus on comparing tree shade benefits with different tree-related parameters at
the same tree locations and arrangements.
2.6 Conclusions
Strategic shade provision offers the potential to mitigate the effects of high solar
radiation loads on summer days, enabling economic, environmental and health related
benefits. We build upon research that links tree coverage with energy savings with higher
levels of precision on tree placement. Unlike prior research, we provide specificity
beyond the cardinal direction and address the relationship to nearby structures, shade on
windows and doors, and retaining the option for rooftop solar panels. Future directions
involve evaluating the microclimate benefits under different tree locations and
arrangements, such as wind speed/direction and solar radiation intensity, and quantifying
the cooling benefits of tree shade through an outdoor urban physical scale model with
field measurement. The proposed method for carrying out the analysis in a 3D
environment is an important first step in relating local level decision making to positive
regional and global change.

37
CHAPTER 3
ASSESSING THE COOLING AND LOCATIONAL BENEFITS OF TREE SHADE BY
AN OUTDOOR URBAN PHYSICAL SCALE MODEL AT TEMPE, AZ
3.1 Introduction
The demands of a rapidly growing human population have resulted in a shift toward
larger and more expansive urban areas (Seto, Fragkias, Güneralp, & Reilly, 2011). This
has altered the surface energy and moisture balances of these urban areas and led to
environmental issues such as the urban heat island (UHI) effect, human thermal
discomfort, air quality degradation, and microclimate modifications (Nazaroff, 2013; Oke,
1982; Santamouris, 2014, p.; Song & Wang, 2014; Zhao et al., 2015; Zhao & Wentz,
2016). To alleviate urban thermal stress, to promote urban ecosystem services, and to
improve human and environmental health, vegetation, more generally described as urban
“green infrastructure”, is becoming an integral feature of urban designs (Tzoulas et al.,
2007). Commonly used urban green infrastructure includes residential landscaping, green
corridors, green roofs and walls, and urban parks using a combination of trees, shrubbery
and turf grass (Akbari et al., 2001; Middel et al., 2015; Millward & Sabir, 2011; Z.-H.
Wang et al., 2016; J. Yang & Wang, 2015; J. Yang, Wang, Georgescu, Chen, & Tewari,
2016). The question that remains is how to best integrate urban green infrastructure with
the transportation, residential, commercial and industrial infrastructure to maximize the
ecosystem service offered by the green infrastructure.
The research presented here focuses specifically on how to effectively and efficiently
incorporate shade trees in residential neighborhoods in a hot desert city. In hot desert
areas, trees provide multiple microclimate benefits by reducing solar radiation

38
penetration, blocking the exchange of long-wave (infrared) radiation, and generating
evapotranspiration. Use of tree shade requires a balanced and nuanced analysis of the
tradeoffs between cooling by shade and the use of water, a scarce resource (Erell,
Pearlmutter, & Williamson, 2011; Z.-H. Wang et al., 2016). Since the tradeoffs between
water and energy require efficiency in the number of trees to be planted on a given parcel,
effective tree placement strategies are needed (e.g., tree location, orientation, and spacing)
(Wentz et al., 2016; Zhao et al., 2014; Zhao, Wentz, & Murray, 2017). These strategies
will help homeowners maximize the overall benefits from trees with the fewest number
of tree in an effort to simultaneously reduce both water consumption and energy use (E.
G. McPherson et al., 1989).
Studies on the effect of shade trees in urban areas has been examined through real
world in situ measurements and through numerical modeling, both confirming the
conventional wisdom that trees and other forms of shade reduce surface and air
temperature (Middel, Selover, Hagen, & Chhetri, 2016; Song & Wang, 2015). The
differences among the in situ studies are the methods used, whether they measured
surface or air temperature, and the impact of different types of shade such as native,
exotic, and artificial shade (Aguiar, 2012; Berry et al., 2013; Vanos, Middel, McKercher,
Kuras, & Ruddell, 2016). Results show reduced temperatures between 1° and 9° C
depending on these variables. The problem with the results is that in situ conditions
influence the results, such as the geometry and material characteristics of trees (tree type,
tree height, leaf area, etc.), building arrangements, and background meteorological
conditions. Numerical simulation modeling offers the ability to manipulate tree
placement, background materials, and analyze cooling from tree shade by simulating the

39
microclimate and resulting human thermal comfort (Krayenhoff, Christen, Martilli, &
Oke, 2014; Z.-H. Wang, 2014). Urban canopy models (UCMs) simulate tree foliage
together with buildings to represent the emission and reflection of radiation, and mutual
shading between buildings and trees, showing energy savings and heat mitigation from
shade trees. Computational fluid dynamics (CFD) modeling better represents the three-
dimensional thermal environment than the UCMs and has been used to analyze air
movement, pollution dispersal, and pedestrian wind tunnels (Erell et al., 2011; Fahmy &
Sharples, 2009; Stathopoulos, Chiovitti, & Dodaro, 1994). Like UCMs, CFD simulations
consistently show that increased vegetation provides cooling effects under a variety of
conditions (Middel et al., 2015; Robitu, Musy, Inard, & Groleau, 2006; Skelhorn, Lindley,
& Levermore, 2014; Taleghani, Sailor, Tenpierik, & van den Dobbelsteen, 2014). The
challenge with simulation modeling tree shade on buildings is that numerical simulations
are unable to resolve the heat transfer of the wall (i.e. the buoyancy effect).
In contrast to the in situ measurements and the numerical simulation modeling,
physical scale models combine the experimental control of numerical simulation with the
real complexities related to the natural environment (Roberts, 2010). There are
comprehensive physical scale models that have been developed to measure urban albedo,
aerodynamic drag, urban surface energy fluxes, thermal inertia, urban canopy
microclimate, pedestrian energy exchange, convective heat transfer, thermal amelioration
from water bodies, and evapotranspiration in urban canyons (Imam Syafii et al., 2017; M.
Kanda, 2005; M. Kanda et al., 2006; M. Kanda, Kanega, Kawai, Moriwaki, & Sugawara,
2007; Manabu Kanda & Moriizumi, 2009; Kawai & Kanda, 2010a, 2010b; Nottrott,
Onomura, Inagaki, Kanda, & Kleissl, 2011; Pearlmutter, Berliner, & Shaviv, 2005, 2006,

40
2007; Pearlmutter, Krüger, & Berliner, 2009). They offer the ability to control many of
the field parameters such as street layouts, existence of vegetation, solar radiation, wind
speed, and humidity, which provides enough flexibility for analyzing radiation, shading,
and wind tunnel conditions. With the exception of Roberts (2010) and Pearlmutter et al.
(2005, 2006, 2007, 2009), none represent the hot desert urban environment, and very few
incorporate vegetation (Lirola, Castañeda, Lauret, & Khayet, 2017; Y. Wang, Bakker, de
Groot, Wortche, & Leemans, 2015). This is because the morphology and materials of
vegetation are much more complex than urban structures (such as cubes, blocks, or
cylinders) in the physical scale modeling. Park et al. (2012) included vegetation (Gold
Crest Wilma plants) in the Comprehensive Outdoor Scale Model (COSMO) to evaluate
the thermal comfort of pedestrians, finding that trees along pedestrian walkways can
reduce the wind speed by up to 51% and decrease the temperature. Taleghani et al.
(2014b) also created a scale model site with vegetation to analyze roof configurations in
courtyards. Their scale model experimental results showed that a green pavement with
grass on a roof or courtyard could result in lower temperature comparing to gravels and
black materials.
Note that artificial trees were used in this outdoor scale model field measurement. As
a result, the biophysical functions of real trees, e.g. evapotranspiration by stomatal
control, root uptake, foliage dynamics, and diurnal/seasonal variabilities, are not
represented. However, these artificial trees can capture the most important cooling
mechanism of real trees via radiative shading (Upreti, Wang, & Yang, 2017). This is
particularly true for xeric trees in an arid or semi-arid environment such as Phoenix,

41
where evapotranspiration is largely inhibited by excessive heat as well as relatively
sparse foliage (Upreti et al., 2017).
The goal of this research is to build an outdoor urban physical scale model to measure
and understand the cooling effect of different tree densities, locations, and arrangements
in a typical residential area in a hot desert city. We conducted our experiment in Tempe,
Arizona, a municipality in the greater Phoenix Metropolitan Area in Arizona, USA. We
designed this study based upon Park et al. (2012) and Taleghani et al. (2014b) who
demonstrated how vegetation can be an asset in physical scale models. Existing research
has not yet explored the cooling benefits of trees under different locations and
arrangements in a physical scale model experiment. This is an obvious research gap in
the outdoor urban physical scale modeling literature that we intend to fill and will be a
crucial step in designing green infrastructure for the long-term sustainability of urban
areas.
3.2 Experimental Details
3.2.1 Experimental Site and Period
In the experimental site, we developed an outdoor physical scale model with
buildings and trees to represent a typical residential parcel with detached single-family
house and surrounding buildings in the City of Tempe, Arizona (33.4 N, 111.9 W).
Tempe is a municipality within the Phoenix metropolitan area in the Sonoran Desert of
the U.S. Southwest. The population of Tempe in 2010 was more than 160,000 residents,
with more than 40% population living in the single-family detached dwellings (US
Census Bureau, 2010). With reaching or exceeding 43 C summertime temperatures,
various heat mitigation strategies such as adding vegetation coverage, creating green/cool

42
roofs, and constructing cool pavement are essential for both reducing heat-related
diseases and energy consumption. To avoid the significant weather fluctuation in the
summer monsoon season at August, the microclimate field measurements were
conducted only at the selected steady hot and cloud free days in the period of August 12th
to August 31st at 2016. The experimental date weather conditions were shown in Table
3.1, which are retrieved from the nearby Phoenix Sky Harbor International Airport
weather station record (Daily Summaries Station Details: PHOENIX SKY HARBOR
INTERNATIONAL AIRPORT, AZ US, National Climatic Data Center (NCDC)).
Table 3.1 Weather Conditions in the 10 Experimental Dates
Date Maximum
temperature (°C)
Minimum
temperature (°C)
Precipitation
(cm)
08/12/16 40.6 27.8 0.00
08/13/16 42.2 28.9 0.00
08/14/16 41.1 30.0 0.00
08/15/16 43.3 30.0 0.00
08/16/16 43.9 30.6 0.00
08/17/16 42.8 28.9 0.25
08/18/16 40.0 27.8 0.03
08/20/16 37.8 26.7 0.00
08/30/16 41.6 28.9 0.00
08/31/16 41.1 27.8 0.00
The specific residential parcel we analyzed is a generic one in the Tempe residential
neighborhood with north-south building orientation. Within the neighborhood, most of
the single-family houses were built with concrete block construction during the 1950s to
1960s. The average parcel size is around 700 m2 with front/back yards, and the average
single story building size is 134 m2, according to the Maricopa County Assessor’s records.

43
Most of the households have nearby neighbors on the west/east side except those
buildings that are close to the major north-south direction roads. This unique compact
urban layout and building orientation make it difficult to plant any residential tree in the
west or east side of the buildings. Even though there is not a strict regulation for front
yard landscaping, most of the household owners plant shade trees to provide some level
of shade to their own home structures.
The outdoor physical scale model is located at the rooftop of the six-story
Engineering Research Center (ERC) building at Arizona State University Tempe campus,
which is approximately 10 km southeast of Phoenix Sky Harbor International Airport and
2 km east of residential parcel we analyzed. This experimental site has many logistical
advantages such as high level of security and its central location on ASU Tempe campus.
To be the highest structure in the area, the rooftop of the ERC building is free of
obstructions (e.g., other buildings, trees) that can potentially result in unwanted
microclimate influences such as horizontal shading, wind environment alternation or
anthropogenic cooling or heating. The ERC rooftop surface is comprised of a layer of
steel grating (6 cm × 3 cm gaps) on 2 m high support piers. The overall rooftop
dimensions are 85 m × 23 m and the building’s long axis is oriented in the south-north
direction. To avoid the excess wind influences the experimental results and ensure the
safety of the equipment and people, ERC rooftop has an approximately 1 m high
surrounding protected walls. The south portion of the ERC roof is largely free of
structures and is the optimal area to construct the scale model experiment.
The outdoor physical scale model (1:15.5) was constructed with an array of concrete
blocks to represent the residential buildings (See Figure 3.1). Since the rooftop surface is

44
a layer of steel grating, we used 260 concrete blocks to create a 20 blocks (386.0 cm) ×
13 blocks (250.9 cm) underlying concrete surface to represent the impervious surface of
the residential area. Each concrete block is a cube with equal length, width and height of
19.3 cm. The cubes are hollow concrete with a 2 cm-thick wall and are painted dark gray.
Further, because the cubes are relatively small in size, 18 of them were aggregated as a
single family building with 6 blocks (115.8 cm) as the building length and 3 blocks (57.9
cm) as the building width. The concrete block of rooftop is 38.6 cm long, 19.3 cm wide,
and 4.2 cm high with dark gray painted as well. The buildings in the scale model were
designed to be scaled at about 1:15.5 relative to a general 18 m length, 9 m width, and
3.65 m height flat roof residential house in Tempe residential neighborhood. To avoid the
boundary effect and to explore the tree shade effect on the surrounding buildings, we
created two 3 blocks × 2 blocks small buildings with rooftops to the west and east side of
the experimental building. Three sets of the building arrays were created with 4 blocks
(77.2 cm, 12 m in the real world) distance in the south-north direction to generate two
similar urban canyons to serve as the treatment group and control group separately.
Natural two-tone pine median profile artificial trees that made by polyvinyl chloride
(PVC) with 45.7 cm tall and 27.9 cm base diameter (at the widest point) were used in the
scale model site to represent 7.1 m thornless mature mesquite trees (Prosopis thornless
hybrid ‘AZT™’) in the residential neighborhood. There are several important reasons we
select an artificial tree in this scale model experiment. First, radiation exchange is often
the dominant factor to influence the microclimate conditions in the hot dry desert
environment (Shashua-Bar et al., 2011). In this scale model experiment, we want to
isolate the role of shading from trees to buildings rather than considering every aspect of

45
the vegetation to better understand the tree shade coverage benefits to the building facade.
Second, compared to real trees, we can easily find identical artificial trees with the same
albedo, emissivity, and physical structures at affordable price. This will guarantee the
similarity of shading area, shape, and density. Many errors or uncertainty may exist and
influence the experimental results by using the real trees such as the different soil
moisture level, leaf area humidity, plant evapotranspiration rate, plant albedo and
emissivity, and shadow shape, area, and density that were mentioned in Park et al.. Third,
although existing research have utilized both real and artificial grass in the scale model
experiment (Jang, Kim, & Jeon, 2015; Peterson & Schmidt, 1984; Taleghani, Tenpierik,
et al., 2014), none of the research attempts to use artificial trees in the outdoor scale
model experiment. This experiment will help understand the importance of shading and
retaining heat radiation from artificial trees in the hot dry desert environment.
In the scale model experiment, the scale model always has different thermal inertia
(volumetric heat capacity) as compared to those of real buildings. This is the common
problem of scale modeling and is difficult to compensate. A method to avoid this
problem is to create a larger urban mock neighborhood and to make it more similar
(thermally and dynamically) to the real world situation. Nevertheless, it will lose some
flexibility of physical scale modeling and increase modeling cost. Due to the space and
cost limitation, our experiment keeps the scale model in a relatively small size to
maintain more flexibility of the physical scale modeling. Further, we use the hollow
concrete cubes to represent the concrete block construction of single-family houses in the
study area to represent the thermal mass of the building structures.
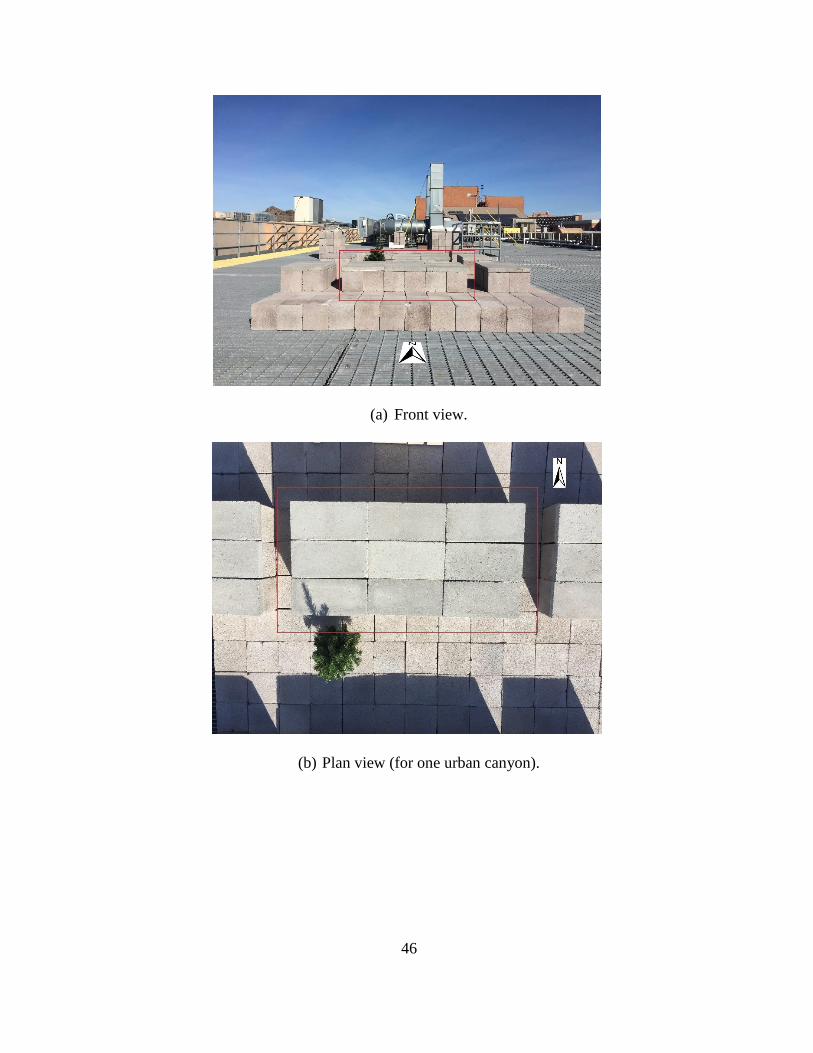
46
(a) Front view.
(b) Plan view (for one urban canyon).
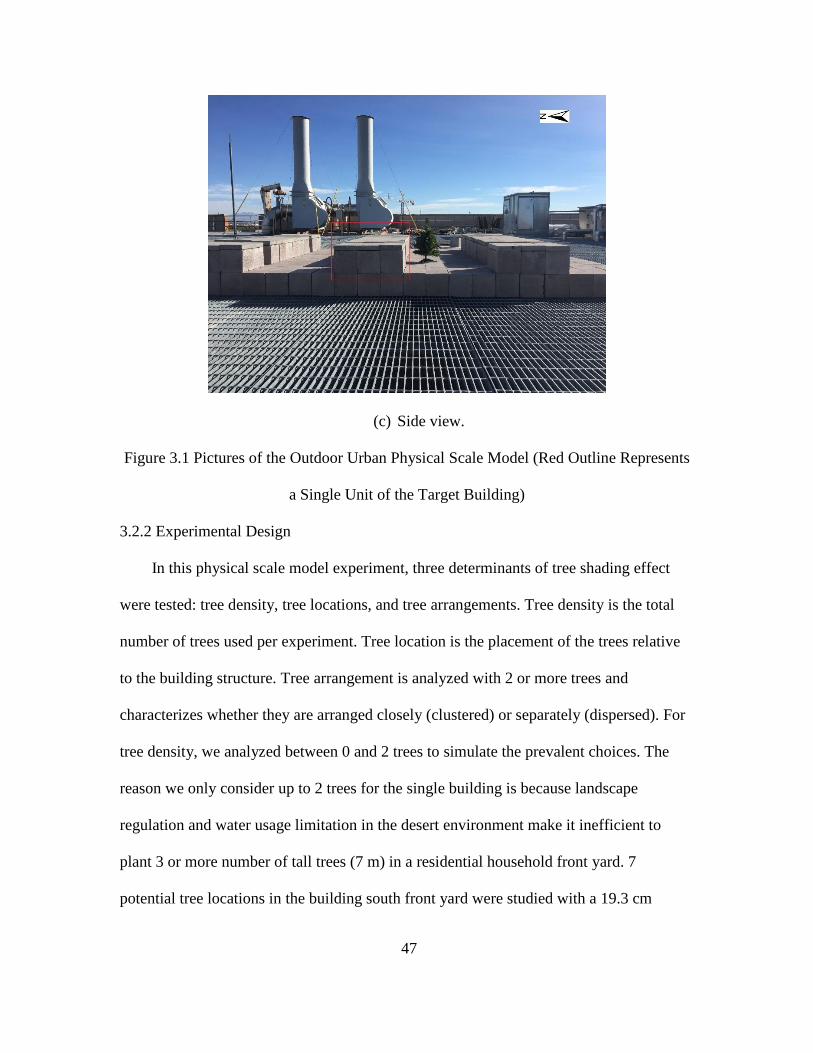
47
(c) Side view.
Figure 3.1 Pictures of the Outdoor Urban Physical Scale Model (Red Outline Represents
a Single Unit of the Target Building)
3.2.2 Experimental Design
In this physical scale model experiment, three determinants of tree shading effect
were tested: tree density, tree locations, and tree arrangements. Tree density is the total
number of trees used per experiment. Tree location is the placement of the trees relative
to the building structure. Tree arrangement is analyzed with 2 or more trees and
characterizes whether they are arranged closely (clustered) or separately (dispersed). For
tree density, we analyzed between 0 and 2 trees to simulate the prevalent choices. The
reason we only consider up to 2 trees for the single building is because landscape
regulation and water usage limitation in the desert environment make it inefficient to
plant 3 or more number of tall trees (7 m) in a residential household front yard. 7
potential tree locations in the building south front yard were studied with a 19.3 cm

48
distance from the structure (3 m in the real world) (Figure 3.2). To characterize different
tree density, location, and arrangement, we conducted 10 different experiments (details
summarized in Table 3.2). Group 1 is the empty control group without trees to represent
the natural solar radiation and reflection in the urban canyon. Group 2 contains one tree
with 7 different tree locations. Group 3 includes the cluster arrangement of two similar
trees with different locations. Group 4 represents the disperse arrangement of two trees.
Given the size of the artificial trees, we place two trees at location 3 and 5 rather than
location 3 and 4 to represent the cluster tree arrangement. Table 3.3 shows the key factors
in the different experimental groups. Since the weather conditions fluctuate frequently in
the summer monsoon season, it is difficult to conduct multiple observation for each
scenario. Thus, we tested each tree location/arrangement scenario in the similar weather
conditions (see Table 3.1) without multiple observations. Seven one-tree scenarios were
tested over a consecutive 7-days period from August 12th to August 18th, 2016, and three
two-tree scenarios were tested on separated days at August 20th, August 30th and August
31st.
Figure 3.2 Potential Tree Locations in the Outdoor Urban Physical Scale Model

49
Table 3.2 Summary of Tree Number, Location, and Arrangement in Different
Experimental Groups
Group no. Tree numbers Tree locations Tree arrangements
Group 1 0 N/A N/A
Group 2 1 (1), (2), (3), (4), (5), (6), (7) N/A
Group 3 2 (3,5), (4,6) Cluster
Group 4 2 (2,5) Disperse
Table 3.3 Key Factors in Different Experimental Groups
Treatment group Control group Key factors
Group 2 Group 1 Tree density and location (one tree vs. no tree)
Group 3 and 4 Group 1 Tree density (two trees vs. no tree)
Group 3 and 4 Group 2 Tree density (two trees vs. one tree)
Group 4 Group 3 Tree arrangement (cluster vs. disperse)
3.2.3 Measurement Equipment
To measure the microclimate conditions, 12 DS1921G iButton temperature loggers
were attached with strong adhesive to the scale model building facade to measure the
near-surface building facade temperature. Since the direct solar radiation influences the
temperature measurement recorded by the iButton temperature logger, we covered each
iButton logger with white printer paper. The iButton loggers were individually calibrated
in a NIST-traceable chamber by the manufacture, measuring temperatures at an accuracy
of 0.5 oC over a range of -40 oC to +85 oC.
Because the outdoor urban physical scale model represents a compact urban setting in
the real residential neighborhood, there is no adequate space for planting a tree in the
west and east side of building. Thus, the physical model represents a west-east orientated

50
street canyon, and the 12 iButton loggers were installed on the south facades of the target
and surrounding buildings (Figure 3.3). Loggers 1-8 were installed in the south urban
canyon, and loggers 9-12 were installed in the north urban canyon. In the south urban
canyon, loggers 2-7 measured the facade temperature of the target building, and logger 1
and 8 measured the facade temperature of the surrounding buildings. In the north urban
canyon, logger 9 served as the control group of logger 1, loggers 10 and 11 served as the
control group of loggers 2-7, and logger 12 served as the control group of logger 8. In our
experiment, all of the temperature loggers were set to collect the temperature data at 15-
minute intervals over a period of 24 hours.
Figure 3.3 The Digital Photo of IButton Logger Locations
To validate the iButton measurements and to collect information on the overall
thermal environment, we used a FLIR P620 thermal camera. The resolution of FLIR
P620 thermal camera is 640×480 with the temperature measurement accuracy at +/- 2 oC
or 2% of reading. It has a large temperature measurement range (-40 oC - 500 oC) and
high thermal sensitivity (<0.06 oC at 30 oC). FLIR thermal camera was applied to collect
the surface temperature in our experimental site, which was later compared with the

51
iButton temperature measurement. The experiments were conducted on clear sky days
with stable weather conditions. The solar radiation was relatively stable and can be
readily obtained from meteorological parameterization schemes. Wind speed was not
measured for several reasons. First, wind speed is relative low in this outdoor urban
physical scale model because of the scale model size and the 1 m protecting walls around
the rooftop (see Figure 3.1(a) and 3.1(c)). Second, wind is a secondary factor to influence
the building surface temperature comparing to the strong solar radiation in the desert
environment.
3.3 Experimental Results
3.3.1 Instrumentation Calibration and Quality Control
A preliminary experiment was conducted on a clear hot summer day from 10:30 to
17:30 at July 13th to validate the temperature measurement accuracy by comparing
temperature readings from thermal images and iButton temperature loggers. We
calibrated the thermal imagery by using FLIR Tools version 5.9 to adjust temperature
related parameters such as emissivity, reflected apparent temperature, distance,
atmospheric temperature, and relative humidity. Because the scale model is mainly
constructed by grey concrete blocks, we set the emissivity as 0.91 (Erell et al., 2011;
Taha, Sailor, & Akbari, 1992). Atmospheric temperature and relative humidity were
decided by the nearby weather station at Sky Harbor International Airport (NOAA, n.d.).
We took two thermal images every 30 minutes from the west side (2 m distance) and east
side (1.5 m distance) of the scale model. Because there was not an obvious heat source on
the rooftop, we set the reflected apparent temperature the same as the atmospheric
temperature.

52
To validate the accuracy of measuring block surface temperature by iButton loggers,
we chose two iButton loggers in the middle of two urban canyons to do the comparison
between thermal images and iButton loggers (see Figure 3.4(a)). We extracted 15
temperature readings from 10:30 to 17:30 at each iButton logger, and identified surface
temperatures in 60 thermal images (30 images for each canyon, 15 images taken from
west and 15 images taken from east) where were next to the iButton loggers (see Figure
3.4(b)). As shown in Table 3.4, the root mean squared error (RMSE) between iButtons
and thermal images was 1.7 oC in the north urban canyon with tree shade, and was 2.0 oC
in the south urban canyon without tree shade. The mean absolute error (MAE) was 1.5 oC
in the north urban canyon and 1.9 oC in the south urban canyon. An existence of tree
induces a 0.3 oC difference of RMSE and a 0.4 oC difference of MAE. iButton
temperature was consistently lower than the concrete block surface temperature derived
by thermal images (see Figure 3.5).
Since the iButton was wrapped by white printer paper and the white paper had higher
reflective rate comparing to the concrete block surface, less direct solar radiation was
received by the iButton loggers. On the other hand, the concrete blocks have higher heat
capacity, and can easily heat up under direct solar radiation. Thus, it is not surprising that
the temperature of the iButton loggers are consistently lower than the real concrete block
surface temperature. The method used in measuring the skin temperatures is a
compromise due to the practical difficulty and complexity in measuring surface
temperatures using direct contact sensors such as flat surface thermistors or
thermocouples.

53
Although iButtons cannot accurately measure the concrete surface temperature and
cause cooler measurement bias, this research focuses on comparing the temperature
differences with/without trees in the mock canyon. After calculating the temperature
differences, the consistent measurement bias will be eliminated and the measurement
errors by trees will be around 0.3 oC between two canyons according to the RMSE.
Considering the accuracy of iButton (0.5 oC) and FLIR thermal camera (+/- 2 oC or 2% of
reading), the preliminary experimental results showed that iButton can be used to
measure and compare the building facade surface temperature in this scale model
experiment.
(a) Digital photo (red outline indicates iButtons that were used in the validation).

54
(b) Thermal imagery (we extracted the surface temperatures from red circles for
validation).
Figure 3.4 Thermal Image and Digital Photo from FLIR P620 Thermal Camera (Taken at
13:59, July 13th)
Table 3.4 Temperature Measurement Errors Between the Thermal Images and IButton
Loggers
RMSE (oC) MAE (oC)
North urban canyon (with tree) 1.7 1.5
South urban canyon (without tree) 2.0 1.9

55
(a) South urban canyon (without tree).
(b) North urban canyon (with tree).
Figure 3.5 Temperature Comparison between IButtons and Thermal Images of Proximal
Exposed Concrete Block Surfaces.
3.3.2 Tree Shade Cooling Benefits to the Target Building
For the one-tree scenarios, we moved the single artificial tree from the west side of
the front yard to the east side of the front yard during the experimental period to explore
40
42
44
46
48
50
52
54
56
58
60
9:36 10:48 12:00 13:12 14:24 15:36 16:48 18:00
Tem
per
atu
re (
°C)
Time
iButton temperature Thermal image temperature
40
42
44
46
48
50
52
54
56
58
9:36 10:48 12:00 13:12 14:24 15:36 16:48 18:00
Tem
per
atu
re (
°C)
Time
iButton temperature Thermal image temperature

56
the cooling benefits of tree shade to the buildings. Because our primary interest is
focused on the cooling benefits from tree shade during the heat hours, we narrowed the
time interval to 8:00 to 17:00 and extracted the temperature records in the iButton logger
to obtain the heat hour temperature variation.
To understand how tree shade influences the building facade temperature, we
calculate the temperature difference (∆𝑇s) between the south urban canyon (𝑇exp,
experimental group) and the north urban canyon (𝑇ctl, control group) through equation
(3.1):
∆𝑇s = 𝑇exp − 𝑇ctl (3.1)
In the north urban canyon, the average temperature of loggers in the target building
(logger 10 and 11) serves as the control group to compare with temperature in the south
urban canyon (loggers 2 through 7). We assume the overall building facade temperature
is homogeneous in the north urban canyon. Since the size of the experimental site is
relative small, the angle of incident for both of the canyons are similar and we do not
consider this factor in this research.
Figure 3.6 shows the tree shade cooling effect on the target building in one-tree
scenarios. Because of the sun movement during the diurnal cycle, the coverage of tree
shade moves from the west side of the south facade to the east side of the south facade.
Among all one-tree scenarios, we choose the scenario that the single tree locates at the
central part of the front yard (location 3 in Figure 3.2) to represent how tree shade
coverage movement influences the building facade temperature. In this scenario, morning
shading in the west side of facade cooled down the temperature at the outer-west of
facade (logger 2) at the maximum value of 1 °C from 8:30 to 12:00, and reduced the

57
facade temperature at the maximum value of 1.75 °C at middle-west and central-west of
the facade (logger 3 and 4) from 8:30 to 13:30. In the afternoon, tree shade covered the
east side of the building facade and an opposite temperature trend can be distinguished at
central-east of facade (logger 5) with a temperature decrease of 1.75 °C from 14:15 to
16:45.
Figure 3.6 Cooling Effect of Tree Shade on the Target Building Facade Temperature
(One-tree, at the Central Part of Front Yard)
Figure 3.7 shows the cooling benefits from tree shade under different tree
arrangements in two-tree scenarios. In the experimental groups, two cluster tree
arrangements (location 3 and 5 or location 4 and 6) and one disperse tree arrangement
(location 2 and 5) were tested. We compare the tree shade benefits by one cluster tree
arrangement (location 3 and 5) and one disperse tree arrangement (location 2 and 5). In
the cluster tree arrangement, the west side of facade was heavily shaded from 9:30 to
12:30. The largest cooling benefit was 3.5 °C at 10:30 in the central-west facade (logger
4). The shading benefits in the afternoon was not as significant as the shading in the
morning, but it still showed an opposite temperature trend at the east side of building
-2.0
-1.0
0.0
1.0
2.0
3.0
4.0
𝑇ex
p-𝑇
ctl(°
C)
Outer-west facade (Logger 2) Middle-west facade (Logger 3)
Central-west facade (Logger 4) Central-east facade (Logger 5)
Middle-east facade (Logger 6) Outer-east facade (Logger 7)

58
south facade (logger 5, 6 and 7) comparing all other loggers. With a disperse tree
arrangement, steady cooling benefits were shown for both west and east side of the
building south facade during the daytime (logger 3 and 6). The maximum morning
cooling benefit was 2.75 °C in the outer-west of facade (logger 2) at 11:30. In the
afternoon, 2.5 °C cooling benefit was shown in middle-east of facade (logger 6) at 13:45.
(a) Cluster tree arrangement.
(b) Disperse tree arrangement.
Figure 3.7 Cooling Effect of Tree Shade on the Target Building Facade Temperature
(Two-trees)
-4.0
-2.0
0.0
2.0
4.0
6.0
8:0
0
8:3
0
9:0
0
9:3
0
10
:00
10
:30
11
:00
11
:30
12
:00
12
:30
13
:00
13
:30
14
:00
14
:30
15
:00
15
:30
16
:00
16
:30
17
:00
𝑇ex
p-𝑇
ctl(°
C)
Outer-west facade (Logger 2) Middle-west facade (Logger 3)
Central-west facade (Logger 4) Central-east facade (Logger 5)
Middle-east facade (Logger 6) Outer-east facade (Logger 7)
-3.0
-2.0
-1.0
0.0
1.0
2.0
3.0
8:0
0
8:3
0
9:0
0
9:3
0
10
:00
10
:30
11
:00
11
:30
12
:00
12
:30
13
:00
13
:30
14
:00
14
:30
15
:00
15
:30
16
:00
16
:30
17
:00
𝑇ex
p-𝑇
ctl(°
C)
Outer-west facade (Logger 2) Middle-west facade (Logger 3)
Central-west facade (Logger 4) Central-east facade (Logger 5)
Middle-east facade (Logger 6) Outer-east facade (Logger 7)

59
To compare the tree shade cooling benefits at different tree locations and
arrangements, we calculate the sum of the temperature differences between two urban
canyons (∆𝑇s) for each iButton logger to represent the total cooling benefits from 8:00 to
17:00. The average value of the total cooling benefits for each experimental group is
calculated to represent the mean cooling benefits for the entire facade (see Table 3.5). In
one-tree scenarios, the average temperature differences at 7 different locations range from
6.8 °C to 36.1 °C. The best tree location prefers east part of the front yard (location 5 and
6). Few cooling benefits were found at the edge of front yard (location 1 and 7) because
half of the shading was projected to the nearby buildings. Large temperature differences
at east side of the facade were observed when locating the single tree at the west side of
the building (location 1 and 2). This phenomenon shows the importance of afternoon
shading to the building facade. In two-tree scenarios, the average temperature differences
with 3 different tree arrangements range from -35.8 °C to 1.3 °C. The best tree
arrangement prefers cluster arrangement at the east side of the front yard (location 4 and
6). When planting trees in a cluster arrangement, the results show that planting trees in
the east side of the front yard generates more cooling benefits than locating trees in the
central area (location 4 and 6 is better than location 3 and 5). Further, a disperse tree
arrangement (location 2 and 5) has a better cooling effect than the cluster tree
arrangement in the central part of the front yard (location 3 and 5), but the effect is worse
than clustering trees at the east side of the front yard (location 4 and 6). The enormous
cooling benefit when clustering trees at the east side of front yard (location 4 and 6) is
unforeseeable, but it is consistent with the cooling benefits we find when locating a single
tree at location 6.

60
Table 3.5 Cooling Benefits Comparison for Each Experimental Group (Referring to
Figure 3.2 and 3.3 for IButton Locations and Tree Locations)
Facade West to East
LG2 LG3 LG4 LG5 LG6 LG7 Mean
One tree scenarios
West L1 19.0 20.0 20.8 39.5 47.0 52.5 33.1
L2 30.8 6.8 17.0 47.3 55.8 58.8 36.1
L3 24.3 -5.3 -1.0 20.8 40.8 33.8 18.9
to L4 44.5 15.5 -4.3 -5.0 33.0 39.5 20.5
L5 39.8 17.8 0.8 4.8 10.8 22.3 16.1
L6 19.3 19.3 8.5 12.3 3.8 -22.3 6.8
East L7 38.8 25.8 19.5 31.8 33.8 -19.3 21.7
Two trees scenarios
Cluster L3&L5 33.3 -18.8 -26.3 -17.3 6.3 30.3 1.3
Cluster L4&L6 -18.5 -32.0 -47.5 -40.9 -64.0 -12.0 -35.8
Disperse L2&L5 -23.5 -42.0 -15.0 14.2 -40.5 32.0 -12.5
Note: L1 represents location 1, LG2 represents logger 2 in the text, and the temperature
unit is °C.
3.3.3 Tree Shade Cooling Benefits to the Surrounding Buildings
Besides the target building, it is also important to explore the cooling effect from
tree shade on the surrounding buildings. When placing the single tree near the boundary
of the building front yard, part of the tree shade was projected to the surrounding
buildings. In this experiment, tree shade cooling benefits were compared by iButtons on
the west/east surrounding building (logger 1 and 8) and on the outer-west or outer-east
facade (logger 2 and logger 7) in the target building. Figure 3.8 shows the tree shade
cooling benefits on the target building and the surrounding building. It is clear from

61
Figure 3.8 that the cooling benefits are more significant when locating the single tree at
the edge of the front yard (locations 1 and 7). The cooling benefits of tree shade on the
west surrounding building happens from 8:00 to 13:30 at the maximum value of 2 °C
when locating single tree at the west edge of front yard (location 1). Not surprisingly, the
cooling period and intensity all decreased when moving this single tree towards the east
side of the building (cooling from 8:00 to 10:45 at the maximum value of 1.5 °C).
Similarly, the cooling benefits to the east surrounding building happens from 13:15 to
17:00 at the maximum value of 2.5 °C when locating the single tree at the east edge of
the front yard (location 7). The cooling intensity and period drops down when moving
this tree west (cooling from 15:45 to 17:00 at the maximum value of 1.5 °C). When
placing trees at the boundary of the building parcel (location 1 or 7), longer and stronger
cooling benefits are detected.
(a) Shading to the west nearby building.
-3.0
-2.0
-1.0
0.0
1.0
2.0
3.0
4.0
8:0
0
8:4
5
9:3
0
10
:15
11
:00
11
:45
12
:30
13
:15
14
:00
14
:45
15
:30
16
:15
17
:00
𝑇ex
p-𝑇
ctl(°
C)
Target building - Outer-west location (Location 1)
West nearby building -Outer-west location(Location 1)
Target building - Middle-west location (Location 2)
West nearby building -Middle-west location(Location 2)
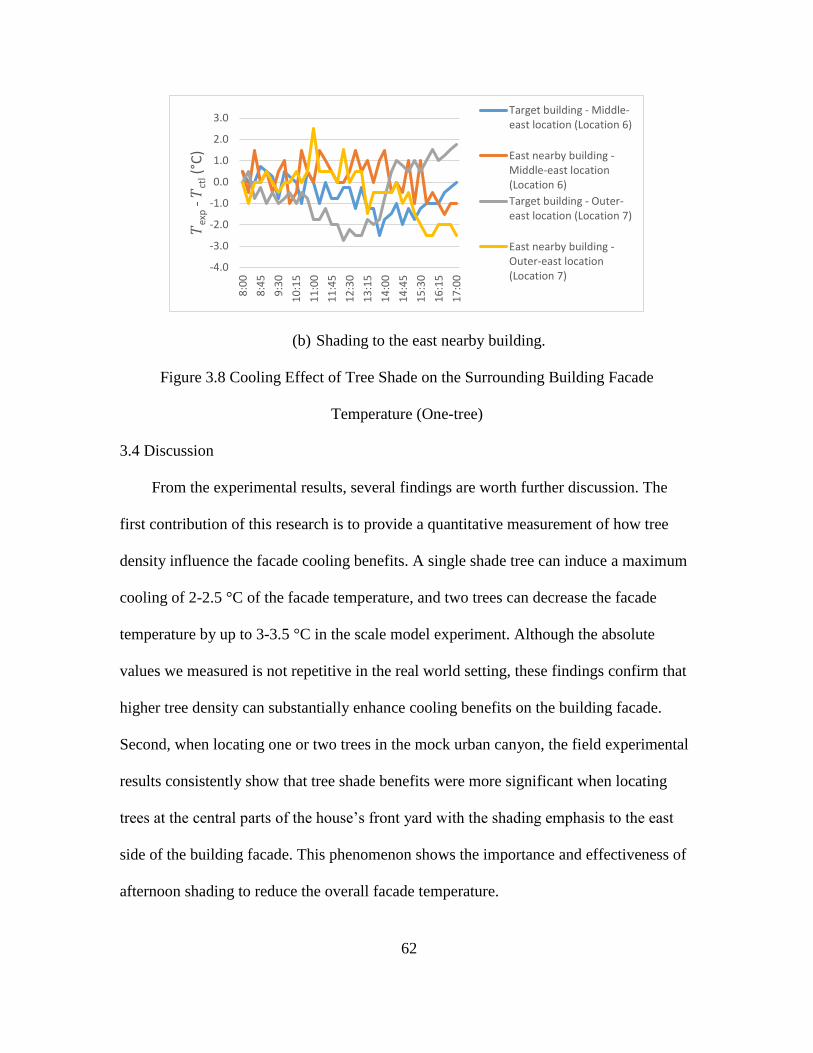
62
(b) Shading to the east nearby building.
Figure 3.8 Cooling Effect of Tree Shade on the Surrounding Building Facade
Temperature (One-tree)
3.4 Discussion
From the experimental results, several findings are worth further discussion. The
first contribution of this research is to provide a quantitative measurement of how tree
density influence the facade cooling benefits. A single shade tree can induce a maximum
cooling of 2-2.5 °C of the facade temperature, and two trees can decrease the facade
temperature by up to 3-3.5 °C in the scale model experiment. Although the absolute
values we measured is not repetitive in the real world setting, these findings confirm that
higher tree density can substantially enhance cooling benefits on the building facade.
Second, when locating one or two trees in the mock urban canyon, the field experimental
results consistently show that tree shade benefits were more significant when locating
trees at the central parts of the house’s front yard with the shading emphasis to the east
side of the building facade. This phenomenon shows the importance and effectiveness of
afternoon shading to reduce the overall facade temperature.
-4.0
-3.0
-2.0
-1.0
0.0
1.0
2.0
3.0
8:0
0
8:4
5
9:3
0
10
:15
11
:00
11
:45
12
:30
13
:15
14
:00
14
:45
15
:30
16
:15
17
:00
𝑇ex
p-𝑇
ctl(°
C)
Target building - Middle-east location (Location 6)
East nearby building -Middle-east location(Location 6)
Target building - Outer-east location (Location 7)
East nearby building -Outer-east location(Location 7)

63
By comparing the cooling benefits from the cluster and disperse arrangement, the
results show that a disperse arrangement is not necessarily worse than the cluster
arrangement. A cluster arrangement with better afternoon shading provides the most
cooling benefits in this particular urban layout, but the disperse arrangement also offers
good level of cooling benefits to the whole building facade. All the results confirm the
importance of the locational benefits from tree shade coverage in relation to the
residential buildings. In this compact urban setting, nearby surrounding buildings also
receive significant tree shade cooling benefits (around 2 °C) especially when planting
trees at the edge of the residential parcels.
From Figures 3.6, 3.7 and 3.8, it is noteworthy that the facade temperature
remarkably increased in the late afternoon (increasing temperature trend for all the
loggers except those loggers under shading), which can be more than 3 oC from 15:00 to
17:00. The potential explanation is that artificial tree serves as a heat source in the late
afternoon and radiates heat to the nearby building facade. Although artificial tree
provides various benefits and convenience in the experiment (see section 2.1), this is an
unavoidable issue due to the small heat capacity and lack of evapotranspiration in
artificial trees. This phenomenon diminishes and underestimates the cooling benefits
from tree shade in the scale model experiment. However, this is further validated the
importance of tree shade coverage for the building facade. Artificial turf increases the
surface temperature and raises health issues on the sports playground (Jim, 2016, 2017;
Serensits, McNitt, & Petrunak, 2011; Villacañas, Sánchez-Sánchez, García-Unanue,
López, & Gallardo, 2017), but the shading from artificial tree is still found to be valuable
and reduces the facade temperature significantly. The finding here emphasizes the

64
contribution of shading to the facade surface temperature and corresponds with the
finding in the existing literature that natural shading and artificial shading provide similar
thermal sensation in the hot dry desert climates (Middel et al., 2016; Vanos et al., 2016).
Several limitations exist in this scale model experiment. First, we use iButton
loggers to measure the near surface air temperature and approximately represent the
building surface temperature with the validation of thermal images. Even though iButton
loggers are easy to install and be used to measure surface temperature in some existing
research (Brabyn et al., 2014; Schmid, Gubler, Fiddes, & Gruber, 2012; Sohrabinia, Rack,
& Zawar-Reza, 2012; Sternberg, Viles, & Cathersides, 2011), flat surface thermistors or
thermocouples may provide better surface temperature measurements with more
experimental efforts. Second, this research does not account for the building’s open
structures such as windows, doors, and ventilation. Adding these important building
components into the physical scale mode is expected to improve the accuracy of the
quantitative study.
This is the first attempt to assess the cooling benefits of tree locations and
arrangements in a residential neighborhood by an outdoor urban physical scale model.
There is, however, more can be done to extend this work. For example, different tree
species, alternative leaf area index/canopy density, crown size, and tree heights are all
important options for flora. All of these factors can be added and evaluated in the
physical scale model. The comparison between artificial tree and real tree will be also
important to understand how evapotranspiration and retention heat issue influence surface
temperature in the built environment. In addition, the specific compact urban
arrangement we simulate limits the orientation of buildings and location of trees in the

65
experiment. Different building arrangements and orientations can be adopted to this
outdoor urban physical scale model in future studies. Furthermore, trees cool down the
building structures in the daytime, but they also trap the long wave radiation during the
night. This outdoor urban physical scale model can be used to explore the overall
advantages and disadvantages of trees for mitigating UHI effects in both daytime and
nighttime.
The research finding from this scale mode experiment can translate into important
policy recommendation or design implication to the residential neighborhood in the
desert city. City residents or single-family homeowners should plant their first tree to
shade the east side of the south facade, and allow enough space between multiple trees to
maximize the overall shading benefits. Also, trees locate at the edge of residential parcel
will not be invaluable. They will provide ample shading to multiple houses and improve
the overall living environment in the neighborhood. We anticipate this research can raise
the attention from city mayors, policy makers, and homeowner association to emphasize
the use of urban green infrastructure to improve the overall built environment under hot
dry desert climates.
3.5 Conclusions
Urban green infrastructure provides the potential to mitigate urban heat and improve
human thermal comfort in the urban residential environment. In a desert city, the
scarceness of water limits the number of trees to be planted in a residential
neighbourhood. Hence, it is important to understand the locational benefits of trees and
maximize the cooling benefits from tree shade to the building structures. This paper
utilizes an outdoor urban physical scale model with field measurements to measure the
66
cooling effect of trees with different combinations of tree densities, locations, and
arrangements in a mock compact residential neighbourhood in Tempe AZ. The research
findings quantify the tree shade cooling benefits, and indicate the effectiveness of
locating shade trees in the middle of the building’s south front yard with the emphasis on
the east side of the facade to generate afternoon shading. A single full size tree can
significantly cool the facade by up to 2.5 °C in the afternoon, and multiple trees improve
the cooling benefits particularly with a cluster of trees with no tree canopy overlap. There
is also a cooling effect on the surrounding buildings from planting trees in the boundary
of the residential parcel. This research is one of the pioneering attempts to incorporate
vegetation in physical scale models. The research results will help the design of urban
green infrastructure for the long-term sustainability of urban environments.
67
CHAPTER 4
IMPACT OF TREE LOCATIONS AND ARRANGEMENTS ON OUTDOOR
MICROCLIMATES AND HUMAN THERMAL COMFORT IN AN URBAN
RESIDENTIAL ENVIRONMENT
4.1 Introduction
The urban heat island (UHI) effect is a well-known phenomenon caused by the
change of energy balance and thermal properties of the built environment (Oke, 1982).
The UHI effects increase air and surface temperature, result in higher energy demand for
cooling, degrade air quality, decrease in human thermal comfort, and increase to heat-
related morbidity and mortality (Bi et al., 2011; Nazaroff, 2013; Song & Wang, 2015;
Wentz et al., 2016; Zhao et al., 2015). Vegetation is the most common method to
alleviate the negative impacts of the UHI (Declet-Barreto, Brazel, Martin, Chow, &
Harlan, 2013; Y. J. Huang et al., 1987; Z.-H. Wang et al., 2016; Zhao et al., 2014). While
turf lawns and shrubbery provide surface cooling, trees provide more benefits by
blocking short-wave radiation penetration to the surface, reducing long-wave radiation
exchange, and generating evapotranspiration with less water consumption comparing to
turfgrass (Erell et al., 2011). Without effective and adequate vegetation coverage in the
residential neighborhood, urban residents will experience significant human thermal
discomfort and result in heat-related illnesses and deaths in the outdoor environment,
especially to the elderly and children (Chow, Chuang, & Gober, 2012; Vanos et al.,
2016). A desert city such as Phoenix, is more complex because water limits the number
of trees to be planted for each residential household (Zhao et al., 2017). Thus, the goal of

68
this research is to quantify the appropriate arrangement of trees in the residential
neighborhood to reduce the UHI and improve human comfort.
Existing research to explore how the locations and arrangements of trees influence the
built environment uses methods including remote sensing and numerical simulation.
Remote sensing research show that vegetation coverage significantly reduces the urban
surface temperature at the city and regional scales (Soe W. Myint, Wentz, Brazel, &
Quattrochi, 2013), however, the specific locational effects of trees have not been
explored widely because of the reduced availability of high resolution thermal satellite
images (Zhao & Wentz, 2016). Recently, using the high resolution thermal remotely
sensed images (60 m/pixel), Myint et al. (2015) and Fan et al. (2015) show that a
clustered arrangement of trees improves cooling effects. However, two limitations exist
by using remote sensing techniques to understand the locational benefits of trees. First,
they can only derive the top canopy surface temperature by using thermal remote sensing
techniques, the temperature comparison between canopy surface temperature and air
temperature under the tree canopy is rarely done by field measurement. Second, air
temperature, wind speed, mean radiant temperature (MRT), and relative humidity need to
be incorporated into the calculation of human thermal comfort under different locations
and tree arrangements. Knowing the thermal perception and grade of physiological stress
of an urban neighborhood is more meaningful for urban residents than just recognizing
extreme heat areas from the urban surface temperature. Thus, we still do not understand
how tree locations and arrangements influence the built environment by the existing
remote sensing research. As an alternative to remotely sensed data and methods,
numerical simulation methods such as the 3D computational fluid dynamics (CFD)

69
modeling, has the capabilities to simulate the urban environment of airflow, pollution
dispersal, pedestrian wind tunnel and vegetation effects (Erell et al., 2011). Numerical
simulation overcomes the limitations of remote sensing because it gives the availability to
simulate outdoor microclimate conditions (air temperature, surface temperature,
humidity, etc.) and human thermal comfort. Most importantly, numerical models make it
possible to create and test a wide variety of tree locations and arrangements scenarios that
are not practical to test in situ.
Numerical models consistently show that increased vegetation or tree coverage
provide a cooling effect and improve the human thermal comfort, but what varies is the
amount of vegetation and the level of cooling. Those variations occur due to the climatic
environment at different geographic locations, the volume or the type of vegetation, and
building layout or wind tunnel design (Hsieh, Jan, & Zhang, 2016; A.-S. Yang, Juan,
Wen, & Chang, 2017). Although trees were widely confirmed to be effective in
mitigating heat and improving human thermal perception in the dense urban streets
(Kong et al., 2017; Morakinyo, Kong, Lau, Yuan, & Ng, 2017; Tan et al., 2015; Tan,
Lau, & Ng, 2017), seldom of research explores how residential tree locations, spacing,
and arrangements will influence the outdoor microclimates and human thermal comfort.
Most of the existing literature simulates the outdoor microclimates and human thermal
comfort by randomly locating trees to a certain percent of the coverage or is simply based
on the real-world landscaping design (L. Chen & Ng, 2013; Hsieh et al., 2016; Jan,
Hsieh, Ishikawa, & Sun, 2013; Middel et al., 2015). The obvious next step is to account
for factors such as tree densities, locations, and arrangements in the numerical models to
evaluate the cooling effects from trees and human thermal comfort. Further, none of the

70
research explores how to effectively design tree locations and arrangements to benefit
both the individual houses and residential neighborhood concurrently. Residents may
want to maximize the shade coverage of their south-facing facade by planting trees in the
central of south front yard, but it is still unknown that if planting a tree between two
residential houses can provide more comprehensive benefits to both the buildings and the
neighborhood.
The goal of this research is to explore how tree locations and arrangements influence
the outdoor microclimates and human thermal comfort by numerical simulation, and how
strategically to design tree locations and arrangements to benefit both the individual
houses and residential neighborhood simultaneously. The model reliability is first
validated by the mobile vehicle field measurements. Further, we designed and compared
different tree arrangements (cluster, disperse, or equal interval) in both the building and
neighborhood scales. This research will improve the theoretical and empirical
understanding of the influences of tree locations and arrangements to the outdoor
microclimates and human thermal comfort in the desert residential neighborhood.
4.2 Study Area and Climatic Conditions
Figure 4.1 Study Area

71
The study area is in the City of Tempe, AZ USA within a residential neighborhood
(Figure 4.1). The majority of this residential neighborhood consists of single-family
houses built between 1950 and 1960. Most structures are single story buildings around
134 m2 according to Maricopa County Assessor’s records
(https://mcassessor.maricopa.gov/). The average parcel size is around 700 m2 moderate
size front and back yards and narrow side yards. Nearly all the parcels have neighboring
houses on the west/east side of the building except those buildings that are close to the
major roads. This unique compact urban layout forces the residents to plant large shade
trees in their front yard (south) or back yard (north). Some residents plant grassland on
their front/back yards as well. Although homeowner association landscaping regulations
do not exist in this neighborhood, most of the residents plant trees and other vegetation in
the front yards.
The City of Tempe has a semi-arid climate that situated in the Sonora desert. The
mean annual rainfall is 237 mm and most of the rain occurs during monsoon season in
July and August (62 mm) as well as in the winter December through March (112 mm).
June is the driest month with less than 1 mm mean annual precipitation. Mean maximum
air temperature ranges from 39.3 C to 40.4 C during the summer months (June to
August), and ranges from 20.1 C to 22.6 C during the winter months (December to
February). Average minimum air temperature peaks at 24.0 C in July and can reach as
low as 3 C in December (“WRCC,” 2015). Under this specific dry and hot summer
climatic conditions, it is important to understand how to ameliorate urban heat and human
thermal discomfort by effectively locating and arranging trees.

72
4.3 Methodology
The research methodology framework is presented in Figure 4.2. In this study,
simulation results from the base model that represents current residential neighborhood
conditions were first validated by fieldwork measurements. Further, outdoor
microclimate conditions and human thermal comfort were simulated and compared under
different tree densities, locations and arrangements. The final model results provide
planning recommendations and understandings to better design sustainable urban
residential environment.
In the base model simulation, we included lawns to accurately represent and simulate
the outdoor thermal environment. However, when we created new simulated scenarios,
we did not change or remove existing lawns. This is because we want to maintain as
similar as possible between the validated scenario and the simulated scenarios to ensure
the model accuracy and avoid extra variables other than tree locations and arrangements
to influence the simulated results.
Figure 4.2 Methodology Framework
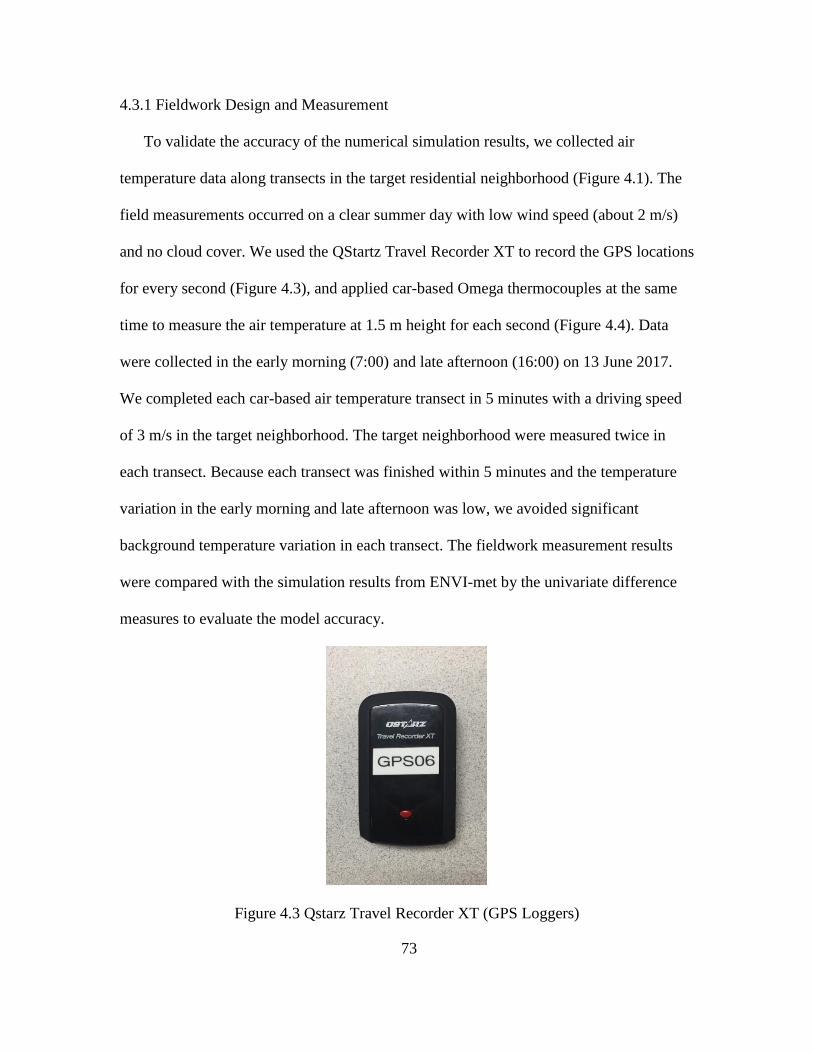
73
4.3.1 Fieldwork Design and Measurement
To validate the accuracy of the numerical simulation results, we collected air
temperature data along transects in the target residential neighborhood (Figure 4.1). The
field measurements occurred on a clear summer day with low wind speed (about 2 m/s)
and no cloud cover. We used the QStartz Travel Recorder XT to record the GPS locations
for every second (Figure 4.3), and applied car-based Omega thermocouples at the same
time to measure the air temperature at 1.5 m height for each second (Figure 4.4). Data
were collected in the early morning (7:00) and late afternoon (16:00) on 13 June 2017.
We completed each car-based air temperature transect in 5 minutes with a driving speed
of 3 m/s in the target neighborhood. The target neighborhood were measured twice in
each transect. Because each transect was finished within 5 minutes and the temperature
variation in the early morning and late afternoon was low, we avoided significant
background temperature variation in each transect. The fieldwork measurement results
were compared with the simulation results from ENVI-met by the univariate difference
measures to evaluate the model accuracy.
Figure 4.3 Qstarz Travel Recorder XT (GPS Loggers)

74
Figure 4.4 Car-Based Air Temperature Thermocouples
4.3.2 Microclimate Numerical Simulation
The base model was first tested in the ENVI-met simulation platform to verify the
modeling that represents the current buildings, vegetation, and soil/surface conditions.
ENVI-met is a three-dimensional atmospheric model designed to simulate the urban
surface-plant-air interactions, and has been utilized for simulating air flows between and
around buildings, vegetation impacts of the local microclimates, heat exchange processes
at the building walls or ground surface, and bioclimatology and pollutant dispersion
(Bruse & Fleer, 1998, p.). The ENVI-met area input and configuration parameters for
validation simulation are shown in Table 4.1. The ENVI-met area input file for the
neighborhood has a vertical and horizontal grid resolution of 1 m and a total of 200 ×
200 × 20 grid cells plus 7 nesting grids in the surrounding (see Figure 4.5). Besides the 7
nesting grids, we created a 10 m empty buffer area around the simulated area to ensure
the model stability. The meteorological conditions were obtained from the nearby
weather station at Phoenix Sky Harbor International Airport on 13 June 2017. Since the
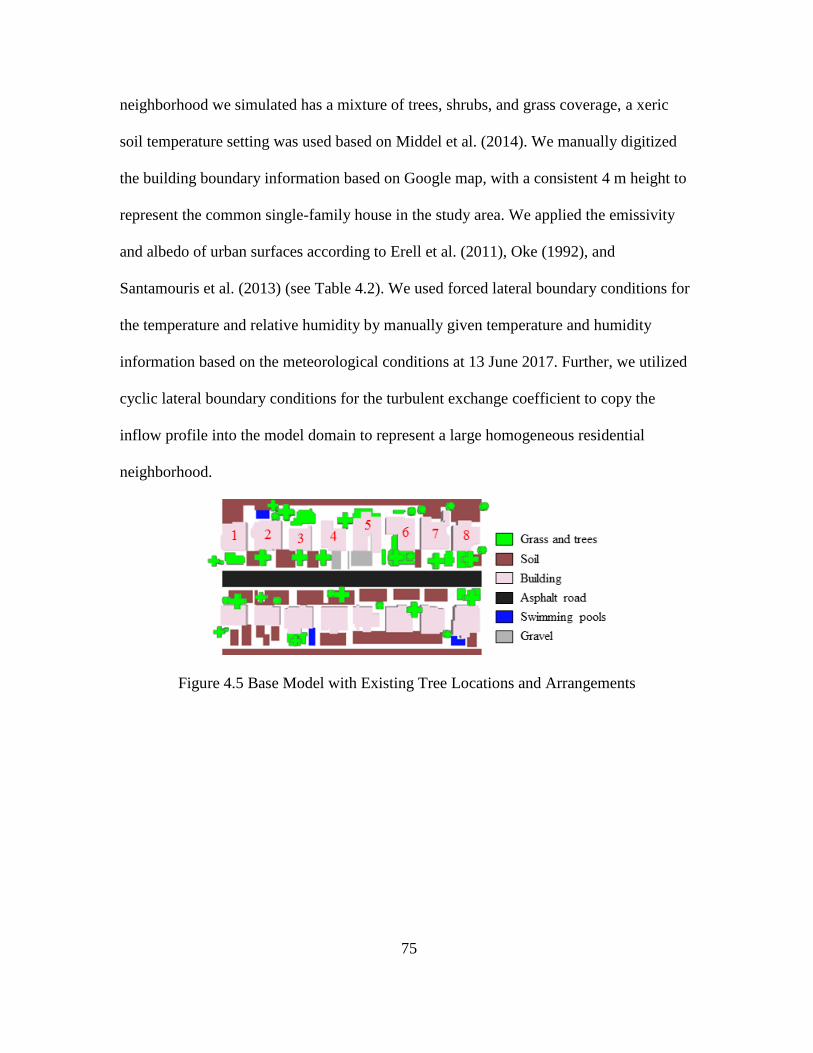
75
neighborhood we simulated has a mixture of trees, shrubs, and grass coverage, a xeric
soil temperature setting was used based on Middel et al. (2014). We manually digitized
the building boundary information based on Google map, with a consistent 4 m height to
represent the common single-family house in the study area. We applied the emissivity
and albedo of urban surfaces according to Erell et al. (2011), Oke (1992), and
Santamouris et al. (2013) (see Table 4.2). We used forced lateral boundary conditions for
the temperature and relative humidity by manually given temperature and humidity
information based on the meteorological conditions at 13 June 2017. Further, we utilized
cyclic lateral boundary conditions for the turbulent exchange coefficient to copy the
inflow profile into the model domain to represent a large homogeneous residential
neighborhood.
Figure 4.5 Base Model with Existing Tree Locations and Arrangements
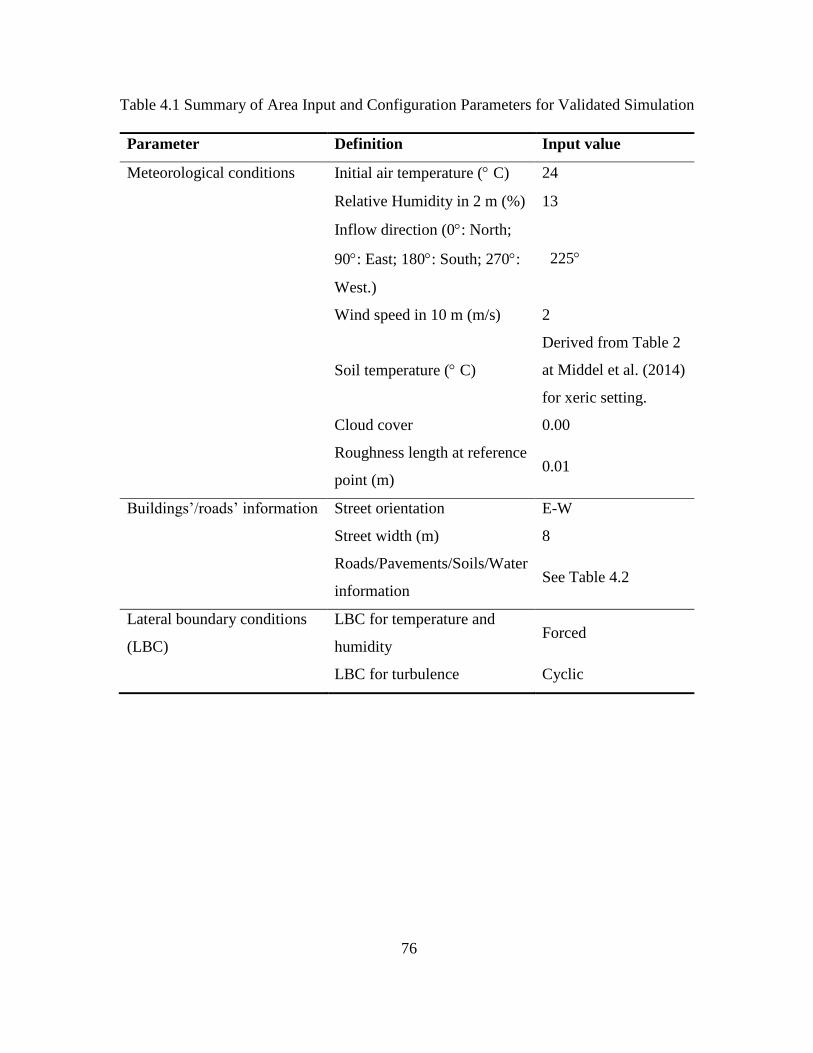
76
Table 4.1 Summary of Area Input and Configuration Parameters for Validated Simulation
Parameter Definition Input value
Meteorological conditions Initial air temperature ( C) 24
Relative Humidity in 2 m (%) 13
Inflow direction (0: North;
90: East; 180: South; 270:
West.)
225
Wind speed in 10 m (m/s) 2
Soil temperature ( C)
Derived from Table 2
at Middel et al. (2014)
for xeric setting.
Cloud cover 0.00
Roughness length at reference
point (m) 0.01
Buildings’/roads’ information Street orientation E-W
Street width (m) 8
Roads/Pavements/Soils/Water
information See Table 4.2
Lateral boundary conditions
(LBC)
LBC for temperature and
humidity Forced
LBC for turbulence Cyclic

77
Table 4.2 Summary of Surface Information
Type Albedo Emissivity Roughness Length
Soil 0.20 0.95 0.015
Asphalt Road 0.15 0.95 0.010
Concrete Pavement Light 0.35 0.90 0.010
Concrete Pavement Gray 0.20 0.90 0.010
Gravel 0.15 0.90 0.010
Water 0.05 0.95 0.010
Three different types of trees were used in the base model with different leaf type,
crown width and tree height: Fraxinus velutina (Desert ash), Acacia salicina (Weeping
acacia), and Washingtonia filifera (Desert palm) (see Table 4.3). Desert ash represents
regular deciduous shade tree with large canopy coverage in the neighborhood. Weeping
acacia has similar height to desert ash, but it has relatively small canopy coverage
(conifer leafs) and fits better in a narrow vertical space. Desert palm is the typical tall
palm tree with little shade coverage from the canopy. These three types of trees were the
most common tree species in this specific neighborhood, and we utilized them to
represent all other similar tree species in our study area. We chose the regular 5 cm
height dense grass to simulate the urban lawns in the study area.
Table 4.3 Summary of Tree Information
Tree name Scientific name Leaf type Crown width Tree height
Desert Ash Fraxinus velutina Deciduous 5 6
Weeping acacia Acacia salicina Conifer 9 6
Desert palm Washingtonia filifera Conifer 9 10
Note: Tree information is obtained from the virtual library of Phoenix Landscape plants
(Martin, n.d.).
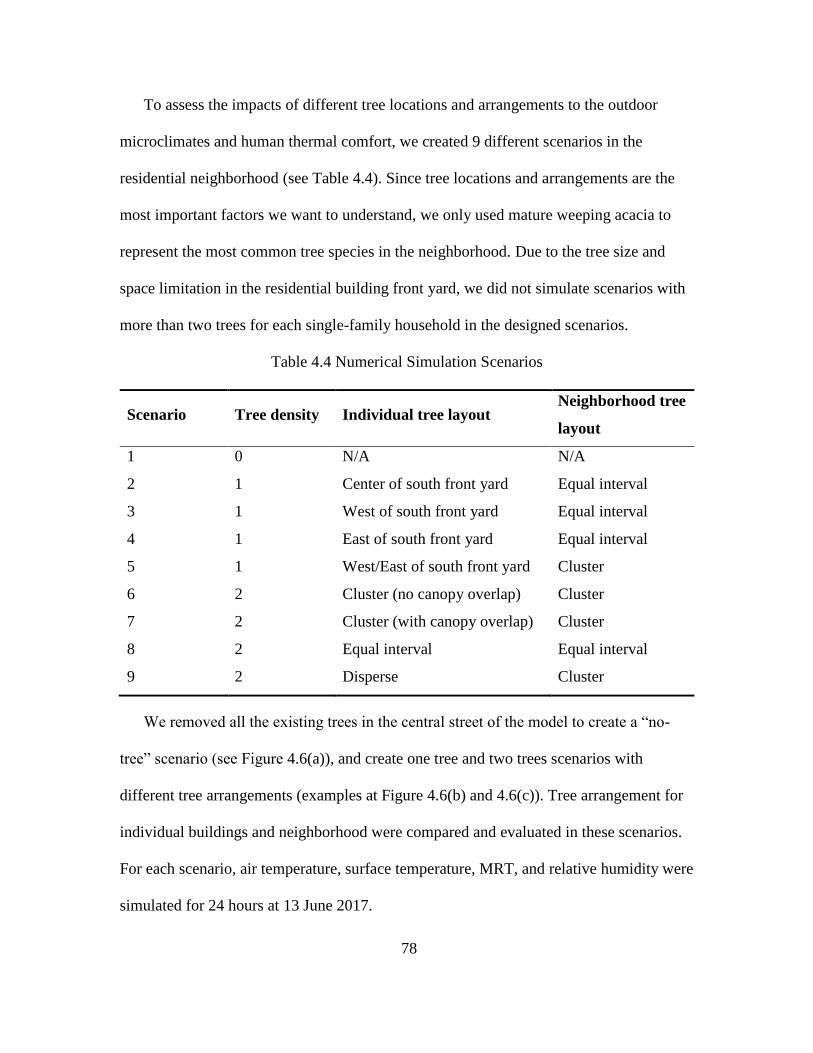
78
To assess the impacts of different tree locations and arrangements to the outdoor
microclimates and human thermal comfort, we created 9 different scenarios in the
residential neighborhood (see Table 4.4). Since tree locations and arrangements are the
most important factors we want to understand, we only used mature weeping acacia to
represent the most common tree species in the neighborhood. Due to the tree size and
space limitation in the residential building front yard, we did not simulate scenarios with
more than two trees for each single-family household in the designed scenarios.
Table 4.4 Numerical Simulation Scenarios
Scenario Tree density Individual tree layout Neighborhood tree
layout
1 0 N/A N/A
2 1 Center of south front yard Equal interval
3 1 West of south front yard Equal interval
4 1 East of south front yard Equal interval
5 1 West/East of south front yard Cluster
6 2 Cluster (no canopy overlap) Cluster
7 2 Cluster (with canopy overlap) Cluster
8 2 Equal interval Equal interval
9 2 Disperse Cluster
We removed all the existing trees in the central street of the model to create a “no-
tree” scenario (see Figure 4.6(a)), and create one tree and two trees scenarios with
different tree arrangements (examples at Figure 4.6(b) and 4.6(c)). Tree arrangement for
individual buildings and neighborhood were compared and evaluated in these scenarios.
For each scenario, air temperature, surface temperature, MRT, and relative humidity were
simulated for 24 hours at 13 June 2017.

79
(a) No front yard tree (scenario 1).
(b) One front yard tree (scenario 5).
(c) Two front yard trees (scenario 9).
Figure 4.6 Simulated Tree Locations and Arrangements Scenarios
4.3.3 Human Thermal Comfort Calculation
To evaluate the outdoor human thermal comfort, we used physiological equivalent
temperature (PET) as the indicator to show the thermal sensation under different
simulated scenarios (Mayer & Höppe, 1987). PET values were estimated by ENVI-met
BioMet package to evaluate the effects of residential trees in improving outdoor
pedestrians and residents comfort (Höppe, 1999). For the human parameter setting in
BioMet, we used a 35-year-old male with 75 kg weight and 1.75 m height, with a static
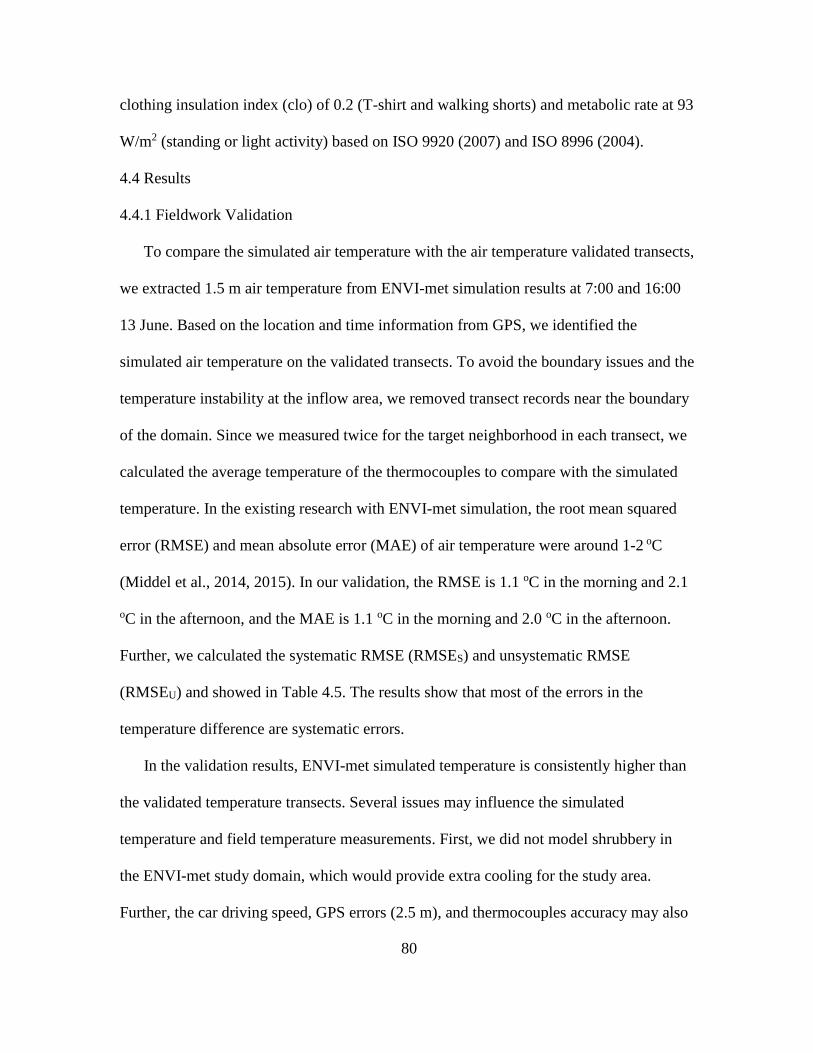
80
clothing insulation index (clo) of 0.2 (T-shirt and walking shorts) and metabolic rate at 93
W/m2 (standing or light activity) based on ISO 9920 (2007) and ISO 8996 (2004).
4.4 Results
4.4.1 Fieldwork Validation
To compare the simulated air temperature with the air temperature validated transects,
we extracted 1.5 m air temperature from ENVI-met simulation results at 7:00 and 16:00
13 June. Based on the location and time information from GPS, we identified the
simulated air temperature on the validated transects. To avoid the boundary issues and the
temperature instability at the inflow area, we removed transect records near the boundary
of the domain. Since we measured twice for the target neighborhood in each transect, we
calculated the average temperature of the thermocouples to compare with the simulated
temperature. In the existing research with ENVI-met simulation, the root mean squared
error (RMSE) and mean absolute error (MAE) of air temperature were around 1-2 oC
(Middel et al., 2014, 2015). In our validation, the RMSE is 1.1 oC in the morning and 2.1
oC in the afternoon, and the MAE is 1.1 oC in the morning and 2.0 oC in the afternoon.
Further, we calculated the systematic RMSE (RMSES) and unsystematic RMSE
(RMSEU) and showed in Table 4.5. The results show that most of the errors in the
temperature difference are systematic errors.
In the validation results, ENVI-met simulated temperature is consistently higher than
the validated temperature transects. Several issues may influence the simulated
temperature and field temperature measurements. First, we did not model shrubbery in
the ENVI-met study domain, which would provide extra cooling for the study area.
Further, the car driving speed, GPS errors (2.5 m), and thermocouples accuracy may also

81
increase the uncertainty of the air temperature transect results. Last, we used a prominent
wind direction at 13 June from southwest to represent the neighborhood wind
environment in the ENVI-met simulation; however, this may not be accurate at 7:00 and
16:00 in this particular neighborhood. Since we are more interested in the temperature
difference between different tree location and arrangement scenarios, the systematic
errors will be eliminated. Thus, we believe the existing ENVI-met simulation can provide
reliable microclimate outputs for further simulation.
Table 4.5 Temperature Differences between the Simulated and Validated Dataset
RMSE (oC) MAE (oC) RMSES (oC) RMSEU (oC)
Morning (7:00) 1.1 1.1 1.1 0.2
Afternoon (16:00) 2.1 2.0 2.1 0.1
4.4.2 Numerical Simulation Results
4.4.2.1 Outdoor Microclimates Comparison
To compare how tree densities, locations, and arrangements influence the outdoor
microclimates, we extracted 1.5 m air temperature and surface air temperature (0.1 m
height) at the hottest summer afternoon (15:00) for all 9 scenarios. We selected 4
buildings in the central of the study domain (building 3, 4, 5, and 6) at the north side of
the street, and calculated the average temperature of their entire front yard to represent as
the neighborhood temperature. Results are shown in Figure 4.7 and 4.8. In the one tree
scenarios, locating a single tree on the west side of the house front yard provides the most
air and surface temperature cooling benefits to the neighborhood (0.26 oC surface
temperature cooling and 0.11 oC air temperature cooling compared to no tree scenario).
The worst case is planting trees at the east side of front yard because most of the
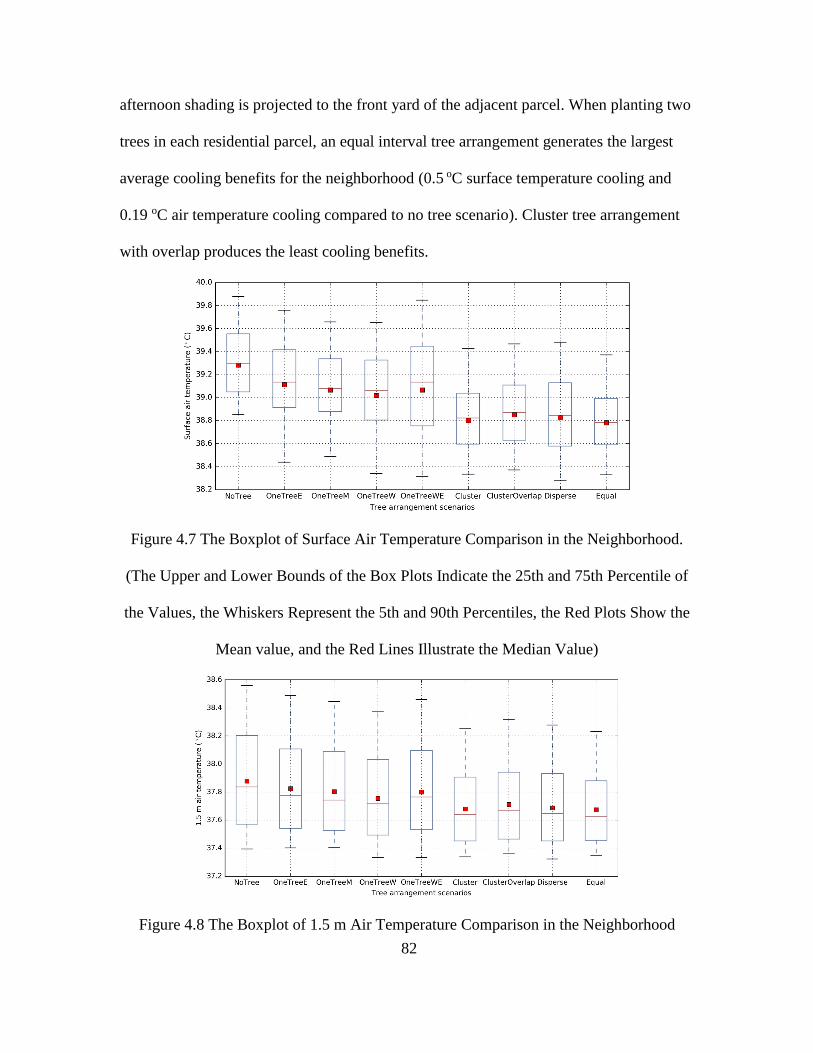
82
afternoon shading is projected to the front yard of the adjacent parcel. When planting two
trees in each residential parcel, an equal interval tree arrangement generates the largest
average cooling benefits for the neighborhood (0.5 oC surface temperature cooling and
0.19 oC air temperature cooling compared to no tree scenario). Cluster tree arrangement
with overlap produces the least cooling benefits.
Figure 4.7 The Boxplot of Surface Air Temperature Comparison in the Neighborhood.
(The Upper and Lower Bounds of the Box Plots Indicate the 25th and 75th Percentile of
the Values, the Whiskers Represent the 5th and 90th Percentiles, the Red Plots Show the
Mean value, and the Red Lines Illustrate the Median Value)
Figure 4.8 The Boxplot of 1.5 m Air Temperature Comparison in the Neighborhood

83
Mean radiant temperature, which sums up all short wave and long wave radiation
fluxes to the human body (Thorsson, Lindberg, Eliasson, & Holmer, 2007), is one of the
most important factors that influences the human thermal comfort. In Figure 4.9, we
show how 1.5 m MRTs vary in all different scenarios at 15:00. Planting one tree in the
middle of building south front yard can produce approximately 5.3 oC average cooling
benefits of MRT to the neighborhood. The best one tree arrangement (establish one tree
in the middle of front yard) offers 0.6 oC more MRT cooling benefits than the worst one
tree arrangement (plant one tree in the west/east of front yard). Adding another tree into
the neighborhood can generate another 5.3 oC cooling benefits when these trees are
equally distributed. The best two trees arrangement (equal interval) provides 1.2 oC more
MRT cooling benefits than the worst two trees arrangement (disperse).
Figure 4.9 The Boxplot of MRT Comparison in the Neighborhood
Figure 4.10 shows the wind speed comparison under different tree locations and
arrangements scenarios in the neighborhood at 15:00. The first finding is that increasing
tree densities in the neighborhood decreases the neighborhood wind speed. When we

84
locate the first residential shade tree in the building south front yard, the wind speed
decreases by 0.1 m/s. With the second residential shade tree, the wind speed further
decrease by 0.05 m/s. When locating one tree in the middle of the front yard, trees has the
least influence to the wind environment. After adding another tree to each house’s front
yard, the cluster tree arrangement with overlap has the best wind environment. In this tree
arrangement, trees are clustered in the middle of the front yard and do not block the wind
corridor between buildings. The wind speed of cluster arrangement without overlap and
equal interval arrangement is very similar to each other.
Figure 4.10 The Boxplot of Wind Speed Comparison in the Neighborhood
4.4.2.2 Human Thermal Comfort Comparison
With the simulated air temperature, relative humidity, wind speed, and MRT, we
simulated the PET at 1.5 m for both the neighborhood and two individual houses in the
neighborhood. Figure 4.11 shows the PET comparison in the residential neighborhood at
15:00. To achieve the best PET at 1.5 m, equal two trees arrangement is the best option to
reduce mean PET from 50.5 oC (no tree) to 49.6 oC. If the residents only plan to plant one

85
tree in their front yard, a single tree in the middle of the front yard offers the most human
thermal comfort by decreasing mean PET from 50.5 oC to 50.1 oC.
Figure 4.11 The Boxplot of PET Comparison in the Neighborhood
Moreover, we picked two individual houses to understand how tree locations and
arrangements influence their front yard human thermal comfort at 15:00. The PET
comparison is shown in Figure 4.12. The overall results are similar to the neighborhood
scale, but we can observe a significant difference when locating one tree at the west/east
corner of the building. Because two individual trees were located between building 5 and
6 (see Figure 6(b)) and most of the afternoon shading cast to the building 6’s front yard.
This specific tree arrangement results in significant cooling benefits on the building 6 as
showed in Figure 4.12(b).
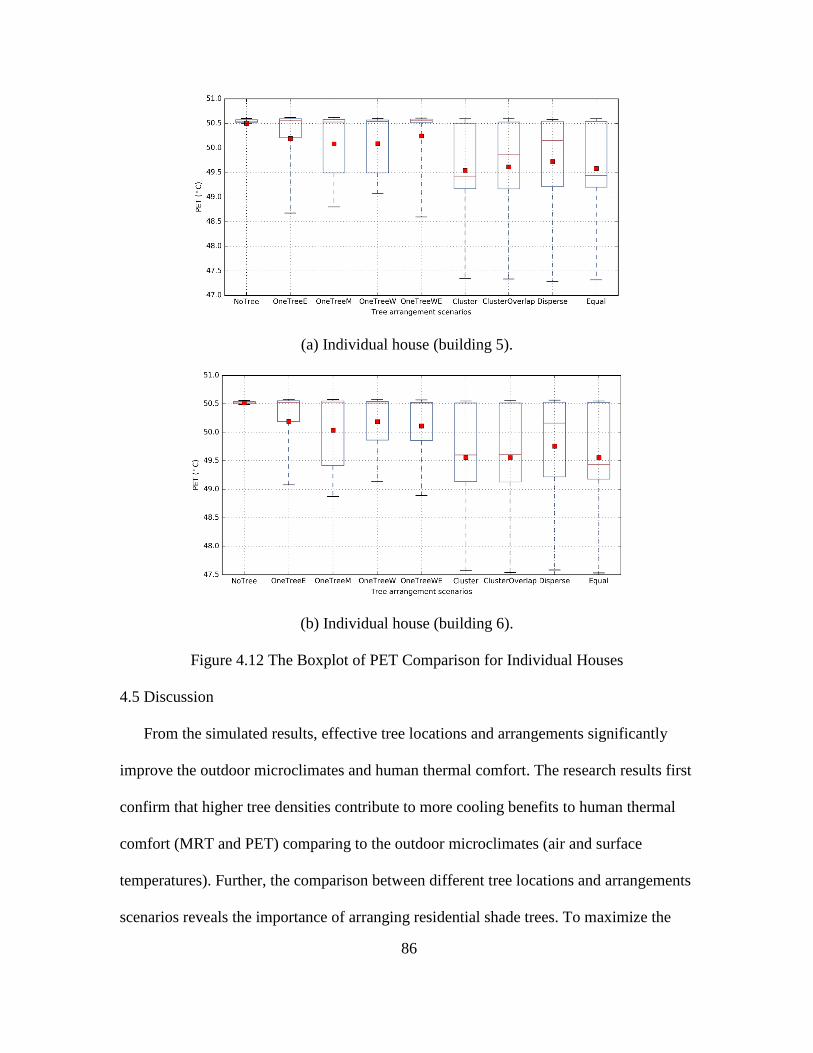
86
(a) Individual house (building 5).
(b) Individual house (building 6).
Figure 4.12 The Boxplot of PET Comparison for Individual Houses
4.5 Discussion
From the simulated results, effective tree locations and arrangements significantly
improve the outdoor microclimates and human thermal comfort. The research results first
confirm that higher tree densities contribute to more cooling benefits to human thermal
comfort (MRT and PET) comparing to the outdoor microclimates (air and surface
temperatures). Further, the comparison between different tree locations and arrangements
scenarios reveals the importance of arranging residential shade trees. To maximize the

87
tree locational benefits, the general guideline is to avoid unnecessary tree canopy overlap,
provide more shading to the built environment, and create effective ventilation conditions
between trees. Because we have a low wind speed (1 m/s) in all of the simulation
scenarios, MRT is the most important factor to influence the human thermal comfort in
the desert residential neighborhood.
By comparing the cooling benefits in the overall neighborhood and individual houses,
the results show that tree cooling benefits to the neighborhood and individual houses are
not contradicted. Multiple individual “cold spots” with effective tree arrangements in the
neighborhood create an overall cool neighborhood. This finding emphasizes the
importance of wisely designing tree locations and arrangements in the individual house
front yard. An appropriate tree arrangement will not only benefit the house owners, but
also benefit the overall thermal environment in the residential neighborhood.
Although conventional wisdom recommends planting the residential shade trees at the
southwest corner of the building front yard, it is not strictly correct from the simulated
results. The air and surface temperature comparison show that locate a single tree at the
west corner can provide the most temperature cooling benefits, however, the cooling
magnitude is relatively trivial (0.26 oC surface temperature and 0.11 oC air temperature
cooling). When locating a single tree in the middle of the front yard, we will lose 0.05 oC
air and surface temperature cooling benefits, but gain 0.14 oC cooling of MRT. Both the
west and the central of the front yard can be a reasonable choice to plant a single
residential shade tree.
It is noteworthy that locating the single tree in the middle of the front yard and the
equal interval two trees arrangement provide the most PET benefits in both the

88
neighborhood and individual level. Both tree arrangement scenarios correspond with
findings in Zhao et al. (2017). These results confirm that the best tree arrangement can
provide the best shading benefits to the outdoor human thermal comfort as well as the
buildings. In a neighborhood without homeowner association (HOA) regulations, it is
difficult to arrange the residential trees in a strictly equal interval arrangement. Thus, it is
important to make the urban residents understand the importance of tree shade in the hot
arid desert environment and offer advice when they attempt to plant a new tree to their
residential parcel. For a residential neighborhood with HOA regulation, adding a
maximum vegetation amount regulation and emphasizing the significance of avoiding
tree canopy overlapping, is significant and necessary.
In a desert city, evapotranspiration is largely inhibited by extreme heat (Upreti et al.,
2017). Thus, radiation exchange is the dominant factor to influence the overall urban
thermal environment. The tree locations and arrangements recommendation in this
research may not be effective in another climate zone such as the tropical monsoon
climate cities. In a hot humid environment, both shading and ventilation are important
factors to be considered. In other climates, excessive cluster tree arrangement may reduce
the wind speed and decrease the evaporation rate of people’s skin, which will have a
detrimental effect on human thermal comfort (Hsieh et al., 2016). The best tree
arrangement will be expected to find the balance of shading benefits as well as
satisfactory wind environment in the residential neighborhood.
Several limitations exist in this research. Although the microclimates and human
thermal benefits from residential trees are very important, we did not account for the
ecological, aesthetic, health, and physiological benefits of trees (Roy et al., 2012;

89
Sarajevs, 2011). Further, we only used one common conifer desert shade tree in the
simulation. It may provide limited coverage of tree shade and other tree species with
different tree height, leaf area index, canopy density, and crown size may recommend
different results from this research (Armson et al., 2013). The tree growing process can
also be considered in the future research to understand how trees will influence the urban
built environment in a long time period (Rahman et al., 2015).
4.6 Conclusions
Trees provide significant benefits to outdoor microclimates and human thermal
comfort in the desert environment. Considering the planting and maintenance cost, it is
important to maximize tree benefits with limited number of trees. This research utilizes
numerical simulation to explore how to wisely design tree arrangements to benefit both
individual households and residential neighborhood. The flexibility of numerical models
makes it possible to create, simulate, and compare the outdoor microclimates and human
thermal comfort under different tree locations and arrangements. The research results
recommend that urban residents should plant shade trees without canopy overlap. If
possible, trees should not block the existing wind tunnels to impede air movement. This
research is one of the pioneering attempts to explore the importance of tree locations and
arrangements, and bridge the tree benefits for both the individual houses and residential
neighborhood. The research results will help the design of urban vegetation and HOA
regulation for the long-term sustainability of urban desert environments.

90
CHAPTER 5
CONCLUSIONS
5.1 Summary of Dissertation
Urban green infrastructure that includes urban parks, street trees, green roofs and
green walls continues to serve as an important component to create a better living
environment for the urban citizens (Chang et al., 2007; Coutts, White, Tapper, Beringer,
& Livesley, 2016; Santamouris, 2014; Wong et al., 2010). Existing research repeatedly
confirmed the effectiveness of heat mitigation from vegetation, especially for trees, by
the evapotranspiration effects, high albedo reflectance from leaves, and the blocking
effects from solar radiation (Taleghani, 2017). Although researchers, policy makers, and
urban citizens understand and believe that planting trees is an effective strategy to benefit
the urban community, existing literature did not fully explore and understand how to
optimally identify the best tree locations and arrangements in both the individual houses
and the urban neighborhood. The goal of this dissertation is to fill this research gap in the
literature and provide a better policy implication for the urban communities to plant
residential trees.
Chapter 2 proposed a new 3D spatial optimization method to optimally locate
residential trees for the single-family houses. We maximized the shading to the building
facade, windows, and doors, and minimized the shading to the building rooftops. Results
show that planting trees in the central part of the south facade provided the most shading
benefits to the building. A cluster tree arrangement provides better shading environment
compared to a dispersed tree arrangement. In addition, planting trees in the boundary of
the residential parcel offered significant shading to the neighboring buildings.

91
Chapter 3 employed an outdoor urban physical scale model to understand the cooling
and locational benefits from trees to the building facade. We measured the facade
temperature by iButton loggers and FLIR thermal camera under different tree locations
and arrangements. Results demonstrated that tree shade benefits were more significant in
the afternoon for the east side of the south facade. Further, tree canopy overlap should be
avoided between multiple trees to provide the most cooling benefits to the built
environment. For neighboring buildings, similar results were shown in both Chapter 2
and 3. Plant trees at the boundary of the residential parcel benefited both of the houses
and improved the overall living environment.
Chapter 4 applied numerical simulation to understand the outdoor microclimates and
human thermal comfort under different tree locations and arrangements. We first validate
the simulated scenarios with the air temperature fieldwork transects. Further, we utilized
ENVI-met simulation platform to create and compare the air temperature, surface
temperature, MRT, wind speed, and PET under different tree locations and arrangements.
The results shown that planting a single tree in the middle of the front yard and arranged
two trees in an equal interval provided the most human thermal comfort benefits to both
the residential neighborhood and individual houses. The research results corresponded
with the research findings in both Chapter 2 and 3, and offered guidelines for arranging
trees at the neighborhood scale.
The overall dissertation research results highlight the importance of arranging
residential shade trees across various geographical scales. In the building scale, research
results recommend that homeowners and urban residents should arrange trees in the
central part of the building south front yard without canopy overlap. In the neighborhood

92
scale, trees are suggested to be located in the central of the south front yard as well, but
what varies is the distance and space between tree canopies. MRT is the most important
factor to influence the human thermal comfort especially in a low wind speed
environment. The dissertation findings not only confirm the cooling benefits from tree
densities, but also indicate the importance of wisely design tree locations and
arrangements for both the individual buildings and the residential neighborhood.
Considering the rapid urbanization process, the severe heat stress, and limited water
supply, judicious planning and design of residential shade trees is increasingly important
for sustaining the urban environment and improving the life quality.
5.2 Limitation and Future Work
5.2.1 Tree Characteristics
This dissertation research explores the importance of tree locations and arrangements
in a hot arid urban residential neighborhood. However, we did not evaluate how tree
species, leaf area index, tree growing process, and tree types (evergreen or deciduous
trees) will affect the spatial optimization results as well as the outdoor microclimate
environment. A deciduous tree provides significant shading during the summer and
allows more solar radiation penetration in the winter season. Future research can
incorporate these tree-related variables into the understanding of the tree benefits.
5.2.2 Tree Placement and Energy Saving
In this dissertation, we decided the optimal tree locations and arrangements by
maximizing tree shade coverage and cooling benefits on the building surfaces. A more
realistic and practical next step will attempt to identify the best tree locations and
arrangements with the maximum air conditioning energy savings resulting from each tree.

93
In addition, different building orientations can also be incorporated into the energy
simulation to gain more understanding of designing built environment.
5.2.3 Tree Location Optimization Index
With the availability of high resolution remotely sensed images, ground-based light
detection and ranging (LIDAR), and high performance computing facilities, it is
achievable to derive the existing tree locations and building configurations in a city
extent. The newly proposed spatial optimization method in this dissertation can be used
to generate a tree location optimization index across different cities. This index will be
useful for urban planners and policy makers to understand the current development status
of urban green infrastructure and further help them implement plans for tree planting
programs.

94
REFERENCES
Aguiar, A. C. (2012). Urban Heat Islands- differentiating between the benefits and draw.
University of Wollongong.
Akbari, H. (2002). Shade trees reduce building energy use and CO2 emissions from
power plants. Environmental Pollution, 116, S119–S126.
Akbari, H., Pomerantz, M., & Taha, H. (2001). Cool surfaces and shade trees to reduce
energy use and improve air quality in urban areas. Solar Energy, 70(3), 295–310.
Akbari, H., & Taha, H. (1992). The impact of trees and white surfaces on residential
heating and cooling energy use in four Canadian cities. Energy, 17(2), 141–149.
Amriki, K. A., & Atrey, P. K. (2014). Bus surveillance: how many and where cameras
should be placed. Multimedia Tools and Applications, 71(3), 1051–1085.
https://doi.org/10.1007/s11042-012-1247-1
Armson, D., Rahman, M. A., & Ennos, A. R. (2013). A comparison of the shading
effectiveness of five different street tree species in Manchester, UK. Arboriculture
Urban Forestry, 39, 157–164.
Bao, S., Xiao, N., Lai, Z., Zhang, H., & Kim, C. (2015). Optimizing watchtower
locations for forest fire monitoring using location models. Fire Safety Journal, 71,
100–109. https://doi.org/10.1016/j.firesaf.2014.11.016
Bassil, K. L., & Cole, D. C. (2010). Effectiveness of Public Health Interventions in
Reducing Morbidity and Mortality during Heat Episodes: a Structured Review.
International Journal of Environmental Research and Public Health, 7(3), 991–
1001. https://doi.org/10.3390/ijerph7030991
Berry, R., Livesley, S. J., & Aye, L. (2013). Tree canopy shade impacts on solar
irradiance received by building walls and their surface temperature. Building and
Environment, 69, 91–100. https://doi.org/10.1016/j.buildenv.2013.07.009
Bi, P., Williams, S., Loughnan, M., Lloyd, G., Hansen, A., Kjellstrom, T., … Saniotis, A.
(2011). The Effects of Extreme Heat on Human Mortality and Morbidity in
Australia: Implications for Public Health. Asia-Pacific Journal of Public Health,
1010539510391644. https://doi.org/10.1177/1010539510391644
Bolund, P., & Hunhammar, S. (1999). Ecosystem services in urban areas. Ecological
Economics, 29(2), 293–301.
Brabyn, L., Zawar-Reza, P., Stichbury, G., Cary, C., Storey, B., Laughlin, D. C., &
Katurji, M. (2014). Accuracy assessment of land surface temperature retrievals
from Landsat 7 ETM + in the Dry Valleys of Antarctica using iButton

95
temperature loggers and weather station data. Environmental Monitoring and
Assessment, 186(4), 2619–2628. https://doi.org/10.1007/s10661-013-3565-9
Bruse, M., & Fleer, H. (1998). Simulating surface–plant–air interactions inside urban
environments with a three dimensional numerical model. Environmental
Modelling & Software, 13(3), 373–384.
Calcerano, F., & Martinelli, L. (2016). Numerical optimisation through dynamic
simulation of the position of trees around a stand-alone building to reduce cooling
energy consumption. Energy and Buildings, 112, 234–243.
https://doi.org/10.1016/j.enbuild.2015.12.023
Chang, C.-R., Li, M.-H., & Chang, S.-D. (2007). A preliminary study on the local cool-
island intensity of Taipei city parks. Landscape and Urban Planning, 80(4), 386–
395. https://doi.org/10.1016/j.landurbplan.2006.09.005
Chen, H., Ooka, R., & Kato, S. (2008). Study on optimum design method for pleasant
outdoor thermal environment using genetic algorithms (GA) and coupled
simulation of convection, radiation and conduction. Building and Environment,
43(1), 18–30. https://doi.org/10.1016/j.buildenv.2006.11.039
Chen, L., & Ng, E. (2013). Simulation of the effect of downtown greenery on thermal
comfort in subtropical climate using PET index: a case study in Hong Kong.
Architectural Science Review, 56(4), 297–305.
https://doi.org/10.1080/00038628.2012.684871
Chow, W. T. L., Chuang, W.-C., & Gober, P. (2012). Vulnerability to Extreme Heat in
Metropolitan Phoenix: Spatial, Temporal, and Demographic Dimensions. The
Professional Geographer, 64(2), 286–302.
https://doi.org/10.1080/00330124.2011.600225
Church, R. L., & Murray, A. T. (2009). Business site selection, location analysis, and
GIS. Hoboken, N.J: Wiley.
Church, R., & ReVelle, C. (1974). The maximal covering location problem. Papers in
Regional Science, 32(1), 101–118.
City of Tempe, AZ : Zoning and Development Code - Appendix. (2011). Retrieved from
http://www.tempe.gov/home/showdocument?id=1910
City of Tempe, AZ : Zoning and Development Code - Part 4: Development Standards.
(2011). Retrieved from http://www.tempe.gov/home/showdocument?id=1914
Coutts, A. M., White, E. C., Tapper, N. J., Beringer, J., & Livesley, S. J. (2016).
Temperature and human thermal comfort effects of street trees across three
contrasting street canyon environments. Theoretical and Applied Climatology,
124(1–2), 55–68. https://doi.org/10.1007/s00704-015-1409-y

96
Daily Summaries Station Details: PHOENIX SKY HARBOR INTERNATIONAL
AIRPORT, AZ US, GHCND:USW00023183 | Climate Data Online (CDO) |
National Climatic Data Center (NCDC). (n.d.). Retrieved January 2, 2017, from
https://www.ncdc.noaa.gov/cdo-
web/datasets/GHCND/stations/GHCND:USW00023183/detail
Dao, T. H. D., Zhou, Y., Thill, J.-C., & Delmelle, E. (2012). Spatio-temporal location
modeling in a 3D indoor environment: the case of AEDs as emergency medical
devices. International Journal of Geographical Information Science, 26(3), 469–
494. https://doi.org/10.1080/13658816.2011.597753
Declet-Barreto, J., Brazel, A. J., Martin, C. A., Chow, W. T. L., & Harlan, S. L. (2013).
Creating the park cool island in an inner-city neighborhood: heat mitigation
strategy for Phoenix, AZ. Urban Ecosystems, 16(3), 617–635.
https://doi.org/10.1007/s11252-012-0278-8
Donovan, G. H., Michael, Y. L., Gatziolis, D., Prestemon, J. P., & Whitsel, E. A. (2015).
Is tree loss associated with cardiovascular-disease risk in the Women’s Health
Initiative? A natural experiment. Health & Place, 36, 1–7.
https://doi.org/10.1016/j.healthplace.2015.08.007
Duffie, J. A. (2013). Solar engineering of thermal processes / John A. Duffie, William A.
Beckman (4th ed). Hoboken: John Wiley.
Eligible desert-adaptive shade trees. (n.d.). Retrieved June 9, 2016, from
http://www.savewithsrp.com/RD/shadetreetypes.aspx
Erell, E., Pearlmutter, D., & Williamson, T. J. (2011). Urban microclimate: designing the
spaces between buildings (1st ed). London ; Washington, DC: Earthscan.
Fahmy, M., & Sharples, S. (2009). On the development of an urban passive thermal
comfort system in Cairo, Egypt. Building and Environment, 44(9), 1907–1916.
https://doi.org/10.1016/j.buildenv.2009.01.010
Fan, C., Myint, S. W., & Zheng, B. (2015). Measuring the spatial arrangement of urban
vegetation and its impacts on seasonal surface temperatures. Progress in Physical
Geography, 39(2), 199–219. https://doi.org/10.1177/0309133314567583
Fogl, M., & Moudrý, V. (2016). Influence of vegetation canopies on solar potential in
urban environments. Applied Geography, 66, 73–80.
https://doi.org/10.1016/j.apgeog.2015.11.011
Gold, S. M. (1976). Social benefits of trees in urban environments†. International
Journal of Environmental Studies, 10(1), 85–90.
Golden, J. S., Carlson, J., Kaloush, K. E., & Phelan, P. (2007). A comparative study of
the thermal and radiative impacts of photovoltaic canopies on pavement surface
97
temperatures. Solar Energy, 81(7), 872–883.
https://doi.org/10.1016/j.solener.2006.11.007
Gomez-Munoz, V. M., Porta-Gándara, M. A., & Fernández, J. L. (2010). Effect of tree
shades in urban planning in hot-arid climatic regions. Landscape and Urban
Planning, 94(3–4), 149–157. https://doi.org/10.1016/j.landurbplan.2009.09.002
Goodchild, M. F., & Lee, J. (1989). Coverage problems and visibility regions on
topographic surfaces. Annals of Operations Research, (18), 175–186.
Grimm, N. B., Faeth, S. H., Golubiewski, N. E., Redman, C. L., Wu, J., Bai, X., & Briggs,
J. M. (2008). Global change and the ecology of cities. Science, 319(5864), 756–
760.
Gui, J., Phelan, P., Kaloush, K. E., & Golden, J. S. (2007). Impact of Pavement
Thermophysical Properties on Surface Temperatures. Journal of Materials in
Civil Engineering, 19(8), 683–690. https://doi.org/10.1061/(ASCE)0899-
1561(2007)19:8(683)
Heisler, G. M. (1986). Energy savings with trees. Retrieved from
http://www.treesearch.fs.fed.us/pubs/34773
Heisler, G. M., & Grant, R. H. (2000). Ultraviolet radiation in urban ecosystems with
consideration of effects on human health. Urban Ecosystems, 4(3), 193–229.
https://doi.org/10.1023/A:1012210710900
Höppe, P. (1999). The physiological equivalent temperature–a universal index for the
biometeorological assessment of the thermal environment. International Journal
of Biometeorology, 43(2), 71–75.
Hsieh, C.-M., Jan, F.-C., & Zhang, L. (2016). A simplified assessment of how tree
allocation, wind environment, and shading affect human comfort. Urban Forestry
& Urban Greening, 18, 126–137. https://doi.org/10.1016/j.ufug.2016.05.006
Huang, H., Ni, C.-C., Ban, X., Gao, J., Schneider, A., & Lin, S. (2014). Connected
Wireless Camera Network Deployment with Visibility Coverage (pp. 1204–1212).
Presented at the IEEE INFOCOM 2014.
Huang, Y. J., Akbari, H., Taha, H., & Rosenfeld, A. H. (1987). The potential of
vegetation in reducing summer cooling loads in residential buildings. Journal of
Climate and Applied Meteorology, 26(9), 1103–1116.
Hwang, W. H., Wiseman, P. E., & Thomas, V. A. (2015). Tree Planting Configuration
Influences Shade on Residential Structures in Four US Cities. Arboriculture &
Urban Forestry, 41(4). Retrieved from
http://urbanforestry.frec.vt.edu/documents/articles/Hwang_AUF_2015.pdf

98
Imam Syafii, N., Ichinose, M., Kumakura, E., Jusuf, S. K., Chigusa, K., & Wong, N. H.
(2017). Thermal environment assessment around bodies of water in urban
canyons: A scale model study. Sustainable Cities and Society, 34, 79–89.
https://doi.org/10.1016/j.scs.2017.06.012
ISO 8996. (2004). (Ergonomics of the thermal environment -- Determination of
metabolic rate). Retrieved from https://www.iso.org/standard/34251.html
ISO 9920. (2007). (Ergonomics of the thermal environment -- Estimation of thermal
insulation and water vapour resistance of a clothing ensemble). Retrieved from
https://www.iso.org/standard/39257.html
Jan, F.-C., Hsieh, C.-M., Ishikawa, M., & Sun, Y.-H. (2013). The Influence of Tree
Allocation and Tree Transpiration on the Urban Microclimate: An Analysis of a
Subtropical Urban Park. Environment and Urbanization ASIA, 4(1), 135–150.
https://doi.org/10.1177/0975425313477751
Jang, H. S., Kim, H. J., & Jeon, J. Y. (2015). Scale-model method for measuring noise
reduction in residential buildings by vegetation. Building and Environment, 86,
81–88. https://doi.org/10.1016/j.buildenv.2014.12.020
Jim, C. Y. (2016). Solar–terrestrial radiant-energy regimes and temperature anomalies of
natural and artificial turfs. Applied Energy, 173, 520–534.
https://doi.org/10.1016/j.apenergy.2016.04.072
Jim, C. Y. (2017). Intense summer heat fluxes in artificial turf harm people and
environment. Landscape and Urban Planning, 157, 561–576.
https://doi.org/10.1016/j.landurbplan.2016.09.012
Kanda, M. (2005). Progress in the scale modeling of urban climate: Review. Theoretical
and Applied Climatology, 84(1–3), 23–33. https://doi.org/10.1007/s00704-005-
0141-4
Kanda, M., Kanega, M., Kawai, T., Moriwaki, R., & Sugawara, H. (2007). Roughness
Lengths for Momentum and Heat Derived from Outdoor Urban Scale Models.
Journal of Applied Meteorology and Climatology, 46(7), 1067–1079.
https://doi.org/10.1175/JAM2500.1
Kanda, M., Kawai, T., Moriwaki, R., Narita, K., Hagishima, A., & Sugawara, H. (2006).
Comprehensive outdoor scale model experiments for urban climate (COSMO). In
Proc., 6th Int. Conf. on Urban Climate (pp. 270–273). Retrieved from
http://www.techno-office.com/file/heat_flux_2.pdf
Kanda, M., & Moriizumi, T. (2009). Momentum and Heat Transfer over Urban-like
Surfaces. Boundary-Layer Meteorology, 131(3), 385–401.
https://doi.org/10.1007/s10546-009-9381-7

99
Kawai, T., & Kanda, M. (2010a). Urban Energy Balance Obtained from the
Comprehensive Outdoor Scale Model Experiment. Part I: Basic Features of the
Surface Energy Balance. Journal of Applied Meteorology and Climatology, 49(7),
1341–1359. https://doi.org/10.1175/2010JAMC1992.1
Kawai, T., & Kanda, M. (2010b). Urban Energy Balance Obtained from the
Comprehensive Outdoor Scale Model Experiment. Part II: Comparisons with
Field Data Using an Improved Energy Partition. Journal of Applied Meteorology
and Climatology, 49(7), 1360–1376. https://doi.org/10.1175/2010JAMC1993.1
Kesselmeier, J., & Staudt, M. (1999). Biogenic Volatile Organic Compounds (VOC): An
Overview on Emission, Physiology and Ecology. Journal of Atmospheric
Chemistry, 33(1), 23–88. https://doi.org/10.1023/A:1006127516791
Kim, Y.-H., Rana, S., & Wise, S. (2004). Exploring multiple viewshed analysis using
terrain features and optimisation techniques. Computers & Geosciences, 30(9–10),
1019–1032. https://doi.org/10.1016/j.cageo.2004.07.008
Kong, L., Lau, K. K.-L., Yuan, C., Chen, Y., Xu, Y., Ren, C., & Ng, E. (2017).
Regulation of Outdoor Thermal Comfort by Trees in Hong Kong. Sustainable
Cities and Society. https://doi.org/10.1016/j.scs.2017.01.018
Krayenhoff, E. S., Christen, A., Martilli, A., & Oke, T. R. (2014). A Multi-layer
Radiation Model for Urban Neighbourhoods with Trees. Boundary-Layer
Meteorology, 151(1), 139–178. https://doi.org/10.1007/s10546-013-9883-1
Lee, G. (2015). 3D coverage location modeling of Wi-Fi access point placement in
indoor environment. Computers, Environment and Urban Systems.
https://doi.org/10.1016/j.compenvurbsys.2015.05.002
Letourneux, F., Corre, Y., Suteau, E., & Lostanlen, Y. (2012). 3D coverage analysis of
LTE urban heterogeneous networks with dense femtocell deployments. EURASIP
Journal on Wireless Communications and Networking, 2012(1), 1–14.
Levinson, R., Akbari, H., Pomerantz, M., & Gupta, S. (2009). Solar access of residential
rooftops in four California cities. Solar Energy, 83(12), 2120–2135.
https://doi.org/10.1016/j.solener.2009.07.016
Li, Z., Zhang, Z., & Davey, K. (2015). Estimating geographical pv potential using lidar
data for buildings in downtown san francisco. Transactions in GIS, 19(6), 930–
963.
Lirola, J. M., Castañeda, E., Lauret, B., & Khayet, M. (2017). A review on experimental
research using scale models for buildings: Application and methodologies. Energy
and Buildings, 142, 72–110. https://doi.org/10.1016/j.enbuild.2017.02.060
100
Livesley, S. J., McPherson, G. M., & Calfapietra, C. (2016). The Urban Forest and
Ecosystem Services: Impacts on Urban Water, Heat, and Pollution Cycles at the
Tree, Street, and City Scale. Journal of Environment Quality, 45(1), 119.
https://doi.org/10.2134/jeq2015.11.0567
Lovasi, G. S., O’Neil-Dunne, J. P. M., Lu, J. W. T., Sheehan, D., Perzanowski, M. S.,
MacFaden, S. W., … Rundle, A. (2013). Urban Tree Canopy and Asthma,
Wheeze, Rhinitis, and Allergic Sensitization to Tree Pollen in a New York City
Birth Cohort. Environmental Health Perspectives, 121(4), 494–500.
https://doi.org/10.1289/ehp.1205513
Ma, T., Zhou, C., Pei, T., Haynie, S., & Fan, J. (2012). Quantitative estimation of
urbanization dynamics using time series of DMSP/OLS nighttime light data: A
comparative case study from China’s cities. Remote Sensing of Environment, 124,
99–107. https://doi.org/10.1016/j.rse.2012.04.018
Martin, C. (n.d.). Virtual Library of Phoenix Landscape Plants. Retrieved July 17, 2017,
from
http://www.public.asu.edu/~camartin/Martin%20landscape%20plant%20library.h
tm
Mayer, H., & Höppe, P. (1987). Thermal comfort of man in different urban environments.
Theoretical and Applied Climatology, 38(1), 43–49.
McGeehin, M. A., & Mirabelli, M. (2001). The potential impacts of climate variability
and change on temperature-related morbidity and mortality in the United States.
Environmental Health Perspectives, 109(Suppl 2), 185–189.
McPherson, E. G., Simpson, J. R., & Livingston, M. (1989). Effects of three landscape
treatments on residential energy and water use in Tucson, Arizona. Energy and
Buildings, 13(2), 127–138.
McPherson, G., Simpson, J. R., Peper, P. J., Maco, S. E., Xiao, Q., & Mulrean, E. (2004).
Desert southwest community tree guide: benefits, costs and strategic planting.
Retrieved from http://www.treesearch.fs.fed.us/pubs/47703
Middel, A., Chhetri, N., & Quay, R. (2015). Urban forestry and cool roofs: Assessment
of heat mitigation strategies in Phoenix residential neighborhoods. Urban
Forestry & Urban Greening, 14(1), 178–186.
https://doi.org/10.1016/j.ufug.2014.09.010
Middel, A., Häb, K., Brazel, A. J., Martin, C. A., & Guhathakurta, S. (2014). Impact of
urban form and design on mid-afternoon microclimate in Phoenix Local Climate
Zones. Landscape and Urban Planning, 122, 16–28.
https://doi.org/10.1016/j.landurbplan.2013.11.004

101
Middel, A., Selover, N., Hagen, B., & Chhetri, N. (2016). Impact of shade on outdoor
thermal comfort—a seasonal field study in Tempe, Arizona. International Journal
of Biometeorology. https://doi.org/10.1007/s00484-016-1172-5
Millward, A. A., & Sabir, S. (2011). Benefits of a forested urban park: What is the value
of Allan Gardens to the city of Toronto, Canada? Landscape and Urban Planning,
100(3), 177–188. https://doi.org/10.1016/j.landurbplan.2010.11.013
Morakinyo, T. E., Kong, L., Lau, K. K.-L., Yuan, C., & Ng, E. (2017). A study on the
impact of shadow-cast and tree species on in-canyon and neighborhood’s thermal
comfort. Building and Environment.
https://doi.org/10.1016/j.buildenv.2017.01.005
Murray, A. T., Kim, K., Davis, J. W., Machiraju, R., & Parent, R. (2007). Coverage
optimization to support security monitoring. Computers, Environment and Urban
Systems, 31(2), 133–147. https://doi.org/10.1016/j.compenvurbsys.2006.06.002
Myint, S. W., Wentz, E. A., Brazel, A. J., & Quattrochi, D. A. (2013). The impact of
distinct anthropogenic and vegetation features on urban warming. Landscape
Ecology, 28(5), 959–978. https://doi.org/10.1007/s10980-013-9868-y
Myint, S. W., Zheng, B., Talen, E., Fan, C., Kaplan, S., Middel, A., … Brazel, A. (2015).
Does the spatial arrangement of urban landscape matter? Examples of urban
warming and cooling in Phoenix and Las Vegas. Ecosystem Health and
Sustainability, 1(4), art15. https://doi.org/10.1890/EHS14-0028.1
Nazaroff, W. W. (2013). Exploring the consequences of climate change for indoor air
quality. Environmental Research Letters, 8(1), 015022.
https://doi.org/10.1088/1748-9326/8/1/015022
NOAA. (n.d.). National Weather Service: Weather Conditions for KPHX. Retrieved July
17, 2017, from
http://www.wrh.noaa.gov/mesowest/timeseries.php?sid=KPHX&num=168
Norton, B. A., Coutts, A. M., Livesley, S. J., Harris, R. J., Hunter, A. M., & Williams, N.
S. G. (2015). Planning for cooler cities: A framework to prioritise green
infrastructure to mitigate high temperatures in urban landscapes. Landscape and
Urban Planning, 134, 127–138.
https://doi.org/10.1016/j.landurbplan.2014.10.018
Nottrott, A., Onomura, S., Inagaki, A., Kanda, M., & Kleissl, J. (2011). Convective heat
transfer on leeward building walls in an urban environment: Measurements in an
outdoor scale model. International Journal of Heat and Mass Transfer, 54(15–16),
3128–3138. https://doi.org/10.1016/j.ijheatmasstransfer.2011.04.020
Nowak, D. J., & Dwyer, J. F. (2007). Understanding the benefits and costs of urban forest
ecosystems. In Urban and community forestry in the northeast (pp. 25–46).
102
Springer. Retrieved from http://link.springer.com/chapter/10.1007/978-1-4020-
4289-8_2
Oke, T. R. (1973). City size and the urban heat island. Atmospheric Environment (1967),
7(8), 769–779. https://doi.org/10.1016/0004-6981(73)90140-6
Oke, T. R. (1982). The energetic basis of the urban heat island. Quarterly Journal of the
Royal Meteorological Society, 108(455), 1–24.
https://doi.org/10.1002/qj.49710845502
Oke, T. R. (1992). Boundary layer climates. London; New York: Routledge. Retrieved
from http://public.eblib.com/choice/publicfullrecord.aspx?p=170002
O’Neill, M. S., Carter, R., Kish, J. K., Gronlund, C. J., White-Newsome, J. L., Manarolla,
X., … Schwartz, J. D. (2009). Preventing heat-related morbidity and mortality:
New approaches in a changing climate. Maturitas, 64(2), 98–103.
https://doi.org/10.1016/j.maturitas.2009.08.005
Ooka, R., Chen, H., & Kato, S. (2008). Study on optimum arrangement of trees for
design of pleasant outdoor environment using multi-objective genetic algorithm
and coupled simulation of convection, radiation and conduction. Journal of Wind
Engineering and Industrial Aerodynamics, 96(10–11), 1733–1748.
https://doi.org/10.1016/j.jweia.2008.02.039
Ordóñez, J., Jadraque, E., Alegre, J., & Martínez, G. (2010). Analysis of the photovoltaic
solar energy capacity of residential rooftops in Andalusia (Spain). Renewable and
Sustainable Energy Reviews, 14(7), 2122–2130.
https://doi.org/10.1016/j.rser.2010.01.001
Owen, S. M., MacKenzie, A. R., Stewart, H., Donovan, R., & Hewitt, C. N. (2003).
Biogenic Volatile Organic Compound (VOC) Emission Estimates from an Urban
Tree Canopy. Ecological Applications, 13(4), 927–938.
Pandit, R., & Laband, D. N. (2010). Energy savings from tree shade. Ecological
Economics, 69(6), 1324–1329. https://doi.org/10.1016/j.ecolecon.2010.01.009
Parisi, A. V., Kimlin, M. G., Wong, J. C. F., & Wilson, M. (2000). Diffuse component of
solar ultraviolet radiation in tree shade. Journal of Photochemistry and
Photobiology B: Biology, 54(2–3), 116–120. https://doi.org/10.1016/S1011-
1344(00)00003-8
Park, M., Hagishima, A., Tanimoto, J., & Narita, K. (2012). Effect of urban vegetation on
outdoor thermal environment: Field measurement at a scale model site. Building
and Environment, 56, 38–46. https://doi.org/10.1016/j.buildenv.2012.02.015

103
Pearlmutter, D., Berliner, P., & Shaviv, E. (2005). Evaluation of Urban Surface Energy
Fluxes Using an Open-Air Scale Model. Journal of Applied Meteorology, 44(4),
532–545. https://doi.org/10.1175/JAM2220.1
Pearlmutter, D., Berliner, P., & Shaviv, E. (2006). Physical modeling of pedestrian
energy exchange within the urban canopy. Building and Environment, 41(6), 783–
795. https://doi.org/10.1016/j.buildenv.2005.03.017
Pearlmutter, D., Berliner, P., & Shaviv, E. (2007). Integrated modeling of pedestrian
energy exchange and thermal comfort in urban street canyons. Building and
Environment, 42(6), 2396–2409. https://doi.org/10.1016/j.buildenv.2006.06.006
Pearlmutter, D., Krüger, E. L., & Berliner, P. (2009). The role of evaporation in the
energy balance of an open-air scaled urban surface. International Journal of
Climatology, 29(6), 911–920. https://doi.org/10.1002/joc.1752
Peterson, T. C., & Schmidt, R. A. (1984). Outdoor scale modeling of shrub barriers in
drifting snow. Agricultural and Forest Meteorology, 31(2), 167–181.
https://doi.org/10.1016/0168-1923(84)90018-2
Pidwirny, M. (2006). Earth-Sun Relationships and Insolation. Fundamentals of Physical
Geography, 2.
Podobnikar, T., & Vrečko, A. (2012). Digital Elevation Model from the Best Results of
Different Filtering of a LiDAR Point Cloud. Transactions in GIS, 16(5), 603–617.
https://doi.org/10.1111/j.1467-9671.2012.01335.x
Rahman, M. A., Armson, D., & Ennos, A. R. (2015). A comparison of the growth and
cooling effectiveness of five commonly planted urban tree species. Urban
Ecosystems, 18(2), 371–389. https://doi.org/10.1007/s11252-014-0407-7
Roberts, S. M. (2010). Three-dimensional radiation flux source areas in urban areas.
Retrieved from https://circle.ubc.ca/handle/2429/28541
Robitu, M., Musy, M., Inard, C., & Groleau, D. (2006). Modeling the influence of
vegetation and water pond on urban microclimate. Solar Energy, 80(4), 435–447.
https://doi.org/10.1016/j.solener.2005.06.015
Roy, S., Byrne, J., & Pickering, C. (2012). A systematic quantitative review of urban tree
benefits, costs, and assessment methods across cities in different climatic zones.
Urban Forestry & Urban Greening, 11(4), 351–363.
https://doi.org/10.1016/j.ufug.2012.06.006
Safarzadeh, H., & Bahadori, M. N. (2005). Passive cooling effects of courtyards.
Building and Environment, 40(1), 89–104.
https://doi.org/10.1016/j.buildenv.2004.04.014

104
Sander, H., Polasky, S., & Haight, R. G. (2010). The value of urban tree cover: A hedonic
property price model in Ramsey and Dakota Counties, Minnesota, USA.
Ecological Economics, 69(8), 1646–1656.
https://doi.org/10.1016/j.ecolecon.2010.03.011
Santamouris, M. (2013). Energy and Climate in the Urban Built Environment. Routledge.
Santamouris, M. (2014). Cooling the cities – A review of reflective and green roof
mitigation technologies to fight heat island and improve comfort in urban
environments. Solar Energy, 103, 682–703.
https://doi.org/10.1016/j.solener.2012.07.003
Sarajevs, V. (2011). Health benefits of street trees. The Research Agency of the Forestry
Commission. Retrieved from
http://www.forestry.gov.uk/pdf/Health_Benefits_of_Street_Trees_29June2011.pd
f/$file/Health_Benefits_of_Street_Trees_29June2011.pdf
Sawka, M., Millward, A. A., Mckay, J., & Sarkovich, M. (2013). Growing summer
energy conservation through residential tree planting. Landscape and Urban
Planning, 113, 1–9. https://doi.org/10.1016/j.landurbplan.2013.01.006
Schmid, M.-O., Gubler, S., Fiddes, J., & Gruber, S. (2012). Inferring snowpack ripening
and melt-out from distributed measurements of near-surface ground temperatures.
The Cryosphere, 6(5), 1127–1139. https://doi.org/10.5194/tc-6-1127-2012
Seo, K., Golub, A., & Kuby, M. (2014). Combined impacts of highways and light rail
transit on residential property values: a spatial hedonic price model for Phoenix,
Arizona. Journal of Transport Geography, 41, 53–62.
https://doi.org/10.1016/j.jtrangeo.2014.08.003
Serensits, T. J., McNitt, A. S., & Petrunak, D. M. (2011). Human health issues on
synthetic turf in the USA. Proceedings of the Institution of Mechanical Engineers,
Part P: Journal of Sports Engineering and Technology, 225(3), 139–146.
https://doi.org/10.1177/1754337111398407
Seto, K. C., Fragkias, M., Güneralp, B., & Reilly, M. K. (2011). A Meta-Analysis of
Global Urban Land Expansion. PLOS ONE, 6(8), e23777.
https://doi.org/10.1371/journal.pone.0023777
Shashua-Bar, L., Pearlmutter, D., & Erell, E. (2011). The influence of trees and grass on
outdoor thermal comfort in a hot-arid environment. International Journal of
Climatology, 31(10), 1498–1506. https://doi.org/10.1002/joc.2177
Shaviv, E., & Yezioro, A. (1997). Analyzing mutual shading among buildings. Solar
Energy, 59, 83–88.

105
Simpson, J. R., & McPherson, E. G. (1996). Potential of tree shade for reducing
residential energy use in California. Journal of Arboriculture, 22, 10–18.
Skelhorn, C., Lindley, S., & Levermore, G. (2014). The impact of vegetation types on air
and surface temperatures in a temperate city: A fine scale assessment in
Manchester, UK. Landscape and Urban Planning, 121, 129–140.
https://doi.org/10.1016/j.landurbplan.2013.09.012
Sohrabinia, M., Rack, W., & Zawar-Reza, P. (2012). Analysis of MODIS LST Compared
with WRF Model and in situ Data over the Waimakariri River Basin, Canterbury,
New Zealand. Remote Sensing, 4(12), 3501–3527.
https://doi.org/10.3390/rs4113501
Song, J., & Wang, Z.-H. (2014). Interfacing the Urban Land–Atmosphere System
Through Coupled Urban Canopy and Atmospheric Models. Boundary-Layer
Meteorology, 154(3), 427–448. https://doi.org/10.1007/s10546-014-9980-9
Song, J., & Wang, Z.-H. (2015). Impacts of mesic and xeric urban vegetation on outdoor
thermal comfort and microclimate in Phoenix, AZ. Building and Environment, 94,
Part 2, 558–568. https://doi.org/10.1016/j.buildenv.2015.10.016
Stathopoulos, T., Chiovitti, D., & Dodaro, L. (1994). Wind shielding effects of trees on
low buildings. Building and Environment, 29(2), 141–150.
https://doi.org/10.1016/0360-1323(94)90065-5
Sternberg, T., Viles, H., & Cathersides, A. (2011). Evaluating the role of ivy (Hedera
helix) in moderating wall surface microclimates and contributing to the
bioprotection of historic buildings. Building and Environment, 46(2), 293–297.
https://doi.org/10.1016/j.buildenv.2010.07.017
Taha, H., Sailor, D., & Akbari, H. (1992). High-albedo materials for reducing building
cooling energy use. Lawrence Berkeley Lab., CA (United States). Retrieved from
https://www.osti.gov/scitech/biblio/7000986
Taleghani, M. (2017). Outdoor thermal comfort by different heat mitigation strategies- A
review. Renewable and Sustainable Energy Reviews.
https://doi.org/10.1016/j.rser.2017.06.010
Taleghani, M., Sailor, D. J., Tenpierik, M., & van den Dobbelsteen, A. (2014). Thermal
assessment of heat mitigation strategies: The case of Portland State University,
Oregon, USA. Building and Environment, 73, 138–150.
https://doi.org/10.1016/j.buildenv.2013.12.006
Taleghani, M., Tenpierik, M., van den Dobbelsteen, A., & Sailor, D. J. (2014). Heat
mitigation strategies in winter and summer: Field measurements in temperate
climates. Building and Environment, 81, 309–319.
https://doi.org/10.1016/j.buildenv.2014.07.010
106
Tan, Z., Lau, K. K.-L., & Ng, E. (2015). Urban tree design approaches for mitigating
daytime urban heat island effects in a high-density urban environment. Energy
and Buildings. https://doi.org/10.1016/j.enbuild.2015.06.031
Tan, Z., Lau, K. K.-L., & Ng, E. (2017). Planning strategies for roadside tree planting and
outdoor comfort enhancement in subtropical high-density urban areas. Building
and Environment. https://doi.org/10.1016/j.buildenv.2017.05.017
Thorsson, S., Lindberg, F., Eliasson, I., & Holmer, B. (2007). Different methods for
estimating the mean radiant temperature in an outdoor urban setting. International
Journal of Climatology, 27(14), 1983–1993. https://doi.org/10.1002/joc.1537
Tomlinson, C. J., Chapman, L., Thornes, J. E., & Baker, C. J. (2011). Including the urban
heat island in spatial heat health risk assessment strategies: a case study for
Birmingham, UK. International Journal of Health Geographics, 10(1), 42.
https://doi.org/10.1186/1476-072X-10-42
Tooke, T. R., Coops, N. C., Voogt, J. A., & Meitner, M. J. (2011). Tree structure
influences on rooftop-received solar radiation. Landscape and Urban Planning,
102(2), 73–81. https://doi.org/10.1016/j.landurbplan.2011.03.011
Toregas, C., Swain, R., ReVelle, C., & Bergman, L. (1971). The location of emergency
service facilities. Operations Research, 19(6), 1363–1373.
Troy, A., Morgan Grove, J., & O’Neil-Dunne, J. (2012). The relationship between tree
canopy and crime rates across an urban–rural gradient in the greater Baltimore
region. Landscape and Urban Planning, 106(3), 262–270.
https://doi.org/10.1016/j.landurbplan.2012.03.010
Tzoulas, K., Korpela, K., Venn, S., Yli-Pelkonen, V., Kaźmierczak, A., Niemela, J., &
James, P. (2007). Promoting ecosystem and human health in urban areas using
Green Infrastructure: A literature review. Landscape and Urban Planning, 81(3),
167–178. https://doi.org/10.1016/j.landurbplan.2007.02.001
United Nations. (2014). World urbanization prospects: the 2014 revision (Department of
Economic and Social Affairs, & Population Division).
Upreti, R., Wang, Z.-H., & Yang, J. (2017). Radiative shading effect of urban trees on
cooling the regional built environment. Urban Forestry & Urban Greening, 26,
18–24. https://doi.org/10.1016/j.ufug.2017.05.008
Urban Tree Scientist - Central Arizona–Phoenix Long-Term Ecological Research. (n.d.).
Retrieved June 10, 2016, from
https://sustainability.asu.edu/caplter/collaborations/shadetree/
US Census Bureau. (n.d.). 2010 Demographic Profile Data. Retrieved September 15,
2016, from

107
https://factfinder.census.gov/faces/tableservices/jsf/pages/productview.xhtml?src=
CF
Vanos, J. K., Middel, A., McKercher, G. R., Kuras, E. R., & Ruddell, B. L. (2016). Hot
playgrounds and children’s health: A multiscale analysis of surface temperatures
in Arizona, USA. Landscape and Urban Planning, 146, 29–42.
https://doi.org/10.1016/j.landurbplan.2015.10.007
Villacañas, V., Sánchez-Sánchez, J., García-Unanue, J., López, J., & Gallardo, L. (2017).
The influence of various types of artificial turfs on football fields and their effects
on the thermal profile of surfaces. Proceedings of the Institution of Mechanical
Engineers, Part P: Journal of Sports Engineering and Technology, 231(1), 21–32.
https://doi.org/10.1177/1754337115624819
Wagar, J. A. (1984). Using vegetation to control sunlight and shade on windows.
Landscape Journal, 3(1), 24–35.
Wang, Y., Bakker, F., de Groot, R., Wortche, H., & Leemans, R. (2015). Effects of urban
trees on local outdoor microclimate: synthesizing field measurements by
numerical modelling. Urban Ecosystems, 18(4), 1305–1331.
https://doi.org/10.1007/s11252-015-0447-7
Wang, Z.-H. (2014). Monte Carlo simulations of radiative heat exchange in a street
canyon with trees. Solar Energy, 110, 704–713.
https://doi.org/10.1016/j.solener.2014.10.012
Wang, Z.-H., Zhao, X., Yang, J., & Song, J. (2016). Cooling and energy saving potentials
of shade trees and urban lawns in a desert city. Applied Energy, 161, 437–444.
https://doi.org/10.1016/j.apenergy.2015.10.047
Wentz, E. A., Rode, S., Li, X., Tellman, E. M., & Turner, B. L. (2016). Impact of
Homeowner Association (HOA) landscaping guidelines on residential water use.
Water Resources Research, n/a-n/a. https://doi.org/10.1002/2015WR018238
Wolfe, M. K., & Mennis, J. (2012). Does vegetation encourage or suppress urban crime?
Evidence from Philadelphia, PA. Landscape and Urban Planning, 108(2–4), 112–
122. https://doi.org/10.1016/j.landurbplan.2012.08.006
Wong, N. H., Kwang Tan, A. Y., Chen, Y., Sekar, K., Tan, P. Y., Chan, D., … Wong, N.
C. (2010). Thermal evaluation of vertical greenery systems for building walls.
Building and Environment, 45(3), 663–672.
https://doi.org/10.1016/j.buildenv.2009.08.005
WRCC. (2015). Retrieved July 9, 2017, from https://wrcc.dri.edu/cgi-
bin/cliMAIN.pl?az8499
108
Yang, A.-S., Juan, Y.-H., Wen, C.-Y., & Chang, C.-J. (2017). Numerical simulation of
cooling effect of vegetation enhancement in a subtropical urban park. Applied
Energy, 192, 178–200. https://doi.org/10.1016/j.apenergy.2017.01.079
Yang, J., & Wang, Z.-H. (2015). Optimizing urban irrigation schemes for the trade-off
between energy and water consumption. Energy and Buildings, 107, 335–344.
https://doi.org/10.1016/j.enbuild.2015.08.045
Yang, J., Wang, Z.-H., Georgescu, M., Chen, F., & Tewari, M. (2016). Assessing the
Impact of Enhanced Hydrological Processes on Urban Hydrometeorology with
Application to Two Cities in Contrasting Climates. Journal of Hydrometeorology,
17(4), 1031–1047. https://doi.org/10.1175/JHM-D-15-0112.1
Zhang, Q., & Seto, K. C. (2011). Mapping urbanization dynamics at regional and global
scales using multi-temporal DMSP/OLS nighttime light data. Remote Sensing of
Environment, 115(9), 2320–2329. https://doi.org/10.1016/j.rse.2011.04.032
Zhao, Q., Myint, S. W., Wentz, E. A., & Fan, C. (2015). Rooftop Surface Temperature
Analysis in an Urban Residential Environment. Remote Sensing, 7(9), 12135–
12159. https://doi.org/10.3390/rs70912135
Zhao, Q., & Wentz, E. A. (2016). A MODIS/ASTER Airborne Simulator (MASTER)
Imagery for Urban Heat Island Research. Data, 1(1).
https://doi.org/10.3390/data1010007
Zhao, Q., Wentz, E. A., & Murray, A. T. (2014). Shade Optimization in a Desert
Environment. In Extended Abstract Proceedings of the GIScience 2014 (pp. 118–
121). Retrieved from
https://www.researchgate.net/profile/Qunshan_Zhao/publication/271215424_Sha
de_Optimization_in_a_Desert_Environment/links/54c2c98c0cf256ed5a8f950c.pd
f
Zhao, Q., Wentz, E. A., & Murray, A. T. (2017). Tree shade coverage optimization in an
urban residential environment. Building and Environment, 115, 269–280.
https://doi.org/10.1016/j.buildenv.2017.01.036