Evaluating the Effect on User Perception and Performance of … · learned through diagrams than...
17
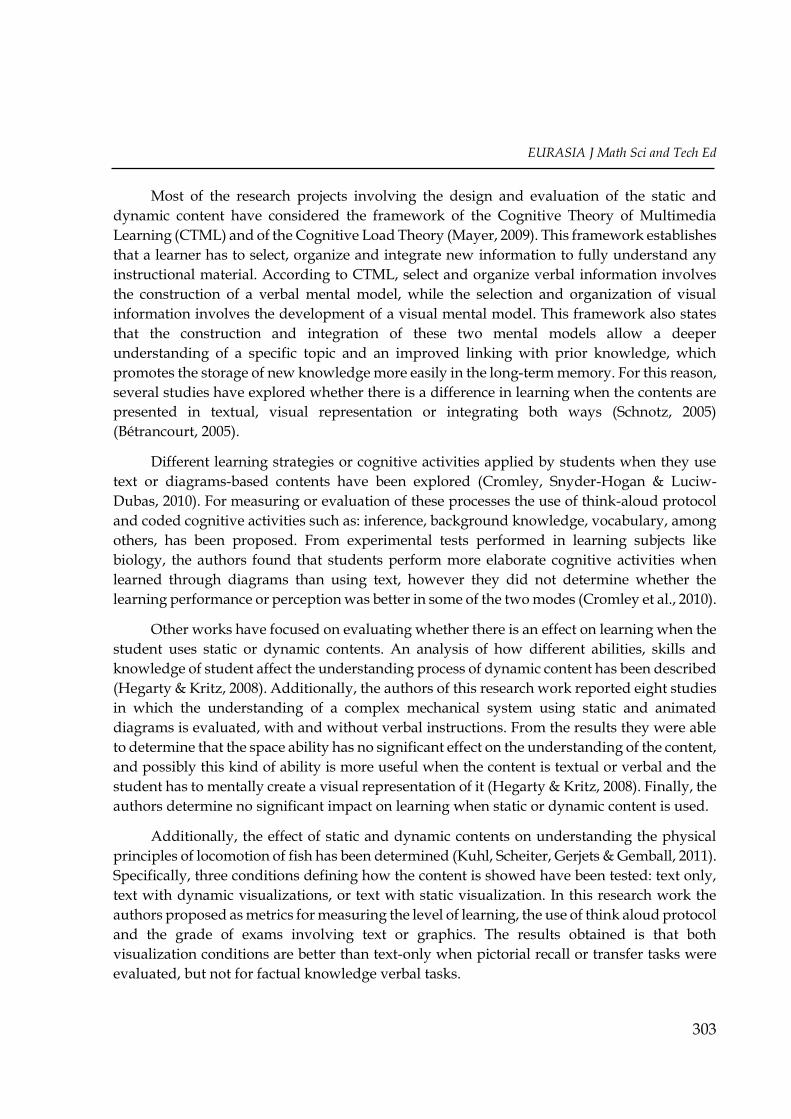
OPEN ACCESS EURASIA Journal of Mathematics Science and Technology Education ISSN 1305-8223 (online) 1305-8215 (print) 2017 13(2):301-317 DOI 10.12973/eurasia.2017.00617a © Authors. Terms and conditions of Creative Commons Attribution 4.0 International (CC BY 4.0) apply. Correspondence: Mauricio Hincapié Montoya, Institución Universitaria Salazar y Herrera, Carrera 70 N° 52-49, Barrio los colores, 0000 Medellín, Colombia [email protected] Evaluating the Effect on User Perception and Performance of Static and Dynamic Contents Deployed in Augmented Reality based Learning Application Mauricio Hincapié Montoya Institución Universitaria Salazar y Herrera, COLOMBIA Christian Andrés Díaz Institución Universitaria Salazar y Herrera, COLOMBIA Gustavo Adolfo Moreno Institución Universitaria Salazar y Herrera, COLOMBIA Received 20 April 2016 - Revised 22 July 2016 - Accepted 17 June 2016 ABSTRACT Nowadays, the use of technology to improve teaching and learning experiences in the classroom has been promoted. One of these technologies is augmented reality, which allows overlaying layers of virtual information on real scene with the aim of increasing the perception that user has of reality. Augmented reality has proved to offer several advantages in the educational context, i.e. increasing learning engagement and increasing understanding of some topics, especially when spatial skills are involved. Contents deployed in an augmented reality application are of two types, static, i.e. text, or dynamic, i.e. animations. As far as we know no research project has assessed how the type of content, static or dynamic, can affect the student learning perception and performance in augmented reality applications. In this article the development and evaluation of an augmented reality application using static and dynamic content is described. In order to determine how the type of content affects the learning perception and performance of the student, two experimental designs in which the student interact with the application, using static and dynamic contents, for learning topics related with an electronic fundamentals course was performed. Keywords: Augmented reality; static and dynamic contents; basics of electronics; engineering teaching INTRODUCTION In recent years, the use of technology to improve teaching and learning experiences in the classroom has been promoted (Kesim & Ozarslan, 2012). One of these technologies is
Transcript of Evaluating the Effect on User Perception and Performance of … · learned through diagrams than...
OPEN ACCESS
EURASIA Journal of Mathematics Science and Technology Education ISSN 1305-8223 (online) 1305-8215 (print)
2017 13(2):301-317 DOI 10.12973/eurasia.2017.00617a
© Authors. Terms and conditions of Creative Commons Attribution 4.0 International (CC BY 4.0) apply.
Correspondence: Mauricio Hincapié Montoya, Institución Universitaria Salazar y Herrera, Carrera 70 N° 52-49,
Barrio los colores, 0000 Medellín, Colombia
Evaluating the Effect on User Perception and Performance
of Static and Dynamic Contents Deployed in Augmented
Reality based Learning Application
Mauricio Hincapié Montoya Institución Universitaria Salazar y Herrera, COLOMBIA
Christian Andrés Díaz Institución Universitaria Salazar y Herrera, COLOMBIA
Gustavo Adolfo Moreno Institución Universitaria Salazar y Herrera, COLOMBIA
Received 20 April 2016 - Revised 22 July 2016 - Accepted 17 June 2016
ABSTRACT
Nowadays, the use of technology to improve teaching and learning experiences in the
classroom has been promoted. One of these technologies is augmented reality, which
allows overlaying layers of virtual information on real scene with the aim of increasing the
perception that user has of reality. Augmented reality has proved to offer several
advantages in the educational context, i.e. increasing learning engagement and increasing
understanding of some topics, especially when spatial skills are involved. Contents
deployed in an augmented reality application are of two types, static, i.e. text, or dynamic,
i.e. animations. As far as we know no research project has assessed how the type of content,
static or dynamic, can affect the student learning perception and performance in
augmented reality applications. In this article the development and evaluation of an
augmented reality application using static and dynamic content is described. In order to
determine how the type of content affects the learning perception and performance of the
student, two experimental designs in which the student interact with the application, using
static and dynamic contents, for learning topics related with an electronic fundamentals
course was performed.
Keywords: Augmented reality; static and dynamic contents; basics of electronics;
engineering teaching
INTRODUCTION
In recent years, the use of technology to improve teaching and learning experiences in the
classroom has been promoted (Kesim & Ozarslan, 2012). One of these technologies is

M. H. Montoya et al.
302
augmented reality, which allows overlaying layers of virtual information on real scene with
the aim of increasing the perception the user has of reality (Azuma et al., 2001). Augmented
reality offers several advantages in the educational context as (Cuendet, Bonnard, Do-Lenh &
Dillengourg, 2013): (i) it has an ability to encourage kinesthetic learning, (ii) it can support
students by inspecting the 3D object or class materials from a variety of different perspectives
or angles to enhance their understanding, (iii) it increases the student level of engagement and
motivation in academic activities, and (iv) it allows to provide contextual information, that is
data about real objects of the scene related with the learning activity. The contents deployed
in an augmented reality application are of two types, static or dynamic (Nincarean, Ali,
Dayana, Abdul & Abdul, 2013). Texts, visual cues or 3D models whose appearance does not
vary during interaction with the user are defined as static contents, besides dynamic contents
vary their appearance during interaction with the user, and animations are an example of
them. Dynamic visualizations such as animations or videos are depictions that change
continuously over time and represent a continuous flow of motion (e.g., of an object), whereas
static visualizations do not show any continuous movement, but only specific states taken
from such a flow of motion (Lowe & Schnotz, 2008). Which type of content must be deployed
in an augmented reality application depends on the topic and the learning experience that will
be provided to the student (Aisnworth, 1999) (Aisnworth, 2006).
State of the literature
Texts, visual cues or 3D models whose appearance does not vary during interaction with the
user are defined as static contents, besides dynamic contents vary their appearance during
interaction with the user, and animations are an example of them.
Several studies have explored whether there is a difference in learning when the contents are
presented in textual, visual representation or integrating both ways.
Most studies comparing different types of contents have been done in multimedia applications.
Other works have focused on evaluating whether there is an effect on learning when the
student uses static or dynamic contents, however, there is not an established definition of
these kinds of contents.
Contribution of this paper to the literature
Two approaches for configuring static and dynamic content in augmented reality applications
are proposed in this article. One based on visual features, i.e. how visualizations are shown as
dynamic and static, supplemented with audio and text, and the interaction done using
common widgets and touchscreen device. In the second approach static and dynamic content
is seen holistically, i.e. considering the visual, interactive and verbal as static or dynamic.
The development and evaluation of augmented reality applications using static and dynamic
content, in order to determine how the type of content affects the learning experience in the
classroom are described.
EURASIA J Math Sci and Tech Ed
303
Most of the research projects involving the design and evaluation of the static and
dynamic content have considered the framework of the Cognitive Theory of Multimedia
Learning (CTML) and of the Cognitive Load Theory (Mayer, 2009). This framework establishes
that a learner has to select, organize and integrate new information to fully understand any
instructional material. According to CTML, select and organize verbal information involves
the construction of a verbal mental model, while the selection and organization of visual
information involves the development of a visual mental model. This framework also states
that the construction and integration of these two mental models allow a deeper
understanding of a specific topic and an improved linking with prior knowledge, which
promotes the storage of new knowledge more easily in the long-term memory. For this reason,
several studies have explored whether there is a difference in learning when the contents are
presented in textual, visual representation or integrating both ways (Schnotz, 2005)
(Bétrancourt, 2005).
Different learning strategies or cognitive activities applied by students when they use
text or diagrams-based contents have been explored (Cromley, Snyder-Hogan & Luciw-
Dubas, 2010). For measuring or evaluation of these processes the use of think-aloud protocol
and coded cognitive activities such as: inference, background knowledge, vocabulary, among
others, has been proposed. From experimental tests performed in learning subjects like
biology, the authors found that students perform more elaborate cognitive activities when
learned through diagrams than using text, however they did not determine whether the
learning performance or perception was better in some of the two modes (Cromley et al., 2010).
Other works have focused on evaluating whether there is an effect on learning when the
student uses static or dynamic contents. An analysis of how different abilities, skills and
knowledge of student affect the understanding process of dynamic content has been described
(Hegarty & Kritz, 2008). Additionally, the authors of this research work reported eight studies
in which the understanding of a complex mechanical system using static and animated
diagrams is evaluated, with and without verbal instructions. From the results they were able
to determine that the space ability has no significant effect on the understanding of the content,
and possibly this kind of ability is more useful when the content is textual or verbal and the
student has to mentally create a visual representation of it (Hegarty & Kritz, 2008). Finally, the
authors determine no significant impact on learning when static or dynamic content is used.
Additionally, the effect of static and dynamic contents on understanding the physical
principles of locomotion of fish has been determined (Kuhl, Scheiter, Gerjets & Gemball, 2011).
Specifically, three conditions defining how the content is showed have been tested: text only,
text with dynamic visualizations, or text with static visualization. In this research work the
authors proposed as metrics for measuring the level of learning, the use of think aloud protocol
and the grade of exams involving text or graphics. The results obtained is that both
visualization conditions are better than text-only when pictorial recall or transfer tasks were
evaluated, but not for factual knowledge verbal tasks.

M. H. Montoya et al.
304
As far as we know no research project has assessed how the type of content, static or
dynamic, can affect the student learning performance and perception when this content is
deployed using augmented reality. In this article the development and evaluation of
augmented reality applications using static and dynamic content, in order to determine how
the type of content affects the learning performance and perception in the classroom are
described. For this purpose an augmented reality application that uses pictures as landmarks
for deploying the virtual contents was developed. The contents deployed by the application
are static or dynamic, including text, images, videos, 3D models and animations. The
augmented reality application is executed in mobile devices for its use in the classroom, and
the user interaction is based on the touch screen of the device. In order to determine how the
type of content affects the learning experience of the student, two experimental designs in
which several students learn topics related with an electronic fundamentals course, using two
approaches for configuring static and dynamic contents was performed. This article is an
extension of the results reported in (Diaz, Hincapié & Moreno, 2015). Table 1 summarizes the
research works that have evaluated how different types of contents impact the learning
performance and perception.
Table 1. List comparing the topics addressed by the related works.
Research work Text-based
content
Static visual-
based content
Text and
visual-based
content
Dynamic
Content
Augmented
Reality
Applications
Schnotz, 2005 X X Bétrancourt, 2005 X X Lowe & Schnotz,
2008
X X
Cromley, Snyder-
Hogan & Luciw-
Dubas, 2010
X
Cromley et al.,
2010
X X X
Hegarty & Kritz,
2008
X X
Kuhl, Scheiter,
Gerjets & Gemball,
2011
X X
Diaz, Hincapié &
Moreno, 2015
X X X X X
Diaz & Hincapié,
2016
X X X X X
The rest of the paper is structured in the following way. The design of the content and
the augmented reality application developed is described in first section. The experimental
design performed in order to determine the level of learning achieved using the augmented
reality application and using different types of contents is reported in second section. Finally,
in the last Section, conclusions and future work will be explained.

EURASIA J Math Sci and Tech Ed
305
Description of the learning content and the augmented reality application
The topics learned through the use of the application, the features of the contents and
the augmented reality application developed are described in this section. It is worth
mentioning that the development of these components was necessary to perform an
experimental test in order to determine whether there are differences in learning when static
and dynamic content are used in an augmented reality application.
Learning topics and contents.
The course chosen for developing the educational content was fundamentals of
electronics, and the topics selected, based on the curriculum of the course, to be included in
the augmented reality content and application were:
The atom and its structure: basic concepts of the atom and its function are
described in this field, including the major components of its structure, i.e.
electrons, protons, neutrons, layers and sub layers are described.
Charge and discharge phenomenon: how electrons are released from an atom
of a specific material to produce the occurrence of the electrical phenomena as
the current, is described in this topic.
Current, voltage and resistance: the physical principles of current, voltage and
resistance phenomena are described. How they are produced, how they are
measured and which factors influence its magnitude.
Battery and generator: In this last topic the chemical and physical principles
describing how the electrical energy is produced in a battery and generator are
described.
From these topics and considering the learning objectives in each of the themes defined
by the course, the next step was the development of the four educational contents that could
be deployed in an augmented reality application. In Figure 1 the four content developed for
each of the topics can be observed. The content used to teach the topic titled the atom and its
structured can be observed in Figure 1a. This content was developed as a static 3D model of
the atom where each one of its structures can be visualized. An example of the content used
to teach the third topic, in this case the voltage can be observed in Figure 1b. For the third
topic, different animations including elements such as arrows, dots and a character
representing electrons were used, so this content is dynamic. For each of the concepts taught
in this topic, i.e. current, voltage and resistance, a different animation was developed. The
content developed for teaching the topic charge and discharge phenomenon can be observed
in Figure 1c. This content consists in an animation in which how the electrons are separated
from the atoms and became free electrons is described. Finally, the content describing the basic
functionality of a battery and generator can be observed in Figure 1d. This content consists of
an animation describing how the chemical or mechanical phenomena produce electrical
energy, for the battery and generator, respectively.

M. H. Montoya et al.
306
Figure 1. Contents for learning the three topics included in the experimental design: (a) atom and
structure; (b) voltage, current and resistance; (c) charge and discharge phenomenon; (d) functional
description of battery and generator.
Two approaches for configuring static and dynamic content in augmented reality
applications are proposed in this article. One based on visual features, i.e. how visualizations
are shown as dynamic and static, supplemented with audio and text, and the interaction done
using common widgets and touchscreen device. In this first approach the visualization is a 3D
model defined as a static content or 3D animation defined as a dynamic content. This first
approach is similar to that proposed in the state of the art in other kind of applications. The
second approach is based on the experimental results obtained using the first proposal. In this
approach static and dynamic content is seen holistically, i.e. considering the visual, interactive
and verbal as static or dynamic. Table 2 shows the configuration differences between static
and dynamic content proposed for the first and second approach.

EURASIA J Math Sci and Tech Ed
307
Table 2. Description of the two approximations proposed for defining statics and dynamic contents.
Approach Type of Content Sensorial Channel
Interaction* Visual Verbal
First approach:
Visual based
content
Static Non animated 3D
models
Text and audio based
description of the
content
Highlighting of different parts
of the models using widgets,
such as radio buttons.
Dynamic Animated 3D
models
Text and audio
description of the
content
Highlighting of different parts
of the models using widgets,
such as radio buttons.
Second
approach:
Integral based
content
Static Non animated 3D
models
Text-based
description of the
content
Forwarding of text description
using widgets, such as buttons.
Dynamic Animated 3D
models
Audio-based
description of the
content
Selectable labels in the 3D
model for activate the audio
based description.
* All approaches allow the change of the point of view of the visualization changing the camera position of the
mobile device regarding the position of the target.
Augmented Reality Application.
The augmented reality application was designed and developed to be deployed on a
mobile device. For the development of the application two tools were used: (i) Vuforia and (ii)
Unity3D. Vuforia is a framework that provides functionalities for the development of
augmented reality applications on mobile using as targets or patterns, images or objects
(Grubert & Grasset, 2013) (Cushnan & El-Habbak, 2013). In the case of our application two
images were used as targets, one of which allows displaying the first and second content and
the other allows displaying the third and fourth content. For the development and deployment
of the application to the mobile device Unity3D is used. Unity3D is a game engine that can be
integrated with Vuforia allowing the development of augmented reality applications
(Hocking, 2015) (Murray, 2014). Using the functionalities provided by Unity3D: (i) the static
and dynamic content were associated to the targets, and (ii) the user interface was created
consisting of toggle buttons for the first approach or ray casting collision with labels for the
second approach, that allowed the student interacting with the content, displaying texts and
reproducing explanatory audios and 3D visualizations. For example, through a set of toggle
buttons the student can chose a structure of the atom, and the application displays and
explains the structure, changing the static or dynamic content, and the audio and text shown.
The augmented reality application deployed on the mobile device can be observed in Figure
2.
Each one of the software components implemented in the augmented reality application
is shown in Figure 3. Two computing nodes are observed in the figure, the mobile device and
the web server. Software components that allow graphical and interactive deployment of
augmented reality content are executed in the mobile device node. The content manager
component allows the management of different types of static and dynamic content, through

M. H. Montoya et al.
308
a file in XML format that describes the content. This component uses Unity3D functionality
for visual displaying of content using the graphic engine and Vuforia SDK for augmented
reality implementation. The interaction manager component allows the use of different forms
of interaction with content such as the use of widgets using the touchscreen or selection of 3D
parts using raycasting collision detection model. For storage of resources that are part of the
static and dynamic content, the application uses obj files for 3D models and animations, mp3
for audio and rtf files for textual description. These resources are handled through the
database content. The web service manager allows getting access to stored resources through
JSON protocol.
Figure 2. Student interacting with the augmented reality application developed.
Figure 3. Deployment diagram of the augmented reality application proposed.

EURASIA J Math Sci and Tech Ed
309
Evaluation and Experimental Test
In this section the design and development of two experimental tests to determine if
there is a significant difference in learning performance and perception achieved by a group
of students using a dynamic and static content are described. Unlike other research performed
and reported in the state of the art, two types of content using an augmented reality application
and complementing the visualization using text and audio are evaluated in this paper. For
each experimental design the first and second approaches described in Table 2 are evaluated
and the learning perception and performance resulted from each one is measured.
Experimental Design
Sixteen students took part of the first experimental test. The average age of the group of
students tested is twenty years. Sixty percent of the students are men and forty percent are
women. None of the students had prior knowledge on the topics taught and evaluated, nor
experience in the use of augmented reality applications. Twenty-five students took part of the
second experimental test. The average age of the group of students tested is twenty-three
years. Forty eight percent of the students are men and fifty two percent are women. As in the
first experimental test none of the students had prior knowledge on the topics taught and
evaluated, nor experience in the use of augmented reality applications. The experimental test
performed by the students, using the first and second approaches, was composed of four major
steps:
1. Pre-test: the first step of both experimental tests was to make a pre-test in which
students' prior knowledge is assessed in the subject taught by the augmented reality
application. This pre-test consisted of six questions, where four of them were multiple choice
text-based questions and two of them were questions based on visualizations.
2. Interaction with the augmented reality application using static and dynamic contents:
once the students made the pre-test, a brief explanation about how augmented reality works
using image targets and how is possible to interact with the static and dynamic contents
through the touch screen was performed. The hardware used for deploying the application
was a smart phone Galaxy S5 and a tablet Asus. Each device had a set of headphones to listen
clearly the audio explaining the topics depending whether the first or second approach was
evaluated. Students had in total a maximum of 10 minutes to interact with the application. The
students involved with the first experiment use the first approach proposed of static and
dynamic content and the students involved with the second experiment use the second
approach described in Table 2.
3. Post-test: The third step consisted of making a post-test to determine how much each
student learned about each of the topics taught by the application. Like the pre-test, the post-
test consisted of six questions, three of them text-based and three of them based on
visualizations.

M. H. Montoya et al.
310
4. Survey: Finally, the experimental test concluded when the student performed a
survey, based on likert scale question, to assess her/his perception of the learning process and
the interaction with augmented reality application during the experiment.
Results
The results obtained from both experimental tests performed are of two types: (i) the
learning performance achieved by the students and (ii) the perception of the students
considering the learning experience. In the first of them the learning performance achieved by
students using the augmented reality application is characterized. Figure 4 and Figure 5 shows
the comparison between the grade obtained by the students when they performed the pre-test
and the post-test and used the first and second dynamic and static content approach,
respectively.
Comparison of the grade for each student using the first approach
Figure 4. Plot comparing the grade obtained in the pre-test and post-test by each one of the students
using the first static and dynamic content approach.
Comparison of the grade for each student using the second approach
Figure 5. Plot comparing the grade obtained in the pre-test and post-test by each one of the students
using the second static and dynamic content approach.

EURASIA J Math Sci and Tech Ed
311
The increment in the grade between the pre-test and post-test, discriminating questions for the type of content being evaluated either static or dynamic using the first and second approach proposed, achieved by the students can be observed in Figure 6 and Figure 7, respectively. As mentioned above three questions was used to evaluate the topics learned by the static content and other three questions was used to evaluate the topics learned by the dynamic content, the total amount of question of the test was of six, with a maximum grade by question of one.
Comparison of the grade obtained by students using the first approach of
dynamic and static contents
Figure 6. Plot comparing the increment of the grade obtained by each student when first approach of
static and dynamic contents was used.
Comparison of the grade obtained by students using the second approach of
dynamic and static contents
Figure 7. Plot comparing the increment of the grade obtained by each student when second approach
of static and dynamic contents was used.
M. H. Montoya et al.
312
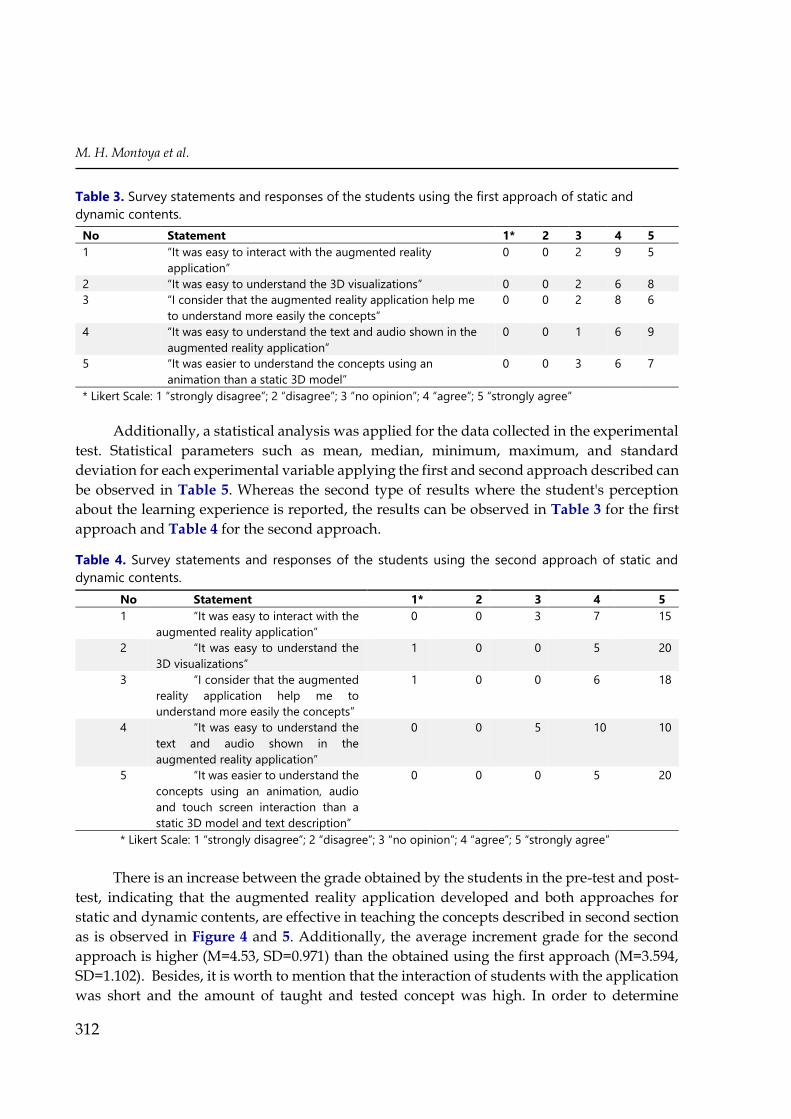
Table 3. Survey statements and responses of the students using the first approach of static and
dynamic contents.
No Statement 1* 2 3 4 5
1 “It was easy to interact with the augmented reality
application”
0 0 2 9 5
2 “It was easy to understand the 3D visualizations” 0 0 2 6 8
3 “I consider that the augmented reality application help me
to understand more easily the concepts”
0 0 2 8 6
4 “It was easy to understand the text and audio shown in the
augmented reality application”
0 0 1 6 9
5 “It was easier to understand the concepts using an
animation than a static 3D model”
0 0 3 6 7
* Likert Scale: 1 “strongly disagree”; 2 “disagree”; 3 “no opinion”; 4 “agree”; 5 “strongly agree”
Additionally, a statistical analysis was applied for the data collected in the experimental
test. Statistical parameters such as mean, median, minimum, maximum, and standard
deviation for each experimental variable applying the first and second approach described can
be observed in Table 5. Whereas the second type of results where the student's perception
about the learning experience is reported, the results can be observed in Table 3 for the first
approach and Table 4 for the second approach.
Table 4. Survey statements and responses of the students using the second approach of static and
dynamic contents.
No Statement 1* 2 3 4 5
1 “It was easy to interact with the
augmented reality application”
0 0 3 7 15
2 “It was easy to understand the
3D visualizations”
1 0 0 5 20
3 “I consider that the augmented
reality application help me to
understand more easily the concepts”
1 0 0 6 18
4 “It was easy to understand the
text and audio shown in the
augmented reality application”
0 0 5 10 10
5 “It was easier to understand the
concepts using an animation, audio
and touch screen interaction than a
static 3D model and text description”
0 0 0 5 20
* Likert Scale: 1 “strongly disagree”; 2 “disagree”; 3 “no opinion”; 4 “agree”; 5 “strongly agree”
There is an increase between the grade obtained by the students in the pre-test and post-
test, indicating that the augmented reality application developed and both approaches for
static and dynamic contents, are effective in teaching the concepts described in second section
as is observed in Figure 4 and 5. Additionally, the average increment grade for the second
approach is higher (M=4.53, SD=0.971) than the obtained using the first approach (M=3.594,
SD=1.102). Besides, it is worth to mention that the interaction of students with the application
was short and the amount of taught and tested concept was high. In order to determine

EURASIA J Math Sci and Tech Ed
313
whether there is a significant increase between the grade obtained by the students in the pre-
test and post-test for each approach, a statistical hypothesis test was applied. For first and
second approaches a Shapiro test was applied for determining whether the samples came from
a normally distributed population. The p-values computed for the variables 𝐹𝐴𝑝𝑟, 𝐹𝐴𝑝𝑜, 𝑆𝐴𝑝𝑟,
and 𝑆𝐴𝑝𝑜 were respectively 0.0018, 0.003, 0.022, and 8x10⁻⁵. These p-values suggest, with a
confidence interval of 95 %, that the variables do not have a normal distribution. For this
reason a paired Wilcoxon test was applied for each approach in order to determine whether
there is a significant increase between the grade obtained by the students in the pre-test and
post-test. The p-values computed for the first approach and second approach are 4.6 x 10⁻⁴ and
1.199 x 10⁻⁵, respectively. These p-values suggest, with a confidence interval of 95 %, that the
grades obtained by students in the pre-test and post-test are not similar for both cases, first
and second approach. Also, the differences in the mean grades values suggest (see Table 5)
that when students interact with the augmented reality application using both approaches,
there is an increase, among the pre-test and post-test.
Table 5. Statistical Analysis for each one of the variables measured in the two experimental tests.
Abbreviation Variable Min Max Mean Median St. Dev.
Pre-test grade using FA* 0.0 3.25 0.7031 0.5 0.8622
Post-test grade using FA 3.0 5.0 4.297 4.0 0.690
Pre-test grade using SA* 0.0 3.0 0.94 1.0 0.820
Post-test grade using SA 4.0 6.0 5.47 6.0 0.674
Grade Increment for static content
using FA 0 2 1.359 1.5 0.6829
Grade Increment for dynamic
content using FA 1.0 3.0 2.234 2.0 0.760
Grade Increment for static content
using SA 0.5 3 1.73 2 0.6919
Grade Increment for dynamic
content using SA 1.25 3 2.80 3 0.4448
Difference in pre-test and
post-test grade using the FA 1.750 5 3.594 4 1.102
Difference in pre-test and
post-test grade using the SA 2.25 6 4.53 5 0.971
*FA is the abbreviation of first approach and SA is the abbreviation of second approach
Regarding Figure 6 and 7, although the increment in the grade is not as significant as in
Figure 4 and 5, we can observe that in most cases (11 students for the first approach and 23 for
the second approach), the grade obtained by the students when they learned using dynamic
content is greater than when they learned using static content. In order to determine whether
there is a significant increase between the grade obtained by the students using a static and
dynamic content using both approaches, a statistical hypothesis test was applied. For the static
and dynamic content using each approach a Shapiro test was applied for determining whether
the samples came from a normally distributed population, the p-values obtained for the
variables 𝐹𝐴𝑠𝑐, 𝐹𝐴𝑑𝑐, 𝑆𝐴𝑠𝑐, and 𝑆𝐴𝑑𝑐 were 0.013, 0.00406, 0.2071, and 7.887 x 10⁻⁸, respectively.

M. H. Montoya et al.
314
These p-values suggest, with a confidence interval of 95 %, that the variables 𝐹𝐴𝑠𝑐, 𝐹𝐴𝑑𝑐, and
𝑆𝐴𝑑𝑐 do not have a normal distribution, but the variable 𝑆𝐴𝑠𝑐 has. For this reason a paired
Wilcoxon test was applied in order to determine whether there is a significant difference
between the grades obtained using static and dynamic content, applying both approaches. The
p-value computed for comparing static and dynamic content using the first approach is
0.00566 and for comparing static and dynamic content using the second approach is 2.586 x 10-
5. These p-values suggest, with a confidence interval of 95 %, that the grades obtained by
students using static and dynamic content are not similar for both cases first and second
approaches. Besides, the differences in the mean values (see Table 5) of the variables suggest
that the increase in the grade cause by the dynamic content is higher (M=2.234, SD=0.760 for
first approach and M=2.80, SD=0.4448 for second approach) than the increase in the grade
cause by the static content (M=1.359, SD=0.6829 for first approach and M=1.73, SD=0.6919 for
second approach). This affirmation may contradict what it is reported in the literature where
the authors have compared static and dynamic visualizations, but our approach is different
because it uses augmented reality and complements the visualization using audio and text in
the first approach, and in the second approach uses an integral dynamic content proposal in
which the visual, verbal and interaction is dynamic.
In a similar way, another hypothesis test was applied in order to determine whether
there is a difference between the grade increased by applying the static content using the first
approach or the static content using the second approach. As was mentioned in the above
paragraph the samples expressed by the variable 𝐹𝐴𝑠𝑐 does not have a normal distribution and
the variable 𝑆𝐴𝑠𝑐 has a normal distribution. For this reason a Mann-Whitney U test was applied
in order to determine whether there is a significant difference between the grade the grade
increased by applying the static content using the first approach or the static content using the
second approach. The p-value computed for comparing static content using the first approach
is 0.1774. This p-value suggests with a confidence interval of 95 %, that the increase in the
grades obtained by students when they use static content are similar for both cases first and
second approaches. In contrast, the same test was applied in order to determine whether there
is a difference between the grade increased by applying the dynamic content using first or the
static content using the second approach. In this case, the p-value computed for comparing the
grade obtained when dynamic content is applied using the first and second approaches is
0.006712. This p-value suggests with a confidence interval of 95 %, that the increase in the
grades obtained by students when they use dynamic content is not similar. Moreover, the
differences in the mean values (see Table 5) of variables 𝐹𝐴𝑑𝑐 and 𝑆𝐴𝑑𝑐 suggest that the
increase in the grade cause by the dynamic content in the first approach is higher than the
increase in the grade cause by the dynamic content in the second approach.
As a final test, the comparison of the impact of first and second approaches on student
performance was proposed. In this case, two new variables were computed using the grades
obtained by the students in the pre-test and post-test for each approach (see Table 5). Equation
1 and 2 expresses the variables computed.

EURASIA J Math Sci and Tech Ed
315
𝐹𝐴𝐷𝑖𝑓𝑓 = 𝐹𝐴𝑝𝑜 − 𝐹𝐴𝑝𝑟 (1)
𝑆𝐴𝐷𝑖𝑓𝑓 = 𝑆𝐴𝑝𝑜 − 𝑆𝐴𝑝𝑟 (2)
For each variable a Shapiro test was applied for determining whether the sample came
from a normally distributed population. The p-values computed for the variables 𝐹𝐴𝐷𝑖𝑓𝑓 and
𝑆𝐴𝐷𝑖𝑓𝑓 were respectively 0.0689, and 0.1930. These p-values suggest, with a confidence interval
of 95 %, that 𝐹𝐴𝐷𝑖𝑓𝑓 and 𝑆𝐴𝐷𝑖𝑓𝑓 have a normal distribution. For this reason a t-student test was
applied in order to determine whether there is a significant increase between the grade
obtained by the students using the first approach and the second approach proposed. The p-
value obtained is 0.095. This p-value suggest, with a confidence interval of 95 %, that the
increase in the grade after using the augmented reality application applying the first approach
is not similar to those using the augmented reality application applying the second approach.
Besides, the differences in the mean of 𝐹𝐴𝐷𝑖𝑓𝑓 and 𝑆𝐴𝐷𝑖𝑓𝑓 variables suggest (see Table 5) that
when students interact with the augmented reality application applying the second approach,
there is a higher increase in the grade than the student interact with the augmented reality
application applying the second approach.
Finally, considering Table 3 and 4, the most important thing that it can be stand out is
that students feel dynamic content helped her/him understanding the concepts more easily.
This would strengthen the affirmation proposed in the previous point. Additionally,
considering two of the questions, number 3 and 5, a higher percentage of students using the
second approach, 96% for third question and 100% for fifth question, than the percentage using
the first approach, 87.5% for the third question and 81.25% for fifth question, are agree about
the benefits of augmented reality and dynamic contents.
CONCLUSION
The design and development of an augmented reality application that allows teaching
basic concepts of the electronic fundamentals course, using two approaches for configuring
static and dynamic contents is described in this article. Additionally, the design and results of
two experimental test performed for determining if there is a difference in the performance
and perception of the learning experience of students, when static and dynamic content is used
in an augmented reality application, is reported.
From the results can be concluded that the augmented reality application using the two
approaches for configuring dynamic and static contents are effective for teaching concepts of
the fundamentals of electronics course. Additionally, it can be observed that there is a
difference in the learning performance of students when they use dynamic contents, besides
better results were obtained using the second approach.
On the other side, the perception of students is that learning the concepts is more easily
when they use dynamic contents than when they use static ones. Additionally, a major
percentage of students consider that it is easier to understand the concepts using the second
M. H. Montoya et al.
316
approach than using the first approach. This last conclusion is affirmed by the performance
results obtained.
From these findings the development and use of the application to the full course of
fundamentals of electronics is proposed. Additionally, the integration of the application with
the curriculum and its evaluation during the whole course in order to define the impact of
static and dynamic contents is defined as future work.
ACKNOWLEDGEMENTS
The current study is part of a larger research project called “Smart room: System for measuring
elements associated with the quality of learning strategies and improving the pedagogical
process in the classroom” with code 709 funded by the institutional call of the Institución
Universitaria Salazar y Herrera (funding period: 20015).
REFERENCES
Ainsworth S. (1999). The functions of multiple representations. Computers & Education, 33(2-3), 131–152.
Ainsworth S. DeFT (2006). A conceptual framework for considering learning with multiple representations. Learning and Instruction, 16, 183–198.
Azuma R, Baillot Y, Behringer R, Feiner S, Julier S, MacIntyre B. (2001). Recent advances in augmented reality. IEEE Computer Graphics and Applications, 21, 34–47.
Bétrancourt M. (2005). The animation and interactivity principles in multimedia learning. The Cambridge handbook of multimedia learning. Cambridge University Press, 287–296.
Cromley J, Snyder-Hogan L, Luciw-Dubas U. (2010). Cognitive activities in complex science text and diagrams. Contemporary Educational Psychology, 35(1), 59 -74.
Cuendet S, Bonnard Q, Do-Lenh S, Dillengourg P. (2013). Designing augmented reality for the classroom. Computer & Education, 68, 557-569.
Cushnan, D., El-Habbak, H. (2013). Developing AR Games for iOS and Android, Packt Publishing.
Diaz, C., Hincapié, M., Moreno, G. How the type of content in educative augmented reality application affects the learning experience. In Procedia Computer Science: 2015 International Conference Virtual and Augmented Reality in Education, Volume 75, pp. 205-212, 2015.
Grubert, J., Grasset, R. (2013). Augmented Reality for Android Application Development, Packt Publishing.
Hegarty M, Kritz S. (2008). Effects of knowledge and spatial ability on learning from animation. Learning with animation: Research implications for design, pp. 3 – 29.
Hocking, J. (2015). Unity in Action: Multiplatform Game Development in C# with Unity 5 (1st Edition), Manning Publications.
Kesim M, Ozarslan Y. (2012). Augmented reality in education: current technologies and the potential for education. Procedia – Social and Behavioral Sciences, 47, 207 – 302.
Kuhl T, Scheiter K, Gerjets P, Gemballa S. (2011). Can differences in learning strategies explain the benefits of learning from static and dynamic visualizations? Computers & Education, 56, 176-187.
Lowe R, Schnotz W. (2008). A unified view of learning from animated and static graphics. In Learning with animation: Research implications for design, ed. Richard Lowe and Wolfgang Schnotz, pp. 304 – 356, Cambridge University Press.
Mayer, R. (2009). Multimedia learning (2nd ed.), Cambridge University Press.

EURASIA J Math Sci and Tech Ed
317
Murray, J. (2014). C# Game Programming Cookbook for Unity 3D, CRC Press.
Nincarean D, Ali M, Dayana N, Abdul N, Abdul M. (2013). Mobile Augmented Reality: the potential for education. Procedia – Social and Behavioral Sciences, 103, pp. 657 – 664.
Schnotz W. (2005). An integrated model of text and picture comprehension. The Cambridge handbook of multimedia learning, Cambridge University Press, pp. 49–69.
http://iserjournals.com/journals/eurasia