Competing with Other States: Evaluating Iowa Business Tax ...
Upload
truongtuongCategory
view
220download
4
1
Evaluating Tax Rebates for Hybrid Vehicles♦♦♦♦
Ambarish Chandra, Sumeet Gulati, and Milind Kandlikar ♣
Preliminary and Incomplete – Please do not quote.
Abstract: In this paper we use data on car sales by model across Canadian Provinces to estimate the effect of provincial tax rebates for hybrid electric vehicles. We ask two questions: what is the effect of the tax rebate on the sales of hybrids? And secondly, which vehicles do consumers forgo in response to the tax incentive? Our results indicate that tax rebates had a large and significant effect on raising the market share of hybrid electric vehicles. We also find that Intermediate cars and Intermediate Sports Utilities experience a significant loss in market share associated with the rebate. We use this information to estimate fuel savings associated with the rebate.
JEL Codes: Q52, Q54, Q58.
♦ The authors would like to thank Maximilian Auffhammer, Kathy Baylis, Severin Bornstein, Linda Fernandez, Keith Head, and participants at the 10th Occasional Conference in Environmental Economics at the University of California, Santa Barbara in March 2008 for comments. All errors are ours alone. ♣ Ambarish is at the Sauder School of Business, Sumeet is at Food and Resource Economics, and Milind is at the Institute for Asian Research, all at the University of British Columbia. Please address all correspondence to Sumeet Gulati, Food and Resource Economics, University of British Columbia, Vancouver, BC, V6T 1Z4, Email: [email protected], Phone: 604-822-2144, Fax: 604-822-2184.
2
Introduction
Concerns about global warming and energy security have triggered numerous government incentives
aimed at increasing the sales of fuel efficient cars. Federal and local governments across the United
States of America and Canada have also demonstrated a particular preference for Hybrid Electric Vehicles
(HEV’s) in the broader subset of fuel efficient technologies.
The US federal government introduced personal income tax credits for hybrid vehicles in the year
2005 and by the year 2007 thirteen state governments had implemented tax incentives for the purchase of
HEV’s. In Canada, the province of British Columbia implemented the first provincial sales tax rebate
encouraging the sale of HEVs. By 2006 five other provinces (of a total of ten) had implemented similar
sales tax rebates. In 2007 the federal government announced a two year eco-auto program encouraging
the sales of fuel efficient and alternative fuel cars through cash rebates.
In this paper we evaluate the cost effectiveness of provincial tax rebates aimed at encouraging
hybrid electric vehicles purchases in Canada. Our approach involves two steps. In the first step we ask
two questions. What is the effect of this rebate on the sales of hybrid electric vehicles? And which
vehicles do consumers forgo in response to the rebate? In the second step we use the estimates from the
first step and combine it with information on the fuel economy of targeted and forgone vehicles. This
gives us an estimate of fuel saved due to the rebate. Finally we combine this estimate with the total outlay
paid to those receiving the rebate and construct a cost per ton of carbon equivalent emissions reduced.
We use annual vehicle sales data for each model sold in the ten provinces of Canada from 1989 to
2006. We are able to estimate the impact of rebates on the sales of HEV’s and other vehicles by
exploiting variation in the rebates over province, time and individual vehicle models. While different
provinces implemented different levels of rebates at different times, some provinces also varied the value
of rebate offered during the period of our analysis (see Table 4 for more information). In addition, as all
3
these rebates were a reduction or waiver of the provincial sales tax they also vary across HEV models due
to price differences.
Our results indicate that a 1000 dollar increase in the rebate increases the market share of hybrid
cars by 28-32%. In 2005 the share of hybrid vehicles in total light vehicle sales in Canada was 0.35%.
We also find that while buying more hybrids consumers shifted away from intermediate passenger cars,
and intermediate SUV’s (classifications defined by the automotive industry in Canada). This is probably
because a majority of the hybrid passenger cars (the Honda Civic Hybrid, Toyota Prius and the Toyota
Camry Hybrid) available in the Canadian market are priced roughly in the range of the intermediate
passenger car. In addition, many of these hybrid cars also belong to the category and offer characteristics
that are similar to other intermediate passenger cars. Thus consumers who buy the hybrid vehicle are
likely to substitute it for a vehicle that costs approximately the same and offers them comparable vehicle
characteristics. A similar argument holds when we consider the fact that hybrid SUV’s are priced
approximately in the range of intermediate SUV’s.
We find that the average vehicle in other classes do not see a statistically significant reduction in
sales from the introduction of these policies. These results indicate that hybrid tax incentives may not be
the most effective way to encourage people to switch away from fuel inefficient vehicles like large
SUV’s, or luxury and sport passenger cars at least in the short or medium run. This might change as
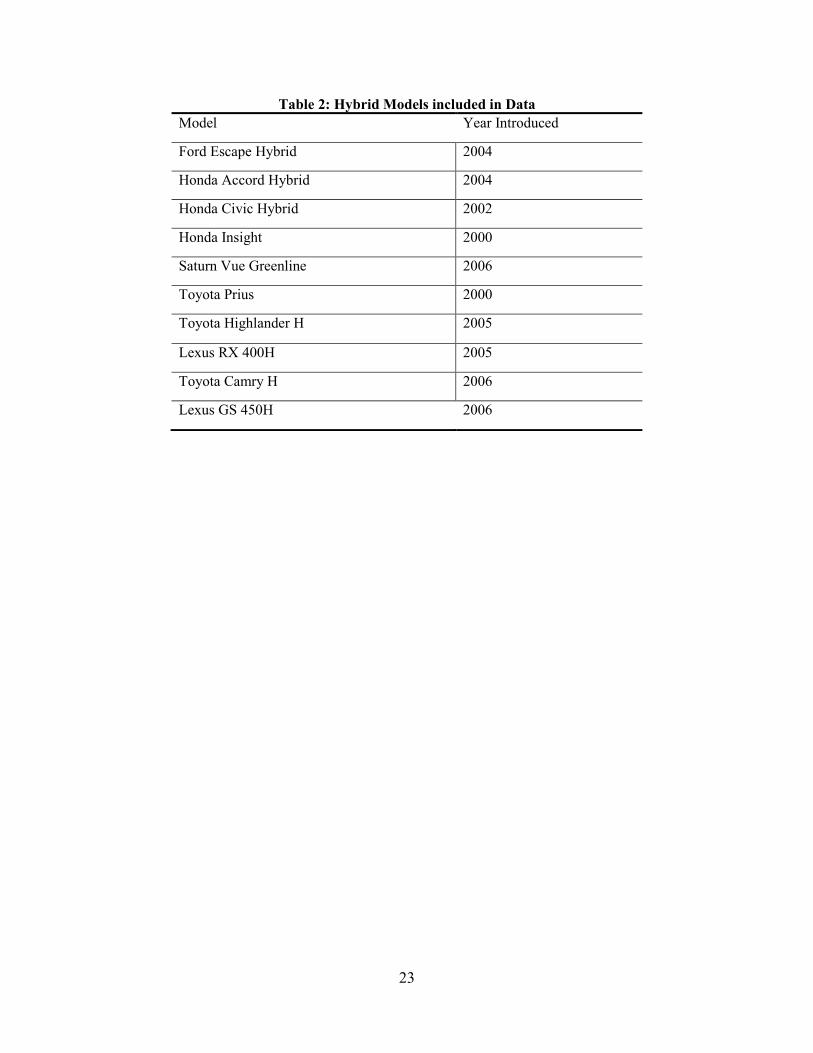
HEV’s are introduced in many more vehicle classes (see Table 1 for HEV’s available across time). Thus
in order to effectively shift people away from fuel inefficient vehicles, the government might need to
introduce aggressive fuel taxes or gas guzzler taxes to further skew the relative price between fuel
efficient and fuel inefficient cars.

4
Literature Survey
As hybrid vehicles are growing in popularity, there is a growing body of economic research on policies
related to hybrid vehicles. Berestenue and Li (2007) evaluate the effect of gas prices and government
incentives on the purchase of hybrid vehicles. Using vehicle registration data from 22 US Metropolitan
Statistical Areas they find that rising gas prices from 1999 to 2006 and government subsidies explain
17%, and 26% of the diffusion of hybrid vehicles in these areas.
Diamond (2006) uses state registration data to evaluate the determinants of hybrid vehicle
adoption. He finds that gas prices, tax incentives, and average miles traveled per year in the state all
significantly influence hybrid vehicle adoption.
Gallagher and Muehlegger (2007) study the relative effect of tax incentives, gasoline prices, social
preferences and other non-monetary incentives (for example, preferential access to high occupancy lanes
and parking etc.) on hybrid sales in the United States (US). They find that tax incentives explain a 12
percent increase in hybrid vehicle sales, gasoline prices explain 28 percent of the increase, and finally
changing social preferences are responsible for 33 percent of the increase from 2000-2006.
Kahn (2007) evaluates the effect of ideology on the purchase of HEV's in the state of California.
Using data on a community’s share of green party voters as a proxy for community environmentalism
Kahn concludes that environmentalists are more likely to purchase HEV's than non-environmentalists.
Sallee (2007) studies the incidence of state and federal tax incentives offered to Toyota Prius
owners. He finds that a majority of state and federal tax incentives are captured by consumers, rather than
producers. This is despite the fact that the Prius market was characterized by excess demand. Sallee
5
(2007) reasons that tax incentives were absorbed by consumers as producers did not wish to reduce future
demand by raising prices.1
Our paper is similar to those above as one of our aims is also to evaluate the effectiveness of tax
rebates on the purchase of hybrid vehicles. However the main difference is that we also include data on
the sales of cars other than hybrids. In addition to estimating the increase in hybrid vehicle sales from tax
rebates, we also estimate the effect of these rebates on the sales of other cars. Thus we can also ask the
question: which cars did the introduction of tax rebates for purchasing hybrid vehicles crowd out?
Hybrid Electric Vehicles
Hybrid-electric vehicles (HEV’s) are a proven means to reduce fuel consumption when compared to an
equivalent conventional Internal Combustion Engine (ICE) Vehicle (Hermance and Sasaki, 1998; EPA,
2007). Consequently, HEVs provide environmental improvements in the use-phase (Turrentine, et al,
2006), and the current fleet reduces carbon emissions by an average of 6 tons per vehicle over its lifetime
(Reynolds and Kandlikar, 2007). Such benefits come from the use of a smaller, more efficient ICE; an
electric motor that either enhances or substitutes the torque of the ICE during the drive cycle; and
regenerative braking which captures dissipative energy and uses it to recharge the Nickel metal hydride
battery used to power the electric motor.
Since their introduction to the Canadian market automotive manufacturers offer an increasing
variety of HEV model types. While in 2000 only two models (Honda insight and Toyota Prius) were
available, in 2007 there were thirteen available. Until 2004, hybrid-electric engine technology remained
the exclusive domain of the smaller car segment, with most sales being captured by the Toyota Prius.
1This paper is also related to others studying the impact of gasoline prices on vehicle purchasing behavior. For example, Linn and Klier (2007) and West (2007) study the impact of gasoline prices on type of vehicle purchased. Klier and Linn find that a one dollar increase in the price of gasoline per gallon is associated with an increase in the average fuel efficiency of new vehicles by 0.5 miles per gallon. West (2007) finds that households weigh the previous quarter’s prices more heavily than the current price in their vehicle purchasing decision.
6
Since then this technology has been extended to other segments and HEVs now extend from compact cars
(Honda Civic Hybrid), to intermediate cars (the Toyota Prius and Camry) and luxury Sports Utility
Vehicles (SUVs) such as the Lexus RX 400h. Hybrid SUVs are a sharply increasing segment, and in the
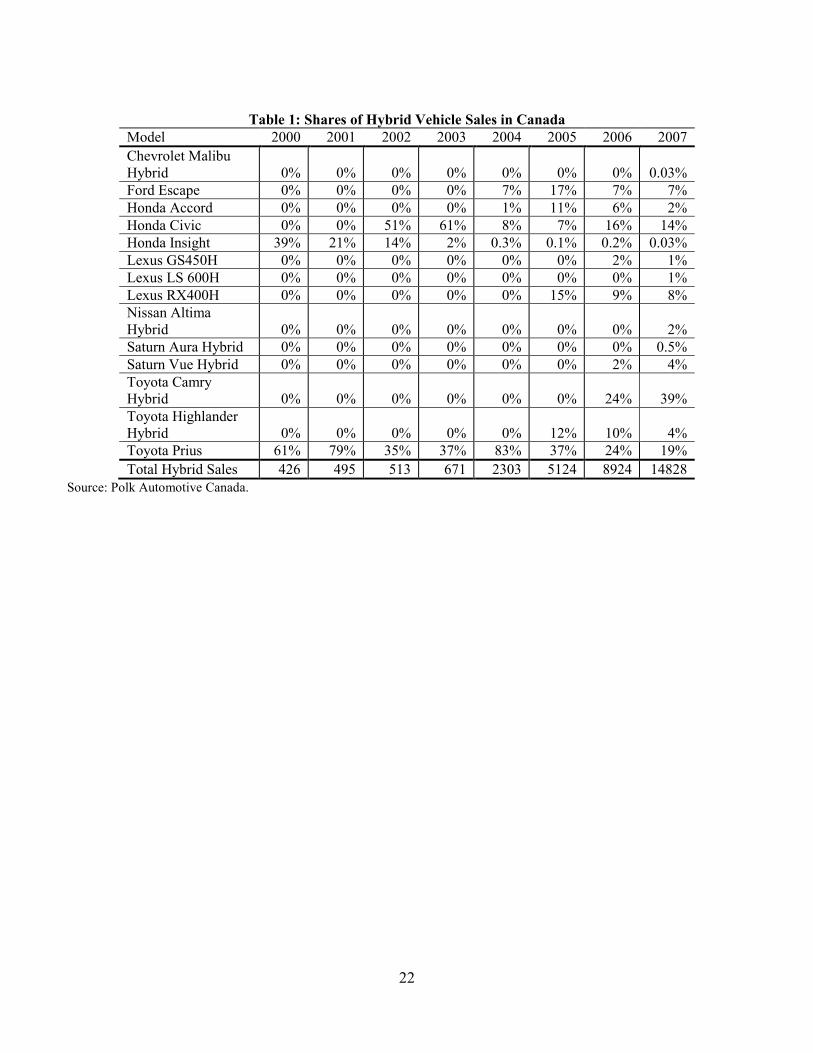
Canadian market hybrid SUV’s made up approximately 28% total hybrid sales in 2006 (see Table 1). In
addition to the growing diversity of model offerings, HEV annual sales continue to grow both in numbers
and as a proportion of the total light-duty vehicle sales. In 2000 HEV sales represented only 0.03% of
total light vehicle sales in Canada; by 2006 this proportion had risen dramatically to 0.53%. In numbers
this had gone from 426 cars sold in 2000 to 8924 cars sold in 2006. Toyota dominates the Hybrid market
with the Prius, Camry and Lexus models capturing approximately 70% of the market share in 2006. In
2006 the Toyota Camry Hybrid was the highest selling hybrid model in Canada with approximately 24%
of all hybrid vehicles sold in Canada.
Data
The primary sales data used in our analysis is provided by DesRosiers Automotive Consultants Inc. This
data includes vehicle sales data, by make and model, for each province, and for each year from 1989 to
2006. This data does not disaggregate sales within the model by engine type, or drive train. Thus if a
model had a hybrid variant its sales are not separately identified. We supplement car sales data from
DesRosiers with hybrid vehicle sales data by province provided by Polk Automotive Canada.
The DesRosiers dataset provides sales data for the Toyota Prius and Honda Insight (which are
hybrid cars with distinct model names and until 2002 were the only hybrid cars available). The dataset
from Polk Automotive provides us with numbers for the Toyota Prius, the Honda Insight and all other
hybrid models sold in Canada.2
2 The intersection between the two datasets allows us to cross-check consistency in sales numbers across the two datasets.
7
We obtain our fuel economy data for each model from the US Environmental Protection Agency’s
database available online at www.fueleconomy.gov. This database provides fuel economy indicators
disaggregated for each model by engine, and transmission. We aggregate the data to match our model-
based sales data, and keep four statistical moments by vehicle model (minimum, maximum, mean and
median) for the distribution of two fuel economy indicators for each model (the two fuel economy
indicators are combined MPG (guide) and Unrounded Combined MPG (EPA)). We obtain gasoline
prices, the Consumer Price Index (CPI) for transportation with its components including a CPI for gas
prices, provincial GDP, number of families, the age distribution of population by Province, average
vehicle kilometers for each province and year from Statistics Canada. Finally we gather information on
model generations (major overhauls of the same model) from Wikipedia (www.wikipedia.org). Wikipedia
has detailed information on each vehicle model and we include the years for each generation. For example
the first generation of the Honda Accord sold as the Honda Accord model year 1976 till the Honda
Accord model year 1981 and the eight (current) generation started selling as the Honda Accord model
year 2008.
Vehicle Class
The DesRosiers dataset classifies each vehicle into a vehicle class defined by the Automobile Industry in
Canada. Passenger Cars are classified into: Subcompact, Compact, Intermediate, Sports, Luxury Sports,
Luxury, Luxury High End. Light Trucks are classified into: Compact Sport Utility, Intermediate Sport
Utility, Large Sport Utility, Small Pickup Truck, Large Pickup Truck, Small Van, Large Van, Luxury
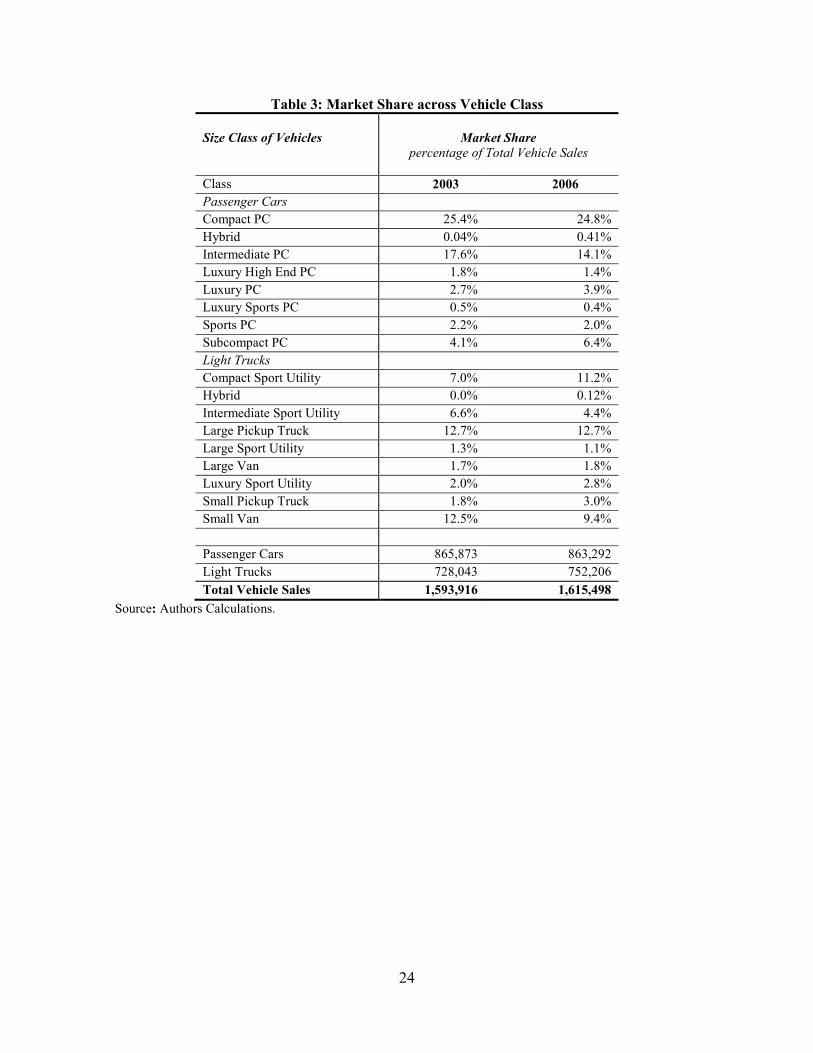
Sport Utility. For some parts of our analysis, including the aggregate data presented in Table 3 we classify
all HEV’s into a single class Hybrid irrespective of the class they originally belonged.
In Table 3 we present the market share for vehicle classes in Canada for 2003 and 2006. Compact
cars comprised almost 25% of all vehicle sales, and intermediate cars roughly 14% in 2006. Pickup

8
trucks (large and small) comprised roughly 15% of all vehicle sales, and compact sports utility vehicles
comprised roughly 11% in 2006. Over the three years luxury cars, subcompact cars, and compact sports
utilities saw significant increases in their market shares. The big losers were small vans, large and
intermediate sports utility vehicles, and intermediate cars. Hybrid vehicles experienced an unprecedented
increase in market share.
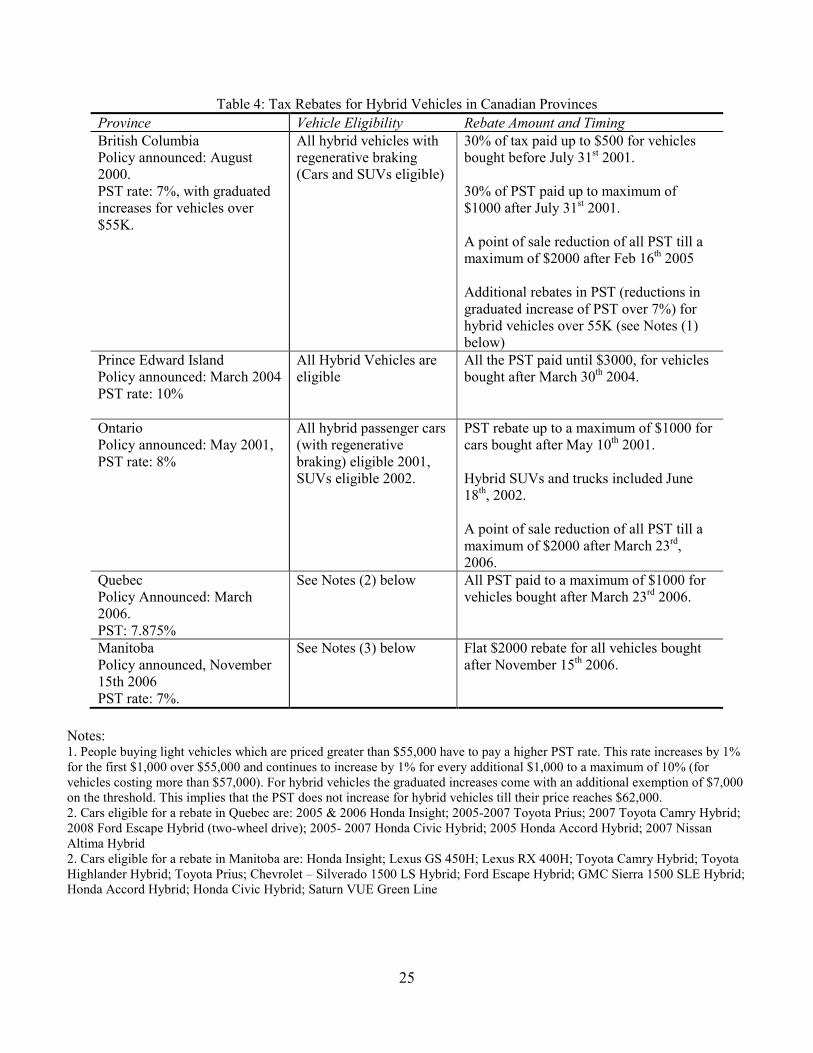
Tax Rebates for Hybrid Electric Vehicles in Canada
Before the federal tax rebate to fuel efficient vehicles was announced in 2007, five Canadian provinces,
British Columbia (BC), Manitoba , Ontario, Prince Edward Island (PEI), and Quebec instituted tax
rebates of varying amounts for hybrid vehicles (please see Table 4 for more details). In the province of
Ontario, all hybrid electric vehicles purchased or leased after May 10th 2001 were allowed a rebate of up
to $1000 of the Retail Sales Tax (RST). For vehicles purchased after 23rd of March, 2006, this limit was
doubled to $2000. In August 2000 the province of British Columbia instituted a 30% refund of the
Provincial Sales Tax (PST) (up to $500) for all hybrid cars purchased or leased and the maximum was
raised to $1000 in 2001. In 2005 the government changed this to a point of sale exemption of all of the
PST applicable up to a maximum of $2,000. Prince Edward Island allowed all hybrid vehicles purchased
after March 30, 2004 a rebate of up to $3,000 of the paid PST. In the province of Quebec, all Hybrid
vehicles purchased or leased after March 23, 2006, and before February 21, 2007 qualify for a rebate of
the PST paid up to a $1,000 and the maximum was increased to $2,000 on February 20, 2007. In
Manitoba, residents who purchase or lease an eligible hybrid vehicle after November 15th 2006 receive a
check of $2000 in the mail. The remaining five provinces do not offer tax rebates or subsidies for the
purchase or lease of HEV’s. For our purposes the subsidy program in Manitoba is not included in our
analysis. This is because we have yearly data on car sales and the subsidy is paid out only to hybrid
vehicles purchased on or after November 15th 2006. While using the information on rebate, or subsidy
9
programs we deem a program to be valid for the year if an only if it is in place before the 1st of August of
the same year.
Besides the program in the province of Manitoba, other provincial rebates are refunds on
provincial taxes paid. To calculate the dollar value paid on the average hybrid car sold we need to know
the value of each vehicle sold. As we do not have transactions price data on each vehicle sold we make
some assumptions to calculate the average value of the rebate paid out.
Assumption A1: The transacted price of the vehicle is at least as high as its base price.
We expect this assumption to be fair as transacted prices add delivery and destination charges and
the price of options to the base price. However, transaction prices also deduct dealer incentives from the
base plus options price which can complicate matters. We expect that given the high demand for most
hybrid models the dealer incentives were not larger than the average delivery and destination and options
charges.
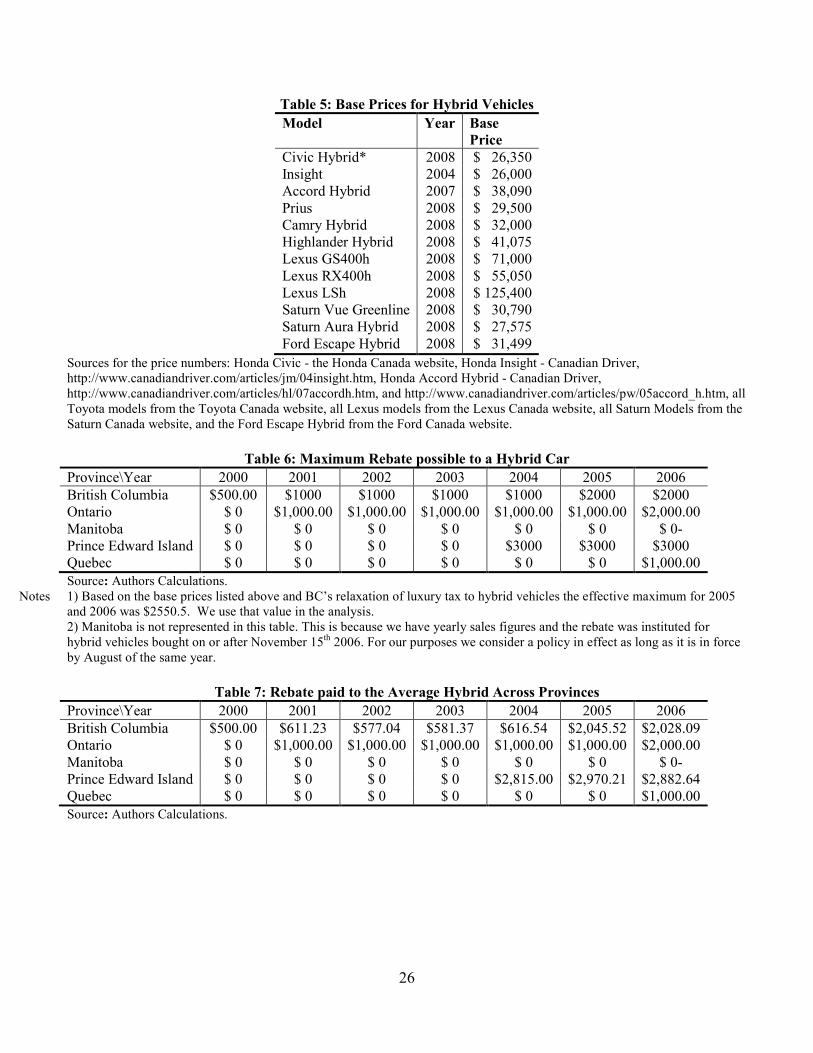
Assumption A2: The base price of all hybrid models do not change from 2000-2008.
As we collect the base price data from the website for each manufacturer we obtain the current
base price of the model in 2008 (please see Table 5).3 This assumption allows us to use the current base
price as the value of the car over the time frame for our data (2000-2006). Assumption A2 is in place
temporarily. We are in the process of collecting list prices for all models in our dataset and will be able to
use a more detailed set of base prices for our analysis for our next draft.
3 We are able to download current prices for all hybrid models in our dataset besides the Honda Insight and the Honda Accord Hybrid (as these models have been discontinued). For these two models we get the base price from the Canadian Driver (an online auto magazine at http://www.canadiandriver.com). More information on the prices and the source of the data is provided in Table A1 in the Appendix.
10
Based on these assumptions we calculate the value of the rebate paid to a hybrid car model during
year t ( mptR ) as follows4
( ){ }min * ,mvt vt v m vtR PST BP Limitη= , (1)
where the subscript m denotes model, v denotes province, and t denotes year. Variable vtη is the
proportion of PST (provincial sales tax) returned to the consumer on purchase of the hybrid vehicle, BP
denotes the base price of the model, and Limit denotes the maximum PST rebate possible in that province
and year (please see Table 6 for these limits across provinces and years). In 2006, PEI has the highest
maximal rebate per hybrid sold in the province and BC is second. Table 6 demonstrates how the
maximum rebate varied across different provinces over time and space.
Given the share of hybrid models sold across different provinces we can also calculate the
weighted value of the rebate paid in BC,5 Ontario, Quebec, and PEI during year t ( ptR ) using the
following formula:
( ){ }( )min * * ,vt mvt vt v m vt
m
R PST BP Limitλ η=∑ , (2)
where mvtλ is the proportion of sales of a hybrid model m as a proportion of all hybrids sold in province p
during year t. The value of rebate paid based on this formula is given in Table 7. We do not use this data
4 For the province of BC we have to account for an exemption to an increase in the PST to a Luxury Tax given to hybrid vehicles. For vehicles that are priced between $55,000 and $58,000 sold in BC the formula is amended to:
( ){ } ( )min * ,mBCt BC m BCt BC BC mrebate PST BP Limit Lux PST BP= + − . The additional term added captures the loss in
revenue from the exemption granted to hybrid vehicles. In our data this additional term is relevant for only one hybrid model, the Lexus RX400h sold in 2005 and 2006. 5 For the province of BC we have modify the formula slightly to account for an exemption to an increase in the PST to a
Luxury Tax given to hybrid vehicles (see Table 4 for details):
( ){ } ( )( )min * * ,BCt iBCt BCt BC i BCt BC BC i
i H
R PST BP Limit Lux PST BPλ η∈
= + −∑ . The additional term added captures
the loss in revenue from the exemption granted to hybrid vehicles. In our data this additional term is relevant only for one hybrid model, the Lexus RX400h sold in 2005 and 2006.
11
in our regressions as it is depends on the share of car sold (our dependent variable in the regressions). We
instead use the maximum rebate possible in each province (from Table 6).
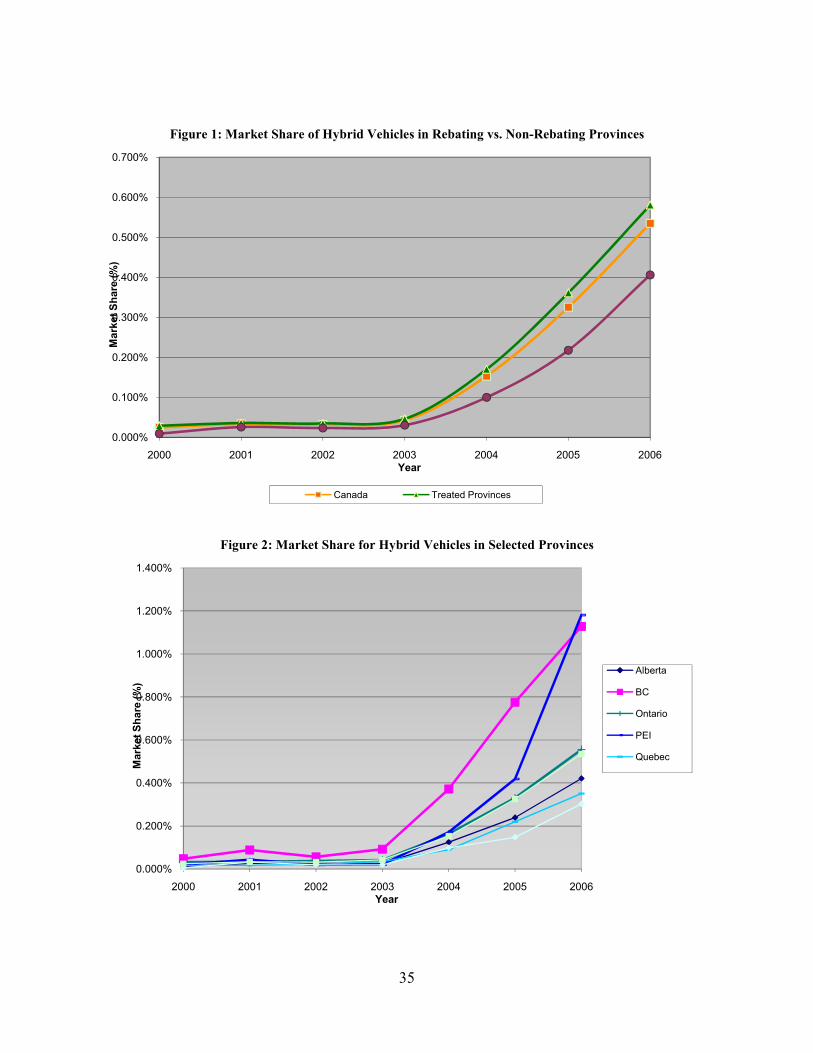
In Figure 1 we present the trend in market share across provinces that offer rebates and those that
do not offer rebates for HEV purchases. The line marked by a triangle is the market share of hybrid
vehicles for provinces that offer rebates for purchasing HEV’s. These provinces are: BC, Manitoba,
Ontario, Quebec, and PEI. The line marked with circles represents the market share of hybrid vehicles in
provinces that do not offer rebates for purchasing HEV’s. The line marked by squares is the market share
of hybrid vehicles in Canada. This figure also shows that the market share of hybrid vehicles is always
higher in provinces that offer rebates for their purchase. The market share was higher even before a lot of
the rebates came online, implying that these provinces might have a preference for hybrid vehicles before
the implementation of their rebates. We address this possibility in our estimation strategy later.
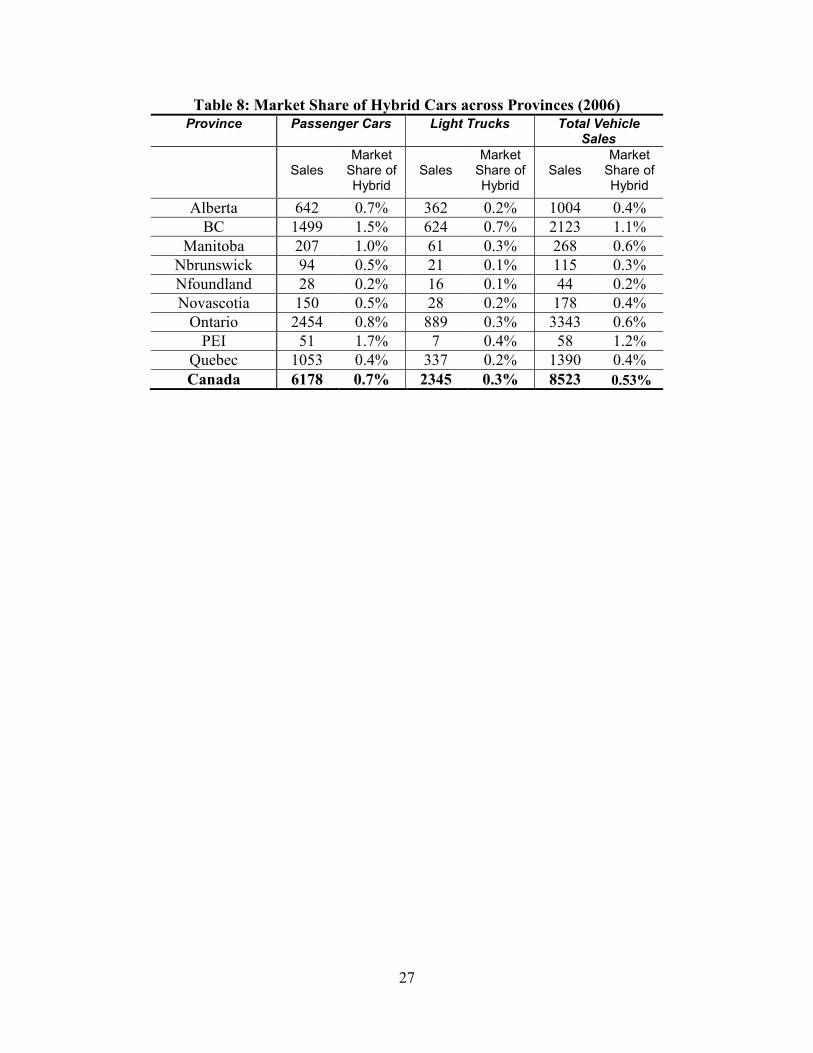
In Table 8 we look at the market share for hybrid vehicles across provinces for year 2006. We find
that BC has the highest share of hybrid vehicles sold, and PEI is a close second, with Manitoba third and
Ontario fourth. Note all four provinces provide tax rebates for purchasing hybrid vehicles. Among the
rebating provinces only Quebec has a market share that is lower than the national average of 0.36%.
Market shares for a few selected provinces are shown in Figure 2. Note that BC, PEI, and Ontario
stay above the Canada average in market share of hybrid vehicles. In the meanwhile, the non-rebating
provinces of Alberta and Saskatchewan stay below the Canada average. Quebec (a rebating province) also
stays below the Canada average in the market share of hybrid vehicles.
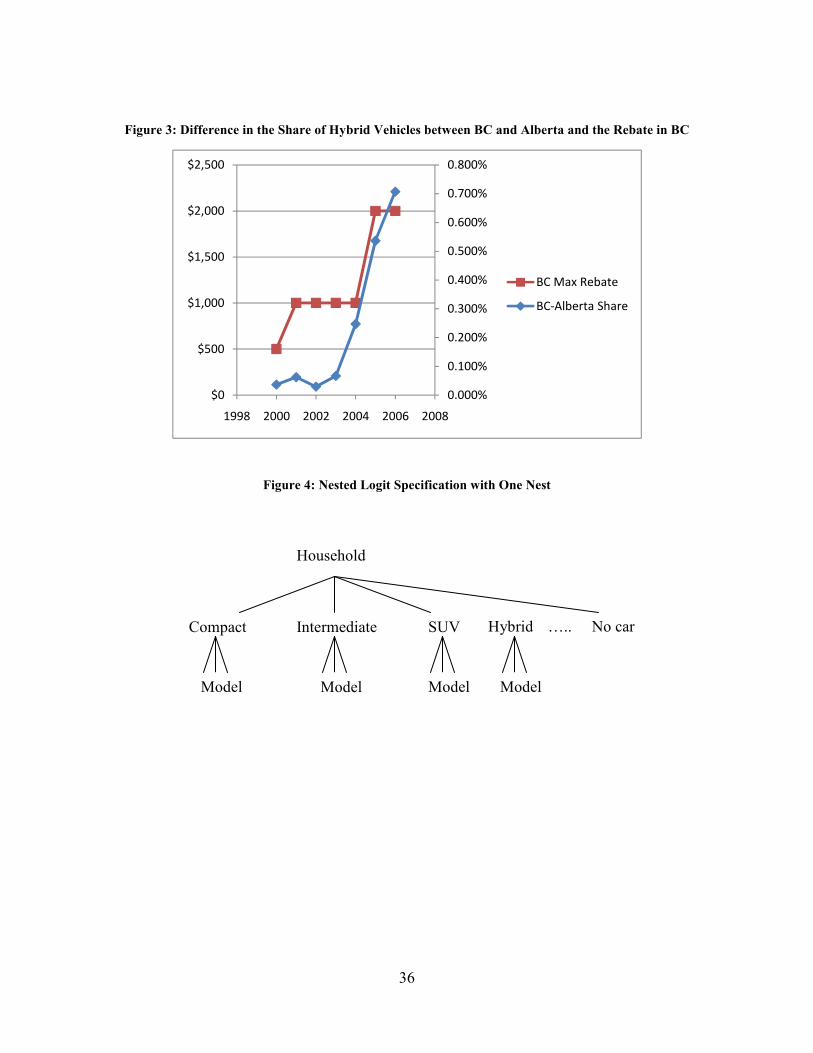
In Figure 3 we graph a difference in the share of hybrid cars between the province of BC and
Alberta. BC offers rebates for the purchase of hybrid vehicles while Alberta does not. We also plot the
maximum rebate offered in BC for the same time period. A visual correlation between the two series is
visually apparent. In what follows we shall try to estimate this correlation more formally.

12
Empirical Strategy
Assume that there are M models available in a given province v. Assume that these M models are
partitioned into C classes such that each model, m, is a member of exactly one class, c. The utility to
individual i in province v from purchasing model m is given by
[ ]imv i i mv i mv mv imvu y p xα β ξ ε= − + + + , (3)
where, xmv contains observed attributes of model m in province v, ξmv contains unobserved attributes, y is
the consumer’s income and p is the price of the model. Additionally, ε is a mean zero random variable
capturing the consumer’s idiosyncratic preference for the model. The model can be made more general by
including a time-specific component. We use data from multiple years in the estimation but suppress the
time subscript for now.
Assume that
mv m mvp p R= − , (4)
implying that the price of a particular model in a given province is equal to a model specific mean less a
model-province specific rebate R. In other words, we assume that a given model has a constant list price
across all provinces, and a discount which depends on province specific rebate policies towards hybrid
vehicles.
Also assume that
mv m cvξ ξ ξ= + ∆ (5)
where c is the class corresponding to model m as described above. This implies that the model-specific
unobserved term can be decomposed into a model attribute that is constant across provinces, and a
province-specific term that is constant for all models in the same class. As these classes are usually
13
associated with size, capacity, performance etc the class variable represents certain functions that the
vehicles performs for the individual (or family). We allow provincial preferences for a class to vary as
the geography, city density, road network, and the makeup of the population often influences the class of
vehicle appropriate for a region.
Also assume that, for all individuals i, ββ =i and αα =i , that is, the only individual source of
heterogeneity in preferences is through the mean-zero additive error term. The utility to person i from not
purchasing any model and instead choosing the outside good is given by
0i v i iovu yα ε= + . (6)
A consumer purchases one of the i vehicles or the outside option (not buy a new car – this could be either
use public transit, or buy a used car) whose utility we normalize to zero. If we assume that ε is distributed
Type-1 extreme value, the market share of model m in province p is
( )( )
exp( )
1 exp( )
mv mv mv m cv
mv
kv mv mv k cv
k
x p Rs
x p R
β α ξ ξ
β α ξ ξ
− − + + ∆=
+ − − + + ∆∑.
(7)
The Estimating Equation
In order to derive the estimating equation, we assume that unobserved and observed model specific
attributes (including the relative retail price but excluding driving costs) remain constant across a
generation of a model and can thus be captured by a model*generation fixed effect. The cost of driving a
particular model (a component of mvx ) is approximated by the consumer price index of gasoline by
province and year ( gas
vtP ) and the EPA defined fuel economy ( mtMPG ) for each model and each year.
We define the cost of driving as gas
vt
mt
P
MPG (this is based on Linn and Klier, 2007, who discuss the
14
implications of this specification). A province*class year fixed effect captures cvξ∆ in the above
equation. In many of our specifications we assume that observed attributes of belonging to a class remain
constant across one year. This is based on the fact that people buy vehicles in a certain class based on the
attributes, and vehicle variety available within that class. This is also a reflection of the fact that as models
vary within classes the relative price for purchasing a different attributes can also change. We can thus
introduce a class*year fixed effect to capture this. This can also capture changing preferences for certain
classes across years in the population.
To compute the estimating equation we calculate the odds of choosing a model m relative to the
outside good. Taking logs of the equation we get the following estimating equation.
0 1 2ln( ) ln( )gas
vtmvt ovt mvt m vct
mt
Ps s R
MPGβ β β θ γ− = + + + + (8)
where θ refers to a model generation fixed effect and γ refers to a combination of province, class and
year fixed effects. The coefficient 1β captures the impact of the rebate on the market share of the average
hybrid model in our data.
This equation corresponds to a simple multinomial logit specification where the individual i
chooses among several models and the outside good. Own and cross elasticities to the rebate can be
calculated based on Nevo (2000). As explained in Nevo (2000) the significant issue with this model is the
implied potentially unrealistic own and cross-price elasticities. Own price elasticities increase in the price
of the product and decrease in the market share of the product. Further cross-price elasticities with
respect to the product attribute (price, or rebate in our case) are higher if the share of the substitute good is
15
higher. This implies that this estimating strategy would predict that the share of the models with the
highest shares would see the biggest reductions in market share as the rebate is implemented.6
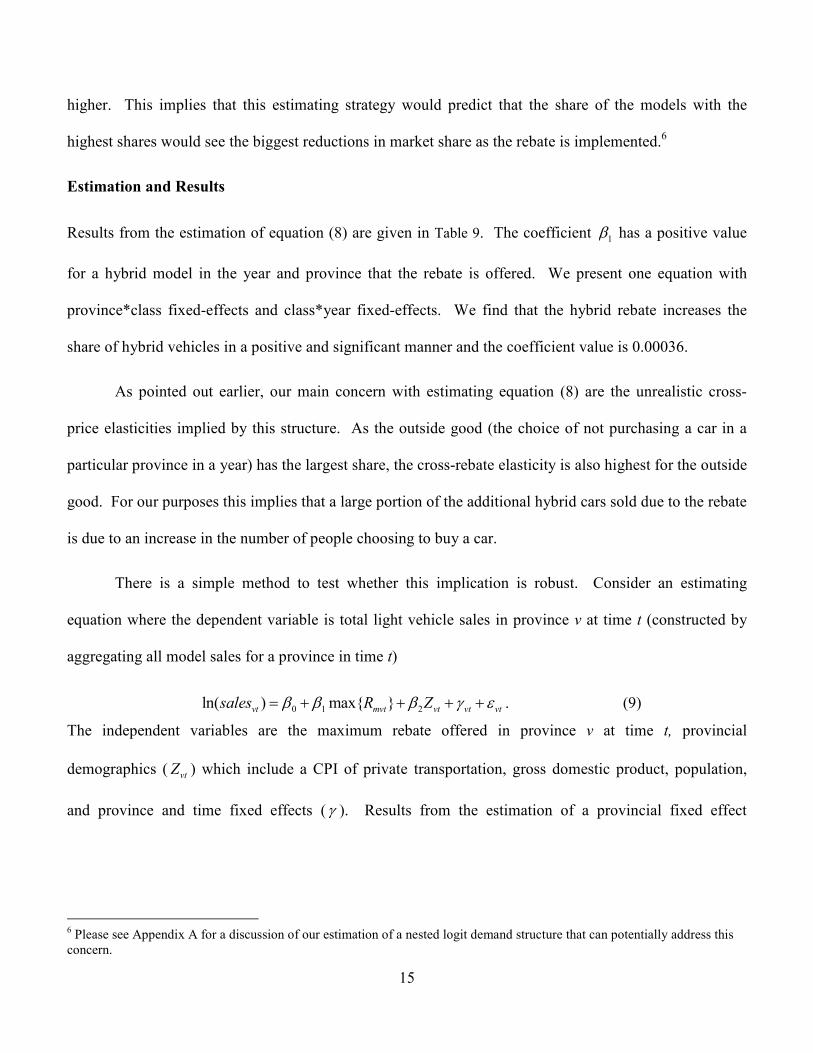
Estimation and Results
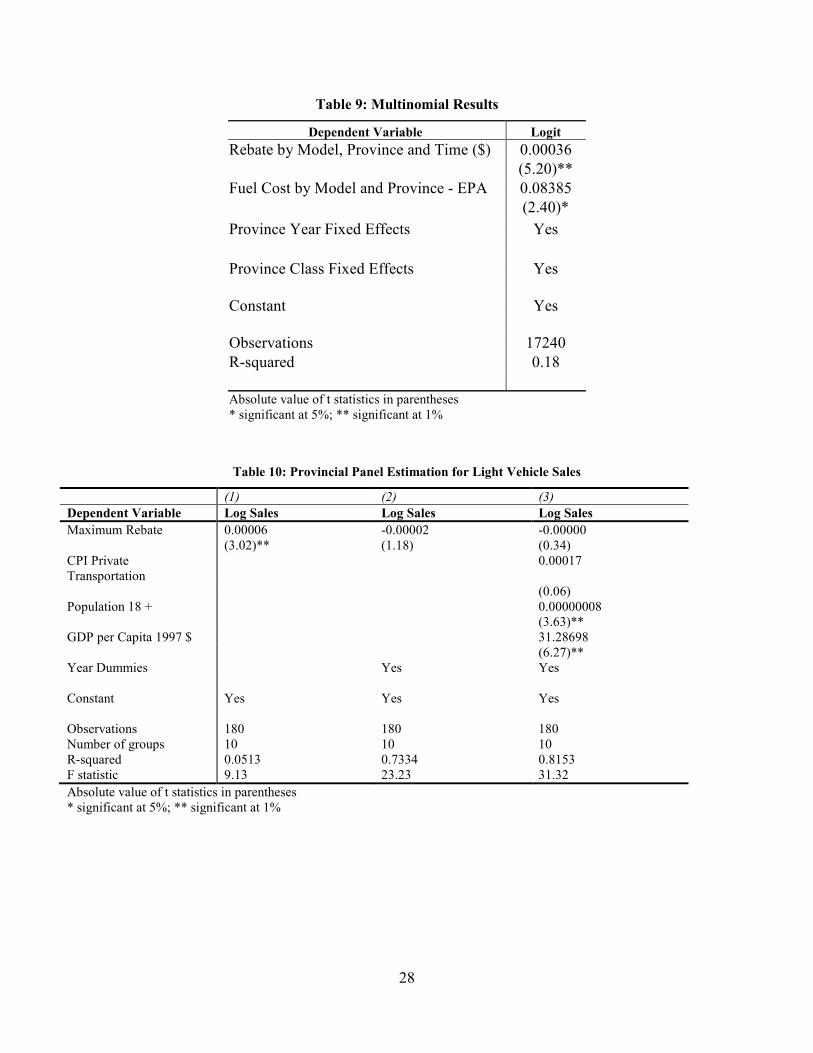
Results from the estimation of equation (8) are given in Table 9. The coefficient 1β has a positive value
for a hybrid model in the year and province that the rebate is offered. We present one equation with
province*class fixed-effects and class*year fixed-effects. We find that the hybrid rebate increases the
share of hybrid vehicles in a positive and significant manner and the coefficient value is 0.00036.
As pointed out earlier, our main concern with estimating equation (8) are the unrealistic cross-
price elasticities implied by this structure. As the outside good (the choice of not purchasing a car in a
particular province in a year) has the largest share, the cross-rebate elasticity is also highest for the outside
good. For our purposes this implies that a large portion of the additional hybrid cars sold due to the rebate
is due to an increase in the number of people choosing to buy a car.
There is a simple method to test whether this implication is robust. Consider an estimating
equation where the dependent variable is total light vehicle sales in province v at time t (constructed by
aggregating all model sales for a province in time t)
0 1 2ln( ) max{ }vt mvt vt vt vtsales R Zβ β β γ ε= + + + + . (9)
The independent variables are the maximum rebate offered in province v at time t, provincial
demographics ( vtZ ) which include a CPI of private transportation, gross domestic product, population,
and province and time fixed effects (γ ). Results from the estimation of a provincial fixed effect
6 Please see Appendix A for a discussion of our estimation of a nested logit demand structure that can potentially address this concern.
16
estimation of the above equation are presented in Table 10. The data spans over our entire sample, that is,
over ten provinces from 1989 to 2006. We find that the rebate did not impact overall light vehicle sales.7
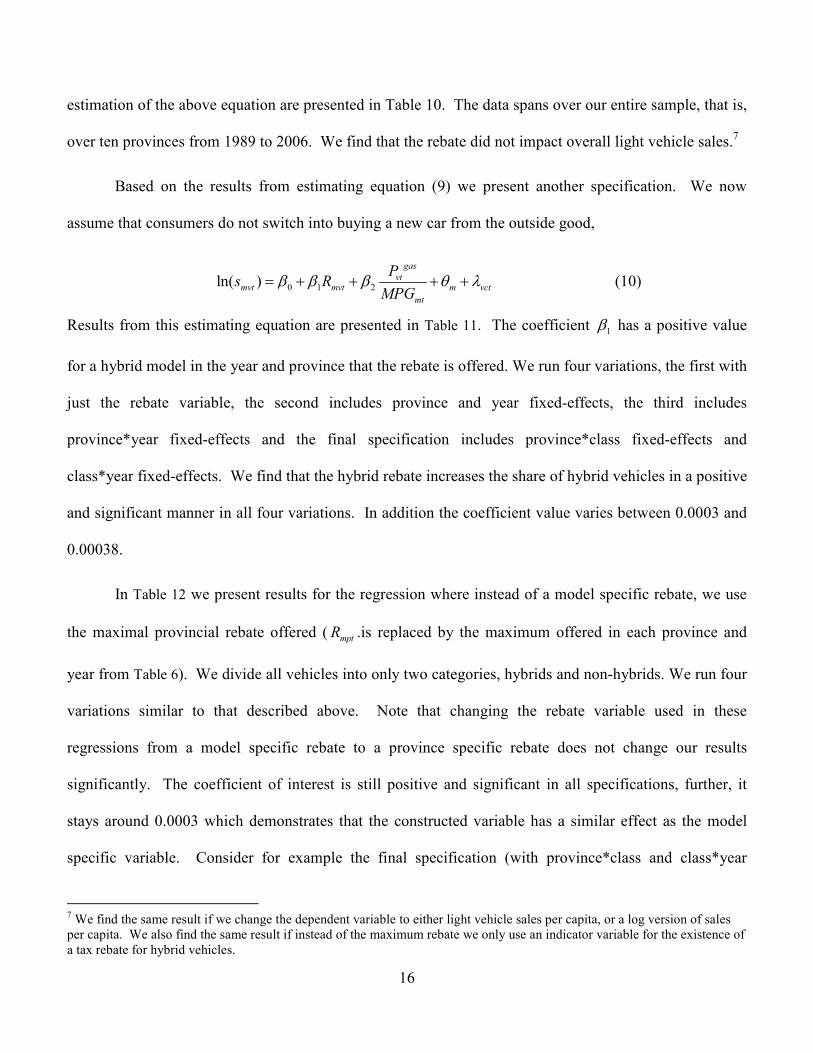
Based on the results from estimating equation (9) we present another specification. We now
assume that consumers do not switch into buying a new car from the outside good,
0 1 2ln( )gas
vtmvt mvt m vct
mt
Ps R
MPGβ β β θ λ= + + + + (10)
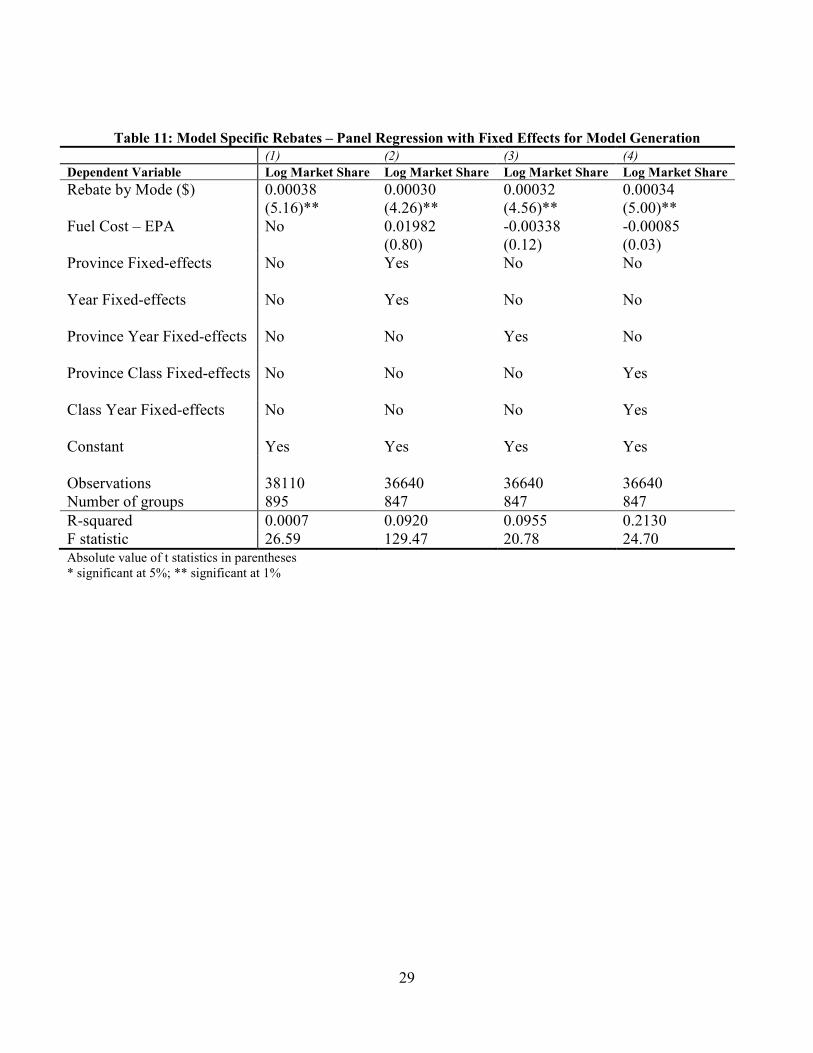
Results from this estimating equation are presented in Table 11. The coefficient 1β has a positive value
for a hybrid model in the year and province that the rebate is offered. We run four variations, the first with
just the rebate variable, the second includes province and year fixed-effects, the third includes
province*year fixed-effects and the final specification includes province*class fixed-effects and
class*year fixed-effects. We find that the hybrid rebate increases the share of hybrid vehicles in a positive
and significant manner in all four variations. In addition the coefficient value varies between 0.0003 and
0.00038.
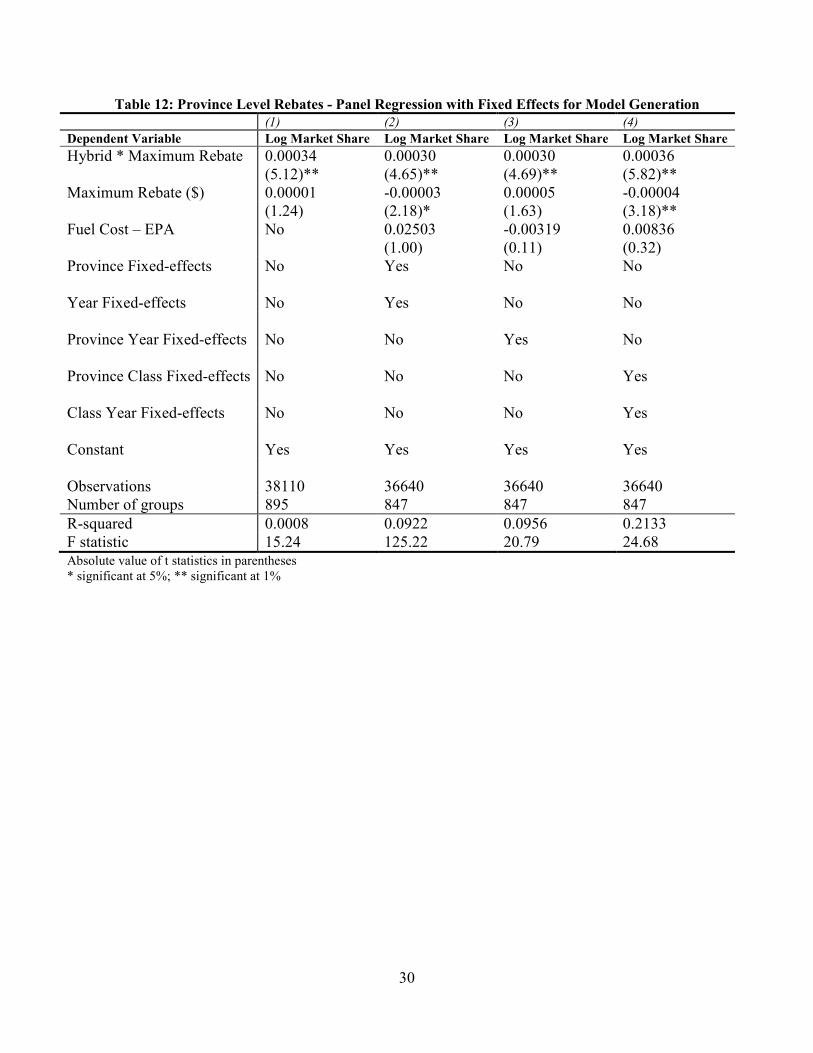
In Table 12 we present results for the regression where instead of a model specific rebate, we use
the maximal provincial rebate offered ( mptR .is replaced by the maximum offered in each province and
year from Table 6). We divide all vehicles into only two categories, hybrids and non-hybrids. We run four
variations similar to that described above. Note that changing the rebate variable used in these
regressions from a model specific rebate to a province specific rebate does not change our results
significantly. The coefficient of interest is still positive and significant in all specifications, further, it
stays around 0.0003 which demonstrates that the constructed variable has a similar effect as the model
specific variable. Consider for example the final specification (with province*class and class*year
7 We find the same result if we change the dependent variable to either light vehicle sales per capita, or a log version of sales per capita. We also find the same result if instead of the maximum rebate we only use an indicator variable for the existence of a tax rebate for hybrid vehicles.
17
effects). We find that the tax rebate had a negative and significant effect on the sales all vehicles (the
coefficient on the rebate variable is negative and significant). This implies that the effective coefficient of
the rebate on hybrid vehicles is now 0.00032 compared to 0.00034 in the corresponding specification for
the model specific rebate variable.
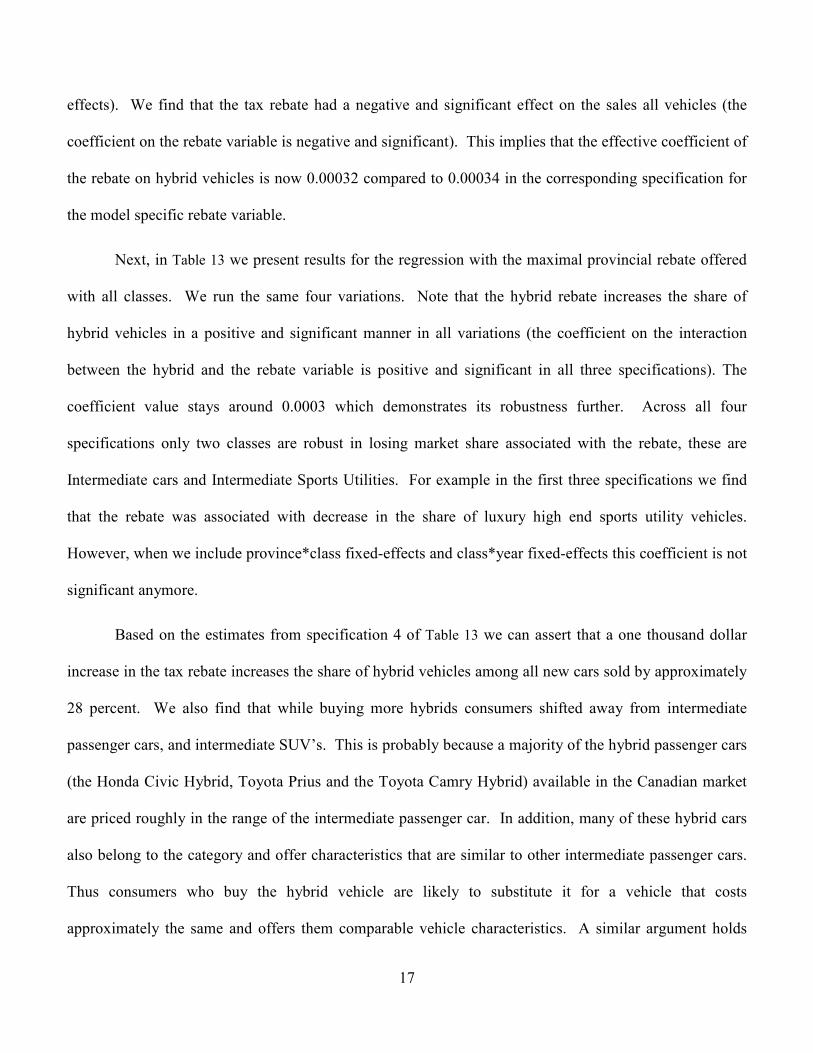
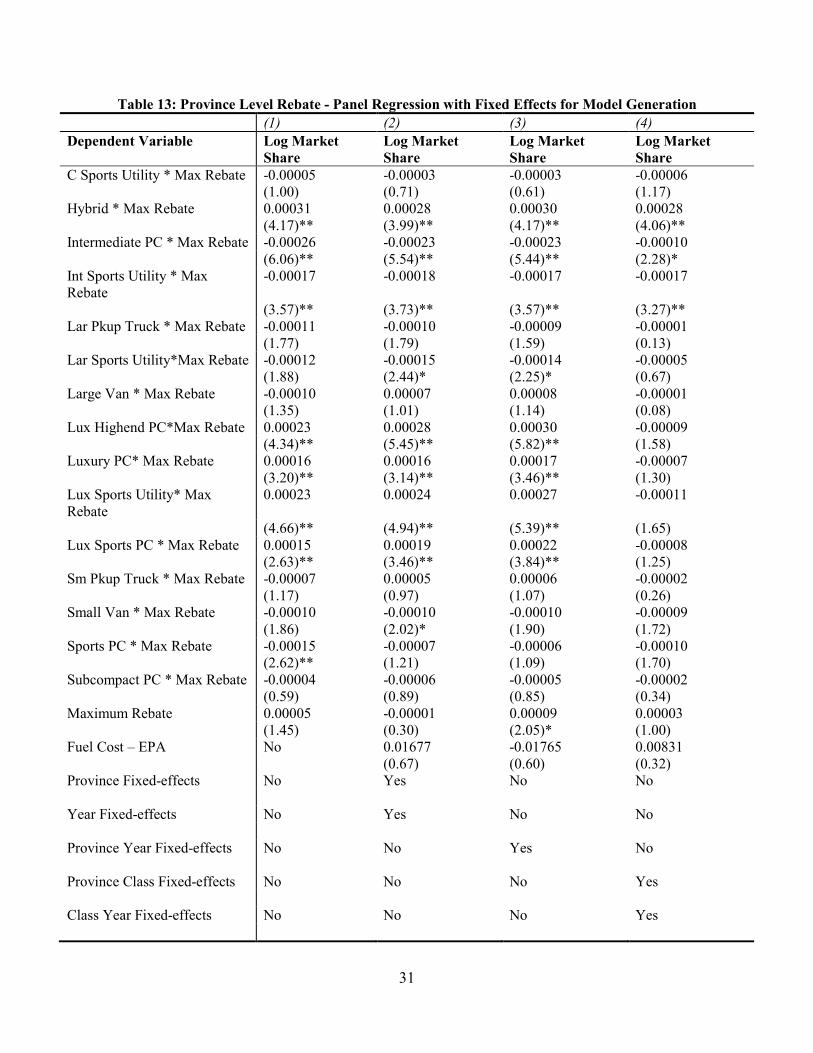
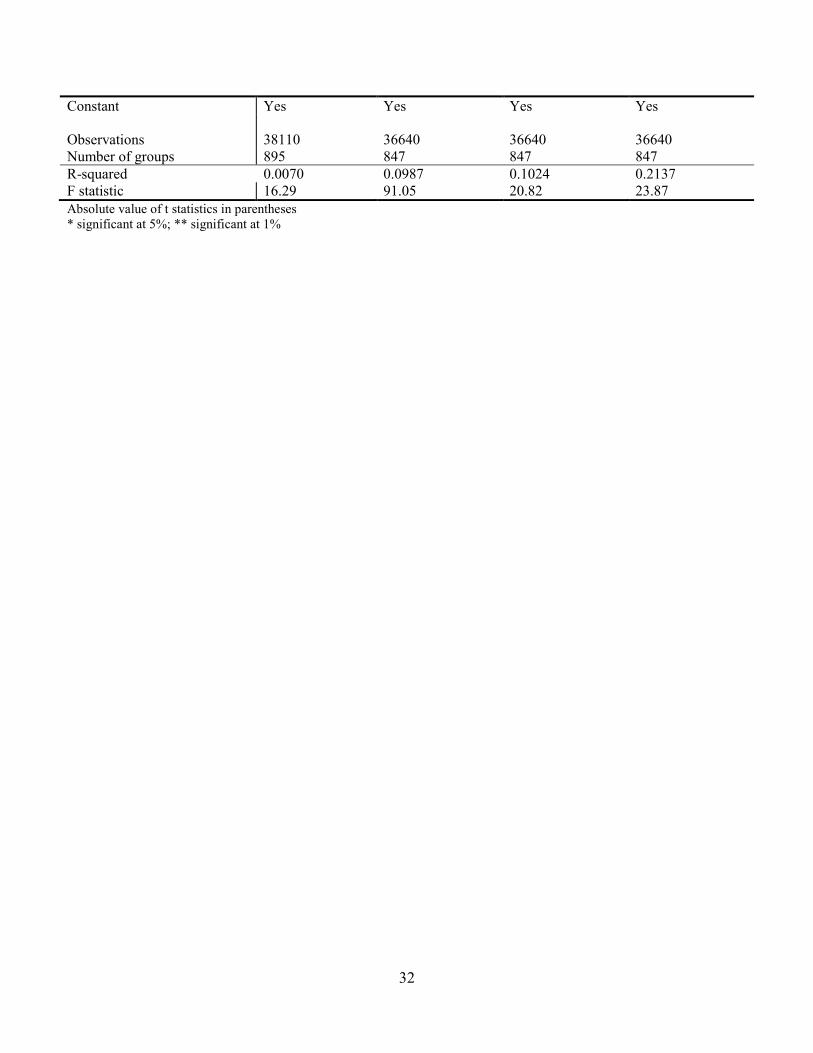
Next, in Table 13 we present results for the regression with the maximal provincial rebate offered
with all classes. We run the same four variations. Note that the hybrid rebate increases the share of
hybrid vehicles in a positive and significant manner in all variations (the coefficient on the interaction
between the hybrid and the rebate variable is positive and significant in all three specifications). The
coefficient value stays around 0.0003 which demonstrates its robustness further. Across all four
specifications only two classes are robust in losing market share associated with the rebate, these are
Intermediate cars and Intermediate Sports Utilities. For example in the first three specifications we find
that the rebate was associated with decrease in the share of luxury high end sports utility vehicles.
However, when we include province*class fixed-effects and class*year fixed-effects this coefficient is not
significant anymore.
Based on the estimates from specification 4 of Table 13 we can assert that a one thousand dollar
increase in the tax rebate increases the share of hybrid vehicles among all new cars sold by approximately
28 percent. We also find that while buying more hybrids consumers shifted away from intermediate
passenger cars, and intermediate SUV’s. This is probably because a majority of the hybrid passenger cars
(the Honda Civic Hybrid, Toyota Prius and the Toyota Camry Hybrid) available in the Canadian market
are priced roughly in the range of the intermediate passenger car. In addition, many of these hybrid cars
also belong to the category and offer characteristics that are similar to other intermediate passenger cars.
Thus consumers who buy the hybrid vehicle are likely to substitute it for a vehicle that costs
approximately the same and offers them comparable vehicle characteristics. A similar argument holds
18
when we consider the fact that hybrid SUV’s are priced approximately in the range of intermediate
SUV’s.
We find that the average vehicle in other classes do not see a statistically significant reduction in
sales from the introduction of these policies. These results indicate that hybrid tax incentives may not be
the most effective way to encourage people to switch away from fuel inefficient vehicles like large
SUV’s, or luxury and sport passenger cars at least in the short or medium run. This might change as
HEV’s are introduced in many more vehicle classes (see Table 1 for HEV’s available across time). Thus
in order to effectively shift people away from fuel inefficient vehicles, the government might need to
introduce aggressive fuel taxes or gas guzzler taxes to further skew the relative price between fuel
efficient and fuel inefficient cars.
Counterfactuals
We now use our estimated coefficients to examine the effect of the hybrid rebate policy. We compute the
outcomes in a counterfactual exercise where rebates for hybrid vehicles are set to zero in all provinces in
all years. In particular, we estimate a particular estimating equation, and compute the predicted odds
ratios for every model in all provinces and years. We then compare these to the fitted values generated by
setting R equal to zero for all m, p and t. The changes in the predicted odds ratios (and therefore in the
predicted number of cars sold for each model) provide an estimate of the effect of the rebates in
increasing the number of hybrid cars sold, and the extent to which these increases came at the expense of
other cars or the outside good.
We calculate the net effect of the hybrid policy on fuel emissions in the following way. First, we
can estimate the amount by which increases in new hybrid-car consumption came at the expense of
consumption of other new (non-hybrid) cars. Using data on the average fuel economy of various models,
we can calculate the improvement in fuel efficiency caused by consumers switching to hybrid cars from
19
non-hybrids. Second, we need to account for the effect on emissions by people buying hybrid cars who
would not otherwise have bought a new car in that province and year. This corresponds to a decrease in
the share of the outside good in the corresponding province and year. Consumers who switched away
from the outside good either did so by replacing an existing car, or adding to their current stock of cars.
However, we do not have information on this decision. Therefore, we attempt to calculate a rough
estimate of this effect by calculating net emissions under the assumption that none of these hybrid sales
added to the stock of cars since a corresponding number of existing vehicles were simply taken off the
roads.
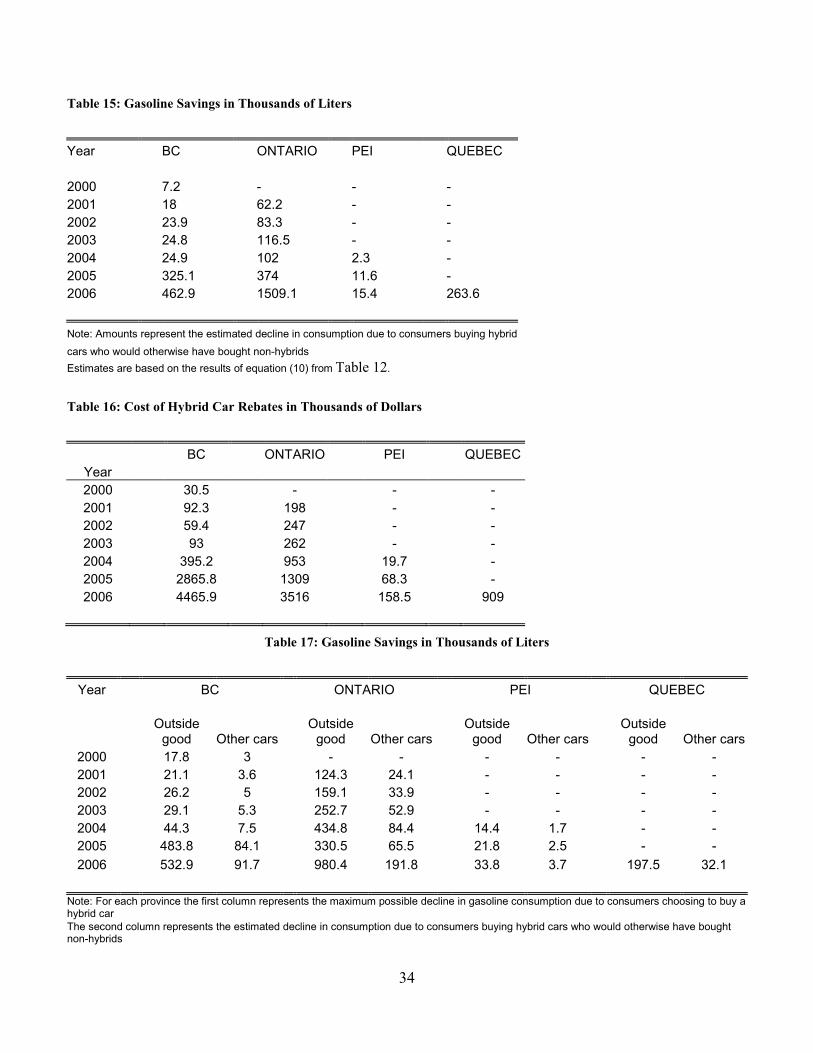
In Table 15 we present counterfactual estimates by using the estimated coefficients from the
regression of equation (10). That regression predicted that a $1000 rebate would, on average, increase the
market share of hybrid vehicles by about 32%. In this table we calculate the gasoline savings by people
changing their new car consumption decision, since there was no outside good. To compare the cost of
these rebates in Table 16 we present the total cost to the provincial governments of the 4 concerned
provinces, offering these rebates on hybrid cars.
Conclusions
To be written.
Appendix A: Nested Logit Specifications.
The literature has tried to overcome issues with aggregate multinomial estimation (especially those regarding own and cross-attribute elasticities) by refining the demand structure estimated. Common refinements are using a nested logit estimation, and more general random parameter logit specifications (see Nevo, 2004 for more details). An intuitive refinement is a nested logit structure. The nested logit allows cross-attribute elasticities to be closer within a nest than outside the nest. We tried a number of different specifications. Ultimately, our preferred specification corresponds to Figure 1. The nests are defined as classes, with all hybrid cars included in a separate nest. This implies that consumers first choose either the outside good or the nest that provides the highest utility. In the second stage they choose the model providing the highest utility in the nest chosen in the first stage. This implies that hybrid vehicles are better substitutes for each other than for other cars. The results correspond to estimating the following equation.
20
0 1 2 |ln( ) ln( ) ln( )mpt opt mpt mpt gpt m pcts s R sβ β β θ λ− = + + + + (11)
we include the within-nest share of model m in its class in the corresponding province and year to account for the second stage decision of which model to choose given a choice of nest. This follows the method in Berry (1994) to estimate a nested logit choice model relying only on data on market shares.
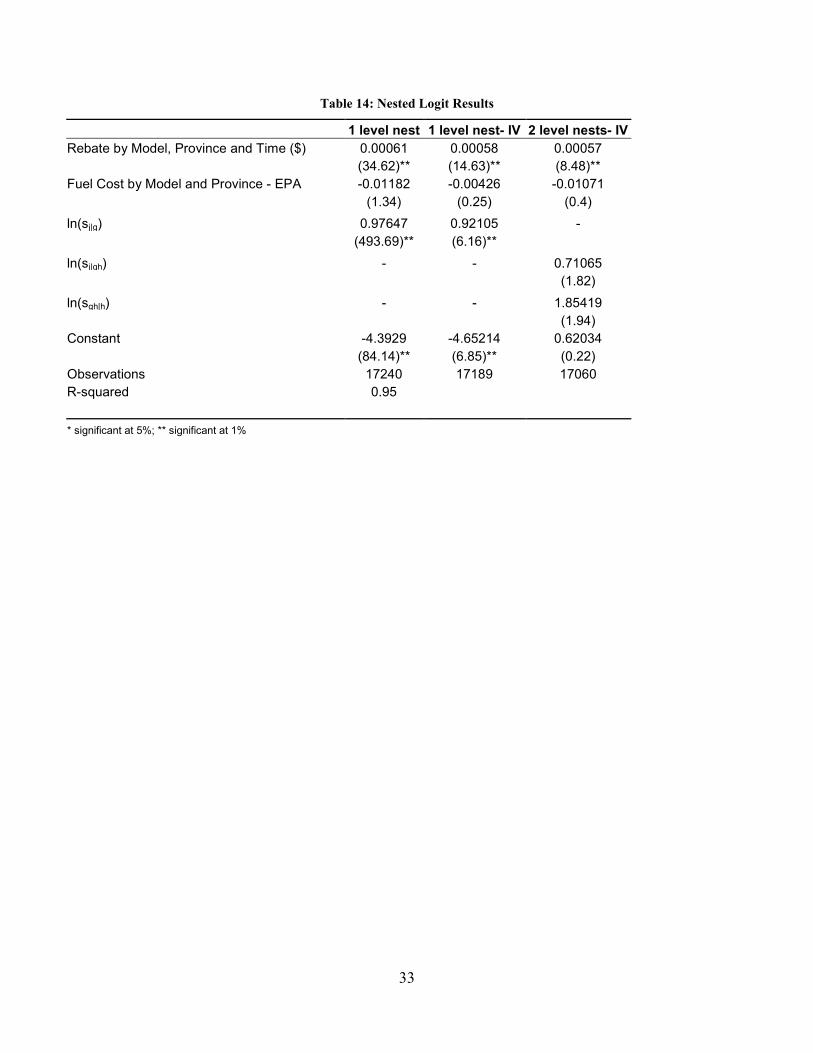
These results are presented in Table 14. The right hand side variables include model, year and province-class fixed effects. The first column contains the nested logit specification where the nests correspond to the structure shown in Figure 4. The right hand side includes the share of the given model of all models in its nest, in the give province and year. The rebate coefficient remains positive and significant. The coefficient on the inside share is close to 1; note, however, that this variable is endogenous since an increase in the share of the model relative to the outside good will necessarily increase its share relative to all models in its nest.
The next column instruments for the endogenous variable. Following the literature, we use characteristics of other models in the nest as instruments for the given model’s inside share. These characteristics are correlated with the model’s share inside the nest, but are uncorrelated with the model’s share relative to the outside good since the latter is a function only of each model’s own characteristics. In practice we use the mean fuel economy of all other cars in the nest, as well as the count of all other cars in the nest to instrument for the inside share.8 The IV regression reduces the coefficient on the inside share, while leaving the magnitude and significance of the rebate coefficient virtually unchanged.
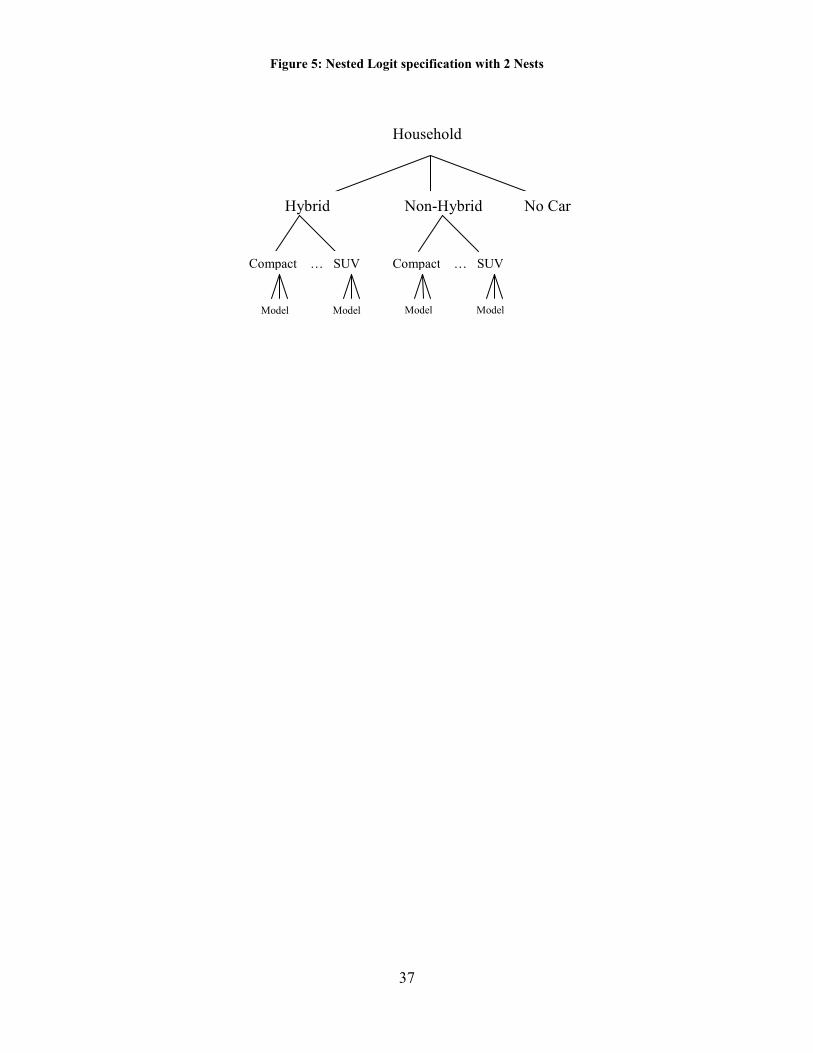
Finally, we present results, in Column 4, using a two-nest structure similar to the one shown in Figure 5. There are now two inside shares, both of which are instrumented for using similar techniques to the one described above. The coefficient on the rebate variable remains positive and highly significant, and implies a roughly 60% increase in a hybrid model’s share relative to the outside good as a result of a $1000 rebate.
We also tried specifications using other nesting structures: first allowing consumers to choose to buy a hybrid or non-hybrid car, then allowing them to choose their preferred segment, followed by the choice of model. The results on the hybrid rebate were very similar to the ones reported in Table 14 and are not presented here.
Our counterfactual estimates for our preferred nested logit model are presented in Table 17. For each province and year, the first column contains an estimate of the gasoline consumption savings under the assumption that new hybrid sales which corresponded to a decrease in consumption of the outside good resulted in an equivalent number of cars taken off the road. To do this we used data on the average fuel consumption for automobiles in each province and year, and calculated the increased efficiency from switching to hybrid cars. The second column calculates the gasoline savings from consumers who bought hybrid cars but would not have done so in the absence of a rebate. Our results suggest that, for example, over half a million liters of gasoline were saved by individuals replacing their cars with new hybrid vehicles, while about 92,000 liters were saved by individuals choosing to buy a hybrid over their otherwise preferred choice in response to the rebate.
8 We also tried using the median and standard deviation of other model’s fuel economy with similar results.
21
References
Berestenue, A. and S. Li (October 2007), “Gasoline Prices, Government Support and the Demand for Hybrid Vehicles in the US,” Mimeo, Duke University.
Berman, B. “Behind the hidden costs of hybrids.” 2007 [cited 04/11 2007], available online at http://www.hybridcars.com/economics/hidden-costs.html.
Berry S. (1994), “Estimating Discrete-Choice Models of Product Differentiation,” Rand Journal of Economics, 25, 242-262.
Diamond, D. (December 2006), “The Determinants of Hybrid-Electric Vehicle Adoption: Insights from State Registration Data,” Working Paper, School of Public Policy, George Mason University.
Gallagher, K. S., and E. J. Muehlegger (2007), “Giving Green to Get Green? Incentives and Consumer Adoption of Hybrid Vehicle Technology,” Mimeo, John F. Kennedy School of Government, Harvard University.
Hermance, D., and S. Sasaki. (November 1998). “Hybrid electric vehicles take to the streets.” IEEE Spectrum: 48-52
Kahn M. E. (September 2007), “Do Greens Drive Hummers of Hybrids? Environmental Ideology as a Determinant of Consumer Choice,” Journal of Environmental Economics and Management, 54(2), 129-145.
Linn, J. and T. Klier (2007), “Gasoline Prices and the Demand for New Vehicles: Evidence from Monthly Sales Data,” Mimeo, University of Illinois at Chicago.
Nevo (2000), “A Practitioner’s Guide to Estimation of Random-Coefficients Logit Models of Demand,” Journal of Economics & Management Strategy, 9(4), 513-548.
Reynolds, C., and M. Kandlikar. (2007). “How hybrid-electric vehicles are different from conventional vehicles: The effect of weight and power on fuel consumption.” Environmental Research Letters, 2(1): 14003
Sallee, J. (2007), “The Incidence of Tax Credits for Hybrid Vehicles,” Mimeo, Department of Economics, University of Michigan.
Turrentine, T., M. Delucchi, R. Heffner, K. Kurani, and Y. Sun. (2006), “Quantifying the benefits of hybrid vehicles.” UCD-ITS-RR-06-17.
United States Environmental Protection Agency (EPA). Fueleconomy.gov. 2007 [cited July 13 2007]. Available from www.fueleconomy.gov.
West, S. (2007), “The Effect of Gasoline Prices on the Demand for Sports Utility Vehicles,” Mimeo, Macalester College.
22
Table 1: Shares of Hybrid Vehicle Sales in Canada
Model 2000 2001 2002 2003 2004 2005 2006 2007
Chevrolet Malibu Hybrid 0% 0% 0% 0% 0% 0% 0% 0.03%
Ford Escape 0% 0% 0% 0% 7% 17% 7% 7%
Honda Accord 0% 0% 0% 0% 1% 11% 6% 2%
Honda Civic 0% 0% 51% 61% 8% 7% 16% 14%
Honda Insight 39% 21% 14% 2% 0.3% 0.1% 0.2% 0.03%
Lexus GS450H 0% 0% 0% 0% 0% 0% 2% 1%
Lexus LS 600H 0% 0% 0% 0% 0% 0% 0% 1%
Lexus RX400H 0% 0% 0% 0% 0% 15% 9% 8%
Nissan Altima Hybrid 0% 0% 0% 0% 0% 0% 0% 2%
Saturn Aura Hybrid 0% 0% 0% 0% 0% 0% 0% 0.5%
Saturn Vue Hybrid 0% 0% 0% 0% 0% 0% 2% 4%
Toyota Camry Hybrid 0% 0% 0% 0% 0% 0% 24% 39%
Toyota Highlander Hybrid 0% 0% 0% 0% 0% 12% 10% 4%
Toyota Prius 61% 79% 35% 37% 83% 37% 24% 19%
Total Hybrid Sales 426 495 513 671 2303 5124 8924 14828
Source: Polk Automotive Canada.
23
Table 2: Hybrid Models included in Data
Model Year Introduced
Ford Escape Hybrid 2004
Honda Accord Hybrid 2004
Honda Civic Hybrid 2002
Honda Insight 2000
Saturn Vue Greenline 2006
Toyota Prius 2000
Toyota Highlander H 2005
Lexus RX 400H 2005
Toyota Camry H 2006
Lexus GS 450H 2006
24
Table 3: Market Share across Vehicle Class
Size Class of Vehicles
Market Share
percentage of Total Vehicle Sales
Class 2003 2006
Passenger Cars
Compact PC 25.4% 24.8%
Hybrid 0.04% 0.41%
Intermediate PC 17.6% 14.1%
Luxury High End PC 1.8% 1.4%
Luxury PC 2.7% 3.9%
Luxury Sports PC 0.5% 0.4%
Sports PC 2.2% 2.0%
Subcompact PC 4.1% 6.4%
Light Trucks
Compact Sport Utility 7.0% 11.2%
Hybrid 0.0% 0.12%
Intermediate Sport Utility 6.6% 4.4%
Large Pickup Truck 12.7% 12.7%
Large Sport Utility 1.3% 1.1%
Large Van 1.7% 1.8%
Luxury Sport Utility 2.0% 2.8%
Small Pickup Truck 1.8% 3.0%
Small Van 12.5% 9.4%
Passenger Cars 865,873 863,292
Light Trucks 728,043 752,206
Total Vehicle Sales 1,593,916 1,615,498
Source: Authors Calculations.
25
Table 4: Tax Rebates for Hybrid Vehicles in Canadian Provinces
Province Vehicle Eligibility Rebate Amount and Timing
British Columbia Policy announced: August 2000. PST rate: 7%, with graduated increases for vehicles over $55K.
All hybrid vehicles with regenerative braking (Cars and SUVs eligible)
30% of tax paid up to $500 for vehicles bought before July 31st 2001. 30% of PST paid up to maximum of $1000 after July 31st 2001. A point of sale reduction of all PST till a maximum of $2000 after Feb 16th 2005 Additional rebates in PST (reductions in graduated increase of PST over 7%) for hybrid vehicles over 55K (see Notes (1) below)
Prince Edward Island Policy announced: March 2004 PST rate: 10%
All Hybrid Vehicles are eligible
All the PST paid until $3000, for vehicles bought after March 30th 2004.
Ontario Policy announced: May 2001, PST rate: 8%
All hybrid passenger cars (with regenerative braking) eligible 2001, SUVs eligible 2002.
PST rebate up to a maximum of $1000 for cars bought after May 10th 2001. Hybrid SUVs and trucks included June 18th, 2002. A point of sale reduction of all PST till a maximum of $2000 after March 23rd, 2006.
Quebec Policy Announced: March 2006. PST: 7.875%
See Notes (2) below All PST paid to a maximum of $1000 for vehicles bought after March 23rd 2006.
Manitoba Policy announced, November 15th 2006 PST rate: 7%.
See Notes (3) below Flat $2000 rebate for all vehicles bought after November 15th 2006.
Notes: 1. People buying light vehicles which are priced greater than $55,000 have to pay a higher PST rate. This rate increases by 1% for the first $1,000 over $55,000 and continues to increase by 1% for every additional $1,000 to a maximum of 10% (for vehicles costing more than $57,000). For hybrid vehicles the graduated increases come with an additional exemption of $7,000 on the threshold. This implies that the PST does not increase for hybrid vehicles till their price reaches $62,000. 2. Cars eligible for a rebate in Quebec are: 2005 & 2006 Honda Insight; 2005-2007 Toyota Prius; 2007 Toyota Camry Hybrid; 2008 Ford Escape Hybrid (two-wheel drive); 2005- 2007 Honda Civic Hybrid; 2005 Honda Accord Hybrid; 2007 Nissan Altima Hybrid 2. Cars eligible for a rebate in Manitoba are: Honda Insight; Lexus GS 450H; Lexus RX 400H; Toyota Camry Hybrid; Toyota Highlander Hybrid; Toyota Prius; Chevrolet – Silverado 1500 LS Hybrid; Ford Escape Hybrid; GMC Sierra 1500 SLE Hybrid; Honda Accord Hybrid; Honda Civic Hybrid; Saturn VUE Green Line
26
Table 5: Base Prices for Hybrid Vehicles
Model Year Base
Price
Civic Hybrid* 2008 $ 26,350 Insight 2004 $ 26,000 Accord Hybrid 2007 $ 38,090 Prius 2008 $ 29,500 Camry Hybrid 2008 $ 32,000 Highlander Hybrid 2008 $ 41,075 Lexus GS400h 2008 $ 71,000 Lexus RX400h 2008 $ 55,050 Lexus LSh 2008 $ 125,400 Saturn Vue Greenline 2008 $ 30,790 Saturn Aura Hybrid 2008 $ 27,575 Ford Escape Hybrid 2008 $ 31,499
Sources for the price numbers: Honda Civic - the Honda Canada website, Honda Insight - Canadian Driver, http://www.canadiandriver.com/articles/jm/04insight.htm, Honda Accord Hybrid - Canadian Driver, http://www.canadiandriver.com/articles/hl/07accordh.htm, and http://www.canadiandriver.com/articles/pw/05accord_h.htm, all Toyota models from the Toyota Canada website, all Lexus models from the Lexus Canada website, all Saturn Models from the Saturn Canada website, and the Ford Escape Hybrid from the Ford Canada website.
Table 6: Maximum Rebate possible to a Hybrid Car
Province\Year 2000 2001 2002 2003 2004 2005 2006
British Columbia $500.00 $1000 $1000 $1000 $1000 $2000 $2000 Ontario $ 0 $1,000.00 $1,000.00 $1,000.00 $1,000.00 $1,000.00 $2,000.00 Manitoba $ 0 $ 0 $ 0 $ 0 $ 0 $ 0 $ 0- Prince Edward Island $ 0 $ 0 $ 0 $ 0 $3000 $3000 $3000 Quebec $ 0 $ 0 $ 0 $ 0 $ 0 $ 0 $1,000.00
Source: Authors Calculations. Notes 1) Based on the base prices listed above and BC’s relaxation of luxury tax to hybrid vehicles the effective maximum for 2005
and 2006 was $2550.5. We use that value in the analysis. 2) Manitoba is not represented in this table. This is because we have yearly sales figures and the rebate was instituted for hybrid vehicles bought on or after November 15th 2006. For our purposes we consider a policy in effect as long as it is in force by August of the same year.
Table 7: Rebate paid to the Average Hybrid Across Provinces
Province\Year 2000 2001 2002 2003 2004 2005 2006
British Columbia $500.00 $611.23 $577.04 $581.37 $616.54 $2,045.52 $2,028.09 Ontario $ 0 $1,000.00 $1,000.00 $1,000.00 $1,000.00 $1,000.00 $2,000.00 Manitoba $ 0 $ 0 $ 0 $ 0 $ 0 $ 0 $ 0- Prince Edward Island $ 0 $ 0 $ 0 $ 0 $2,815.00 $2,970.21 $2,882.64 Quebec $ 0 $ 0 $ 0 $ 0 $ 0 $ 0 $1,000.00
Source: Authors Calculations.
27
Table 8: Market Share of Hybrid Cars across Provinces (2006)
Province Passenger Cars Light Trucks Total Vehicle Sales
Sales
Market Share of Hybrid
Sales
Market Share of Hybrid
Sales
Market Share of Hybrid
Alberta 642 0.7% 362 0.2% 1004 0.4%
BC 1499 1.5% 624 0.7% 2123 1.1%
Manitoba 207 1.0% 61 0.3% 268 0.6%
Nbrunswick 94 0.5% 21 0.1% 115 0.3%
Nfoundland 28 0.2% 16 0.1% 44 0.2%
Novascotia 150 0.5% 28 0.2% 178 0.4%
Ontario 2454 0.8% 889 0.3% 3343 0.6%
PEI 51 1.7% 7 0.4% 58 1.2%
Quebec 1053 0.4% 337 0.2% 1390 0.4%
Canada 6178 0.7% 2345 0.3% 8523 0.53%
28
Table 9: Multinomial Results
Dependent Variable Logit
Rebate by Model, Province and Time ($) 0.00036
(5.20)**
Fuel Cost by Model and Province - EPA 0.08385
(2.40)*
Province Year Fixed Effects Yes
Province Class Fixed Effects Yes
Constant Yes
Observations 17240
R-squared 0.18
Absolute value of t statistics in parentheses * significant at 5%; ** significant at 1%
Table 10: Provincial Panel Estimation for Light Vehicle Sales
(1) (2) (3)
Dependent Variable Log Sales Log Sales Log Sales
Maximum Rebate 0.00006 -0.00002 -0.00000 (3.02)** (1.18) (0.34) CPI Private Transportation
0.00017
(0.06) Population 18 + 0.00000008 (3.63)** GDP per Capita 1997 $ 31.28698 (6.27)** Year Dummies Yes Yes Constant Yes Yes Yes Observations 180 180 180 Number of groups 10 10 10 R-squared 0.0513 0.7334 0.8153 F statistic 9.13 23.23 31.32
Absolute value of t statistics in parentheses * significant at 5%; ** significant at 1%
29
Table 11: Model Specific Rebates – Panel Regression with Fixed Effects for Model Generation
(1) (2) (3) (4)
Dependent Variable Log Market Share Log Market Share Log Market Share Log Market Share
Rebate by Mode ($) 0.00038 0.00030 0.00032 0.00034 (5.16)** (4.26)** (4.56)** (5.00)** Fuel Cost – EPA No 0.01982 -0.00338 -0.00085 (0.80) (0.12) (0.03) Province Fixed-effects No Yes No No Year Fixed-effects No Yes No No Province Year Fixed-effects No No Yes No Province Class Fixed-effects No No No Yes Class Year Fixed-effects No No No Yes Constant Yes Yes Yes Yes Observations 38110 36640 36640 36640 Number of groups 895 847 847 847
R-squared 0.0007 0.0920 0.0955 0.2130 F statistic 26.59 129.47 20.78 24.70 Absolute value of t statistics in parentheses * significant at 5%; ** significant at 1%
30
Table 12: Province Level Rebates - Panel Regression with Fixed Effects for Model Generation
(1) (2) (3) (4)
Dependent Variable Log Market Share Log Market Share Log Market Share Log Market Share
Hybrid * Maximum Rebate 0.00034 0.00030 0.00030 0.00036 (5.12)** (4.65)** (4.69)** (5.82)** Maximum Rebate ($) 0.00001 -0.00003 0.00005 -0.00004 (1.24) (2.18)* (1.63) (3.18)** Fuel Cost – EPA No 0.02503 -0.00319 0.00836 (1.00) (0.11) (0.32) Province Fixed-effects No Yes No No Year Fixed-effects No Yes No No Province Year Fixed-effects No No Yes No Province Class Fixed-effects No No No Yes Class Year Fixed-effects No No No Yes Constant Yes Yes Yes Yes Observations 38110 36640 36640 36640 Number of groups 895 847 847 847
R-squared 0.0008 0.0922 0.0956 0.2133 F statistic 15.24 125.22 20.79 24.68 Absolute value of t statistics in parentheses * significant at 5%; ** significant at 1%
31
Table 13: Province Level Rebate - Panel Regression with Fixed Effects for Model Generation
(1) (2) (3) (4)
Dependent Variable Log Market
Share
Log Market
Share
Log Market
Share
Log Market
Share
C Sports Utility * Max Rebate -0.00005 -0.00003 -0.00003 -0.00006 (1.00) (0.71) (0.61) (1.17) Hybrid * Max Rebate 0.00031 0.00028 0.00030 0.00028 (4.17)** (3.99)** (4.17)** (4.06)** Intermediate PC * Max Rebate -0.00026 -0.00023 -0.00023 -0.00010 (6.06)** (5.54)** (5.44)** (2.28)* Int Sports Utility * Max Rebate
-0.00017 -0.00018 -0.00017 -0.00017
(3.57)** (3.73)** (3.57)** (3.27)** Lar Pkup Truck * Max Rebate -0.00011 -0.00010 -0.00009 -0.00001 (1.77) (1.79) (1.59) (0.13) Lar Sports Utility*Max Rebate -0.00012 -0.00015 -0.00014 -0.00005 (1.88) (2.44)* (2.25)* (0.67) Large Van * Max Rebate -0.00010 0.00007 0.00008 -0.00001 (1.35) (1.01) (1.14) (0.08) Lux Highend PC*Max Rebate 0.00023 0.00028 0.00030 -0.00009 (4.34)** (5.45)** (5.82)** (1.58) Luxury PC* Max Rebate 0.00016 0.00016 0.00017 -0.00007 (3.20)** (3.14)** (3.46)** (1.30) Lux Sports Utility* Max Rebate
0.00023 0.00024 0.00027 -0.00011
(4.66)** (4.94)** (5.39)** (1.65) Lux Sports PC * Max Rebate 0.00015 0.00019 0.00022 -0.00008 (2.63)** (3.46)** (3.84)** (1.25) Sm Pkup Truck * Max Rebate -0.00007 0.00005 0.00006 -0.00002 (1.17) (0.97) (1.07) (0.26) Small Van * Max Rebate -0.00010 -0.00010 -0.00010 -0.00009 (1.86) (2.02)* (1.90) (1.72) Sports PC * Max Rebate -0.00015 -0.00007 -0.00006 -0.00010 (2.62)** (1.21) (1.09) (1.70) Subcompact PC * Max Rebate -0.00004 -0.00006 -0.00005 -0.00002 (0.59) (0.89) (0.85) (0.34) Maximum Rebate 0.00005 -0.00001 0.00009 0.00003 (1.45) (0.30) (2.05)* (1.00) Fuel Cost – EPA No 0.01677 -0.01765 0.00831 (0.67) (0.60) (0.32) Province Fixed-effects No Yes No No Year Fixed-effects No Yes No No Province Year Fixed-effects No No Yes No Province Class Fixed-effects No No No Yes Class Year Fixed-effects No No No Yes
32
Constant Yes Yes Yes Yes Observations 38110 36640 36640 36640 Number of groups 895 847 847 847
R-squared 0.0070 0.0987 0.1024 0.2137 F statistic 16.29 91.05 20.82 23.87
Absolute value of t statistics in parentheses * significant at 5%; ** significant at 1%
33
Table 14: Nested Logit Results
1 level nest 1 level nest- IV 2 level nests- IV
Rebate by Model, Province and Time ($) 0.00061 0.00058 0.00057
(34.62)** (14.63)** (8.48)**
Fuel Cost by Model and Province - EPA -0.01182 -0.00426 -0.01071
(1.34) (0.25) (0.4)
ln(sj|g) 0.97647 0.92105 -
(493.69)** (6.16)**
ln(sj|gh) - - 0.71065
(1.82)
ln(sgh|h) - - 1.85419
(1.94)
Constant -4.3929 -4.65214 0.62034
(84.14)** (6.85)** (0.22)
Observations 17240 17189 17060
R-squared 0.95
* significant at 5%; ** significant at 1%
34
Table 15: Gasoline Savings in Thousands of Liters
Year BC ONTARIO PEI QUEBEC
2000 7.2 - - -
2001 18 62.2 - -
2002 23.9 83.3 - -
2003 24.8 116.5 - -
2004 24.9 102 2.3 -
2005 325.1 374 11.6 -
2006 462.9 1509.1 15.4 263.6
Note: Amounts represent the estimated decline in consumption due to consumers buying hybrid
cars who would otherwise have bought non-hybrids
Estimates are based on the results of equation (10) from Table 12.
Table 16: Cost of Hybrid Car Rebates in Thousands of Dollars
BC ONTARIO PEI QUEBEC
Year
2000 30.5 - - -
2001 92.3 198 - -
2002 59.4 247 - -
2003 93 262 - -
2004 395.2 953 19.7 -
2005 2865.8 1309 68.3 -
2006 4465.9 3516 158.5 909
Table 17: Gasoline Savings in Thousands of Liters
Year BC ONTARIO PEI QUEBEC
Outside good Other cars
Outside good Other cars
Outside good Other cars
Outside good Other cars
2000 17.8 3 - - - - - -
2001 21.1 3.6 124.3 24.1 - - - -
2002 26.2 5 159.1 33.9 - - - -
2003 29.1 5.3 252.7 52.9 - - - -
2004 44.3 7.5 434.8 84.4 14.4 1.7 - -
2005 483.8 84.1 330.5 65.5 21.8 2.5 - -
2006 532.9 91.7 980.4 191.8 33.8 3.7 197.5 32.1
Note: For each province the first column represents the maximum possible decline in gasoline consumption due to consumers choosing to buy a hybrid car The second column represents the estimated decline in consumption due to consumers buying hybrid cars who would otherwise have bought non-hybrids
35
Figure 1: Market Share of Hybrid Vehicles in Rebating vs. Non-Rebating Provinces
Figure 2: Market Share for Hybrid Vehicles in Selected Provinces
0.000%
0.100%
0.200%
0.300%
0.400%
0.500%
0.600%
0.700%
2000 2001 2002 2003 2004 2005 2006
Market Share (%)
Year
Canada Treated Provinces
0.000%
0.200%
0.400%
0.600%
0.800%
1.000%
1.200%
1.400%
2000 2001 2002 2003 2004 2005 2006
Market Share (%)
Year
Alberta
BC
Ontario
PEI
Quebec
36
Figure 3: Difference in the Share of Hybrid Vehicles between BC and Alberta and the Rebate in BC
0.000%
0.100%
0.200%
0.300%
0.400%
0.500%
0.600%
0.700%
0.800%
$0
$500
$1,000
$1,500
$2,000
$2,500
1998 2000 2002 2004 2006 2008
BC Max Rebate
BC-Alberta Share
Compact SUV Intermediate Hybrid
….. No car
Model Model Model
Household
Model
Figure 4: Nested Logit Specification with One Nest
37
No car
Household
Hybrid Non-Hybrid
…… SUV Compact
Model Model
…… SUV Compact
Model Model
No Car
Figure 5: Nested Logit specification with 2 Nests