Evaluating Stereo and Motion Cues for Visualizing ...
21
1 Ware and Franck TOG Info Net Vis April 20, 2000 Evaluating Stereo and Motion Cues for Visualizing Information Nets in Three Dimensions Colin Ware and Glenn Franck Faculty of Computer Science University of New Brunswick P.O. Box 4400, Fredericton, NB. E3B 5A3 [email protected] Abstract This paper concerns the benefits of presenting abstract data in 3D. Two experiments show that motion cues combined with stereo viewing can substantially increase the size of the graph that can be perceived. The first experiment was designed to provide quantitative measurements of how much more (or less) can be understood in 3D than in 2D. The 3D display used was configured so that the image on the monitor was coupled to the user's actual eye positions (and it was updated in real-time as the user moved) as well as being in stereo. Thus the effect was like a local "virtual reality" display located in the vicinity of the computer monitor. The results from this study show that head-coupled stereo viewing can increase the size of an abstract graph that can be understood by a factor of three; using stereo alone provided an increase by a factor of 1.6 and head coupling alone produced an increase by a factor of 2.2. The second experiment examined a variety of motion cues provided by head coupled perspective (as in virtual reality displays), hand guided motion and automatic rotation respectively, both with and without stereo in each case,. The results show that structured 3D motion and stereo viewing both help in understanding, but that the kind of motion is not particularly important; all improve performance, and all are more significant than stereo cues. These results provide strong reasons for using advanced 3D graphics for interacting with a large variety of information structures. Categories and Subject Descriptors: H.5.1 [Information Interfaces and Presentation]: Multimendia - Evaluation/methodology I.3.6 [Computer Graphics]: Methodology and Techniques - ergonomics. General Terms: Human Factors Additonal Key Words and Phrases: Head-coupled display, stereopsis, virtual reality, information visualization, network visualization. 1. INTRODUCTION A useful and interesting method for examining three dimensional structures is to couple a perspective stereoscopic view of a 3D scene to the user's eye positions and update the view in real-time as the user moves. The key elements of this are a high resolution monitor capable of running at a high frame rate, stereo glasses and some method for tracking the user's head position (see Figure 1) [5]. The position of the user's two eyes are computed from the head position and separate images are generated showing the correct perspective view of a set of virtual objects somewhere in the vicinity of the monitor screen. The result is a localized "Virtual Reality" (VR) environment which has a number of advantages over
Transcript of Evaluating Stereo and Motion Cues for Visualizing ...
1
Ware and Franck TOG Info Net Vis April 20, 2000
Evaluating Stereo and Motion Cues for VisualizingInformation Nets in Three Dimensions
Colin Ware and Glenn FranckFaculty of Computer ScienceUniversity of New Brunswick
P.O. Box 4400, Fredericton, NB.E3B 5A3
AbstractThis paper concerns the benefits of presenting abstract data in 3D. Two experiments showthat motion cues combined with stereo viewing can substantially increase the size of thegraph that can be perceived. The first experiment was designed to provide quantitativemeasurements of how much more (or less) can be understood in 3D than in 2D. The 3Ddisplay used was configured so that the image on the monitor was coupled to the user'sactual eye positions (and it was updated in real-time as the user moved) as well as being instereo. Thus the effect was like a local "virtual reality" display located in the vicinity of thecomputer monitor. The results from this study show that head-coupled stereo viewing canincrease the size of an abstract graph that can be understood by a factor of three; usingstereo alone provided an increase by a factor of 1.6 and head coupling alone produced anincrease by a factor of 2.2. The second experiment examined a variety of motion cuesprovided by head coupled perspective (as in virtual reality displays), hand guided motionand automatic rotation respectively, both with and without stereo in each case,. The resultsshow that structured 3D motion and stereo viewing both help in understanding, but that thekind of motion is not particularly important; all improve performance, and all are moresignificant than stereo cues. These results provide strong reasons for using advanced 3Dgraphics for interacting with a large variety of information structures.
Categories and Subject Descriptors: H.5.1 [Information Interfaces andPresentation]: Multimendia - Evaluation/methodology I.3.6 [Computer Graphics]:Methodology and Techniques - ergonomics.
General Terms: Human Factors
Additonal Key Words and Phrases: Head-coupled display, stereopsis, virtual reality,information visualization, network visualization.
1. INTRODUCTIONA useful and interesting method for examining three dimensional structures is to couple aperspective stereoscopic view of a 3D scene to the user's eye positions and update the viewin real-time as the user moves. The key elements of this are a high resolution monitorcapable of running at a high frame rate, stereo glasses and some method for tracking theuser's head position (see Figure 1) [5]. The position of the user's two eyes are computedfrom the head position and separate images are generated showing the correct perspectiveview of a set of virtual objects somewhere in the vicinity of the monitor screen. The result isa localized "Virtual Reality" (VR) environment which has a number of advantages over

2
Ware and Franck TOG Info Net Vis April 20, 2000
immersive virtual reality [1, 5], not the least of these being that the everyday workspace ofdesk, filing cabinet, co-workers and coffee mug are not excluded. In our previous work wehave called this "Fish Tank VR" to characterize its localized nature and distinguish it fromfull immersive VR [19].
The advantages of Fish Tank VR representations of conventional objects are fairly obvious.For example, an industrial designer can see her design of a telephone handset as a trulythree dimensional object, or a trainee mechanic can see the engine part and how it is insertedas if he were looking at the real thing. But what about abstract information, such as database schemas, networks of human relationships, the structure of object-oriented code orhypertext links? It is by no means clear that 3D diagrams offer any advantages over 2Dones in representing this kind of information. The present paper provides some strongevidence that 3D diagrams can offer significant advantages under the right viewingconditions. But before presenting this evidence we review some of the evidence as towhether advanced 3D viewing techniques should be used for viewing information networks.We discuss three types of evidence: perceptual, anecdotal and experimental.
1.1 How many dimensions are there in visual space?
In the following discussion we use the term visual space in the everyday sense of perceivedarea or volume, ignoring the dimensions of, for example, color and texture. Using a naiveview, moving from a 2D to a 3D display should vastly increase the amount of informationthat can be represented. Consider a 1000x1000 computer display. On a line we canperceive 1000 distinct pixels, on the plane we can perceive 10002 distinct pixels. Extendingthis logic we should be able to display 10003 distinct voxels in a 3D volume. Theserelations can be succinctly expressed by the following equations
I2D = I1D2 I3D = I2D3/2
where InD represents the information that can be perceived given an n-dimensional display.
Clearly there is a flaw in this logic; in general we do not perceive volumes of data; we donot perceive details of the insides of solids, only the layout of surfaces in space. This placesan upper bound on the amount of information that can be represented in a 3D space.
Using a different naive view we can argue that since stereo 3D viewing is based on inputfrom two eyes this can at most double the amount of information perceivable, and we knowthat such effects as binocular rivalry mean that truly independent images from the two eyescannot be perceived [10]. In fact it is only possible to extract depth information from highlycorrelated information presented to the two eyes. This alternative pessimistic view can beexpressed by the equation
I3D = C*I2D
where C is some constant < 2.0; probably much closer to one than to two, due to thiscorrelation.
This second view suggests that moving from 2D to 3D will only yield a small benefit invisualization, at least for the understanding of abstract data. If this view is correct it will be
3
Ware and Franck TOG Info Net Vis April 20, 2000
hardly worthwhile using 3D representations of abstract multidimensional networks ofinformation; a 2D view is likely to be equally effective and much simpler to produce.
There is a third view based on the ecological argument that because we have evolved in a 3Dworld, information presented in 3D will be processed more easily by the visual system.Networks of information do not have an inherent dimensionality in the geometric sense butif our brains prefer 3D layouts then a 3D layout may be more effective in conveying theinformation [15]. We should also allow that the brain is capable of integrating informationfrom the sequence of views of the world that are obtained as we move about and that thisconsiderably increases the amount of information obtainable, although as with stereopsisthese views must be highly correlated.
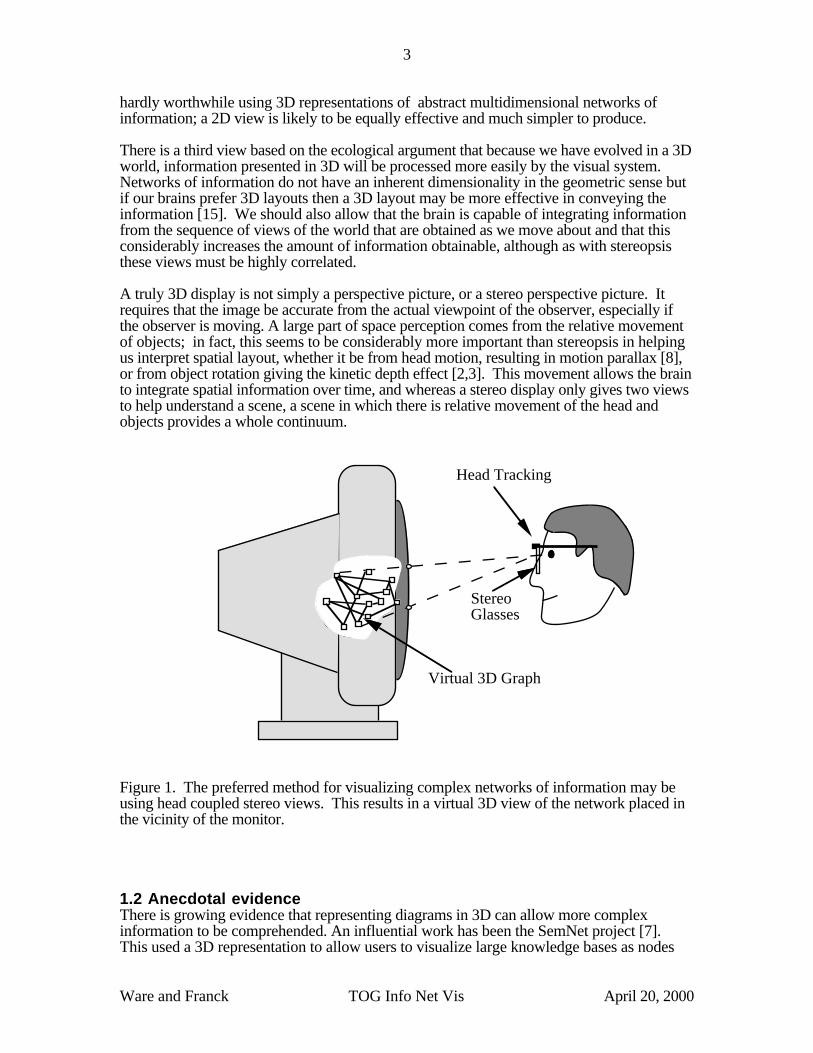
A truly 3D display is not simply a perspective picture, or a stereo perspective picture. Itrequires that the image be accurate from the actual viewpoint of the observer, especially ifthe observer is moving. A large part of space perception comes from the relative movementof objects; in fact, this seems to be considerably more important than stereopsis in helpingus interpret spatial layout, whether it be from head motion, resulting in motion parallax [8],or from object rotation giving the kinetic depth effect [2,3]. This movement allows the brainto integrate spatial information over time, and whereas a stereo display only gives two viewsto help understand a scene, a scene in which there is relative movement of the head andobjects provides a whole continuum.
StereoGlasses
Virtual 3D Graph
Head Tracking
Figure 1. The preferred method for visualizing complex networks of information may beusing head coupled stereo views. This results in a virtual 3D view of the network placed inthe vicinity of the monitor.
1.2 Anecdotal evidenceThere is growing evidence that representing diagrams in 3D can allow more complexinformation to be comprehended. An influential work has been the SemNet project [7].This used a 3D representation to allow users to visualize large knowledge bases as nodes
4
Ware and Franck TOG Info Net Vis April 20, 2000
and arcs in a three dimensional space. No attempt was made to quantify the advantages ofthis mode of viewing over 2D layouts but much of the current interest in 3D abstract datavisualization can be traced to this study.
The Cone Tree technique developed by Robertson et al. [16] has the capacity to showconsiderably more tree structured data than do more conventional 2D layouts. In a ConeTree all the children of a node are displayed around the base of a cone in 3D space and thisprinciple is applied recursively. The authors claim that as many as one thousand nodesmay be displayable using Cone Trees without visual clutter - this is clearly more than couldbe contained in a 2D layout, although the Cone Trees require certain user manipulations toaccess some of the information. However, on the other side of the argument there are 2Dlayout schemes that also claim to increase the amount of information displayable [11].
1.3 Empirical evidenceOf particular relevance to the display of information networks is work that has shown thatthe number of errors in detecting paths through tree structures is substantially reduced if a3D display method is used [18,19]. Sollenberger and Milgram showed that both scenerotation and stereopsis helped reduce errors in a path tracing task [17,18]. In their motionconditions the stimulus pattern rocked back and forth about a vertical axis (the perspectiveimagery was not coupled to head position). They found that motion was more valuable thanstereopsis in reducing errors when subjects were required to discover to which of two treeroots a highlighted leaf node was attached. In a similar experiment Ware et al. used asimilar task with a head coupled stereo display in which the perspective view was coupled tothe measured eye position of the observer [19]. Although in Ware et al's display the motionwas caused by head movement, the results were similar to those obtained previously bySollenberger and Milgram. Since the geometric transformation of the image which mayoccur under head coupling or scene rotation may be very similar there is every reason tosuppose that the same visual mechanisms are involved in both cases in constructing a 3Dinterpretation of the world.
A simple model for the integration of different depth cues is a weighted additive model [3],according to which the brain computes a weighted sum of different information indetermining the depth that will be perceived. Sollenberger and Milgram found their datasuggested a super-additive model, however the relationship between depth perception andpercent correct in a path tracing task was not made clear. Conversely, the data of Ware et alis sub-additive, although the same reservations about the link between the model and thedata apply. Also, their experiment resulted in much lower error rates, and ceiling effectswere undoubtedly present.
1.4 Motivation for new studiesA number of unanswered questions are posed by the above studies. The first and mostfundamental question is how much is gained by moving from a 2D to a 3D representation.While a completely general answer to this question can never be expected because theanswer must to some extent be task specific, any answer derived from an abstract task suchas path tracing in networks of nodes and arcs will generalize to the large set of problemsthat can be represented in this way. There is also the more profound question related to theissue of how depth information from different cues is integrated in the brain. By measuring
5
Ware and Franck TOG Info Net Vis April 20, 2000
task performance with a series of graphs of different sizes under different viewingconditions it should be possible to determine the function relating error rate to graph sizefor each condition. If these functions appear to belong to the same family we can modeltheir relationship.
A second question is whether the results of Sollenberger and Milgram and Ware et algeneralize to arbitrary graphs other than trees. This is important because tree layout is arelatively simple, well understood process and it is trivial to lay out a pair of trees in a planeso that they do not overlap. Hence the visualization problem posed by the previous studiescould easily be solved without resorting to a 3D display. This is not the case for anarbitrary graph where the layout problem is more difficult and the advantages of 3Dvisualization may be more pronounced. While much of the work on 2D layout of directedgraphs has been directed at minimizing arc crossings, the algorithms are often complex [6].We hypothesize that 3D visualization will to some extent reduce the graph crossing problembecause arcs will no longer appear in the plane of the screen.
A third question is what kind of motion is better for perceiving structure in informationnetworks:
a) motion induced by perspective coupled to eye position,b) automatic rotation of the object, orc) motion caused by linking the user's hand movements to the object.
Both Sollenberger and Milgram and Ware et al. showed advantages of motion ininformation perception but the kind of motion was different in the two cases: scene rotationin the former case (causing the kinetic depth effect) and head motion in the latter (causingmotion parallax). It should be noted that lateral motion of the viewpoint produces a verysimilar transformation to rotation of the scene about a vertical axis through the center of thescene. This leads to the hypothesis that both kinds of structured transformations maycontribute to 3D space perception in similar ways to enhance network comprehension.However, it might be that the active search allowed by viewing modes a) and c) are critical tounderstanding since under these conditions the user has control over the view of the scene.
Experiment 1a was designed to address the first and second of the above questions, whileExperiment 1b was designed to supplement 1a which yielded only an incomplete answer.Experiment 2 was designed to address the third question.
2. EXPERIMENT 1a: HOW MUCH BETTER IS A 3D/STEREO
DISPLAY FOR PATH TRACING IN A GRAPH?
The purpose of this experiment was to provide a quantitative estimate of the improvementsin graph understanding offered by adding head coupling and stereo disparity cues to thedisplay. We chose path tracing in a graph as the task, because a graph is a very generaldata structure used to reprensent an information network. We chose error rates as thedependent variable because the previous studies decribed above [1, 17] have shown this tobe highly sensitive to the mode of viewing. In addition, the ability to trace information pathsaccurately is fundamental to understanding information networks. The answer we werelooking for was of the form "adding head coupled stereo increases the size of a graph thatcan be understood by a factor of X". In order to make such an evaluation we designed anexperiment with a range of graph sizes in the hope that the data would yield a family of
6
Ware and Franck TOG Info Net Vis April 20, 2000
curves (error rate as a function of graph size) to allow valid comparisons between viewingconditions. Two viewing conditions were used initially.
1) 2D: no stereo, no rotation; the 3D graph was projected onto a 2D plane using anorthographic (parallel) projection by removing Z axis information, hence no depthinformation was presented.
2) Stereo, head coupled perspective: The correct perspective view was generated foreach eye position (continuously updated) using an apparatus as shown in Figures 1 and 2.The perspective was continuously updated based on the measured head position (andderived eye position) of the subject.
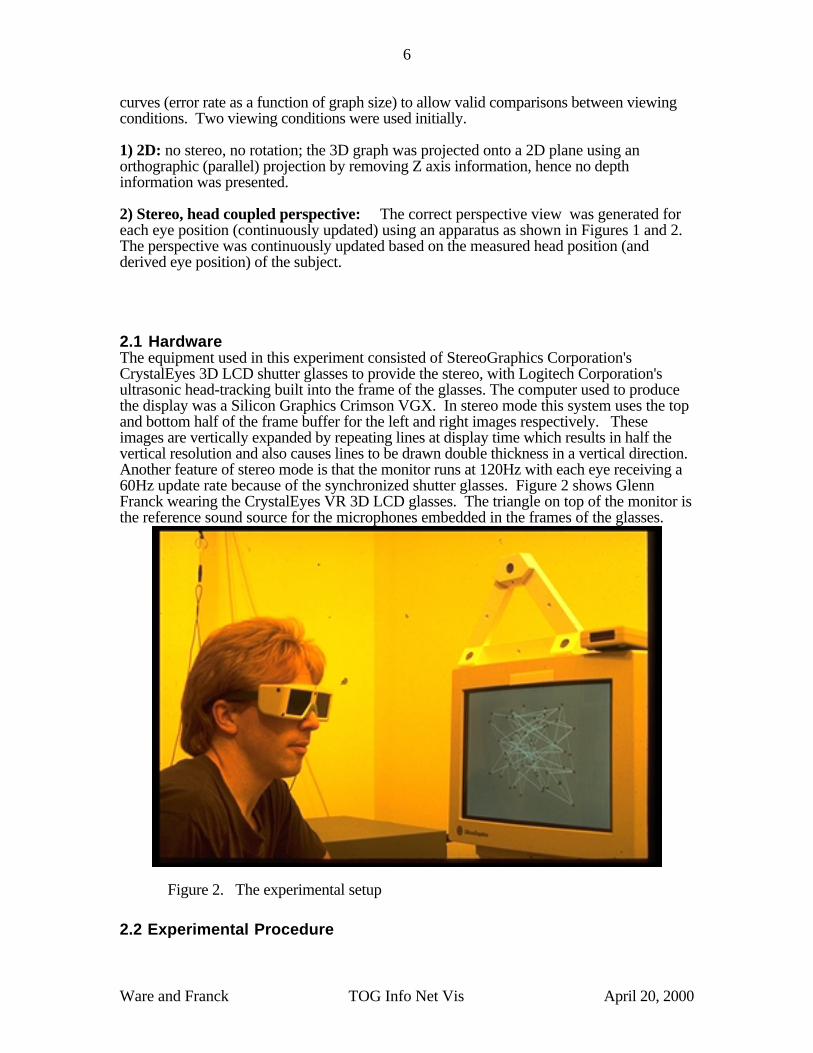
2.1 HardwareThe equipment used in this experiment consisted of StereoGraphics Corporation'sCrystalEyes 3D LCD shutter glasses to provide the stereo, with Logitech Corporation'sultrasonic head-tracking built into the frame of the glasses. The computer used to producethe display was a Silicon Graphics Crimson VGX. In stereo mode this system uses the topand bottom half of the frame buffer for the left and right images respectively. Theseimages are vertically expanded by repeating lines at display time which results in half thevertical resolution and also causes lines to be drawn double thickness in a vertical direction.Another feature of stereo mode is that the monitor runs at 120Hz with each eye receiving a60Hz update rate because of the synchronized shutter glasses. Figure 2 shows GlennFranck wearing the CrystalEyes VR 3D LCD glasses. The triangle on top of the monitor isthe reference sound source for the microphones embedded in the frames of the glasses.
Figure 2. The experimental setup
2.2 Experimental Procedure
7
Ware and Franck TOG Info Net Vis April 20, 2000
The subject's task was to decide whether there was a path of length two connecting twonodes which were highlighted in a randomly laid out graph. On each experimental trial therewas either a path of length two (with an intervening node between the two highlightednodes) or no path, with a 50% probability of each occurring.
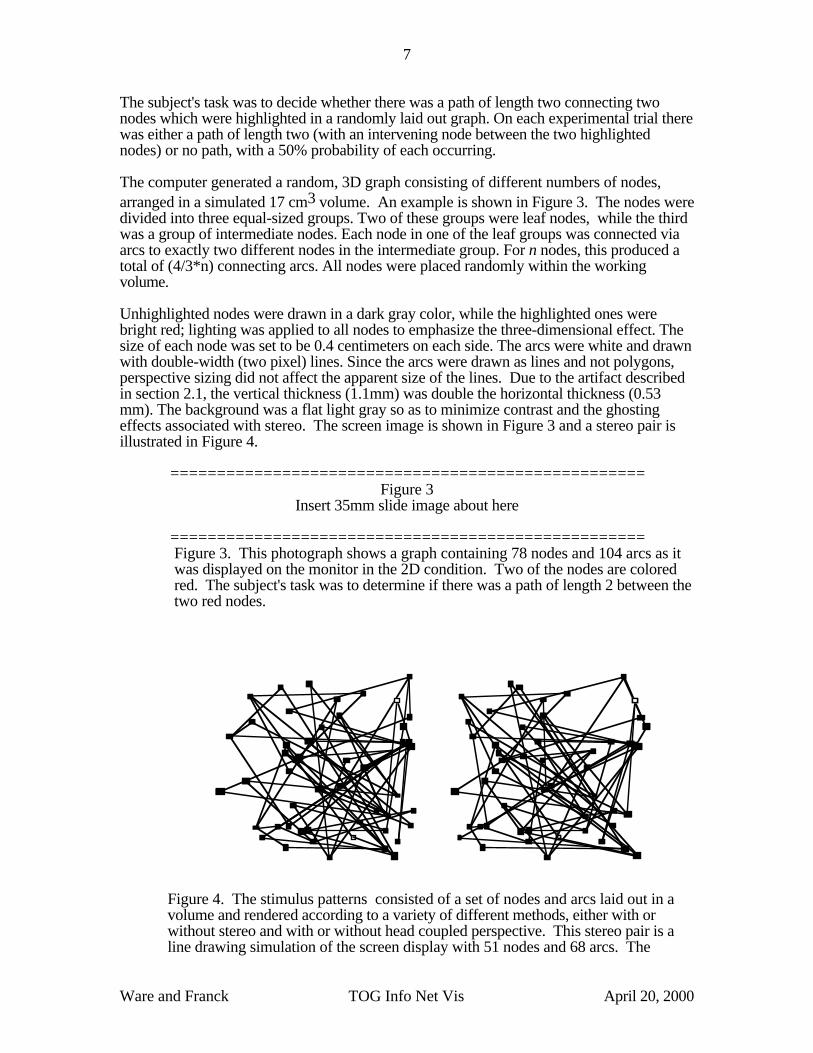
The computer generated a random, 3D graph consisting of different numbers of nodes,arranged in a simulated 17 cm3 volume. An example is shown in Figure 3. The nodes weredivided into three equal-sized groups. Two of these groups were leaf nodes, while the thirdwas a group of intermediate nodes. Each node in one of the leaf groups was connected viaarcs to exactly two different nodes in the intermediate group. For n nodes, this produced atotal of (4/3*n) connecting arcs. All nodes were placed randomly within the workingvolume.
Unhighlighted nodes were drawn in a dark gray color, while the highlighted ones werebright red; lighting was applied to all nodes to emphasize the three-dimensional effect. Thesize of each node was set to be 0.4 centimeters on each side. The arcs were white and drawnwith double-width (two pixel) lines. Since the arcs were drawn as lines and not polygons,perspective sizing did not affect the apparent size of the lines. Due to the artifact describedin section 2.1, the vertical thickness (1.1mm) was double the horizontal thickness (0.53mm). The background was a flat light gray so as to minimize contrast and the ghostingeffects associated with stereo. The screen image is shown in Figure 3 and a stereo pair isillustrated in Figure 4.
===================================================Figure 3
Insert 35mm slide image about here
===================================================Figure 3. This photograph shows a graph containing 78 nodes and 104 arcs as itwas displayed on the monitor in the 2D condition. Two of the nodes are coloredred. The subject's task was to determine if there was a path of length 2 between thetwo red nodes.
Figure 4. The stimulus patterns consisted of a set of nodes and arcs laid out in avolume and rendered according to a variety of different methods, either with orwithout stereo and with or without head coupled perspective. This stereo pair is aline drawing simulation of the screen display with 51 nodes and 68 arcs. The

8
Ware and Franck TOG Info Net Vis April 20, 2000
images are set up for crossed eye viewing. If they are inverted they can be viewedeither with a stereo viewing device or with the eyes parallel (something that requiresconsiderable practice).
Five graph sizes were used for each of the two viewing conditions.
Graph #nodes #arcs1 24 322 51 683 78 1044 105 1405 132 176
This resulted in 10 size/condition combinations. Each of these was examined using twoseparate sets of 20 trials for each subject giving a total of 40 trials per condition. The graphremained the same throughout a trial set, but for each trial a different pair of nodes werehighlighted. The highlighted nodes were actually connected on 50% of the trials, randomlydetermined.
For each subject the experiment was divided into two experimental sessions administered onseparate days with a complete set of conditions given on a pseudo-random order on eachday. Before beginning the experiment each day, the subject was given a short warm-upwhich presented two trials under each of the conditions, but only using three of the fivecomplexities (low, middle and high) for each condition.
Prior to each block of trials subjects were told which experimental condition to expect. Oneach trial subjects were given as much time as required to respond which they did bypressing a specified mouse button. The response time and the response validity wererecorded.
Due to the different graph sizes, and the relatively high numbers of polygons to draw in themore complex scenes, the update rate was reduced to 30 updates per second for allconditions. That is, the scene was redrawn into the frame buffer 30 times per second.However, the video refresh rate was 120 Hz (60 Hz for each eye). The subject wore thestereo glasses regardless of whether the condition required them in order to avoid effectsrelated solely to the reduced luminance caused by the glasses.
Eleven subjects took part in this experiment, eight of whom had used similar apparatusand/or graphics systems before.
9
Ware and Franck TOG Info Net Vis April 20, 2000
0
1 0
2 0
3 0
4 0
5 0
%
Err
or
0 2 0 4 0 6 0 8 0 100 120Number of Nodes
2D Stereo head coupled perspective
140
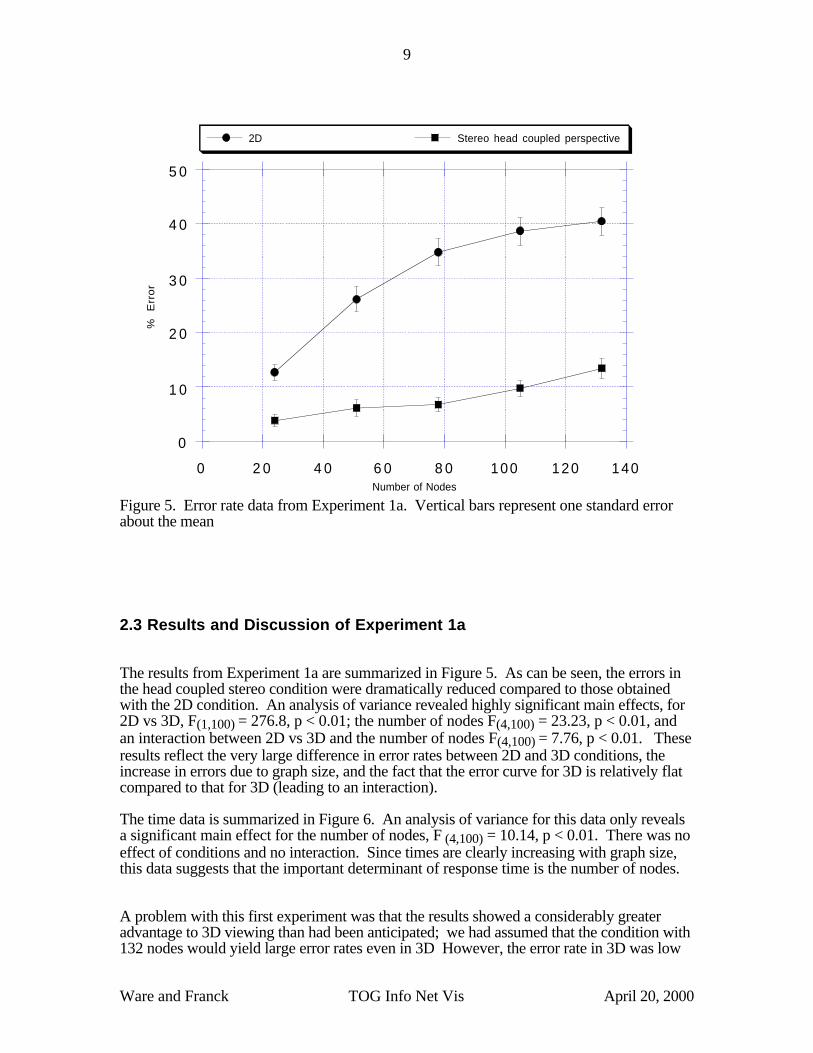
Figure 5. Error rate data from Experiment 1a. Vertical bars represent one standard errorabout the mean
2.3 Results and Discussion of Experiment 1a
The results from Experiment 1a are summarized in Figure 5. As can be seen, the errors inthe head coupled stereo condition were dramatically reduced compared to those obtainedwith the 2D condition. An analysis of variance revealed highly significant main effects, for2D vs 3D, F(1,100) = 276.8, p < 0.01; the number of nodes F(4,100) = 23.23, p < 0.01, andan interaction between 2D vs 3D and the number of nodes F(4,100) = 7.76, p < 0.01. Theseresults reflect the very large difference in error rates between 2D and 3D conditions, theincrease in errors due to graph size, and the fact that the error curve for 3D is relatively flatcompared to that for 3D (leading to an interaction).
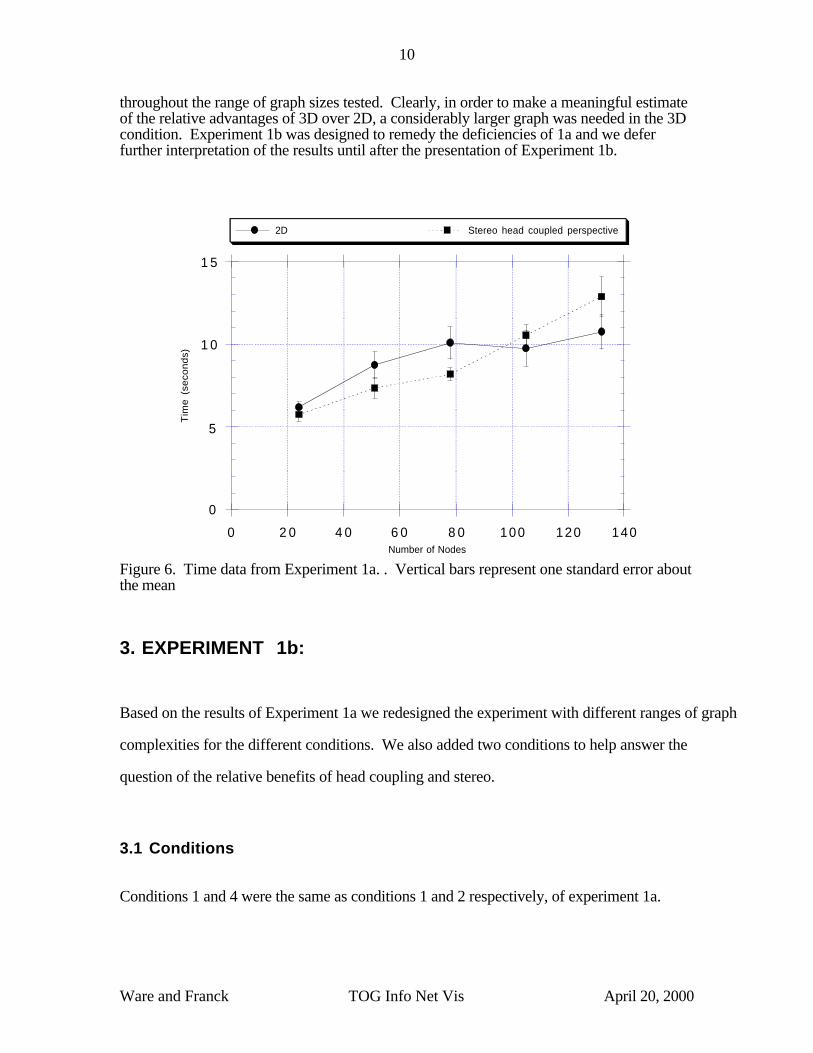
The time data is summarized in Figure 6. An analysis of variance for this data only revealsa significant main effect for the number of nodes, F (4,100) = 10.14, p < 0.01. There was noeffect of conditions and no interaction. Since times are clearly increasing with graph size,this data suggests that the important determinant of response time is the number of nodes.
A problem with this first experiment was that the results showed a considerably greateradvantage to 3D viewing than had been anticipated; we had assumed that the condition with132 nodes would yield large error rates even in 3D However, the error rate in 3D was low
10
Ware and Franck TOG Info Net Vis April 20, 2000
throughout the range of graph sizes tested. Clearly, in order to make a meaningful estimateof the relative advantages of 3D over 2D, a considerably larger graph was needed in the 3Dcondition. Experiment 1b was designed to remedy the deficiencies of 1a and we deferfurther interpretation of the results until after the presentation of Experiment 1b.
0
5
1 0
1 5
0 2 0 4 0 6 0 8 0
Tim
e (
seco
nd
s)
1 00 120 140Number of Nodes
2D Stereo head coupled perspective
Figure 6. Time data from Experiment 1a. . Vertical bars represent one standard error aboutthe mean
3. EXPERIMENT 1b:
Based on the results of Experiment 1a we redesigned the experiment with different ranges of graph
complexities for the different conditions. We also added two conditions to help answer the
question of the relative benefits of head coupling and stereo.
3.1 Conditions
Conditions 1 and 4 were the same as conditions 1 and 2 respectively, of experiment 1a.

11
Ware and Franck TOG Info Net Vis April 20, 2000
1) 2D: no stereo, no rotation; the 3D graph was projected onto a 2D plane using anorthographic (parallel) projection by removing Z axis information, hence no overlapinformation was available.
2) Stereo perspective: no rotation; this condition made use of a pair of StereoGraphicsCrystalEyes LCD shutter glasses to provide the disparity depth cues.
3) Head coupled perspective: the scene's perspective projection changed continuouslyaccording to the subject's measured head position; the perspective projection was defined bya single viewpoint centered between the eyes.
4) Stereo, head coupled perspective: same as above, except with stereo. The correctview was generated for each eye position (continuously updated).
The numbers of nodes used in the different conditions were as follows.1) 21, 42, 63, 84, 1052) 51, 81, 111, 141, 1713) 81, 117, 153, 189, 2254) 111, 156, 201, 249, 291To obtain the number of arcs multiply by 4/3.
The procedure for Experiment 1b was in most respects identical to Experiment 1a exceptthat the number or trials per condition/size combination was reduced to 12 to keep thesession time to a manageable size. This experiment involved 11 participants, six of whomhad been exposed to a similar environment before. There was one person from Experiment1a that took part in Experiment 1b as well.
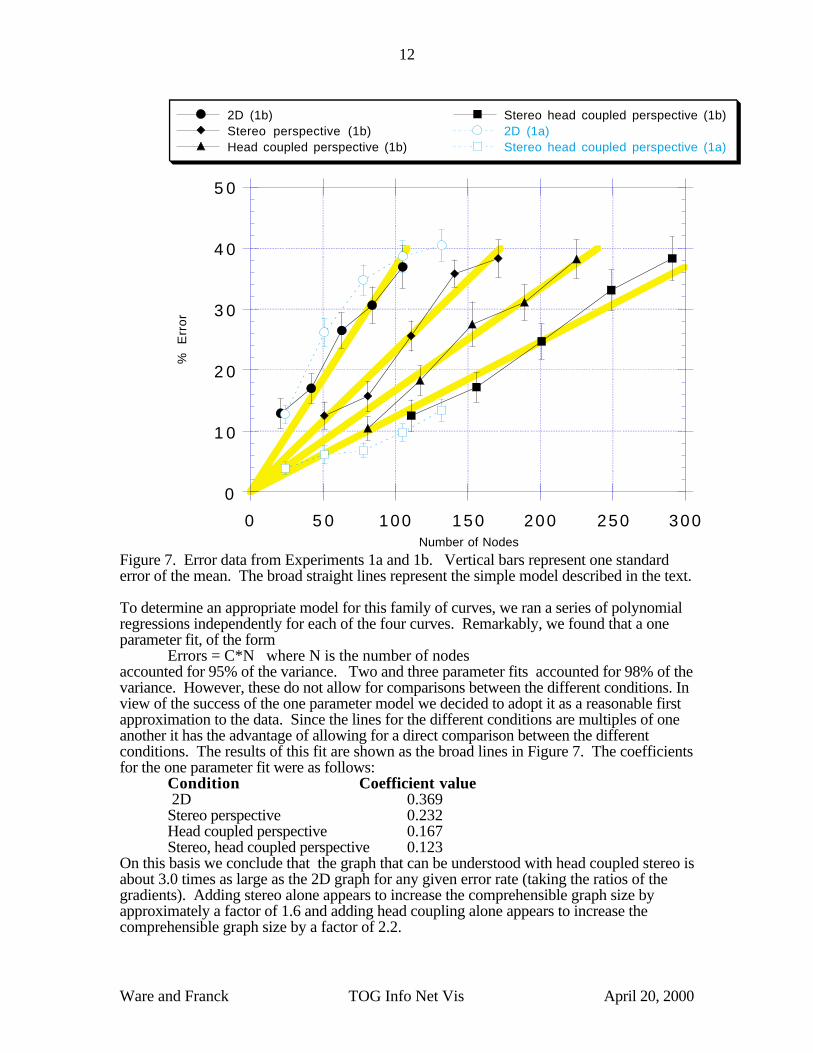
3.2 Results and Discussion of Experiment 1bFigure 7 summarizes the error data from this experiment, with data from Experiment 1aincluded for comparison. It shows a sequence of curves with varying gradients whichappear to be roughly multipliers of each other with respect to the graph size. That is, errorrate appears to be directly proportional to the number of nodes, with a different gradient forthe different conditions.
12
Ware and Franck TOG Info Net Vis April 20, 2000
0
1 0
2 0
3 0
4 0
5 0
0
%
Err
or
5 0 100 150 200 250 300Number of Nodes
2D (1b)Stereo perspective (1b)Head coupled perspective (1b)
Stereo head coupled perspective (1b)2D (1a)Stereo head coupled perspective (1a)
Figure 7. Error data from Experiments 1a and 1b. Vertical bars represent one standarderror of the mean. The broad straight lines represent the simple model described in the text.
To determine an appropriate model for this family of curves, we ran a series of polynomialregressions independently for each of the four curves. Remarkably, we found that a oneparameter fit, of the form
Errors = C*N where N is the number of nodesaccounted for 95% of the variance. Two and three parameter fits accounted for 98% of thevariance. However, these do not allow for comparisons between the different conditions. Inview of the success of the one parameter model we decided to adopt it as a reasonable firstapproximation to the data. Since the lines for the different conditions are multiples of oneanother it has the advantage of allowing for a direct comparison between the differentconditions. The results of this fit are shown as the broad lines in Figure 7. The coefficientsfor the one parameter fit were as follows:
Condition Coefficient value 2D 0.369Stereo perspective 0.232Head coupled perspective 0.167Stereo, head coupled perspective 0.123
On this basis we conclude that the graph that can be understood with head coupled stereo isabout 3.0 times as large as the 2D graph for any given error rate (taking the ratios of thegradients). Adding stereo alone appears to increase the comprehensible graph size byapproximately a factor of 1.6 and adding head coupling alone appears to increase thecomprehensible graph size by a factor of 2.2.

13
Ware and Franck TOG Info Net Vis April 20, 2000
To test the significance of these differences we divided the subject means by the number ofnodes in each condition to remove covariance due to the diffent numbers of nodes. We thenconducted pairwise analyses of variance. The results revealed that each of the fourconditions was significantly different from the others with p <0.01.condition 2 vs condition 1 F(1,100) = 34.54 p < 0.01condition 3 vs condition 2 F(1,100) = 15.68 p < 0.01condition 4 vs condition 3 F(1,100) = 8.69 p < 0.01With differences as large as these it seems safe to assume transitivity. Thus we concludethat all conditions were different with respect to error rates.
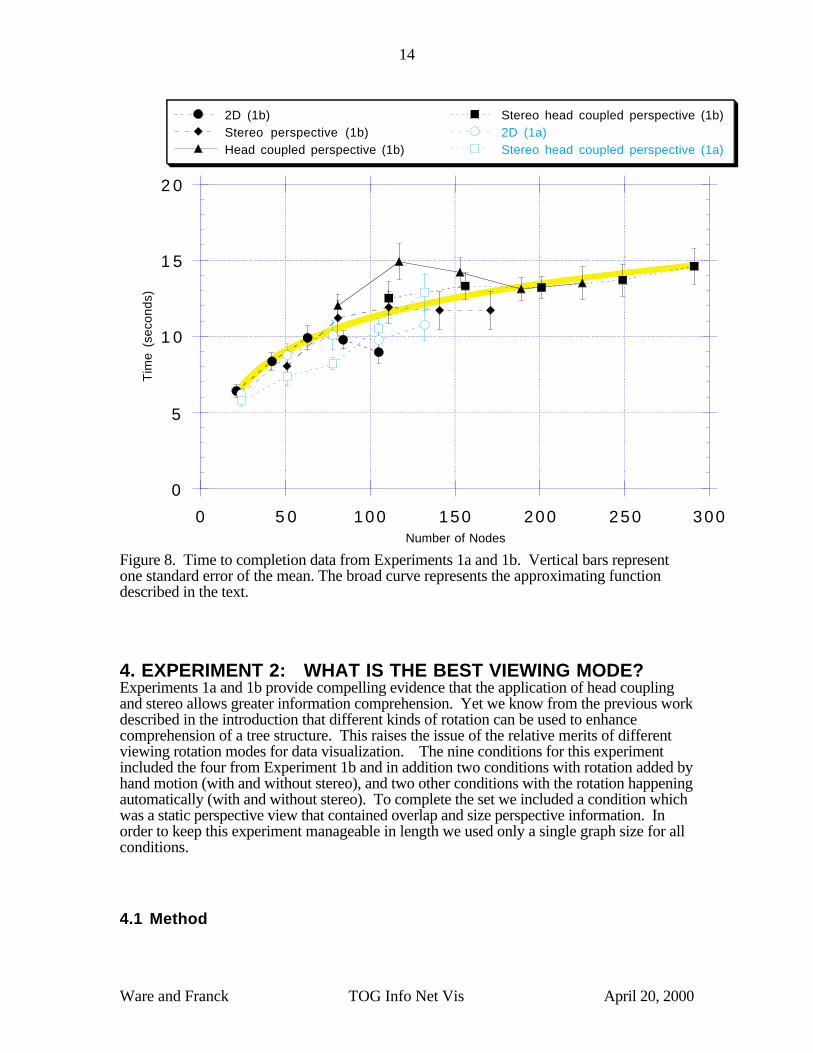
The average time for completion data is summarized in Figure 8. Completion time appearsto depend more on the number of nodes and arcs in the graph than on the viewing mode aswas shown in Experiment 1a, although there is evidence for different asymptotes for thedifferent viewing modes. The times increase to about 13 seconds with approximately 100nodes after which the curve levels off. The increasing part of the curve suggests that thetime to process the data depends on the number of nodes, whereas the asymptote mayrepresent the amount of time it takes for a subject to feel that they have extracted all theyusefully can from the data. This asymptote is lower for 2D viewing presumably because thegraph appears as a hopeless jumble sooner than it does for the 3D viewing modes. Wefound that the best fit to this data to be a function of the logarithm of the number of nodes:
Time = 3.21 loge(N/ 3.57). r2 = 0.77
This function is represented by the broad line shown in Figure 8.
14
Ware and Franck TOG Info Net Vis April 20, 2000
0
5
1 0
Tim
e (s
econ
ds)
1 5
2 0
0 5 0 100 150 200Number of Nodes
250 300
2D (1b)Stereo perspective (1b)Head coupled perspective (1b)
Stereo head coupled perspective (1b)2D (1a)Stereo head coupled perspective (1a)
Figure 8. Time to completion data from Experiments 1a and 1b. Vertical bars representone standard error of the mean. The broad curve represents the approximating functiondescribed in the text.
4. EXPERIMENT 2: WHAT IS THE BEST VIEWING MODE?Experiments 1a and 1b provide compelling evidence that the application of head couplingand stereo allows greater information comprehension. Yet we know from the previous workdescribed in the introduction that different kinds of rotation can be used to enhancecomprehension of a tree structure. This raises the issue of the relative merits of differentviewing rotation modes for data visualization. The nine conditions for this experimentincluded the four from Experiment 1b and in addition two conditions with rotation added byhand motion (with and without stereo), and two other conditions with the rotation happeningautomatically (with and without stereo). To complete the set we included a condition whichwas a static perspective view that contained overlap and size perspective information. Inorder to keep this experiment manageable in length we used only a single graph size for allconditions.
4.1 Method
15
Ware and Franck TOG Info Net Vis April 20, 2000
Eighteen trials were conducted under each of nine conditions (described below). There werealways 75 nodes and 100 arcs in every trial. Otherwise the method was the same as forExperiments 1a and 1b. Once again, eleven subjects were used. Five of these subjects hadhad exposure to a similar set-up before, and there were two participants who were involvedin both experiments 1b and 2.
4.2 Conditions
1) 2D: no stereo, no rotation; the 3D graph was projected onto a 2D plane using anorthographic (parallel) projection by removing Z axis information, hence no overlapinformation was available.
2) Static Perspective: no stereo, no rotation; essentially the same task as in 1) above,except that the graph is displayed using a perspective projection with the depth cues ofrelative size and overlap/occlusion. Conditions 2 through 9 all used a perspectiveprojection.
3) Stereo: no rotation; this condition made use of a pair of StereoGraphics CrystalEyesLCD shutter glasses to provide disparity depth cues.
4) Passive rotation: no stereo; the scene rotated at a constant angular velocity of 20degrees/sec about a vertical axis.
5) Stereo, passive rotation: same as above except with stereo.
6) Hand coupled: no stereo, hand coupled; lateral movement of the mouse caused rotationof the scene about a vertical axis; mouse movement towards and away from the subjectcaused rotation of the scene about a horizontal axis. Movement was restricted to ±128°about the vertical axis and ±49.1° tilt (about the horizontal axis).
7) Stereo, hand coupled: same as above, except with stereo.
8) Head coupled perspective: the scene's projection changed continuously according tothe subject's head position; the perspective projection was defined by a single viewpointcentered between the eyes.
9) Stereo, head coupled perspective: same as above, except with stereo. The correctview was generated for each eye position. Fish Tank VR.
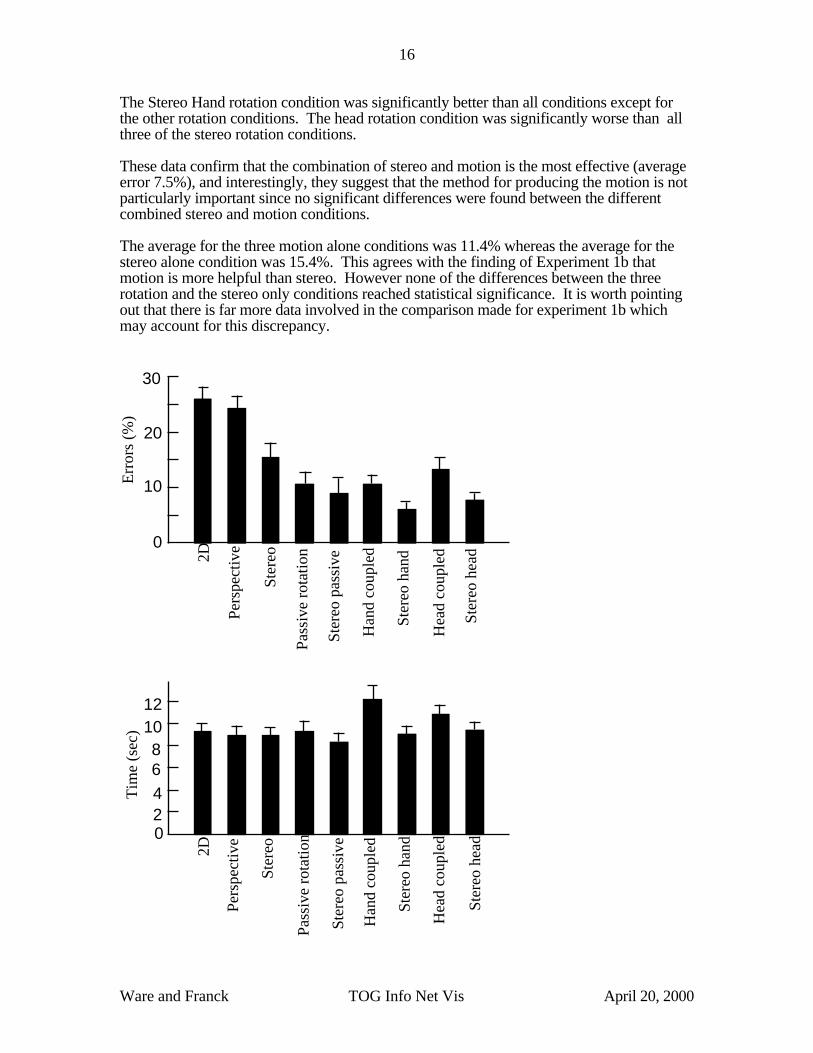
4.3 Results from Experiment 2The results are summarized in Figure 9. The main difference between conditions is found inerror rates. These ranged from a high of 26% in the 2D condition down to a low of 6.1% inthe stereo hand coupled condition.
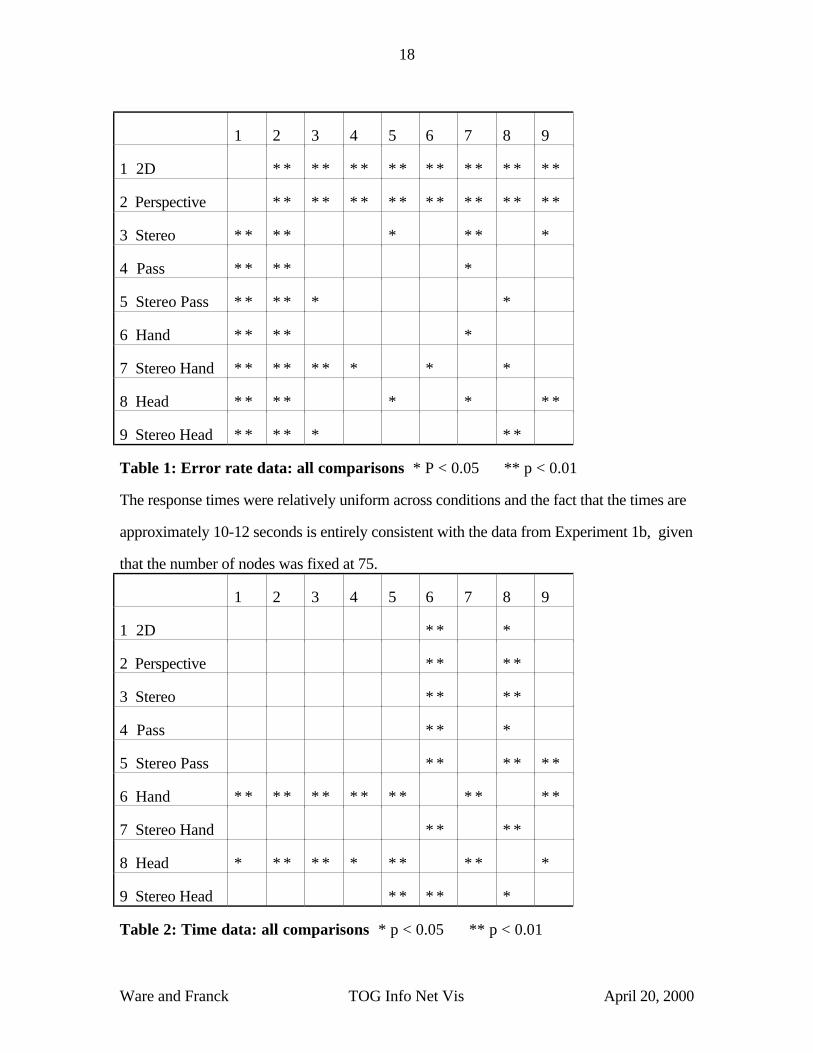
We applied pairwise t-tests for all combinations of conditions and the results are given inTables 1 and 2. The results from large numbers of t-tests must be treated with some cautionsince 1 in 20 statistical differences (at the 0.05 level) will be a false positive.
The two 2D conditions gave significantly higher error rates than all other conditionsalthough they did not differ significantly from each other. Other than this we find that allthree stereo conditions with motion were better than the stereo condition without motion.
16
Ware and Franck TOG Info Net Vis April 20, 2000
The Stereo Hand rotation condition was significantly better than all conditions except forthe other rotation conditions. The head rotation condition was significantly worse than allthree of the stereo rotation conditions.
These data confirm that the combination of stereo and motion is the most effective (averageerror 7.5%), and interestingly, they suggest that the method for producing the motion is notparticularly important since no significant differences were found between the differentcombined stereo and motion conditions.
The average for the three motion alone conditions was 11.4% whereas the average for thestereo alone condition was 15.4%. This agrees with the finding of Experiment 1b thatmotion is more helpful than stereo. However none of the differences between the threerotation and the stereo only conditions reached statistical significance. It is worth pointingout that there is far more data involved in the comparison made for experiment 1b whichmay account for this discrepancy.St
ereo
pas
sive
Pass
ive
rota
tion
2D
Pers
pect
ive
Ster
eo h
and
Hea
d co
uple
d
Ste
reo
head
Ster
eo
0
42
6
1012
8
Tim
e (s
ec)
Han
d co
uple
d
2D
Pers
pect
ive
Ster
eo
10
20
30
Err
ors
(%)
Ster
eo p
assi
ve
Pass
ive
rota
tion
Ster
eo h
and
Hea
d co
uple
d
Ste
reo
head
Han
d co
uple
d0

17
Ware and Franck TOG Info Net Vis April 20, 2000
Figure 9. The results for Experiment 2. There were small differences between times for thedifferent conditions but large differences in error rates. Vertical bars represent one standarderror of the mean.
18
Ware and Franck TOG Info Net Vis April 20, 2000
1 2 3 4 5 6 7 8 9
1 2D * * * * * * * * * * * * * * * *
2 Perspective * * * * * * * * * * * * * * * *
3 Stereo * * * * * * * *
4 Pass * * * * *
5 Stereo Pass * * * * * *
6 Hand * * * * *
7 Stereo Hand * * * * * * * * *
8 Head * * * * * * * *
9 Stereo Head * * * * * * *
Table 1: Error rate data: all comparisons * P < 0.05 ** p < 0.01
The response times were relatively uniform across conditions and the fact that the times are
approximately 10-12 seconds is entirely consistent with the data from Experiment 1b, given
that the number of nodes was fixed at 75.
1 2 3 4 5 6 7 8 9
1 2D * * *
2 Perspective * * * *
3 Stereo * * * *
4 Pass * * *
5 Stereo Pass * * * * * *
6 Hand * * * * * * * * * * * * * *
7 Stereo Hand * * * *
8 Head * * * * * * * * * * *
9 Stereo Head * * * * *
Table 2: Time data: all comparisons * p < 0.05 ** p < 0.01
19
Ware and Franck TOG Info Net Vis April 20, 2000
However, multiple t-tests revealed that there were significant differences. The Hand andHead motion conditions were slower than all other conditions but they were not differentfrom each other. There was only one other significant difference. The Stereo Head coupledcondition was slower than the Stereo Passive rotation condition.
5. CONCLUSIONWe believe that our major contribution in this paper has been to provide a first quantitativeestimate of the benefits of stereo viewing with and without motion parallax for perceivinginformation nets. Our results surprised us, as we were prepared to believe that the secondof the three theoretical views outlined in the introduction was the correct one and that adding3D viewing would only have minimal benefits for an abstract data visualization task. Thefactor of three improvement that we actually measured (for the head coupled stereocondition) should provide some strong encouragement to those who are developingexperimental applications which use 3D viewing in information management systems[9,12,14,20]. Our results suggest that this effort makes sense only if real-time rotationand/or stereo viewing is included in the data presentation. A static perspective image mayadd little in comparison with a 2D diagram and adding real time rotation is more importantthan adding stereo. Unfortunately, structured motion is far more computationally expensivethan stereo since it requires a minimum of ten screen updates per second for a duration of atleast 30 seconds, whereas a stereo pair only requires the computation of two images.
The practical conclusion from Experiment 2 is that although a variety of methods forintroducing structured motion can help comprehension, the type of motion used shoulddepend on the application. For example, if the selection of objects is important thenautomatic rotation is not desirable because selecting moving objects is difficult. On theother hand, if head coupling is available then this would probably not interfere with 3Dselection. This is presumably because the motor control systems used for visually guidedhand placement have evolved to work in conjunction with simultaneous head motion.
On the theoretical issue of the additivity of depth cues we find a slight superadditivity in thecues of stereo and motion (60% improvement for stereo and 120% improvement for headcoupling does not quite add up to the 200% improvement obtained with both). This agreeswith the previous results of Sollenberger and Milgram [18]. We do not wish to make muchof this observation since we find it hard to believe that such a simple model can account forsomething as complex as space perception. In addition, there is a an alternativeinterpretation of our result which does not rely on space perception at all. In our displays,more 2D patterns were inherently ambiguous than were the 3D patterns in so far as theycontained paths that could not be resolved due to the densely overlapping network of nodesand arcs. It might be argued that the main advantage of the 3D view was simply the fact thatmotion allows the resolution of ambiguous arc destinations. Perhaps a mechanism thatmade all the nodes in a 2D display move at random would work just as well. Certainlysimple motion can be used to resolve patterns in abstract data [13]. This is an interestingpossibility which needs further investigation, however it does not detract from the practicalutility of our findings.
There does appear to be some penalty associated with using head coupled viewing. Anumber of subjects stated that they found viewing the graph in the head coupled stereomode to be somewhat stressful. Part of this may be due to the difficulty of the task. Tryingto perceive a path in a tangle of almost 300 nodes and 400 arcs is not easy. We alsosuspect that improvements in technology will help here. Noise in the head tracking system

20
Ware and Franck TOG Info Net Vis April 20, 2000
and the occasional briefly frozen image because of UNIX system functions are especiallyirritating in the head coupled viewing modes. It is as if having adopted the real-world virtualreality metaphor the brain expects the visual world to be stable, and if it is not we get aqueasy feeling. This is a problem which improvements in head tracking and displaytechnology will help solve.
ACKNOWLEDGEMENTSThe primary source of support for this research is an NSERC Canada Strategic Grant. Weare grateful to Arthur Ryman at IBM Toronto Labs for his encouragement and support andfor his assistance in providing code analysis tools. We also thank Tim Dudley at BellNorthern Research for providing the initial impetus to start this project and for ongoingenthusiastic support.
REFERENCES1. Arthur, K, Booth, K.S. and Ware, C. (1993) Evaluating Human Performance for
Fishtank Virtual Reality. ACM Transactions on Information Systems, 11(3), 216-2662. Braunstein, M.L. (1976) Depth Perception Though Motion. New York, Academic Press.3. Bruno, N. and Cutting, J.E. (1988) Minimodularity and the Perception of Layout.
Journal of Experimental Psychology: General, 117, 161-170.4. Card, S.K, Robertson, G.G. and Mackinlay, J.D. (1991) The Information Visualizer, an
Information Workspace. CHI'91 Proceedings. 181-188.5. Deering, M. (1992) High resolution virtual reality. Computer Graphics, 26,2,195-202.6. Eades and Xuemin. How to draw a directed graph. In IEEE Workshop on Visual
Languages. 13-17, 1989.7. Fairchild, K.M., Poltrock, S.E. and Furnas, G.W. (1988) SemNet: Three-Dimensional
Graphic Representations of Large Knowledge Bases. In Cognitive Science and ItsApplications for Human-Computer Interaction. Ed Raymond Guindon LawrenceErlbaum. 201-233.
8. Gibson, E.J., Gibson, J.J. Smith, O.W. and Flock H. (1959) Motional parallax as adeterminant of perceived depth. Journal of Experimental Psychology. 58. 40-51.
9. Koike, H. (1993) The role of another spatial dimensions in software visualization. ACMTransactions on Information Systems, 11(3) 266-286.
10. Lack, L.C. (1974) Selective attention and the control of binocular rivalry. Perceptionand Psychophysics, 15, 193-200.
11. Lamping, J. and Rao, R. (1994) Laying out and Visualizing Large Trees using aHyperbolic Space. Proceedings of the ACM symposium on User Interface Softwareand Technology, Marina del Rey CA. 128-130.
12. Lieberman, H. (1989) A Three-Dimensional Representation for Program Execution,IEEE Workshop on Visual Languages Proceedings, 111-116.
13. Limoges, S., Ware, C. and Knight, W. (1989). Displaying Correlations using Position,Motion, Point Size or Point Color. Graphics Interface Proceedings, 262-265.
14. Mariani, J.A., and Lougher, R. TripleSpace: an Experiment in a 3D Graphical Interfaceto a Binary Relational Database, Interacting with Computers, 4(2) 1992 147-162
15. Purcell, D.G. and Stewart, A.L. (1991) The object detection effect: Configurationenhances perception, Perception and Psychophysics, 50(3) 215-224.
16. Robertson, G.G., Mackinlay, J.D and Card, S. K. (1991) Cone Trees: Animated 3DVisualizations of Hierarchical Information. CHI'91 Proceedings. 189-194.
17. Sollenberger, R.L. and Milgram, P. (1991) A comparative Study of Rotational andStereoscopic Computer Graphic Depth Cues. Proceedings of the Human FactorsSociety Annual Meeting, 1452-1456.

21
Ware and Franck TOG Info Net Vis April 20, 2000
18. Sollenberger, R.L and Milgram, P. (1993) The effects of Stereoscopic and RotationalDisplays in a Three-Dimensional Path-Tracing Task. Human Factors, 35(3) 483-500.
19. Ware, C. Arthur, K. and Booth, K.S. (1993) Fishtank Virtual Reality. INTERCHI'93Technical Paper. Proceedings. 37-42.
20. Ware, C., Hui, D. and Franck, G. Visualizing object oriented software in threedimensions. Proceedings, CASCON'93. IBM Canada Ltd. and NRC. Toronto,October 1993. 612-620.