Evaluating Satellite Rainfall Products for Hydrological
16
Mekonnen Gebremichael, and Dawit Zeweldi Civil & Environmental Engineering Department University of Connecticut Evaluating Satellite Rainfall Products for Hydrological Applications
Transcript of Evaluating Satellite Rainfall Products for Hydrological
Mekonnen Gebremichael, and Dawit ZeweldiCivil & Environmental Engineering DepartmentUniversity of Connecticut
Evaluating Satellite Rainfall Products for Hydrological Applications

Mekonnen GebremichaelUniversity of Connecticut 2
Outline
Introduction+ The Approach+ The Study Region
Evaluating Satellite Rainfall Products (PERSIANN)+ Performance Statistics
Evaluating Utility in Hydrological Applications+ A Blueprint
Conclusions

Mekonnen GebremichaelUniversity of Connecticut 3
Two validation approaches:1. Evaluating against independent rainfall observations
2. Evaluating error propagation in hydrological applications
Introduction

Mekonnen GebremichaelUniversity of Connecticut 4
Introduction
High-resolution satellite rainfall products analyzed: PERSIANN, CMORPH (to follow)
PERSIANN+ IR-PMW merged algorithm: Neural Network+ 4-km hourly over the United States
Validation Approach+ Evaluation against NEXRAD radar rainfall observations+ Evaluation in hydrological applications (to follow)
Study region+ Little Washita watershed in Oklahoma, USA+ Good quality NEXRAD data; subject of several major experiments (NASA,
USDA, etc.)

Mekonnen GebremichaelUniversity of Connecticut 5
Area ~ 600 km2
Introduction: The Little Washita Watershed
Mekonnen GebremichaelUniversity of Connecticut 6
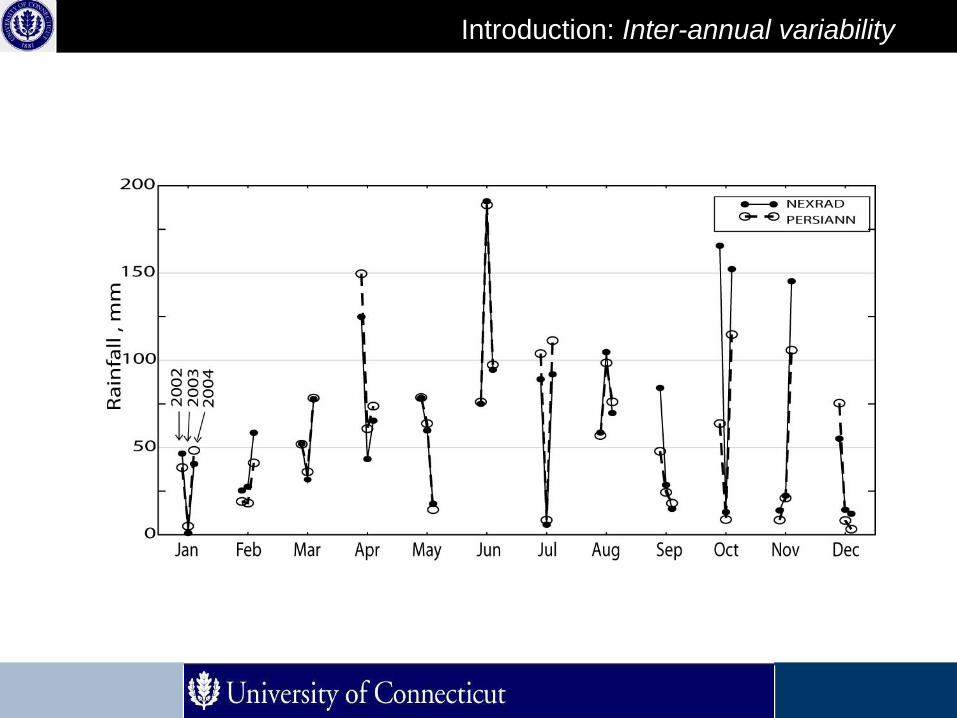
Introduction: Inter-annual variability

Mekonnen GebremichaelUniversity of Connecticut 7
Performance Statistics: 4-km, hourly time scale
Bias

Mekonnen GebremichaelUniversity of Connecticut 8
Performance Statistics: watershed-averaged, hourly time scale
JJADJF

Mekonnen GebremichaelUniversity of Connecticut 9
Performance Statistics: e-folding distance

Mekonnen GebremichaelUniversity of Connecticut 10
Performance Statistics of the Largest Storm

Mekonnen GebremichaelUniversity of Connecticut 11
Storm Duration Storm rainfall , mm E-folding distance:eP / eN
Peak Storm Rate:qP / qN
RMSEmm
Corr elati on
Beginning Ending NEXRAD PERSIANN
06/04/02:22 06/05/02:16 37.31 47.62 8.60 0.92 6.11 0.57
08/11/04:07 08/11/04:14 30.07 26.46 8.17 0.62 2.76 0.63
03/03/04:18 03/04/04:23 53.82 58.12 0.89 0.94 8.59 0.63
10/07/04:09 10/07/04:18 36.21 28.16 0.94 0.70 2.82 0.40
09/19/02:04 09/19/02:13 24.90 14.95 4.26 1.34 8.45 0.23
05/17/02:07 05//17/02:12 36.59 18.78 0.41 0.42 3.20 0.40
05/14/03:03 05/14/03:13 21.56 9.30 1.07 0.46 5.74 0.46
10/08/02:06 10/09/02:22 72.46 15.84 0.55 0.26 7.16 0.48
10/28/02:19 10/29/02:06 30.73 13.40 0.71 0.79 5.07 0.25
09/08/02:16 09/09/02:19 44.95 5.49 0.63 0.09 8.00 0.76
Performance Statistics of Storms

Mekonnen GebremichaelUniversity of Connecticut 12
Performance Statistics: Scaling with Temporal Scale
38.0−∝TR
RMSE55.0−∝T
RRMSE
RRMSE
DJF JJA
What is the appropriate spaceWhat is the appropriate space--time scale?time scale?

Mekonnen GebremichaelUniversity of Connecticut 13
Numerical simulations of catchment hydrologic processes require a method for representing a basin. Methods can be categorized as lumped versus distributed modeling (contours, grids, polygons, TINs).
Basin-Averaged Models (e.g. HEC-HMS)
Raster-Grid Models (e.g. MIKE SHE)
Which is the hydrologic model apt for the satellite rainfall obsWhich is the hydrologic model apt for the satellite rainfall observations?ervations?
versus
Predictive performance of hydrologic models as a function of model complexityand data availability (Grayson and Bloschl 2001).
Hydrological Application

Mekonnen GebremichaelUniversity of Connecticut 14
SatelliteRainfall Products
Simulated Watershed Response
Satellite Rainfall Error PropagationHydrologic Model
ReferenceRainfall Products Hydrologic Model
Simulated Watershed Response
Observed Watershed Response Hydrologic
Model Error
Performance Statistics: A Blueprint for Hydrological Applications

Mekonnen GebremichaelUniversity of Connecticut 15
Conclusions
Need for rigorous validation of high-resolution satellite rainfall products, at various space-time scales, for different regimes
Need for identifying hydrologic model complexity level apt for satellite- rainfall inputs, and sensitivity to space-time resolutions

Mekonnen GebremichaelUniversity of Connecticut 16
Thank you