Evaluating Remotely Sensed Images For Use In Inventorying Roadway Infrastructure Features N C R S T...
34
Evaluating Remotely Sensed Images For Use In Inventorying Roadway Infrastructure Features N C R S T INFRASTRUCTURE
-
Upload
bridget-daniels -
Category
Documents
-
view
213 -
download
0
Transcript of Evaluating Remotely Sensed Images For Use In Inventorying Roadway Infrastructure Features N C R S T...

Evaluating Remotely Sensed Images For Use In Inventorying
Roadway Infrastructure Features
N C R S TINFRASTRUCTURE

The Problem• DOT use of spatial inventory data
– Planning– Infrastructure Management– Safety– Traffic engineering– Meet federal requirements (HPMS)
• Inventory of large systems costly– e.g., 110,000 miles of road in Iowa
• Current Inventory Collection Methods– Labor intensive– Time consuming– Disruptive to traffic– Dangerous (workers located on/near roadways)

Research Objectives
• Investigate use of remotely sensed images for collection of roadway inventory features
• Evaluate level of resolution required for various inventory features
• Identify feasible features for future automation
• Make recommendations

Research Approach
• Identify common inventory features • Identify existing data collection methods• Extract inventory features from aerial photos• Performance measures
– Feature identification– Accuracy of linear measurements– Positional accuracy
• Define resolution requirements• Recommendations

Identify Common Inventory Features
• HPMS requirements• Additional elements (Iowa DOT)
Number of signals at intersections
Number of stop signs at intersections
Type of area road passes through (residential, commercial, etc)
Number of business entrances
Number of private entrances
Railroad crossings Intersection through
width

Required HPMS Physical Inventory Features
• Shoulder Type • Shoulder Width
– Right and Left • Number of Right/Left Turn
Lanes • Number of Signalized
Intersections • Number of Stop
Intersections • Number of Other
Intersections
• Section Length • Number of Through
Lanes • Surface/Pavement Type • Lane Width • Access Control • Median Type • Median Width • Peak Parking
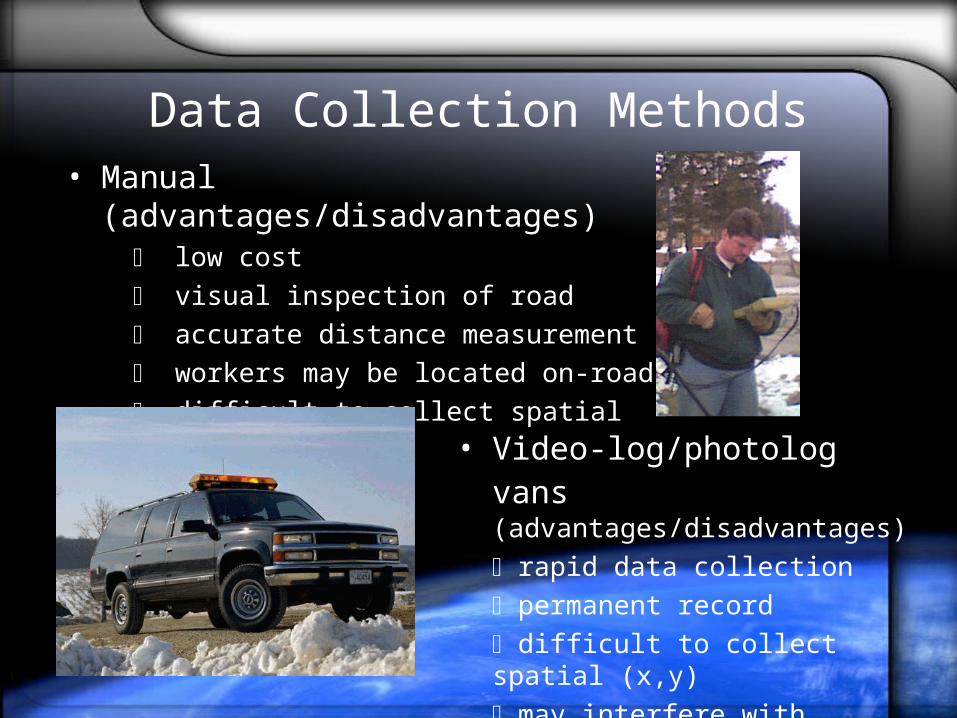
Data Collection Methods• Manual
(advantages/disadvantages) low cost visual inspection of road accurate distance measurement workers may be located on-road difficult to collect spatial (x,y)
• Video-log/photolog vans (advantages/disadvantages) rapid data collection permanent record difficult to collect spatial (x,y) may interfere with traffic stream

Data Collection Methods
• GPS (advantages/disadvantages)
highly accurate (x,y,z)
can record elevation time consuming workers may be
located on-road• Traditional surveying
(advantages/disadvantages)
highly accurate (x, y, z, distance)
time consuming

Pilot Study
Ames, Iowa
Remote Sensing Datasets
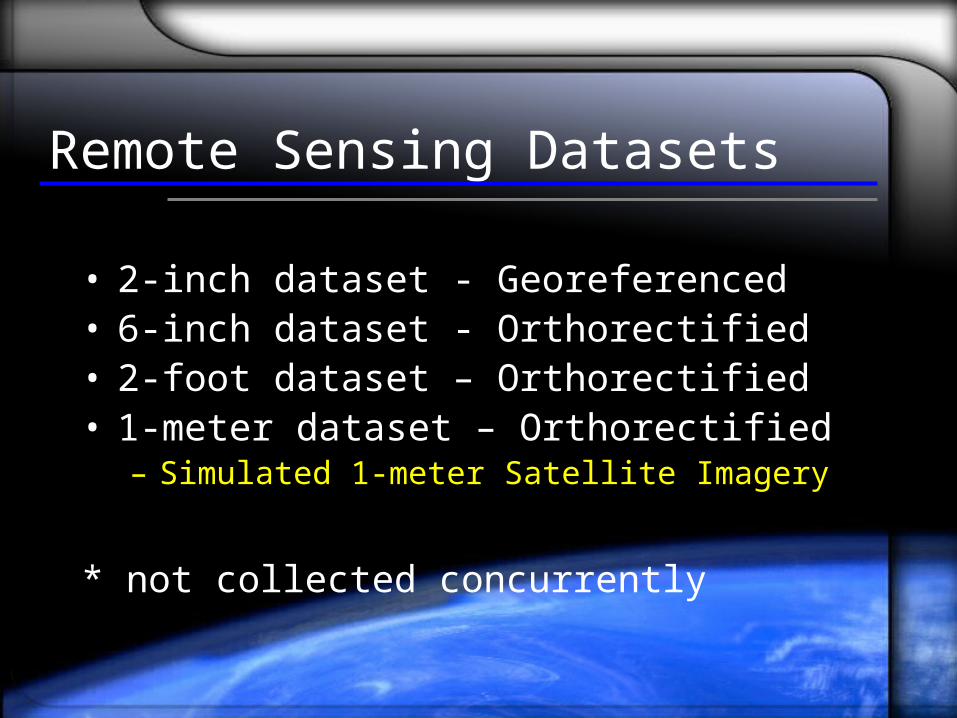
• 2-inch dataset - Georeferenced• 6-inch dataset - Orthorectified• 2-foot dataset – Orthorectified• 1-meter dataset – Orthorectified
– Simulated 1-meter Satellite Imagery
* not collected concurrently
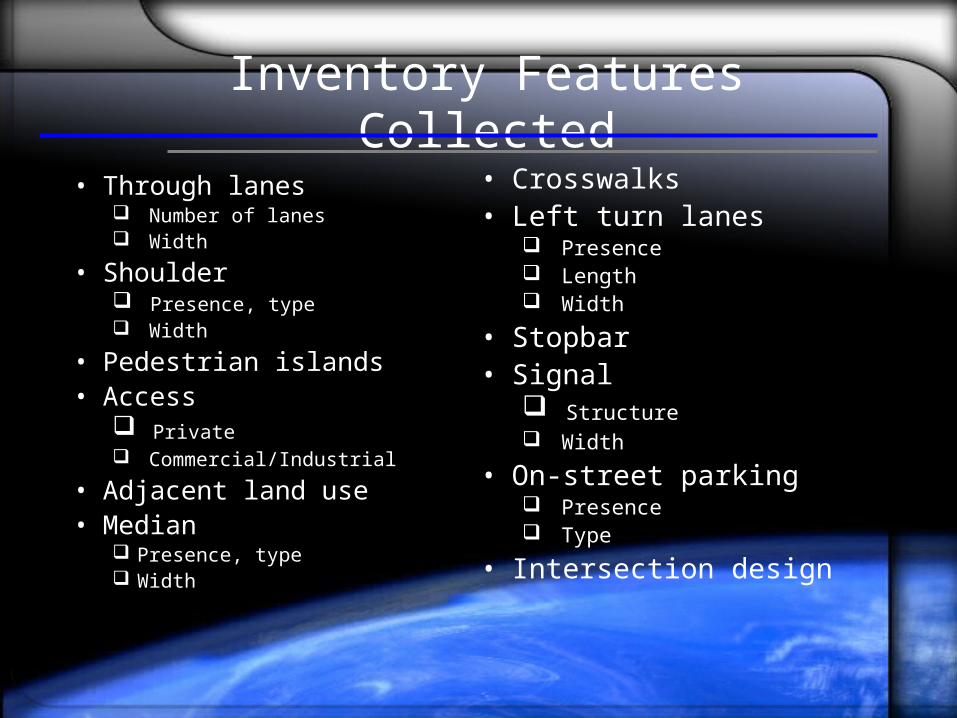
Inventory Features Collected
• Through lanes Number of lanes Width
• Shoulder Presence, type Width
• Pedestrian islands• Access
Private Commercial/Industrial
• Adjacent land use• Median
Presence, type Width
• Crosswalks• Left turn lanes
Presence Length Width
• Stopbar• Signal
Structure Width
• On-street parking Presence Type
• Intersection design

Extraction
6” resolution image

Performance Measures
• Feature Identification• Accuracy of Linear Measurements• Positional accuracy
Feature Identification
• Number of features identified in aerial photos versus ground truth
• e.g. only 44% of the time can the number of through lanes be correctly identified (24-inch resolution)
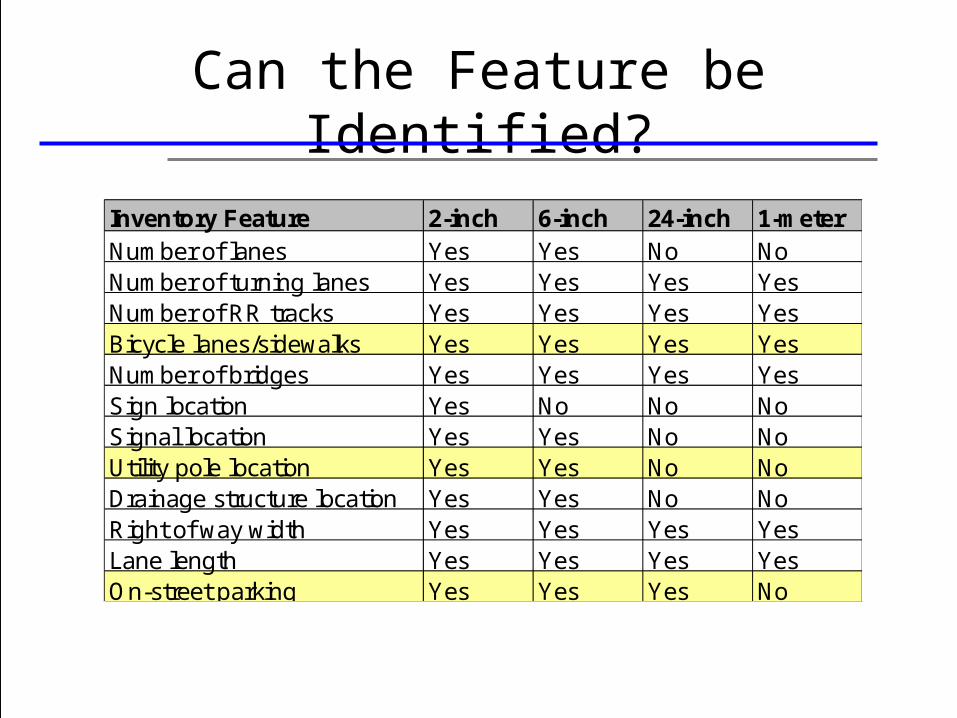
Can the Feature be Identified?
Inventory Feature 2-inch 6-inch 24-inch 1-meterNumber of lanes Yes Yes No NoNumber of turning lanes Yes Yes Yes YesNumber of RR tracks Yes Yes Yes YesBicycle lanes/sidewalks Yes Yes Yes YesNumber of bridges Yes Yes Yes YesSign location Yes No No NoSignal location Yes Yes No NoUtility pole location Yes Yes No NoDrainage structure location Yes Yes No NoRight of way width Yes Yes Yes YesLane length Yes Yes Yes YesOn-street parking Yes Yes Yes No

Feature Identification
Inventory 2-inch 6-inch 24-inch 1-meterElement Observations % Observations % Observations % Observations %Through lanes 65 100 65 100 65 52 46 39Shoulders 2 100 2 100 2 0 N/A N/AMedians (Presence) 9 100 9 100 9 56 6 67Medians (Type) 9 100 9 78 9 11 6 0Pavement type 20 95 20 55 20 0 12 0Intersection design 10 100 10 100 10 100 6 100Intersection Location 10 100 10 100 10 100 6 100Crosswalks 16 100 16 31 16 0 12 0Pedestrian islands 3 100 3 100 3 33 3 33Stopbar location 20 100 20 80 20 0 12 0Right turn lane 13 100 13 100 13 54 7 57Left turn lane 20 100 20 100 20 60 9 33
*** Observations is the number of features tested. Differences by datasets indicate a smaller available sample size
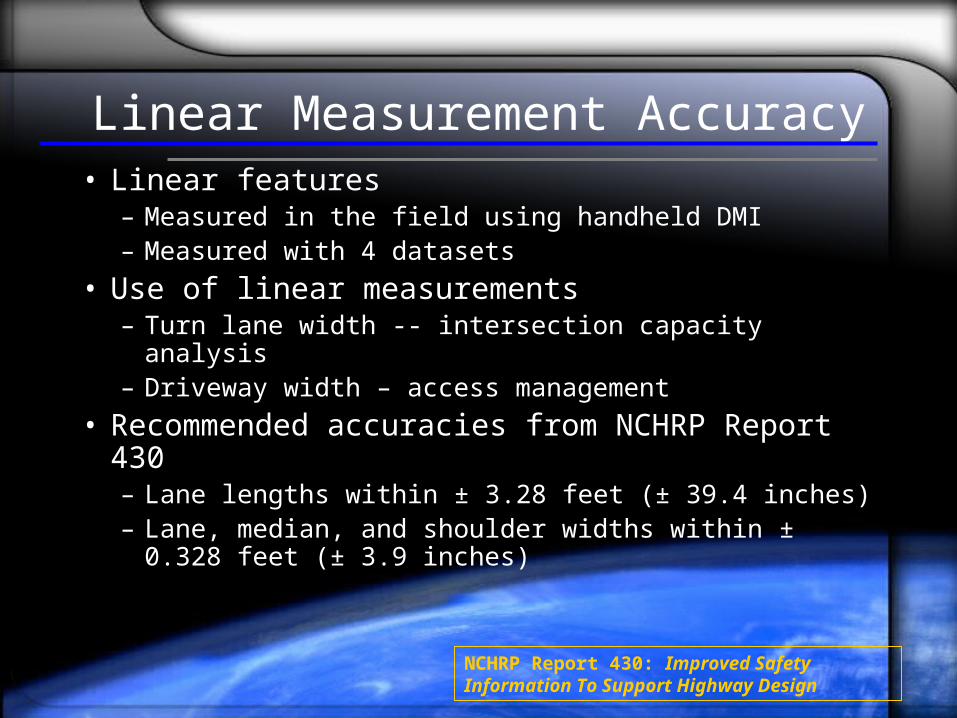
Linear Measurement Accuracy• Linear features
– Measured in the field using handheld DMI– Measured with 4 datasets
• Use of linear measurements– Turn lane width -- intersection capacity analysis– Driveway width – access management
• Recommended accuracies from NCHRP Report 430– Lane lengths within ± 3.28 feet (± 39.4 inches)– Lane, median, and shoulder widths within ±
0.328 feet (± 3.9 inches)
NCHRP Report 430: Improved Safety Information To Support Highway Design

Thru Lane Width ErrorDataset 95th Percentile Confidence intervalNCHRP 430 - 0.328 to +0.328 feet2-inch -0.1 to 0.24 feet6-inch 0.0 to 0.38 feet24-inch -0.6 to 0.37 feet1-meter -1.1 to 0.8 feet
Left Turn Lane Length ErrorDataset 95th Percentile Confidence intervalNCHRP 430 -3.28 to 3.28 feet2-inch -4.6 to 2.9 feet6-inch -10.1 to 4.9 feet24-inch -9.0 to 3.4 feet1-meter -10.5 to 6.8 feet

Linear Measurement Accuracy
• Lane width, turn lane length, and driveway width measurement relied heavily on pavement marking
• Expect less error with better identifiers (i.e. length of raised median)
• Accuracy required depends on application

Positional accuracy
• 50 GPS points were collected for comparison– kinematic GPS– 5mm to 10mm horizontal– 4 cm vertical accuracy
• Compared to the same points located with the 4 datasets
• Root mean square (RMS)

Dataset RMSE (feet) NSSDA (feet)2-inch 0.93 1.616-inch 2.25 3.8924-inch 3.04 5.261-meter 6.26 10.84
NSSDA: Spatial accuracy test suggested by National Standard for Spatial Data Accuracy
Results of RMSE and NSSDA Test (95th
Percentile)

Cost Comparison• Aerial photos
– Iowa DOT estimates $100/mile for images + in-house costs to orthorectify
– 1.5 hours in-house to locate 55 features – hour to measure turn left turn, 2 approach lanes, lane
and median lengths, lane and median widths for 1 intersection (see david’s)
• Field manual data collection– 1 hour to measure and record turn lane and median
lengths & lane and median widths for 1 intersection in field not including (see david’s)

Cost Comparison• GPS
– Cost $1500 for 55 points w/ kinematic GPS from consultant– 24 person hours
10.5 hours for 1 person 3 hours processing All sites within 2 miles
• Videolog van– $35/mile to collect– How many miles can they collect per hour realistically, not including travel time to
location– Processing time
• Manual see David’s• Costs for on-road data collection can increase significantly when sites are
located at distances from data collectors and equipment– 2 hours for Iowa DOT Mandli van to reach Iowa City from Ames, Iowa

Conclusions
• Majority of inventory features studied could be identified in the 2-inch, 6-inch, and 24-inch datasets
• Ability to identify features in 1-meter dataset is significantly reduced
• If identified, most features could be located spatially and measured
• Positional accuracy and linear measurement accuracy varied by dataset
• Acceptability of positional/linear measurement accuracies depends on application
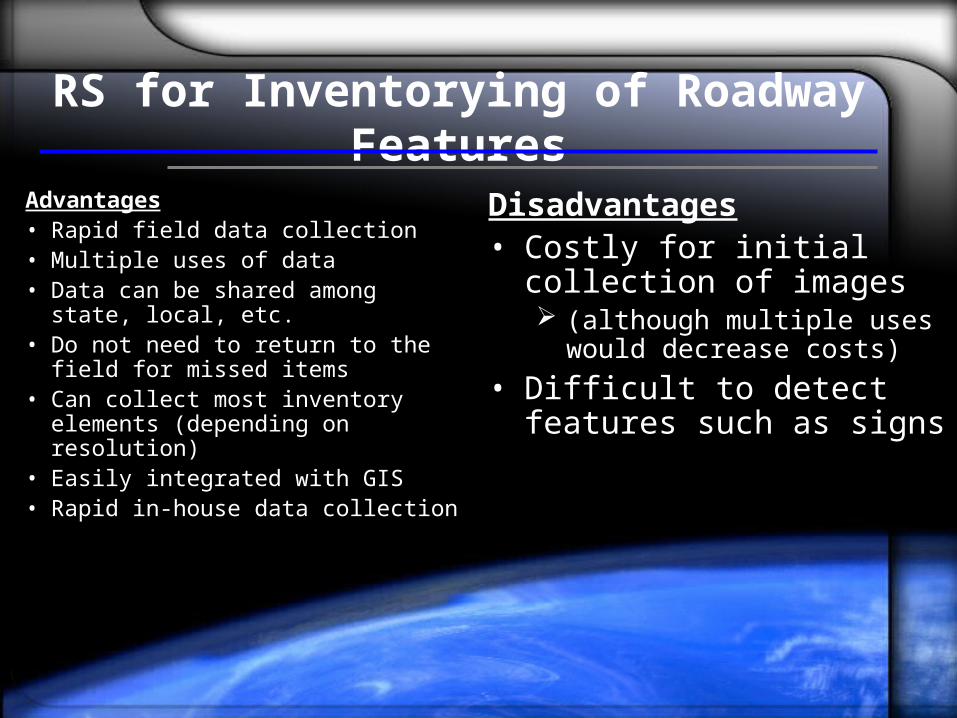
RS for Inventorying of Roadway Features
Advantages• Rapid field data collection• Multiple uses of data• Data can be shared among state,
local, etc.• Do not need to return to the field
for missed items• Can collect most inventory
elements (depending on resolution)
• Easily integrated with GIS• Rapid in-house data collection
Disadvantages• Costly for initial collection
of images (although multiple uses
would decrease costs)
• Difficult to detect features such as signs

Applications
• Iowa DOT’s linear referencing system (LRS)
• Identification of passing zones

Iowa DOT’s LRS
• Iowa DOT is implementing a linear referencing system (LRS)
• Requires method to create accurate spatial representation of network for creation of datum
• Current accuracy requirements– Anchor points (nodes) – ± 3.28 feet– Anchor sections (links) – ± 6.89 feet– Business data located - ± 32.81 feet

Data Collection Methods Tested by Consultants for Iowa DOT
• Anchor points– Kinematic GPS (reference dataset)– Heads-up digitizing of 24-inch orthophotos
for coordinates (meets)– Heads-up digitizing of 6-inch orthophotos for
coordinates (meets accuracy)– Project plans (did not meet)– Existing cartography (did not meet)
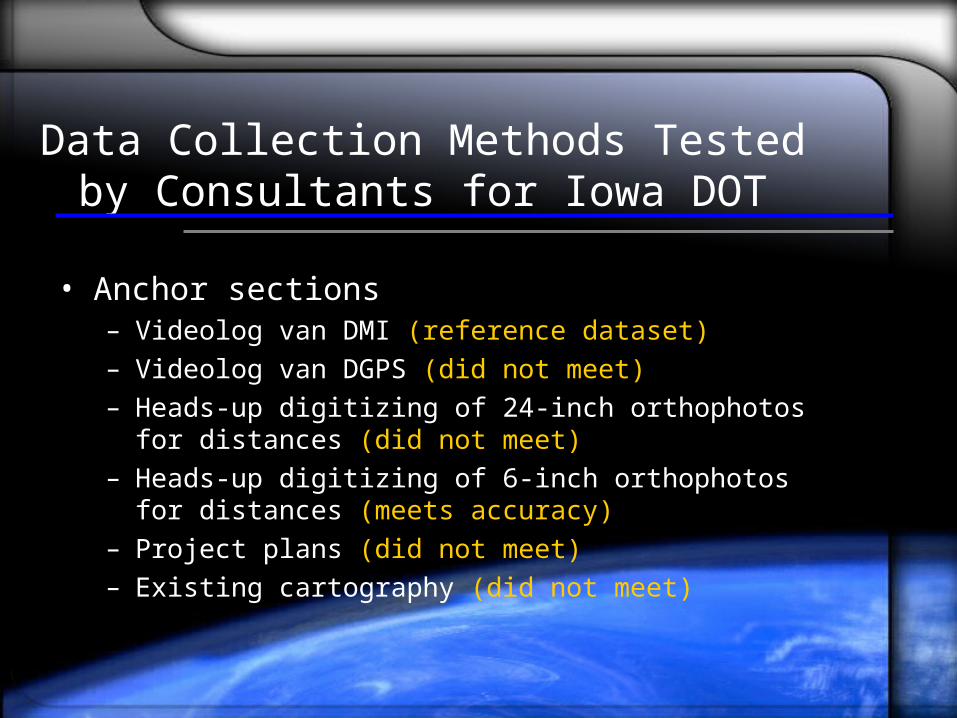
Data Collection Methods Tested by Consultants for Iowa DOT
• Anchor sections– Videolog van DMI (reference dataset)– Videolog van DGPS (did not meet)– Heads-up digitizing of 24-inch orthophotos for
distances (did not meet)– Heads-up digitizing of 6-inch orthophotos for
distances (meets accuracy)– Project plans (did not meet)– Existing cartography (did not meet)

ISU Research Team Results
• All datasets but 1-meter meet anchor point accuracy requirements
• In progress -- distance measurements– DMI (reference)– Roadware van– 2-inch photos– 6-inch orthophotos– 24-inch orthophotos– 1-meter orthophotos
• All datasets meet positional accuracy requirements for business data

Creation of Datum Using Aerial Photos
Cartography centerline
Heads-up digitized centerline for datum
6-inch resolution aerial photos

Passing Zones on Rural 2-lane Roadways
• Provide guidance to drivers as to whether the geometric layout of the roadway allows sufficient sight distance for a following vehicle to pass a slower moving one
• Are identified by pavement marking • Inventory of passing zones useful for:
– Safety analysis – Design– Evaluation of deficiencies– Capacity studies– Roadway maintenance and rehabilitation

Identification of Passing Zones
Identification of changes in pavement marking for passing zones
Point feature to delineate changes in pavement marking
— Street database centerline
• Begin and end point represented as points
• Attribute tables created
• Point features snapped to street centerline
• Distance from reference location calculated

Using Point Features and Attributes to Linearly Reference Passing Zones